Real World Use of Antidiabetic Drugs in the Years 2011–2017
21
International Journal of Environmental Research and Public Health Article Real World Use of Antidiabetic Drugs in the Years 2011–2017: A Population-Based Study from Southern Italy Ylenia Ingrasciotta 1, * , Maria Paola Bertuccio 1 , Salvatore Crisafulli 1 , Valentina Ientile 1 , Marco Muscianisi 2 , Luca L’Abbate 1 , Maurizio Pastorello 3 , Vincenzo Provenzano 4 , Alessandro Scorsone 4 , Salvatore Scondotto 5 and Gianluca Trifirò 6 1 Department of Biomedical and Dental Sciences and Morphofunctional Imaging, University of Messina, 98125 Messina, Italy; [email protected] (M.P.B.); [email protected] (S.C.); [email protected] (V.I.); [email protected] (L.L.) 2 Department of Clinical and Experimental Medicine, University of Messina, 98125 Messina, Italy; [email protected] 3 Palermo Local Health Unit, Department of Pharmacy, 90127 Palermo, Italy; [email protected] 4 Regional Referral Centre for Insulin Pump Implantation and Diabetes, Civic Hospital, Partinico, 90047 Palermo, Italy; [email protected] (V.P.); [email protected] (A.S.) 5 Department of Epidemiologic Observatory, Health Department of Sicily, 90127 Palermo, Italy; [email protected] 6 Department of Diagnostic and Public Health, University of Verona, 37134 Verona, Italy; gianluca.trifi[email protected] * Correspondence: [email protected]; Tel.: +39-090-2213877 Received: 19 November 2020; Accepted: 16 December 2020; Published: 18 December 2020 Abstract: Diabetes mellitus is a metabolic disease characterized by chronic hyperglycemia. The availability of new antidiabetic drugs (ADs) has led to complex treatment patterns and to changes in the patterns of specific drug utilization. The aim of this population-based study was to describe the pattern of antidiabetic drugs (ADs) use in Southern Italy in the years 2011–2017, in relation to the updated type 2 diabetes mellitus (T2DM) therapy guidelines. A retrospective cohort study was conducted on T2DM patients using data from the Palermo Local Health Unit (LHU) claims database and diabetologist registry. The first-line treatment was investigated and incident treatments were identified and characterized at baseline in terms of demographics, complications, comorbidities, concomitant drugs and clinical parameters. Persistence to AD treatment was also evaluated. During the study period, one-third of first ever ADs users started the treatment with ADs other than metformin, in contrast to guideline recommendations. Among 151,711 incident AD treatments, the male to female ratio was 1.0 and the median age was 66 (57–75) years. More than half (55.0%) of incident treatments discontinued the therapy during the first year of treatment. In Italy, general practitioners (GPs) can only prescribe first-generation ADs, while the prescription of more recently marketed ADs, such as GLP-1RA, DPP4i and SGLT2i, is restricted to diabetologists only, based on a therapeutic plan. The role of GPs in the management of T2DM in Italy should be re-evaluated. Keywords: antidiabetic drugs; real world data; type 2 diabetes mellitus; therapy guidelines; Southern Italy Int. J. Environ. Res. Public Health 2020, 17, 9514; doi:10.3390/ijerph17249514 www.mdpi.com/journal/ijerph
-
Upload
khangminh22 -
Category
Documents
-
view
3 -
download
0
Transcript of Real World Use of Antidiabetic Drugs in the Years 2011–2017
International Journal of
Environmental Research
and Public Health
Article
Real World Use of Antidiabetic Drugs in the Years2011–2017: A Population-Based Study fromSouthern Italy
Ylenia Ingrasciotta 1,* , Maria Paola Bertuccio 1 , Salvatore Crisafulli 1, Valentina Ientile 1,Marco Muscianisi 2 , Luca L’Abbate 1, Maurizio Pastorello 3, Vincenzo Provenzano 4,Alessandro Scorsone 4, Salvatore Scondotto 5 and Gianluca Trifirò 6
1 Department of Biomedical and Dental Sciences and Morphofunctional Imaging, University of Messina,98125 Messina, Italy; [email protected] (M.P.B.); [email protected] (S.C.); [email protected] (V.I.);[email protected] (L.L.)
2 Department of Clinical and Experimental Medicine, University of Messina, 98125 Messina, Italy;[email protected]
3 Palermo Local Health Unit, Department of Pharmacy, 90127 Palermo, Italy;[email protected]
4 Regional Referral Centre for Insulin Pump Implantation and Diabetes, Civic Hospital, Partinico,90047 Palermo, Italy; [email protected] (V.P.); [email protected] (A.S.)
5 Department of Epidemiologic Observatory, Health Department of Sicily, 90127 Palermo, Italy;[email protected]
6 Department of Diagnostic and Public Health, University of Verona, 37134 Verona, Italy;[email protected]
* Correspondence: [email protected]; Tel.: +39-090-2213877
Received: 19 November 2020; Accepted: 16 December 2020; Published: 18 December 2020 �����������������
Abstract: Diabetes mellitus is a metabolic disease characterized by chronic hyperglycemia.The availability of new antidiabetic drugs (ADs) has led to complex treatment patterns and tochanges in the patterns of specific drug utilization. The aim of this population-based study wasto describe the pattern of antidiabetic drugs (ADs) use in Southern Italy in the years 2011–2017,in relation to the updated type 2 diabetes mellitus (T2DM) therapy guidelines. A retrospective cohortstudy was conducted on T2DM patients using data from the Palermo Local Health Unit (LHU)claims database and diabetologist registry. The first-line treatment was investigated and incidenttreatments were identified and characterized at baseline in terms of demographics, complications,comorbidities, concomitant drugs and clinical parameters. Persistence to AD treatment was alsoevaluated. During the study period, one-third of first ever ADs users started the treatment withADs other than metformin, in contrast to guideline recommendations. Among 151,711 incident ADtreatments, the male to female ratio was 1.0 and the median age was 66 (57–75) years. More thanhalf (55.0%) of incident treatments discontinued the therapy during the first year of treatment.In Italy, general practitioners (GPs) can only prescribe first-generation ADs, while the prescription ofmore recently marketed ADs, such as GLP-1RA, DPP4i and SGLT2i, is restricted to diabetologistsonly, based on a therapeutic plan. The role of GPs in the management of T2DM in Italy shouldbe re-evaluated.
Keywords: antidiabetic drugs; real world data; type 2 diabetes mellitus; therapy guidelines;Southern Italy
Int. J. Environ. Res. Public Health 2020, 17, 9514; doi:10.3390/ijerph17249514 www.mdpi.com/journal/ijerph

Int. J. Environ. Res. Public Health 2020, 17, 9514 2 of 21
1. Introduction
Diabetes mellitus is a metabolic disease characterized by chronic hyperglycemia as a consequenceof defects in insulin action, secretion, or both. Diabetes currently affects more than 425 million peopleover the world, and the number of patients with diabetes is estimated to rise up to 693 million in2045 [1]. In Europe, 58 million people are affected by diabetes, despite 22 million of these beingundiagnosed cases [1]. In Italy, type 2 diabetes (T2DM) accounts for over 90% of diabetes cases, with aprevalence of about 5% [2] in the general population, which further increases in Southern ItalianRegions [3]. Specifically, Sicily is among the Italian regions with the largest consumption (around80 Defined Daily Dose (DDD)/1000 inhabitants/day) of antidiabetic drugs (ADs) [4,5].
The growing number of people with T2DM has a great impact not only in terms of clinical effects,but also in terms of economic burden on the healthcare systems [6]. T2DM is a major risk factor forcardiovascular (CV) diseases, such as stroke, myocardial infarction and peripheral vascular disease,as well as being an independent risk factor for heart failure [7,8]. In patients with diabetes mellitus, CVcomplications are considered the main cause of morbidity and mortality [9,10]. As mentioned in the2019 ESC guidelines, the early identification and treatment of comorbidities and factors that increaseCV risk can bring great benefits to patients with glucose perturbations [11].
According to the 2012, 2015 and 2018 guidelines of the American Diabetes Association (ADA) andthe European Association for the Study of Diabetes (EASD) on the management of hyperglycemia inT2DM, metformin is recommended as a first-line glucose-lowering therapy, if well-tolerated, in additionto lifestyle changes [8,12,13]. When glycemic control is not reached with metformin monotherapyat the maximum tolerated dose, adding a second AD is recommended. In particular, before 2018,the guidelines recommended the prescription of a two-drugs combination, choosing the AD to beadded to metformin on the basis of several patient- and disease-specific factors. If glycemic controlwas not reached within three months of dual therapy, adding another AD (triple therapy) wasrecommended. Combination with injectable therapy (metformin + insulin + mealtime insulin orglucagon-like peptide-1 receptor agonists (GLP-1RA)) was recommended when glycemic control wasnot achieved within 3 months of triple therapy [12,13].
On the contrary, the last updated EASD-ADA guidelines recommend either GLP-1RA orsodium–glucose linked transporter 2 inhibitor (SGLT2i) as the second-line treatment in patientsaffected by established atherosclerotic cardiovascular disease (ASCVD), heart failure or chronic kidneydisease (CKD), or in those in which a minimization of weight gain is necessary [8]. In patients withoutestablished ASCVD or CKD, if there is a need to minimize hypoglycemia risk, dipeptidyl peptidase-4inhibitors (DPP4i), GLP-1RA, SGLT2i or glitazones should be added to metformin; finally, only ifaffordability is a major issue, sulfonylureas or glitazones should be added to metformin. When glycemiccontrol is not achieved with the oral ADs, the previous and the new EASD-ADA guidelines recommendthe addition of or the switch to insulin therapy [8,13].
Nevertheless, in Italy, general practitioners (GPs), who play a major role in T2DM management,can only prescribe first-generation ADs, such as metformin, sulfonylureas, glinides, acarbose andglitazones, while the prescription of more recently marketed ADs, such as GLP-1RA, DPP4i andSGLT2i, is restricted to diabetologist only, based on a therapeutic plan [2].
The objective of this population-based study was to explore the real-world use of ADs in a largeprovince of Southern Italy in the years 2011–2017, in relation to recently updated guidelines.
2. Materials and Methods
2.1. Data Source and Study Design
An observational, retrospective study was conducted from 2011 to 2017 in collaboration with theSicilian Regional Department for Health Activities and Epidemiological Observatory, the PalermoLocal Health Unit (LHU) and the Regional Center of Reference Diabetology and Microinfusion PlantSicily—Civic Hospital of Partinico (Province of Palermo). Altogether, these centers provided access to

Int. J. Environ. Res. Public Health 2020, 17, 9514 3 of 21
fully anonymized data from the claims database and diabetologist registry of Palermo LHU (coveringa total population of 1,362,708 people during the study years). As not all T2DM patients were cared forby diabetologists, clinical data from registries were available only for a subsample of the study cohort.The claims database included information on demographics of residents, outpatient pharmacy claims(drug dispensing data), hospital discharges, emergency department (ED) visits and healthcare servicepayment exemptions.
The diabetologist registry included information on the antidiabetic prescriptions, history ofdiabetes-related complications and clinical parameters (e.g., glycated hemoglobin, cholesterol,triglycerides, transaminases, albumin extraction rate, creatinine clearance, body mass index (BMI),body weight, waist circumference). The dispensed drugs were coded using the Anatomical TherapeuticClinical (ATC) classification system and the Marketing Authorization Code (AIC), while comorbiditiesand complications were coded through the ninth review of the International Classification ofDiseases—Clinical Modification (ICD9-CM).
The study protocol was notified to the Ethical Committee of the Academic Hospital of Messina(Prot. N. 0001373 of the 01/24/2018), according to the current national law [14]. The manuscript doesnot contain clinical studies or patient data. For this type of study formal consent is not required.
2.2. Study Population
From the general population of Palermo LHU, all subjects with at least one year of databasehistory and at least one AD dispensed (i.e., prevalent users) during the years 2011–2017 were identified.Of these, all AD users without any dispensing of the same AD in the year prior to the ID (i.e., incidentAD users) were then identified. The index date was defined as the date of the first AD dispensingduring the study period. The same patient could be included in several AD classes (i.e., incident ADtreatment), and multiple index dates (one for each AD that was initiated during follow-up) for thesame patient were allowed. All AD users with a diagnosis of T1DM (identified from diabetologistregistry and/or from discharge diagnosis database), or with ages less than 20 years and exclusivetreatment with insulin, or gestational diabetes or other types of non-T2DM, were excluded.
2.3. Study Drugs
All the marketed molecules/classes of ADs included in the study and their ATC codes are listed inTable A1. Specifically, in light of the change of some drug ATCs in 2017, the previous ATCs of thesedrugs were included as well ((exenatide (A10BX04); liraglutide (A10BX07); lixisenatide (A10BX10);albiglutide (A10BX13); dulaglutide (A10BX14), dapagliflozin (A10BX09); canagliflozin (A10BX11);empagliflozin (A10BX12)) [15].
All available AD dispensing data were identified from the Palermo claims database.
2.4. Data Analysis
First, the distribution of the dispensed ADs as first-line treatment was investigated. Only subjectsnot treated with ADs before the first AD dispensing during the study period (first ever users) wereincluded in this analysis. Second, the prevalence (%) of AD users, stratified by calendar year and ADmolecule/class, was also evaluated. Third, among incident treatments, the distribution of previoususe of other ADs (i.e., at least one dispensing any time prior to ID) was evaluated and stratifiedby molecule/class.
Then, a baseline characterization of incident treatments, stratified by antidiabetic drug/class,was performed. The variables examined included patients’ demographics, comorbidities, DMcomplications, concomitant drugs and clinical parameters (Table A2).
All incident AD treatments with at least 180 days of follow-up and at least one HbA1c measurementwithin 1 month prior to the ID (i.e., baseline HbA1c value), and another one within the 6th month afterID (follow-up HbA1c), were identified. The difference between the mean follow-up and the baselineHbA1c values, i.e., delta Hb (∆HbA1c), was calculated and stratified by AD molecule/class.
Int. J. Environ. Res. Public Health 2020, 17, 9514 4 of 21
The same analysis for waist circumference and body weight measurement was performed bycomparing values at baseline vs. those measured within 12 months after ID.
Among incident AD treatments, time to discontinuation analysis during the first year of treatmentwas carried out. For each incident AD treatment, the number of days of continuous therapy from thetreatment’s start, based on the DDD and the amount of dispensed ADs, was estimated. Concerningfixed-dose combinations, as DDD does not exist, we assumed that patients received one tablet a day.Persistence to AD treatment was assessed based on the maximum allowed treatment gap, defined asthe time between the last day covered by AD treatment (discontinuation date) and the day to the nextrefill. Patients were considered discontinuers if they had at least one treatment gap exceeding 90 daysbetween the estimated end of exposure of the last drug dispensing and the start of the next one (if any).For discontinuers, the time to discontinuation was calculated as the number of days between ID and thediscontinuation date. Antidiabetic drug/class-specific time to discontinuation analysis was performedusing a Kaplan–Meier plot. Persistence to insulin was not evaluated since no standard duration oftreatment with insulin exists because the actual administered daily doses may vary substantiallydepending on the health conditions of the patient; therefore, in general, the assessment of adherenceand persistence to insulin treatment using claims databases may not be accurate.
Then, discontinuers were re-classified as intermittent users if they received at least one dispensingof the same AD between the discontinuation date and the end of the first year of follow-up. Instead,continuers were re-classified as add-on users if they received at least one additional AD (never prescribedbefore) between the ID and the end of the first year of follow-up.
All the analyses on drug utilization were carried out only using the claims database covering thewhole T2DM population.
Descriptive statistics were used to describe all examined variables. The results are presentedas mean ± standard deviation (SD) or median with interquartile range (IQR) depending on theunderlying distribution for quantitative variables, and they were summarized by absolute frequenciesand percentages for categorical variables.
In order to compare proportions and variations (as %) between the different groups, a GeneralizedEstimating Equations (GEE) model was fitted, using a binomial and Gaussian link function forbinary and continuous variables, respectively. For comparisons within groups, a paired t-test wasused. Statistical analyses were performed using SAS 9.2 (SAS Institute, Cary, NC, USA). GeneralizedEstimating Equations models were performed in R version 3.5.0 using the geepack package (version1.3-1). The significance level for all statistical tests was set at p-value < 0.05.
3. Results
During the study period, from a population of about 1.4 million patients registered in Palermo LHU,excluding 2797 patients with T1DM, gestational diabetes or other types of non-T2DM, 151,744 incidentT2DM AD treatments were identified. Clinical data from the diabetologist registry were available for asubsample of 48,498 (32.0%) incident AD treatments (Figure 1).
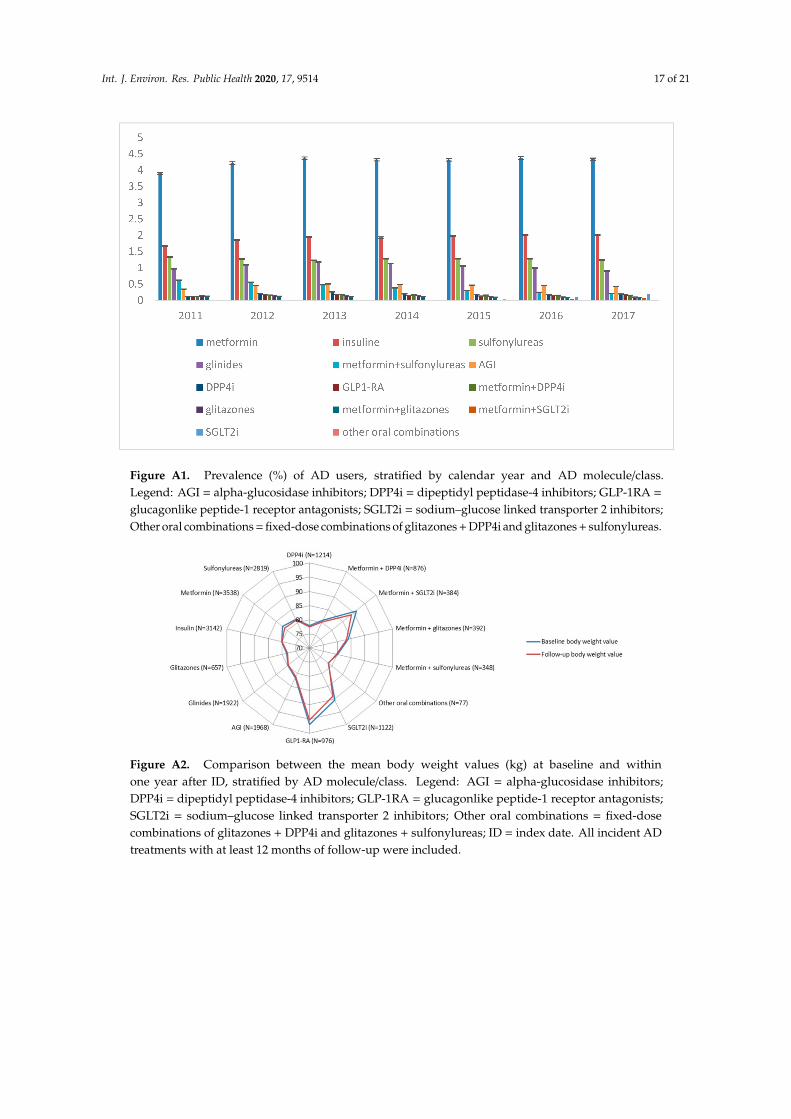
The overall prevalence (%) of AD users was 9.1%, with a stable trend during the study years.However, a slight decrease in metformin + sulfonylureas fixed-dose combination use was observedover time (from 0.6% in 2011 to 0.2% in 2017). On the contrary, a slight increase in the more recentlymarketed SGLT2i and metformin + SGLT2i fixed-dose combination from 2015 onwards was found.The use of the other first-generation ADs remained almost steady during the study period (Figure A1).
During the observation years, among the 44,692 subjects that were the first ever users of ADs,only two-thirds (N = 29,514; 66.0%) received metformin as the first-line treatment, with the remainingones mostly receiving insulin (N = 3807; 8.5%) and first-generation ADs, such as sulfonylureas(N = 3638; 8.1%), glinides (N = 2428; 5.4%) and AGIs (N = 2083; 4.7%) (Figure 2).
Int. J. Environ. Res. Public Health 2020, 17, 9514 5 of 21
Figure 1. Flow-chart of T2DM patients receiving antidiabetic drugs in Palermo Local Health Unitin the years 2011–2017. Legend: LHU: Local Health Unit; AD: Antidiabetic drug; T1DM: Type 1diabetes mellitus; T2DM: Type 2 diabetes mellitus. a Subjects without any AD dispensing of the samedrug within one year prior to the treatment start date, i.e., index date (ID). The same patient could beincluded in different AD classes; for this reason, incident T2DM AD treatments were more numerousthan prevalent users.
Figure 2. Distribution (%) of the first antidiabetic drug use, stratified by antidiabeticmolecule/class. Legend: AGI = alpha-glucosidase inhibitors; DPP4i = dipeptidyl peptidase-4inhibitors; GLP-1RA = glucagon-like peptide-1 receptor antagonists; SGLT2i = sodium–glucoselinked transporter 2 inhibitors; Other oral combinations = fixed-dose combinations of glitazones +
DPP4i and glitazones + sulfonylureas.

Int. J. Environ. Res. Public Health 2020, 17, 9514 6 of 21
Non fixed-dose combinations include AD users with more than one AD dispensing at theindex date.
Only AD users not treated with any AD before the first dispensing date during the study periodwere included in this analysis.
Looking at the previous use of ADs, 1581 (37%) and 1769 (61%) patients with GLP1-RA andSGLT2i incident treatments, respectively, had received more than three other ADs before GLP1-RA andSGLT2i were started (Figure 3).
Figure 3. Distribution (%) of the number of ADs dispensed any time prior to the treatment start amongincident treatments. Legend: AGI = alpha-glucosidase inhibitors; DPP4i = dipeptidyl peptidase-4inhibitors; GLP-1RA = glucagon-like peptide-1 receptor antagonists; SGLT2i = sodium–glucose linkedtransporter 2 inhibitors; Other oral combinations = fixed-dose combinations of glitazones + DPP4i andglitazones + sulfonylureas. Only number of ATCs belonging to a different antidiabetic molecule/classas compared to the molecule/class that was dispensed at the index date.
In general, among all incident AD treatments, a male to female ratio of 1.0 was observed, exceptfor incident treatments of metformin + SGLT2i, metformin + glitazones and other oral antidiabeticfixed-dose combinations (male to female ratio = 1.4); the overall median age was 66 (IQR: 57–75)years, except for those undergoing incident treatments of SGLT2i, GLP-1RA, and metformin + SGLT2ifixed-dose combinations, who were significantly younger (i.e., 56 years) (p-value < 0.05) (Table 1).Only a very low proportion of incident treatments of SGLT2i and GLP1-RA had a history of heartfailure or nephropathy, compared to incident treatments of glinides and insulin (heart failure: 5.1%and 5.9% vs. 10.2% and 11.6%, respectively (p-values < 0.001 for both comparisons); nephropathy:7.7% and 7.4% vs. 11.2% and 12.4%, respectively (p-values < 0.001 for both comparisons)).

Int. J. Environ. Res. Public Health 2020, 17, 9514 7 of 21
Table 1. Baseline characteristics of incident AD treatments in Palermo LHU during the years 2011–2017.
MetforminN = 50,544
(%)
InsulinN = 24,270
(%)
SUN = 19,296
(%)
GlinidesN = 18,590
(%)
AGIN = 12,170
(%)
DPP4iN = 5869
(%)
GLP-1 RAN = 4273
(%)
GlitazonesN = 2977
(%)
SGLT2iN = 2900
(%)
Metformin +DPP4i
N = 3987(%)
Metformin +SGLT2iN = 971
(%)
Metformin +GlitazonesN = 1828
(%)
Metformin +SU
N = 3701(%)
Other OralCombinations
N = 368(%)
TotalN = 151,744
(%)
Males 24,852(49.2)
12,643(52.1)
9716(50.4)
9314(50.1)
5835(47.9) 3079 (52.5) 2308
(54.0)1589(53.4) 1547 (53.3) 2224
(55.8)569
(58.6)1067(58.4)
1848(49.9)
213(57.9)
76,804(50.6)
Median Age(Q1–Q3)
64(55–72)
69(58–77)
68(60–76)
70(61–77)
66(58–74)
65(58–73)
57(50–64)
64(56–71)
57(50–63)
62(55–69)
56(49–61)
63(55–70)
71(63–79)
63(56–70)
66(57–75)
Age ranges—N (%)
<45 6820(13.5)
2192(9.0)
1045(5.4)
731(3.9)
715(5.9)
260(4.4)
594(13.9)
218(7.3)
310(10.7)
233(5.8)
140(14.4)
126(6.9)
195(5.3)
21(5.7)
13,600(9.0)
45–64 21,864(43.3)
7866(32.4)
8015(41.5)
5994(32.3)
4814(39.6) 2437 (41.5) 2790
(65.3)1491(50.2) 2061 (71.1) 2231
(56.0)686
(70.6)1006(55.0)
1389(37.5)
186(50.5)
62,830(41.4)
65–84 20,076(39.7)
12,372(51.0)
9396(48.7)
10,650(57.3)
6170(50.7) 3056 (52.1) 880
(20.6)1216(40.8) 527 (18.1) 1503
(37.7)145
(14.9)665
(36.4)1896(51.2)
157(42.7)
68,709(45.3)
≥85 1784(3.5)
1840(7.6)
840(4.4)
1215(6.5)
471(3.9)
116(2.0)
9(0.2)
52(1.7)
2(0.1)
20(0.5) – 31
(1.7)221(6.0)
4(1.1)
6605(4.3)
Comorbidities a —N (%)
Heart failure 2129(4.2)
2813(11.6)
1159(6.0)
1888(10.2)
834(6.9)
501(8.5)
254(5.9)
129(4.3)
149(5.1)
156(3.9)
26(2.7)
75(4.1)
216(5.8)
14(3.8)
10,343(6.8)
Atrial fibrillation 2001(4.0)
2164(8.9)
1024(5.3)
1519(8.2)
667(5.5)
339(5.8)
184(4.3)
99(3.3)
110(3.8)
129(3.2)
18(1.9)
53(2.9)
194(5.2)
7(1.9)
8508(5.6)
Hypertension b 34,762(68.8)
19,040(78.5)
15,412(79.9)
15,711(84.5)
9940(81.7) 4918 (83.8) 3469
(81.2)2264(76.0) 2304 (79.4) 3181
(79.8)754
(77.7)1373(75.1)
2858(77.2)
280(76.1)
116,266(76.6)
Lipid metabolismdisorders b
20,356(40.3)
11,960(49.3)
10,361(53.7)
10,303(55.4)
7165(58.9) 3964 (67.5) 2706
(63.3)1792(60.2) 1950 (67.2) 2,715
(68.1) 616(63.4) 1,102(60.3)
1754(47.4)
243(66.0)
76,987(50.7)
COPD 2008(4.0)
2014(8.3)
928(4.8)
1331(7.2)
596(4.9)
281(4.8)
196(4.6)
101(3.4)
94(3.2)
126(3.2)
23(2.4)
46(2.5)
209(5.6)
8(2.2)
7961(5.2)
Dementia b 583(1.2)
659(2.7)
274(1.4)
366(2.0)
197(1.6)
95(1.6)
17(0.4)
35(1.2)
7(0.2)
32(0.8)
5(0.5)
4(0.2)
67(1.8)
5(1.4)
2346(1.5)
Liver disease 1769(3.5)
1598(6.6)
737(3.8)
811(4.4)
530(4.4)
294(5.0)
241(5.6)
121(4.1)
167(5.8)
177(4.4)
47(4.8)
59(3.2)
159(4.3)
13(3.5)
6723(4.4)
Anemia 1737(3.4)
2300(9.5)
945(4.9)
1380(7.4)
671(5.5)
364(6.2)
177(4.1)
139(4.7)
109(3.8)
154(3.9)
32(3.3)
64(3.5)
216(5.8)
18(4.9)
8306(5.5)
Hyperuricemia/Gout b 7965(15.8)
5752(23.7)
4128(21.4)
5161(27.8)
2970(24.4) 1452 (24.7) 870
(20.4)591
(19.9) 516 (17.8) 633(15.9)
143(14.7)
307(16.8)
727(19.6)
74(20.1)
31,289(20.6)
Int. J. Environ. Res. Public Health 2020, 17, 9514 8 of 21
Table 1. Cont.
MetforminN = 50,544
(%)
InsulinN = 24,270
(%)
SUN = 19,296
(%)
GlinidesN = 18,590
(%)
AGIN = 12,170
(%)
DPP4iN = 5869
(%)
GLP-1 RAN = 4273
(%)
GlitazonesN = 2977
(%)
SGLT2iN = 2900
(%)
Metformin +DPP4i
N = 3987(%)
Metformin +SGLT2iN = 971
(%)
Metformin +GlitazonesN = 1828
(%)
Metformin +SU
N = 3701(%)
Other OralCombinations
N = 368(%)
TotalN = 151,744
(%)
Complications e—N (%)
Nephropathy 1737(3.4)
3007(12.4)
1168(6.1)
2087(11.2)
1016(8.3) 688 (11.7) 315
(7.4)236(7.9)
223(7.7)
195(4.9)
41(4.2)
89(4.9)
217(5.9)
22(6.0)
11,041(7.3)
Retinopathy 1252(2.5)
1308(5.4)
993(5.1)
906(4.9)
907(7.5)
486(8.3)
355(8.3)
194(6.5) 395 (13.6) 337
(8.5)106
(10.9)112(6.1)
159(4.3)
28(7.6)
7538(5.0)
Neuropathy 770(1.5)
491(2.0)
362(1.9)
380(2.0)
251(2.1)
157(2.7)
126(2.9)
55(1.8)
89(3.1)
105(2.6)
26(2.7)
31(1.7)
62(1.7)
11(3.0)
2916(1.9)
Cardiovasculardiseases c
5676(11.2)
5206(21.5)
2993(15.5)
3561(19.2)
2036(16.7) 1283 (21.9) 737
(17.2)384
(12.9) 689 (23.8) 710(17.8)
161(16.6)
212(11.6)
546(14.8)
41(11.1)
24,235(16.0)
Cerebrovasculardiseases d
5059(10.0)
4796(19.8)
2550(13.2)
3204(17.2)
1638(13.5) 967 (16.5) 474
(11.1)313
(10.5) 421 (14.5) 525(13.2)
113(11.6)
154(8.4)
522(14.1)
42(11.4)
20,778(13.7)
Diabetic foot 188(0.4)
249(1.0)
128(0.7)
140(0.8)
151(1.2)
70(1.2)
57(1.3)
29(1.0)
50(1.7)
43(1.1)
19(2.0)
21(1.1)
42(1.1)
4(1.1)
1191(0.8)
Concomitant drugs f —N (%)
Proton pumpinhibitors
23,168(45.8)
15,376(63.4)
11,071(57.4)
11,850(63.7)
7335(60.3) 3770 (64.2) 2351
(55.0)1638(55.0) 1601 (55.2) 2,232
(56.0)477
(49.1)924
(50.5)2156(58.3)
208(56.5)
84,157(55.5)
Anticoagulants g 4572(9.1)
4828(19.9)
2287(11.9)
2991(16.1)
1541(12.7) 728 (12.4) 445
(10.4)293(9.8)
249(8.6)
378(9.5)
70(7.2)
165(9.0)
506(13.7)
31(8.4)
9084(12.6)
Antiplatelet agents h 14,577(28.8)
10,797(44.5)
7956(41.2)
8801(47.3)
5626(46.2)
2838(48.4)
1577(36.9)
1158(38.9)
1183(40.8)
1,676(42.0)
347(35.7)
681(37.3)
1537(41.5)
154(41.9)
58,908(38.8)
Systemicglucocorticoids
6556(13.0)
4914(20.2)
2905(15.1)
3132(16.8)
1688(13.9) 667 (11.4) 405
(9.5)354
(11.9)262(9.0)
374(9.4)
72(7.4)
195(10.7)
613(16.6)
40(10.9)
22,177(14.6)
Antidepressants 4593(9.1)
2557(10.5)
2061(10.7)
2112(11.4)
1383(11.4) 617 (10.5) 436
(10.2)326
(11.0)260(9.0)
375(9.4)
95(9.8)
170(9.3)
442(11.9)
46(12.5)
15,473(10.2)
Drugs for neuropathicpain i
2128(4.2)
1648(6.8)
1286(6.7)
1326(7.1)
963(7.9)
497(8.5)
388(9.1)
219(7.4)
236(8.1)
315(7.9)
87(9.0)
124(6.8)
263(7.1)
33(9.0)
9513(6.3)
Anti-osteoporoticdrugs
1815(3.6)
1085(4.5)
1010(5.2)
1026(5.5)
747(6.1)
340(5.8)
112(2.6)
150(5.0)
82(2.8)
186(4.7)
29(3.0)
72(3.9)
181(4.9)
12(3.3)
6847(4.5)
Legend: AGI = alpha-glucosidase inhibitors; DPP4i = dipeptidyl peptidase-4 inhibitors; GLP-1RA = glucagon-like peptide-1 receptor antagonists; SGLT2i = sodium–glucose linkedtransporter 2 inhibitors; SU = sulfonylureas; COPD = chronic obstructive pulmonary disease; DM = diabetes mellitus; ID = index date; IQR = interquartile range. The other oralcombinations include fixed-dose combinations of glitazones + DPP4i and glitazones + sulfonylureas. a Evaluated any time prior to ID and identified looking at ICD9-CM codes fromdischarge diagnosis database or codes from exemptions from healthcare service co-payment database. b Dementia, hypertension, lipid metabolism disorders and gout were identified bylooking at ICD9-CM codes from the discharge diagnosis database, or codes from exemptions from the healthcare service co-payment database or the specific ATC codes from the outpatientdrug dispensing database. c This category includes: angina pectoris, ischemic heart disease, acute myocardial infarction. d This category includes: transient cerebral ischemia and stroke.e Evaluated any time prior to ID and identified by looking at ICD-9 codes from discharge diagnosis database or diabetologist registry or codes from exemptions from the healthcareservice co-payment database. f Evaluated within three months prior to ID and identified by looking at ATC codes from outpatient drug dispensing. g This category includes: vitaminK antagonists, heparins, thrombin direct inhibitors, factor Xa direct inhibitors, fibrinolytic agents. h This category includes: platelet aggregation inhibitors. i This category includes:Pregabalin, Gabapentin and Duloxetin.

Int. J. Environ. Res. Public Health 2020, 17, 9514 9 of 21
History of heart failure was observed in 4.3% of incident treatments of glitazones. Hypertensionand lipid metabolism disorders were the most common comorbidities (76.6% and 50.7%, respectively),and proton pump inhibitors (55.5%) were the most frequently used concomitant drugs.
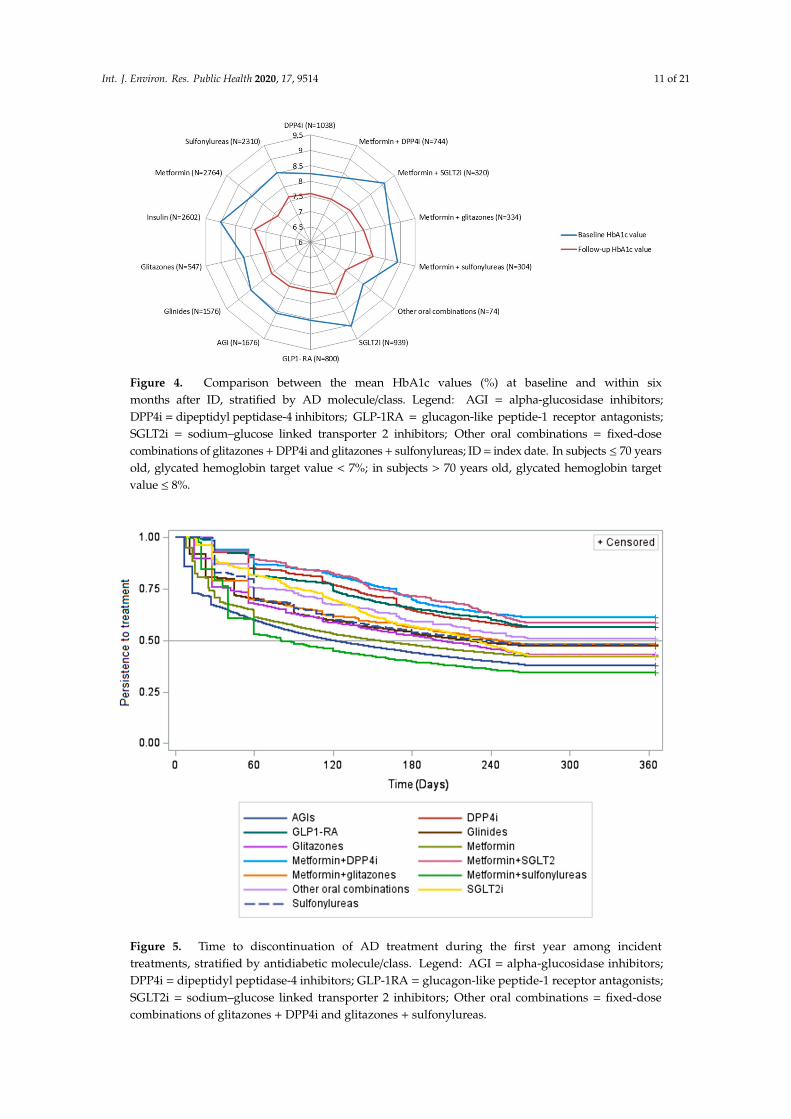
Among incident treatments of ADs with available clinical parameters from the diabetologistregistry, the baseline HbA1c values were always over the target range, with the highest values beingreported for incident treatments of SGLT2i (N = 1221 (79.6%); median (IQR): 8.9% (7.9–9.9%)), insulin(N = 3845 (47.6%); median (IQR): 8.8% (7.7–10.2%)) and a fixed-dose combination of metformin+ sulfonylureas (N = 463 (48.2%); median (IQR): 8.7% (7.6–10.0%)) (p-value < 0.05) (Table 2).Within 6 months after ID, the variation (%) in HbA1c values was more marked among incidenttreatments of fixed-dose combination of metformin + SGLT2i (−15.7%), SGLT2i (−12.8%) and insulin(−12.7%), as compared to other AD classes (p-values < 0.001) (Figure 4).
All incident AD treatments within at least 6 months of follow-up, with at least 1 HbA1cmeasurement at baseline and within 6 months from baseline, were included.
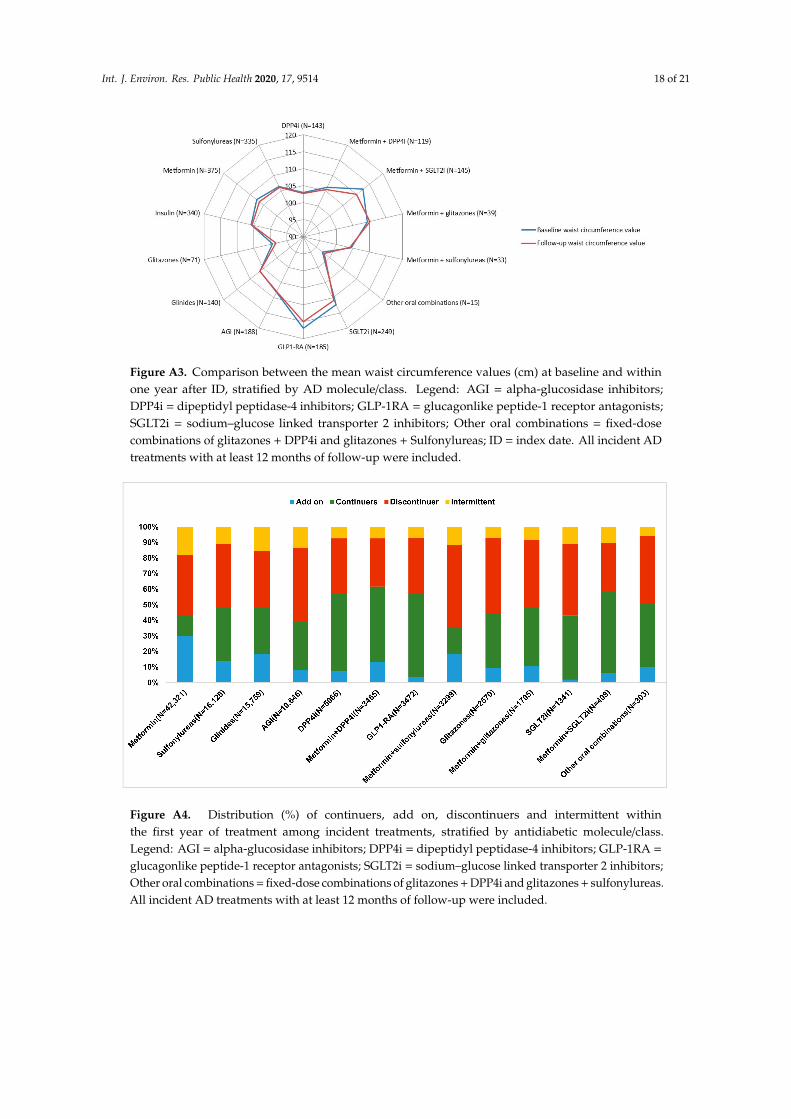
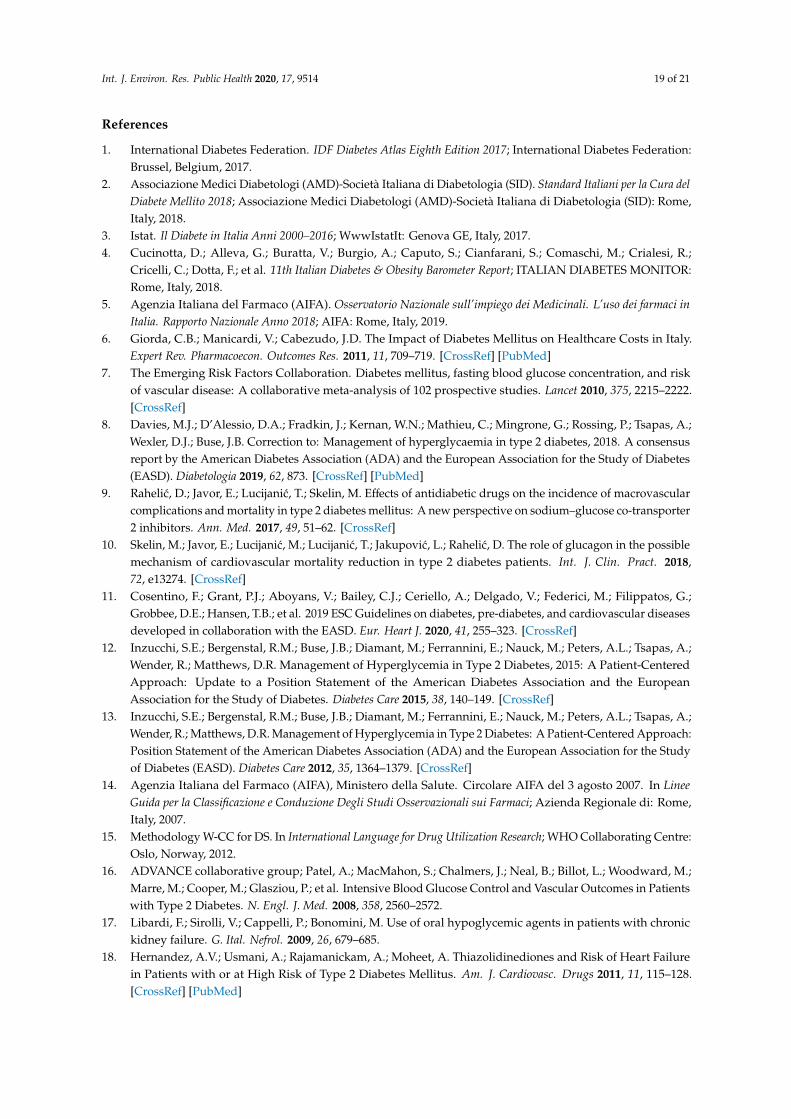
The highest baseline body weight as well as waist circumference values were observed amongincident treatments of newly marketed ADs, such as GLP1-RA (N = 1127 (59.0%); median (IQR)body weight: 95.0 kg (84.0–107.5 kg); N = 569 (29.8%), median (IQR) waist circumference: 116.0 cm(108.0–123.0 cm)) and fixed-dose combinations of metformin + SGLT2i (N = 438 (79.5%); median (IQR)body weight: 89.0 kg (79.0–102.0 kg); N = 295 (53.5%), median (IQR) waist circumference: 115.0 cm(106.0–120.0 cm)) and SGLT2i (N = 1231 (80.3%); median (IQR) body weight: 87.7 kg (77.5–100.4 kg);N = 669 (43.6%), median (IQR) waist circumference: 112.0 cm (104.0–120.0 cm)) (p-values < 0.05)as compared with other AD groups (Table 2). Statistically significant changes in body weight andwaist circumference values within one year after ID were observed (Figures A2 and A3). Specifically,the reduction in body weight values was more marked among incident treatments of fixed-dosecombination of metformin+SGLT2i (−2.4%), SGLT2i (−1.7%) and GLP1-RA (−1.6%) (p-values < 0.001)as compared with other AD groups. Additionally, for waist circumference, the reduction in meanvalues was more marked among incident treatments of fixed-dose combinations of metformin+SGLT2i(2.1%) and GLP1-RA (−1.6%;) (p-values < 0.001).
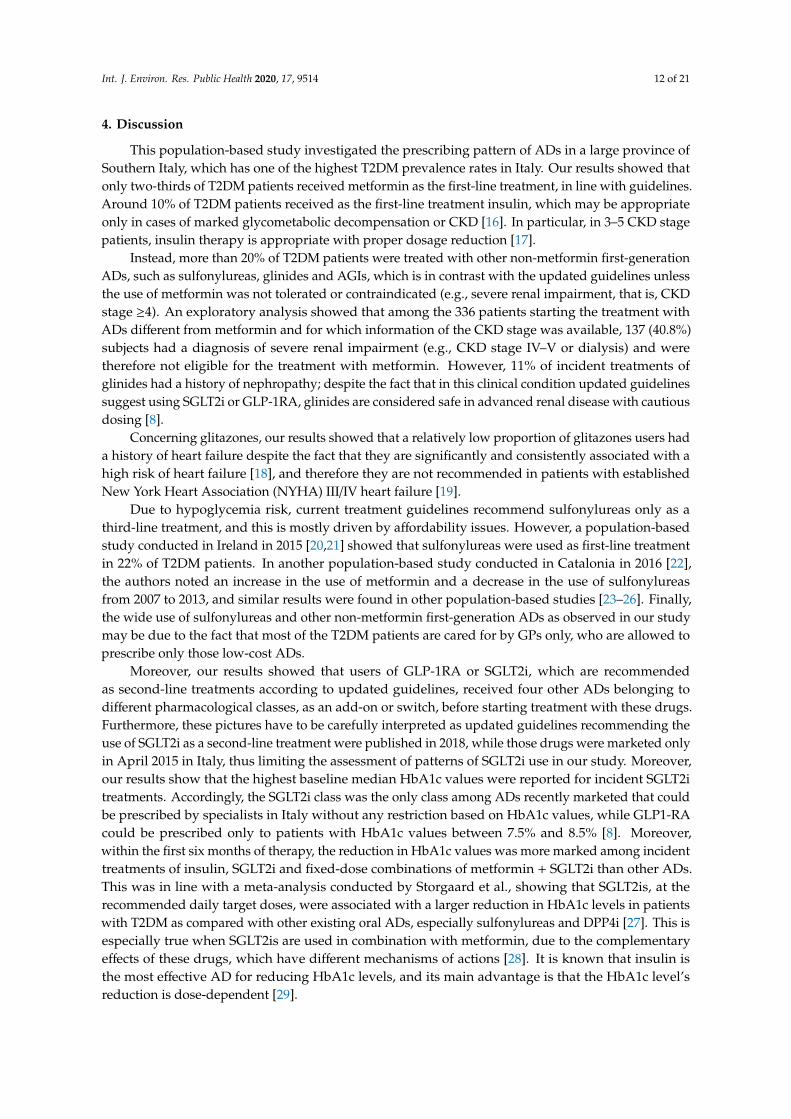
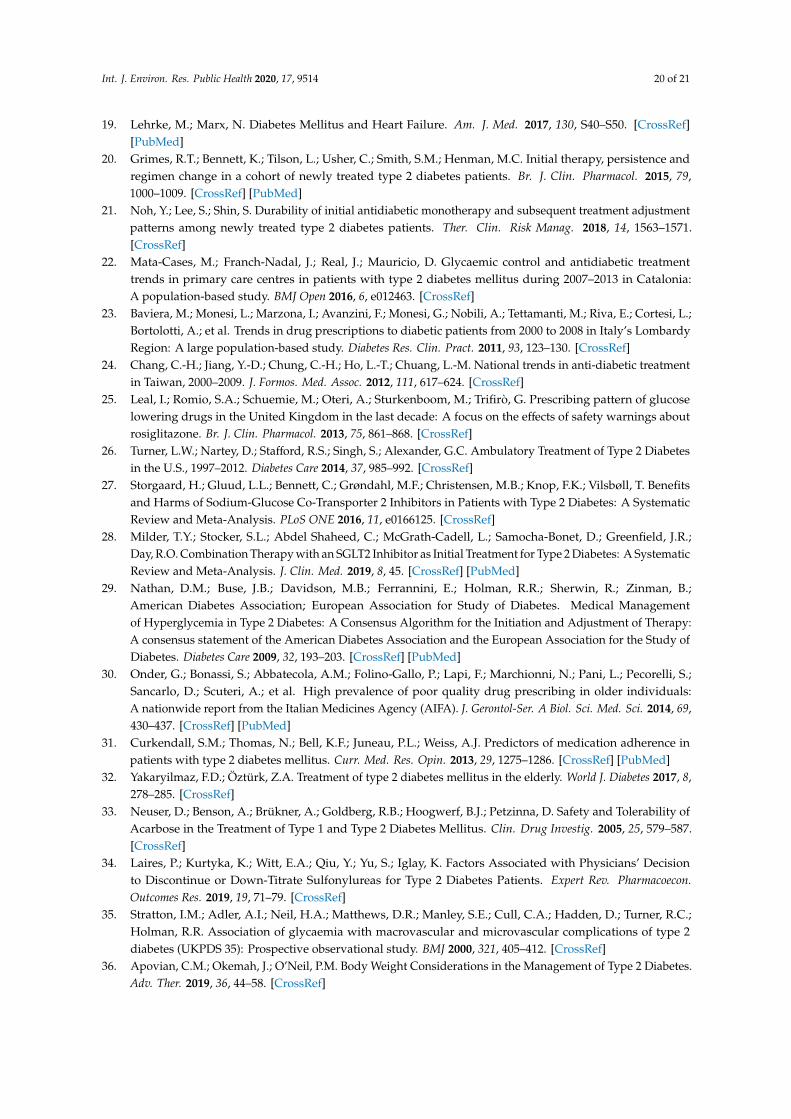
During the first year of AD treatment, more than half (55.0%) of the 106,484 incident AD treatmentsincluded in the persistence analysis discontinued the treatment, with the highest proportions ofdiscontinuers being observed among incident treatments of the metformin + sulfonylureas fixed-dosecombination (65.9%) and AGIs (62.2%) (p-value < 0.05). Moreover, 52.3% of sulfonylureas usersdiscontinued during the first year of treatment. One-fourth of incident treatments received onlyone dispensing of AD (i.e., occasional users) during the first year of treatment. On the contrary,the proportion of discontinuers was lower among incident treatments of more recently marketedADs, such as GLP1-RA and fixed-dose combinations of metformin+SGLT2i and metformin + DPP4i(p-values < 0.05 for comparison with other AD groups) (Figure 5).
Overall, within the first year of treatment, 13.9% of incident AD treatments were intermittentusers, as the same AD treatment was restarted after discontinuation. The highest percentages ofintermittent users were found among metformin users (17.7%) (p-value < 0.05). Overall, 20,389 (19.1%)incident AD treatments received an add-on therapy during the first year of treatment, mostly amongincident treatments of metformin (29.5%) (Figure A4).

Int. J. Environ. Res. Public Health 2020, 17, 9514 10 of 21
Table 2. Baseline clinical parameters of incident AD treatments in Palermo LHU during the years 2011–2017.
MetforminN = 12,230
InsulinN = 8081
SUN = 6587
GlinidesN = 5532
AGIN = 4759
DPP4iN = 2411
GLP-1 RAN = 1909
GlitazonesN = 1299
SGLT2iN = 1533
Metformin +DPP4i
N = 1713
Metformin +SGLT2iN = 551
Metformin +Glitazones
N = 778
Metformin +SU
N = 961
Other OralCombinations
N = 154
TotalN = 48,498
Clinical parameter: median [IQR] (Proportion (%) of incident AD treatments with ≥ 1 measurement within 3 months prior to ID)
Glycatedhemoglobin(target range:
7–8%) *
8.0[7.0–9.2]
(38.0)
8.8[7.7–10.2]
(47.6)
8.2[7.4–9.3]
(52.8)
8.2[7.2–9.3]
(44.7)
8.2[7.4–9.4]
(52.7)
8.0[7.5–8.7]
(59.3)
8.3[7.7–9.2]
(58.3)
8.0[7.1–9.1]
(60.7)
8.9[7.9–9.9]
(79.6)
8.2[7.6–8.8]
(59.7)
8.3[8.0–9.9]
(79.3)
8.5[7.6–9.7]
(63.5)
8.7[7.6–10.0]
(48.2)
8.0[7.6–8.9]
(68.8)
8.3[7.4–9.4]
(49.5)
Cholesterol(target range:
120–220 mg/dl)
184.0[155.0–216.0]
(34.1)
172.0[145.0–202.0]
(41.0)
173.0[147.0–204.0]
(46.8)
173.0[146.0–202.0]
(40.0)
170.0[144.0–200.0]
(46.8)
171.0[144.0–199.0]
(51.5)
170.0[142.0–199.0]
(51.8)
175.0[149.0–203.0]
(53.3)
168.0[142.0–197.0]
(68.0)
164.0[141.0–193.0]
(52.4)
171.0[147.0–195.0]
(68.2)
176.0[149.0–202.0]
(59.4)
176.0[148.5–210.5]
(42.9)
177.5[159.0–213.0]
(63.6)
174.0[147.0–204.0]
(43.7)
SGOT (targetrange: 1–35 UI/l)
20.0[15.0–27.0]
(22.6)
18.0[14.0–25.0]
(28.1)
19.0[15.0–26.0]
(33.5)
18.0[14.0–25.0]
(25.5)
19.0[15.0–25.0]
(33.3)
19.0[15.0–25.0]
(38.0)
21.0[16.0–28.0]
(37.8)
19.0[15.0–25.0]
(39.1)
20.0[15.0–28.0]
(49.4)
18.0[15.0–25.0]
(38.2)
20.0[15.0–28.0]
(48.8)
19.0[15.0–28.0]
(32.0)
18.0[15.0–25.0]
(24.3)
18.0[14.0–22.5]
(44.2)
19.0[15.0–26.0]
(30.1)
SGPT (targetrange: 1–43 UI/l)
23.0[16.0–36.0]
(23.9)
21.0[14.0–32.0]
(29.8)
22.0[16.0–33.0]
(35.2)
21.0[15.0–30.0]
(27.8)
21.0[15.0–31.0]
(36.0)
21.0[15.0–31.0]
(39.6)
26.0[18.0–39.0]
(39.4)
21.0[15.0–31.0]
(41.3)
24.0[17.0–36.0]
(50.0)
22.0[16.0–32.0]
(39.4)
25.0[17.0–36.0]
(51.0)
25.0[17.0–37.0]
39.5)
22.0[15.0–30.0]
(30.7)
20.0[15.0–28.0]
(53.2)
22.0[16.0–34.0]
(32.1)
Albuminextraction rate
(target range: 1,5–20 µg/min)
10.9[5.0–27.0]
(11.8)
13.60[6.0–40.30]
(16.5)
12.0[5.0–33.0]
(19.0)
14.0[5.6–49.0]
(14.8)
13.0[5.3–37.0]
(18.2)
13.0[5.0–37.5]
(21.3)
14.0[6.0–47.5]
(22.7)
11.0[5.0–26.0]
(25.1)
12.3[5.20–41.0]
(32.2)
12.8[5.3–31.0]
(23.0)
12.0[5.5–30.0]
(32.3)
12.0[5.0–34.0]
(25.2)
11.8[5.0–35.0]
(17.7)
12.0[7.0–57.8]
(29.9)
12.15[5.0–36.0]
(17.5)
Creatinineclearance
(target range:70–120 mL/min)
87.0[66.0–115.0]
(17.2)
78.0[53.0–108.0]
(25.7)
84.0[60.0–111.0]
(27.0)
67.0[48.0–96.0]
(25.1)
79.0[56.0–107.0]
(27.1)
72.0[51.0–99.0]
(33.5)
113.0[89.0–145.0]
(30.4)
78.0[57.0–108.0]
(32.7)
102.5[81.0–133.5]
(45.9)
88.0[68.0–107.0]
(30.9)
111.0[89.0–139.0]
(52.1)
95.0[73.0–119.0]
(32.5)
80.0[58.0–110.0]
(21.3)
81.0[62.0–108.0]
(27.9)
84.0[60.0–114.0]
(25.7)
BMI(target range:
18.5–24.9 Kg/m2)
29.9[26.7–34.0]
(37.5)
29.3[25.8–33.1]
(45.7)
30.0[26.6–33.7]
(51.1)
29.4[26.2–33.3]
(42.8)
30.1[26.8–34.0]
(48.7)
28.9[25.8–32.4]
(57.3)
34.5[31.0–39.1]
(57.5)
28.4[25.2–32.5]
(58.1)
32.4[28.9–36.7]
(79.3)
29.4[26.6–32.9]
(57.5)
32.5[29.0–36.7]
(78.9)
30.5[27.5–34.0]
(59.6)
30.1[26.5–33.6]
(43.4)
28.8[24.6–32.5]
(61.0)
30.1[26.6–34.0]
(47.8)
Waistcircumference(target values:
women: <80 cm;men: <94 cm)
108.0[100.0–116.0]
(14.8)
106.0[98.0–115.0]
(17.2)
107.0[99.0–116.0]
(19.9)
107.0[100.0–116.0]
(14.6)
109.0[100.0–118.0]
(16.6)
103.0[97.0–112.0]
(24.8)
116.0[108.0–123.0]
(29.8)
102.0[94.0–112.0]
(23.2)
112.0[104.0–120.0]
(43.6)
105.0[99.0–113.0]
(29.0)
115.0[106.0–120.0]
(53.5)
107.0[100.0–115.0]
(26.6)
104.0[98.0–114.0]
(15.1)
100.0[92.0–109.0]
(25.3)
108.0[100.0–117.0]
(19.4)
Bodyweight (kg)
80.0[70.0–93.0]
(38.7)
78.0[67.5–90.0]
(47.3)
79.0[69.0–91.0]
(52.6)
77.0[68.0–89.0]
(44.3)
80.0[70.0–91.7]
(50.3)
77.0[66.8–87.0]
(58.4)
95.0[84.0–107.5]
(59.0)
75.7[66.0–88.0]
(59.7)
87.7[77.5–100.4]
(80.3)
80.0[71.0–90.0]
(58.7)
89.0[79.0–102.0]
(79.5)
82.6[72.0–93.0]
(60.9)
79.0[69.0–91.0]
(44.8)
77.2[66.5–86.3]
(62.3)
80.0[70.0–92.5]
(49.2)
Legend: AGI = alpha-glucosidase inhibitors; DPP4i = dipeptidyl peptidase-4 inhibitors; GLP-1RA = glucagon-like peptide-1 receptor antagonists; SGLT2i = sodium–glucose linkedtransporter 2 inhibitors; SU = sulfonylureas; DM = diabetes mellitus; IQR = interquartile range; SGOT = serum glutamic oxaloacetic transaminase; SGPT = serum glutamate-pyruvatetransaminase; BMI = body mass index. The other oral combinations include fixed-dose combinations of glitazones + DPP4i and glitazones + sulfonylureas. * In subjects ≤ 70 years old,glycated hemoglobin target value < 7%; in subjects 70 years old, glycated hemoglobin target value ≤ 8%.
Int. J. Environ. Res. Public Health 2020, 17, 9514 11 of 21
Figure 4. Comparison between the mean HbA1c values (%) at baseline and within sixmonths after ID, stratified by AD molecule/class. Legend: AGI = alpha-glucosidase inhibitors;DPP4i = dipeptidyl peptidase-4 inhibitors; GLP-1RA = glucagon-like peptide-1 receptor antagonists;SGLT2i = sodium–glucose linked transporter 2 inhibitors; Other oral combinations = fixed-dosecombinations of glitazones + DPP4i and glitazones + sulfonylureas; ID = index date. In subjects ≤ 70 yearsold, glycated hemoglobin target value < 7%; in subjects > 70 years old, glycated hemoglobin targetvalue ≤ 8%.
Figure 5. Time to discontinuation of AD treatment during the first year among incidenttreatments, stratified by antidiabetic molecule/class. Legend: AGI = alpha-glucosidase inhibitors;DPP4i = dipeptidyl peptidase-4 inhibitors; GLP-1RA = glucagon-like peptide-1 receptor antagonists;SGLT2i = sodium–glucose linked transporter 2 inhibitors; Other oral combinations = fixed-dosecombinations of glitazones + DPP4i and glitazones + sulfonylureas.
Int. J. Environ. Res. Public Health 2020, 17, 9514 12 of 21
4. Discussion
This population-based study investigated the prescribing pattern of ADs in a large province ofSouthern Italy, which has one of the highest T2DM prevalence rates in Italy. Our results showed thatonly two-thirds of T2DM patients received metformin as the first-line treatment, in line with guidelines.Around 10% of T2DM patients received as the first-line treatment insulin, which may be appropriateonly in cases of marked glycometabolic decompensation or CKD [16]. In particular, in 3–5 CKD stagepatients, insulin therapy is appropriate with proper dosage reduction [17].
Instead, more than 20% of T2DM patients were treated with other non-metformin first-generationADs, such as sulfonylureas, glinides and AGIs, which is in contrast with the updated guidelines unlessthe use of metformin was not tolerated or contraindicated (e.g., severe renal impairment, that is, CKDstage ≥4). An exploratory analysis showed that among the 336 patients starting the treatment withADs different from metformin and for which information of the CKD stage was available, 137 (40.8%)subjects had a diagnosis of severe renal impairment (e.g., CKD stage IV–V or dialysis) and weretherefore not eligible for the treatment with metformin. However, 11% of incident treatments ofglinides had a history of nephropathy; despite the fact that in this clinical condition updated guidelinessuggest using SGLT2i or GLP-1RA, glinides are considered safe in advanced renal disease with cautiousdosing [8].
Concerning glitazones, our results showed that a relatively low proportion of glitazones users hada history of heart failure despite the fact that they are significantly and consistently associated with ahigh risk of heart failure [18], and therefore they are not recommended in patients with establishedNew York Heart Association (NYHA) III/IV heart failure [19].
Due to hypoglycemia risk, current treatment guidelines recommend sulfonylureas only as athird-line treatment, and this is mostly driven by affordability issues. However, a population-basedstudy conducted in Ireland in 2015 [20,21] showed that sulfonylureas were used as first-line treatmentin 22% of T2DM patients. In another population-based study conducted in Catalonia in 2016 [22],the authors noted an increase in the use of metformin and a decrease in the use of sulfonylureasfrom 2007 to 2013, and similar results were found in other population-based studies [23–26]. Finally,the wide use of sulfonylureas and other non-metformin first-generation ADs as observed in our studymay be due to the fact that most of the T2DM patients are cared for by GPs only, who are allowed toprescribe only those low-cost ADs.
Moreover, our results showed that users of GLP-1RA or SGLT2i, which are recommendedas second-line treatments according to updated guidelines, received four other ADs belonging todifferent pharmacological classes, as an add-on or switch, before starting treatment with these drugs.Furthermore, these pictures have to be carefully interpreted as updated guidelines recommending theuse of SGLT2i as a second-line treatment were published in 2018, while those drugs were marketed onlyin April 2015 in Italy, thus limiting the assessment of patterns of SGLT2i use in our study. Moreover,our results show that the highest baseline median HbA1c values were reported for incident SGLT2itreatments. Accordingly, the SGLT2i class was the only class among ADs recently marketed that couldbe prescribed by specialists in Italy without any restriction based on HbA1c values, while GLP1-RAcould be prescribed only to patients with HbA1c values between 7.5% and 8.5% [8]. Moreover,within the first six months of therapy, the reduction in HbA1c values was more marked among incidenttreatments of insulin, SGLT2i and fixed-dose combinations of metformin + SGLT2i than other ADs.This was in line with a meta-analysis conducted by Storgaard et al., showing that SGLT2is, at therecommended daily target doses, were associated with a larger reduction in HbA1c levels in patientswith T2DM as compared with other existing oral ADs, especially sulfonylureas and DPP4i [27]. This isespecially true when SGLT2is are used in combination with metformin, due to the complementaryeffects of these drugs, which have different mechanisms of actions [28]. It is known that insulin isthe most effective AD for reducing HbA1c levels, and its main advantage is that the HbA1c level’sreduction is dose-dependent [29].

Int. J. Environ. Res. Public Health 2020, 17, 9514 13 of 21
As expected, the highest baseline body weight values, as well as waist circumference values,were observed among incident treatments of more recently marketed ADs, such as GLP1-RA, SGLT2iand fixed-dose combinations of metformin + SGLT2i. This is in line with guidelines, which recommendthe prescription of these ADs in patients prioritizing weight loss or weight maintenance [8].
In general, discontinuation may result from intolerance or side-effects, and our results showedthat during the first year of treatment, more than half of the patients with incident treatments ofADs, especially AGIs and fixed-dose combinations of metformin + sulfonylureas, discontinued thetherapy. This finding is in line with other national/international population-based studies, showingthat up to 50% of T2DM patients discontinued AD treatment during the first year of therapy [30,31].AD treatment discontinuation in the elderly population could be explained by the need to avoidhypoglycemic events that can be fatal in fragile patients; that is why higher glycated hemoglobinlevels are allowed in elderly patients [32]. Concerning AGIs, discontinuation was probably due totheir known gastrointestinal effects [8,33]. The high proportion of discontinuers among sulfonylureasusers as well as users of fixed-dose combinations of metformin + sulfonylureas could be explained bythe high risk of symptomatic hypoglycemic events [34]. AD treatment discontinuation is associatedwith a worsening of glucose metabolism, and therefore with increased glycated hemoglobin valuesthat could determine a series of consequences related to macroangiopathy, microangiopathy anddiabetic neuropathy [35]. Such consequences may lead to an increased cardiovascular risk and clinicalcomplications that can negatively impact the NHS.
In our study, 25% of the incident treatments were occasional (only one AD dispensing), especiallyamong AGIs and metformin groups (data not shown). However, the proportion of metforminoccasional users could probably be overestimated. In Italy, metformin is very cheap and, accordingto the “IMS-Health Italy” database, which provides aggregated data on drugs dispensed by privatepharmacies and distinguishes between dispensing reimbursed and not reimbursed (e.g., paid directlyby patients) by the National Health System, around 20% of metformin is purchased outside theNational health Service (NHS), hence not being fully traceable using claims databases. In addition,almost one-third of incident treatments of metformin received an add-on therapy during the first yearof treatment, probably because glycemic control was not achieved with metformin monotherapy.
On the contrary, lower proportions of discontinuers were observed among incident treatments ofmore recently marketed ADs, such as GLP1-RA, DPP4 and metformin+DPP4i, which are generallywell tolerated, and are associated with weight loss and low risk of hypoglycemia [36]. Moreover,patients treated with these ADs are cared for by diabetologist (as GPs cannot prescribe those drugs),who can be more effective in motivating patients to continue AD treatment, especially as periodic visitsare planned to assess therapy and eventually renew therapeutic plans.
Strengths and Limitations
The main strengths of this study are the large size of the study cohort and the availability of theclaims plus diabetologist registry from the same catchment area for a period of 8 years.
On the other hand, some study limitations warrant caution. First, clinical data from thediabetologist registry were limited to a low sample of the study cohort with likely more advanced orcomplicated diabetes mellitus. In Italy, only the diabetologist may prescribe more recently marketedADs, such as GLP-1RA, DPP4i and SGLT2i, while GPs can prescribe only first-generation ADs [37].
Second, the persistence to treatment was assessed on the basis of DDD for non-fixed dosecombinations, but clearly situations in which some patients have to intensify the therapy could occur,and therefore DDD could not reflect the doses used in the real world. This is the case of insulin:as no standard duration exists because it depends on the health condition of the patient, insulin wasexcluded from the persistence analysis (Figure 5) and from the analysis of the distribution of continuers,add-on, discontinuers and intermittent users (Figure A4). Moreover, the doses of sulfonylureas, usuallyprescribed by GPs, are substantially variable (from half to three tablets a day, as specified in the summaryof product characteristics). For this reason, we cannot rule out that persistence to sulfonylureas may be

Int. J. Environ. Res. Public Health 2020, 17, 9514 14 of 21
partly underestimated. However, the proportion of discontinuers among users of sulfonylureas wasnot significantly higher than discontinuers of other Ads, and it is well known that the hypoglycemiceffects of sulfonylureas may trigger discontinuation. Concerning fixed-dose combinations, as a DDDdoes not exist, we assumed that the dosing regimen was one tablet a day. However, in the case offixed-dose combination of metformin + sulfonylureas, the dose, again, is related to patient tolerance orthe patient’s renal function. For this reason, discontinuation could be overestimated.
Third, not all AD dispensing can be completely traced, as 16% of ADs dispensed in PalermoLHU were reported as being purchased outside the NHS during the study years, with the highestpercentages for lowest-costing Ads, such as metformin (cost = EUR 3.00; estimated purchase outsidethe NHS = 20%). However, in Italy, it is unlikely that a patient after receiving a diagnosis of diabetesmellitus and a first AD prescription by the GP/diabetologist will purchase a drug outside the NHS inprivate pharmacy, without any reimbursement, and consequently the first AD dispensing is missing.As such, it is highly unlikely that the first AD drug dispensing goes untraced. However, this could atleast partly explain the very high proportion of intermittent users/discontinuers that could directlypurchase a low-cost AD in a private pharmacy without receiving the prescription from the GP/specialist.
Finally, our findings cannot be fully generalized to the whole Italian general population, as thestudy was restricted to a LHU of Southern Italy.
5. Conclusions
In a general population from Southern Italy, a large use of non-metformin first-generation ADs,as both first- and second-line treatments and with high short-term discontinuation rates, was observed.This is likely due to the fact that about 70% of T2DM patients in the Palermo LHU were cared for onlyby GPs, who may prescribe only first-generation ADs, despite updated guidelines recommendingas second-line therapies more recent and higher-cost drugs, such as DPP4i, GLP1-RA and SGLT2i.A linkage of claims databases with clinical registries can help rapidly explore the effectiveness andsafety issues in real-world settings. In the near future, further analyses re-evaluating the patternof recently marketed antidiabetic drugs in relation to the updated type 2 diabetes mellitus therapyguidelines, as well as the role of GPs in the prescription of more recently marketed ADs in Italy, need tobe performed. It is also crucial to establish an alliance between physicians and patients aimed atimplementing treatment adherence by increasing patient’s knowledge of the possible complications thatchronic diseases such as diabetes can cause. New strategies, such as lifestyle modifications, reductionsin the major risk factors (e.g., obesity, physical activity, tobacco smoking, alcohol consumption andmental stress) responsible for T2DM, and other educational programs for both physicians and patients,are needed to prevent and/or delay the onset of diabetes and to promote AD therapy adherence inorder to avoid, or reduce as much as possible, treatment-related adverse events. This would result insignificant reductions in social burden and economic costs.
Author Contributions: Conceptualization, G.T.; methodology, Y.I., G.T.; software, V.I., L.L.; validation, L.L.;formal analysis, S.C., V.I.; resources, M.P., S.S.; data curation, V.I.; writing—original draft preparation, Y.I., M.P.B.,S.C.; writing—review and editing, Y.I., M.P.B., S.C., M.M., M.P., V.P., A.S.; supervision, G.T.; funding acquisition,G.T. All authors have read and agreed to the published version of the manuscript.
Funding: The study received an unconditional grant from AstraZeneca. The sponsors did not influence in anyway the investigators in any phase of the study.
Conflicts of Interest: Gianluca Trifirò declares his participation in advisory boards organized by Sanofi Genzyme,Abbvie, Sanofi, GSK, Biogen, Ipsen, Novartis, Bayer; he was a consultant for Otsuka; furthermore, he coordinatesa pharmacoepidemiology research team at the University of Messina, which receives research grants for projectsby PTC Therapeutics, AstraZeneca, Amgen, IBSA. The other authors declare no conflict of interest.
Int. J. Environ. Res. Public Health 2020, 17, 9514 15 of 21
Appendix A
Table A1. List of study drugs.
Molecule/Class ATC Codes
Metformin A10BA02DPP4i A10BH01, A10BH02, A10BH03, A10BH04, A10BH05SGLT2i A10BK01, A10BK02, A10BK03, A10BX09, A10BX11, A10BX12
GLP1-RA A10BJ01, A10BJ02, A10BJ03, A10BJ04, A10BJ05, A10BX04, A10BX07, A10BX10,A10BX13, A10BX14
AGI A10BF01Glinides A10BX02
Glitazones A10BG02, A10BG03Insulin A10AB.xx, A10AC.xx, A10AD.xx, A10AE01, A10AE04, A10AE05, A10AE06
Sulfonylureas A10BB.xx
Fixed-dose combinations
Metformin + DPP4i A10BD07, A10BD08, A10BD10, A10BD11, A10BD13Metformin + SGLT2i A10BD15, A10BD16, A10BD20
Metformin + glitazones A10BD03, A10BD05Metformin + sulfonylureas A10BD01, A10BD02
Other oral combinations A10BD09, A10BD04, A10BD06
Legend: ATC = anatomical therapeutic clinical; AGI = alpha-glucosidase inhibitors; DPP4i = dipeptidyl peptidase-4inhibitors; GLP-1RA = glucagon-like peptide-1 receptor antagonists; SGLT2i = sodium–glucose linked transporter 2inhibitors; Other oral combinations = fixed-dose combinations of glitazones + DPP4i and glitazones + sulfonylureas.
Int. J. Environ. Res. Public Health 2020, 17, 9514 16 of 21
Table A2. List of covariates included in the baseline characterization of incident treatments.
Covariates Identification Criteria
Patient demographics
SexEvaluated at index dateAge
Comorbidities
Heart failureICD-9 codes from discharge diagnosis database or codes fromexemptions from healthcare service co-payment database anytime prior to index date
Atrial fibrillationCOPD
Liver diseaseAnemia
Hypertension ICD9-CM codes from discharge diagnosis database, or codesfrom exemptions from healthcare service co-payment databaseor the specific ATC codes from outpatient drug dispensingdatabase any time prior to index date
Lipid metabolism disordersDementia
Hyperuricemia/Gout
Complications
Nephropathy
ICD-9 codes from discharge diagnosis database or diabetologistregistry or codes from exemptions from healthcare serviceco-payment database any time prior to index date
RetinopathyNeuropathy
Cardiovascular diseases a
Cerebrovascular diseases b
Diabetic foot
Concomitant drugs
Proton pump inhibitors
ATC codes from outpatient drug dispensing within threemonths prior to index date
Anticoagulants c
Antiplatelet agents d
Systemic glucocorticoidsAntidepressants
Drugs for neuropathic pain e
Anti-osteoporotic drugs
Clinical parameters
Glycated hemoglobin (HbA1c)
Available only for a subgroup of patients with data recorded inthe diabetologist registry, measured within three months priorto index date
CholesterolTransaminases
Albumin extraction rateCreatinine clearance
BMIWaist circumference
Body weight
Legend: COPD = chronic obstructive pulmonary disease; BMI = body mass index. a This category includes anginapectoris, ischemic heart disease, acute myocardial infarction. b This category includes transient cerebral ischemiaand stroke. c This category includes vitamin K antagonists, heparins, thrombin direct inhibitors, factor Xa directinhibitors, fibrinolytic agents. d This category includes platelet aggregation inhibitors. e This category includesPregabalin, Gabapentin and Duloxetin.
Int. J. Environ. Res. Public Health 2020, 17, 9514 17 of 21
Figure A1. Prevalence (%) of AD users, stratified by calendar year and AD molecule/class.Legend: AGI = alpha-glucosidase inhibitors; DPP4i = dipeptidyl peptidase-4 inhibitors; GLP-1RA =
glucagonlike peptide-1 receptor antagonists; SGLT2i = sodium–glucose linked transporter 2 inhibitors;Other oral combinations = fixed-dose combinations of glitazones + DPP4i and glitazones + sulfonylureas.
Figure A2. Comparison between the mean body weight values (kg) at baseline and withinone year after ID, stratified by AD molecule/class. Legend: AGI = alpha-glucosidase inhibitors;DPP4i = dipeptidyl peptidase-4 inhibitors; GLP-1RA = glucagonlike peptide-1 receptor antagonists;SGLT2i = sodium–glucose linked transporter 2 inhibitors; Other oral combinations = fixed-dosecombinations of glitazones + DPP4i and glitazones + sulfonylureas; ID = index date. All incident ADtreatments with at least 12 months of follow-up were included.
Int. J. Environ. Res. Public Health 2020, 17, 9514 18 of 21
Figure A3. Comparison between the mean waist circumference values (cm) at baseline and withinone year after ID, stratified by AD molecule/class. Legend: AGI = alpha-glucosidase inhibitors;DPP4i = dipeptidyl peptidase-4 inhibitors; GLP-1RA = glucagonlike peptide-1 receptor antagonists;SGLT2i = sodium–glucose linked transporter 2 inhibitors; Other oral combinations = fixed-dosecombinations of glitazones + DPP4i and glitazones + Sulfonylureas; ID = index date. All incident ADtreatments with at least 12 months of follow-up were included.
Figure A4. Distribution (%) of continuers, add on, discontinuers and intermittent withinthe first year of treatment among incident treatments, stratified by antidiabetic molecule/class.Legend: AGI = alpha-glucosidase inhibitors; DPP4i = dipeptidyl peptidase-4 inhibitors; GLP-1RA =
glucagonlike peptide-1 receptor antagonists; SGLT2i = sodium–glucose linked transporter 2 inhibitors;Other oral combinations = fixed-dose combinations of glitazones + DPP4i and glitazones + sulfonylureas.All incident AD treatments with at least 12 months of follow-up were included.
Int. J. Environ. Res. Public Health 2020, 17, 9514 19 of 21
References
1. International Diabetes Federation. IDF Diabetes Atlas Eighth Edition 2017; International Diabetes Federation:Brussel, Belgium, 2017.
2. Associazione Medici Diabetologi (AMD)-Società Italiana di Diabetologia (SID). Standard Italiani per la Cura delDiabete Mellito 2018; Associazione Medici Diabetologi (AMD)-Società Italiana di Diabetologia (SID): Rome,Italy, 2018.
3. Istat. Il Diabete in Italia Anni 2000–2016; WwwIstatIt: Genova GE, Italy, 2017.4. Cucinotta, D.; Alleva, G.; Buratta, V.; Burgio, A.; Caputo, S.; Cianfarani, S.; Comaschi, M.; Crialesi, R.;
Cricelli, C.; Dotta, F.; et al. 11th Italian Diabetes & Obesity Barometer Report; ITALIAN DIABETES MONITOR:Rome, Italy, 2018.
5. Agenzia Italiana del Farmaco (AIFA). Osservatorio Nazionale sull’impiego dei Medicinali. L’uso dei farmaci inItalia. Rapporto Nazionale Anno 2018; AIFA: Rome, Italy, 2019.
6. Giorda, C.B.; Manicardi, V.; Cabezudo, J.D. The Impact of Diabetes Mellitus on Healthcare Costs in Italy.Expert Rev. Pharmacoecon. Outcomes Res. 2011, 11, 709–719. [CrossRef] [PubMed]
7. The Emerging Risk Factors Collaboration. Diabetes mellitus, fasting blood glucose concentration, and riskof vascular disease: A collaborative meta-analysis of 102 prospective studies. Lancet 2010, 375, 2215–2222.[CrossRef]
8. Davies, M.J.; D’Alessio, D.A.; Fradkin, J.; Kernan, W.N.; Mathieu, C.; Mingrone, G.; Rossing, P.; Tsapas, A.;Wexler, D.J.; Buse, J.B. Correction to: Management of hyperglycaemia in type 2 diabetes, 2018. A consensusreport by the American Diabetes Association (ADA) and the European Association for the Study of Diabetes(EASD). Diabetologia 2019, 62, 873. [CrossRef] [PubMed]
9. Rahelic, D.; Javor, E.; Lucijanic, T.; Skelin, M. Effects of antidiabetic drugs on the incidence of macrovascularcomplications and mortality in type 2 diabetes mellitus: A new perspective on sodium–glucose co-transporter2 inhibitors. Ann. Med. 2017, 49, 51–62. [CrossRef]
10. Skelin, M.; Javor, E.; Lucijanic, M.; Lucijanic, T.; Jakupovic, L.; Rahelic, D. The role of glucagon in the possiblemechanism of cardiovascular mortality reduction in type 2 diabetes patients. Int. J. Clin. Pract. 2018,72, e13274. [CrossRef]
11. Cosentino, F.; Grant, P.J.; Aboyans, V.; Bailey, C.J.; Ceriello, A.; Delgado, V.; Federici, M.; Filippatos, G.;Grobbee, D.E.; Hansen, T.B.; et al. 2019 ESC Guidelines on diabetes, pre-diabetes, and cardiovascular diseasesdeveloped in collaboration with the EASD. Eur. Heart J. 2020, 41, 255–323. [CrossRef]
12. Inzucchi, S.E.; Bergenstal, R.M.; Buse, J.B.; Diamant, M.; Ferrannini, E.; Nauck, M.; Peters, A.L.; Tsapas, A.;Wender, R.; Matthews, D.R. Management of Hyperglycemia in Type 2 Diabetes, 2015: A Patient-CenteredApproach: Update to a Position Statement of the American Diabetes Association and the EuropeanAssociation for the Study of Diabetes. Diabetes Care 2015, 38, 140–149. [CrossRef]
13. Inzucchi, S.E.; Bergenstal, R.M.; Buse, J.B.; Diamant, M.; Ferrannini, E.; Nauck, M.; Peters, A.L.; Tsapas, A.;Wender, R.; Matthews, D.R. Management of Hyperglycemia in Type 2 Diabetes: A Patient-Centered Approach:Position Statement of the American Diabetes Association (ADA) and the European Association for the Studyof Diabetes (EASD). Diabetes Care 2012, 35, 1364–1379. [CrossRef]
14. Agenzia Italiana del Farmaco (AIFA), Ministero della Salute. Circolare AIFA del 3 agosto 2007. In LineeGuida per la Classificazione e Conduzione Degli Studi Osservazionali sui Farmaci; Azienda Regionale di: Rome,Italy, 2007.
15. Methodology W-CC for DS. In International Language for Drug Utilization Research; WHO Collaborating Centre:Oslo, Norway, 2012.
16. ADVANCE collaborative group; Patel, A.; MacMahon, S.; Chalmers, J.; Neal, B.; Billot, L.; Woodward, M.;Marre, M.; Cooper, M.; Glasziou, P.; et al. Intensive Blood Glucose Control and Vascular Outcomes in Patientswith Type 2 Diabetes. N. Engl. J. Med. 2008, 358, 2560–2572.
17. Libardi, F.; Sirolli, V.; Cappelli, P.; Bonomini, M. Use of oral hypoglycemic agents in patients with chronickidney failure. G. Ital. Nefrol. 2009, 26, 679–685.
18. Hernandez, A.V.; Usmani, A.; Rajamanickam, A.; Moheet, A. Thiazolidinediones and Risk of Heart Failurein Patients with or at High Risk of Type 2 Diabetes Mellitus. Am. J. Cardiovasc. Drugs 2011, 11, 115–128.[CrossRef] [PubMed]
Int. J. Environ. Res. Public Health 2020, 17, 9514 20 of 21
19. Lehrke, M.; Marx, N. Diabetes Mellitus and Heart Failure. Am. J. Med. 2017, 130, S40–S50. [CrossRef][PubMed]
20. Grimes, R.T.; Bennett, K.; Tilson, L.; Usher, C.; Smith, S.M.; Henman, M.C. Initial therapy, persistence andregimen change in a cohort of newly treated type 2 diabetes patients. Br. J. Clin. Pharmacol. 2015, 79,1000–1009. [CrossRef] [PubMed]
21. Noh, Y.; Lee, S.; Shin, S. Durability of initial antidiabetic monotherapy and subsequent treatment adjustmentpatterns among newly treated type 2 diabetes patients. Ther. Clin. Risk Manag. 2018, 14, 1563–1571.[CrossRef]
22. Mata-Cases, M.; Franch-Nadal, J.; Real, J.; Mauricio, D. Glycaemic control and antidiabetic treatmenttrends in primary care centres in patients with type 2 diabetes mellitus during 2007–2013 in Catalonia:A population-based study. BMJ Open 2016, 6, e012463. [CrossRef]
23. Baviera, M.; Monesi, L.; Marzona, I.; Avanzini, F.; Monesi, G.; Nobili, A.; Tettamanti, M.; Riva, E.; Cortesi, L.;Bortolotti, A.; et al. Trends in drug prescriptions to diabetic patients from 2000 to 2008 in Italy’s LombardyRegion: A large population-based study. Diabetes Res. Clin. Pract. 2011, 93, 123–130. [CrossRef]
24. Chang, C.-H.; Jiang, Y.-D.; Chung, C.-H.; Ho, L.-T.; Chuang, L.-M. National trends in anti-diabetic treatmentin Taiwan, 2000–2009. J. Formos. Med. Assoc. 2012, 111, 617–624. [CrossRef]
25. Leal, I.; Romio, S.A.; Schuemie, M.; Oteri, A.; Sturkenboom, M.; Trifirò, G. Prescribing pattern of glucoselowering drugs in the United Kingdom in the last decade: A focus on the effects of safety warnings aboutrosiglitazone. Br. J. Clin. Pharmacol. 2013, 75, 861–868. [CrossRef]
26. Turner, L.W.; Nartey, D.; Stafford, R.S.; Singh, S.; Alexander, G.C. Ambulatory Treatment of Type 2 Diabetesin the U.S., 1997–2012. Diabetes Care 2014, 37, 985–992. [CrossRef]
27. Storgaard, H.; Gluud, L.L.; Bennett, C.; Grøndahl, M.F.; Christensen, M.B.; Knop, F.K.; Vilsbøll, T. Benefitsand Harms of Sodium-Glucose Co-Transporter 2 Inhibitors in Patients with Type 2 Diabetes: A SystematicReview and Meta-Analysis. PLoS ONE 2016, 11, e0166125. [CrossRef]
28. Milder, T.Y.; Stocker, S.L.; Abdel Shaheed, C.; McGrath-Cadell, L.; Samocha-Bonet, D.; Greenfield, J.R.;Day, R.O. Combination Therapy with an SGLT2 Inhibitor as Initial Treatment for Type 2 Diabetes: A SystematicReview and Meta-Analysis. J. Clin. Med. 2019, 8, 45. [CrossRef] [PubMed]
29. Nathan, D.M.; Buse, J.B.; Davidson, M.B.; Ferrannini, E.; Holman, R.R.; Sherwin, R.; Zinman, B.;American Diabetes Association; European Association for Study of Diabetes. Medical Managementof Hyperglycemia in Type 2 Diabetes: A Consensus Algorithm for the Initiation and Adjustment of Therapy:A consensus statement of the American Diabetes Association and the European Association for the Study ofDiabetes. Diabetes Care 2009, 32, 193–203. [CrossRef] [PubMed]
30. Onder, G.; Bonassi, S.; Abbatecola, A.M.; Folino-Gallo, P.; Lapi, F.; Marchionni, N.; Pani, L.; Pecorelli, S.;Sancarlo, D.; Scuteri, A.; et al. High prevalence of poor quality drug prescribing in older individuals:A nationwide report from the Italian Medicines Agency (AIFA). J. Gerontol-Ser. A Biol. Sci. Med. Sci. 2014, 69,430–437. [CrossRef] [PubMed]
31. Curkendall, S.M.; Thomas, N.; Bell, K.F.; Juneau, P.L.; Weiss, A.J. Predictors of medication adherence inpatients with type 2 diabetes mellitus. Curr. Med. Res. Opin. 2013, 29, 1275–1286. [CrossRef] [PubMed]
32. Yakaryilmaz, F.D.; Öztürk, Z.A. Treatment of type 2 diabetes mellitus in the elderly. World J. Diabetes 2017, 8,278–285. [CrossRef]
33. Neuser, D.; Benson, A.; Brükner, A.; Goldberg, R.B.; Hoogwerf, B.J.; Petzinna, D. Safety and Tolerability ofAcarbose in the Treatment of Type 1 and Type 2 Diabetes Mellitus. Clin. Drug Investig. 2005, 25, 579–587.[CrossRef]
34. Laires, P.; Kurtyka, K.; Witt, E.A.; Qiu, Y.; Yu, S.; Iglay, K. Factors Associated with Physicians’ Decisionto Discontinue or Down-Titrate Sulfonylureas for Type 2 Diabetes Patients. Expert Rev. Pharmacoecon.Outcomes Res. 2019, 19, 71–79. [CrossRef]
35. Stratton, I.M.; Adler, A.I.; Neil, H.A.; Matthews, D.R.; Manley, S.E.; Cull, C.A.; Hadden, D.; Turner, R.C.;Holman, R.R. Association of glycaemia with macrovascular and microvascular complications of type 2diabetes (UKPDS 35): Prospective observational study. BMJ 2000, 321, 405–412. [CrossRef]
36. Apovian, C.M.; Okemah, J.; O’Neil, P.M. Body Weight Considerations in the Management of Type 2 Diabetes.Adv. Ther. 2019, 36, 44–58. [CrossRef]

Int. J. Environ. Res. Public Health 2020, 17, 9514 21 of 21
37. Comaschi, M.; Di Lenarda, A.; Medea, G.; Aglialoro, A.; Cucinotta, D.; Gulizia, M.; Vespasiani, G.; Zuin, G.;Nicolucci, A.; Spandonaro, F.; et al. INtegration of care for reaching targetS In Diabetic patiEnts: Design ofthe INSIDE Study. Diabetes Ther. 2019, 11, 359–367. [CrossRef]
Publisher’s Note: MDPI stays neutral with regard to jurisdictional claims in published maps and institutionalaffiliations.
© 2020 by the authors. Licensee MDPI, Basel, Switzerland. This article is an open accessarticle distributed under the terms and conditions of the Creative Commons Attribution(CC BY) license (http://creativecommons.org/licenses/by/4.0/).