In vitro and in vivo TNFα synthesis modulation by methylguanidine, an uremic catabolyte
24
Autore et al. 1 MODULATION OF INDUCIBLE NITRIC OXIDE SYNTHASE EXPRESSION BY AN UREMIC CATABOLYTE, METHYLGUANIDINE, IN LPS-STIMULATED J774 MACROPHAGES. #Giuseppina Autore, Stefania Marzocco, Raffaella Sorrentino*, Anwar Baydoun** and Aldo Pinto. Department of Pharmaceutical Sciences, University of Salerno, Via Ponte Don Melillo, 84084 Fisciano (SA) Italy. *Department of Experimental Pharmacology, University Federico II of Naples, Via D. Montesano, 49, 80131 Naples, Italy. **Department Bioscieces, University of Hertfordshire, Hartfield, Herts, AL109AB, UK. Running Title: Inhibition of iNOS expression by methylguanidine Corresponding author: # Giuseppina Autore Ph.D. Department of Pharmaceutical Sciences University of Salerno Via Ponte Don Melillo 84084 Fisciano (SA) Italy Tel/fax #39089962810 e-mail: [email protected]
Transcript of In vitro and in vivo TNFα synthesis modulation by methylguanidine, an uremic catabolyte
Autore et al. 1
MODULATION OF INDUCIBLE NITRIC OXIDE SYNTHASE EXPRESSION BY AN
UREMIC CATABOLYTE, METHYLGUANIDINE, IN LPS-STIMULATED J774
MACROPHAGES.
#Giuseppina Autore, Stefania Marzocco, Raffaella Sorrentino*, Anwar Baydoun** and
Aldo Pinto.
Department of Pharmaceutical Sciences, University of Salerno, Via Ponte Don Melillo,
84084 Fisciano (SA) Italy. *Department of Experimental Pharmacology, University
Federico II of Naples, Via D. Montesano, 49, 80131 Naples, Italy. **Department
Bioscieces, University of Hertfordshire, Hartfield, Herts, AL109AB, UK.
Running Title: Inhibition of iNOS expression by methylguanidine
Corresponding author: # Giuseppina Autore Ph.D. Department of Pharmaceutical Sciences
University of Salerno Via Ponte Don Melillo 84084 Fisciano (SA) Italy Tel/fax #39089962810 e-mail: [email protected]
Autore et al. 2
Abstract
1. We have investigated whether methylguanidine (MG), an uremic toxin, modulates the
expression of the inducible nitric oxide synthase (iNOS) and nitric oxide (NO) release in vitro
in LPS-induced J774 macrophages.
2. Addition of MG (0.01-1mM) or L-NAME (0.01-1mM), 30 min before LPS challenge,
inhibited significantly (37.77 % inhibition, P<0.001; n=12) but only at the highest
concentration tested LPS-induced nitrite production.
3.When J774 macrophages were pretreated with MG or L-NAME (0.01-1mM) 18h prior
stimulation with LPS, MG significantly (P<0.001) inhibited, in a concentration related
manner, LPS-stimulated nitrite production reducing nitrite levels by 40.26 % (n=12), 31.85 %
(n=9) and 26.68 % (n=6) for MG 1, 0.1 and 0.01 mM respectively.
4. MG, added to the culture medium of J774 macrophages 24 h after LPS challenge, also
reduced significantly and in a concentration-related manner nitrite production inhibiting NO
release by 50.0 % (P<0.001, n=32), 26.0 % (P<0.05, n=23) and 3.18 % for MG 1, 0.1 and
0.01 mM respectively. In this condition when the culture medium was supplemented with L-
arginine (10mM; L-ARG) the inhibitory effect of MG (1mM) on nitrite production was
reversed to 10.86 % significantly different (P<0.05) from MG-inhibitory effect observed in
normal medium.
5. Preincubation of cells with MG (1mM; 24 h) 30 min and 18 h prior to activation with LPS
resulted in inhibited iNOS protein expression by 44.16±5.7 % (P<0.01; n=3) and 30.47±3.9 %
(P<0.01; n=3). In the same conditions L-NAME (1mM) did not modify significantly iNOS
expression.
7. MG (1mM) or L-NAME (1mM) added to the culture medium 24 h after LPS challenge did
not modify iNOS protein expression.
8. Our results show that MG inhibited LPS-induced nitrite production in the murine
macrophages cell line J774. This inhibitory effect could be partly due to the antagonistic
Autore et al. 3
activity on iNOS protein that is reversed by L-Arg supplementation and partly related to the
inhibitory effect on iNOS expression .
9. Parallel experiments employing L-NAME (0.01-1 mM) have been carried out for
comparison in all the three different experimental settings. Similar results on LPS-induced
nitrite production but different results on iNOS expression have been obtained for L-NAME.
Key words: macrophages; bacterial lipopolysaccharide; nitric oxide, inducible nitric oxide
synthase, methylguanidine; L-arginine; L-NAME
Autore et al. 4
Introduction
It has been well established that an immunodeficient state often paradoxically coexists with
signs of activation of immune system in patients with chronic renal failure (CRF)
(Deschamps–Lastscha, 1993). While chronic activation of monocytes has been recognized as
a key factor responsible for the immunological disorders, the existing immunodeficiency may
reflect inhibition of nitric oxide (NO) synthesis normally induced in macrophages as in part
responsible of the host defense mechanism. More recently Le Meur and coworkers (1996)
suggested the possibility that CRF-associated-immunodeficiency could be linked to multiple
and complexes alterations of cytokine network and that target cells such as monocytes, T or B
lymphocytes, fibroblasts and endothelial cells may be involved. In this disease chronic
activation of monocyte functions has been recognized as a key factor responsible for
immunological disorders associated to CRF that is accentuated rather than corrected by
replacement dialysis therapy (Kawano et al., 1993; Kelly, 1994; Deenitchina et al., 1995). In
1975 Jones and Burnett hypothesized that high blood concentration of various endogenous
nitrogen compounds may be responsible of uraemic symptoms and immunodisfunctions. In
1990 Yokozawa and coworkers and more recently Mendes-Ribeiro (1996) demonstrated that
uraemia is often accompained by accumulation of L-arginine analogue NG-monomethyl-L-
arginine, methylguanidine (MG) and its precursor creatinine. These results have been recently
clarified by Aucella and coworkers (1998) who indicated that there are two key factors
responsible for the different cytokine release: one is the different absorption of inflammatory
mediators on the dialysis membrane surface and another one could be related to the different
sterilization method used for haemodialysis membranes that may be responsible for the higher
serum levels of monokines, including TNFα, in patients with CRF in haemodialysis (Kawano
et al., 1993). In this regard we have previously demonstrated that methylguanidine (MG), an
uremic toxin, inhibits NO production of both the constitutive and inducible isoforms of NO
synthase (Sorrentino et al., 1997), that in vivo pretreatments in rats with MG, simulating a

Autore et al. 5
pattern similar to the uremic conditions, significantly inhibited serum levels of TNF-α
measured in vivo 2h after LPS challenge and also in vitro MG (1mM) reduced significantly
TNF-α released by LPS-induced J774 (Autore et al., 1999)
In order to examine whether the uraemic toxin MG could modulate iNOS activity and/or
iNOS expression and whether these effects could be related to the time or concentration of
MG added to J774 medium, in this study we have examined in vitro the ability of MG to
influence iNOS expression and/or NO release in the murine macrophage cell line J774
stimulated with LPS. Parallel experiments employing L-NAME were also carried out for
comparison.
METHODS
Cell culture
Murine macrophage cell line, J774, was maintained in continous culture in DMEM
supplemented with NaHCO3 (42 mM), penicillin (100 units ml-1), streptomycin (100 units ml-
1), glutamine (2 mM) and foetal calf serum (10 %). Monolayers of cells were routinely
harvested by gentle scraping with a Teflon cell-scraper, diluted 1:10 in fresh medium and
cultured to confluency at 37 °C 95 % air and 5 % CO2 atmosphere.
Determination of the cytotoxic activity
J774 (3.5×10⁴) were plated on 96-well microtiter plates and allowed to adhere at 37°C in 5 %
CO2, 95 % air for 2 h. Thereafter the medium was replaced with 50 μl of fresh medium and
75 μl aliquot of 1:2 v v-1 serial dilution of MG (0.01-1 mM, dissolved in culture medium) was
added and the cells incubated for 24, 48, 72 h. The cells viability was assessed accordingly to
the method of Mosman, 1983. Briefly, 25μl of 3-(4,5-dimethyltiazol-2yl)-2,5-phenyl-2H-
tetrazolium bromide] (MTT, 5 mg ml-1) was added and the cells were incubated for additional
3 h. Following this time the cells were lysed and the dark blue crystals solubilized with 100 μl

Autore et al. 6
of a solution containing 50 % (v:v) N,N-dimethilformamide, 20 % (w:v), SDS (sodium
dodecyl sulphate) with an adjusted pH of 4.5 (Opipari et al., 1992). The optical density (OD)
of each well was measured with a microplate spectrophotometer equipped with a 620 nm
filter. The viability of J774 cell line in response to treatment with compounds was calculated
as: % dead cell = 100-(OD treated/ OD control) ×100.
Analysis of nitrite production
Prior to each experiment, harvested cells were plated at a seeding density of 2.5x10⁵ cells ml-1
.Cells were activated with LPS (6x10³units ml-1) alone or in combination with MG (0.01-1
mM) or L-NAME (0.01-1 mM), used as reference drug. In our studies MG and L-NAME
were also added to the culture medium of J774 30 min or 18 h before and simultaneously
with LPS.
The culture medium was replaced with fresh DMEM plus MG or L-NAME after each
different incubation time. NO release was determined 24 h after LPS-activated J774 by
measuring accumulated nitrite levels in the culture medium by the Griess reaction (Green et
al., 1982) and expressed as μM NO2- released in medium from 2.5x10⁵ cells ml-1 released in
medium 24 h after LPS challenge or as percentage inhibition calculated versus LPS alone.
Western Blot analysis for iNOS expression
Confluent monolayers of J774 in well culture plates (1.5x10⁶ cells/well) were preincubated
with MG (1mM) or L-NAME (1mM) for 30 min or 18 h respectively and then incubated with
either DMEM alone or DMEM containing LPS (6x10³ u ml-1) alone or in combination with
MG (1mM) or L-NAME (1mM). After 24 h incubation with LPS, cells were scraped off,
washed with ice-cold phosphate buffered saline (PBS) [(mM): 140 NaCl, 2.7 KCl, 8.1 Na2
HPO4, 1.5 K2HPO4 (pH 7.4)], and harvested by centrifugation (5000 g, 10 min at 4°C) and
resuspended in a buffer containing 20 mM TRIS HCl (pH 7.5), 1 mM Na+ orthovanadate, 1
mM phenylmethylsulfonyl fluoride, 10 μg ml-1 leupeptin, 10 mM NaF, 150 mM NaCl, 10 mg
ml-1 tripsin inhibitor and 1% Nonidet P 40. Protein concentration was estimated by the Bio-
Autore et al. 7
Rad protein assay using bovine serum albumin as standard. Equal amounts of protein (70 µg)
of cell lysates were dissolved in Laemmli’s sample buffer, boiled, and run on a SDS-PAGE
minigel (8 % polyacrylamide) and transferred for 40 minutes at 5 mA cm2 into 0.45 µm
hybond polyvinyldeme difluoride membrane. Membranes were blocked for 40 minutes in
PBS 1× containing 5 % (w v-1) non fat milk and subsequently probed overnight at 4 °C with
mouse monoclonal anti-iNOS antibody (1:10.000 dilution in PBS 1× containing 5 % w v-1
non fat milk and 0.1 % Tween-20). Blots were then incubated, after four washes in PBS 1×
containing 5% w/v non fat milk and 1% Tween 20, with horseradish peroxidase conjugated
goat anti-mouse IgG (1:5.000) for 1 h at room temperature. Immunoreactive bands were
visualized using ECL detection system according to the manufacturer’s instructions and
exposed to Kodak X-Omat film. The protein bands of iNOS on X ray film were quantified by
scanning densitometry (Imaging Densitometer GS-700 BIO-RAD U.S.A.) and the data are
expressed as a percentage of the values obtained from samples containing cells with LPS
alone.
Materials
Escherichia coli lipopolysaccharide (activity 6x10⁶ u mg-1) was obtained from Fluka (Italia).
Methylguanidine, NG-nitro-L-arginine methylester, [3-(4,5-dimethyl-thiazolyl-2yl) 2.5
diphenyl tetrazolium bromide], PBS, NaCl, KCl, Na2HPO4, K2HPO4 ,Tris HCl, Na+
orthovanadate, phenylmethylsulfonylfluoride, bovine serum albumin were obtained from
Sigma Chemical Co., Italy. Kodak X-Omat film, Hybond polyvinyldeme difluoride
membrane, ECL detection system, Hybond polyvinyldeme difluoride membrane were from
Amersham Life Science Ltd Buckinghamshire (U.K.). Lleupeptin, tripsin, Nonidet, Biorad
reactive, Laemmli’s sample buffer, polyacrylamide, non fat milk, Tween 20, horseradish
peroxidase conjugated goat anti-mouse
Mouse monoclonal antibody for inducible nitric oxide synthase was from Jackson (U.K.).
Autore et al. 8
Dulbecco’s Modified Eagle’s Medium, penicillin/streptomycin, HEPES, glutamine, Foetal
calf serum and horse serum were from Hy Clone ( Euroclone, U.K.).
Statistics
Data are expressed forn nitrite production as μM NO2 – released in medium from 2.5x10⁵ cells
ml-1. For Western Blot anlysis data are expressed as percentage of inhibition calculated
versus LPS alone. All values are means±s.e.mean of measurements in at least three different
experiments with five replicates in each. Prism software version 2.01, GraphPad Inc.was used
to perform statistical analysis. Comparisons were made using the one way ANOVA or using
unpaired Student’s t-test. The level of statistical difference was defined as P<0.05.

Autore et al. 9
RESULTS
Inhibition of nitrite production by MG or L-NAME preincubated with cells 30 min or 18 h
before LPS challenge
NO production in J774 cells incubated for 24 hours with LPS (6x10³ u ml-1; 24 h) was
significantly (P<0.0001) increased from a basal value of untreated cells of 0.05±0.03 µM to
15.98± 0.8 µM 24 h-1 (n=36).
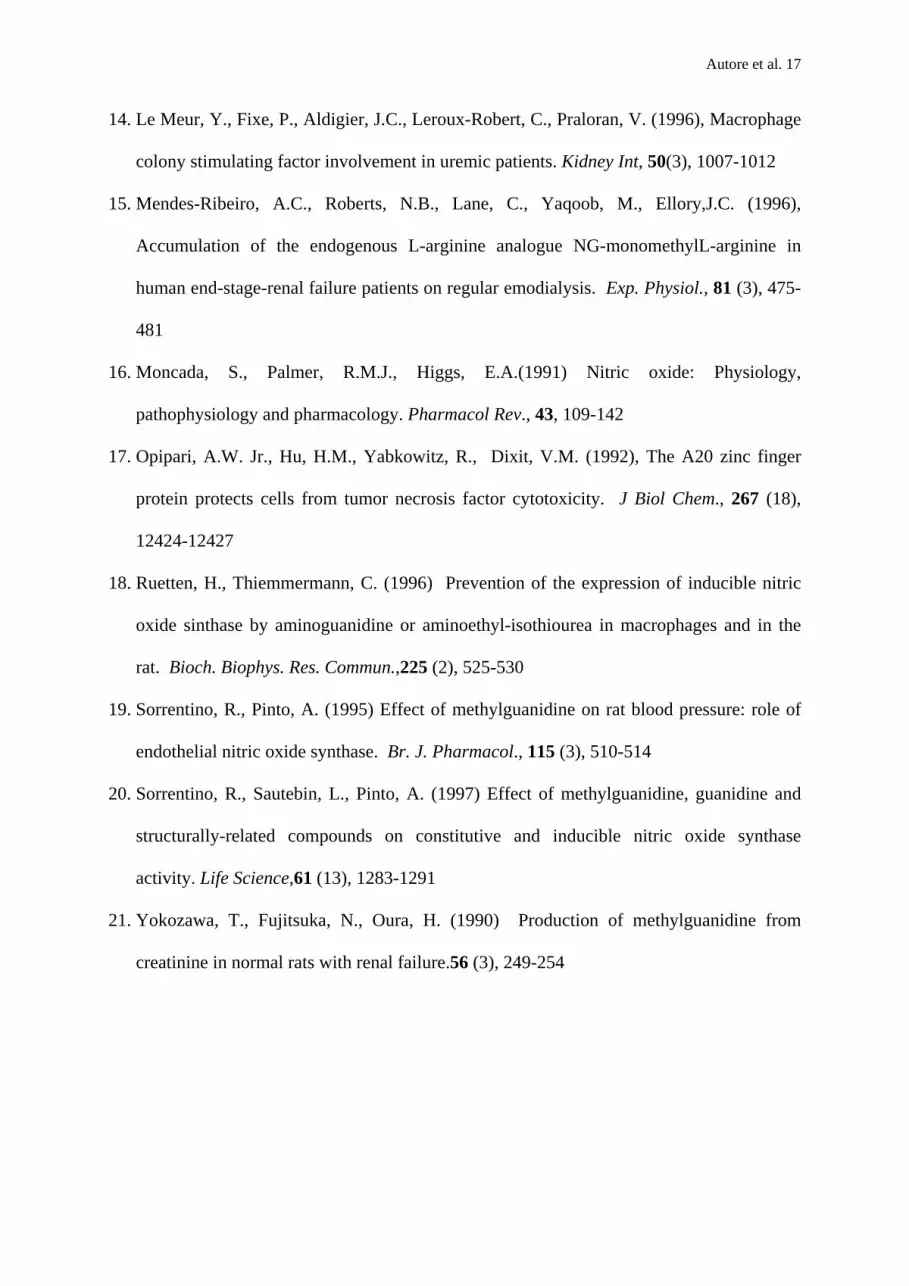
MG added to the culture medium of incubation in a range from 0.01-1 mM inhibited NO
formation. As shown in figure 1a LPS-stimulated J774 released 15.33±1.02 μmol l-1 NO2-
(n=18) in the medium. MG, added to the culture medium 30 min before and simultaneously to
LPS, only at the highest concentration (1 mM) significantly inhibited NO release (P<0.001;
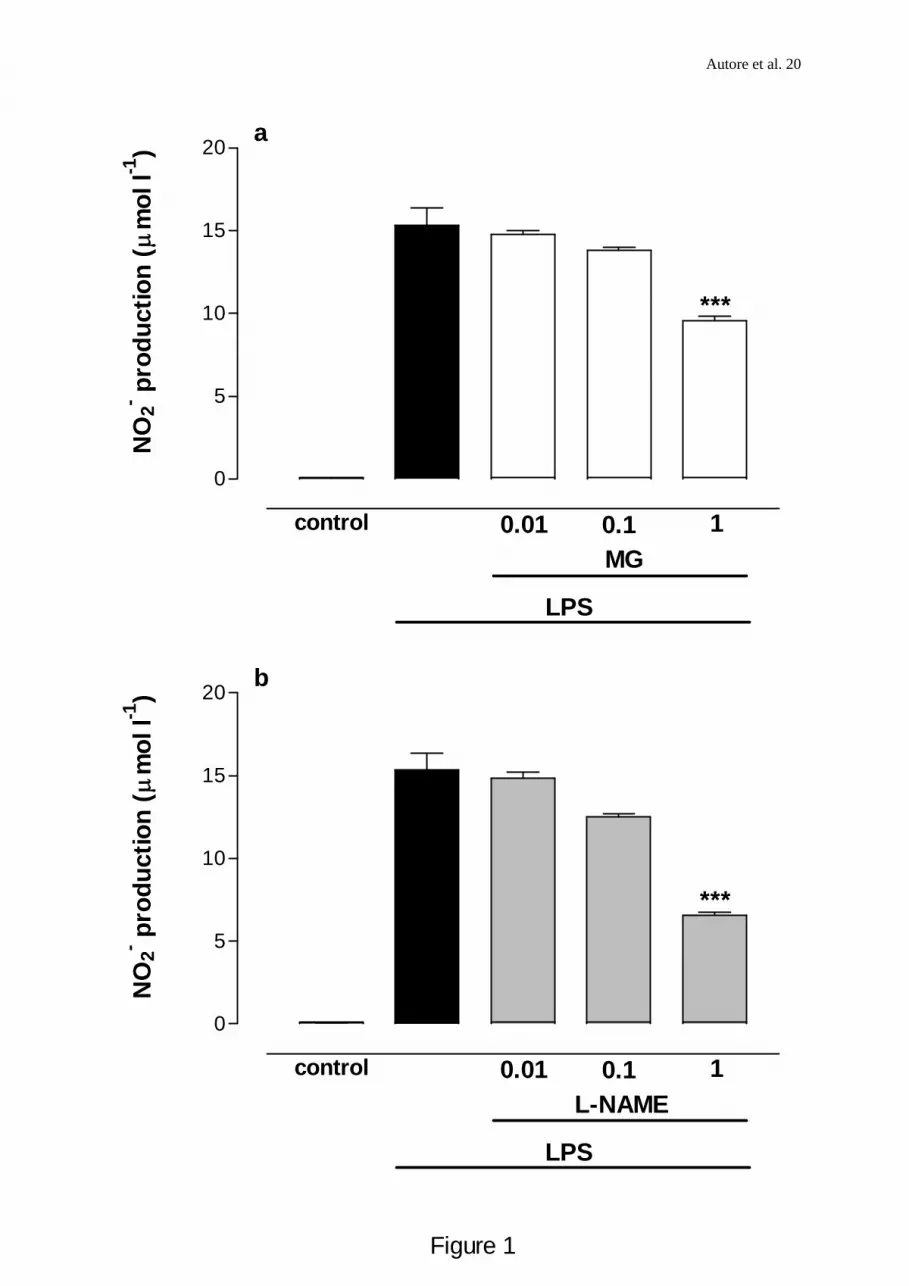
37.77 %; Fig.1a). When MG (0.01-1 mM ) was added to the culture medium 18 h before and
simultaneously to LPS reduced significantly (P<0.001) and in a concentration-dependent
manner LPS-induced NO production giving rise to 40.26 % inhibition , 1mM; 31.85 %
inhibition, 0.1 mM; 26.68 % inhibition, 0.01 mM respectively with P<0.001; Figure 2a).
Parallel experiments were carried out with a well known NO synthase inhibitor, L-NAME.
Results obtained with MG were comparable to those obtained with L-NAME (0.01-1 mmol l-
1) both when incubated for 30 min than for 18 h before LPS challenge ( Figure 1b and 2b).
Effect of MG and L-NAME on NO release from already expressed iNOS
In previous experiments MG was added before any expression of iNOS; in another set of
experiments J774 macrophages were stimulated with LPS (6x10³ u ml-1) and 24 h later the
medium was replaced with MG- or L-NAME-medicated medium (0.01-1 mmol l-1) and the
incubation was continued for further 24 h. After the first incubation NO released in the
medium was 14.69±0.61 μmol l-1, while NO production in the second incubation (24 h) was
5.34±0.37 (n=52). MG (0.01-1 mM), added 24 h after LPS challenge, markedly and
significantly (P<0.001) reduced NO release both at the highest concentration (50 % inhibition,

Autore et al. 10
P<0.001) than at lower concentration 0.1 mM ( 26 % inhibition , P<0.05, Figure 3a). Similar
results have been obtained with L-NAME (0.01-0.1 mM), added 24 h after LPS addition. In
this condition L-NAME decreased significantly and in a concentration related manner NO
release by LPS-stimulated J774 (Figure 3b.).
In this experimental condition L-ARG (10mM) supplementation significantly (P<0.05)
reversed both MG than L-NAME inhibitory effect on NO release. In fact MG (1mM) added to
the culture medium of LPS-stimulated-J774 24 h after LPS challenge gives rise to 50.0±9.0 %
(P<0.001) inhibition in normal medium This inhibitory effect is significantly reversed in
medium containing L-ARG (10mM) to 10.86±1.8 % inhibition) that is significantly different
(P<0.05) from MG inhibitory effect (Figure 3a). Similar results have been obtained for L-
NAME (1mM). L-NAME in normal medium gives rise to a significant inhibition (64.79±2.8
% with P<0.001 versus LPS) of NO release. This inhibitory effect is significantly reversed
with L-ARG (10 mM) to 24.11±5.3 % that is significantly (P<0.001) different from L-NAME
inhibitory effect (Figure 3b.)
Western Blot analysis for iNOS expression
To determine whether the inhibitory effect caused by MG on NO released by LPS-stimulated
J774 could also be due to the inhibition of iNOS expression, Western Blot analysis was
carried out on whole cell lysates using a monoclonal antibody for murine iNOS. In lysates
from LPS-stimulated (6x10³ u ml-1 24 h-1) but not from unstimulated cells the iNOS antibody
recognised as a single 130 kDa protein band which migrated at a molecular weght of 130
kDa (Figure 4a. and Figure 5a)
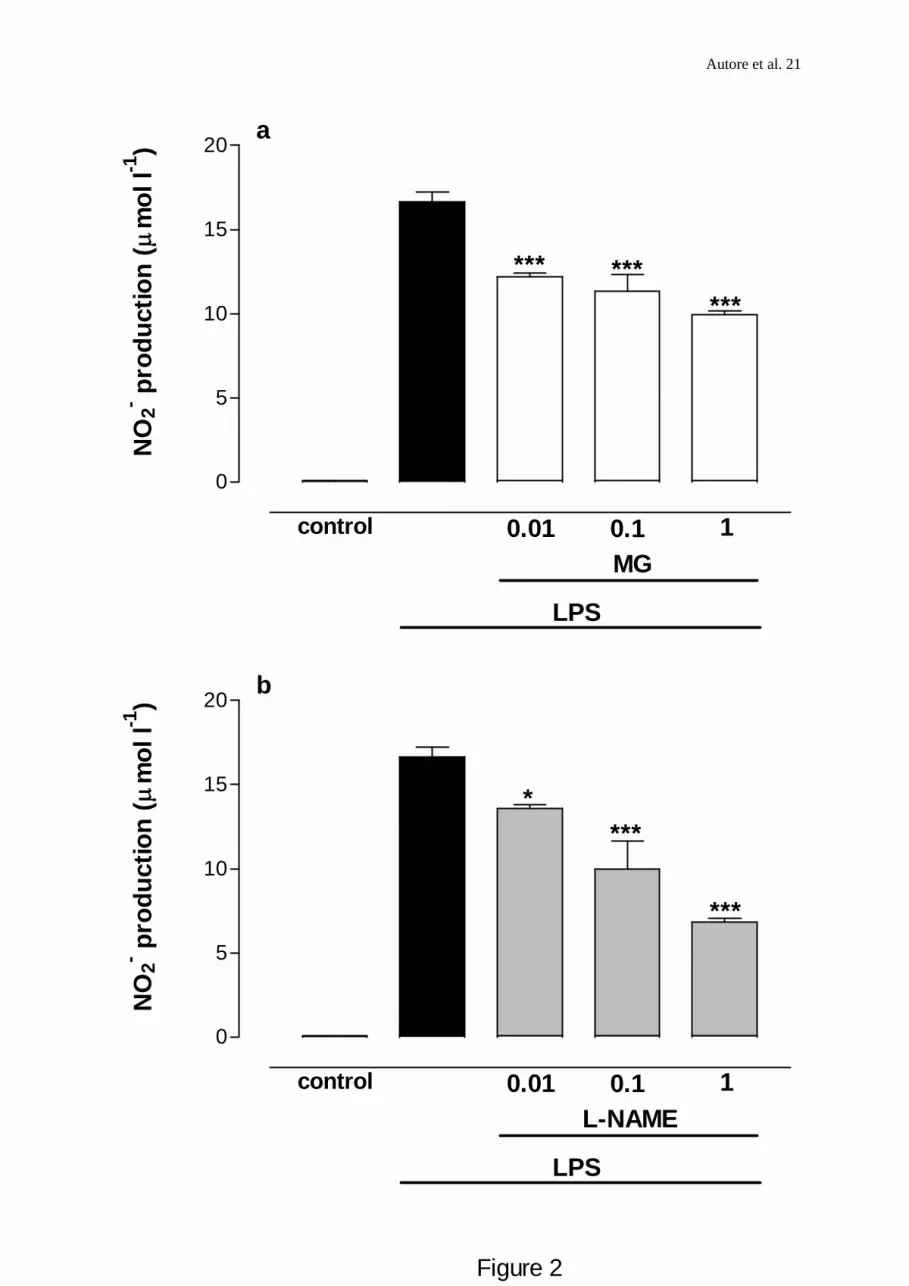
The level of iNOS protein was markedly attenuated in lysates from J774 cells preincubated
with MG (1mM) or L-NAME (1mM) 30 min before and then activated with LPS plus MG
(1mM) or L-NAME (1mM). MG, but not L-NAME, added to the culture medium only 30

Autore et al. 11
min before LPS challenge, significantly reduced iNOS expression ( 44.16± 7.9 % inhibition ;
n=3; P<0.05,Figure 4b.). A representative blot from these experiments is shown in Figure 4a.
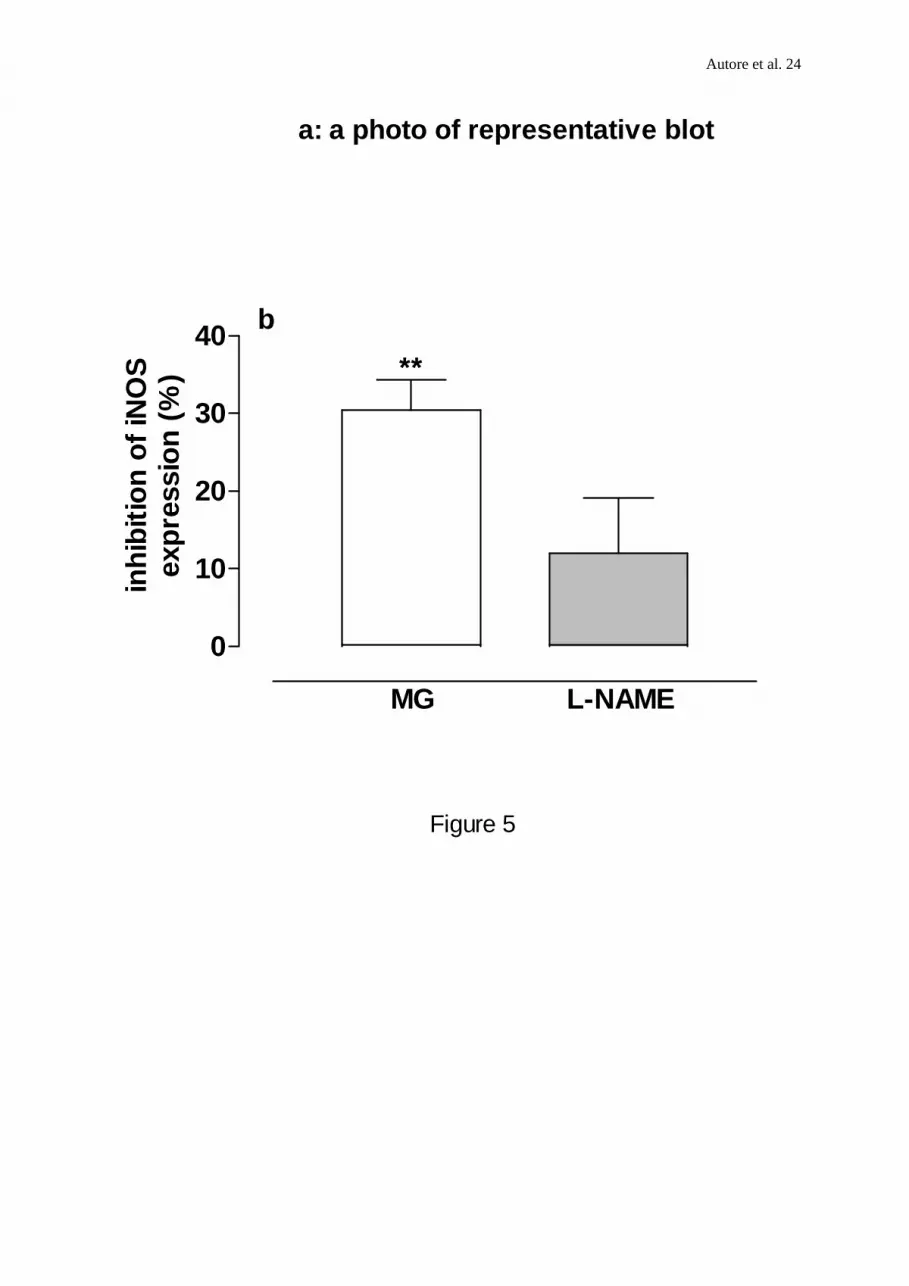
Similar results have been obtained when MG (1mM) or L-NAME (1mM) was preincubated
with J774 18 h before LPS challenge. The level of iNOS protein was markedly and
significantly attenuated also in lysates from J774 cells preincubated with MG (1mM) or L-
NAME (1mM) 18 h before and then activated with LPS plus MG (1mM) or L-NAME
(1mM). In this experimental setting MG, but not L-NAME, significantly reduced iNOS
expression (30.47±3.9 % inhibition; n=3; P<0.01, Figure 5b). A representative blot from
these experiments is shown in Figure 5a.
The effect of MG on iNOS expression has also been observed incubating LPS-induced J774
with MG or L-NAME (1mM) added 24 hours after LPS challenge. In this experimental
setting both MG and L-NAME did not influence significantly iNOS.
In all the different experimental settings MG (0.01-1 mM) or L-NAME (0.01-1 mM) did not
affect significantly mitochondrial reduction of MTT to formazan (data not shown) both when
incubated for 30 min, 18 h before LPS challenge and or 24 after LPS suggesting that these
compounds at the concentration tested are not cytotoxic to J774 cells even at the highest
concentration used (1 mM).
Autore et al. 12
DISCUSSION
The present study demonstrates that preincubation of J774 macrophages with MG
significantly affected LPS-induced nitrite production. Its inhibitory effect is both time- and
concentration-dependent.. The maximal response was obtained following 18 h pretreatment of
cells with 1 mM MG prior activation with LPS. Although addition of MG only for 30 min
before LPS challenge also inhibited accumulated nitrite levels, the inhibition was relatively
less compared to responses produced after 18 h preincubation because MG, preincubated for
30 min before LPS activation, was effective only at the highest concentration used (1 mM).
On the other hand its inhibitory effect was effective still at 0.01-0.1 mM, when MG was
added to J774 medium 18 h before LPS challenge, this effect is concentration dependent and
appears to involve also regulation of iNOS expression at the molecular levels resulting in
inhibited enzyme protein expression and thus NO production. These findings suggest that
MG could act with a dual mechanism of action on NO release. One mechanism may be
directly linked to the inhibition iNOS expression, another one may be related to capability of
MG to act as iNOS antagonist.
Induction of iNOS is a time-dependent process requiring de novo protein synthesis. Enzyme
expression is detected after about 6 h from LPS activation of cells, reaching a maximum at 12
h and is maintained over aperiod of 24-48 h (Assreuy et al., 1993). Thus the fact that the
addition of MG just 30 min before LPS challenge significantly inhibited iNOS expression and
NO release strongly suggest that all these effects may be linked to the inhibitory effect at
certain upstream events probably associated with induction of the enzyme such as TNF-α
release. In fact, Western blot analysis of lysates obtained from cells activated in the presence
of LPS alone or in combination with MG showed that LPS-induced iNOS expression was
significantly inhibited in the presence of MG, probably indicating decreased iNOS gene
transcription and/or mRNA stability.

Autore et al. 13
A growing body of evidence suggests that NO may be involved in the inflammatory
processes, such as host defence mechanisms, induced by TNF-α (Moncada et al., 1991). NO
is generated in macrophages by an inducible, calcium independent isoform of iNOS that is
expressed to a significant level following stimulation with phlogogenic agents, as LPS
(Moncada et al., 1991) and/or cytokines, including TNF-α ( Drapier et al.,1988; Chester et al.,
1998).
TNF-α is an extremely potent peptide cytokine which serves as an endogenous mediator of
inflammation and as an important factor in host defence functions (Berczi et al., 1996). It is
not generally thought to be produced costitutively by normal cells, but rather to be induced by
invasive stimuli in the setting of infectious diseases. In this role, macrophages and monocytes
are thought to be the cells which contribute most to the local and systemic TNF-α release in
response to bacterial, viral and parasitic organisms and products. The consequences of
endogenous TNF-α can be either beneficial or life threatening depending on the amount, time
course and distribution of released cytokine.
In this study we have simulated in vitro a pattern similar to the uremic conditions by
incubating J774-macrophages for 30 min or 18 h in medium containing high concentrations of
MG (1mM) and then we have stimulated J774 macrophages with LPS in presence of MG or
L-NAME. In the experimental setting in which MG was added to J774 medium 18 h before
LPS challenge, we have previously demonstrated (Autore et al., 1999) that, in this condition,
MG inhibits in vitro TNF-α release, measured 3 h after LPS activation. In this paper we also
demonstrated that MG is able to inhibit not only NO release but also iNOS expression. In the
same experimental conditions L-NAME showed almost the same inhibitory effect, compared
to MG effect, on TNF-α and NO release while did not show any significant inhibitory effect
on iNOS expression. Similar results have been obtained by Deakin (1995) and Ruetten &
Thiemmermann (1996) with aminoguanidine (AMG). In their papers they have demostrated
Autore et al. 14
that the immunological stimulated TNF-α release is markedly attenuated by nitric oxide
inhibitors (Deakin et al., 1995) and by AMG (Ruetten & Thiemmermann, 1996), an
endogenous compound which is structurally-tightly-linked to MG.
Previously we have demonstrated (Sorrentino et al., 1997) the ability of MG to link and to
inhibit a semicrude preparation of both constitutive (neuronal and endothelial) and inducible
isoforms (macrophagic) of NOS but the relevance of the present paper regarded the ability of
MG to regulate not only iNOS activity but although iNOS expression and on the basis of our
previous results obtained both in vitro in LPS-treated-J774 macrophages than in vivo in LPS-
treated rats we could hypothesize that the effects observed could be due or tightly linked to
the inhibition of TNF-α release (Autore et al.,1999).
The ability of MG to inhibit iNOS expression and/or NO production may have significant
implications in the pathogenesis of CRF where it has been reported that these patients often
present an immunodeficient state that paradoxically coexists with signs of activation of
immune system cells. Moreover, this is accentuated rather than corrected by replacement
dialysis therapy (Deschamps-Latscha, 1993; Kelly, 1994; Deenitchina et al., 1995). It is
obvious that MG concentration in CRF patients could be quite different from the
concentration used in our experimental model. Indeed, plasma concentration of MG in CRF
patients have been calculated at around 27 µM (Orita et al., 1981). It is worth noting, however
that MG can accumulate intracellularly, reaching concentrations which are 7 fold higher than
those found in serum (Orita et al., 1981).
In summary our results indicate that high concentration of MG could interfere not only in
inhibiting iNOS activity but also in inhibiting iNOS expression. The ability of MG to inhibit
NO release and iNOS expression may have significant implications in the pathogenesis of
CRF where it has been reported that patients often present an immunodeficient state
paradoxically coexisting with signs of activation of immune system cells. In conclusion our
results strongly demonstrate that MG is a potent modulator of NO release and that its

Autore et al. 15
inhibitory effect is not only due to a competitive antagonism of iNOS but also to an inhibitory
activity on iNOS expression. These effects together with the ability of MG to inhibit TNFα
release, as demonstrated in our previous study (Autore et al., 1999), could, at least in part,
account for the immunodisfunction associated to CRF
The relevance of these results is that in CRF patients the presence of high serum
concentration of MG could interfere with NOS inhibitory activity (Sorrentino et al., 1997) and
/or in cytokine network not only trough reduction of TNFα release (Autore et al., 1999) but
also in inhibiting iNOS expression. This study points out a possible pathophysiological role
for iNOS activity and expression in immunodisfuntions of haemodialitic patients where
elevation of iNOS expression could be considered a physiological response to invasive stimuli
that is drastically reduced when high concentrations of the uremic catabolyte, MG, are present
in the blood.
REFERENCES
1. Assreuy, J., Cunha, F.J., Liew, F.Y. & Moncada, S. (1993) Feed back inhibition of nitric
oxide synthse activity by nitric oxide. Br. J. Pharmacol., 108, 833-837
2. Aucella, F., Vigilante, M., Grandone, E., Colaizzo, D., Margaglione, M., Modoni, S.,
Orlandini, G., Stallone, C. (1998) Reduction of mononuclear cytokine production in
hemodialysis patients treated with steam-sterilized low-flux polysulphone membranes. Int.
J.Artif.Organs, 21 (4), 210-215
3. Autore, G., Marzocco, S., Sorrentino, R., Mirone, V., Baydoun, A. & Pinto, A. (1999) In
vitro and in vivo TNFα synthesis by methylguanidine, an uremic catabolyte. Life Science,
in press
4. Berczi, I, Chalmers, I.M., Nagy, E., Warrington, R.J. (1996), The immune effects of
neuropeptides. Bailliers Clin Rheumatol.,10 (2), 227-257
Autore et al. 16
5. Chester, A.H., Borland, J.A., Buttery, L.D., Mitchell, J.A., Cunningham, D.A., Hafizi, S.,
Hoare, G.S., Springall, D.R., Polak, J.M., Yacoub, M.H. (1998) Induction of nitric oxide
synthase in human vascular smooth muscle: interactions between proinflammatory
cytokines. Cardiovascul. Res.,38 (3), 814-821
6. Deakin, A.M., Payne, A.N., Whittle, B.J. & Moncada, S. (1995), The modulation of IL-6
and TNF alpha release by nitric oxide following stimulation of J774 cells with LPS and
IFN-gamma. Cytokine, 7 (5), 408-416
7. Deenitchina, S.S., Ando, T., Okuda, S., Kinukawa, N., Hirakata, H., Nagoshima, A.,
Fujishima, M. (1995) Cellular immunity in hemodialysis patients: a quantitative analysis
of immune cell subsets by flow cytometry. Am. J. Nephrol., 15 (1), 57-65
8. Deschamps-Lastscha, B. (1993) Curr. Opin. Nephrol. Hypertens.,2 (6), 883-891
9. Drapier, J.C., Wietzerbin, J. , Hibbs, J.B. Jr (1988), Interferon.γ and tumor necrosis factor
induce the L-arginine-dependent cytotoxic effector mechanism in murine macrophages.
Eur. J. Immunol. 18 (10), 1587-1592
10. Green, L.C., Wagner, D.A., Glogowski, J.J., Skipper, P.L., Wishnok, J.S 6 Tannenbaum,
S.R. (1982) Analysis of nitrate, nitrite and 15N-nitrite in biological fluids.
Anal.Biochem.,126, 131-138
11. Jones, J.D. & Burnett, P.C. (1975) Creatinine metabolism and toxicity. Kidney Int.
Suppl.,3, 294-298
12. Kawano, Y., Takaue, Y., Motoyoshi, K., Minakuchi, J., Kawashima, S., Saito, S., Hirao,
A., Sato, J., Shimizu, T, Kuroda, Y.(1993) Measurements of serum levels of macrophage
colony stimulating factor (m-CSF) in patients with uraemia. Exp. Hematol., 21(2), 220-
223
13. Kelly, C.J. (1994) T cell function in chronic renal failure and dialysis. Blood Purif.,12 (1),
36-41
Autore et al. 17
14. Le Meur, Y., Fixe, P., Aldigier, J.C., Leroux-Robert, C., Praloran, V. (1996), Macrophage
colony stimulating factor involvement in uremic patients. Kidney Int, 50(3), 1007-1012
15. Mendes-Ribeiro, A.C., Roberts, N.B., Lane, C., Yaqoob, M., Ellory,J.C. (1996),
Accumulation of the endogenous L-arginine analogue NG-monomethylL-arginine in
human end-stage-renal failure patients on regular emodialysis. Exp. Physiol., 81 (3), 475-
481
16. Moncada, S., Palmer, R.M.J., Higgs, E.A.(1991) Nitric oxide: Physiology,
pathophysiology and pharmacology. Pharmacol Rev., 43, 109-142
17. Opipari, A.W. Jr., Hu, H.M., Yabkowitz, R., Dixit, V.M. (1992), The A20 zinc finger
protein protects cells from tumor necrosis factor cytotoxicity. J Biol Chem., 267 (18),
12424-12427
18. Ruetten, H., Thiemmermann, C. (1996) Prevention of the expression of inducible nitric
oxide sinthase by aminoguanidine or aminoethyl-isothiourea in macrophages and in the
rat. Bioch. Biophys. Res. Commun.,225 (2), 525-530
19. Sorrentino, R., Pinto, A. (1995) Effect of methylguanidine on rat blood pressure: role of
endothelial nitric oxide synthase. Br. J. Pharmacol., 115 (3), 510-514
20. Sorrentino, R., Sautebin, L., Pinto, A. (1997) Effect of methylguanidine, guanidine and
structurally-related compounds on constitutive and inducible nitric oxide synthase
activity. Life Science,61 (13), 1283-1291
21. Yokozawa, T., Fujitsuka, N., Oura, H. (1990) Production of methylguanidine from
creatinine in normal rats with renal failure.56 (3), 249-254

Autore et al. 18
Fig 1 (a, b). Concentration-dependent effect of LPS-induced nitrite production in J774
macrophages by MG (1a) and L-NAME (1b). Cells were incubated with LPS (6x10³ u ml-1)
alone (control) or in combination with MG (0.01-1mM) or L-NAME (0.01-1 mM) added
simoultaneously and 30 min before LPS challenge. Accumulated nitrite in the culture
medium was determined 24 h after LPS addition by the Griess reaction. Results are expressed
as μmol l –1 NO2- (basal LPS levels were 15.33±1.02 μM NO2
- 24 h -1) and values are the
mean±s.e.m. of at least 3-6 independent experiments with 5 replicates in each. *** Denotes
values significantly different from control at P<0.001.
Fig 2 (a,b). Concentration-dependent inhibition of LPS-induced nitrite production in J774
macrophages by MG and L-NAME. Cells were incubated with LPS (6x10³ u ml-1) alone
(control) or in combination with MG (0.01-1mM) or L-NAME (0.01-1 mM) added
simoultaneously and 18 h before LPS challenge. Accumulated nitrite in the culture medium
was determined 24 h after LPS addition by the Griess reaction. Results are expressed as μmol
l –1 NO2- (basal LPS levels were 16.64±0.58 μM NO2
- 24 h -1) and values are the mean±s.e.m.
of at least 3-6 independent experiments with 5 replicates in each. *** Denotes values
significantly different from control at P<0.001, * P<0.05.
Fig 3 (a,b). Concentration-dependent inhibition of LPS-induced nitrite production in J774
macrophages by MG or L-NAME, added 24 h after LPS challenge, and reversal inhibition of
LPS-induced nitrite production in J774 macrophages by MG or L-NAME with L-ARG
supplementation (10mM). Cells were incubated with LPS (6x10³ u ml-1) alone (control) or in
combination with MG (0.01-1 mM) or L-NAME (0.01-1 mM) with or without L-ARG
(10mM) added 24 h after LPS challenge. The effect of MG or L-NAME on accumulated
nitrite in the culture medium was determined 48 h after LPS addition by the Griess reaction.
Results are expressed as μmol l –1 NO2- and values are the mean±s.e.m. of at least 3-6

Autore et al. 19
independent experiments with 3 replicates in each *** Denotes values significantly different
from control at P<0.001, * P<0.05
FIGURE 4. (a,b) Western blot analysis of inducible NO synthase in J774 cells. Lysates (70
µg protein) from untreated cells (c) and from cells preincubated with MG or L-NAME (1mM)
for 30 min (a,b) before LPS and reincubated with LPS (6x10³ u ml-1; 24 h) alone or in
combination with either MG (1mM) or L-NAME (1mM) were separated by SDS-PAGE,
transferred to a nitrocellulose and blotted with a mouse monoclonal anti-iNOS antibody. The
blot is representative of 3 independent experiments. (a) A representative blot from these
experiments (b) Relative intensity of iNOS protein bands quantitated by scanning
densitometry. Data are expressed as percentage of inhibition calculated versus LPS alone.
FIGURE 5. (a,b) Western blot analysis of inducible NO synthase in J774 cells. Lysates (70
µg protein) from untreated cells (c) and from cells preincubated with MG or L-NAME (1mM)
for 18 h before LPS and reincubated with LPS (6x10³ u ml-1; 24 h-1 )alone or in combination
with either MG (1mM) or L-NAME (1mM) were separated by SDS-PAGE, transferred to a
nitrocellulose and blotted with a mouse monoclonal anti-iNOS antibody. These blots are
representative of 3 independent experiments. (a) A representative blot from these experiments
(b) Relative intensity of iNOS protein bands quantitated by scanning densitometry. Data are
expressed as percentage of inhibition calculated versus LPS alone.
Autore et al. 20
0
5
10
15
20
LPS
control
MG0.01 0.1 1
***
aN
O2- p
rod
uct
ion
(μ m
ol l
-1)
0
5
10
15
20
LPS
control
L-NAME0.01 0.1 1
***
b
NO
2- pro
du
ctio
n (μ m
ol l
-1)
Figure 1
Autore et al. 21
0
5
10
15
20
LPS
control
MG0.01 0.1 1
***
a
******
NO
2- pro
du
ctio
n (μ m
ol l
-1)
0
5
10
15
20
LPS
control
L-NAME0.01 0.1 1
***
b
****
NO
2- pro
du
ctio
n (μ m
ol l
-1)
Figure 2

Autore et al. 22
0
1
2
3
4
5
6
LPS
control
MG
0.01 0.1 1
***
a
1L-ARG
*
#N
O2- p
rod
uct
ion
(μ m
ol l
-1)
0
1
2
3
4
5
6
LPS
control
MG
0.01 0.1 1
***
b
1L-ARG
* ###*
NO
2- pro
du
ctio
n (μ m
ol l
-1)
Figure 3
Autore et al. 23
0
25
50
MG L-NAME
***b
inh
ibiti
on
of i
NO
Sex
pre
ssio
n (
%)
a: a photo of representative blot
Figure 4
Autore et al. 24
0
10
20
30
40
MG L-NAME
**
b
inh
ibit
ion
of
iNO
Sex
pre
ssio
n (
%)
a: a photo of representative blot
Figure 5