IN THE CIRCUIT COURT OF COOK COUNTY, ILLINOIS ...
493
IN THE CIRCUIT COURT OF COOK COUNTY, ILLINOIS COUNTY DEPARTMENT, CHANCERY DIVISION LEILA MENDEZ and ALONSO ZARAGOZA, Plaintiffs, v. CITY OF CHICAGO, et al., Defendants. ) ) ) Case No. 16 CH 15489 ) ) Judge Sanjay T. Tailor ) ) ) ) ) PLAINTIFFS’ MOTION FOR SUMMARY JUDGMENT Jeffrey Schwab (#6290710) Liberty Justice Center Cook County No. 49098 190 S. LaSalle Street, Suite 1500 Chicago, Illinois 60603 (312) 263-7668 (312) 263-7702 (fax) [email protected] Jacob Huebert (#6305339) Timothy Sandefur (#6325089/pro hac vice #61192) Christina Sandefur (#6325088/ pro hac vice #61186) Goldwater Institute 500 E. Coronado Road Phoenix, Arizona 85004 (602) 462-5000 (602) 256-7045 (fax) [email protected] Attorneys for Plaintiffs FILED 6/21/2019 6:51 PM DOROTHY BROWN CIRCUIT CLERK COOK COUNTY, IL 2016CH15489 5515202 Return Date: No return date scheduled Hearing Date: No hearing scheduled Courtroom Number: No hearing scheduled Location: No hearing scheduled FILED DATE: 6/21/2019 6:51 PM 2016CH15489
-
Upload
khangminh22 -
Category
Documents
-
view
1 -
download
0
Transcript of IN THE CIRCUIT COURT OF COOK COUNTY, ILLINOIS ...
IN THE CIRCUIT COURT OF COOK COUNTY, ILLINOIS
COUNTY DEPARTMENT, CHANCERY DIVISION
LEILA MENDEZ and ALONSO ZARAGOZA,
Plaintiffs,
v.
CITY OF CHICAGO, et al.,
Defendants.
)
)
) Case No. 16 CH 15489
)
) Judge Sanjay T. Tailor
)
)
)
)
)
PLAINTIFFS’ MOTION FOR SUMMARY JUDGMENT
Jeffrey Schwab (#6290710)
Liberty Justice Center
Cook County No. 49098
190 S. LaSalle Street, Suite 1500
Chicago, Illinois 60603
(312) 263-7668
(312) 263-7702 (fax)
Jacob Huebert (#6305339)
Timothy Sandefur
(#6325089/pro hac vice #61192)
Christina Sandefur
(#6325088/ pro hac vice #61186)
Goldwater Institute
500 E. Coronado Road
Phoenix, Arizona 85004
(602) 462-5000
(602) 256-7045 (fax)
Attorneys for Plaintiffs
FILED6/21/2019 6:51 PMDOROTHY BROWNCIRCUIT CLERKCOOK COUNTY, IL2016CH15489
5515202
Return Date: No return date scheduledHearing Date: No hearing scheduledCourtroom Number: No hearing scheduledLocation: No hearing scheduled
FILE
D D
ATE:
6/2
1/20
19 6
:51
PM
2016
CH
1548
9
i
TABLE OF CONTENTS
TABLE OF CONTENTS ................................................................................................................ i
TABLE OF AUTHORITIES ........................................................................................................ iii
STATEMENT OF FACTS ………………………..……………………….……….....………… 1
Chicago’s home-sharing taxes and fees …………………………...……….……….....………… 1
Procedural history and Plaintiffs’ Uniformity Clause claim …………………………..………… 3
The City’s purported justifications for the surcharges ……….………………………..………… 4
The City’s purported “real and substantial” differences for tax classifications ……….………… 6
The City’s purported “real and substantial” differences for fee classifications ……….………… 7
The City’s purported justifications for the differing fees ……………………….…….………… 7
The City’s purported justifications for the differing fees ……………………….…….………… 7
STANDARD .................................................................................................................................. 8
ARGUMENT …………………....…………………...……………………………….……..…... 8
I. The home-sharing surcharges are not justified by real and substantial differences between
home-sharing and other “hotel accommodations.” …………………………...……...….. 9
II. The home-sharing surcharges violate the Uniformity Clause because they are not
reasonably related to their stated purpose or public policy. …….…………...……...….. 11
A. The surcharges’ classifications are not reasonably related to the surcharges’ purpose
because they do not apply to other types of hotel accommodations that keep property
out of the long-term housing market. ……………………………………….......….. 12
B. The studies the City has cited do not establish that home-sharing leads to increased
homelessness. …………………….………………...……………………….......….. 13
C. The economic literature shows that high rents and affordable housing shortages are
overwhelmingly caused by factors other than home-sharing. ………..…….......….. 16
D. There is no basis for concluding that increased rents in neighborhoods with home-
sharing will lead to increased homelessness. ………………………....…….......….. 18
FILE
D D
ATE:
6/2
1/20
19 6
:51
PM
2016
CH
1548
9
ii
III. The varying fees for different hotel accommodations violate the Uniformity Clause
because there is no real and substantial difference between hotels, bed-and-breakfasts,
vacation rentals, and shared housing units. …….………………….………...……...….. 20
IV. The home-sharing fees violate the Uniformity Clause because their purpose does not bear
any reasonable relationship to the object of the City’s home-sharing ordinance. ….….. 21
CONCLUSION …………………………………..………………………………….……..…... 22
CERTIFICATE OF SERVICE ……………..……………………………………….……..…... 24
FILE
D D
ATE:
6/2
1/20
19 6
:51
PM
2016
CH
1548
9
iii
TABLE OF AUTHORITIES
Cases
Milwaukee Safeguard Ins. Co. v. Selcke, 179 Ill. 2d 94 (1997) .................................................... 12
Nat’l Pride of Chi., Inc. v. City of Chi., 206 Ill. App. 3d 1090 (1st Dist. 1990) ........................... 11
Primeco Pers. Commc’ns, L.P. v. Ill. Commerce Comm’n, 196 Ill. 2d 70 (2001) ......................... 8
Satellink of Chi., Inc. v. City of Chi., 168 Ill. App. 3d 689 (1st Dist. 1988) ................................... 9
U.S.G. Italian Marketcaffe, L.L.C. v. City of Chi., 332 Ill.App.3d 1008 (1st Dist. 2002) ........ 9, 12
Statutes
735 ILCS 5/2-1005(c) ..................................................................................................................... 8
Other Authorities
Patricia Fron, et al., Aldermanic Prerogative is the Grease That Oils the Machine, Chi. Trib.,
Feb. 7, 2019 ............................................................................................................................... 18
Tanvi Misra, How Chicago’s Aldermen Help Keep It Segregated, CityLab, Aug. 2, 2018 ......... 18
Regulations
Chi. Muni. Code § 3-24-020(A)(4) ................................................................................................. 2
Chi. Muni. Code § 3-24-020(4) ...................................................................................................... 9
Chi. Muni. Code § 3-24-030 ........................................................................................................... 2
Chi. Muni. Code § 3-24-030(B) ...................................................................................................... 2
Chi. Muni. Code § 3-24-030(C) .................................................................................................. 2, 5
Chi. Muni. Code § 4-5-010 ............................................................................................................. 3
Chi. Muni. Code § 4-5-010(2) ........................................................................................................ 3
Chi. Muni. Code § 4-5-010(3) ........................................................................................................ 3
Chi. Muni. Code § 4-5-010(36) ................................................................................................ 3, 22
Chi. Muni. Code § 4-5-010(38) ...................................................................................................... 3
Chi. Muni. Code § 4-6-290 ............................................................................................................. 2
FILE
D D
ATE:
6/2
1/20
19 6
:51
PM
2016
CH
1548
9
iv
Chi. Muni. Code § 4-6-300 ............................................................................................................. 2
Chi. Muni. Code § 4-6-300(h)(8) .................................................................................................. 10
Chi. Muni. Code § 4-13-230(a)................................................................................................. 3, 22
Chi. Muni. Code § 4-14-020 ......................................................................................................... 11
Chi. Muni. Code § 4-14-060(d) .................................................................................................... 10
Chi. Muni. Code § 4-16-200 ........................................................................................................... 3
Chi. Mun. Code § 4-14-010 ............................................................................................................ 2
Chi. Muni. Code § 17-3-0207 ....................................................................................................... 10
Chi. Muni. Code § 17-4-0207 ....................................................................................................... 10
Constitutional Provisions
Chi. Const., art. IX, § 2 ............................................................................................................... 3, 8
FILE
D D
ATE:
6/2
1/20
19 6
:51
PM
2016
CH
1548
9

1
The City of Chicago imposes a 4.5% tax on rentals of “hotel accommodations,” a term
that includes, among other things, hotels, bed-and-breakfasts, and home-sharing through online
platforms such as Airbnb. The City has also enacted additional surcharges of 4% and 2% that
apply only to home-sharing. The City attempts to justify this discrimination against home-
sharing primarily by arguing that home-sharing tends to reduce the supply of long-term housing
and therefore tends to increase rents and, in turn, homelessness.
That justification fails. In fact, many properties used for home-sharing do not remove
property from the long-term housing market, while virtually all hotel accommodations occupy
property that could otherwise be used for long-term housing—so it is arbitrary and unreasonable
to impose surcharges intended to address problems related to affordable housing and
homelessness exclusively on home-sharing. Further, the City has provided no reason to believe
that home-sharing significantly increases long-term rents or increases homelessness at all.
The City also arbitrarily imposes varying fees on different forms of accommodations,
including home-sharing—fees that are not based on real and substantial differences between the
accommodations and are not reasonably related to their supposed purpose or to public policy.
The Court should therefore grant summary judgment in favor of Plaintiffs on their claim
that the surcharges and fees violate the Uniformity Clause of the Illinois Constitution.
STATEMENT OF FACTS
Chicago’s home-sharing taxes and fees
The Chicago Municipal Code regulates two categories of home-sharing arrangements:
“vacation rentals” and “shared housing units.” The Code’s definitions of these terms are nearly
identical, except that they are mutually exclusive. See Ex. A., Defs.’ Resp. To Plfs.’ First Set of
Interrogs. (“Defs.’ 1st Int. Resp.”) No. 20. In other words, the Code defines a “vacation rental”
FILE
D D
ATE:
6/2
1/20
19 6
:51
PM
2016
CH
1548
9

2
as “a dwelling unit that contains 6 or fewer sleeping rooms that are available for rent or for hire
for transient occupancy by guests,” but excludes from that definition “(1) single-room occupancy
buildings or bed-and-breakfast establishments … ; (2) hotels … ; (3) a dwelling unit for which a
tenant has a month-to-month rental agreement and the rental payments are paid on a monthly
basis; (4) corporate housing; (5) guest suites; or (6) shared housing units registered pursuant to
Chapter 4-14 of this Code.” Chi. Muni. Code § 4-6-300. On the other hand, the Code defines a
“shared housing unit” as “a dwelling unit containing 6 or fewer sleeping rooms that is rented, or
any portion therein is rented, for transient occupancy by guests,” and excludes from that
definition “(1) single-room occupancy buildings; (2) hotels; (3) corporate housing; (4) bed-and-
breakfast establishments, (5) guest suites; or (6) vacation rentals.” Id. § 4-14-010. The term
“transient occupancy” used in these definitions means “occupancy on a daily or nightly basis, or
any part thereof, for a period of 31 or fewer consecutive days.” Id. §§ 4-6-290, 4-6-300, 4-14-10.
The Code includes vacation rentals and shared housing units in its definition of “hotel
accommodations.” Id. § 3-24-020(A)(4). As a result, guests who stay in vacation rentals and
shared housing units must pay the 4.5% tax that the City imposes on all gross rental or leasing
charges for any “hotel accommodation” in the City. Id. § 3-24-030.
The Code also imposes additional taxes of 4% and 2% (for a total of 6%) on gross rental
or leasing charges for any vacation rental or shared housing unit but not on rentals of any other
“hotel accommodations.” Id. The Code states that the purpose of the 4% surcharge is to “fund
supportive services attached to permanent housing for homeless families and to fund supportive
services and housing for the chronically homeless.” Id. § 3-24-030(B). The Code states that the
purpose of the 2% surcharge is to “fund housing and related supportive services for victims of
domestic violence.” Id. § 3-24-030(C).
FILE
D D
ATE:
6/2
1/20
19 6
:51
PM
2016
CH
1548
9
3
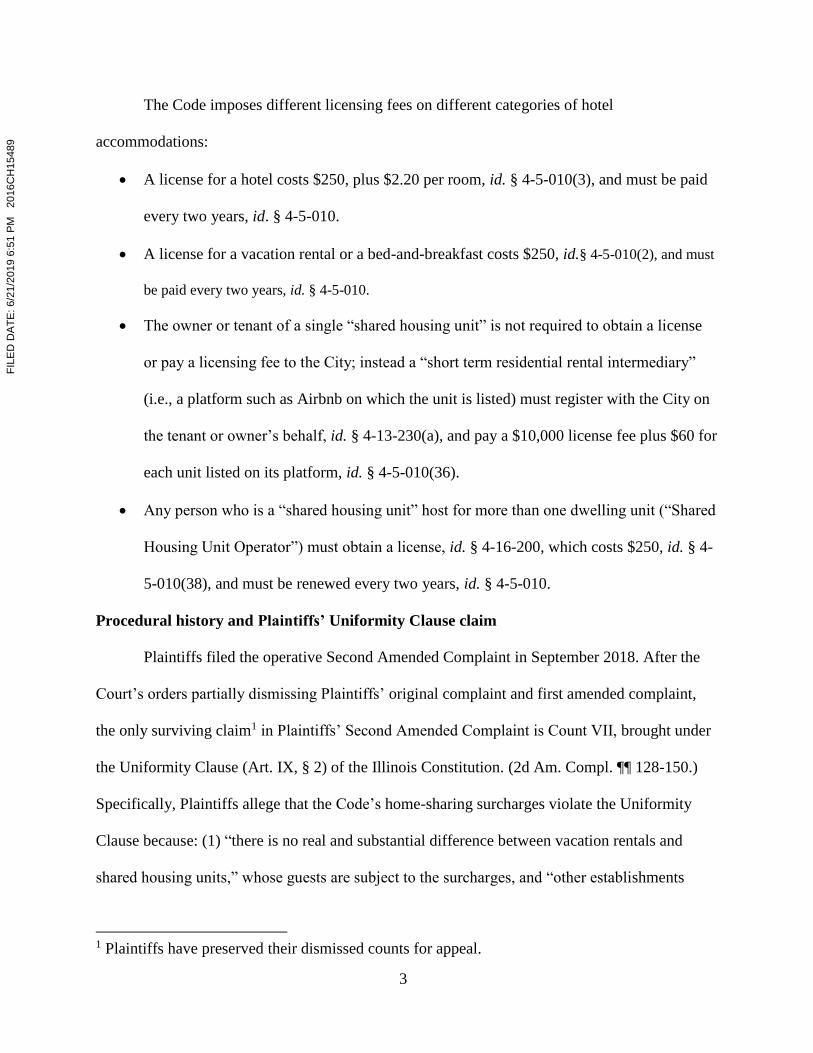
The Code imposes different licensing fees on different categories of hotel
accommodations:
A license for a hotel costs $250, plus $2.20 per room, id. § 4-5-010(3), and must be paid
every two years, id. § 4-5-010.
A license for a vacation rental or a bed-and-breakfast costs $250, id.§ 4-5-010(2), and must
be paid every two years, id. § 4-5-010.
The owner or tenant of a single “shared housing unit” is not required to obtain a license
or pay a licensing fee to the City; instead a “short term residential rental intermediary”
(i.e., a platform such as Airbnb on which the unit is listed) must register with the City on
the tenant or owner’s behalf, id. § 4-13-230(a), and pay a $10,000 license fee plus $60 for
each unit listed on its platform, id. § 4-5-010(36).
Any person who is a “shared housing unit” host for more than one dwelling unit (“Shared
Housing Unit Operator”) must obtain a license, id. § 4-16-200, which costs $250, id. § 4-
5-010(38), and must be renewed every two years, id. § 4-5-010.
Procedural history and Plaintiffs’ Uniformity Clause claim
Plaintiffs filed the operative Second Amended Complaint in September 2018. After the
Court’s orders partially dismissing Plaintiffs’ original complaint and first amended complaint,
the only surviving claim1 in Plaintiffs’ Second Amended Complaint is Count VII, brought under
the Uniformity Clause (Art. IX, § 2) of the Illinois Constitution. (2d Am. Compl. ¶¶ 128-150.)
Specifically, Plaintiffs allege that the Code’s home-sharing surcharges violate the Uniformity
Clause because: (1) “there is no real and substantial difference between vacation rentals and
shared housing units,” whose guests are subject to the surcharges, and “other establishments
1 Plaintiffs have preserved their dismissed counts for appeal.
FILE
D D
ATE:
6/2
1/20
19 6
:51
PM
2016
CH
1548
9
4
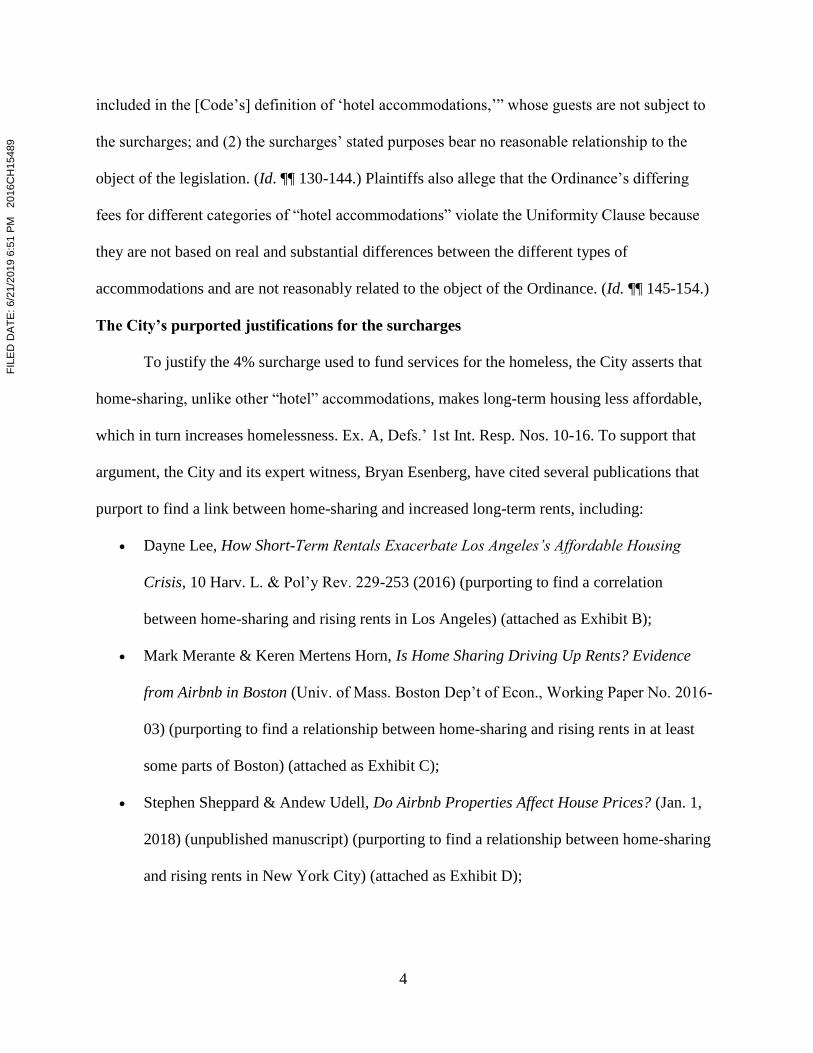
included in the [Code’s] definition of ‘hotel accommodations,’” whose guests are not subject to
the surcharges; and (2) the surcharges’ stated purposes bear no reasonable relationship to the
object of the legislation. (Id. ¶¶ 130-144.) Plaintiffs also allege that the Ordinance’s differing
fees for different categories of “hotel accommodations” violate the Uniformity Clause because
they are not based on real and substantial differences between the different types of
accommodations and are not reasonably related to the object of the Ordinance. (Id. ¶¶ 145-154.)
The City’s purported justifications for the surcharges
To justify the 4% surcharge used to fund services for the homeless, the City asserts that
home-sharing, unlike other “hotel” accommodations, makes long-term housing less affordable,
which in turn increases homelessness. Ex. A, Defs.’ 1st Int. Resp. Nos. 10-16. To support that
argument, the City and its expert witness, Bryan Esenberg, have cited several publications that
purport to find a link between home-sharing and increased long-term rents, including:
Dayne Lee, How Short-Term Rentals Exacerbate Los Angeles’s Affordable Housing
Crisis, 10 Harv. L. & Pol’y Rev. 229-253 (2016) (purporting to find a correlation
between home-sharing and rising rents in Los Angeles) (attached as Exhibit B);
Mark Merante & Keren Mertens Horn, Is Home Sharing Driving Up Rents? Evidence
from Airbnb in Boston (Univ. of Mass. Boston Dep’t of Econ., Working Paper No. 2016-
03) (purporting to find a relationship between home-sharing and rising rents in at least
some parts of Boston) (attached as Exhibit C);
Stephen Sheppard & Andew Udell, Do Airbnb Properties Affect House Prices? (Jan. 1,
2018) (unpublished manuscript) (purporting to find a relationship between home-sharing
and rising rents in New York City) (attached as Exhibit D);
FILE
D D
ATE:
6/2
1/20
19 6
:51
PM
2016
CH
1548
9
5
Office of the New York City Comptroller, The Impact of Airbnb on NYC Rents (April
2018) (unpublished manuscript) (attached as Exhibit E);
David Wachsmuth, et al., McGill Univ. Sch. Of Urban Planning Urban Politics &
Governance Research Group, The High Cost of Short-Term Rentals in New York City
(2018) (unpublished manuscript) (attached as Exhibit F);
Kyle Barron et al., The Sharing Economy and Affordable Housing: Evidence from Airbnb
(Apr. 1, 2018) (unpublished manuscript) (nationwide study finding that home-sharing
causes an average increase in rents and housing prices of less than 0.1%) (attached as
Exhibit G);
Josh Bivens, Econ. Policy Inst., The Economic Costs and Benefits of Airbnb (2019)
(attached as Exhibit H)
DC Working Families, Selling the District Short (2017) (addressing home-sharing in
Washington, D.C.) (attached as Exhibit I)
Ex. J, Report of Bryan Esenberg (minus exhibits) (“Esenberg Report”)2 3–5.
The City also premises its justification for the 2% surcharge on the supposed link
between home-sharing and a lack of affordable housing. That surcharge’s stated purpose is to
“fund housing and related supportive services for victims of domestic violence.” Chi. Muni.
Code § 3-24-030(C). The City asserts that the 2% surcharge relates to this purpose because a
“lack of safe and affordable housing is one of the primary barriers [that victims of domestic
violence] face in choosing to leave an abusive partner” and “house sharing has a tendency to
reduce the availability of affordable housing, thereby contributing to the problem of domestic
2 For ease of reference, Plaintiffs have attached the articles that Esenberg attached to his report as
separate exhibits to this motion. Contemporaneously Plaintiffs are filing a Motion to Exclude
Defendants’ Expert, which seeks to exclude Esenberg’s report and testimony. Plaintiffs cite the
report and testimony here only for the City’s justifications and related admissions.
FILE
D D
ATE:
6/2
1/20
19 6
:51
PM
2016
CH
1548
9
6
abuse victims lacking affordable housing.” Ex. K, City of Chicago’s Resp. to Plfs.’ 2d Set of
Interrogs. (“Defs.’ 2d Int. Resp.”) 28.
To refute the City’s justifications, Plaintiffs retained an economist, Dr. Adrian Moore, as
their expert witness. In summary, Dr. Moore’s report (“Moore Report,” attached as Exhibit L)
and testimony (“Moore Dep.,” attached in relevant part as Exhibit M) establish the following
undisputed facts:
The publications the City relies on do not establish, or even attempt to establish, any link
between home-sharing and homelessness. Ex. L, Moore Report at 10; Ex. M, Moore Dep.
at 29:24-30:6.
One cannot draw general conclusions from studies focused on a single city, as most of the
publications the City relies on are. Ex. M, Moore Dep. at 25:22-27:1.
The only nationwide study on the relationship between home-sharing and housing costs
found only a minimal effect. Ex. L, Moore Report at 8; Ex. M, Moore Dep. at 48:17-49:6.
A lack of affordable housing is overwhelmingly the result of other factors within the
city’s control, particularly restrictions on land use and building. Ex. L, Moore Report at
9-15.
Homelessness is overwhelmingly the result of other factors, including low incomes and a
lack of housing supply due to restrictions the City has imposed. Id. at 15-21.
The City’s purported “real and substantial” differences for tax classifications
The City makes several assertions to show that there are “real and substantial”
differences among different types of hotel accommodations that justify applying the surcharges
to home-sharing alone. The purported differences include:
Zoning differences, which prohibit hotels and bed-and-breakfasts in residential areas
FILE
D D
ATE:
6/2
1/20
19 6
:51
PM
2016
CH
1548
9
7
where home-sharing is allowed;
“[H]otels and B&Bs have owners or employees who are present when guests stay at
those establishments, while shared housing units generally do not.”
“[S]hared housing units are widely dispersed and often anonymous, with only a limited
amount of information provided on web site listings, thereby making enforcement and
regulation more difficult, time consuming, and expensive.”
Ex. A, Defs.’ 1st Int. Resp. No. 11.
The City’s purported “real and substantial” differences for fee classifications
To identify the (supposed) real and substantial differences that could justify the differing
licensing fees, the City has stated that there are relatively few hotels and B&Bs in Chicago—
about 199 hotels, with about 51,600 rooms, and 20 B&Bs—but a large number (“over 6,369”) of
shared housing units available for rent. Ex. A, Defs.’ 1st Int. Resp. No. 18. “Since there are
relatively few [hotels and B&Bs], it is relatively easy and inexpensive for the City to perform
license checks, building inspections and other required activities” with respect to them, the City
states, but “licensing and inspecting all of the available shared housing units would be
administratively inconvenient and expensive.” Id.
The City’s purported justifications for the differing fees
The City states that it imposes a licensing fee on shared housing intermediaries (i.e.,
platforms such as Airbnb) rather than the owners of individual shared housing units, because it is
easier “to deal primarily with just a few intermediaries rather than a large number of individual
unit owners.” Ex. A, Defs.’ 1st Int. Resps. No. 21. It further states that “[o]wners of multiple
shared housing units are more likely to be real estate developers or investors who are in the
business of renting out hotel accommodations,” so requiring them to be licensed gives the City
FILE
D D
ATE:
6/2
1/20
19 6
:51
PM
2016
CH
1548
9

8
“some control over their activities” and allows it to “put a hold on—or refuse to renew—the
license of an operator that is causing problems.” Id.
STANDARD
Summary judgment is appropriate where the pleadings, affidavits, depositions,
admissions, and exhibits on file, when viewed in the light most favorable to the non-moving
party, reveal that there is no genuine issue as to any material fact and the movant is entitled to
judgment as a matter of law. 735 ILCS 5/2-1005(c).
ARGUMENT
The City’s home-sharing surcharges violate the Uniformity Clause because they
arbitrarily and unreasonably discriminate against home-sharing and in favor of other “hotel”
accommodations. Neither the surcharges nor the fees are based on real and substantial
differences between home-sharing and other “hotel accommodations, and neither are reasonably
related to their purported purpose or to public policy.
The Uniformity Clause states:
In any law classifying the subjects or objects of non-property taxes
or fees, the classes shall be reasonable and the subjects and objects
within each class shall be taxed uniformly. Exemptions,
deductions, credits, refunds and other allowances shall be
reasonable.
Ill. Const. Art. IX, § 2. To be reasonable under the Uniformity Clause, a classification must (1)
be “based on a real and substantial difference between those who are taxed and those who are not
taxed” and (2) “bear some reasonable relationship to the object of the legislation or to public
policy.” Primeco Pers. Commc’ns, L.P. v. Ill. Commerce Comm’n, 196 Ill. 2d 70, 84 (2001).
When a plaintiff presents a good-faith challenge to the reasonableness of a tax classification, “the
taxing body … must first justify the tax classification.” Id. at 85. Then “the challenging party
FILE
D D
ATE:
6/2
1/20
19 6
:51
PM
2016
CH
1548
9

9
must persuade the court that the taxing body’s justification is unsupported by the facts or
insufficient as a matter of law.” Id. This test does not merely “duplicate the limitation on the
taxing power contained in the equal protection clause” but rather is “meant to insure that
taxpayers receive added protection in the state constitution based on standards of reasonableness
which are more rigorous than those developed under the federal constitution.” U.S.G. Italian
Marketcaffe, L.L.C. v. City of Chi., 332 Ill.App.3d 1008, 1014 (1st Dist. 2002) (internal marks
and citations omitted). The classifications Plaintiffs challenge fail this test.
I. The home-sharing surcharges are not justified by real and substantial differences
between home-sharing and other “hotel accommodations.”
The City’s home-sharing surcharges violate the Uniformity Clause because there is no
real and substantial difference between the service provided to home-sharing guests and the
service provided to hotel guests: all receive lodging on a “transient” basis for a nightly rate. Cf.
Satellink of Chi., Inc. v. City of Chi., 168 Ill. App. 3d 689, 694 (1st Dist. 1988) (no real and
substantial difference between cable TV providers and satellite subscription TV providers
because they “provide essentially the same service to [consumers]”). Indeed, the City Code
recognizes that vacation rentals, shared housing units, hotels, motels, inns, and similar places all
provide the same thing: “hotel accommodations.” Chi. Muni. Code § 3-24-020(4).
The City primarily justifies its different treatment of home-sharing by asserting that
home-sharing removes housing from the long-term housing market, which supposedly increases
long-term rents, which, in turn, supposedly increases homelessness. Ex. A, Defs.’ 1st Int. Resp.
Nos. 10-16. Even assuming arguendo that home-sharing has those consequences, that does not
distinguish home-sharing from other types of hotel accommodations. In fact, every type of hotel
accommodation occupies space that could otherwise be devoted to long-term housing—and
therefore any type of hotel accommodation should, under the City’s theory, have the same
FILE
D D
ATE:
6/2
1/20
19 6
:51
PM
2016
CH
1548
9
10
effects. Indeed, much existing hotel space could be converted to long-term residences even
without a zoning change because the City Code allows residential dwelling units above the first
floor as a matter of right in almost all business, commercial, and downtown districts. See Chi.
Muni. Code §§ 17-3-0207, 17-4-0207. For example, there are buildings in Chicago partially used
as hotels and partially used for long-term residences. There is no reason why those buildings
could not be devoted, partially or entirely (at least above the ground floor), to long-term
residential use; their owners’ decision to use them partly as a hotel therefore logically results in
less available long-term housing than would otherwise exist, just as short-term rentals
supposedly do. Yet the City treats them differently.
Moreover, unlike virtually all other hotel accommodations, many shared housing units do
not displace long-term housing. The City argues that shared housing units are different from
hotels and B&Bs because, unlike hotels and B&Bs, they “are permitted in residential single-unit
districts (RS1, RS2, RS3)” and “low density multi-unit districts (RT3.5).” Ex. A, Defs.’ 1st Int.
Resp. No. 11. Therefore, the City argues, “shared housing units limit the market for housing
available for long term use while hotels and B&Bs do not.” Id. But, under the City Code, a
person may only rent out a “single-unit” home, or a unit in a building with two to four residential
units, if it is his or her primary residence. Chi. Muni. Code §§ 4-6-300(h)(8), 4-14-060(d).
Therefore, home-sharing in such homes does not remove those homes from “housing available
for long term use.”
The City also asserts that “hotels and B&Bs have owners or employees who are present
when guests stay at those establishments, while shared housing units generally do not.” Ex. A,
Defs.’ 1st Int. Resp. No. 11. It is not apparent whether the City knows how often shared housing
units have an owner or employee present, nor is it apparent how this is a substantial difference
FILE
D D
ATE:
6/2
1/20
19 6
:51
PM
2016
CH
1548
9

11
between the service provided to home-sharing guests and the service provided to guests of other
hotel accommodations. To the contrary, the Appellate Court has held that, for Uniformity Clause
purposes, the character of the service that a business provides does not change based on the
participation (or non-participation) of an owner or employee of the business when the service is
provided. See Nat’l Pride of Chi., Inc. v. City of Chi., 206 Ill. App. 3d 1090, 1097, 1104 (1st
Dist. 1990) (no real and substantial difference between self-service car washes and car washes
with “machines operated and controlled by the owner or manager of such machines”).
Finally, the City asserts that shared housing units are different from other hotel
accommodations because they “are widely dispersed and often anonymous, with only a limited
amount of information provided on web site listings, thereby making enforcement and regulation
more difficult, time consuming, and expensive.” Ex. A, Defs.’ 1st Int. Resp. No. 11. In fact,
shared housing units can never be “anonymous” because their intermediaries must register them
with the City, providing the owners’ or operators’ names, addresses, and other details. See Chi.
Muni. Code § 4-14-020. Further, the City elsewhere states that it has addressed the problem of
shared housing units being widely dispersed, with different owners, by requiring intermediaries
(i.e., platforms such as Airbnb) to register and monitor them. Ex. A, Defs.’ 1st Int. Resp. No. 21.
And, in any event, the City has not explained how this is a difference between the services
provided to home-sharing guests and services provided to guests of other hotel accommodations.
II. The home-sharing surcharges violate the Uniformity Clause because they are not
reasonably related to their stated purpose or public policy.
In addition, the City’s home-sharing surcharges violate the Uniformity Clause because
their classification is not reasonably related to their stated purposes of addressing the problems of
homelessness and domestic violence.
FILE
D D
ATE:
6/2
1/20
19 6
:51
PM
2016
CH
1548
9
12
A. The surcharges’ classifications are not reasonably related to the surcharges’
purpose because they do not apply to other types of hotel accommodations
that keep property out of the long-term housing market.
As an initial matter, even if one accepts the City’s premise that keeping properties out of
the long-term rental market will tend to increase long-term rents and, in turn, homelessness, it is
not reasonable to apply the surcharges to all vacation rentals and shared housing units while not
applying it to any other hotel accommodations. As discussed above, many shared housing units
are not removed from the long-term housing market at all, because the law requires that they
remain their owners’ primary residences. These units therefore cannot contribute to rising rents
and homelessness even under the City’s theory.
On the other hand, other types of hotel accommodations are virtually never used as long-
term housing, and they occupy space that could otherwise be devoted to long-term housing. It is
not reasonable to combat homelessness, by imposing a surcharge on many units that (under the
City’s theory) do not even arguably contribute to that problem, while simultaneously not
imposing that surcharge on other hotel accommodations that (under the City’s theory) do
contribute to the problem at least as much as any vacation rental or shared housing unit. Cf.
Milwaukee Safeguard Ins. Co. v. Selcke, 179 Ill. 2d 94, 103 (1997) (tax on foreign, but not
domestic, insurance companies was not reasonably related “to protecting the interests of Illinois
policyholders because the tax [was] imposed on all foreign companies regardless of their
financial strength or their level of compliance with [statutory criteria that allowed domestic
insurers to avoid the tax]”); U.S.G. Italian Marketcaffe, 332 Ill. App. 3d at 1017 (ordinance
cannot reasonably serve to prevent litter when it “taxes items that are not likely to cause litter,
while not taxing items that are very likely to cause litter”).
FILE
D D
ATE:
6/2
1/20
19 6
:51
PM
2016
CH
1548
9

13
B. The studies the City has cited do not establish that home-sharing leads to
increased homelessness.
In addition, the City’s theory that home-sharing tends to increase homelessness is not
well founded. None of the studies the City has cited even addressed homelessness, much less
found that home-sharing increases it. Ex. L, Moore Report at 10; Ex. N, Deposition of Bryan
Esenberg (“Esenberg Dep.”) 71:5-9, 76:4-7, 77:19-21, 83:12-15, 87:11-14. In fact, Dr. Moore’s
survey of the academic literature found no empirical research on that question. Ex. M, Moore
Dep. 29:24-30:6.
Rather than address homelessness, the City’s studies only found, at most, that home-
sharing led to modest increases in long-term rents in some parts of some cities. And all but one
of the City’s studies connecting home-sharing to increased rents focused on a single city. None
of these studies provides a basis for concluding that home-sharing in general causes long-term
rents to rise, or that it will do so in Chicago. As Dr. Moore has explained, one cannot draw
general conclusions from a study of a single city; no economist would do so. Ex. M, Moore Dep.
25:22-27:1. Rather, results from a single city only suggest a hypothesis—a “research question”—
that economists would want to investigate. Id. at 26:3-19.
There are additional reasons why the City’s studies do not provide a basis for concluding
that home-sharing tends to lead to increased rents, let alone a basis to conclude that home-
sharing tends to increase homelessness.
The article about Los Angeles—a law review student note, not a peer-reviewed research
paper by a trained scholar—does not even purport to show that home-sharing causes increased
rents. In fact, the note employs no economic or statistical analysis. Rather, it only looks at
comparative statics showing that certain Los Angeles neighborhoods with the most home-sharing
also saw increased rents. Ex. M, Moore Dep. 50:16-51:2. The note argues from correlation; it
FILE
D D
ATE:
6/2
1/20
19 6
:51
PM
2016
CH
1548
9

14
does not show any causal relationship between home-sharing and increases in rents. Id. at 51:2-
7. And, as another article the City has cited has noted, and the City’s proffered expert has
acknowledged, without evidence of causation, home-sharing could be correlated with increased
rents simply because it tends to be popular in places that are already gentrifying. Ex. N, Esenberg
Dep. at 99:13-24.
As for the studies focused on New York City, they do not provide a basis for drawing
general conclusions because New York is, as a rule of thumb, “always an outlier” due to its
unique characteristics. Ex. L, Moore Report at 10. New York’s data is not representative because
that city’s density is “orders of magnitude higher than any other city in America,” with
“developable space … extremely limited … in a way that it isn’t in other major US cities.” Ex.
M, Moore Dep. 22:16-23:4. New York’s extraordinary density and lack of developable space
make its housing market “less flexible” and thus less able to adapt to changes. Id. at 23:15-24:5.
Chicago’s market is more flexible than New York’s for two reasons: because it scores as
more flexible on the “Wharton Index” that measures housing market flexibility, and because
Chicago’s suburbs are not as dense as New York’s. Id. at 24:6-22. Dr. Moore explained that “that
density profile [] has a big influence on where development can occur, where people move in
anticipation of changes in the market, where jobs locate in anticipation of access to workers, all
of these things. Chicago has a lot more opportunity for things to shift in appreciable ways than
the much denser and almost over-developed New York profile does.” Id. at 24:23-25:7.
Chicago’s suburbs’ greater flexibility allows for additional housing to be created, for properties
to shift from commercial to residential use (or vice versa), and for people to move in and out
more readily. Id. at 25:8-21. Thus, “[t]here is no clear reason to think the effects of home sharing
FILE
D D
ATE:
6/2
1/20
19 6
:51
PM
2016
CH
1548
9

15
on rents would [be] as strong [in other cities]”—or in Chicago in particular—“as in New York
City.” Ex. L, Moore Report at 10.
As for the study focused on Boston, Dr. Moore testified that, even assuming its
methodology is sound and there were no confounding factors the authors failed to account for,
that study provides no basis “to conclude that short-term rentals generally or in Chicago in
particular would tend to increase rents or increase homelessness” in Chicago. Id. at 46:5-12.
“[T]o draw conclusions … on overall availability [of affordable housing]” based on that study
“would be a stretch way beyond what the data actually shows.” Id. 46:13-47:12.
The authors’ data only showed that, for census tracts in the highest decile of Airbnb
listings relative to total housing unit—i.e., the 10% of Boston census tracts with the greatest
density of Airbnb listings—home-sharing caused an increase in asking rents ranging from 1.3%
to 3.1%. Id. at 46:1-4, 47:13-48:6. This means, for example, that if average rents were $750, the
average increase would be between $9.75 and $23.25. But landlords do not generally actually
raise rents by such small amounts; instead, the data suggest that approximately “one out of every
hundred or one out of fifty landlords is raising their rents by [a larger amount such as] a hundred
dollars,” while other tenants do not see an increase. Id. at 46:20-47:5. Thus, the Boston data does
not suggest that home-sharing has led to a “widespread shock,” but shows only “a tiny effect
[on] the margin affecting … only a small percentage of [housing] units.” Id. at 47:6-8. And of
course, this effect was limited to the top decile, so “the most extreme effect [the authors] could
find was [approximately] 1 to 3 percent using the most extreme situation.” Id. at 47:20-48:6.
Thus, even assuming the authors’ analysis is correct as far as it goes, it cannot allow one to draw
broader conclusions about home-sharing’s effects on rents generally in Boston—much less its
effects on rents in Chicago, much less its effects on homelessness in Chicago. Id. at 47:9-12.
FILE
D D
ATE:
6/2
1/20
19 6
:51
PM
2016
CH
1548
9
16
The publication focused on Washington, D.C., does not even purport to prove that home-
sharing causes rents to increase. It only reported that rents rose more quickly in D.C.’s top 20
Airbnb neighborhoods from 2011 through 2016, with a median increase of 14.9% compared to
the citywide average of 11.0%. Ex. I, DC Working Families, Selling the District Short at 19. And
it acknowledged that this “does not prove Airbnb caused the increase” and that “it is possible that
commercial [short-term rental] operations are most viable in gentrifying neighborhoods, and that
they locate in such neighborhoods for that reason.” Id. (emphasis added).
Finally, the only nationwide study found that home-sharing had a minimal effect on rents.
It found that a 1% increase in Airbnb listings in a given zip code leads to an increase in long-
term rents of just 0.018% to 0.024%—18 to 24 cents per $1,000—and an increase in house
prices of just 0.026% to 0.037%. Ex. G, Barron, et al., The Sharing Economy and Housing
Affordability: Evidence from Airbnb at 27; Ex. L, Moore Report at 8. And, as Dr. Moore
testified, this nationwide study, combined with the others the City relies on, suggests that “the
more comprehensive the data … , the smaller the effect [on home-sharing on rents] is,” Ex. M,
Moore Dep. 48:17-49:6 (emphasis added), providing a further reason to discount the single-city
studies that suggest that home-sharing has a more-than-negligible effect on housing prices.
C. The economic literature shows that high rents and affordable housing
shortages are overwhelmingly caused by factors other than home-sharing.
As Dr. Moore’s report explains, high rents and affordable housing shortages are
overwhelmingly caused by factors other than home-sharing—factors that are within the City’s
control, primarily land use restrictions and housing regulations. See Ex. L, Moore Report at 10-
15.
Harvard’s Joint Center for Housing Studies’ definitive survey of America’s rental
housing market in 2017 thoroughly discussed the challenges facing the rental housing market
FILE
D D
ATE:
6/2
1/20
19 6
:51
PM
2016
CH
1548
9
17
“with no mention of Airbnb or the rise of home sharing.” Id. at 10. “Home sharing is simply not
a problem that even shows up on the radar screen relative to long running major factors that
shape the rental market.” Id. Indeed, in general, “[a]nalyses of the housing market, and
particularly of rental housing markets, do not consider home sharing to be even worth
mentioning as a factor influencing the market.” Id. at 21.
In fact, land-use and growth restrictions, zoning, and housing regulations account for
“roughly 90% of the home price differentials between markets with similar amenities.” Id. at 10.
“In other words, most of the problem with lack of affordable housing in Chicago and high rents
is attributable to decisions by the city that raise the cost of housing.” Id. at 10-11. Dr. Moore
supported this conclusion with a “rich literature digging in to what drives high housing costs in
some cities,” including, among other things, reports from the Harvard Joint Center for Housing
Studies; the California Legislative Analyst’s Office; Jason Furman, chairman of President
Obama’s Council of Economic Advisors; and Harvard economist Edward Glaeser, who has
published dozens of articles on this issue. Id. at 11-15. In summary, this literature states that, to
the extent that housing is unaffordable in cities, it is because those cities have enacted land use,
zoning, and building restrictions that make it difficult to expand the supply.
Chicago is no exception. As Moore testified, the “Wharton Residential Land Use
Regulatory Index”—which measures how stringently cities regulate land use—“puts Chicago in
the middle of the pack with respect to land use regulations.” Id. at 13. “This means that while the
housing market in Chicago is not as restricted as in, say, Boston, there are nearly 100 points in
the Housing Affordability Index between Chicago and the least restrictive cities like St. Louis,
Indianapolis, and Kansas City. This shows that Chicago has many policy options available to
loosen up the housing market and lower home prices and rents.” Id.
FILE
D D
ATE:
6/2
1/20
19 6
:51
PM
2016
CH
1548
9
18
Moreover, Chicago has a well-documented history of aldermen using “aldermanic
prerogative”—through which an alderman may block proposed zoning changes in his or her
ward—to prevent the development of affordable housing. See, e.g., Tanvi Misra, How Chicago’s
Aldermen Help Keep It Segregated, CityLab, Aug. 2, 20183; Patricia Fron, et al., Aldermanic
Prerogative is the Grease That Oils the Machine, Chi. Trib., Feb. 7, 2019.4
As for the other 10% of home price differentials, Dr. Moore opines that “most of it”
would likely be attributable to economic growth, not home-sharing, because “[g]rowing areas
have very different housing markets from shrinking [or steady] areas.” Ex. M, Moore Dep. at
37:16-38:9.
D. There is no basis for concluding that increased rents in neighborhoods with
home-sharing will lead to increased homelessness.
In addition, the City has no basis for its assumption that increased long-term rents that
(supposedly) result from home-sharing will lead to increased homelessness because renters on
the margin will no longer be able to afford housing.
The claim is implausible on its face because there is no reason to believe that home-
sharing occurs in any significant amount in neighborhoods where people are on the verge of
homelessness. Home-sharing tends to occur in relatively upscale neighborhoods close to business
centers and tourist attractions. People who rent homes through Airbnb do not look for apartments
at the bottom of the market. Ex. L, Moore Report 9-10; Ex. M, Moore Dep. 43:6-22. This is
confirmed by a report the City itself cites, that lists the five Chicago zip codes with the most
Airbnb listings (accounting for more than 41% of Airbnb’s revenue in the Chicago metropolitan
3 https://www.citylab.com/equity/2018/08/how-chicagos-aldermen-help-keep-it-
segregated/564983/. 4 https://www.chicagotribune.com/opinion/commentary/ct-perspec-aldermanic-prerogative-
zoning-political-corruption-0208-20190207-story.html.
FILE
D D
ATE:
6/2
1/20
19 6
:51
PM
2016
CH
1548
9
19
area): 60657 (Lakeview, Boystown); 60611 (Magnificent Mile, Streeterville); 60614 (Lincoln
Park, Sheffield Neighbors, Old Town Triangle); 60610 (Old Town, Gold Coast); 60622 (Wicker
Park, West Town). Ex. O, John W. O’Neill & Yuxia Ouyang, Penn State Univ. Sch. of
Hospitality, From Air Mattresses to Unregulated Businesses 33 (2016). It is also confirmed by a
map of Chicago home-sharing listings produced by the City’s proffered expert, which shows
listings heavily concentrated downtown and on the north side, and shows that vast areas of
Chicago’s south side, including some of the city’s poorest neighborhoods, have no listings at all.
Ex. J Esenberg Report at Ex. E; Ex. N, Esenberg Dep. at 105:16-107:9.
Thus, even if home-sharing marginally increases rents in some neighborhoods where it
occurs, “it’s unlikely that those effects are sufficiently strong among the population of renters
most vulnerable to disruption to push them into homelessness.” Ex. L, Moore Report at 10.
Again, even studies that found that home-sharing increases rents in some cities or neighborhoods
found only a modest effect, and the only nationwide study found a minimal effect. It is
implausible that such small rent increases in the upscale neighborhoods where home-sharing is
most concentrated could force people out of their homes in neighborhoods where people are so
impoverished that a rent increase of several percent would render them homeless—and where
Airbnb listings do not even occur.
Further, Dr. Moore has explained that one cannot conclude that there is a simple causal
chain through which home-sharing increases rents, which in turn affects the total housing supply,
which in turn affects the number of people who are homeless. “[I]n each of the steps of that
causal chain, there are many other influences, orders of magnitude stronger.” Ex. M, Moore Dep.
49:10-19. The City’s attempt to connect home-sharing to domestic violence requires yet another
step in the causal chain, making that relationship even more attenuated.
FILE
D D
ATE:
6/2
1/20
19 6
:51
PM
2016
CH
1548
9
20
In fact, homelessness is overwhelmingly the result of factors unrelated to home-sharing.
The greatest factor affecting homelessness is not housing supply but lack of income. Ex. L,
Moore Report at 20-21. Restrictions on housing supply do affect homelessness; one study of 40
large U.S. cities found about 42 percent of the variation in homelessness explained by
differences in median home prices. Id. at 15. But, again, high housing costs are driven by city
policies that restrict the supply of housing, not by home-sharing. See id. at 10-15. Academic
literature shows that the restricted supply that results from these policies results in greater
homelessness. See id. at 16-20.
In particular, homelessness is exacerbated by building restrictions that inhibit the creation
of low-quality housing—i.e., the type of housing used by “people at high risk for homelessness,
not the higher end apartments typically demanded by middle class vacation travelers and
sometimes converted to home sharing.” Id. at 17-18. Empirical research shows that most cities
with less housing regulation have between 50 and 100 percent less homelessness than cities with
the median amount of regulation such as Chicago. Id. at 19.
In summary, even if one assumes the City’s studies are correct as far as they go,
“problems with income are much more important for explaining homelessness than are housing
supply and costs, while land use and housing regulations lead to nearly all housing supply and
cost issues, leaving home sharing with very little impact on homelessness.” Id. at 21. And that
only means that there is little room for home-sharing to have an impact; again, there is no
evidence that home-sharing actually increases homelessness at all.
III. The varying fees for different hotel accommodations violate the Uniformity Clause
because there is no real and substantial difference between hotels, bed-and-
breakfasts, vacation rentals, and shared housing units.
The City has also failed to show that there are real and substantial differences between
FILE
D D
ATE:
6/2
1/20
19 6
:51
PM
2016
CH
1548
9
21
the various types of “hotel accommodations”—hotels, bed-and-breakfasts, vacation rentals, and
shared housing units—that could justify imposing different fees on them.
Asked to identify the real and substantial differences that could justify this differential
treatment, the City stated that there are relatively few hotels and B&Bs in Chicago—about 199
hotels, with about 51,600 rooms, and 20 B&Bs—but a large number (“over 6,369”) of shared
housing units available for rent. Ex. A, Defs.’ 1st Int. Resp. No. 18. “Since there are relatively
few [hotels and B&Bs], it is relatively easy and inexpensive for the City to perform license
checks, building inspections and other required activities” with respect to them, the City states,
but “licensing and inspecting all of the available shared housing units would be administratively
inconvenient and expensive.” Id.
That explanation makes little sense, given that the City imposes identical fees on B&Bs
and vacation rentals, even though vacation rentals are permitted everywhere that shared housing
units are permitted and therefore are also numerous and widely dispersed. It also makes little
sense given that the City imposes a lower per-unit registration fee on shared housing units (paid
by Shared Housing Unit Operators) than on hotels. If shared housing units were really and
substantially different from other hotel accommodations because they are costlier to regulate, as
the City claims, one would expect them to pay higher licensing fees than other hotel
accommodations, but they do not.
IV. The home-sharing fees violate the Uniformity Clause because their purpose does
not bear any reasonable relationship to the object of the City’s home-sharing
ordinance.
The City cannot justify imposing different fees on shared housing units and vacation
rentals because, as the City admits, “the ordinance definitions of vacation rentals and shared
housing units are virtually identical.” Ex. A, Defs.’ 1st Int. Resp. No. 20. Imposing different fees
FILE
D D
ATE:
6/2
1/20
19 6
:51
PM
2016
CH
1548
9

22
on identical things can only be arbitrary and a violation of the Uniformity Clause.
The City also cannot justify imposing no fee on owners of a single shared housing unit
while imposing a $250 “Shared Housing Unit Operator” license on owners of more than one
shared housing unit. The City explains that it imposes a fee on shared housing intermediaries
(platforms such as Airbnb) rather than the owners of individual shared housing units because it is
easier “to deal primarily with just a few intermediaries rather than a large number of individual
unit owners.” Id. No. 21. But that does not explain why owners of more than one shared housing
unit have to pay an additional fee, even though they, too, must register with an intermediary,
which must pay a registration fee on their behalf. See Chi. Muni. Code §§ 4-5-010(36), 4-13-
230(a). The City states that “[o]wners of multiple shared housing units are more likely to be real
estate developers or investors who are in the business of renting out hotel accommodations,” and
licensing gives the City “some control over their activities” and allows it to “put a hold on—or
refuse to renew—the license of an operator that is causing problems.” Ex. A, Defs.’ 1st Int. Resp.
No. 21. But that (if true) only explains (at most) the separate license requirement; it does not
explain the added $250 fee in addition to the $60 per-unit fee that an intermediary pays on an
operator’s behalf. It also does not explain why the operator of two units should pay the same
licensing fee as the operator of 100 or more units, when all other hotel licensing fees are greater
or lesser depending on the number of buildings or units operated.
CONCLUSION
The City has failed to justify imposing surcharges on home-sharing that do not apply to
other hotel accommodations, and it has failed to justify its arbitrary scheme of fees. The Court
should therefore grant summary judgment in Plaintiffs’ favor and declare that the City’s home-
sharing surcharges and fees violate the Uniformity Clause of the Illinois Constitution.
FILE
D D
ATE:
6/2
1/20
19 6
:51
PM
2016
CH
1548
9

23
Dated: June 21, 2019
Respectfully submitted,
LEILA MENDEZ and ALONSO ZARAGOZA
By:
One of their Attorneys
Liberty Justice Center
Cook County No. 49098
Jeffrey Schwab (#6290710)
190 S. LaSalle Street, Suite 1500
Chicago, Illinois 60603
(312) 263-7668
(312) 263-7702 (fax)
Goldwater Institute
Jacob Huebert (#6305339)
Timothy Sandefur (#6325089 / pro hac vice #61192)
Christina Sandefur (#6325088 / pro hac vice # 61186)
500 E. Coronado Road
Phoenix, Arizona 85004
(602) 462-5000
(602) 256-7045 (fax)
Attorneys for Plaintiffs
FILE
D D
ATE:
6/2
1/20
19 6
:51
PM
2016
CH
1548
9

24
CERTIFICATE OF SERVICE
I, Jeffrey Schwab, an attorney, hereby certify that on June 21, 2019, I served the
foregoing Plaintiffs’ Motion for Summary Judgment via electronic filing service provider
FileTime Illinois to Weston Hanscom ([email protected]), Richard Danaher
([email protected]), and Jason Rubin ([email protected]).
Under penalties as provided by law pursuant to Section 1-109 of the Code of Civil
Procedure, the undersigned certifies that the statements set forth in this instrument are true and
correct, except as to matters therein stated to be on information and belief and as to such matters
the undersigned certifies as aforesaid that he verily believes the same to be true.
Jeffrey M. Schwab
FILE
D D
ATE:
6/2
1/20
19 6
:51
PM
2016
CH
1548
9

IN THE CIRCUIT COURT OF COOK COUNTY, ILLINOIS COUNTY DEPARTMENT, CHANCERY DIVISION
LEILA MENDEZ and ALONSO ZARAGOZA, Plaintiffs, v. CITY OF CHICAGO, et al., Defendants.
) ) ) Case No. 16 CH 15489 ) ) Judge Sanjay T. Tailor ) ) ) ) )
LIST OF EXHIBITS TO PLAINTIFFS’ MOTION FOR SUMMARY JUDGMENT
Exhibit A – Defendants’ Responses To Plaintiffs’ First Set of Interrogatories. Exhibit B – Dayne Lee, How Short-Term Rentals Exacerbate Los Angeles’s Affordable Housing Crisis, 10 Harv. L. & Pol’y Rev. 229-253 (2016). Exhibit C – Mark Merante & Keren Mertens Horn, Is Home Sharing Driving Up Rents? Evidence from Airbnb in Boston (Univ. of Mass. Boston Dep’t of Econ., Working Paper No. 2016-03). Exhibit D – Stephen Sheppard & Andew Udell, Do Airbnb Properties Affect House Prices? (Jan. 1, 2018) (unpublished manuscript). Exhibit E – Office of the New York City Comptroller, The Impact of Airbnb on NYC Rents (April 2018) (unpublished manuscript). Exhibit F – David Wachsmuth, et al., McGill Univ. Sch. Of Urban Planning Urban Politics & Governance Research Group, The High Cost of Short-Term Rentals in New York City (2018) (unpublished manuscript). Exhibit G – Kyle Barron et al., The Sharing Economy and Affordable Housing: Evidence from Airbnb (Apr. 1, 2018) (unpublished manuscript). Exhibit H – Josh Bivens, Econ. Policy Inst., The Economic Costs and Benefits of Airbnb (2019). Exhibit I – DC Working Families, Selling the District Short (2017). Exhibit J – Report of Defendants’ Expert, Bryan Esenberg (exhibits omitted, except Exhibit E – Map of Chicago Home-Sharing Listings).
FILE
D D
ATE:
6/2
1/20
19 6
:51
PM
2016
CH
1548
9
Exhibit K – City of Chicago’s Response to Plaintiffs’ Second Set of Interrogatories. Exhibit L – Report of Plaintiffs’ Expert, Dr. Adrian Moore. Exhibit M – Transcript of Deposition of Dr. Adrian Moore (excerpts). Exhibit N – Transcript of Deposition of Bryan Esenberg (excerpts). Exhibit O – John W. O’Neill & Yuxia Ouyang, Penn State Univ. Sch. of Hospitality, From Air Mattresses to Unregulated Businesses 19 (2016).
FILE
D D
ATE:
6/2
1/20
19 6
:51
PM
2016
CH
1548
9

Exhibit A
FILE
D D
ATE:
6/2
1/20
19 6
:51
PM
2016
CH
1548
9
IN THE CIRCUIT COURT OF COOK COUNTY, ILLINOISCOUNTY DEPARTMENT, CHANCERY DIVISION
LEILA MENDEZ, et al.,
Plaintiffs,
v.
CITY OF CHICAGO, et al.,
Defendants.
Case No. 2016-CH-15489
Judge Sanjay T. Tailor
DEFENDANTS' RESPONSESTO PLAINTIFFS' FIRST SET OF INTERROGATORIES
Defendant City of Chicago ("City") responds to Plaintiffs' First Set of Interrogatories as
follows:
INTERROGATORY NO. 1
Identify all persons with knowledge of any of the events alleged or referred to inParagraphs 1 through 21 and 129 through 151 of Plaintiffs' Amended Complaint,including the nature and substance of each person's knowledge.
RESPONSE: The City objects to this Interrogatory as vague, overbroad and unduly
burdensome. Subject to and without waiving these objections, tl~e City states that Stefan
Schaffer, Deputy Policy Director, Mayor's Office, has knowledge of the policy reasons behind
the imposition of the surcharge at issue, including the analysis that was conducted prior to its
imposition. Other persons with knowledge of these subjects include:
• Beth Beatty, Deputy Director, Financial Policy, Finance
• Rosa Escareno, Commissioner, Department Qf Business Affairs &Consumer Protection
• Maria Guerra, Director of Legislative Counsel &Government Affairs, Mayor's Office
• Samantha Fields, Budget Director, Office of Budget &Management
1
FILE
D D
ATE:
6/2
1/20
19 6
:51
PM
2016
CH
1548
9

• Steven Valenziano, Assistant Zoning Administrator, Department of Planning &
Development
• Members of the Chicago City Council
Investigation continues. The City will supplement this Response as appropriate.
INTERROGATORY NO.2
Identify all witnesses you may rely on in defense of this case, including the nature and
substance of each person's knowledge and anticipated testimony.
RESPONSE: The City anticipates that it will rely on Mr. Schaffer as a witness, who can testify
about the policy reasons behind the imposition of the surcharge at issue, including the analysis
that was conducted prior to its imposition. The City has not yet identified who else it may be
calling as witnesses in this case. Once that determination is made, the City will duly supplement
its response.
INTERROGATORY NO.3
With respect to each and every person who may be used to present expert evidence
regarding this action pursuant to Illinois Supreme Court Rule 213 (~, identify:
a. all opinions to be expressed, with a description sufficiently complete to include all
of the information in your possession or control about such opinions;
b. the specific allegations of the parties' pleadings to which such opinions are
relevant, identified by pleading title and paragraph number;
c. the basis, reasons, underlying data, and other information considered and relied on
by the witness in forming the opinions to be expressed;
d. all publications authored by the witness within the preceding ten years;
e. all correspondence between the witness and the City;f. all drafts of the report produced for this litigation.
RESPONSE: The City has not yet identified who, if anyone, it will be calling as an expert
witness in this case. Once that determination is made, the City will duly supplement its
response.
INTERROGATORY NO.4
2
FILE
D D
ATE:
6/2
1/20
19 6
:51
PM
2016
CH
1548
9

Identify any and all meetings in which any member or agent of the City participatedrelating to the drafting and consideration of the Ordinance, specifically including thoserelated to the addition of §§ 3-24-030(B) and 4-5-10(36), (37), and (38) to the ChicagoMunicipal Code.
RESPONSE: The City objects to this Interrogatory on the grounds that it seeks information that
is neither relevant nor likely to lead to the discovery of relevant information. The surcharge and
registration fees added by the Ordinance are either valid or invalid as written, and what was said
in oral or written communications prior to passage of the Ordinance has no bearing on that issue.
See Empress Casino Joliet Corp. v. Giannoulias, 231 Ill. 2d 62, 76 (2008) ("The reasons
justifying the classification ... need not appear on the face of the statute, and the classification
must be upheld if any state of facts reasonably can be conceived that would sustain it." ). The
City also objects that this Interrogatory is overbroad and unduly burdensome. The City further
objects to the extent that the Interrogatory seeks information that is protected from disclosure by
the attorney-client privilege, the work product privilege and/or the legislative privilege.
INTERROGATORY NO.S
Identify any other meeting of any members of the City Council, a City Councilcommittee, the City's Finance Department, or the City's Department of BusinessAffairs and Consumer Protection relating to the consideration or imposition of anytax or fee on vacation rentals, shared housing units, or shared housing unit operatorsfrom 2015 through the present.
RESPONSE: The City objects to this Interrogatory on the grounds that it seeks information that
is neither relevant nor likely to lead to the discovery of relevant information. The surcharge and
registration fees added by the Ordinance are either valid or invalid as written, and what was said
in oral or written communications prior to passage of the Ordinance has no bearing on that issue.
See Empress Casino Joliet Corp. v. Giannoulias, 231 Ill. 2d 62, 76 (2008) ("The reasons
justifying the classification ... need not appear on the face of the statute, and the classification
must be upheld if any state of facts reasonably can be conceived that would sustain it." ). The
3
FILE
D D
ATE:
6/2
1/20
19 6
:51
PM
2016
CH
1548
9
City also objects that this Interrogatory is overbroad and unduly burdensome. The City further
objects to the extent that the Interrogatory seeks information that is protected from disclosure by
the attorney-client privilege, the work product privilege and/or the legislative privilege.
INTERROGATORY NO.6
Identify each and every short term residential rental intermediary that has paid the licensefee imposed by Chi. Muni. Code § 4-5-010(37).
RESPONSE: The City objects to this Interrogatory on the grounds that it seeks information that
is neither relevant nor likely to lead to the discovery of relevant information. Subject to and
without waiving this objection, the City responds that, as of the date of this Response, the
following short term residential intermediaries have paid the license fee: AIRBNB ACTION,
LLC d/b/a Airbnb; HOMEAWAY.COM, Inc.
INTERROGATORY NO. 7
Identify the number of shared housing unit operators that have paid the license feeimposed by Chi. Muni. Code § 4-5-010(38).
RESPONSE: The City objects to this Interrogatory on the grounds that it seeks information that
is neither relevant nor likely to lead to the discovery of relevant information. Subject to and
without waiving this objection, the City responds that, as of the date of this Response, 26 shared
housing unit operators have paid the license fee.
INTERROGATORY NO.8
Identify each and every fact that forms the basis for the City's denial, in its Answer, ofParagraph 133 of the Amended Complaint, which states that "some individuals stay (andpay taxes) only at vacation rentals or shared housing units in Chicago, and someindividuals stay (and pay taxes) only at hotels, bed-and-breakfasts, or other 'hotelaccommodations' that are not vacation rentals or shared housing units."
RESPONSE: The City objects to this Interrogatory on the grounds that it lacks foundation.
Paragraph 133 of the Amended Complaint alleged that "[t]here are individuals who are members
of the first class of taxpayers who are not members of the second class of taxpayers ..." While
4
FILE
D D
ATE:
6/2
1/20
19 6
:51
PM
2016
CH
1548
9
the City does not deny that there may be some individuals who stay (and pay taxes) only at
vacation rentals or shared housing units in Chicago (hereafter collectively "shared housing
units"), and some individuals who stay (and pay taxes) only at hotels, bed-and-breakfast
establishments ("B&Bs"), or other hotel accommodations that are not shared housing units, the
City denies that there is an identifiable "class of taxpayers" who stay only in shared housing
units or an identifiable "class of taxpayers" who stay only at hotels or B&Bs.
INTERROGATORY NO.9
Identify each and every fact supporting the City's position, reflected in its Answer to
Paragraph 137 of the Amended Complaint, that the home-sharing surcharge's stated
purpose — to "fund supportive services attached to permanent housing for homeless
families and to fund supportive services and housing for the chronically homeless," Chi.
Muni. Code § 3-24-030 — beaxs a reasonable relationship to the object of the Ordinance.
RESPONSE: The City objects to this Interrogatory on the grounds that it is vague and lacks
foundation. Subject to and without waiving these objections, the City states that the surcharge's
stated purpose is the same as the object of the Ordinance and therefore by definition bears a
reasonable relationship to it.
IN~I'F,RROGATOItY NO. l0
Identify each and every fact supporting the City's position, reflected in its Answer to
Paragraph 138 of the Amended Complaint, that guests of vacation rentals and sharedhousing units affect homelessness, or that vacation rentals and shared housing units
have any greater connection to homelessness than other commercial and non-
commercial traveler housing accommodations, such as hotels, bed-and-breakfasts,
and the houses of friends or relatives.
RESPONSE: The City objects to this Interrogatory on the grounds that it lacks foundation.
Subject to and without waiving this objection, the City states that studies indicate that house
sharing has a tendency to reduce the availability of affordable housing, thereby contributing to
the problem of homelessness. Each housing unit that is used for short-term house sharing rentals
is a unit that is not available for use as permanent housing for residents. Hotels and B&Bs are
5
FILE
D D
ATE:
6/2
1/20
19 6
:51
PM
2016
CH
1548
9

generally located in non-residential districts and therefore do not have that effect. There are only
about 199 hotels in Chicago, with a total of about 51,600 rooms available for rent, and there are
only about 20 B&Bs. By contrast, there are listings for over 6,369 shared housing units available
for rent, largely in residential neighborhoods, so they use up much more housing that would
otherwise be available for permanent housing. Investigation continues. The City will
supplement this Response as appropriate.
INTERROGATORY NO. 11
Identify each and every real or substantial difference between vacation rentals and sharedhousing units, on the one hand, and other establishments included in the definition ofhotel accommodations, on the other, asserted by the City and that the City relied on indenying Paragraph 134 of the Amended Complaint in its Answer.
RESPONSE: There are real and substantial zoning differences among the different types of
hotel accommodations. While neither hotels nor B&Bs are permitted in residential single-unit
districts (RS1, RS2, RS3), shared housing units are permitted in such districts. Similarly, only
shared housing units are permitted in low density multi-unit districts (RT3.5). Consequently,
shared housing units limit the market for housing available for long term use while hotels and
B&Bs do not. Also, hotels and B&Bs have owners or employees who are present when guests
stay at those establishments, while shared housing units generally do not. Furthermore,
regulators and public safety officials know where hotels and B&Bs are located, and they know
who to contact if needed. By contrast, shared housing units are widely dispersed and often
anonymous, with only a limited amount of information provided on web site listings, thereby
making enforcement and regulation more difficult, time consuming, and expensive.
Investigation continues. The City will supplement this Response as appropriate.
INTERROGATORY NO. 12
Identify each and every object of the home-sharing surcharge.
6
FILE
D D
ATE:
6/2
1/20
19 6
:51
PM
2016
CH
1548
9

RESPONSE: The purpose of the surcharge is to fund supportive services attached to permanent
housing for homeless families and to fund supportive services and housing for the chronically
homeless.
INTERROGATORY NO. 13
Identify any and all public policies that the City alleges support the home-sharingsurcharge.
RESPONSE: One public policy consideration supporting the house sharing surcharge is caring
for the less fortunate, including the homeless. Homelessness is a significant problem in Chicago
and nationwide. Addressing that problem is an important public policy consideration, and
addressing the problem requires revenue, which the house sharing surcharge helps provide.
Studies indicate that house sharing has a tendency to reduce the availability of affordable
housing, thereby contributing to the problem of homelessness. Each housing unit that is used for
short-term house sharing rentals is a unit that is not available for use as permanent housing for
residents. In addition, it is an important and long-standing public policy consideration to keep
residential neighborhoods relatively quiet, peaceful and uncongested. This is one reason that
house sharing was not allowed before the ordinance at issue went into effect, and it is a reason
why hotels and B&Bs must generally be located in areas that are zoned for non-residential uses.
Investigation continues. The City will supplement this Response as appropriate.
INTERROGATORY NO. 14
Identify each and every way that the City asserts that the home-sharing surcharge bears areasonable relationship to any object of the legislation or to any public policy.
RESPONSE: See Responses to Interrogatory Nos. 10 - 13.
INTERROGATORY NO. 15
7
FILE
D D
ATE:
6/2
1/20
19 6
:51
PM
2016
CH
1548
9

Identify the ways in which vacation rentals and shared housing units disrupt the desiredphysical character of Chicago's residential neighborhoods, and how the City believes thehome-sharing surcharge prevents this type of disruption.
RESPONSE: In general, shared housing units are located in residential neighborhoods. Guests
of shared housing units are not permanent residents of those neighborhoods and have no
particular stake in the well-being of the neighborhood. They are transient guests, generally from
out of town, and they often take up parking spaces that would otherwise be available to residents.
In some cases, they axe there to "party," which can mean noise and other disturbances for
neighbors. There is no requirement that an owner, or an employee of the owner, be present to
supervise their activities, as there is at a hotel or B&B. The surcharge does not necessarily
prevent disruption, but there is no legal requirement that a tax have such an effect —only that it
meet the requirements of the Uniformity Clause, which the surcharge does. Investigation
continues. The City will supplement this Response as appropriate.
INTERROGATORY NO. 16
Identify the ways in which vacation rentals and shared housing units decrease the numberof units of affordable housing, and how the home-sharing surcharge mitigates theseeffects.
RESPONSE: Studies indicate that house sharing has a tendency to reduce the availability of
affordable housing, thereby contributing to the problem of homelessness. Each housing unit that
is used for short-term house sharing rentals is a unit that is not available for use as permanent
housing for residents. The proceeds of the surcharge are used to fund supportive services
attached to permanent housing for homeless families and to fund supportive services and housing
for the chronically homeless. The City will produce documents providing additional details
about the programs that the surcharge funds. Investigation continues. The City will supplement
this Response as appropriate.
8
FILE
D D
ATE:
6/2
1/20
19 6
:51
PM
2016
CH
1548
9

INTERROGATORY NU. 17
Identify the ways in which vacation rentals and shared housing units cause or increaseguest-created disturbances in the City, and how the home-sharing surcharge mitigatesthese effects.
RESPONSE: See Response to Interrogatory No. 15.
INTERROGATORY NO. 18
Identify each and every fact on which the City relies to justify its denial of Paragraph 142of the Amended Complaint, which states that "for the purpose of licensing fees, there isno real and substantial difference between hotels, bed-and-breakfast establishments,vacation rentals, and shared housing units."
RESPONSE: There are only about 199 hotels in Chicago, with a total of about 51,600 rooms
available for rent, and there are only about 20 B&Bs. By contrast, there are listings for over
6,369 shared housing units available for rent. Hotels are licensed, are in non-residential zoning
districts, and have employees on site. Since there are relatively few of them, it is relatively easy
and inexpensive for the City to perform license checks, building inspections and other required
activities. The same is generally true of B&Bs. By contrast, licensing and inspecting all of the
available shared housing units would be administratively inconvenient and expensive. In fact,
when the City first allowed house sharing, by the same ordinance that imposed the surcharge, it
had to spend over $1.1 million to set up a system for registering and regulating shared housing
units. Investigation continues. The City will supplement this Response as appropriate.
INTERROGATORY NO. 19
Identify each and every alleged real or substantial difference between hotels, bed-and-breakfast establishments, vacation rentals, and shared housing units that the Citybelieves justifies the imposition of different fees under Chi. Muni. Code § 4-5-010.
RESPONSE: See Response to Interrogatory No. 18.
INTERROGATORY NO.20
FILE
D D
ATE:
6/2
1/20
19 6
:51
PM
2016
CH
1548
9

Identify each and every fact that the City alleges supports its Answer to paragraph 148 ofthe Amended Complaint, which denies that the Code's definitions of vacation rentals andshared housing units are virtually identical.
RESPONSE: The City objects to this Interrogatory on the grounds that it lacks foundation. The
City does not deny that the ordinance definitions of vacation rentals and shared housing units are
virtually identical. The City denies the allegation, of paragraph 148 of the Amended Complaint,
that the different fee systems for vacation rentals and shared housing units are unjustifiable.
Pursuant to the pertinent Code provisions, a unit owner may choose which licensing system to
use, and this will have an effect on which regulations and procedures will apply.
INTERROGATORY NO.21
Identify each and every object of Chi. Muni. Code § 4-5-010, which imposes no licensefee on the owner or tenant of a single shared-housing unit but does impose license feeson hotels, bed-and-breakfasts, vacation rentals, and shared housing unit operators.
RESPONSE: The owner of a single shared housing unit is generally an individual who is not
otherwise in the business of renting out hotel accommodations. By listing their units through
intermediaries, the owners of such units allow the City to deal primarily with just a few
intermediaries rather than a large number of individual unit owners. The intermediaries help
monitor the rentals of such units, and they pay much larger license fees, based in part on the
number of units they list. Owners of multiple shared housing units are more likely to be real
estate developers or investors who are in the business of renting out hotel accommodations. It is
important for the City to be able to have some control over their activities, and requiring them to
obtain a license helps provide that control because, among other things, the City can put a hold
on - or refuse to renew —the license of an operator that is creating problems. Investigation
continues. The City will supplement this Response as appropriate.
INTERROGATORY NO.22
10
FILE
D D
ATE:
6/2
1/20
19 6
:51
PM
2016
CH
1548
9

Identify any and all public policies that the City alleges support its decision to exemptowners and tenants of a single share-housing unit from the license fees that apply tohotels, bed-and-breakfasts, vacation, rentals, and shared housing unit operators underChi. Muni. Code § 4-5-010.
RESPONSE: The City objects to this Interrogatory on the grounds that it lacks foundation. See
Response to Interrogatory No. 21.
INTERROGATORY NO.23
State the factual basis for the City's denial of Paragraph 149 of the Amended Complaint.
RESPONSE: See Response to Interrogatory No. 21.
INTERROGATORY NO.24
Identify all documents and other tangible items Defendants may use in defense of thisaction.
RESPONSE: The City will produce documents responsive to Plaintiffs' First Set of Requests
for Documents. The City has not yet identified which documents it will use in defense of this
action. The City will duly supplement its response to this Interrogatory.
FILE
D D
ATE:
6/2
1/20
19 6
:51
PM
2016
CH
1548
9
INTI~.RROGATORY NO.25
Identify each person who provided information needed to respond to any interrogatoryor request herein, including which interrogatory (by number) was addressed by eachsuch person respectively.
RESPONSE: Stefan Schaffer provided information needed to respond to all of the
Interrogatories herein. Joy Adelizzi provided information needed to respond to Interrogatory
Numbers 6, 7, l0 and 18. Steven Valenziano provided information needed to respond to
Interrogatory Numbers 10, 11, 13, 15, 16, 18 and 21.
Weston HanscomJason RubinCity of Chicago Law DepartmentRevenue Litigation Division30 N. LaSalle Street, Suite 1020Chicago, Illinois 60602(312) 744-9077/4174(312) 744-6798 (fax)Weston.Hanscom(c~,cityofchica~o.orgJason.Rubin(a~cityofchica~o.orgAttorney No. 90909
12
CITY OF CHICAGO, et
of their A
FILE
D D
ATE:
6/2
1/20
19 6
:51
PM
2016
CH
1548
9

CERTIFICATION
On this day,luly 6t", 2018, under penalties as provided by law pursuant to Section 1-109 of the
Code of Civil Procedure, the undersigned certifies that the answers to Interrogatories asset forth in this
document are true and correct to the best of his knowledge, information and belief.
,~:~
Stefan Schaffer
Deputy Policy Director for City of Chicago
FILE
D D
ATE:
6/2
1/20
19 6
:51
PM
2016
CH
1548
9
CERTIFICATE OF SERVICE
I, Jason L. Rubin, an attorney, hereby certify that on July 10, 2018, I served the foregoing
DEFENDANTS' RESPONSES TO PLAINTIFFS' FIRST SET OF INTERROGATORIES
on Defendants' counsel by electronic mail sent to Jacob Huebert, jhuebert(c~libertyjusticecentec.org,
Jeffrey Schwab, jschwab(a~libertyjusticecenter.org, Timothy Sandefur,
tsandefurn,~oldwaterinstitute.org, and Christina
13
FILE
D D
ATE:
6/2
1/20
19 6
:51
PM
2016
CH
1548
9

Exhibit B
FILE
D D
ATE:
6/2
1/20
19 6
:51
PM
2016
CH
1548
9
HOW AIRBNB SHORT-TERM RENTALS EXACERBATE..., 10 Harv. L. & Pol'y...
© 2019 Thomson Reuters. No claim to original U.S. Government Works. 1
10 Harv. L. & Pol'y Rev. 229
Harvard Law & Policy ReviewWinter, 2016
Student Note
Dayne Lee a1
Copyright © 2016 by the President and Fellows of Harvard College; Dayne Lee
HOW AIRBNB SHORT-TERM RENTALS EXACERBATE LOSANGELES'S AFFORDABLE HOUSING CRISIS: ANALYSIS ANDPOLICY RECOMMENDATIONS
I. INTRODUCTION
Los Angeles, California, is in the midst of an affordable housing crisis. Rents have increased by 7.3% in 2014 alone, and
the median renting household already spends 47% of its income on housing. 1 This crisis has added fuel to the contentiousdebate over Airbnb, a startup technology company that facilitates short-term rentals (STRs) of residential homes totourists. Whereas Airbnb and its users tout its positive effects on tourism, cultural exchange, and the environment,its critics contend that Airbnb harms neighborhoods, distorts the housing market, undermines labor unions, andexacerbates Los Angeles's affordable housing crisis. In regulating Airbnb, policymakers seek to curb Airbnb's impacts
on neighborhood character and housing while harnessing the economic activity it brings. 2
Employing legal, statistical, and secondary source analysis, this article explores how STRs affect the price and aggregatesupply of affordable housing rentals in Los Angeles, and how municipal policymakers can best regulate Airbnb. InSection I, I briefly outline the contours of Los Angeles's affordable housing crisis, and describe Airbnb and its growthin Los Angeles. The topics of Section II are the effects that STRs have on rents and Los Angeles's aggregate supplyof affordable housing. Section III of this article analyzes how and to what extent Airbnb leads to displacement,gentrification, and segregation in Los Angeles's residential neighborhoods. In Section IV, I assess strategies, regulations,and policies that municipal policymakers and stakeholders can use to regulate Airbnb. Finally, in the Conclusion, Irecommend a set of regulations, taxes, and community-benefits agreements that will force Airbnb to be a partner thatpromotes, rather than impedes, the goals of affordable housing advocates.
*230 Airbnb likely reduces the affordable housing supply by distorting the housing market in two interconnectedmechanisms. The first such mechanism is one of simple conversion: any housing unit that was previously occupied bya city resident, but is now listed on Airbnb year round, is a unit that has been removed from the rental market andhas essentially been added to Los Angeles's supply of hotel rooms. This leads to a real, but likely mild, increase incitywide rents, an effect that is concentrated in affluent or gentrifying neighborhoods along the city's central core. Moredisconcertingly, conversion reduces Los Angeles's already-limited supply of affordable housing. The second mechanismis “hotelization.” So long as a property owner or leaseholder can rent out a room on Airbnb for cheaper than the priceof a hotel room, while earning a substantial premium over the residential market or rent-controlled rent, there is anoverpowering incentive to list each unit in a building on Airbnb rather than rent to Los Angeles residents, thereby creating“cottage hotels.” This decreases the supply of housing and spurs displacement, gentrification, and segregation.
FILE
D D
ATE:
6/2
1/20
19 6
:51
PM
2016
CH
1548
9
HOW AIRBNB SHORT-TERM RENTALS EXACERBATE..., 10 Harv. L. & Pol'y...
© 2019 Thomson Reuters. No claim to original U.S. Government Works. 2
These two mechanisms distort the rental housing market, which traditionally does not overlap with the hospitalitysector. Tourists stay in hotels that are specifically permitted for and developed in commercially zoned neighborhoods.Residential housing is zoned and built through a wholly different process. Airbnb facilitates the inappropriate mergingof the residential and tourist markets on an unprecedented scale, and unlike with a shortage of, say, shoes or oranges,neither the market nor the public sector can swiftly replace the housing units that Airbnb removes from the marketplace.Thus, city officials regulating Airbnb--and regulating STRs generally--must address conversion and hotelization head on.
As detailed in Section IV and the conclusion of this article, policymakers should pursue targeted bans and regulations thatdiscourage conversion and hotelization. A simple tax on STRs alone will likely be insufficient to fund the replacementof converted units, and may serve to further incentivize hotelization. In exchange for Airbnb's cooperation withenforcement, city officials could allow Airbnb to participate directly in expanding the hospitality market.
A. Background: Los Angeles's Affordable Housing Crisis
Los Angeles, California, has become America's least affordable rental housing market. In 2014, the average renter in Los
Angeles County 3 paid *231 $1,716 per month. 4 And within the city, where most residents rent, the median renting
household earned less than $40,000 and spent 47% of its income on housing. 5 One in two middle-income families and
nine in ten families from the bottom income quintile are rent burdened, spending at least 30% of their income on rent. 6
The city's affordability crisis has developed because of declining real wages, population growth, and zoning policies that
favor single-family and luxury housing. 7 The foreclosure crisis of 2010 exacerbated the affordability crisis by pushing
over 100,000 former homeowners into the rental market. 8 At the same time, wealthier residents repopulated the city core,
rapidly gentrifying low-income immigrant enclaves such as Chinatown and Highland Park. 9 As a result, rents increased
by 7.3% in 2014 alone. 10 Over the past decade, 143,000 market-rate apartments that were once “affordable” (meaningthat rent constituted 30% or less of a resident's monthly income) to families earning under $44,000 per year became
unaffordable. 11
Los Angeles's public housing infrastructure is ill equipped to protect low-income renters. Experts consider the city's RentStabilization Ordinance (RSO) to be weaker than comparable regulations in San Francisco or New York, largely becauseits 3% cap on annual rent increases does not apply to units built after 1978, and because it does not prevent landlords from
exceeding the cap in between tenancies. 12 California's Ellis Act exempts from local rent control provisions landlordswho purchase a rent-controlled unit from a prior owner, provided that the prior owner is selling in order to exit the
business. 13 As neighborhoods gentrify, evictions of RSO-protected tenants rose by 235% in 2014 as landlords sold theirprotected units to commercial developers, who are in turn exempted from rent control obligations *232 pursuant to
the Ellis Act. 14 Meanwhile, the Section 8 voucher waitlist has been closed for nearly a decade due to limited funding. 15
City officials have been similarly unable to increase the stock of affordable housing. Since 2006, the city has been able to
build only a fifth of the 5,300 affordable units that Los Angeles needed to add each year. 16 This is largely because fundinghas plummeted; the Los Angeles Affordable Housing Trust Fund fell from $100 million in 2008 to just $19 million in2015, while $1.7 billion in state funds have been cut from the California Redevelopment Agency and the Community
Development Block Grant program. 17 For renters, an affordability crisis is the downside to Los Angeles's ubiquitoustaquerias, Korean barbeque restaurants, and perennial beautiful weather.
B. Airbnb and the Short-term Rental (STR) Phenomenon
FILE
D D
ATE:
6/2
1/20
19 6
:51
PM
2016
CH
1548
9

HOW AIRBNB SHORT-TERM RENTALS EXACERBATE..., 10 Harv. L. & Pol'y...
© 2019 Thomson Reuters. No claim to original U.S. Government Works. 3
Los Angeles's affordability crisis has developed alongside the transformation of its tourism sector by STRs--rentals ofentire apartments to tourists for fewer than thirty days--arranged through Airbnb. A pair of art students founded Airbnb
in 2008 to help travelers bypass expensive hotels and gain local experiences by “couch surfing” with strangers. 18 Touristsuse the Airbnb website or mobile application to browse and reserve accommodations in a city or neighborhood of theirchoice; instead of staying at a hotel or motel, a tourist can “couch surf” with, or rent an empty apartment from, a strangerin another city during their vacation.
For “hosts,” Airbnb is a platform through which apartment owners or lease-holders can rent out anything from a spare
living room couch to entire apartment units, with Airbnb collecting “host service” 19 and “guest service” fees from
each transaction. 20 On its platform, Airbnb allows both hosts and tourists to exchange pictures of the units, “review”apartments and guests on a five-star system, communicate privately, and securely exchange money.
*233 Now worth thirteen billion dollars, Airbnb is among the most lucrative poster-children of the so-called“sharing economy,” in which technology companies circumvent business regulations and well-established competitors
by facilitating direct, peer-to-peer exchanges of goods and services. 21 Similar cottage-scale rentals have been possiblesince the dawn of the Internet, but Airbnb's unique success stems from its secure and exceptionally well-designed website,and from its users' positive experiences.
Airbnb has transformed Los Angeles's hospitality industry. In 2014, Los Angeles city residents listed 11,401 units on
Airbnb, including 7,316 whole-unit STRs. 22 By comparison, Los Angeles has 97,000 hotel rooms, though these are
dispersed throughout the county. 23 Approximately 135,000 of the forty-five million tourists to visit the city in 2014
stayed in an Airbnb unit. 24
Airbnb reports that in 2014, it generated $314 million in economic activity in Los Angeles, and that by redistributing
revenue from corporate hotels, it helps everyday Angelenos cope with rising rents and economic instability. 25 Airbnbtouts its positive effects on cultural exchange, and 37% of surveyed guests state that they would not have been able to
travel to Los Angeles for as long a period of time without the service. 26 Finally, Airbnb presents home-sharing as a
sustainable, energy-efficient, and environmentally conscious alternative to hotels. 27
But criticism of Airbnb's business practices has mounted at a rapid pace. The Venice Neighborhood Council contendsthat STRs are illegal because they blatantly violate zoning codes banning sub-thirty-day rentals in residential or
multifamily zones. 28 Hosts' neighbors allege that rowdy tourists undermine public safety. 29 And unions and hotelscomplain that Airbnb unfairly competes with hotels by avoiding occupancy taxes and zoning laws, skirting public health
regulations, and undercutting unionized hotel workers by connecting its hosts with independently contracted cleaners. 30
Los Angeles's “Airbnb economy” does not match the idyllic image Airbnb promotes, in which artistic, youngprofessionals couch surf from Los *234 Angeles to New York to Madrid, exchanging apartments through Airbnb withtheir fellow travelers. In practice, 64% of Airbnb listings in Los Angeles are for STRs of units that are never occupied by
their owners or leaseholders, and operate year-round essentially as independent, unlicensed hotel rooms. 31 Chances are,an apartment booked through the service is managed by a full-time investor or company that also owns or leases dozens
of other Airbnb listings. 32 Such companies contract in bulk with decorators and cleaners, manage reservations, and
negotiate above-market rent leases with building landlords in exchange for the privilege of renting units out on Airbnb. 33
Airbnb's emergence has significant political and policy implications for Los Angeles's tourism sector, sustainabilityefforts, and labor movement. As a bona fide cultural phenomenon, Airbnb has galvanized opposition among
FILE
D D
ATE:
6/2
1/20
19 6
:51
PM
2016
CH
1548
9

HOW AIRBNB SHORT-TERM RENTALS EXACERBATE..., 10 Harv. L. & Pol'y...
© 2019 Thomson Reuters. No claim to original U.S. Government Works. 4
neighborhood organizations, labor unions, and affordable housing advocates. Yet it has also mobilized a groundswellof support from hosts and guests alike. The narrow focus of this article, however, is the effects that Airbnb STRs haveon Los Angeles's affordable housing market.
II. AIRBNB INCREASES RENTS, INCENTIVIZES HOTELIZATION, AND REDUCES THE AFFORDABLEHOUSING STOCK
An Airbnb-affiliated economist claims that Airbnb is a scapegoat for broader economic trends in Los Angeles, and that
it has increased monthly rents by just six dollars over five years. 34 Rental pricing is certainly a complicated topic, butthere is a simple underlying dynamic between STRs and the rental market. Tourists and renters are non-overlappingpopulations with different needs, traditionally served by non-overlapping markets. But because 64% of its listings areSTRs for tourists, Airbnb brings an increasing number of the forty-five million tourists who visit Los Angeles each year
into direct competition with renters, distorting the housing market. 35
Each apartment or home listed year-round on Airbnb is a home that has been removed from the residential housingmarket and added to the city's aggregate stock of hotel rooms; I label this phenomenon “conversion.” So long asa property owner or leaseholder can earn a substantial premium from Airbnb rather than renting to city residents,there is an overpowering incentive to “hotelize” entire buildings, further reducing the aggregate housing *235 stock.Compounding these market distortions, neither the market nor the public sector can swiftly replenish the housing stock,given the time, cost, and legal barriers to developing affordable housing in Los Angeles. In light of this basic dynamic,the following sections detail how this market-mixing function raises rents and reduces the supply of affordable housingin Los Angeles.
A. Airbnb Increases Rents in Neighborhoods with a High Density of Airbnb Listings
Airbnb listings are concentrated in just seven of the city's densest, most expensive neighborhoods: Venice, Downtown,
Miracle Mile, Hollywood, Hollywood Hills, Echo Park, and Silver Lake. 36 These tourist destinations account for nearly
half of Airbnb listings, and 69% of all Airbnb-generated revenue in Los Angeles. 37 In 2014, rents in these neighborhoods
were 20% higher, and increased 33% faster, than rents citywide. 38
*236 FIGURE 1:
RENTAL HOUSING AVAILABILITY IN TOP 7 AIRBNB NEIGHBORHOODS 39
NEIGHBORHOODPOPULATION
(2010)
% OF
RESIDENTS
THAT RENT
RENTERS
(ESTIMATE)
AVG.
HOUSEHOLD
SIZE
VACANCY
RATE
TOTAL UNITS
(ESTIMATE) 40
AIRBNB
WHOLE UNIT
LISTINGS
Venice 40,885 68.80% 28,128 1.9 4% 15,422 882
Downtown 34,811 93.40% 32,413 1.6 4% 21,168 220
Miracle
Mile
6,197 59% 3,656 2.5 3% 1,508 543 41
Hollywood 85,489 92.40% 78,992 2.1 3.50% 38,979 646
FILE
D D
ATE:
6/2
1/20
19 6
:51
PM
2016
CH
1548
9

HOW AIRBNB SHORT-TERM RENTALS EXACERBATE..., 10 Harv. L. & Pol'y...
© 2019 Thomson Reuters. No claim to original U.S. Government Works. 5
Hollywood
Hills
22,988 46.50% 10,689 1.8 3.50% 7,154 315
Echo Park 43,832 76% 10,689 3 3.50% 11,507 230
Silver Lake 32,890 64.30% 21,148 2.3 3.50% 9,528 268
Totals 267,092 78.04% 208,440 104,266 3,104
*237 Figure 1 shows that 3,104 whole-units are listed on Airbnb in these neighborhoods, which have a rental stock of
104,265 units. 42 To the extent that whole-unit STRs are listed throughout the year, as much as 3% of the apartmentsin these districts--which have a low 3.5% vacancy rate--have been removed from the market and converted to touristaccommodations. This distortion is particularly acute in beachside Venice, where, according to one study, 12.5% of the
neighborhood's apartments are listed on Airbnb. 43
In tight housing markets with near-zero vacancy rates, a sudden reduction in supply naturally increases rents, particularlybecause neither the market nor the public sector can swiftly add to the housing stock. Unlike with most commodities,a shortage in housing supply cannot be ameliorated by importing or quickly building additional units. Assuming that agiven neighborhood permits and can physically accommodate the construction of new housing, building an average unitof rental housing in Los Angeles requires an investment of $315,000, three years just for permitting, and additional time
for construction. 44 Thus, a sudden removal of between 3% and 12.5% of a neighborhood's housing stock constitutesa supply shock.
The price effect of a supply shock in Los Angeles is compounded by annual increases in residential demand, and by theupward pressure that the allure of STR profits puts on property values, which in turn affect property taxes and rents.Even under a simple economic model holding the demand for rental housing constant against a relatively flat supply
curve that has a price-elasticity coefficient of 0.200, each 1% decrease in supply would lead to a 0.2% rent increase. 45
Under this model, the rent on a $2,680 one-bedroom apartment in Venice would increase by an additional sixty-seven
dollars per month from the reduction in local supply alone. 46
In addition to a supply-related rent increase, the market could be affected by demand pressures from the allure of STRprofits, and from accelerated *238 inflation at the tail-end of the distribution in a housing market with near-zerovacancies. Put simply, a renter in an Airbnb-saturated neighborhood seeking to occupy one of the handful of availableapartments is no longer bidding against the local residential rent price, but is instead bidding against the extra profitthat STRs can bring.
By incentivizing the conversion of residential units to tourist housing, Airbnb causes a small, but notable, increase incitywide rents. In the neighborhoods with the greatest concentration of Airbnb listings, this rent-increasing effect is muchgreater; Airbnb accounts for a significant portion of the accelerated rent inflation seen in neighborhoods such as Veniceand Silver Lake.
B. Airbnb Reduces Supply by Encouraging Illegal Conversion, Hotelization, and Evictions
In addition to causing a small increase in rents, Airbnb substantially reduces Los Angeles's aggregate supply of housing.Thus, as residents bid for a smaller number of available units, an increasing number of residents are priced out of theirneighborhoods, or even the city, entirely. The phenomenon of “hotelization” accelerates this process. Airbnb createsa strong incentive for property owners and renters to permanently “hotelize” entire buildings by renting each unit to
FILE
D D
ATE:
6/2
1/20
19 6
:51
PM
2016
CH
1548
9
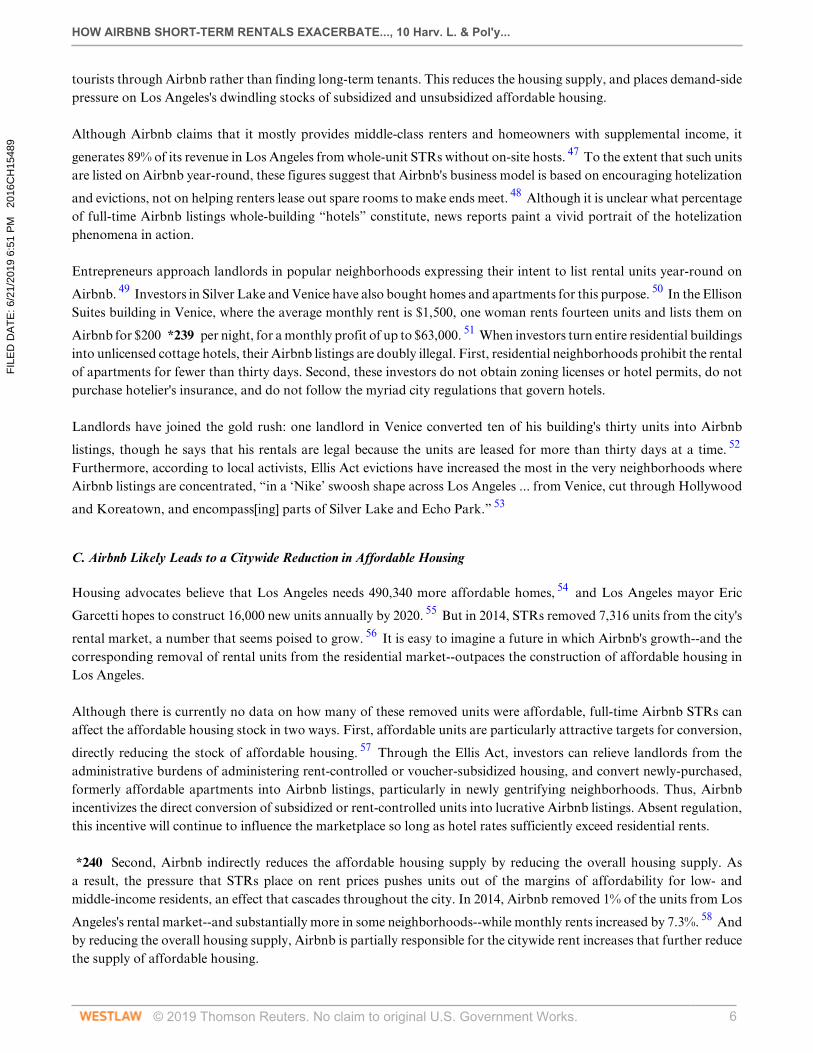
HOW AIRBNB SHORT-TERM RENTALS EXACERBATE..., 10 Harv. L. & Pol'y...
© 2019 Thomson Reuters. No claim to original U.S. Government Works. 6
tourists through Airbnb rather than finding long-term tenants. This reduces the housing supply, and places demand-sidepressure on Los Angeles's dwindling stocks of subsidized and unsubsidized affordable housing.
Although Airbnb claims that it mostly provides middle-class renters and homeowners with supplemental income, it
generates 89% of its revenue in Los Angeles from whole-unit STRs without on-site hosts. 47 To the extent that such unitsare listed on Airbnb year-round, these figures suggest that Airbnb's business model is based on encouraging hotelization
and evictions, not on helping renters lease out spare rooms to make ends meet. 48 Although it is unclear what percentageof full-time Airbnb listings whole-building “hotels” constitute, news reports paint a vivid portrait of the hotelizationphenomena in action.
Entrepreneurs approach landlords in popular neighborhoods expressing their intent to list rental units year-round on
Airbnb. 49 Investors in Silver Lake and Venice have also bought homes and apartments for this purpose. 50 In the EllisonSuites building in Venice, where the average monthly rent is $1,500, one woman rents fourteen units and lists them on
Airbnb for $200 *239 per night, for a monthly profit of up to $63,000. 51 When investors turn entire residential buildingsinto unlicensed cottage hotels, their Airbnb listings are doubly illegal. First, residential neighborhoods prohibit the rentalof apartments for fewer than thirty days. Second, these investors do not obtain zoning licenses or hotel permits, do notpurchase hotelier's insurance, and do not follow the myriad city regulations that govern hotels.
Landlords have joined the gold rush: one landlord in Venice converted ten of his building's thirty units into Airbnb
listings, though he says that his rentals are legal because the units are leased for more than thirty days at a time. 52
Furthermore, according to local activists, Ellis Act evictions have increased the most in the very neighborhoods whereAirbnb listings are concentrated, “in a ‘Nike’ swoosh shape across Los Angeles ... from Venice, cut through Hollywood
and Koreatown, and encompass[ing] parts of Silver Lake and Echo Park.” 53
C. Airbnb Likely Leads to a Citywide Reduction in Affordable Housing
Housing advocates believe that Los Angeles needs 490,340 more affordable homes, 54 and Los Angeles mayor Eric
Garcetti hopes to construct 16,000 new units annually by 2020. 55 But in 2014, STRs removed 7,316 units from the city's
rental market, a number that seems poised to grow. 56 It is easy to imagine a future in which Airbnb's growth--and thecorresponding removal of rental units from the residential market--outpaces the construction of affordable housing inLos Angeles.
Although there is currently no data on how many of these removed units were affordable, full-time Airbnb STRs canaffect the affordable housing stock in two ways. First, affordable units are particularly attractive targets for conversion,
directly reducing the stock of affordable housing. 57 Through the Ellis Act, investors can relieve landlords from theadministrative burdens of administering rent-controlled or voucher-subsidized housing, and convert newly-purchased,formerly affordable apartments into Airbnb listings, particularly in newly gentrifying neighborhoods. Thus, Airbnbincentivizes the direct conversion of subsidized or rent-controlled units into lucrative Airbnb listings. Absent regulation,this incentive will continue to influence the marketplace so long as hotel rates sufficiently exceed residential rents.
*240 Second, Airbnb indirectly reduces the affordable housing supply by reducing the overall housing supply. Asa result, the pressure that STRs place on rent prices pushes units out of the margins of affordability for low- andmiddle-income residents, an effect that cascades throughout the city. In 2014, Airbnb removed 1% of the units from Los
Angeles's rental market--and substantially more in some neighborhoods--while monthly rents increased by 7.3%. 58 Andby reducing the overall housing supply, Airbnb is partially responsible for the citywide rent increases that further reducethe supply of affordable housing.
FILE
D D
ATE:
6/2
1/20
19 6
:51
PM
2016
CH
1548
9
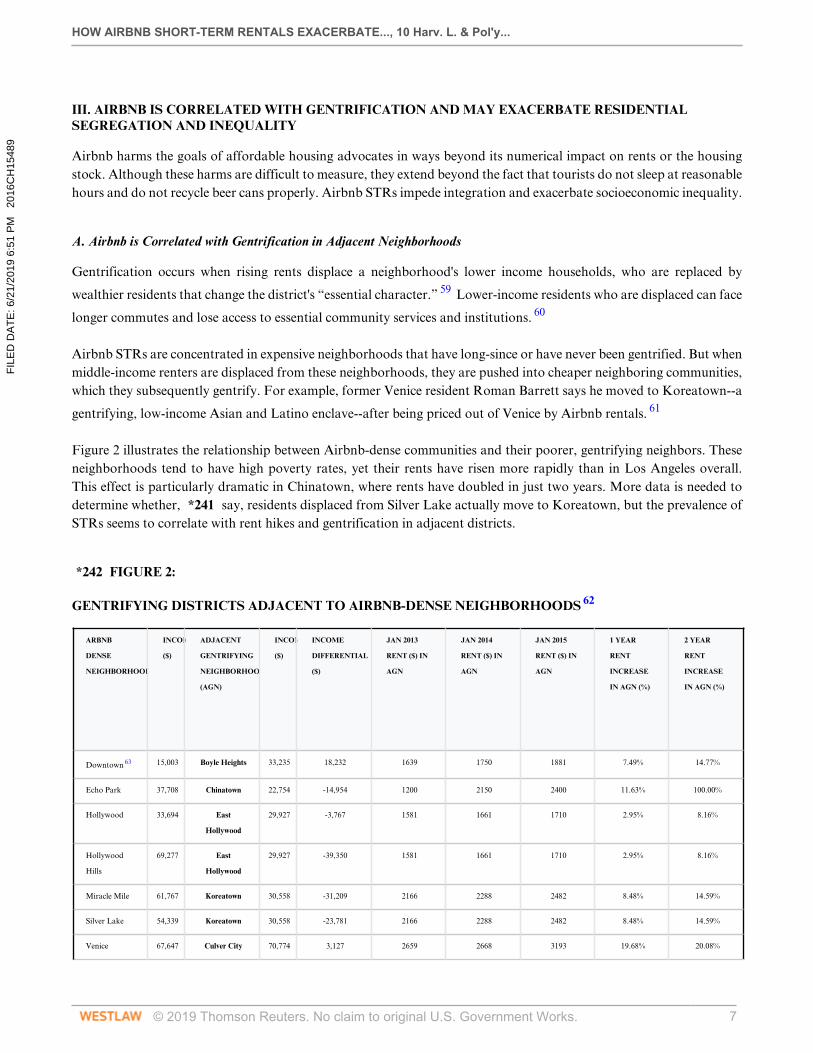
HOW AIRBNB SHORT-TERM RENTALS EXACERBATE..., 10 Harv. L. & Pol'y...
© 2019 Thomson Reuters. No claim to original U.S. Government Works. 7
III. AIRBNB IS CORRELATED WITH GENTRIFICATION AND MAY EXACERBATE RESIDENTIALSEGREGATION AND INEQUALITY
Airbnb harms the goals of affordable housing advocates in ways beyond its numerical impact on rents or the housingstock. Although these harms are difficult to measure, they extend beyond the fact that tourists do not sleep at reasonablehours and do not recycle beer cans properly. Airbnb STRs impede integration and exacerbate socioeconomic inequality.
A. Airbnb is Correlated with Gentrification in Adjacent Neighborhoods
Gentrification occurs when rising rents displace a neighborhood's lower income households, who are replaced by
wealthier residents that change the district's “essential character.” 59 Lower-income residents who are displaced can face
longer commutes and lose access to essential community services and institutions. 60
Airbnb STRs are concentrated in expensive neighborhoods that have long-since or have never been gentrified. But whenmiddle-income renters are displaced from these neighborhoods, they are pushed into cheaper neighboring communities,which they subsequently gentrify. For example, former Venice resident Roman Barrett says he moved to Koreatown--a
gentrifying, low-income Asian and Latino enclave--after being priced out of Venice by Airbnb rentals. 61
Figure 2 illustrates the relationship between Airbnb-dense communities and their poorer, gentrifying neighbors. Theseneighborhoods tend to have high poverty rates, yet their rents have risen more rapidly than in Los Angeles overall.This effect is particularly dramatic in Chinatown, where rents have doubled in just two years. More data is needed todetermine whether, *241 say, residents displaced from Silver Lake actually move to Koreatown, but the prevalence ofSTRs seems to correlate with rent hikes and gentrification in adjacent districts.
*242 FIGURE 2:
GENTRIFYING DISTRICTS ADJACENT TO AIRBNB-DENSE NEIGHBORHOODS 62
ARBNB
DENSE
NEIGHBORHOOD
INCOME
($)
ADJACENT
GENTRIFYING
NEIGHBORHOOD
(AGN)
INCOME
($)
INCOME
DIFFERENTIAL
($)
JAN 2013
RENT ($) IN
AGN
JAN 2014
RENT ($) IN
AGN
JAN 2015
RENT ($) IN
AGN
1 YEAR
RENT
INCREASE
IN AGN (%)
2 YEAR
RENT
INCREASE
IN AGN (%)
Downtown 63 15,003 Boyle Heights 33,235 18,232 1639 1750 1881 7.49% 14.77%
Echo Park 37,708 Chinatown 22,754 -14,954 1200 2150 2400 11.63% 100.00%
Hollywood 33,694 East
Hollywood
29,927 -3,767 1581 1661 1710 2.95% 8.16%
Hollywood
Hills
69,277 East
Hollywood
29,927 -39,350 1581 1661 1710 2.95% 8.16%
Miracle Mile 61,767 Koreatown 30,558 -31,209 2166 2288 2482 8.48% 14.59%
Silver Lake 54,339 Koreatown 30,558 -23,781 2166 2288 2482 8.48% 14.59%
Venice 67,647 Culver City 70,774 3,127 2659 2668 3193 19.68% 20.08%
FILE
D D
ATE:
6/2
1/20
19 6
:51
PM
2016
CH
1548
9

HOW AIRBNB SHORT-TERM RENTALS EXACERBATE..., 10 Harv. L. & Pol'y...
© 2019 Thomson Reuters. No claim to original U.S. Government Works. 8
Los Angeles
Average
$49,497 $2,321 $2,362 $2,534 7.28% 9.18%
*243 B. Airbnb Might Reduce Integration by Displacing Lower-income Tenants
Economic and racial neighborhood integration can lead to a range of positive educational, vocational, and healthoutcomes for low-income tenants. But Airbnb reduces neighborhood integration by incentivizing hotelization,
encouraging Ellis Act conversions of rent-controlled units, and driving out lower-income renters. 64 Furthermore, somelandlords of buildings protected by the city's Rent Stabilization Ordinance choose to list vacant units on Airbnb rather
than deal with the eviction and rent protections that a full-time tenant would enjoy. 65
Because Airbnb STRs are such a nascent phenomenon, further research is needed to measure Airbnb's impact on annualchanges in racial and economic diversity in high-demand neighborhoods. Researchers should also track the displacementof lower income residents from neighborhoods where Airbnb listings are prevalent.
C. Unequal Access to Airbnb Exacerbates Racial and Socioeconomic Inequality
Airbnb creates winners and losers; it facilitates cultural exchange and provides economic benefits to hosts and tourists,but distributes these benefits unequally. Hosts need an Internet connection and cultural savvy just to access the platform.And the fact that just seven of Los Angeles's most expensive neighborhoods, in which approximately 8% of the city'sresidents live, generate over two thirds of the city's Airbnb revenue suggests that there is little tourist demand for STRs
in lower- and middle-income neighborhoods. 66
According to Airbnb, 38% of its hosts are of low-to-moderate income, and more than half are renting out couches
and spare bedrooms. 67 But these hosts only make 11% of the city's Airbnb-supported income. 68 Instead, largescale
operators reap the lion's share of the revenue; 6% of Airbnb hosts list multiple units, earning 35% of all Airbnb revenue. 69
One such company, Global Homes and Condo, lists seventy-eight units on Airbnb through a pair of friendly, but fake,
“front” women. 70 These figures suggest that whereas individual “hosts” set their rates based on the value of theirapartments, commercial Airbnb operators set their prices against prevailing hotel prices, leading to profits for operatorsand Airbnb alike.
*244 In addition, although most Airbnb STRs blatantly violate city laws prohibiting sub-thirty-day apartment rentals,landlords seem to enforce these laws more diligently against renters--particularly those with rent-controlled or subsidized
housing--than against apartment or condo owners. 71 It would probably be unfair for publicly subsidized tenants toprofit from listing STRs on Airbnb. But the benefits of Airbnb overwhelmingly accrue to relatively wealthy renters andproperty owners, not to average Angelenos.
Finally, Airbnb is based on an amorphous “trust” and “sense of community” endemic to the sharing economy, a trust thatextends only to some social groups. A recent study found that African American hosts earn 12% less than white hosts for
equivalent rental listings. 72 And minority guests are systematically denied lodging by Airbnb hosts. 73 If Airbnb hostsare offering a public accommodation, minority Airbnb guests may even have a prima facie case against Airbnb hosts fordiscrimination in violation of the Fair Housing Act of 1968, which prohibits refusal to rent to a person on the basis of a
protected class, such as racial minorities. 74 Airbnb facilitates systemic discrimination and reduces racial integration.
FILE
D D
ATE:
6/2
1/20
19 6
:51
PM
2016
CH
1548
9
HOW AIRBNB SHORT-TERM RENTALS EXACERBATE..., 10 Harv. L. & Pol'y...
© 2019 Thomson Reuters. No claim to original U.S. Government Works. 9
IV. REGULATING AIRBNB TO PROMOTE EQUITABLE HOUSING
A. Criteria for Evaluating Proposals: Solutions Must Address All Problems
Because Airbnb STRs are a new and rapidly growing phenomenon, local and state lawmakers and regulators are just
beginning to deal with this problem. 75 The author's view is that Los Angeles should prioritize the housing needs ofresidents over the needs of tourists when the two aims conflict. However, there are ways to harness the benefits of Airbnb,while regulating it so that it promotes affordable housing, integration, and equity in Los Angeles. But, any policy reformsmust directly address the distortive effects that conversion and hotelization have on affordable housing.
Ideally, STR regulations should address as many of Airbnb's negative effects on affordable and fair housing as possible.Ideally, they would also address the underlying causes of Los Angeles's housing crisis, including the *245 lack of fundingfor developing affordable housing. Before signing on to a deal, policymakers and community stakeholders should askwhether a proposal:
1. Addresses and combats neighborhood and city-wide rent increases;
2. Reduces or adds to the city's market-rate and affordable housing stock;
3. Discourages the “conversion” of existing affordable units into STR listings;
4. Eliminates incentives that encourage “hotelization” of rental units;
5. Protects residents from displacement and eviction;
6. Addresses cultural and economic gentrification;
7. Exacerbates socioeconomic disparities or increases access to Airbnb's benefits;
8. Promotes socioeconomic integration.
B. Evaluating Mayor Garcetti's Plan to Tax STRs in Order to Fund Affordable Housing
On April 16, 2015, Mayor Garcetti announced a deal he had proposed to Airbnb. Under his proposal, Los Angeles
would levy a 14% occupancy tax on all Airbnb facilitated rentals. 76 This is expected to generate at least $5 millionannually, although this static projection does not take into account expected increases or tax-induced decreases in Airbnb
FILE
D D
ATE:
6/2
1/20
19 6
:51
PM
2016
CH
1548
9

HOW AIRBNB SHORT-TERM RENTALS EXACERBATE..., 10 Harv. L. & Pol'y...
© 2019 Thomson Reuters. No claim to original U.S. Government Works. 10
activity. 77 These funds would be allocated each year to Los Angeles's Affordable Housing Trust Fund, which has been
reduced from $100 million in 2008 to just $19 million in 2015. 78
Without taking matching funds into account, $5 million could fund the development of sixteen affordable units at an
average cost of $315,000 per unit. 79 However, Airbnb rentals remove 7,316 units--which does not include units that arelisted only intermittently on Airbnb--year-round from Los Angeles's rental market. Even if Airbnb stops expanding, itwould take 457 years for occupancy taxes to fund the full replacement of the units that Airbnb removes from the city'srental market. To use another rough calculation, a single studio apartment in Silver Lake that is booked on Airbnb foran average of $132 per night at a remarkable 60% rate--219 days a year-- *246 yields $28,908 for its host, generating
$4,047 in occupancy tax revenue for Los Angeles each year. 80 Such a unit would take seventy-eight years to fund theconstruction of its own replacement.
This may not be an apples-to-apples comparison because Airbnb should not shoulder the entire burden of replacing aconverted unit of affordable housing when, presumably, an affordable housing developer would recoup its costs throughtenants' rent payments. Take, then, the hypothetical Silver Lake apartment in the paragraph above and assume that it wasan affordable unit of housing for a median-income city resident. Perhaps it would be reasonable at least to expect STRtaxes to cover the costs of construction during the period that Airbnb leaves Silver Lake with one fewer unit of housing.
Assume that a developer spends four years building (three years of permitting, one year of construction) a unit ofaffordable housing in Silver Lake, and that the unit will be habitable for fifty years. At a cost of $315,000, the unit will costthe developer $6,300 per year in construction costs alone over the 50-year period. If Airbnb was responsible for coveringthe costs of four years of construction, it would still have to generate $25,200 in taxes over four years, requiring a dailytax rate of 21.8%. The back-of-the-envelope calculations in this hypothetical demonstrate the complications involvedin trying to fund the replacement of converted or hotelized units of housing through an occupancy tax on STRs. Anoccupancy tax of 14% might be insufficient to meet Mayor Garcetti's stated policy goals.
Furthermore, Garcetti's plan would not address gentrification or rent increases in neighborhoods where Airbnb listingsare prevalent. And depending on where new units are built, it is unclear whether the neighborhoods most affected byAirbnb would benefit from new housing construction. After all, the city may build in lower-income neighborhoodsthat offer taxpayers a better “bang for your buck” than Venice or Silver Lake. This could concentrate poverty, anddecrease economic integration in affluent neighborhoods, unless the funds were used to fund mixed-use or affordabledevelopments in higher income neighborhoods at higher cost to the Trust Fund.
Garcetti's plan may spread demand and help lower income and minority hosts. But this could backfire by contributing togentrification in those neighborhoods, especially if taxes push STR demand into the already gentrifying districts adjacentto the neighborhoods that are popular on Airbnb. One final concern is that such a deal would formally excuse Airbnbfrom a wide range of liability, from safety-related issues to STR regulation. Legalization may also spur STR growth.And Garcetti should specify how his plan would address evictions, illegal conversions, and discrimination by Airbnbhosts and renters during the time period when replacement housing is being constructed.
*247 C. Evaluating Alternative Tax and Redistribution Schemes
Mayor Garcetti's plan directly addresses Los Angeles's affordable housing shortage, but might not replace the units thatAirbnb removes from the rental market. Allocating STR taxes to construct affordable housing also does not addresssegregation and gentrification. There may be more effective ways to tax and redistribute the revenue that STRs generate.
The city can be ambitious about tax rates and tax Airbnb at a rate higher than the 14% occupancy fee levied on licensedhotels. As a matter of policy, it is desirable that the brunt of any taxes levied on Airbnb would be borne by two relatively
FILE
D D
ATE:
6/2
1/20
19 6
:51
PM
2016
CH
1548
9
HOW AIRBNB SHORT-TERM RENTALS EXACERBATE..., 10 Harv. L. & Pol'y...
© 2019 Thomson Reuters. No claim to original U.S. Government Works. 11
wealthy populations: tourists and property owners. Furthermore, whereas hotel guests are ostensibly paying for cityservices with their taxes, Airbnb guests could also be paying to replenish the housing stock. If Airbnb tourists are lookingto avoid paying a premium to stay in hotels, Los Angeles could tax hosts to any extent such that the price of an Airbnbis less than the price of an equivalent hotel room without de facto banning STRs. Although there are political limits totax levels, officials need not set a 14% pre-negotiation upper tax limit on Airbnb listings.
Los Angeles could promote economic diversity and integration by directing tax revenue towards a municipal housingvoucher program, which would increase economic integration. And if these vouchers were given to low-income residentsof Airbnb-dense buildings or neighborhoods, it would allow them to stay in their homes. However, like Mayor Garcetti'splan, such taxation and redistribution schemes may not be able to replace all of the units that Airbnb removes from theresidential market. Other measures are necessary to complement these tax schemes and promote integrated, affordableneighborhoods throughout Los Angeles.
D. Evaluating a Ban or Targeted Restrictions on Airbnb STRs
STRs increase rents for residents and reduce the supply of affordable housing by removing units from the housing marketthrough conversion and hotelization. Given Los Angeles's low vacancy rate, it is likely that thousands of residents havebeen displaced due to the 7,316 year-round listings on Airbnb. On the other hand, Airbnb's economists claim that in
2014, Airbnb helped add $314 million in economic activity and 2,600 jobs to Los Angeles's economy. 81 Although thisdoes not take into account losses to renters and other community stakeholders, it is plausible that Airbnb simultaneouslyproduces economic benefits while exacerbating the city's affordability crisis. This article approaches the issue of Airbnbfrom the lens of weighing its effect on Los Angeles's affordable housing crisis, and is not an attempt to quantitativelymeasure the net economic gains or losses produced by Airbnb. Policymakers seeking to regulate Airbnb must make botheconomic and *248 value-driven decisions in order to weigh the importance of promoting affordable housing.
A blanket ban on STRs would end Airbnb's role in exacerbating Los Angeles's affordability crisis. For residents displacedby Airbnb, a blanket ban would likely be preferable to any solution that insufficiently addresses the corrosive effects ofSTRs. Enforcing anti-STR laws could also halt the evictions, displacement, and gentrification that follow when Airbnbsaturates a neighborhood. That said, a ban would not add to Los Angeles's affordable housing stock itself, and woulddeprive the city of Airbnb's benefits. Furthermore, bans that deprive property owners of Airbnb's benefits implicateConstitutional protections for property owners under the three-pronged Penn Central takings test, which assesses: (1) theeconomic impact of a regulation on affected parties, (2) the extent to which a regulation frustrates investor expectations,
and (3) the extent to which a regulation is tailored to promote general welfare or is arbitrary. 82
Property law scholar Jamila Jefferson-Jones suggests that New York's anti-STR regulations may violate legitimateinvestor-backed expectations, and are not “roughly proportional,” meaning that the severity of existing laws banningSTRs are not commensurate to the value of the regulations: protecting public safety, hotels, and neighborhood property
values. 83 However, Professor Jefferson-Jones's analysis underestimates the public's legitimate interest in protecting
affordable housing. 84 These arguments demonstrate how outright bans may become increasingly untenable givenAirbnb's prevalence. At the moment, however, most of the STRs listed on Airbnb in Los Angeles's residential and mixed-use (business and residential) zones are illegal.
Alternatively, city officials could legalize STRs but place targeted restrictions on them rather than enforce the existingblanket ban. Such an approach could reasonably prevent Airbnb from distorting the housing market while allowingtourists and residents to benefit from it. However, such a strategy would have to address conversion and hotelization,or otherwise ameliorate Airbnb-induced reductions in affordable housing supply.
FILE
D D
ATE:
6/2
1/20
19 6
:51
PM
2016
CH
1548
9

HOW AIRBNB SHORT-TERM RENTALS EXACERBATE..., 10 Harv. L. & Pol'y...
© 2019 Thomson Reuters. No claim to original U.S. Government Works. 12
For example, enforcement agencies could choose to target unlicensed hotels and prevent hotelization. Perhaps purchasersof property could be banned from using Airbnb for a one-year “cool-down” period. This would put a check on pricehikes and discourage hotelization. Such a ban would protect the existing affordable housing stock. However, such arequirement may invite scrutiny under the investor expectations prong of the Penn Central test where investors, prior toenactment of the rule, bought a building for the purpose of hotelization. But the city can assert that the restriction is *249necessary to prevent public nuisances and protect the affordable housing stock. And because it would not constituterent control, a cool-down requirement would not trigger the intervention of the Ellis Act if a purchased property waspreviously rent-controlled.
Similarly, policymakers could discourage “conversion” by prohibiting landlords who have evicted a tenant withoutfault--meaning that the tenant is not evicted for violating his or her lease--from listing the unit in question on Airbnbfor a one-year cool-down period. This cool-down period can be imposed on all landlords, or just landlords of subsidizedunits. Either approach would discourage wanton conversion of rental stock into tourist accommodations.
Another approach would be to assign STR permits and restrict the number of permits per square mile or neighborhood.However, geographically targeted restrictions on STRs would be difficult to enforce, and it would be difficult toadminister a permit system that is equitable to all prospective hosts. Furthermore, this might encourage the spreadof STRs into newly gentrifying neighborhoods. For example, such a policy could restrict the culling of Echo Park'saffordable housing supply while exacerbating the affordability crisis in neighboring Chinatown.
Another solution would be to mandate that Airbnb STRs be allowed only in buildings that meet a target affordabilitythreshold. For example, the city could promote inclusionary housing by only allowing STRs in neighborhoods orbuildings where 30% of the units are affordable, which would incentivize property owners to subsidize apartments thatare currently priced at the market rate in order to “free up” units for Airbnb listings. This would directly address STRs'effects on neighborhood socioeconomic integration. But such solutions would be cumbersome to calculate and difficultto enforce. Furthermore, such a benchmark may be considered exactions that are not roughly proportional to the actual
affordability and public safety problems that STRs create. 85 Finally, such an approach would increase the stock ofaffordable housing, but simultaneously reduce Los Angeles's overall stock of residential housing.
Lastly, city officials could prevent hotelization by legalizing STRs, but limiting the number of days per year that ahost can list a unit without going through the hotel permitting process. This would disincentivize the conversion andremoval of units from the housing market, protect the housing stock, and tamp down speculation and rent inflation.Such an approach would be subject to an investor-backed expectations takings challenge, but the city could argue thatthe limitation is necessary to protect the residential housing stock.
Should Los Angeles decide to adopt some sort of enforcement strategy towards Airbnb, policymakers should empowerregulators to enforce zoning and hotel licensing laws. Regulations on Airbnb STRs are municipal in nature, concerningissues such as zoning and hotel licensing. California counties *250 have not coordinated to regulate STRs on a countyor statewide basis. Although Los Angeles has not committed resources to enforcing STR laws, the City Attorney's office
has asked hosts to pay occupancy taxes. 86 But it is unclear whether these warnings were symbolic or whether the City
Attorney has the resources to enforce these laws. 87
Policymakers should empower regulators to enforce zoning and hotel licensing laws. Although resources are limited,this should be a priority given the havoc that STRs wreak on the residential housing market. And rather than targetingsingle-unit hosts, regulators can target the cottage industry of “Airbnb leasing companies” that are rapidly removing
units from the rental housing market, thereby discouraging hotelization. 88
FILE
D D
ATE:
6/2
1/20
19 6
:51
PM
2016
CH
1548
9
HOW AIRBNB SHORT-TERM RENTALS EXACERBATE..., 10 Harv. L. & Pol'y...
© 2019 Thomson Reuters. No claim to original U.S. Government Works. 13
Perhaps taxes can fund enforcement officers or a regulatory body within the city planning department. In the absenceof a new regulatory agency, Airbnb should at least make it possible for the city to track STRs and crack down on themost egregious activities. Perhaps hosts who post listings more than once a month--which indicates that a host hasconverted a unit--should have to register with the city. Los Angeles should also crack down on large-scale operatorswho manage “virtual hotels” with multiple rooms across the city. And investors should be prevented from convertingentire buildings into cottage hotels. Airbnb's cooperation is critical to any effective enforcement scheme that preventsconversion and hotelization. Perhaps city officials can negotiate with Airbnb and exchange greater cooperation withtargeted enforcement efforts for a general legalization of noncommercialscale STRs.
E. Promote Affordable and Fair Housing Through Community Benefits Agreements
In addition to regulating and taxing Airbnb, Los Angeles should adopt the community benefits agreement (CBA) model
that local industries have negotiated with unions and affordable housing advocates. 89 Under a typical CBA, developersof large projects are given tax credits and the permission to build lucrative developments such as luxury apartments,malls, or sports stadiums in exchange for a commitment to hire local residents, set aside affordable housing, or donate to
public projects. 90 So too here, policymakers, advocates, unions, and developers would come together and bring Airbnb
in as a partner, helping Los Angeles's low-income and minority communities share in Airbnb's benefits. 91 92
*251 First, Airbnb should ban racially discriminatory hosts and users and make the approval process race-blind. Airbnbcould also use its platform, market penetration, and technology to connect hosts with cleaning services that pay livingwages. Additionally, Airbnb could apply its proprietary technology to help low-income renters find low-cost or publichousing.
Airbnb and developers could also be given incentives to concurrently expand the supply of housing and the supply oftourist accommodations, removing tourists from the residential housing market. Developers could be given permits toconstruct sanctioned “Airbnb hotel” apartments in neighborhoods with a high density of Airbnb listings. Qualifyingnewly constructed buildings could be exempt from the bans, taxes, or restrictions on STRs that would govern existingresidential housing. These permits could be contingent upon Airbnb or the developer signing a CBA that ensures workers
are fairly paid, and require that at least 15% of a hotel's units be rentcontrolled or subsidized for low-income residents. 93
The remaining units could be rented at market-price, or listed on Airbnb. An even better ratio of “hotel” units toaffordable residential units would be one that directs hotel developers to reserve as many affordable units as possiblewhile earning market-rate returns. In any combination, an “Airbnb hotel” would directly expand the affordable housingstock, expand the aggregate housing stock, increase Los Angeles's supply of hotel rooms, and promote integration.
V. CONCLUSION: REFORMING STRS TO ADDRESS THE HOUSING CRISIS
As gentrification transforms Los Angeles's urban core, policymakers must adapt to better regulate new technologies suchas Airbnb. The best regulation comes from precise data, so additional research is needed on how STRs affect evictionsand rents. To an extent, Airbnb is a response to, not a cause of, gentrification and Los Angeles's affordable housing crisis.But policymakers must understand that Airbnb profits from illegal rentals that cause rent increases, reduces the housingsupply, and exacerbates segregation. Even an outright ban on STRs would be better for low-income residents than theunregulated status quo. Airbnb must become a responsible partner and facilitate, not hinder, the goals of affordablehousing advocates.
In preparing to negotiate with Airbnb, Los Angeles can learn from the approaches that other cities have taken toregulate Airbnb. San Francisco, Chicago, and Washington, D.C. negotiated with Airbnb lobbyists to legalize STRs and
apply hotel occupancy taxes to STRs. 94 Aside from New York, *252 policymakers have avoided suggesting outright
FILE
D D
ATE:
6/2
1/20
19 6
:51
PM
2016
CH
1548
9

HOW AIRBNB SHORT-TERM RENTALS EXACERBATE..., 10 Harv. L. & Pol'y...
© 2019 Thomson Reuters. No claim to original U.S. Government Works. 14
bans, perhaps because Airbnb has mobilized grassroots support and formed sophisticated lobbying and advocacy
organizations. 95 Airbnb spent $100,000 in 2014 alone to lobby Los Angeles officials. 96
After proposing and evaluating various reforms, my recommendation is that Los Angeles adopt a three-pronged strategy.First, the city should prevent the hotelization and conversion of existing residential buildings and units of housing.Airbnb provides a tremendous benefit to tourists and residents alike when it allows tourists to travel off the tourist-beaten path. Such adventures are a win-win for hosts who are merely using Airbnb for a month per year to subsidizetheir own travels, or who are using Airbnb to earn enough money to keep their home after losing a job.
But given the inelasticity of the housing supply, it is inappropriate for investors to permanently remove units from theresidential housing stock in order to cater to tourists. Fundamentally, I would argue that the raison d'être of Los Angeles'shousing stock is to serve its residents. Thus, Los Angeles should ban year-round listings of apartments on Airbnb andsimilar websites, perhaps by emulating San Francisco's proposed “Ballot Measure F” and setting a seventy-five-day limit
on the number of days that a unit can be listed. 97 Bona fide homeowners or leaseholders who occasionally host gueststhrough Airbnb can be exempted from any taxes that would otherwise be levied on STR transactions.
Furthermore, Los Angeles should institute a one-year cool-down period before any formerly subsidized or rent-controlled home can be listed on Airbnb. To prevent hotelization and professional Airbnb management, Los Angelesshould set a hard cap on the number of units that any individual or business can list on Airbnb in a given year. Finally,Los Angeles should set a hard cap on the number of units in a building that property owners and managers can liston Airbnb.
In order to incentivize developers and Airbnb itself to build additional affordable and market-rent housing, Los Angelesshould apply these restrictions to existing residential buildings and units, but allow newly-developed building managersand owners to set aside a greater number of units for STRs. The city can also grant additional exemptions for developerswho set aside newly-constructed units for low-income residents, thereby directly increasing the affordable housing stockand promoting economic integration. Along this line, the city can bring developers, unions, advocates, and Airbnb--theparent company--together to sign Community Benefits Agreements. The parties can agree to build “Airbnb hotels” intourist destinations *253 that set units aside for low-income residents, provide good jobs, and ban discrimination.
Finally, Los Angeles should implement a 14% occupancy tax on any unit that is listed on Airbnb for greater than theseventy-five-day cap mentioned above. This would prevent Airbnb hosts from gaining an unfair competitive advantageover hotels. The city can allocate this revenue towards code enforcement, and for funding mixed-income housing inAirbnb-dense neighborhoods, thereby promoting integration and preventing displacement.
Airbnb is organizing constituents and mobilizing political support. 98 This is why political stakeholders must regulateAirbnb STRs now, before the industry calcifies into Los Angeles's political and economic structure. At the moment,local politics are favorable to increased regulations. Unions and neighborhood associations have united with their
political adversaries--hotels and developers--to speak out against Airbnb. 99 By framing the public narrative around thedisplacement that STRs cause, regulators can also win the support of influential faith leaders, as well as of the public.If the city brings Airbnb together with community stakeholders, the city can eliminate Airbnb's corrosive effects on fairand affordable housing, and help all communities benefit from safe, integrated, and affordable neighborhoods.
Footnotes
FILE
D D
ATE:
6/2
1/20
19 6
:51
PM
2016
CH
1548
9

HOW AIRBNB SHORT-TERM RENTALS EXACERBATE..., 10 Harv. L. & Pol'y...
© 2019 Thomson Reuters. No claim to original U.S. Government Works. 15
a1 J.D. Candidate, Harvard Law School (expected 2017). The author gratefully acknowledges professors Rick Su and EsmeCaramello, as well as Eloise Lawrence for their advice regarding this article. He thanks the dedicated Harvard Law & PolicyReview editors for their thoughtful editing and comments.
1 See Los Angeles Home Prices & Values, ZILLOW (Sept. 30, 2015), http://www.zillow.com/los-angeles-ca/home-values/ [http://perma.cc/J82K-A3F3]; Rosalie Ray et al., Impacts of the Widening Divide: Los Angeles at the Forefront of the Rent BurdenCrisis, UCLA LUSKIN SCHOOL OF PUBLIC AFFAIRS CENTER FOR THE STUDY OF INEQUALITY, Sept. 2014,at 8, http://issuu.com/csiucla/docs/ziman_2014-08w/1 [http://perma.cc/P4GH-KFHW].
2 See, e.g., Steven Leigh Morris, Airbnb is Infuriating the Neighbors. Is it Time for New Rules?, LOS ANGELES WEEKLY(Jan. 22, 2015), http://www.laweekly.com/news/airbnb-is-infuriatingthe-neighbors-is-it-time-for-new-rules-5343663 [http://perma.cc/4JG2-KAJM].
3 Los Angeles is a city located within the County of Los Angeles, California. Approximately one-third of Los Angeles Countyresidents live within Los Angeles. Unless stated otherwise, the statistics and neighborhoods referenced in this article refer tothe city of Los Angeles, not the overall county. County-wide statistics are used as they are here when cityspecific statisticsare unavailable.
4 Richard K. Green et al., 2014 USC Casden Multifamily Forecast, USC LUSK CENTER FOR REAL ESTATE, Feb. 2014,at 12, http://lusk.usc.edu/sites/default/files/2014-USC-CasdenMultifamily-Forecast.pdf [http://perma.cc/AM24-EN57].
5 Ray, supra note 1, at 8.
6 Id. at 9 (citing US Census American Community Survey data from 2009-2011).
7 Id. at 6, 13.
8 How Los Angeles County's Housing Market Is Failing to Meet the Needs of Low-Income Families, CALIFORNIA HOUSINGPARTNERSHIP COALITION REPORT, May 2014, at 2, http://www.chpc.net/dnld/Housing_Need_LA_Final_060414.pdf[http://perma.cc/7BVZ-TCXT].
9 See, e.g., York & Fig, AMERICAN PUBLIC MEDIA (2014), http://yorkandfig.com [http://perma.cc/UYK9-RA46]; see alsoinfra Fig. 2.
10 See ZILLOW, supra note 1.
11 Ray, supra note 1, at 8 (acknowledging that the authors' affordability benchmark is 30% of income).
12 See Economic Study of the Rent Stabilization Ordinance and the Los Angeles Housing Market, LOS ANGELES HOUSINGDEPARTMENT, 2009, at 8-9; see also Ben Bergman, Has Rent Control Been Successful in Los Angeles?, SOUTHERNCALIFORNIA PUBLIC RADIO, (Sept. 12, 2014), http://www.scpr.org/news/2014/09/12/45988/la-rent-has-rent-control-been-successfulinlos-an/ [http://perma.cc/H5G3-P24R].
13 California Ellis Act of 1985, Cal. Gov't Code § 7060.7 (West).
14 Leo Duran, Ellis Act Evictions in L.A. on the Rise, SOUTHERN CALIFORNIA PUBLIC RADIO (Apr. 24, 2015), http://www.scpr.org/news/2015/04/24/51256/ellis-act-evictions-in-l-a-ontherise/ [http://perma.cc/N8XZ-ZAEY] (describing how theEllis Act allows rent-controlled properties to be sold to commercial developers).
15 Ray, supra note 1, at 13.
16 Id.
17 Ben Bergman, Garcetti Wants Airbnb to Help Solve L.A.'s Affordability Crisis, SOUTHERN CALIFORNIA PUBLICRADIO, Apr. 16, 2015, http://www.scpr.org/news/2015/04/16/51042/garcetti-wants-airbnb-to-help-solve-la-s-affordabi/[http://perma.cc/EW8J-L7NC]; CALIFORNIA HOUSING PARTNERSHIP COALITION REPORT, supra note 8.
FILE
D D
ATE:
6/2
1/20
19 6
:51
PM
2016
CH
1548
9

HOW AIRBNB SHORT-TERM RENTALS EXACERBATE..., 10 Harv. L. & Pol'y...
© 2019 Thomson Reuters. No claim to original U.S. Government Works. 16
18 Jessica Pressler, The Dumbest Person in Your Building is Passing Out Keys to Your Front Door! The War over Airbnb GetsPersonal, NEW YORK MAGAZINE (Sept. 23, 2014), http://nymag.com/news/features/airbnb-in-new-york-debate-2014-9/[http://perma.cc/4ZYVCMRX].
19 What are Host Service Fees?, AIRBNB, https://www.airbnb.com/help/article/63/whatarehost-service-fees [http://perma.cc/Q24Q-7AMJ].
20 Brittany McNamara, Airbnb: A Not So Safe Resting Place, 13 COLO. TECH. L.J. 149, 151 (2015).
21 Molly Cohen & Corey Zehngebot, What's Old Becomes New: Regulating the Sharing Economy, BOSTON BAR JOURNAL(Apr. 1, 2014), http://bostonbarjournal.com/2014/04/01/whats-old-becomes-new-regulating-the-sharing-economy [http://perma.cc/NN7V-HPU2].
22 Roy Samaan, Airbnb, Rising Rent, and the Housing Crisis in Los Angeles, LAANE (Mar. 2015), http://www.laane.org/wp-content/uploads/2015/03/AirBnB-Final.pdf [http://perma.cc/MTJ4-DLJA].
23 Hugo Martin, Lacking Sufficient Lodging, L.A. Tourism Growth, L.A. TIMES (Apr. 13, 2014), http://www.latimes.com/business/la-fi-tourism-wars-20140423-story.html [http://perma.cc/5CZ6-G25J].
24 David Owens, Positive Impact of Home Sharing in Los Angeles, AIRBNB (Dec. 4, 2014), http://publicpolicy.airbnb.com/positive-impacts-home-sharing-los-angeles/ [http://perma.cc/B4W3-LCTL].
25 Id.
26 Id.
27 Id.
28 Morris, supra note 2.
29 Id.
30 Samaan, supra note 22, at 15, 22-26.
31 Id. at 8.
32 Adrian Kudler, Meet LA's Most Prolific Airbnb Host with 78 Units for Rent, CURBED LA (Mar. 12, 2015), http://la.curbed.com/archives/2015/03/airbnb_los_angeles_most_prolific_host_ghc.php [http://perma.cc/4WMD-7MXH].
33 Id.
34 Kristen Lepore, Apartment Conversions to Airbnb Hotels Driving Up LA Rents, Critics Say, SOUTHERN CALIFORNIAPUBLIC RADIO (Mar. 16, 2015), http://www.scpr.org/news/2015/03/16/50321/are-apartment-conversions-to-airbnb-hotels-driving/ [http://perma.cc/PF4SKBST].
35 Bergman, Garcetti Wants Airbnb to Help Solve L.A.'s Affordability Crisis, supra note 17.
36 Kudler, supra note 32.
37 Id.
38 Id.
39 Top cities and vacancy rates are from Samaan, supra note 22, at 18. Population and household data are from Mapping L.A.Neighborhoods, L.A. TIMES, http://maps.latimes.com/neighborhoods/ [http://perma.cc/U3XF-FRUM].
40 Estimate: (Estimated Renters / Household Size) / (1 - Vacancy Rate).
41 Miracle Mile STRs estimated from (total units) x (LA average whole unit STR %).
FILE
D D
ATE:
6/2
1/20
19 6
:51
PM
2016
CH
1548
9
HOW AIRBNB SHORT-TERM RENTALS EXACERBATE..., 10 Harv. L. & Pol'y...
© 2019 Thomson Reuters. No claim to original U.S. Government Works. 17
42 Estimated using household size data from Mapping L.A. Neighborhoods, supra note 39.
43 Samaan, supra note 22, at 3. Like the Samaan report, Section II.A of this article assumes that whole-unit listings are listed year-round on Airbnb. However, it is likely that the whole-unit STR figures cited from the Samaan report include some housingunits that are in fact occupied by the owner or leaseholder for most of the year, and are not listed year-round on the service.Such units are not removed from the residential housing market.
44 Cost per unit from California Department of Housing and Community Development, see Affordable Housing CostStudy: Analysis of the Factors that Influence the Cost of Building Multi-family Affordable Housing in California,CAL. DEP'T OF HOUS. & CMTY. DEV. ET AL. 32 (2014), http://www.hcd.ca.gov/housing-policy-development/docs/finalaffordablehousingcoststudyreportwit-coverv2.pdf [http://perma.cc/A98W-WG6T] [hereinafter Affordable Hosuing CostStudy]. See also Ben Bergman, LA Rent Crisis: Why Aren't There More Affordable Apartments?, SOUTHERN CALIFORNIAPUBLIC RADIO (June 12, 2014), http://www.scpr.org/blogs/economy/2014/06/12/16821/la-rent-crisis-why-aren-t-there-more-affordable-ap/ [http://perma.cc/6N8L-Q3UE].
45 See, e.g., John M. Quigley & Steven Raphael, Regulation and the High Cost of Housing in California 26 (Berkeley Program onHousing & Urban Policy, Working Paper No. W04-008, 2004) (finding that the price elasticity coefficient to supply is .360 fornon-rent controlled rental markets). A regression analysis would be needed to specifically determine the Los Angeles housingmarket's price elasticity.
46 See Venice Home Prices & Values, ZILLOW, http://www.zillow.com/venice-los-angelesca/home-values/ [http://perma.cc/87J8-3TJE].
47 Samaan, supra note 22, at 9.
48 The rental of spare bedrooms may also distort the housing market by pushing up prices.
49 Tim Logan, Emily Alpert Reyes & Ben Poston, Airbnb and Other Short-term Rentals Worsen Housing Shortage, Critics Say,L.A. TIMES (Mar. 11, 2015), http://www.latimes.com/business/realestate/la-fi-airbnb-housing-market-20150311-story.html[http://perma.cc/48BRCRFN].
50 Morris, supra note 2.
51 Lepore, supra note 34.
52 Id.
53 Duran, supra note 14.
54 CALIFORNIA HOUSING PARTNERSHIP COALITION REPORT, supra note 8.
55 Plan: Transforming Los Angeles, CITY OF LOS ANGELES 52 (2015), https://d3n8a8pro7vhmx.cloudfront.net/mayorofla/pages/17002/attachments/original/1428470093/pLAn.pdf?1428470093 [https://perma.cc/RW4Q-ZT6D].
56 Samaan, supra note 22, at 3.
57 Id. (describing how trade publications advise landlords on how to convert units to STRs).
58 See ZILLOW, supra note 1. Total number of apartments in LA estimated by dividing census population data by householdsize data from Mapping L.A. Neighborhoods, supra note 39.
59 Maureen Kennedy & Paul Leonard, Dealing with Neighborhood Change: a Primer on Gentrification and Policy Choices,BROOKINGS INSTIT. CTR. ON URBAN & METRO. POLICY, Apr. 2001, at 5.
60 Id. at 22, 43.
61 Logan et al., supra note 49.
FILE
D D
ATE:
6/2
1/20
19 6
:51
PM
2016
CH
1548
9
HOW AIRBNB SHORT-TERM RENTALS EXACERBATE..., 10 Harv. L. & Pol'y...
© 2019 Thomson Reuters. No claim to original U.S. Government Works. 18
62 Income data and adjacent districts were determined from Mapping L.A. Neighborhoods, supra note 39. Rent statistics are fromZillow.com.
63 The Downtown income figure is likely distorted by the high concentration of homeless individuals in “Skid Row.” BoyleHeights residents are likely lower income than Downtown renters.
64 See, e.g., Duran, supra note 14.
65 Samaan, supra note 22, at 12.
66 The population-share of Downtown, Echo Park, Hollywood, Hollywood Hills, Miracle Mile, Silver Lake, and Venicecalculated from Mapping L.A. Neighborhoods, supra note 39.
67 Id.
68 Samaan, supra note 22, at 13.
69 Kudler, supra note 32.
70 Id.
71 See, e.g., Samaan, supra note 22, at 18.
72 Benjamin Edelman & Michael Luca, Digital Discrimination: The Case of Airbnb.com 2 (Harvard Bus. Sch., Working Paper No.14-054, 2014), http://www.hbs.edu/faculty/Publication%20Files/14-054_e3c04a43-c0cf-4ed8-91bf-cb0ea4ba59c6.pdf [http://perma.cc/S6EZABQX]. See also Michael Todisco, Note, Share and Share Alike? Considering Racial Discrimination in theNascent Room-sharing Economy, 67 STANFORD L. REV. ONLINE 121, 122 (Mar. 14, 2015) (discussing the study as proofof pervasive racial bias among Airbnb users).
73 Todisco, supra note 72, at 123.
74 Id. at 126. However, only hosts, and not Airbnb itself, could be held liable.
75 Ben Bergman & Alice Walton, Los Angeles Officials Crack Down on “Sharing Economy” Rides, Rental Companies,SOUTHERN CALIFORNIA PUBLIC RADIO (Dec. 9, 2014), http://www.scpr.org/news/2014/12/09/48569/los-angeles-officials-crack-down-on-sharing-econom/ [http://perma.cc/HA8N-TJTH].
76 Bergman, Garcetti Wants Airbnb to Help Solve L.A.'s Affordability Crisis, supra note 17.
77 Garcetti's Airbnb Tax Plan Does Little to Increase Affordable Housing, S. CAL. PUB. RADIO (Apr. 16, 2015),http://www.scpr.org/programs/take-two/2015/04/16/42416/garcetti-sairbnbtax-plan-does-little-to-increase/ [http://perma.cc/Y8CW-435Z].
78 Bergman, supra note 17.
79 Average cost per Los Angeles County publicly built affordable housing unit from California Department of CommunityDevelopment, see Affordable Hosuing Cost Study, supra note 44, at 31.
80 See Airbnb, https://www.airbnb.com/s/Los-Angeles?neighborhoods%5B%5D=Silver+Lake (last visited Dec. 2, 2015).Occupancy rate figure from Martin, supra note 23.
81 Owens, supra note 24.
82 See Penn Cent. Transp. Co. v. City of New York, 438 U.S. 104, 152-53 (1978).
83 Jefferson-Jones, Airbnb and the Housing Segment of the Modern “Sharing Economy”: Are Short-Term Rental Restrictions anUnconstitutional Taking?, 42 HASTINGS CONST. L.Q. 557, 566-68 (Spring 2015).
FILE
D D
ATE:
6/2
1/20
19 6
:51
PM
2016
CH
1548
9
HOW AIRBNB SHORT-TERM RENTALS EXACERBATE..., 10 Harv. L. & Pol'y...
© 2019 Thomson Reuters. No claim to original U.S. Government Works. 19
84 Pennell v. San Jose, 485 U.S. 1, 13 (1988) (affirming public's right to preserve affordability through measures such as rentcontrol).
85 Jamila Jefferson-Jones, supra note 83, at 568.
86 Bergman & Walton, supra note 75.
87 Id.
88 See, e.g., Kudler, supra note 32.
89 See, e.g., Harold Meyerson, L.A. Story, AMERICAN PROSPECT (Aug. 6, 2013), http://prospect.org/article/la-story-0[http://perma.cc/2J9H-NLB4].
90 Id.
91 Id.
92 If Airbnb signs a CBA with community stakeholders, rather than the city, a CBA would likely not violate the Penn Centralexactions test.
93 This is the same percentage that is required for other developments that seek density bonuses fromthe city. LA Affordable Housing Incentives Guidelines 2014, http://cityplanning.lacity.org/Code_Studies/Housing/DRAFTUPDATEDAffordHousingGuide.pdf [http://perma.cc/ZKJ4-7JUH].
94 Bergman, Garcetti Wants Airbnb to Help Solve L.A.'s Affordability Crisis, supra note 17.
95 Logan et al., supra note 49.
96 See, e.g., Short Term Rental Advocacy Center, http://www.stradvocacy.org/ [http://perma.cc/A996-EWRB].
97 S.F., Cal., Admin. Code § 41.A.4, 41.A.5 (2015), http://sfgov2.org/ftp/uploadedfiles/elections/candidates/Nov2015/ShortTermRentals_Text.pdf [http://perma.cc/LTS4-4RP6].
98 Logan et al., supra note 49.
99 See, e.g., Keep Neighborhoods First, http://www.keepneighborhoodsfirst.com/ [http://perma.cc/6YHE-A7HJ] (coalition oflabor and neighborhood councils).
10 HVLPR 229
End of Document © 2019 Thomson Reuters. No claim to original U.S. GovernmentWorks.
FILE
D D
ATE:
6/2
1/20
19 6
:51
PM
2016
CH
1548
9

Exhibit C
FILE
D D
ATE:
6/2
1/20
19 6
:51
PM
2016
CH
1548
9
ExI".1
lg Home $haring Drlvlng up Rents? Erddencs lrom Alrbnb ln Baston
Mark Merante and Koron Martens Horn
w$nKHG pApEn go| s-03
OEPARTITilTHT OF NCO$OMIS$
ul'lruEn$lTY 0F MA$$ACHU$ETTS B0ST0!{
D000391
FILE
D D
ATE:
6/2
1/20
19 6
:51
PM
2016
CH
1548
9
Is Home Shar:ing Driving Up Rerrts?
Evidence liorn Airbnb in Boston
Mark Merante
UMass lloston, MA Economics 2016
Keren Msfiens Horn
UMass lloston, Assistarrt Professor of Economics
Intraductian
'Ihe growth of the sharing ecclnomy has received increasing attention from economists.
Some researchers have examined how these new business models shape markel
mechanisms (Einav, Farronato and Levin, 2015) ancl, in the case ollhome sharing,
economists have begun to exanrinc how the shad.ng economy affects thc hotel industqy
(Zeras, Froserpio anci Byers, 2016). llowever, cconomists have not y*t empirically
tested whefher irorne sharing af{ects the housing rnalk*t, despile the obvious overlap
bef;vcen these twa maikets. As il result, policy makerg grnppling with the effects cf the
*:pid gl**'th *f h*me shari*g hnve in*dequ*tc informslion on which to nrake r**soned
policy dccisions. In this pap6r! rve adrl to the smail but growing body of knorvledge on
hor.v the sharing economy ie shaping the housing market by focusing on how the growth
of Airbnb in Boston neighborhoocls af'f'ects the rental market.t We exarnine whelher tlie
ini:re;rsing plesflnce of Airbnb rajses askirtg rents and, thcir, exantine whether the charrge
iu rents may bc driven by a decline in'the supply of housing olTered for rent.
I We distinguish the "rental housing mirrkct," housing uccrrpied by or offcrect for rent only fbr nrolc than 30consr:cutivc elays, frorrr thi.: "horre sirorirg in*rke{.," lroun^ing offerr:d lbr reut fbl ns li*le as {ine day,
1
D000392
FILE
D D
ATE:
6/2
1/20
19 6
:51
PM
2016
CH
1548
9

Suirporters of Airbnb argue thal home sharing allorvs residents to eflm extra income,
enabling some to eontinue to live in rapidly appreciating housing markets and delray
othcr costs of living.z Critics of Airbnb claim rhat in largc cities where the majolity of
resitlents are rentem, home sharing is increasing rents 1br tenants.3 In a recent curatecl
debate on this issue hosled by the New York Times, Nicole Celinas of tire Manhatran
Institute argues thal once landlords become aware that tenants use Airbnb to earn
additir:nal income tlrey can qtrickly 'cut out tle middieman' and directly rent out units on
a short term basis.a Both sicles of the argumeni arc Iacking unbiased empiricai evielence
on lhis new markef phenomenon, a g^p that we proposs ro filI.
This paper rnakes tlree primary contributions io the existing econonic literatire. First,
wc prervide lhe first rigorous cmpirical investi.gation af how Air:bnb is affecting the renlal
rnarket, tbcusing on ll$slein, a cily where rents have be*n grcwing rcccnily at *n average
<:f 5t% annrrally and are amorlg the highcst in th* nation.s $cconcl, we eoncluct fhis
invcstigation by combining tlvo new source$ olibig clata: weekly rental lisiings, avail*ble
only r*cenfiy as a r*sull of tlie shift of rental listings to tJre inlernet, and data ort Airbnb
listings rnade available throrigh web scraping technology. "fhird, we take advantage o1'
the fi'eqneticy of thc ohservaiir:ns availahle frorn these large data set* to rrse a fixeel
2 httl:l"$r//www.airbnbaction,com/wp-conlentluploads/\tJ15/fi/Middle-Class-Econotnic-lleport-FlNAI.,pdI:t "5xn lllrincis<'o is grounrl zr':ro liu'an Airbub li'eako*i," l):ivey A.lba, Wired.cotn, Novernbcr 2,2{\15a htqi://r.vww.uyiiriles.corn/roomfbrdtLr,1tt/2011, /A6f 7L' /sa*-{rancisco-nud-:icw-york-rveigh-airl:nbs-r-'ffect*un-rent/airbnb-i:;'a-plobletr-fbr-cities-like-ne'"v^5'or*-ancl-san-{rartciscos btttrt:/ /www.bostounragazirr*.corn/;rrt:rp er ty / ittticle/2*1 6 /AZ /21 lboston-e:pensivcf
Z
D000393
FILE
D D
ATE:
6/2
1/20
19 6
:51
PM
2016
CH
1548
9

effects model to cclntrol ftrr iinobserved variables allowing fclr" the calculation of precise
eslimates of thc impacts of Airbnb on rents.
llhe characteristics of Airbnb listings in lJoston provide sonte evielence supporting both
sides of the Airbnb clcbate. F'or instance, our analysis shovl,s that in Boston on October' {
2AI5,8?oA of hosfs had only one simultaneons listing on Airbnb, suggesting fhat most
Airbnb hosts are occupairts seeking extra incr:me try occasionally r.enting out thcir olvn
homes. On tlre r:{her hand, though only 18% of hosts had multiple properties listed
simuhaneously, thcir properties represented aknost haif of those listed on Ailbnb (46%),
suggesting that a large proporlion of Air"bnb's pruperties in. Boston are leased by
commerciai operators listing proper:tics that would, presumably, otherwise be occupied
by residents. Ultimatel5r, our analysis supporls tlre contention'liraf hone sharing is
increasing rents by deereasing the supply af unifs availabie to potcntial resjdents. Usinr
a hetJorric cstirnuliorr, w.: slrow {liat a oue shndard deviation futcreasc irr Airbu[r listings
reiative to tho total uumbcr erf housing unils in a con$rls trircl, at ihc nrcari 12 Ailbrib
listings psr ffact, is associated with an increase in asking rents of 0.4olo. For those census
tracts in thr: higliesl decile of Airbnb listings rclative to total housirrg nnits, this irrcresse
in asking rent$ rallges fror:r 1.3% ta 3.Io/o, which equates at the ciiywitle mean ffonthly
asking rent to an increase of as tnuch as $93. IJlAirtrnb's gro*'th rate in 2A15,24o/o,
conlinuss for the next llrr'*e yeals, assriruing cotrstant rncan rcnts and total irruxber of
housing unils, Boston's nleiln asking rents in January 2019 woukl [:e as mnch as
$lTtllmclnth highcr than in the'absence of Air:bnb activity; Wc further find evirJence that
Airlrrrli is irrr;rcasirrlr askirq; r'r:lls llrrour{lr its stipltt'essiotr oi'lhe srrl4rly olrcrttal rrrrits
J
D000394
FILE
D D
ATE:
6/2
1/20
19 6
:51
PM
2016
CH
1548
9

offered for rent. Specifically, a one standard dcviation increase in Airbnb listings relative
to totfll housing units is correlated with a 5.9Yo decreuse in the numlrcr of rcntal units
offered for rent. Ai the mean nurnber of rental unifs offered far rent in a given censu$
tract,75.8,lhis equates to 4 fewer: units offered for rent.
lllltis paper proceeds as follorvs. 'I'he following section provides background on horne
sharing and reviews the relevaflt economic literature on rental matkets to provide a
theoretical basis firr this paper's moelel anel merhocl. 'We then discuss theoretical models
that illustrate home sharing's potential eflect on the rental housing supply atrd on asking
renls. Next rve dessribe the mettrod wc use to esiimate these effbcts on rental housing
supply and reirts. In the following section we present the data on Airbnb in Boston and
provide descrilrrive statistics of aur rental housing data. We then prcsent rcsults. F'inally,
we coilcluele and preir.ide thoughts on some of tlre polioy implications of this research.
iSaekground and Li.ter"pture lleview
The internet has enabled the oreation of what has bocome known as the shering econonly,
a host ollfinns based on ihe peer-to-peer busincss moeiel (Finav, Farronato and Levin,
2015i. This model is one f'orm of a two-sidecl market, a tefln coined tc desciibe
businesses which provide a platfonn tc comeet rnsrket participants. Unlike $$ms two-
sided markets, srich as cre<iit card companies, sharing economy platfbnns are intendecl fot:
nonproftssional users {Li, Moreno and Zhang, 2015). One of the most visible
dcmponents of the siraring econoRry in the populat press is home sharing, web-based .
fir:ms that provide a pI*tfbrnr that r;harses i:oth those seeking to lease and those seeking to
4
D000395
FILE
D D
ATE:
6/2
1/20
19 6
:51
PM
2016
CH
1548
9
reni housirlg fbr periods as short as onc niglit.
Irounded in August 2008, Airbnb.com ("Ailbnb") is the largest holne sharing cntctprise
in the rvorld, having hosted more than 60 million guests to date; il currently ftzrtrres ovcr
2 million plcperties for rent in t 91 countries.6 lt is growing rapirlly; in New York City,
for example, tie nunrber of Airbnb listings expanded tenfold frcm 2010 ta2014
(Schneiderrnan,2014) and incleasedby 24% in Boston bolween January 2015 snd
Janua.ry 201.6. Airbnb mar*ets itself to pr:tcntial tenants a$ a way for visitors to have a
more authentic travei expelience by siaying with local resi<lents and to potential lancliords
as a way for lacal resitlents to earn extra incr:me by renting out sor:re or ail of their home
when they're not using it.i :L'he speed with which this and simitar "home sharing"
businesses have changecl consumer be'havior has left lesearchex^*as well as cotupetitors
in the traditional hospitality industry, goveruruenl regulators,s anel coufis*-racing to
turrlcrslar lcl its *ff cr:ts.e
.Res€archcrs irave morleled how the existence of tr straring plalfornr lbr: a good ciranges
bolh llre demancl lor ancl tire supply of that gaod (Muller,2A14; Horlon and Zeektrauser
6 "Atrr:ut us", Airbnb.cam, http:1/wrvrv.airbnb.cnnr/abou/about-ns, lasf visitcd April 20, 2016,7 "Airtrnb l.,aunches First (ilohal Ad Campaign in Ninc Markcts," Advertising Age.
Itlu.IL?{!"as9.,a"q{./a$-is!$1-ddtal/.eirbqb;lq.tr.rysll_e-s.:8i!-o.i2ilktl:csqp4j^g!:i!qrkqt$ /223.}-gW last visited April?0, ?0t{r.B Penclirrg legislation to regulate hornc sharing in MA includc !I ?618, AnAct ReeUlatirttu$-i9.f!:iffry.
Bssd,-$lliel&plxfllse Hnmc slrlring's lcgalit.v vari*s b*{w*eir iurisdictions and relevant confractraI obligtations vary betwceir
buildings, and everr rvithil buildings frorn unit to unit (l,azarol, ?015). Iir i:|oston, sor*e condotniniuntdocurrricnts forbid lcasing units lbr: Jess thau a certain term, oflcn onc month, and the Creater llostan ItealISstntc Boanl's $tandald Funn Apartrnenl Lease (Fixed Tcr-m) furbids sublctling. Despite these legal
hurdl*s, bcrtlr oN,ners and ternnrrts cnlinlic in horne shnriug, as evid<ucerl lry thc many weirsites that alferadvice to ownerr; aucl lunanls sc*hirrg i.,u'rrii:isirrn to Iist or Airl:rrb, inc:lutlirrg Airbnb's rir.vn *itc:
lanri lorcl-about-a irbuh.
5
D000396
FILE
D D
ATE:
6/2
1/20
19 6
:51
PM
2016
CH
1548
9

2A1q. This body of researh posits that some utility maximiziug consuurers who
previously chosc to or,vn the good in the absence of dre sharing narketplace. will choose
instead not to onn the good, but sinrply to lent it as nceded, whcn given that option. Oil
the ather hand, sorne consrrmers lhat had chosen not to owrr the good will now buy it,
given the opportunity to rent clut a portion of if thxrugh lhe sharing marketplace. The net
effect on demard is indeterminaie and dependent on participants' utiiity functions for
these goods. The demand in the rrewly created sharing market create$ its own supply, as
existing goods, either prcviously unutiiized or utilized for other purposes, are olTered into
the netdy created sharing marketplace. In the case of home sharing, to the extent that
sonie of the housing affered in the hoine shar'ing market would have becn of?ercd instead
in fhe housing market, the existence of thc home sharing market will affect both the
denrarrd lbr and the supply of housing. Thercfbre, while tlrese models of the eftbct of the
sharing economy on the iarget market do rrot morlel the specific effects of hosre sharing
a,t flre lrousirig ruaiket, tlrcy irrlirrn huu. lt(ruie sLrariltg rrriglrt al'fcct t]te dcntaucl tbr and
supply of lnrusing. A visitor: looking fur r roonr {br a night or two irr a city she'd lik.e to
visil may choose a home shale rather than a hotel, thereby irnpacting the visiting eity's
hotel ;nril*ei. ln addilion, lhat <i*rnand for a home sharc may cause $ome orvners *f
housing in thaf lo*aliein to shift nnits fi'om thc liousing market to the homs sharing
ln&rket, thereby reducing thc supply of housing.
There has been little empirical research on thc efl-ect of home straring on the housing
markct. A few researchels har.,c atter:rpted to test tiris efi'ect inclirectly. Fartly relying on
A id:nb data th*t is unieliie iy avaiiable lbr: Ncrv Ynr k {lil,y as a result of a Ner.v York
6
D000397
FILE
D D
ATE:
6/2
1/20
19 6
:51
PM
2016
CH
1548
9

Attornel' Ceneral's investigafion, researchers looked l'or sirnple correlations between
Airbnb use and neighborhood mean rents, finding that those neighborhoods with tirc
highest number of Air'bnb listings were oflen those where rents wsre incrcasing fastest.lt)
Munioipal officials in San Francisco estitnated tlre number"of housing units that they
believed had been shifted fiom the housing market to thc home sharing rnarket by
calculating which malket offered the best returu far cach unit, disregarding the non-
monet{uy considerations homer:wners face when chooshg between the two markets, such
as personal convenience, risk of damage, lcgal risks, etc.!l This analysis found a rough
correlation bet"lveen neighborhoods witlr high Airbnb usc and those with tiglit liorising
markets. We hope to confiibute to the literaturc by dir:ectly estimating ths effbct of home
sharing listirrgs on nearby rents.
Though there is little empirical research on tlle home sharing market, there is a broad
lilcratLrrp irr rcal cstalu and urban eot)loruics cxarrrirrirrg clctcrrrtir:alits ol"liousitrg pricc,
both prirchase prices ($lacscr, Cyourka and $aks, 2005; Quiglcy, J. M., & Il.osenth*I, L.
A. (2005); Ihlanfeldt, 2007) and rents {Pagliari, Webb and Lisblich,1996; Ambrose,
Cerulsorr and Y*shicla, XOL5; Verbrugge, I)ordnan, Jolrns*n, M.arsh, Pr:oie and
Shoelrak,er, 2,{}16). Rcse€}rchers typically use hedonic r:e;rrr:ssions to compare the
predictive effect on rcnfs of a variety of uuit characleristics, f}om locatiou to tnit age.
'Ihey have fbund evidence fhat though the ownership and r*nlal rnarkets are corurectcd
(Kashirvagi, Z0l4). homo values adjnst slowly to ciranges in mar*et conditions {Riddel,
'0 "Airl,uh in i.h'C Ilousiulr Rcporl, 2015," Nev,, York i.l*mnrurritici; ft:r (Jhringc. Ri:al Aftaidabilily farAIl, nycrournunities.org.tt Palicy Analysis Repor"t,ISudget and l.egislalive Analyst's Office, lJoard oi Supervisnls, City aud
{,ounty of $an }tr;rnci^,;r:c, May 23, ?015, http:1/*rrr'-.sfbol.org/index.lspx?page"3703,
7
D000398
FILE
D D
ATE:
6/2
1/20
19 6
:51
PM
2016
CH
1548
9

2004), while rental data provicle n mor"e tirnely e:stimate cf the florv price of housing
(Ambrose, Coulson and Yoshida,2Al5). Fligh qualit5, clata on rents has historically ticcn
difficult to obtain, but rvith new sources of big d:rfa on rental markets it is easier to learn
about tlris mar*et scgrnsnt. lLesearchers have firther imploved the tirneliness of this
measurc of the flow pricc of housiug by srrveying only ncwly signecl lcasc contracts,
ratlrer than the traditional surveys of all existing renters (Claescr anti Gyorko,2AA7).
Ambrose, Coulson and Yoshida (2015) fbrurcl that rnoveurents in the u'idely used Bureau
of L.abor Statistics' rent index, which is based on a survey of all rentem, trailed a rent
index based soleiy on new leases with new tenants by about one yeax. Wc build on this
appruacli and use asking rents, which were available at weekly intervals and rvitir precise
geographic coordinates.
Theary
Utiliiy rtaxilnizltion tltcury titctatcs that if thc utility uf llrc orvrrct oi'a rcridcrltiul
housing unit is greater as a result of listing tlic urrit iri thu h<;ni* sharing markct thnn rs a
result of rentirig in the ierng-tenn rentai m;rrkct or l*aving tirc unit unrentcd, the owner
will renr the properly in rhe home sharing market iMr"rller, 20 l4).r2 l l" so, it citn l:e
assurned thaf some po$iott ollthe housing slock listr:el on Ailbrrb i.r'oultl o{herr.vise hav*
been occupied by tenants, fheteby decleasing the supply and increasing the pricc ofthc
rcntal housing units listc<i lbrlrerrt, Similally, this thet:r'y $uggests that orvricls' or:
ienants' expectaticlns of being ablc to earn income by sublelting their uuit through homc
lx.{lc,ng rvith renl, rctrtive: markl't vrilur:* of'thcse irro options rv*uld tnkr: intc irccount lrans;rcrir:n altlope raiir:g costs sucli *r- clcrtnirtg the ulrii, rlept'vuiatiou ll'$rn cxira use, rcsolvirig dispules, etc., ns rvcll as theih. charged by a reutnl broker or by the markctplacc, in th,is cascr, Ailbnb. Wc call thc residential real estafca tl*usin;z unit, cvcrr thoLigh $om* spaccs listcd ,:n Airbnb are rfit111s. noi rvhole units.
B
D000399
FILE
D D
ATE:
6/2
1/20
19 6
:51
PM
2016
CH
1548
9

sharingll wili increase the demand for long tenn rentai housing.la Some owners or
tcnants will obtain housing in cxcess of the anonnt that rvould have:naxjmized their
utility in the abserrce of the home sharing rnarket and will value units based on the units'
peiceived marketability in the horne sharing market,
Our hy:othesis is that the existence of the homc sharing mat'ket operates either firough
changes in the demand fbr or in the supply of housing, or likely both, to decrease the
supply of rental unit-s listed fbr rent and, thereby, to increase the asking rents of available
uniB.l5 In a partial equilibriurn competitive model of rental ltousing, either the rightward
shift of the demand eiuve f.br rental housing caused by the potential to earn income from
listing a unif rvith a home sharing site or the leftward shilt of the supply curve for reutaL
housing causeci by orvnels' r'smoval of son:e units fronr the rental housing ntarket ftrr rent
in the hcme sharing market incre*ses tlre trrriee of lrousing, ceteris paribtrs.
Modelilig the effecr of houre sharing on moan re.sidential asking rents, lhei'efi:tc, r*quires
changing one of tire assumptions comntonly usecl by housing econornisl.s to siucly the
effbcts *i rl*rnanrJ variation on price : that hcnsing srq:ply chauges so slowly {hat it can hc
assr;nrer.l to be static when strrdying shcff-term el'fects (ltlank and Winnick, I953). The
emelgcnce of the hotne sharing rnar*et iepresents a significant nelv source oI'short-tetn
13 in the case of tenants, they would be cr:n*idcring either listing a porlion ol'lhc unit, or listitrg all of thc
unit when thcy arc nrvay.14 I'lris pot*niial demanri effcci is lrof h:iviol: itr Ncrv York City, fcr instati*e, Airbr.rb estimalcs tlrlrt a tvpii:al
lrost's arrnual earnings fronr using the scrvice is cquivnlent lo21Yo ol. the rent due for thc unit listeti
(Laearorv,20l5). '
't An itur.,:as<r in tlrc clcrnnnd for re nt:,rl holsing mty decreast thc nutttbE:r olrenlal utri{:s ofl'erc(l {ur rcnt trv
dccrcasing ol elirtrinating th* pi:riod a.nnil r'eurljns on tfutl llr,rrket. Whcrc, ari herc, fire nunr'bi:r r"rf uttifs
offered lor rent is tncasured wcckly, a shorter tirnc on the niarket reduc.es th* toial mulfi-rvcek count o1'
units ofi'crcd {'or rertt"
9
D000400
FILE
D D
ATE:
6/2
1/20
19 6
:51
PM
2016
CH
1548
9
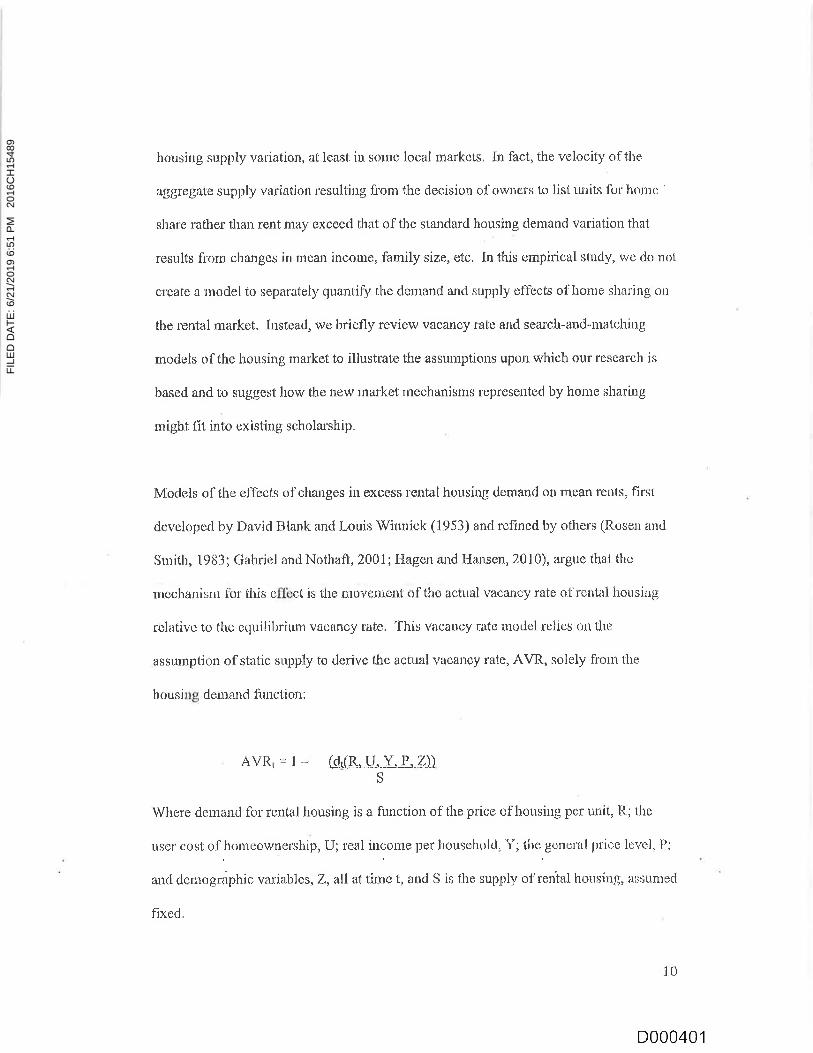
housing supply variation, at lcast in sorne local markeis. In fbct, the velocity of the
*ggregate supply variation resulting fiom the decisir:n of owners to list units for hon:c '
share ruthei'than rent may exceecl fhat of the standard lrorising dernand variation that
results fi'om changes in mean income, family size, etc. In this empirical studv, we do not
crcafe a model to separately quantify the dentand and supply el'fects of hcxre sharing on
the rental market. Instead, we briefly review vaoancy rate and search-and-rnatchiug
models of the housing market to illustrate the assumptions upon which our researph is
based and to sugE;est how the new nrarket rnechanisrns reprcsented by horne sharing
might fit into existing scholarship.
Models of the effects of chauges in excess rental housing demand on mean rents, fit'st
developed by David tliank and l-ouis Winnick (1q53) and rellned by others (Rosen and
Smith, 1983; $abriel andN*thafl.2001; Hagen and Hansen,2.0l0), atgue that the
rnochariisrrr 1'or tiris cll'cct is the nrovcrttetit of itrc actrtal vacancy ratc of rctttal liottsing
rclstive t<; thc cquilibriurn vacrincy rate. This vacanr:y rate m*del rclies on tlte
assumptir:n of static supply to derive the actual vacarlcy rate, AVR, solely fiorn the
housir.rg demand frurction:
AVR.* 1* G{&-U._L3"4))S
Where demanel for rental housing is a function of tire price r:f housing per unil, R; rhe
user ccst of liomeorvnership. U; real itrcotne per househerlcl, li; tlre,genelnl price level, P;
arrcl ciemographic variablcs, Z, all at tilne t, a:rd S is f.h.e supply of rrni*l housitrg. assumeci
fixed.
1U
D000401
FILE
D D
ATE:
6/2
1/20
19 6
:51
PM
2016
CH
1548
9
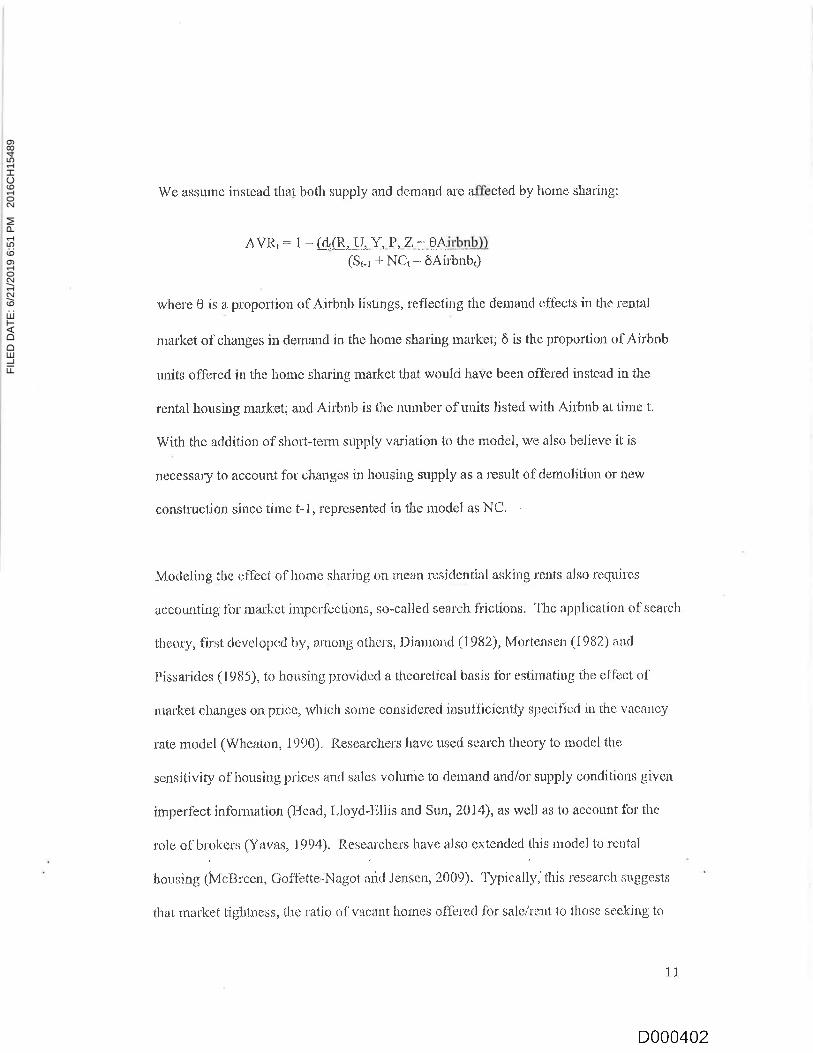
We assumc instead tha! trr:th supply and demand ar* affected by horne sharing:
Avltt: I * (drG*fl.Y, P", Z.i-:-0-Airt:r!)(St-r +NCt-6Airbnb1)
where 0 is a prnporl.ion of Airbnb iistings, reflecting the demand effects in the rcntal
market cl'changes in dernand in the home shaling market; 6 is the proportion of Airbnb
units offered in the home sharing market that would have been ofl'er:ed instcad in rhe
rental housing market; and Ailbnb is fhe nunrber of uaits listed with Airbnb at tinle t.
With the addition of shr:f-tem supply variation to the model, we also believe it is
fieeessary to account for changcs in housing supply as a result of demolition or new
conslrucl.ion since titne t-I, represented in the model as NC.
Moclcling the *ffuct of Imms sharing on nlean residcntial asking rents also requircs
aeeounting ibr narkct irnperfeciions, sr:-called searc4r fi{ctions. 'I'hc applicatiori of search
thcory, {irst dcvcloped by, amoi}g ot}rels, Diamc;tid (1982i, Mortensen (1982) ancl
Pissaricles ( 1985), to honsing provielccl a theor"efical basis lbr estimatitig rhe ei'fect of
nrark'et changes on pric*, qrhich some considered insufficiently speciiiccl in thc v.lcltlloy
ratc mcdel (Whearern, 1990). Il,esearchers have used search theory to rnodel the
sensitirrify of housing prices and sales volume to rjemand and/or supirly conditions given
imperfbct infamration (Flead, l,loyd-Ellis and Sun, 7A14), as well as to account fbl thc
role of brilkels (Yavas, 1994). Researchers hav* arlso exterldod this model tcr rettal
h6rising (McBreen, Goffette-Nagot arid Jensen, ?009). 'fypically,'this research suggests
thar markei tiglrtncss,llre ratir: o{'vacant honrcs offerecl fclr sale/tent to tltosc seching to
11
D000402
FILE
D D
ATE:
6/2
1/20
19 6
:51
PM
2016
CH
1548
9
buy/rcnt, is one of thc mechanisms through rvhich clemand or supply changes affect price
(Novy-Marx, 2009). A decrease in tirc nnmber of hon:es offerecl fur salelrent, r'elative to
the nurnber of individuals seeking to buy/rent, fol example, increases the rate of matching
for sellem/lanrJ.lords and decreases th* rate of matching fbr buyerx/reirters, In this wfiy, an
increase in market tightriess puts upward prossurc on price. A.gain, we believe hone
sharing increases malket tightness botli by decreasing the numbet of homes offered for
rent, as units rue shifted ltom tire rental to the home sharing market, and by increasirtg the
housing demanded as a result of the income cpporlunity ofiered by honre sharirrg.
MethodoloEXt
We are interestecl in estimating the impacts of Ailbnb on both rcnts and ihe nurnber of
grtal units available f:or rent, to see whether if Airbnb affects rents, nlight it do so by
con:;trzrining t1re supply of av*ilable rental units. We creste a meastu* of'Al*nh
'dermity' lbr each c$n$t$ lr"act in l3ostou, by dividing lJre nurnber af Air'bnb listirrgs in a
ceilsus tr-act by the tot*l nluuber of lrousirig rinits itt lhat census tract, "fhis apltroach
frrlloin s that of Susin (2002) anci Sinai and Waldfr:gcl (2005) as they examine the itnpacts
of public reni*i housiug sribsidies on the private rental marhet. in this way wc &re
cnnlrolliag {br clifl'br*lces between tracts irt bnth popul*tion arxl the rental hr:rusirrg
markel.
Resealchcrs examining both housing supply and price changes have utilizecl many
ciifferellt geogr:aphies. Wiile solrrc re$earclters kroking at thd elfect of vacancy rate$ ol1
renis belween *if.ics r*ly cin r:iryrvidc ria{a, lho:ii: exarnining iniracity effe*f;s olLcn
17.
D000403
FILE
D D
ATE:
6/2
1/20
19 6
:51
PM
2016
CH
1548
9
compars neighborhoods, and define 'neiglrtrorhoods' to match availablc demographic,
price,vacancy or other data (I)ow, 2011; Fujii, Hozumi, Iida and Tsutsumi, 201.2).
f irough some have argued that neighborhoods, as measured by census tracts, maybe be
ioo small a geography ai rvhich to measure the l'ull matket response to a supply consttaint
(Giaeser and Ward, 2009; Sinai and Waldfcrgel, 2005) we choose to foctts on the censu$
tract to better identif,i the imrnediate impacts of Airbnb, urulerstancling that it may not
capture the full impact. In addition, recent researchers havc fuund prics impacts of
housing demand or supply changcs at relatively small geographies such as census tracts
ancl have ascribed this to the now widespread use of the intemet for hr:me search
(Piazzesi, lJchneider and Stroebel, ?015). They believe intemet home search allows
buyers or renters to more narowly tailor searches to desired geogtaphies.
Research examining lhe cffecl of chang*s in the demanel for or supply of irousing on
resiclcnrial rerrts ]ia<l trat-litionally usud a one year lag betwccn clentantVsupply changcs
and changes in rBnt (Rosen and Snrith, 1983; $aiz, 200?). More rscently, lesearchers
have examined shoner time fiarr-res, given the increasc<l availability of rental data. For
instancc, Bdelsrein ancl Tsang {2007) us*d quarterly dakr, rvhile }.:{agen and Itansen
(2f)10) examinecl the effbet of changes in vacancy rate{i on rents with a six-motrtlr lag. In
the years since that research, horvever, fhe widesprcatl adoption of the internet by
landlorcls to advertise vacanl aparlments and by potential tenetrts to search fr:r homes to
leaseld lras incrensed mateh *.fticiency, lcading to shorter times on the market (Carillo,
?008), ancl may have shodened the time necessary for: renl\ to aeljust to changes in
r{' lriazzesi. Scfineider arrd litrocbel {?0I5) *:itc tbc National Axscoiaxicn of Realt(irs iri rtating that g0% ofhomr.buyers repone(l using the intenlet in ?013, a figurc that scems likely to hald for rent{ir$ as wcll arrd
lras likcly conlinucrl to incrcase sincc that time .
13
D000404
FILE
D D
ATE:
6/2
1/20
19 6
:51
PM
2016
CH
1548
9

hoirsing supply. [:or example, Kashiwagi's (2014) receltt model oi U.$. housing market
dyuarnics assrunes rents adjust substantially in the month following a cltange in housing
sqrply. With potential landlorcls wiriely detennining n:al*et prices from on-line sites
rvhich continuously add new rental listings, we will test the effect of Airbnb use on the
asking rents of units listed for rent since our last Ailbnb measurolnenl, one rnonih otr
avsrage.
To estimate the effect of home sharing on lnean asking rent$ we use a hedonic esfimation.
F\rther, we include fixed effects at the census tract level to control for unobserved
neighborhood effects, such as locaticn and demographic characteristics. We estirnate the
following rcgression:
LnR;t+1" : blAirbnbrc -l- brBediL* r" * b2lSath;-plt" t' brSqfht.r l" {' bqNCtc 1" b5Mont}r;1" -f llirc
(1)
Whsre i inclexes eaclr unit, t teprescnts thc period belween Ailbnb fire&surQlneni* and c
fhe eensus fia*t. LnR.ir!1q teprcsants tlie nntur*l log of the asking renl o{'tJte unit, iti ihe
periad after the obserued Airbnb lisring, Airbnbr is the Airbntr density, calcul*teel as the
uumb*r of units listr:d on Aiytrnb elivided by the teif*l ntnnber of horising utits in the
given eensu$ tract. Betl;1*1", is the lisling's number of bedrocms and l3athir'r-t" is the
Iisting's number of bathrooms. NCit" is tire number of newly eonstrucied rental units
which recciveci their ccrtificate of occupnr:cy from the Cit-v of lSoston in the same time
period in which Ai:'bni: nniis. are mcasurod.. Ir4onthir.* represettts dummy variables for
each of thc tinrc periocl:r betwcctt Airblrir measutertlents,
14.
D000405
FILE
D D
ATE:
6/2
1/20
19 6
:51
PM
2016
CH
1548
9
To estirnate whether increases in rents were driven by constraints irr the suplrly of rental
housing, wc test for a correlation behveen the rnean weekly number of units listed fbr rent
in a given Airbnb meAsurement period and the Ailbnb density measurcd at the end of that
period. "I'he ten:r of residential lease agreements in Boston gencrally end on the last day
of the month and, therefore., require landlor.ds to advellise their units weeks before the
day the landiord desires to stalt a new tenancy. I}:t the term of Airbnb rentals is daily,
ailowing orn'nels to list tlieil units rnuch closer to the day the landlor:ds' desire an Airbnb
customer to ocsupy the unit. As a resnlt, we anficipat e that a landlord's decision to list
her unit on Airbnb rather than in the reffal mar*et rvill likoiy affect the nruuber of units
listed for r6nt in the weeks leading up to listing the unit on Airtinb, rot afterward.
Therefore, to estiruate the effect of home sharing on the quaniity of rental housing offered
for rent, we empioy the following tract l*r'el lixed elfecfs model:
LnCoun{R,,, * br Airbnbr"{- b:NCt" -t'bsh{ontlrr,, -t- ur" t2)
wherc LnCountR.r-1g rcpt'ilseilts the mean rreekly mrsrber <lf units in a census tract oflbred
Ibr rert in tlre ssme time perior{ in whjc}r wc obrserve Aii'bnb lisiiltgs, and all otirerr
variables arc as describecl abovc.
Our fixed effects model remove$ the cff*ct of static rent diflerenlials between cen$us
lraet$. ftT aclrlition, oltr u$tl of asking renfs from lhe period imn:eeiialely following cach
mcasure of r\.irbnb clensity minimize* tiu: risk of reversc causalion tbat coulcl rcsttllfi'ott:
simrrltar:eity of Air:bnb lisfings ancl rents. lVhile rclative changes across censu$ tracls in
1,5
D000406
FILE
D D
ATE:
6/2
1/20
19 6
:51
PM
2016
CH
1548
9
the net revenue diffureutials between renting and Airbnb listing are assumed to affect
owl€r$' decisions whether to rent or list on Airbnb, and thereby affcct Airbnb density,
this effect should appear in the sutrsequent Airbnb uleasure rather than the preceding
Airbnb measrlre.
Data
We obtained rental data from Rainmaker Insights, Inc., a service fhat aggregates listings
of housing for rent. These data include a weekly count of each housing unit ofJbred for
rent in lloston fiom Septenrber 2015 duough January 2016. The dataset includes asking
price, square footage, number of bedrootns and bal'hr<xrms, location and, in some cases:
additional unit characteristics and is obtairied from over 5,000 sources including websibes
that list hornes fur rent in ths U.S. The total number of ljstings over the period was
265,241(Table i). Given the import*ncs of including square f*otage in our regression,
we have limitext orr sample to those observations where this infonr:ation w*s available,
which total I 14,527listings.r7
'fo nrore accurately measure changes in housing supply wc use data on n*w conslnrction,
specifically the number of new housing units, which we obtained frorn the Foston
Reclevelopment Authority ("llRA"). "fhe BRA data records the date that the City of
Boston issued a certificate of occupancyt* fot lr new hotising unit or ti:at an existing
housing rmif rvas deemed no longer available fi:r occupancy a$ a result of constu"ttction.
t7 Tle regression rcsults remain suhsianlivcly unchanged when ntn witlt<iut this conrrol variirblc.l8 Rerluir:,:ri pri$r to occupatl(:y by Scction I 11.1 of thc Massachrtsett'.* l3uilclirg Codc.
16
D000407
FILE
D D
ATE:
6/2
1/20
19 6
:51
PM
2016
CH
1548
9
We use rhe 2010-2014 Arnerican Community Survey (ACS) to obtain the total numbcr of
lrousing units per cetlslls tract.19
We obtained clata on Airbnb listings in Iloston from September 2AM to Jamrary 2016
using web $crE)es of Airbnb.com: sorne that we conductcci oursclves and sonre contlucted
by InsideAirbnb.com and its rese&rchers, who obtairr and provide data to tlre public for
rcsearch purpo$es and who provided the data fbr the San F'mncisco lloard of Suireruisors'
2015 report. These rveb scrapes pruvi<led the following data: tire price anel ihe type of
real estate listed (either a room or an entire apartmenVhome), locationai data, in the form
of longinrcle and latifude coordinates, and the A.irbnb-assigncd identification code for the
prclperty and for the lessor. The October 2Al5 rveb scrape al.so provides additional details
about listings and hosts. We have limited our rcgressions to the wt:b scrapes conducted
i:n Jyly ?, August 22, fleplember 25, October 3, Noveinber 3 i. atid Decenlber 14, 201 5
anri January 2l , 2A16. T {ble 2 surnmzlrie*$ these elttli by cerisrx tract. Wc see t}rai: lits
avsrage tract in our sample has 1,600 housing units, 74 rcntal units and 12 Airbrrb
listings, with an avetage daiiy asking price of $ i (r L
Ailbrib elf*r*d the Bostnn market in 200910 *ncli:y the seccind l'ralf eil'2015 it aver:aged
over 2,000 listings. 'l'able 3 provides morthly totals fcrr Airbnb listings, mcasurecl on a
silgie clay each month, and the weekly avsroges of each rnonih's liottsittg ulrits offured
It Wo excluele from oul ahalysis ihosc cerrsus tracts within the 9800 code riltrgci, n{rich the Cunsus Bureart
usr:* to rlesignalf itreas rvitli littlc ot no r*sid*ntial pcpularian, uu:stlv parks m crl-)cll lvi'ricr. [1.$. L"cnsus
l}ureau, ?{)10 Cenxus Redistricting Daia (l}ublic i,arv 94- 171) Surrrntary Filc.htip:lAvww2.ccnsus.govlgeo/pti1's/r*1'erencelC'f C. -1
0.pdf.2f'r\irlrnlr.coru. lrtq:;r/trlag.airirnb.c<lruairbnbsl.rositive-inrpnct-beistr:ni ?*g**l .15. acct-:ssed (]fi l litllz115.
11
D000408
FILE
D D
ATE:
6/2
1/20
19 6
:51
PM
2016
CH
1548
9
for rent.zt As of Jarrrnry 2016, Airbnb listings rvere gtowing in Iloston by 74o/a, year on
year, Figure I shows that s'ith the exception of outer neighborhoods, such as West
Roxbury, listings wsre colnmon across thc city.
Air.bnb listings. horvever, ale unevenly distributed across census tracts, both in absolute
terms ancl as rneasured irr relation to total rental units.32 To illustrate this point, we
presenr Air,bnb density by decile in Table 4. We meo$ure Ajrbnb density by dividing the
number of Airbnb units listed by the tqtal nunrber of housing units in the tract. Auoss
Boston, Airbrrb listings by census ilact ranged fi'om zeto listings to a ntaxitnum of 50/o of
all housing units.
Llsing the more detaiierl October 2AI5 data, Tables 5-7 describc the units and hosts fbr
Airt'nb listings in Bostcn, av*raged across neighborhot:rds. llable 5 sltows thal niost
tSB%) of the units listeri on',,{ilbnb in l}oston t'hat nronth of'l'ered ths enlire ltornc {ix'r'ent,
either iiee stantiing house, apadment or conclorninium, while 39% oifered ir privatc rootn
in a honre and a rnere 2o/o affered shared space, such as sleeping on a fold oui couc,h in a
living rconi. I:ven partiai unit listings have some potential lo impaci the City's rental
market, as * fraction af a unit might hav* been occupicd by a tefiant (an aclclitir:nal
roonrmate) had itnot been switched to the hr:me sharing mat'ket.
2l V/c l',res*lu. wrckly :]v*raglcs as Nov*lyrber inclnslfs 5 rvecks, whet*ilti ali othcr mt:nfhl incllrdc only 4
weeks.22 Because llre nlrnber of total rentsl uniis is surr.'ey*d bctweeri 2010 and 20i4, a pcriod of somi: renewcd
rqrnwth 6l'r*si<leufial hnr:*ing in ll*ston after ihe 20{}B recession. thc:sc t'atios ntav he *liglttJy *r'r-'rstitted.
1B
D000409
FILE
D D
ATE:
6/2
1/20
19 6
:51
PM
2016
CH
1548
9
Ols *f tfie most contentious trrr:rints in the debate over home shadng's eflbct on housing
has becn whetlrer ihcse companies merely ol'fer residents a chance to carn extra income
by renting out all or a portion of tlreir home thal they w'onld not ofher"wise rent t0
resicJential tenants r:r whether they offer residents a chance to carn more moncy than they
wsulcl by leasing to residential tenants, thereby reducirig the supply of renml housing.
Tabte 6 shows that in lloston in October 2015, almoslS2% of Airbnb hosts had only a
silgle listing and a rnere 39lo of hosts had four or more listings. On the other hand, Table
7 shows that non*resident owners, some wouid call them commercial hosts, though they
comprise a small share of all hosts listed nearly half ,460/o, of all the units listed for rent
on Airblb" White the data cannot prove the poinq it seem$ likely that a host with two
homcs for rent on Airbnb in the same city is listing at least siome space which would
otherwise be rented to resi<leniial tenilnts.
l{.exilt,r
We begin by presenting results fur equation (1), estimaling the irnl:aets of Airbnb derisity
on asking rcnts, in l'able ll Using the natulal log of rental prices, we find thal a one
sian{a;et cleviaii*n inerease in Airbnb density in a given oen$us trac{ is correhted witli a
0.,tr%, i$crease in asking rsnts. Iior those ccnsus hacis in th* highest decil* of Airbnh
listings relal.ive to total honsing unils, this increase in asking rents r"anges lrom L30/a to
3.19l0, whicir equates at rhe oilywicle mcan rnonthly asking leni of $2,972 ta an increiise of
as nruch as $93 in meau nrondrly asking rent. As exl)eete{l, unit characicristics ha.ve large
effects on askirfg rcnts. with each zrclditiondl becfu:oom increasing askirig.renls by l7a/o atd
cach aciclitianal baihror:rn inc;:easing asking rcnls by I 1%. We ilrclrtd* balh timr: anc{
39
D00041 0
FILE
D D
ATE:
6/2
1/20
19 6
:51
PM
2016
CH
1548
9

tract fixed effects, in order to control fr:r any lime trends or tracl level unobservable
characteristics.
Next, rve tesf the hypothesis that this direct corelation between Airbr:b listings aritl
asking rcnts is the result of a correlaf.ion bel'lveen Airbnb listings and the supply of rental
housing offeled for rent. We regress Ailbnb density on tire naiulal log of thc toial
aunber of rental units offerccl for rent in the period since the previous Airbnb
nleasnrement, again incorp<lrating both time and tracl fixed etfects. Wc present tesults in
Table 9. We find that a one standard deviation increase in Airbnb density is con'eiated
with a 5.9% decrease in the number of renial unils offer*d for retrl. At the mean rveekly
rnrmber cf units offerecl fior rcnt per census tract, lhis repfesents a reduction of 4.3 units.
Ihis matches tire rednction in rental units caused by Airbnb uso that our breakclowtt oJ-
Ailbnb rurits plec{icts. There, r,ve found that 46.30A of tlre units r:n Airbnb are listcd by
()wucrs rvith nrore than one unit listed firr rc:nt on A irbnb in jli:ston at the satne linie . lf
cver:y onc of those units would have been olfbr"ed fbr rent in the absencc ol Airbnir, tlris
rvould predici rr mean recluctir:n of 5.4 units.
T'Jrese resrdts confinn the correlations b$tweeti Airbr:b use and lottg-term housing sttpply
suggested by the N*w York33 anel San lirancisco2a reports. They also shorv a corrclation
between Ailbnb use ancl asking rents anrl, ibr the first time, quantify this pricc effect. In
genelal, Air:bnb use in lioslon is sm;rllcr than that in New York aird San l;rancisco, itt
?:r 'inirbnb in NYC I.lousitg l{r:grart,Zfi}5," i.ierv Yolk Conrrrruuiti*s flor Chrrrtltc. }{tralAffori:lnbiiity f*rAll, nycomurunifies.rrg.ta
frolic-.v lu*lysi.s Rr,Jroi'f, l]udget oucl l.egislative Analyst's Oflicc, Board of Supervisors, City and County
af $arr i;rnnciscr:" May ?.3,?.415.
2A
D00041 1
FILE
D D
ATE:
6/2
1/20
19 6
:51
PM
2016
CH
1548
9
both absoliite terms zrnrJ relativc to eaeh city's total housing sttpply. Itor example, in New
York City, researchers fbund that the uumber of Airbnb listings in lbur of that cily's zip
cocles cxceedsd20% of ihe total numher of housing ruilts. In Boston, no census tract had
Airbnb lisrings gl:eater than 5a/,, of that tract's total housing units. Giveu the more lirnited
use of Airbnb in llosron, therefore, our resslts likely pr*sent a iower bourrd on the
impacts of Aii'bnb on local rental markets for cities iike fian l"rancisco and New York
where Airbnb use is greater as a share af totat housing supply.
Conclusiorcs
This paper makes thrcc ccntributions to tire existing literature. F'irst, it provides cne of
the first rigororw erni:irical explorations of an interesting nerv lieaturc of the housing
malket, home slraring. Second, it relies on a nnt el use of two forms of'big data ta
examine the irnpacts of horne sharing on *'re renlal housing rnarket, weekly rental listings
apri Airbnb listings. 'I llixl, ir r:eli*s on thc short lims fiames tlnt arc possiblc when usirtg
lew soulocs of big clata to n$e r{ {ixed eflect rnod$l to iclenlify cu;ual iinks belwceu
.Ailbnb use and thc reutal housing market.
We have found that *lmost l-rsif of the units listecl on Airbnb in lJoslon ate offer:*d hy
tlrgsc with mor* than one simultan*ous li-.rting in tlie city. In addition, we have a direct
copclation tretwcen Ailbnb density and the price of such housing. If Airbnb grorvtlr
persists at curent gron'th rates, use will double iir Boslon in a little more than three years.
In a city rvhere tle demarxl for rental'lrousing is orltpr]cing supplyand pushing up rents
7,1
D000412
FILE
D D
ATE:
6/2
1/20
19 6
:51
PM
2016
CH
1548
9
quickly, home sharing is contributing to this dynamic ancl deserves bcth {'urther research
and policy attention.
As policy makers consider whetlier and horv to respond to the rapid rise of home sharing,
these findings provide evidence that home sharing is both a personal anrl a commercial
enterprise and should be regulated and taxed as such. Several jurisdictions have recently
adopted or considered legislation that seeks to dif&rentiate between these categodes of
home sharing customers in order to regulate and/or tax cornmercial users. I;or cities
parlicularly concemed about the availability and/or price of residential housing, these
results will strengthen tire arguments for using such regulation an#or taxationo or
alternative methods, to limit home sharing activity in certain neighborhoods, On the
other hand, these rcsults emphasize the need for both further thdcretical and empirical
analysis cl'the social weifare irnplications of home'sharing, sttch as whetlier Airbnb
enables middle income f'amilies to remain in their homes in rapidly appreciating housing
markets"
22
D00041 3
FILE
D D
ATE:
6/2
1/20
19 6
:51
PM
2016
CH
1548
9

References
Ambrose, ]]. W., Coulscn, N. Ii., & Yeishida, J. QAlr. The repeat rent index' Revieu' rtfilcononics atrd Stutistit:i', 97(5), 93q-950.
Blank, D. M. and Winnick L. (1953). The sfiucture of the housing market, The Qu.arterl.yJottrnal aJ'Econonic:s, 67 (2), I B 1-208.
Carillo, p. E. (2003). Infonnalion and real estate transactions: the effbcts of pictures and
vi*ual tours or1 home salcs" Ceorge Washington i.Iniversity Working Paper.
Diamond,Ii. A. (19S2). Wage deterurination and efficiency in search eqrrilibria. Ret,ie*-
rsf .Hconamic Studies, 49, 2I7 -227 .
Dow Jr, J. P. (201 l). Neighborhood fuctors affecting aparifiIent vacarcy rates in LosAngeles. Soutltwes tern Econ o mic Revieu,, 3 2, 3 5'44.
Iidelstein, R.. I{., &'['sang, D. (2007). Dynamic residential housing cycles a.nalysis.
Jor*'nal of lleal Estafe.F'inunce antl Econortiics,35i3), 295-313.
Einav, L., Fanonato, C. & Let'in, J. (2015). Peer-to-peer matkets, NBER Working Paper
No.2l496,hlp-#wy"tv,nbq1.o-1glp3p-9{dig?-14!6.
Fujii, K., Hozumi, Y., Iida" T'., &"I'sutsttmi, M. (201.2). Analysis by "Madori" of .llakyo's
23 rvards rental aparhnent market. In ls'1{1"9 & A}IEUEA Jaint lrtternationatConlbrence.
Clar*ser, Li. I-, ancl {.}your*o, i, (?00?). Arbitragc in housing t:ralkels, Nl}ijl{ Workilg11 aper No. I 37 tJ 4, lrttp : //wlvrv. n ber, org/papersln' I 3 7 04.
(ilaeser, li. L., Gyourko, J., & Sa!*, I{,. (?005). Why have hausing prices gone up? NB$RWorking Paper No" 1ll2r, http://lvrnv.nber.org/papers/wl I 129.
Gabrisi, S. A., & Nofhall, F. H. (2001). Rental fusushrg ntarkets, tlte irrcidence and
dtrr:aii*tr of v*cairey, ancl thc iialui'al vfle:ii1ty t:*L*. ,ltzunzul xf Urb*u ik:ononits,49,12t-49.
Ciacscr, E. L., & Ward, B. A. (2009). Tlic cau$os ami consequences of lancl use
regulation: Eviclence fiom greater lloston. Jatu'nal af Urbun Econamics, 65(3),
265-278
Hagen, D. A., & Hansen, J. L. (2010)^ Renlal lrousing arid the nalrral vacancy rate
J au rnul a f ' Re al Es kile R tt.r c erc h, 32(4), 4 13 -433 .
I{ead. A., lJoyd-iillis aud Sun" I{. (2014}. Search, liquidity'and the dynamics oi. housc:
priccs turclconslnrclion, Ilrr: Americ:nn Ecrsrcrsmic Review,l$4(4),1172-121A.
I'lorton, J. anri Zeckhinrser. Lt.. J. (2016). Ou,ning, using and rcnting: Some sirnple
23
D000414
FILE
D D
ATE:
6/2
1/20
19 6
:51
PM
2016
CH
1548
9
ceonorlrics of the "sharing cconcmy", NBER Wr:r*ing Paper No. 22029,
htlpL1,www'pb,elp-rg1papp:p/y22!.t)-7.9.
lhlanfeldt, K. R. (?007). Tlre effect of land use regulation on housing and land prices.
Journu! of Urhan Ecorrundcl,6l(3), 420-435.
Kashiwagi, M. (2014). A search-theorelic modei of the rental and homeownerslripnrarkets,,lournal af' Hous in g Ecanomi r:s, 26, 33 -47 .
Luz,arow,A. (2015). Airbnb ir:r New York City: Law and poiicy cirallenges, fsiunichPerson RePEc A.rchive, Paper No, 68838.
Li, J,, Moreno, A.,Zhang, D. (2015). Agent behavior in the sharing economy: Evidence
fi'om Airbnb, submitted to Manufacturing & fiervice Operations Managemcnt,7
McBreen, J., CofTette-Nagcf, F. and Jenscn, p. (2009). An agent-based simulation r:frental housing markets. European Rea[ Estate Socie4, (ElfES)
Moftensen, n. f. (19S2). Property rights and efficiency in mating, racing and related
games. A m er i can E c onctmi c llev i ew, 7 5, 397'4 1 5 .
Muller, M,P., (20i4). An llconomic Analysis of Online Sharing Systetns'Implications on
Social Welfare, Proceeding"t o/'the European Confbretx(e (tn lnJbrmation Systerns
SICIS) 2014, Tel Aviv, Israel, Jate 9-l l, 201'1, ISBN 978-A-9915567'0-0.
h&x//gits"."Lsi&s..1.-s-t:giss;.t$J.Q.1.4-/:v:e-r;srdit?s,v/lt:stt:l{lPIl"4..
Ncrvy-Marx, R. (2t)09). t'Iot anrl coid rnarkets. Rettl Estrtte Ecanrsmics,ST(l\, L-22".
Pagliari, J., Webb J. aud Lieblich, F. {1996). The histolic behavieir of REIT relurus: Arsfii s$tat$ perspective, I:let;ullsndt uJ'lte:*l blsk$e Investwent Trusts,2A.
l1iazzusi,M., Schneidsr, M., & $troebel, J, iZ()l5), Sepnented housing se&rult, Nl1trRlforkin g P ap er N o. 2 0 I ? 3. h tlp{ry1y"ry.dr"sq, p,t&/!agqSly'?Q$?.}-.
Pissarides, C. A. (tgS5). tJnemployfirerlt, vacancies and leal wages^ Americrm EconomicRedew,75,676-694.
Quigley, J. M.. & Rosenthal, I-. A. (2005). Tire effecis oJ: land use regulaticn on the priec
<rf housing: \Vhat do rve know? Whai can rve learn? Cityscape, 69'\37 '
Riddel, M. (2004). Housing*market disequilibrium: an examination of housing.markefprice and stock dynamics I967^1998..lourna! af l"{ousing Er:onondcs,13(2004},
. i?0-135
It osen, K., & Snrith, 1,. ( I 9tl3 ). lfhe price acijustrnctrt l)toces$ ancl the naftuirl viicilllcyraie, A m e rir:an E c o no mic,s {l.s v ittt"-, 7 3, 7 7 I -7 X$'
24.
D00041 5
FILE
D D
ATE:
6/2
1/20
19 6
:51
PM
2016
CH
1548
9
$aiz, A. (200?). Immigration and housing rents in American cilres. Journal of UrhanEconamics, 6lQ), 345-37 l.
Schneiderman, E. (20i4). Airbnb in the city. New Yarh State Olrtce of the AttorneyGeneral, Oct, 14.
Sinai, T., & Waldfbgel, J. (2005). Do low-income housing subsidies increase the
occupied hcusiltg stoek? ,Iaurnrtl of Public Er:anomics, B9(l l-12), 2137-2164.
Susin, S. i2002). Rent vouchers and the price of low-income housing. .Iournal aJ'Public
.Economtcs, 83(U, 109-152.
Verbrugge, R., I)orfman, A., Jolursotr, W., Marsh lll., F., Poole, R', & Shoemaker, O.
(2016). Detenninants of rent changes: Mean reversion versus the usual suspeets.
Real Estatc .flconornics, Doi: 10.1 I I I/I540-6229'12145'
Wheaton, W. C. (1990). Vacancy, search and prices in a housing markst matcbing rnodel.
Journal rf Politieal Economy,98, L?70-1292.
Yalas, A. (1994). Middlemen in bilateral search merkets. ,lournal otl"abar Ecanornics,
406-429.
Zervas, G.,Ilroserpio, D., & Byers, J. (201.4). The rise of the sharing economy:
Estimating the impact of Airbnb on the hotel industry. Basfnrt Unive6i4t Sckoal aJ'
Management Rcsearch Paper, (20 I 3- I 6).
25
D00041 6
FILE
D D
ATE:
6/2
1/20
19 6
:51
PM
2016
CH
1548
9
Table 1. Statistics on Rental Units
Mean Stanelard Deviation Count
Price 972 $t 130 , lli".ta? ,
lJedroonrs ? i.0 .. J]l,jg2-,Badrrooms 0.4 ll3
Feet t 471
Source: f)ala fro*r Rahrmakcr ln*ights, inc., Fcbruary 20 I 6.
26
1
D000417
FILE
D D
ATE:
6/2
1/20
19 6
:51
PM
2016
CH
1548
9
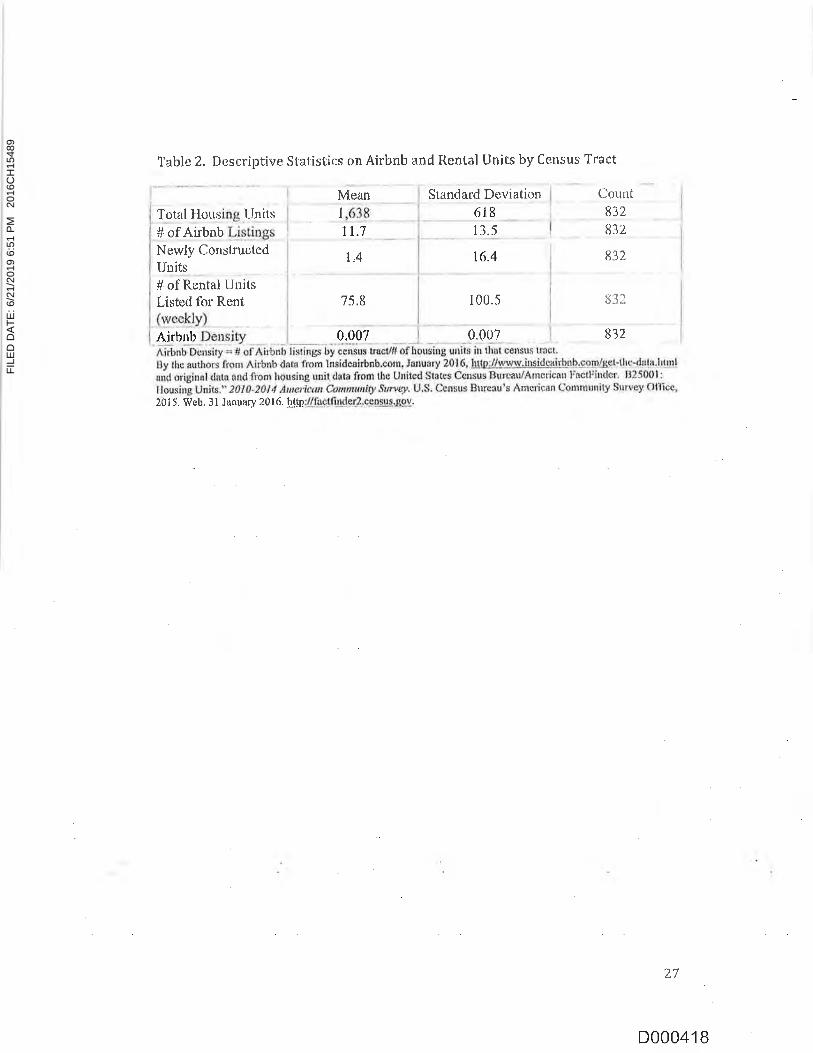
Table 2. Descriptive Statistics on Airbnb and Rental Units by Census Tract
M-ean Count
Totalllous Units 832
832
Newly ConstructedUnits
1'4
# of Rental UnitsListed ftrr Renf 75.8 I00.5 s32
Airbnb 0.007 0.007 832
?0 I 5. Web. 3 I Januu ry 20 I 6. hJ!p-,/-if-acxf ind9r?*.9g$u{,SSV.
16"4 832
Standard Deviaticn
11.7# of AirbnbI 618
13.5
"'n
D00041 B
FILE
D D
ATE:
6/2
1/20
19 6
:51
PM
2016
CH
1548
9
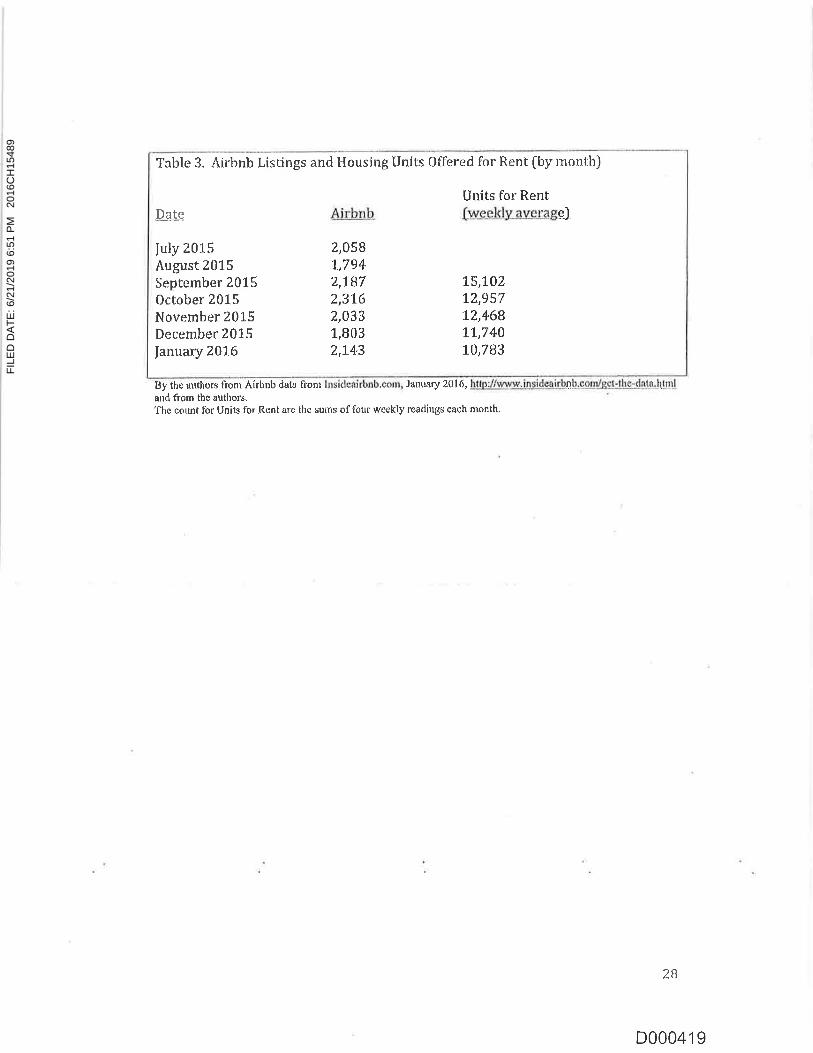
Table 3. Airbnb Listings *nd l{ousing Units Offered fc.rr Rent fby month)
luly 2015August 201.5
September 2015October 2015November 2015December 201"5
|anuary 2016
2,0581.,7947,LB72,3L62,CI331,8032,143
.DaIe Airb*1,-
15,10212,95712,468'J.L,744
10,783
Units for R.ent
finlss&ly-ave$gel
By lhe authorr lronr Airbnb data fr<rm
and fiom the euthor$.'l'he count for Unils for Rent are ihe sums of four weekly readings each monlh.
January 20 I 6, http:/'lfyw,ilsideqirbn[SgdCc!-thed{*lt$d
1t)LU
D00041 I
FILE
D D
ATE:
6/2
1/20
19 6
:51
PM
2016
CH
1548
9
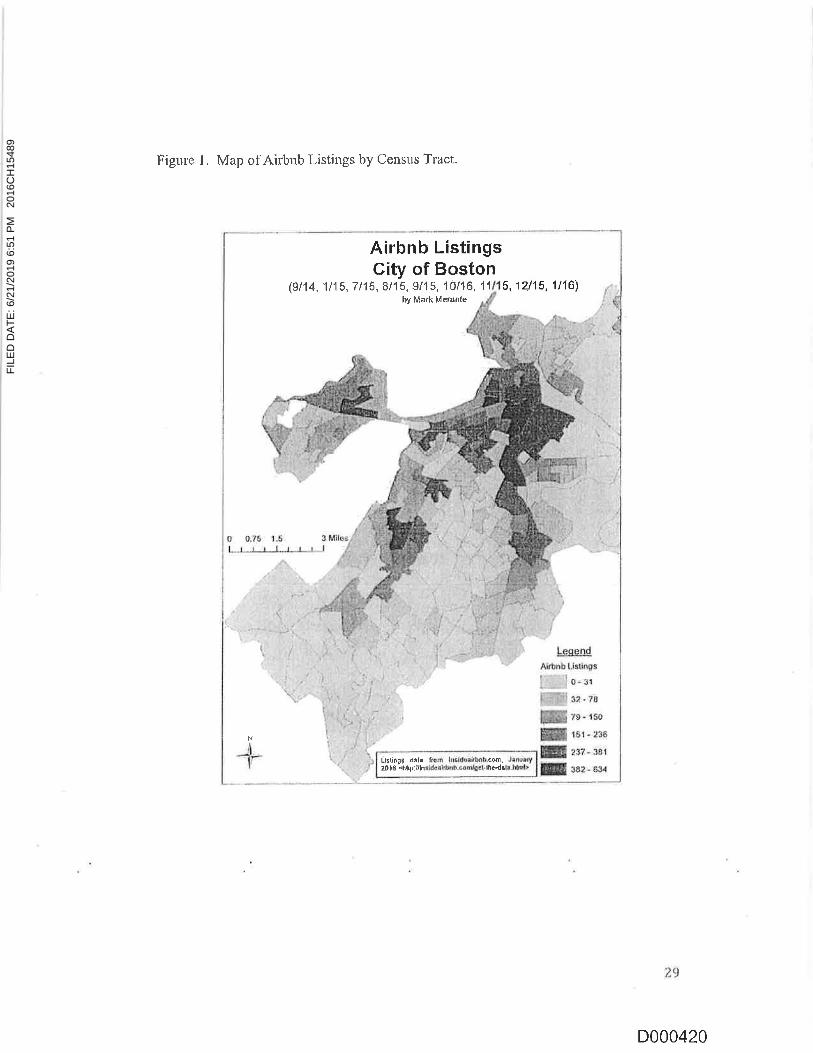
Figure l. Map of Airbnb L,isiings by Census Tract.
Liltifigg dlle faofi krsidoett nb.cos. Jrnuary20 16 dtt{lp;utniidaaLb{b,condoet"lltc-doh,hd}
LsgsodAlrbnb Ustlngs
0- s1
t2.14
79- 150.
{s't - 235
2$? -381
s&2 - 634
(9t14, 1 l1 5, 7 115, 8115, 9115, 1An6, {
+
s,1a15,".116)by Marh Meratrte
0 0"7s 1,6 I1., r*r r l" r,.Ji--d
Airbnb ListingsCity of Baston
29
D000420
FILE
D D
ATE:
6/2
1/20
19 6
:51
PM
2016
CH
1548
9
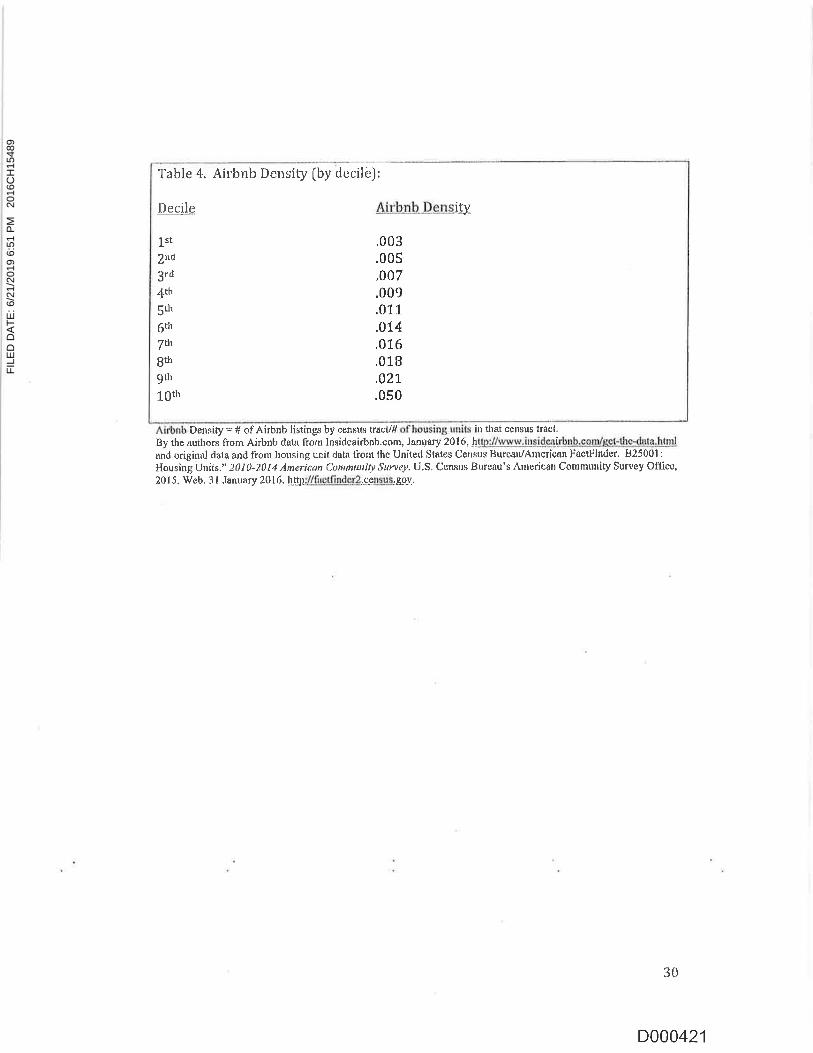
1.st
2nd
3.,1
4th
5d'
6th
7ui
B$grl,
10tl'
.003
.005,0a7.009.01"1"
.0I4
.01.6
.018
.021
.050
Table 4. Airbnb Density [by de cilcJ:
Dceile Aubnhles$-l-ty
Density * g of Airbnb listings by censtt$ trsctl# in that ccnsus tracl.By the autirors from Airbnb datu fron lnsideairbnb.com, Janqary 2016,.filtpdlwwJl)1l{s{ifuhsst!&9$b9:i$fe.htlllmd originul data and frarn horsing unit data liorn thc Unitecl States Cersrrs llur*au/Americal FoctFilder. 825001 :
l{ousing Unifs." 2A10-2014 Anrcrit:an Cotnmunity Survry. U.S. Census Bureau's American Comnrunity $urvey Oflice,2015. Web. 3l Janunry 2016. hn;[f*s!fi!dgg2.t*ffiq$,ggy.
30
D000421
FILE
D D
ATE:
6/2
1/20
19 6
:51
PM
2016
CH
1548
9
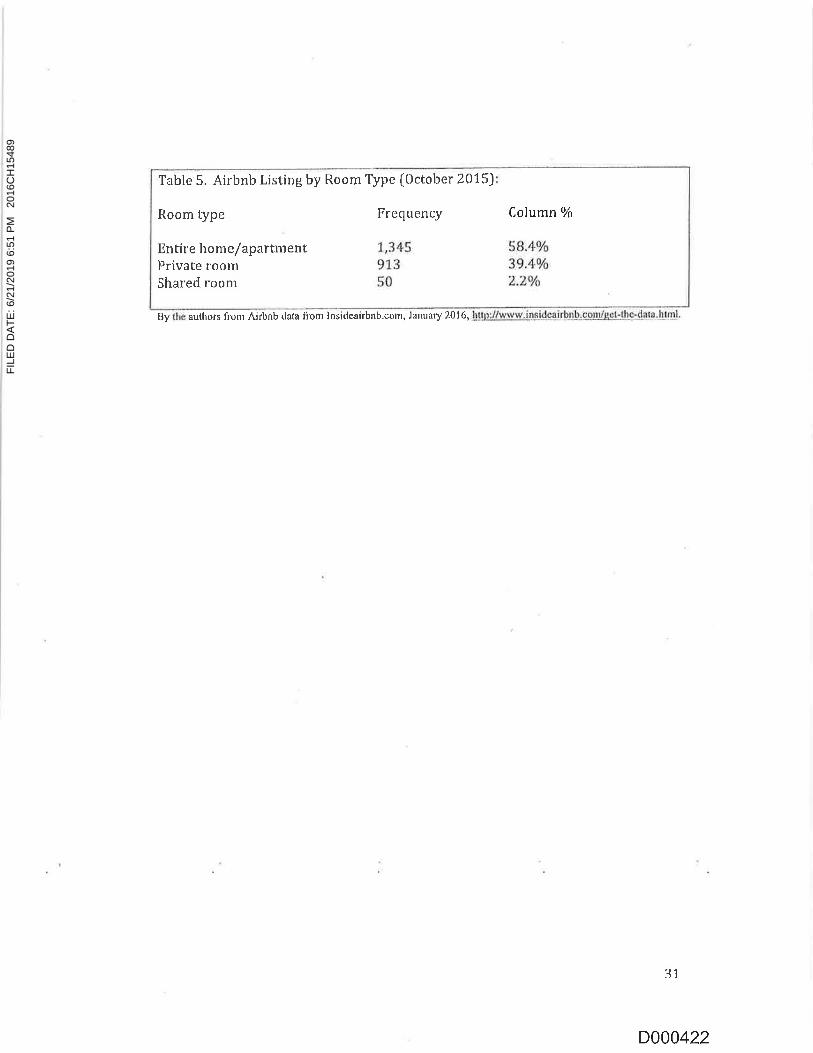
Table 5. Airbnb Listing by Room'l'ype [October 2015]
Column %Room type Frequency
58.40/o
39.40/a
2.Zalo
Entire homelapartmentPrivate roomShared room
1,34591350
By authors from Airbnb data iiom Insidcairbnb.com, January 20t6,
31
D000422
FILE
D D
ATE:
6/2
1/20
19 6
:51
PM
2016
CH
1548
9
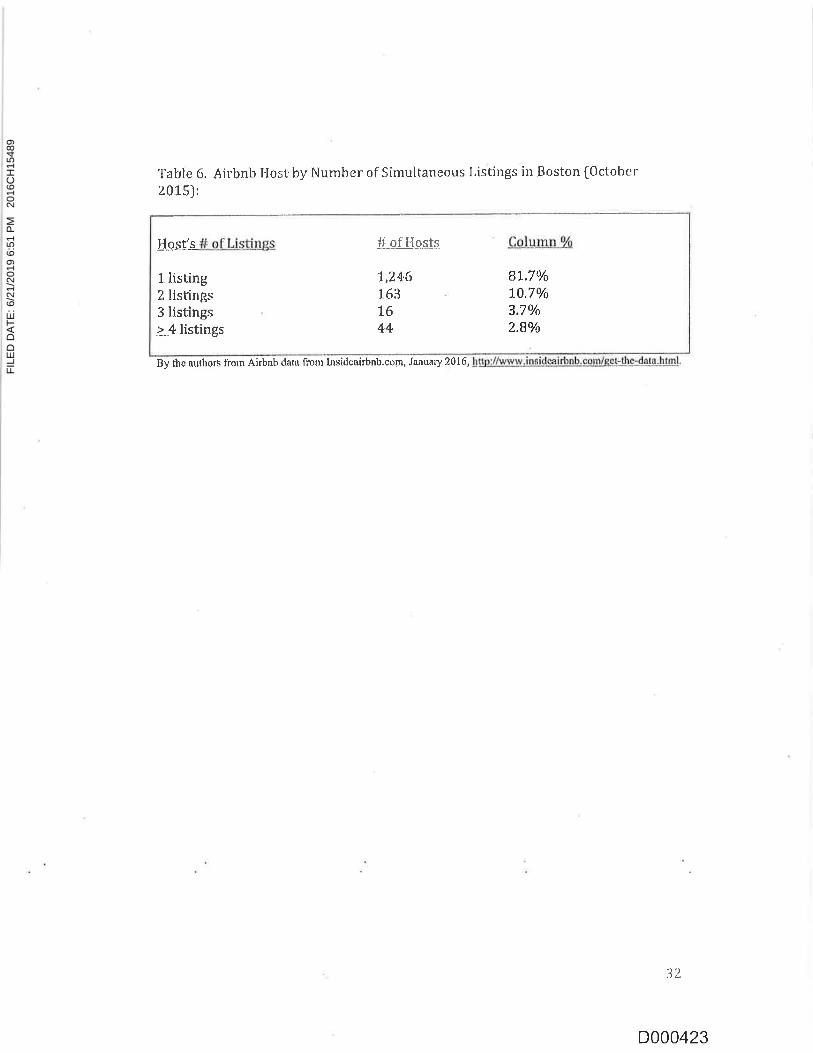
'fa}:le 6. Airbnb Ilost by Number of Simultaner:us Listings in Boston {0ctober20151:
By the authors frorn Airbnb dahr fron: Insideairbnb.com, Januaty 2416,
ed"umn%#sf-HffIs"llss-ts-#_q-LLisdnss
8I.70/o'LA,7a/o
3,701c
2.84/o
1,24{,163t644
1 listing? Iistings3listings:"4listings
32
D000423
FILE
D D
ATE:
6/2
1/20
19 6
:51
PM
2016
CH
1548
9
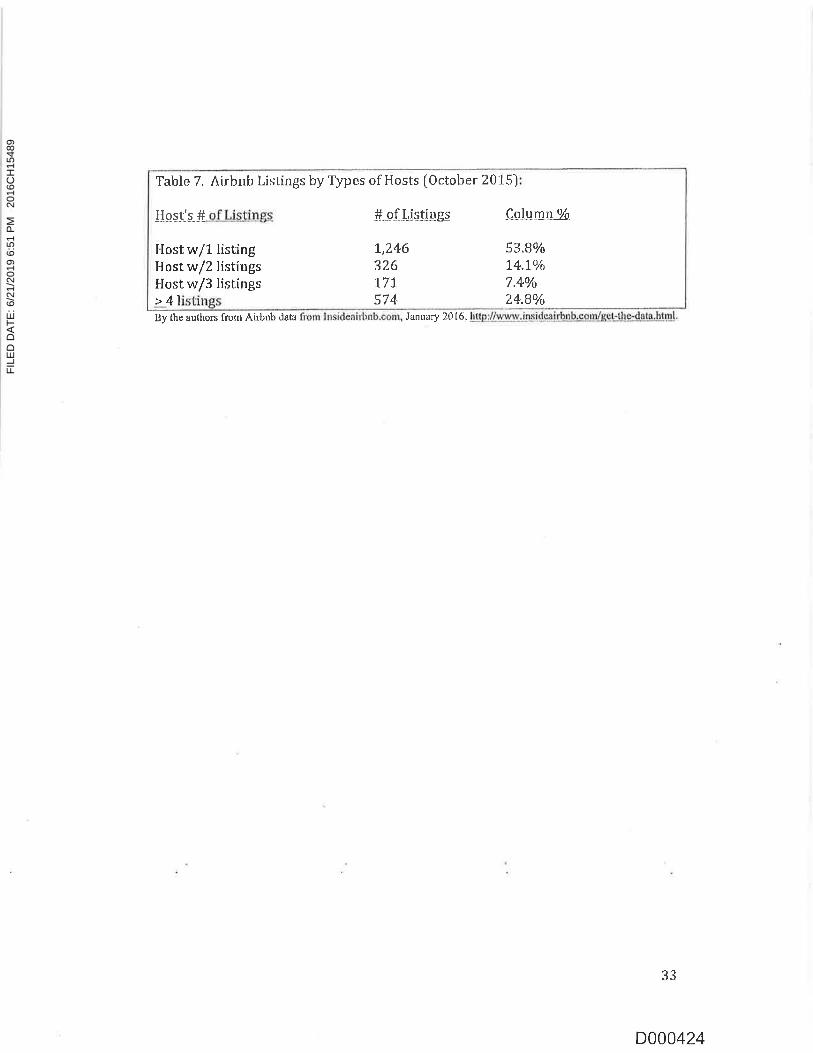
Table 7. Airbnb Listings by Types of Hosrs [October 2015J
>41
Hsstls.$-s-Ll.iatings^ #--of Lis"tingr -eellimn*96.
r,246s26L71_
574
53.8a1$
L4.LVa7.444)
24"9a/a
FIost w/1 listingHost w/2 listingsllost w/3 listings
By the authors fronr Airbnb data January 2i)16,
JJ
D000424
FILE
D D
ATE:
6/2
1/20
19 6
:51
PM
2016
CH
1548
9

Table 8, Airbnb Density and [,og of Asking Rents
Airbnb Density
Bedrooms
Bathrooms
Sqrnre F'eet
Newly Constnrcted Units
Constant
N
Msnth Fixed &l'{*efr
Ccnsus Fixed Hffbcls
(1
(
o1' A9$gg..Rent1
a.627"'
.9.t. *-..atc
0.r71
. (itp{)"
0.r12(tt.64j
0.000132."'(7.11)
-0.00000742-0.32)
7.373
l 13409
Y
X
t statistics in pnreirtheses'p < 0. 1 0,
-'p { 0,05, **'/,
" 0.0 1
.forrr-"ar: Airbnb datn frorrr Insirieairbnb.eonr, Jrnuery 2016, hl$?;l/wrr,w,ir.r.,s"rslsiijiblltt.-Sg$&gl:,!b9:da$,llt-tfl arrd irortt
ths author$. New construclion data from the Bostou Red*veloprlent Auihoriry. Rcntnl listing data fiorn l{ahlmnker,
Insights, Inc.
34
D000425
FILE
D D
ATE:
6/2
1/20
19 6
:51
PM
2016
CH
1548
9

Tabl*: 9. Regression af Log of Number of Units for Rent on Airbnb Density,
of Number of Units fcrr Rent
-g.366"rAirbnb Density
Nerl'ly Consfl'ucted Units
(2.47-)_,.
0
nr
2.947-".Clonstant
83)
832
Month Fixed llff'ects X
Clcnsus liact Fixed Ilffects X
t statistics in parentheses'" p <AJl,.'7: .i 0.05, """^p. 0.01
Sourtes: Airbntr drla fiorn Insidenirbnb.cotn, Jauuary 2016, htlp;//1vww.ili,si.dS-,Ii*n.b..qpttL/Sglitltp.d{tg,hlgl and fitnttht: authors. Nerv cou*tructicn tiato from the Boston Redevelopment Authority. Rentnl lisiing dnta frorn Rainnaker,insights. lnc.
35
D000426
FILE
D D
ATE:
6/2
1/20
19 6
:51
PM
2016
CH
1548
9

Exhibit D
FILE
D D
ATE:
6/2
1/20
19 6
:51
PM
2016
CH
1548
9

€.vh, I
Do Airbnb properties affect house prices?
Stephen Sheppardl and Andrew Udell2
January 1, 2018
1. r
{
? ri& '*
lWilliams College f)epartment of Economics, 24 Hopkins Hall Drive, Williamstown, MA 012672Dropbox, fnc., 333 Brannan Street, San Francisco CA
?r!
,L
D000080
FILE
D D
ATE:
6/2
1/20
19 6
:51
PM
2016
CH
1548
9
Abstract
The growth of peer-to-peer markets has provided a mechanism through which private individuals can
enter a market as small scale, often temporary, suppliers of a good or service. Companies that facilitate
this type of supply have attracted controversy in cities around the world, with corrcerns regarding Uber and
Airbnb in particular. Airbnb has been criticized for failing to pay taxes to local authorities, for avoiding
regulatory oversight that constrains more traditional suppliers of short-term accommodation, and for the
impact of short-term rental properties on the value of residential property. A report prepared by the Office of
the Attorney General of the State of New York lists these impacts among a number of concerns: do Airbnb
rentals provide a black market in unsafe hotels? Do short*term rentals make New York City less affordable?
ls the influx of out-of-town visitors upsetting the quiet of longstanding residential neighborhoods?
These concerns pose difficulties because they imply different impacts on the values of residential p{op-
erties. lf short-term rentals provided via Airbnb create a concentration of what are effectively unsafe hotels
or upaetting quiet residential neighborhoods, tJrey would generate a lacal mn(entration of externalities, that
might be expected to depress property values rather than make housing less affordable. Alternatively, if
negative externalities are modest relative to the impacts of space diverted from providing housing for res'
idents to providing short-term aceomnnodation for visitors, then local concentration of Airbnb properties
may increase house prices. ln this paper \re present an evaluation of the impacls oF Airbnb on residential
property values in New York City.
D000081
FILE
D D
ATE:
6/2
1/20
19 6
:51
PM
2016
CH
1548
9

1 lntroduction
Since its founding in 2008, Airbnb's rapid growth has prompted thd expression of concerns about its impact
on cities and urban housing markets. These concerns have focused on a variety of issues, ranging from
whether Airbnb clients are paying appropriate fees and taxes to the appropriateness of listing residential
properties in the occupied territories of lsrael. Perhaps no concern has been more vehemently expressed
than the impact of Airbnb listings on housing affordability. This issue led to ballot initiative Proposition
F in 2015 in 5an Francisco, with a group of protesters occupying Airbnb headquarLers in San Francisco in
advance of the vote. lt has also led to bans or partial bans on advertising of short-term private rentals in
Barcelona, Berlin and other cities around the world.
Airbnb is an internet-based peer*to-peer marketplace that allows individuals to "list, discover, and book"
over 3,000,000 accommodations in over 65,000 cities across the world (Airbnb 21fi). Airbnb acts as an
intermediary between consumers and producers to reduce the risk and cost of offering a home as a short-term
rental, which enables suppliers {homeowners) to flexibly participate in the commercial market for short-term
residential housing. While Airbnb was not the first service to act as an intermediar,y in this way, and even
today has cornpetition in provision ol'these services, its suceess and rapid growth have made it the focus
ol'concern for policy makers.
Airbnb is part of what has come to be known as the "Sharing Economy," a term that refers to peer-
to-peer products, services, and companies. A large part of the motivation behind the Sharing Economy,
according tc the companies that self-define as part of the s€ctor, is to make use of otherwise under-Lrtilized
goods.l ln the case of housing, homes might not be utilized to their full extent (for exarnple, during
vacations or due to an unused bedroom). This allows homeowners to "share" (e.g., rent) parts or the
entirety of their homes during these times and earn revenue. The potential for and ease of these types
of transactions is greatly increased by better matching technologies, a trend which has been driven by lhe
lnter:net (Horton & Zeckhauser 2016). Airbnb further reduces transaction costs for both consumers and
producers by providing a feedback and reputation mechanisrn, allowing lor a safer ancl nrore streamlined
transaction.
Despile Airbnb's efficiency improvements and the ability it gives homeowners to generate revenue, there
isee "The Sharing ficonorny: Friend or Foe?" (Avital, Carroll, lljalrnarsson, Levina, Malhotra & Sundararajrn 2015) forr concisc summrry of thc different vicwpoints surrounding the firturc of the Sharing Econonry.
I
D000082
FILE
D D
ATE:
6/2
1/20
19 6
:51
PM
2016
CH
1548
9

are concerns about the economic and welfare effects of Airbnb's presence on the residential housing market.2
The analysis belows presents an examination of some of those economic efflects. The study is motivated by
the following question: in a highly constrained and regulated housing market, where residential homes are
both in high demand and located in dense neighborhoods, what is the impact of being able to transform
residential properties into revdnue slreams and partly commercial residences?
ln New York City, the question of impact on housing affordability has been raised explicitly, and the
role of Airbnb has been at the center of a number of policy discussions at the municipal level. ln 2014,
the Attorney General of New York State, Eric Schneiderman, investigated Airbnb's presence in New York
City (Schneiderman 2A14). The subsequent reporL indicated that72% of Airbnb listings in New York City
violated property use and safety laws and were therefore illegal.3 The Attorney General's Oflice also found
that over 4,600 units in New York City were booked for more than three months of the year, leading the
Attorney General's Office to question the impact that Airbnb has on the supply of housing stock and the
afFordability of housing in New York City.
The prospect that Airbnb encourages violation of health and safety laws as well as reduces housing
supply raises a puzzle regarding the likely efFects on house prices. lf short-term rentals provided via Airbnl:
create e concentration of whal are el'l'ectively unsafe hotels, upsetting quiet residential neighborhoods with
more traffic and persons who don't care about the neighborhood, they may generate a local concentration of
externalities that might be expected to depress property values. Alternatively, if these externality eflects are
not present or are modesl relative to the impacts of space diverted lrom providing housing for residents to
providing short-term acconrmodation for visitors, then local concentration of Airbnb properties may increase
house prices.
Perhaps because of this confusion, it is possible to find divergent viewpoints expressed about the impacts
of Airbnb in the popular press and in consultant reports. Most policy makers appear to believe that Airbnb
causes housing prices to increase. ln October of 2016, New York Governor Andrew Cuomo signed into law
a bill providing for a range of fines to be imposed on those who advertise entire apartnrents or dwellings
2Therq are several firms similar to Airbnlr. As these types of companics. become more prevalent and continue to expand,this area of research becomes increasingly important, as such firms rrrostly enter highly constrained and regulated markets, thedynamicsofwhichoftenhavewelfareconscquenccs. Thcanalysishcreisnotdirectlyapplicableto,forexample,unilerstanelingthe economic impact oi Uber on a city, a ride-sharing service. However, the rescarch piesented in this paper suggests thatthese companies can have a significant impact, one worthy of study.
3This is largcly due to New York State's Multiple Dwelling Law, which irnposes strict regulations on safcty and healthconditions that must be met as wcll as linrits on business uses of hornes.
2
D000083
FILE
D D
ATE:
6/2
1/20
19 6
:51
PM
2016
CH
1548
9
for time periods of less than 30 days. The issue of the impact on house prices was presented as a central
argument for passage of the law, as noted in Brustein & Bedhelsen (2016):
Liz Krueger, the state senator who sponsored the bill, said in a statement that the passage was
a " huge victory for regular New Yorkers over the interests of a $30 billion corporation." She
has argued that Airbnb has actively encouraged illegat activity, taking apartments off the rental
market and aggravating ttre cily's affordable hr:using crisis.
The response of Airbnb was to characterize the law as a policy designed to protect the hotel industry
rather than concern over housing affordability. Brustein & Berthelsen (2016) go on to report that:
Airbnb says New York lawmakers had ignored the wishes of their constituents. "Albany back-
room dealing rewarded a special interest - the price-gouging hotel industry - and ignored the
voices of tens of thousands of New Yorkers," Peter Schottenfels, a spokesman for the company,
said in a statement
At the time of the Attorney General's investigation in 2014, Airbnb had experienced an increase of over
1000% in both listings and bookings from 2010 to 2014. To understand Airbnb's scale of growth, or at leasl
the way their investcrs value its business, an oft cited statistic is that in its most r:ecent funcling round, Airbnl:
was valued at approximately $318. This suggests it is niore valuable than Marriott lnternational lnc., whiclr
has a market capitalization of $tZ.gn and which owns over 4,000 hotels. ln 2-0L4, Marriott lnternational
lnc. had $13.88 in revenue, over ten times Airbnb's projected revenue in 2015 (Kokalitcheva 2015) a.
That investors are still wiliing to purchase an equity stake in Airbnb at its current valuation $uggests an
expectation of continued, extraordinary growth. Their expected revenue far 202A is $108, implying an
annual growth rate of approximately -t-75% (Kokalitcheva 2015).
Confronted by such rapid growth, the New York Attorney General's investigation is typical of concerns
about the presence of Airbnb in cities across lhe world. Central to this consideralion, according to author
Doug. Henwood, .is
the potential of Airbnb's, "real, if hard-to-measure, impact on housing availability and
aftordability in desirable cities," (f-lenwaod 2015). We will argue below that almost all of the welfare
consequences (both positive and negative) of Airbnb circle around the question of its impact on housing
4Although Airbnb's total revenue for ihe third quarter of 2AL7 was estinrated at nrore than $1 billion, so its continuedgrowth is making it a serious rival to major hospitality firnrs.
.lJ
D000084
FILE
D D
ATE:
6/2
1/20
19 6
:51
PM
2016
CH
1548
9

prices. Our analysis examines the question of Airbnb's impact in the context of New York City by presenting
both empirical evidence and theoretical arguments that help us to understand Airbnb's impact on residential
housing prices * an issue that has been raised frequently but rarely studied carefully. This paper seeks not
to make a judgment on whether or not Airbnb is gaod or bad for cities (which in any event would depend
crirically on which population was being considered), but rather to provide the first quasi-experimental
estimates of Airbnb's impact on neightborhood residential housing prices by focusing on the case of New
York City.
ln New York City, Airbnb activity tends to be heavily concentrated in the boroughs of Manhattan and
Brooklyn, with some concentration in portions of Queens that are close to La Guardia airport or have good
access to Manhattan. As of November 17th, 2015, there were a total of 35,743 active listings in New York
City. These listings constitute a sizable portion of the accommodations industry in New York City, as there
is a total of approximately 102,000 hotel rooms in the entire city (Cuozzo 2015).5 Airbnb has an apparently
significant presence in' New York City and many other cities across the world. The question is whether
making these properties available to a population not normally resident in the city has an impacl orr prices
and, if so, whether Lhe efFecl is !o increase or rJecrease prices.
2 Cnntemporary Policy Debates and Literature
Residents of cities and local governments across the world, both in favor and against Airbnb's presence,
are growing increasingly vocal. The arguments against Airbnb focus primarily on three areasl6 1.) Airbnb's
impact on decreasing afforclability, 2) the negative externalities caused by Airbnb guests,? and 3) the shadow
5There are 3,394,486 housing units in New York City rneasured in 2013 (Been, Capperis, Roca, Ellen, Gross, Koepnick &Yager 2015), meaning that over 1% of housing units were being rctively listed on Airbnb on November 17th, 2015. Given
that the distribution of Airbnb is not normally distributed throughout the city, we should expect that in some areas, the ratioof Airbnb listings to total units is significantly higher.
6An article on the impact of Airbnb in Los Angeles articulates these concerns clearly: "Airbnb forces neighborhoods and
cities to bear the costs of its business model. llesidents must adapt to a tighter housing market. lncreased tourist trafficalters neighborhccd character while introducing ncw safety risks. Cities lose out on revenue that eould have [reen invested
in irnproving rhe basic qualiLy of life for its residents. Jobs are lost and wages are lowereel in the hospitrlity induslry"(5aJnaan 2015, p. 2).
7l-lorlon describes this phenornenon well: "lf Airbnb hosts bringing in lnud or disreputable guosts but, critically, stillcollect paynrent, then it would secni to creatc a classic case of un-internalized externalities: the host gets the money and hei"
neighbors get the noise" (Horton 20t4, p. l). Recently Airbnb has even been criticized in Whyte (2?fi) for the problem
of "overtourism" which we are assured is a "very real" problem, despite its sinrilarity to the complaint that one's favorite
resi.aurant rrow requires reservations. We can Lrncierslattd this as a prcbletn in the sensc thlt increasing tourists is eifectivelyincrcasing urban pcpulation, which in t closed-ciiy rnodel reduces r.quilibriutn r,rtility levels.
4
D000085
FILE
D D
ATE:
6/2
1/20
19 6
:51
PM
2016
CH
1548
9
hotel industry that allows commercial operators to use Airbnb in order to evade important safety regulations
and taxes,B On the other side, those who argue in favor of Airbnb's presence tend to focus on its positive
economic impact on the city, including creating new inconre streams for residents as well as encouraging
tourism and its associated economic benefits for a city (Kaplan & Nadler 2015).
The contemporary policy debates surrounding Airbnb can be summarized by the following question:
should Airbnb be regulated and, if so, what is the appropriate type and level of regulation? This has been
debated in New York City Council Hearings, protests have formed in support of and against Airbnb, and this
past November (2015), Airbnb even made it onto the ballot in San Francisco through Proposition F.e There is
strong language on both sides; some are scared of Airbnb's impact on the affordability of neighborhoods and
others suggest that its net welfare effects are positive. Additionally, the policy debates surrounding Airbnb
and other sharing economy companies are concerned that these companies degrade important regulations.
Arun Sundararajan argues that new regulations need to be developed to protect individuals, both consumers
and workers, as a result of these companies: "As the scale of peer-to-peer expands, however, society needs
new ways of keeping consumers safe and of protecting workers as it prepares for an era of population,scale
peer-to*peer exchange" {Sundararajan 2014).
ln the New York City Council hearings, as well as in protests and debates in the public sphere, there
is a lack of data and analysis upon which people can rely. Because of this void, arguments are, to put it
bluntly, mostly rhetorical and ideological rat.her than empirical. Thus, in addition tr: pursuing the analysis
of Airhnb's impact on housing prices in New York City, the data collection work inclucleci in this paper will
also hopefully begin to fill that void so that individuals can better understancl Airbnb's impact in a way that
is mathematically rigorous and econometrically robust.
To our krrowledge there is only one other careful scieniific stucly thal estimaLes the direct impact of
Airbnb rental availability on house prices. Barron, Kung & Proserpio (z}fi) examine the impacts of Airbnb
listings on the value of house price and rent indices in US cities. Their analysis, working as it does with
aggregate (zip-code level) price trends, mLrst deal with the potential endogeneity of the nurnber of Airbnl:
Jistings. They deal with this by constructing an instrurnent based on Google Trends searches for Airbnb.
sMuch of the uproar in New York City concerns non-uniform taxation arrd regulation; hotels and moiels face taxes whiclrAirbnb is not currently subject to. ln New York City, it is up to ho$ts to pay taxes on the reveilue they generate from Airbrrb.ln sonre other cities, Airbnb has a "collect and remit" feature to collect taxcs.
ePraposition F was ultimately rejected but would have limited the number of nights :n Airbnb coulcl be available eachyear.
5
D000086
FILE
D D
ATE:
6/2
1/20
19 6
:51
PM
2016
CH
1548
9
Unfortunately, these are not ac'curately available at the zip code level, so to obtain an instrument that
varies at the zip code level they interact these searches with a measure based on the number of food
service and lodging establishments in the zip code area. Whatever objections might be raised concerning
the instruments, they do find that an increase in Airbnb listings is associated with an increase in house
prices and rents.
2.L Research on peer*to-Peer Platforms
Compared with research on housing markets and how their organization affects price outcomes, there is
even less literature on the economics and impacts of peer-to-peer lnternet markets. The existing literature
provides a basis for addressing two main questions: 1) ln what ways do peer*to-peer markets create economic
efficiencies? 2) How do peer-to-peer platforms impact markets in auxiliary ways (e.g. over and above
"normal" ways of doing business)? The remainder of the literature review will be devoted to understanding
some of the most imporlant contributions in this area and its application to this paper.
Einav, Farronato & Levin (2015) revicw some important considerations that allow these types of markets
to exist. Among other things, they highlight the difficulties associated with designing these markets, such
*E search, trust *nd reputation, and pricing rnechanisms. We will review a few cf the impor,tant {indings in
the way they relate to Airbnb.
[inav et al. (20i5) review some of the policy and regulatory issues that arise in the context of peer-to-
peer markets, such as the dichotomy that local businesses are often subject to certain entry ancl licensing
standards (such as limits cn resid*ntial short tcrm rcntals), urhile companies like Airbnb are,often ahle to
evade these regulations. There is not a clear solution to these issues. On the one hand, one nri6ht argue that
these regulations are an important response to market failures (Einav et a[. 20].5, p 19), while others might
argue these regulations reduce competition by favoring incumbents. As has been expressed, an important
motivation of this paper is filling the void in quantifying the impact of one peer-to-peer market. Einav et al.
(2015) makes clear that grappling with these regulaLory quandaries requires empirical work: "the eflect of
new platforms for ride-sharing, short-term accommodation or other services on pnces and quality, and their
consequences for incurnbent businesses, are really empirical questions" (Einav et al, 2015, p. l9).
Peer-to-peer markets, like Airbnb, l'ace trernendor:s obstacles in having to match buyers and sellers. One
6
D000087
FILE
D D
ATE:
6/2
1/20
19 6
:51
PM
2016
CH
1548
9
of the difficulties is balancing a breadth of choice with low search and transaction costs. As such, Airbnb
provides users (those looking for lodging) with a simple search mechanism with quick results, allowing these
users to then filter more selectively based on desired criteria, like exact neighborhood, number of rooms, or
price. ln terms of pricing mechanisms, Airbnb allows its hosts to adjust their own prices, rather than set
prices based on market conditions as is done for companies like Uber and Lyft,
An important question that Airbnb must grapple with is how to facilitate trust between users and hosts
on the platform. The way Airbnb deals with this is through their reputation mechanism, which allows both
hosts and guests to review each other. Trust in the platform depends on the success of the reputation
mechanism.lo
Levin (2011) highlights a few of the most distinctive characteristics of peer-to-p€er markets and then
delves into some of the economic theory applied to these types of markets . One particularly relevant
feature that he highlights is the ability for these types of markets to facilitate customization, which has
the potential to lead to a superior matching process between buyers and sellers. The paper reviews a wide
body literature on different elements of internet markets. Varian (2010) also reviews the existing literature
in this field and discusses the implications of markets moving online such as the ease of scalability, the
unprecedented anrount of data, and the ability for firms to experiment at significantly lower costs. Horton
& Zeckhauser (2016) models a two*sided peer-to*peer nrarket by examining the decision to own and/or
renl as both short-run and long-run consumption decisions. ln addition, they also conduct a survey to
enrpirically evaluate consumers' deeisions to own and rent clifferent goods. Yet while each of these papers
both review existing knowledge and provide theoretical frameworks (mostly around transaction costs), none
ask the questions regarding the empirical impacts of such platforms on market values of underlying assets
being used or traded in these markets.
The most relevant research to this paper is Zervas, Proserpio & Byers (2016). lt is the only paper of
which we are aware that attempts to quantify Airbnb's impact on local neighborhoods. Focusing on Airbnb
usage in 'Iexas, the main findings are that a L0% increase in the number r:f listings available on Airbnb
is associated with a A34% decrease in nronthly hotel revenues using, in their main model, a difference'
in-differences design with fixeei efiects.ll Their clifference-in-diflerences desigrr examines tlre cliff'erence in
l0There exists literatrrre on Airbnb's reputation mechanism, narnely Andrey Fradkin's research, "8ias and Reciprocity in
Online Reviews: Evidence From Field fxperiments on Airbnb" (Fradkin, Grewal, |"loltz & lrearson 2015).llln cities where thcrc is lrighcr Airbnb penetratiorr, they find a significantly more pronounccd effect. ln Austin. they find
7
DOOOOBB
FILE
D D
ATE:
6/2
1/20
19 6
:51
PM
2016
CH
1548
9

revenues "before and al'ter Airbnb enters a specific city, against a baseline of changes in hotel room revenue
in cities with no Airbnb presence over the same period time" (Zervas et al. 2016, p. 11). ln order to make
a causal claim based on their estimates, they test for and assume that there is no endogeneity that drives
both Airbnb activity,/entry as well as hotel revenues.12 This paper has served as a helpful resource for how
to estimate the impact of Airbnb activity on the housing market, though there are of course significant and
notable difference in our analysis and that of Zervas et al. (2016), the biggest of which being that we are
estimating the impact on residential housing prices (in New York City) rather than hotel revenue and that
we consider both a hedonic model with fixed effects as well as a difference-in-diflerences strategy,13
3 Theoretical Perspectives
ln this section we present an overview of theoretical arguments that could justify an a prioriview that Airbnb
listings might have an impact on residential property values. Where possible, we identify the direction of
such impacts.
3.1 Overview
The intuition for expeeting Airbnb to have an impact on residential property values is relatively straightfor-
ward. First, unclcr rnany circumstanees residences can be held as an asset and rcnted via Airbnb to producc
an income stream. This can permil" speculating for potcntial capital apprecialion as well as generating renLal
income during the per.ioel nf ownership, This potential income and capital gain nright both draw investors
to purchase residential property not for their own use and to hold onto properties for longer because rental
income obtained via Airbnb reduces the cost of ownership. [ither of these mechanisms would increase ef-
fective demand for horLsing and drive up the price of sales and rentals on these units. This would potentially
affect both freehold sales price and rental price because the willingness-to-pay of both buyers and renters
would be increased due to this potentiaI increase in income.
that Airbnb activity has decreased hotel revenues by L00/ol?One thing to note about their difference-in-differences strategy is that their lreatrnent group is defined after'the first
Airbnb lisling enters thal nrarket. For a robr-rstness check, they also change this trcatment to bc alter ten and fifty Airbnblistings are available in a given location. To further test lhe robustness of their main specification, they also include dif[erentmeasures of Airbnb penetration, guch as lirniting their analysis to only include listings which have received at least r:ne review.
l3There is also ongoing research by Chi;ra liarronato and Andrey Fradkin, which seeks identify the impact of Airbnb activityon hotel revenues across many citics in the United States.
B
D000089
FILE
D D
ATE:
6/2
1/20
19 6
:51
PM
2016
CH
1548
9
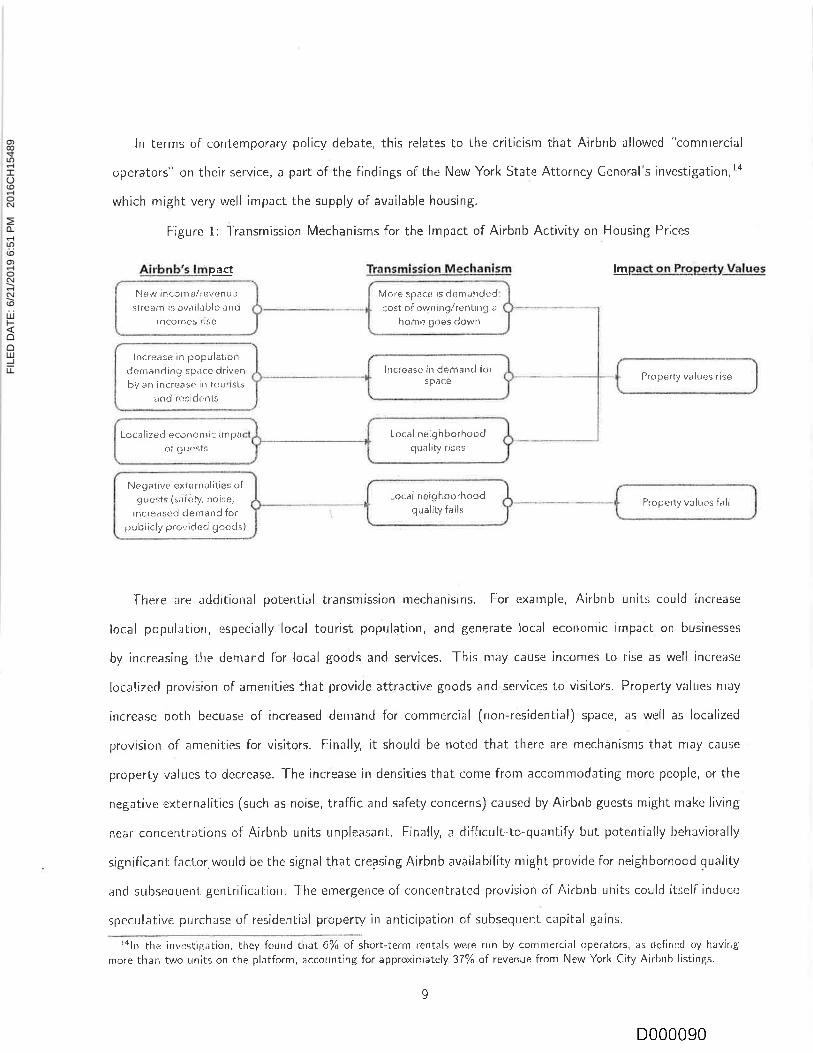
ln terms of contemporary policy debate, this relates to the criticism that Airbnb allowed "comnrercial
operators" on their service, a part of the finclings of the New York State Attorney Genoral's investigation,la
which might very well impact the supply of available housing.
Figure 1: Transmission Mechanisms for the lmpact of Airbnb Activity on Housing Prices
Airbnb's lmpeg! Transmission lVlechanitrn lmee-st-9.!-f(opsrtylfa&91
There are addirional potenlial transmission mechanisns. For exarnple, Airbnb units could increase
local population, especially local tourist population, and generate local econonric impact on businesses
by increasing the demand for local goods and services. This nlay cause inconres to rise as well increase
localized provision of amenities that provide attractive goods and services to visitors. Property values may
increase both becuase of increased demand for commercial (rron-residential) space, as well as localized
provision of amenities for visitors. Finally, it shoLrlcl be noted that there are nrechanisms that firay cause
property values to decrease. The increase in densities that conre from accommodating more people, or the
negative exlernalities (such as noise, traffic and safety concerns) caused by Airbnb guests might make living
near concentrations of Airbnb units unpleasanr, Finally, a difficult-lo-quanlify buL potentially behaviorally
significant factor.would be the signal that creasing Airbnb availability nright provide for neighborhood quality
and subseqrrerrl gcntrificalion. -I'he emergence of concenLrated provision of Airbni: units could itself induce
speculative purchase of residential property in anticipation of subsequerrt capital gains.
lalrr the investigation, they found th;t 6% ol short-terrn rentals were run by comnrerciai operators, as defined by hirving
nrore than two units on the platforn-r, accouniing for approxinrately 37% of revenue from New York City Airbnb listings.
9
New incornelrr.'venucgtrcam is ;rv;rilable and
rncorneg rite
More lp;lr:e is clcmandedcost of ov/ning./reniirrg a
honre gcles cJown
Property values riselncrease in demancJ lor
space
lncrease in g:opulaliond*nranding :pace drivenby an incre;rse: in toutists
ind rcsidonts
Local neighhorhoodquality risos
Localized econornic impar:f tTrrclts
Local n*ighborhcrodquality falls
Neg;r1rve exlernalili*s o[guests {sa{ety. noi:e,
increased derrend forpubiicly provided goods)
Properly valrrts flll
D000090
FILE
D D
ATE:
6/2
1/20
19 6
:51
PM
2016
CH
1548
9

ln Figure 1, we outline some of these potential transmission mechanisms for how Airbnb might impact
housing prices, As noted in the figure and mentioned above, there is the potential for the impacts to both
increase and decrease house prices. While some of the arguments advanced in policy discussions seem to
raise the possibility of impacts in both directions, impacts that increase property values and make housing
less affordable are the primary focus of most discussion. ln the subsections below we consider in greater
detail two approaches that suggest the likelihood of this outcome.
3.2 Capitalization
Consider a city in equilibrium, with equilibrium welfare of residents is given by u, For a house located at
distance;r the annual rent that will be paid by a resident isthen given by ll.(t,r). Here we suppress other
parameters such as transport costs t and parameters of the utility function that will obviously aflect the
equilibrium rent function at each location and for any given level of welfare.
There is a relationship between this annual rent at r and the structure price P which is given by:
n R(u,c)u
(1)
where u is the user cast of ltousing
u" * ri-l- r,.r -, - (r'rn+ i.r) + 6 * g + I (2)
-fhis model has l':een applied and discussed by Sinai & Souleles i?005) and Kuttner & Shim {2012). ln
the present context, we need to account for the fact that the Airbnb income is taxable income. lf a > 0
is the expected annual Airbnb rental as a percentage of house value, then we augment the expression for
user cost of housing to:
rt,*r*-l-w-" r.{r,o"l-t:)+ d--.f 1-?" (t --r)"e (3)
with
r0
D000091
FILE
D D
ATE:
6/2
1/20
19 6
:51
PM
2016
CH
1548
9
Variable lnterpretation
r* Risk free annual interest rate
a Property tax rate as a percent of market. price
r Effective tax rate on personal income
?"n Annual mortgage interest rate
d Maintenance costs as a percent of rnarket price
.g Expected percent capital gain or loss
''t Ownership risk premium
cr Airbnb rental as a percent of market price
Essentially, this defines (or is irnplied by) the process of capitalization, relating the rent, property tax,
mortgage ancJ risk-free interest rates, maintenance costs, expected capital gains and ownership risk premium
to the price of the structure. We need to add to this an expression that allows for the use of Airbnb as a
mechanism for earning revenue from the asset.
Assuming that at least partial capitalization takes place, and that &(.) > 0 and r < 1 we will have
.95 t O Assr-rming that owners are forward-looking, face finite interest rates, and purchase properties in
eompetitive nrarkets we weiuld expect at l*asf paftial capitalization so that praperty values would rise.
This is perhaps the simplcst theoretical perspective that implies a positive relationship between the
presence of Airbnb as a service that available to property owners and the freehold price of rcsidcntial
property. 'fhe Airbnb service provicles the opportunity to earn additional income by virlue of ownership of a
residcnce. "fhe present valuc ol'this income slre;]rn, available contingcnt on ownership, would incre:se the
market price of properties as long as capilalization takes place.
3.3 Simple monocentric model
What are the mechanisms through which Airbnb activity might impact hou.sing prices? This section will ex-
plore this question using an extremely simple monocenlric urban model, with residential space and consurnp-
tion of o'thr:r goods l:eing perfee:t conrplenrenls. Despite its simplicity, many ol'the essential cotnparative
static irnpacts of increased Airbrrb activity can be clearly clenronstrated.l5
15 fhese types of models are based on the original Ricardian Theory of Rent (f6f7) (DiPasquale & Wheatorr 1996)
11
D000092
FILE
D D
ATE:
6/2
1/20
19 6
:51
PM
2016
CH
1548
9

As outlined in Figure 1, there are several ways in which Airbnb activity might impact housing prices. On
the demand side, we might reasonably expect that the Airbnb service provides homeowners with an increase
in income and as a result, more space would be demanded. Furthermore, as a result of Airbnb, there is an
increase in the population of the city demanding space or equivalently an increase in the space demanded by
each household.l6 Local incomes and population may also increase if there is a localized economic impact
caused by guests spending money in areas near their Airbnb listings. Finally, there might be a negative
externality of .guests, such as noise, decreased security, or simply additional demand for publicly provided
goods (such as transportation).
These comparative-static results are formally derived and well-summarized in Brueckner (1987a). Within
the context of a simple open-city model with all agents sharing a common utility function, he shows that
an increase in population is associated with an increase in rents at all locations, and an increase in income
is associated with a decline in rents for locations closer to the CBD and an increase in rents for locations
further away. Because the analysis uses an arbitrary utility function, there is no single parameter that can
represent an increase in demand.
ln an effort to clarify these predicti<lns while at the same time representing an environment that might
better approximate the limited substitutability between space ancl cther consumplion that characterizes an
thoroughly built-up area like New York City, we consider a special case of the more general model considered
in Brueckner (1987a).
Consider a "perfectly complementary" city where all households regard "space" and "other goods" as
perfect complements. The utility function will be ol'thefornt: tl(n,$,o) * rnin(c-'s,o), where s represents
the amount of space and o represents dollars spent on other goods.l7 ln this model, s can be understood
as either lancl or interior living space; the same intuition holds. n is a preference parameter with demand
for "other goods" increasing in rr and the demand for space decreasing as rr increases. r is the land-rent
function, which refers to the cost of land.
l-louseholds have income, nr, and all households are employed in the central business district (CBD)
16lndeed, a common anecdote among thqse purchasing homes is that they.purchase a bigger honre, one with more bedrooms
for exanrple, because they have the abiiitv to rent orrt that l:edrootn during peak seasons like holidays to help col,er the cost
of a mortgage.l7The qualitative comp;rrative statics, e.g. the sign of changes ta rn, tr,.s, (v, o, and N, do not depend on this particular
utility function. lts sirnplicity nrakes it an attractive choice for a model. A more general case is presented in Brueckner
(ie87b)"
12
D000093
FILE
D D
ATE:
6/2
1/20
19 6
:51
PM
2016
CH
1548
9
which is located in the center of the city. As is customary, the CBD is regarded as a point in space. This
implies that there are no difFerences in where a household is employed within the CBD. lf a household is
located r distance from the CBD, they must pay f . z annual commuting costs. Thus, a household will
have rn * t . r remaining to spend on space (s) and other goods (o). Consider distance and space to be
measured in the similar units (e.g. meters and square meters).
Solving for the dernand for s and o at distance r, we have:
NL(4)
o 'l'T'
Equation 4 implies that s is given UV T#, and o is given by k?#-. Because rn'in(o*,o) : u and
usno,weknowthatrls:ri,whichimpliesthat.s:'1{. Becauseahouseholdcanchoosewheretolocate
in the city and rn is equal across the population , we know that every household with a given income, nz,
and cr consumes the same amount of space. We can solve for rent as a function of utility and distance frorn
the CBD^
Solving i# : ! for r, we obtainr
( t r)aa
utrn,*t.:r;*-u.)u,
(5J
Equation 5 presents the equilibrium land-rent function. At every point z (the distance to the CBD), r
is determined by utility (u), incorrre (nz), transportation costs (t), and a preference parameter (n). As a
natural component ol'spatial equilibriurr, , utility wifl bc equal across all hcuseholds and locations {otherwise
households will move to maximize utility). This implies that property values fall as * (distance to the CBD)
increases in order to equalize utility at every location. This must be the case because the farther away a
household tives from the CBD, the more they spend on commuting costs (recall that commuting costs are
equalto f .r). Furthermore, in equilibrium all N households must be accommodated in the city, so property
values must be sufficiently high in order to bid space away from alternative use^
Wittr ,tr total households, the total space bought by the households is A1s.rB ln a classical urban model,
l8-Fhis model could be expanded to muliiple classes, but the intuition and forthconring results hold and so for sirnplicity, we
will assunreaone-classmodel. Amulti-clas-smodel couldtake theformof differentlevelsof incorne,rn,oroftherrpreferenceparamcter, nrocleled by a di:;tributian o{ f (tu| ,*).
IJ
D000094
FILE
D D
ATE:
6/2
1/20
19 6
:51
PM
2016
CH
1548
9
?"o represents the agricultural price of land, but we can consider ro to simply represent the opportunity
cost, or alternative use value, of land. The total land "bid away" from this use is the land area where the
price of space is greater than r.,. The radius of the city, X, is determined when the value of land becomes
equal to the value of space in alternative uses, so it is therefore the maximum distance from the CBD.
The equilibrium requires that r\ ii is equal to zi(X)2. This is the case because the (circular) city needs to
accommodate the entire population and all spacc in the city will be consumed. lf we set these two equal,
we can solve for the equilibrium level of utility.
!. .-.-.(--,nrt * vl| Nt2 -F 4,m rr, + cv))
'2n(r,, + a)
a(Nt2 j'2rntr(r,,.+ a) * .,/F 1ll.? + 4mn(r,, -* *))(6)
u.Y2r(ro 1' tu)2
Because X must be positive (it is a distance), applying 6, the equilibrium land rent function is:
(*m,+ u, * t. r)a'tt
Zrrurro(r,o -i- cv) -t- d(--,fufcr -- 2r:r(ro + *f + {Na (7)
;Vt? * 2rrnr(ln+ a) * v'Ft iu t, 4- 4nt;r(r'o +' <t
We can now look at tlre inrpact r:i i:lrree eJiffbrent exogenous variatjles that could change as the level of
Airbnb activity inereases, ,V,r.r, and rn,, on the land-rent firnction. These impacts are illustrated in Figures
2, 3, and 4. We can determine the impact of populaiion by taking Lhe derivative of the above land-rent
function with respect to ,V.
dr Zrt(*nt + t .r)(r," -f- cv)2
N * Antr ro -1" a
d/Y- (/n/ N * 4m,tr T,, * {! (* nt' *2mx(r',"+a) +.,/Att lr/i2+ 4rnr(r,,+a.))(B)
A rise in AI is associated with an unambiguous increase in the value of space l at all distances r, and an
increase in the slope of the rent gradient. The land-rent function must rise to bid away additional residerrtial
space frr:m alternative uses in more remotc parts of the city {c.g- the urtran periphery). HqLration 6 implies
th;it the increase in Iy' results'in reduced Lrtility it, and therefore reduced consumption of space by each
household and higher population density. Spatial equilibrium requires thet the value of space per unit area
clecline by just enough to cornpensatc for the extn transportation costs of houscholds residing in that arca.
l4
D000095
FILE
D D
ATE:
6/2
1/20
19 6
:51
PM
2016
CH
1548
9

lncreasing density implies an increase in toial transport costs per unit area, so increasing r requires more
compensation - i.e. the land rent function must be steeper.
Why might the impact of Airbnb be modeled as an increase in ly'? ln this simple model, lf is fixed and
exogenously determined. Airbnb listings allow more people (e.g. tourists) to occupy the city. For example,
if a city experiences e private room listings, filled each night, the city has experienced an increase of z in
Ai.
We can also determine the impact of income by taking the derivative of the land rent function with
respect to zll,:
0r 2trt(ro+ u)2(2ur1/Nr(r,,* u)(n,L'*2r'r(ro+ *))( -v[lVt r \NF*:w;(;;?,fl)ih" - (e)
Airbnb presents homeowners with a new revenue stream. We can model this as a rise in income. With
an increase in incorne, households will spend more both on space attd r.rllter guuds, atttl itt Llre prutess
experience an increase in i7. As a result, the city must expand. Because land consumption increases, density
is reduced so the rent gradient will get flatter, implying that rents will fall in more central parts of the city
and rise in more remote parts of the city. Figure 3 illustrates this effect.
Figure 2; J"heoretical lmpact of a Rise in Population
tt rl):rcl oi art irtr:tUJsrl
irr prlnt.rl;llir:n
CBD
Firrally, we can dete rmine the inrpacl cf ,': by taking thc derivative of the above land-rent function with
r
X
.t5
D000096
FILE
D D
ATE:
6/2
1/20
19 6
:51
PM
2016
CH
1548
9

Figure 3: Theoretical lmpact of a Rise in lncome
CBD
Figure 4: 'fheoretical lmpact of a Decrease in a
!rnpar:t af en ir:crease
in ineq:m*
tmp*et *f * dsere*sein u {tar::rtir(; irr} ittcre;ese
i* th* ***si;nptian o{ sp***}
r
X
/-Dn\.u L/
16
D000097
FILE
D D
ATE:
6/2
1/20
19 6
:51
PM
2016
CH
1548
9
respect to cv, which gives
0ri)"
t(rnJN + :r(t/Nt + Nt'} +- 4'rnr(r',, * a(10 )
n'L 4 4rn rr, + a)
An increase in cr causes a decrease in the demand for space and vice versa. The impact we nright expect as
a result of Airbnb is a decrease in a, which would cause an increase in the consumption of space as resiclents
purchased larger homes with seeking investment returns via short-term rentals. How does a decrease in cv
impact rent? Rent in the urban periphery, e.g. in more remote parts of the city, will rise by bidding away
space from alternative uses to make available for residential housing consumption. The higher consumption
of space wil[ reduce density which in turn will reduce the slope of the rent function r (see Figure 4). As in
the case of increasing income rn, there would be a reduction in the cost of space in the city center and an
increase at the periphery. Thus, the impact of changing cv does not have a uniform impact.
lf an increase in Airbnb activity in a clty were equivalent to a rise in -ff we wt;ultl llterelore be juslifiecl itr
expecting an unambiguous rise in rent and prcperty values, with a larger impact observed at more central
locations. On the other hand, the theoretical impacts of r: and 'rn, are ambiguous so that if an increase in
Airl1nb properties primarily affects the household demand fe:r space or provides greater income there remains
an empirical question to measure the actual impacts. I his provides motivatiotr for: the empirical research
presented below.
4 Data & Descriptive Statistics
Table 1 describes the diflerent data sources used as weil as lheir main uses. ln total, there were eight main
sources of data: 1) lnsideAirbnb, 2) The Department of Finance Annualized Sales Data (January 2003-
August 2015), 3) -l-he Department of Finance "Places" or "Areas-of-lnteresl" Map, ) Department of City
Planning PLUTOTM, 5) The 2AL0-2014 American Community Survey, 6) The New York Police Department
Crirne Statis1ics, 7) Census Geergraphy Maps, and B) the Metropolitan Transportation Authority Map of
Subway Entrances.
77
D000098
FILE
D D
ATE:
6/2
1/20
19 6
:51
PM
2016
CH
1548
9
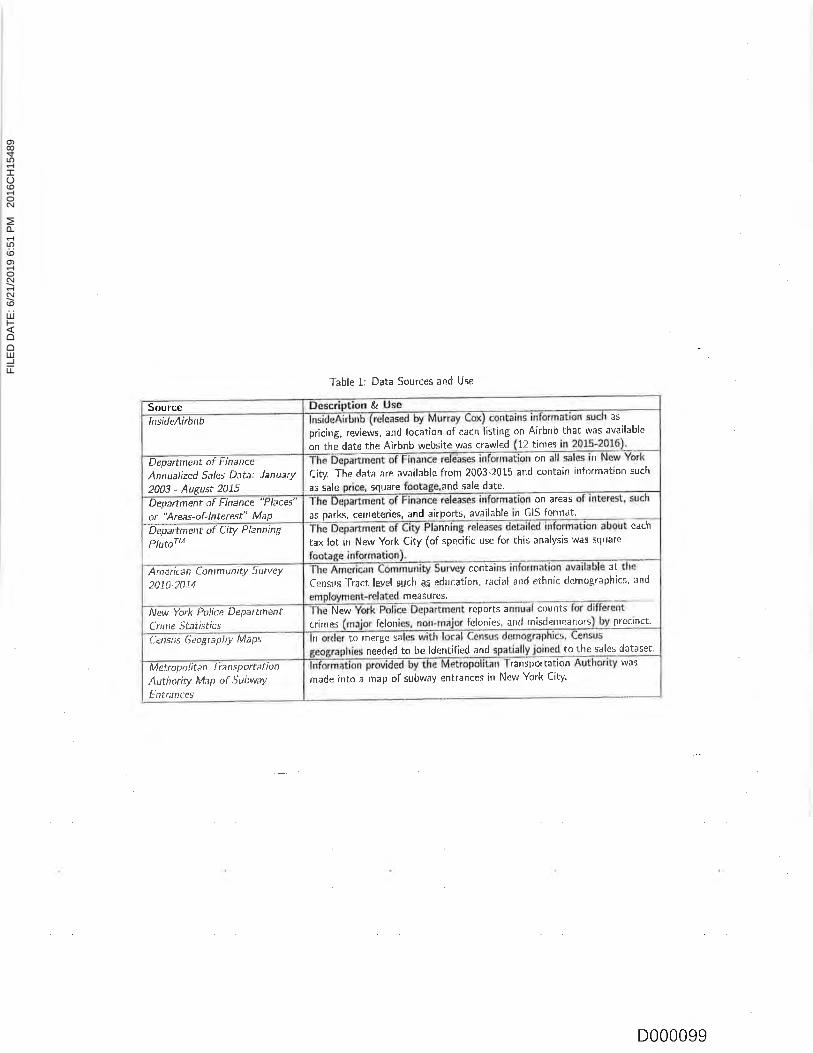
Table 1: Data Sources and Use
Source &lnsideAirbnb as
pricing, tevlews, and location of each listing on Ai rbnb that was ava ilable
on the date the Airbnb website was crawled T2 times
Department of Finance
Annualized S":les Dafa; JanuarY
2003 - August 2015
on tn
City. The dat; are avail able from 2003-2015 an<l contain information such
as sale square and sale date.on areas
a5 parks, cernet€ri€9, and airporls. availahle tn G15 format.Department of Finance "Places"
or "Areas^of-lnterest" MaP
biiaitment of City Planning
PlutorM
nn each
tax lot in New York City {of spccific use for this analysis wat sq(rare
c0nta at
Cen*us Tract level..ruch eg edUcaliqn, racial and ethnic dcmographics, and
mea$ur{!s.
New feportg a counts
cntneS felon f*lonies, antJ misdemeanors preclnct.
American CamrnunitY 5 urveY
201*"2014
New York Poli€e De1attrftefit
Grire SfiiisricvCettsus 6eag,raplrY MaPs n to merge sa
needed to be identified and to the sales dataset.
M etrap alita n 17* ns PartationAuthority Map of SubwaY
Ln*ances
lansportation w3s
rnade into a rrap of stlbway entrance.s in New Ycrk City.
D000099
FILE
D D
ATE:
6/2
1/20
19 6
:51
PM
2016
CH
1548
9
Table 2 and Table 3 document descriptive statistics for the variables used in this analysis. These data
were aggregated and joined together using ArcGlS and Stata. Not all,of these data are available at the same
geographic scale. For example, crime statistics were only available to us at the geographic unit of precinct,
which means that when controlling for crime for each sale, precinct is the level of granularity being used.
ln all, there were l-,252,891- observations (sales) from January 20A3 through August 2015. We dropped
145,594 observations because they were non-residential sales, and 3l-9,975 observations were dropped that
had sales prices below $10,000,1e We dropped 4,533 observations with sales prices above $10,000,000,
and 2,552 observations were dropped because they were missing square footage information (or if square
footage was below 10ft or above 50,000ft), leaving a total of 780,237 observations. Approximately 16,000
observations were excluded because they could not be properly geocoded.
For each of the re maining observed sates, we have information on sale price, sale date, square footage,
and property type, along with some other variables in the Departntent of Finance Annualized Sales Data.
Before describing how we are calculating Airbnb activity that could influence each sale, it is important to note
the other information that was joined to the sales data" Most of the data, such as crinre, Census information,
distance to subway entrances and areas-of-interest, could be spatially joined using a combination of ArcGlS
and Stata.
ln the Department of Finance sales data, square footage was missing for approximately 50% of the
observations. The size of the residential property is oF:vicusly an important variable for a hedonic regressiort
or as a control firr matching observations in a quasi-experimental approach. Rather than simply dropping
half of the observations or exclucjing square footage as a variable, we enrployed a techrrique using the
PLUTOTM dataset. PLUTOTM contains information on residential area (measured in square feet) and the
number of residential units by Tax Lot and Block, both o1'which are very snrall geographic units o[ ;rrea.
There are 857,458 Tax Lots with a mean of 1.254051 builclings per Lot, We calculated square footage
by dividing residential living area by the number of residential units in each Lot and we were then able to
join the sales data with this information to have a measure of square footage for an average unit in the
same Lot as the sale.20 While this method is not perfect, units in the same building and Lot tend to have
re$ales below $10,000 do not represent the aetual sales prices ol properties in New York City. Rathcr, they are eithcrrrissing appropriate data or are bequests fronr one generatiotr.
20For some sales, we were unable to join average square footage per Tax Lot. ln these cases, we used average $quare
footage per Tax Block.
19
D0001 00
FILE
D D
ATE:
6/2
1/20
19 6
:51
PM
2016
CH
1548
9
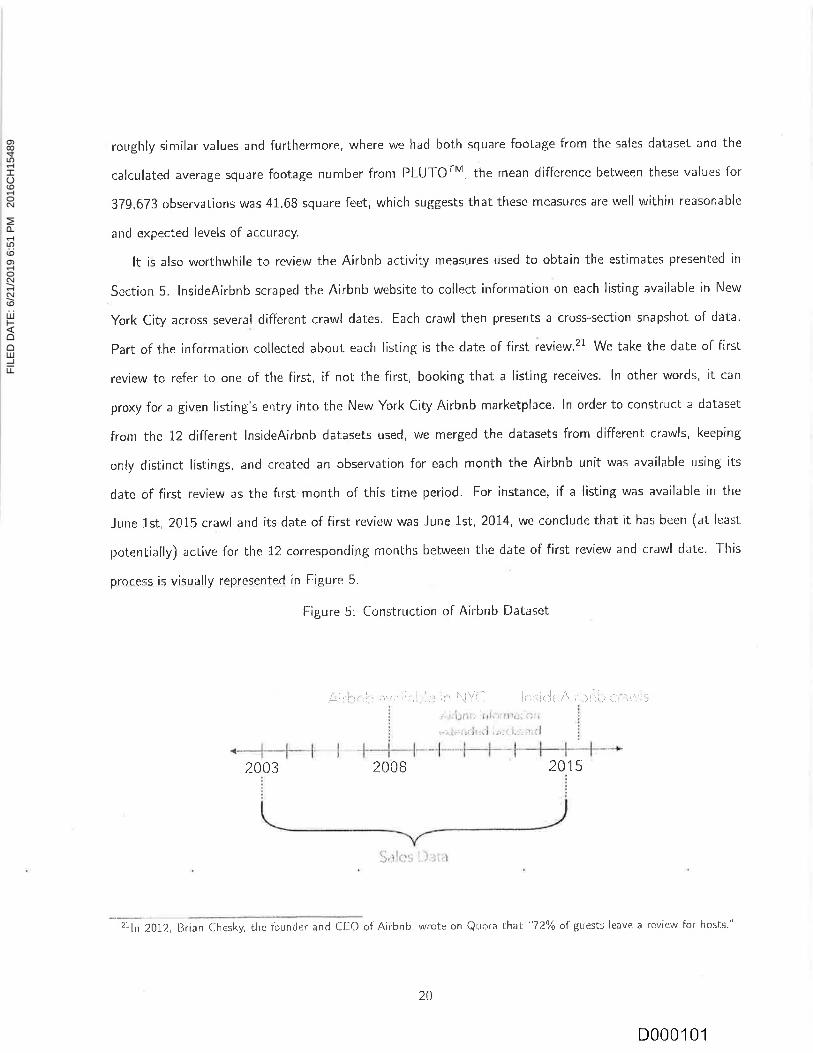
roughly similar values and furthermore, where we had both square footage from the sales dataset ancl the
calculated average square footage number from PLUTOTM, the mean difference between these values for
379,673 observations was 41.68 square feet, which suggests that these measures are well within reasonable
and expected levels of accuracy.
It is also worthwhile to review the Airbnb activily measures used to obtain the estimates presented in
Section 5. lnsideAirbnb scrapecl the Airbnb website to collect information on each listing available in New
York City across several different crawl dates. Each crawl then presents a cross-section snapshot of data.
Part of the information collected about each listing is the date ol'first review.21 We take the date of first
review to refer to one of the first, if not the first, booking that a listing receives. ln other words, it can
proxy for a given listing's entry into the New York City Airbnb marketplace. ln order to construct a dataset
from the 12 different lnsideAirbnb datasets used, we merged the datasets from different crawls, keeping
only distinct listings, and created an observation for each month the Airbnb unit was available using its
date of first review as the first month of this time period. For instance, if a listing was available in the
June Lst, 2015 crawl and its date of first review was June 1st, 2014, wc conclude that it has been (at least
potentially) active for the 12 corresponding months between the date of first review and crawl date. This
process is visually represented in Figure 5.
Figure 5: Construction oi Airbnb Dataset
*i,'i:.,:'.,1., ;,t,.,..:'1,';it''1t ,r: i'.jYl - ll'':l';jli,,ii.;rt, '. ' ''
j' .!r.a-jili, ;,;.ti iirr.ri :tii.t
,.rir:: :i ]{:ri,;,;r. !,::rjli,: J
II
2003 2008 201 5i
ij.,iiill , j,i,;
21ln 2012, Brian Chesky, tlre founder anrJ CFO of Airbnb, wrote on QLrora that "7?-% of guests leave a review for hosts."
20
D0001 01
FILE
D D
ATE:
6/2
1/20
19 6
:51
PM
2016
CH
1548
9
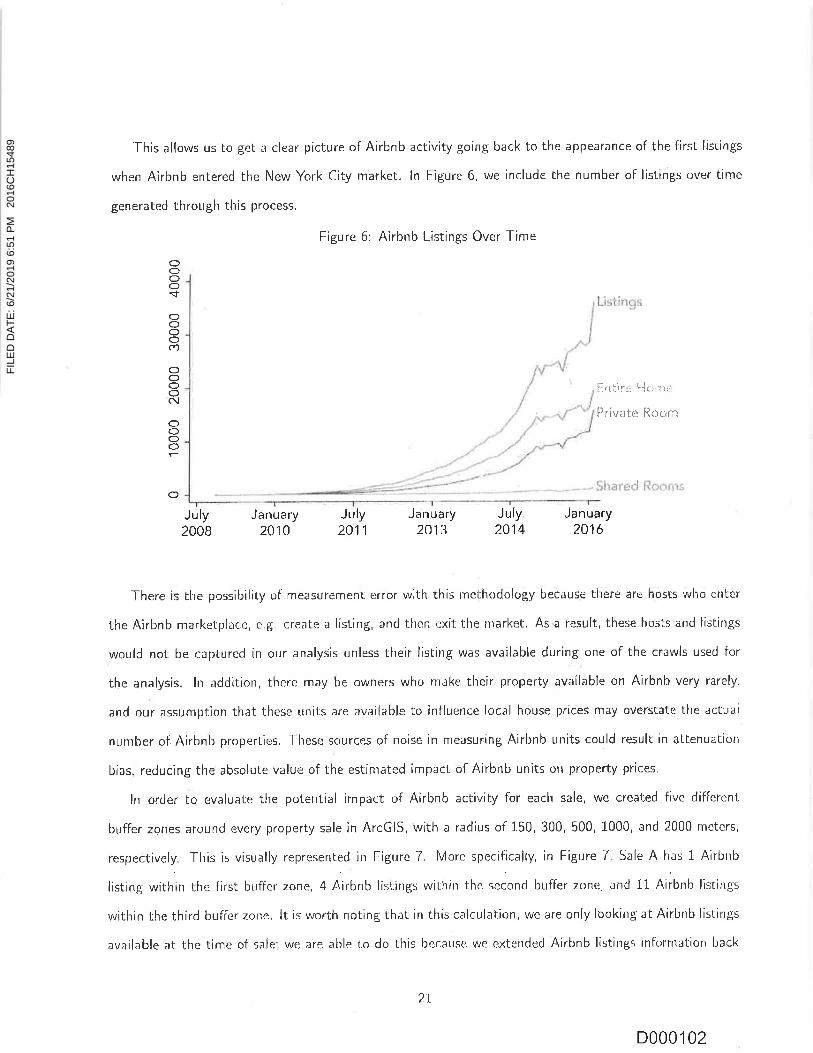
This allows us to get a clear picture of Airbnb activity going back to the appearance of the first listings
when Airbnb entered the New York City market. ln Figure 6, we include the number of listings over time
generated through this process.
Figure 6: Airbnb Listings Over Time
()OOO
OOo(>cf)
O()O()c!
OOc)()
(}
riI{!
i.-i*ti*i;:;
{lniir* }-'i**t*:.
Privato Rccn:
July2008
January2010
July January2A11 2A13
July January2414 ?016
There is the possibility of measurement error with this melhodology because tltere are hosls vuiro enter
the Airbnb nrarketplace, €.g. create a listing, and tiren exit the rnarket. As a result, these hosts and listings
would not be captured in or.rr analysis unless their listing was available during one of the crawls used for
the analysis, ln addition, therc may be owners who nrake their property available on Airbn[: very rarely,
and our assumption that these units are available to influence local house prices may overstate the actuai
number oi Airbnb properties. These sources of noise in rneasur,ing Airbnb units could result in attenuation
bias, reducing the absolute value of the estinrated impact of Airbnb units on property prices.
ln grcler to evaluate the poterrtial impact of Airbnb activity for each sale, we created five diflerent
bufler zones around every property sale in ArcGlS, with a radius of 150, 300, 500, 1000, and 2000 meters,
respectively. This is visually represented in Figure 7. More specifically, in Figure 7, Sale A has 1 Airbrrb
listing within thc first buftcr zone, 4 Airbnb listing;s wirhin the second buffer zone, and L1 nirUnb listings
within the third bufler zorre. lt is worth noting that in this calculation, we are only looking at Airbnb listings
available at the time of sale; we are able to do this becaust: we extendecl Airbnb listings infornration back
2I
D0001 02
FILE
D D
ATE:
6/2
1/20
19 6
:51
PM
2016
CH
1548
9
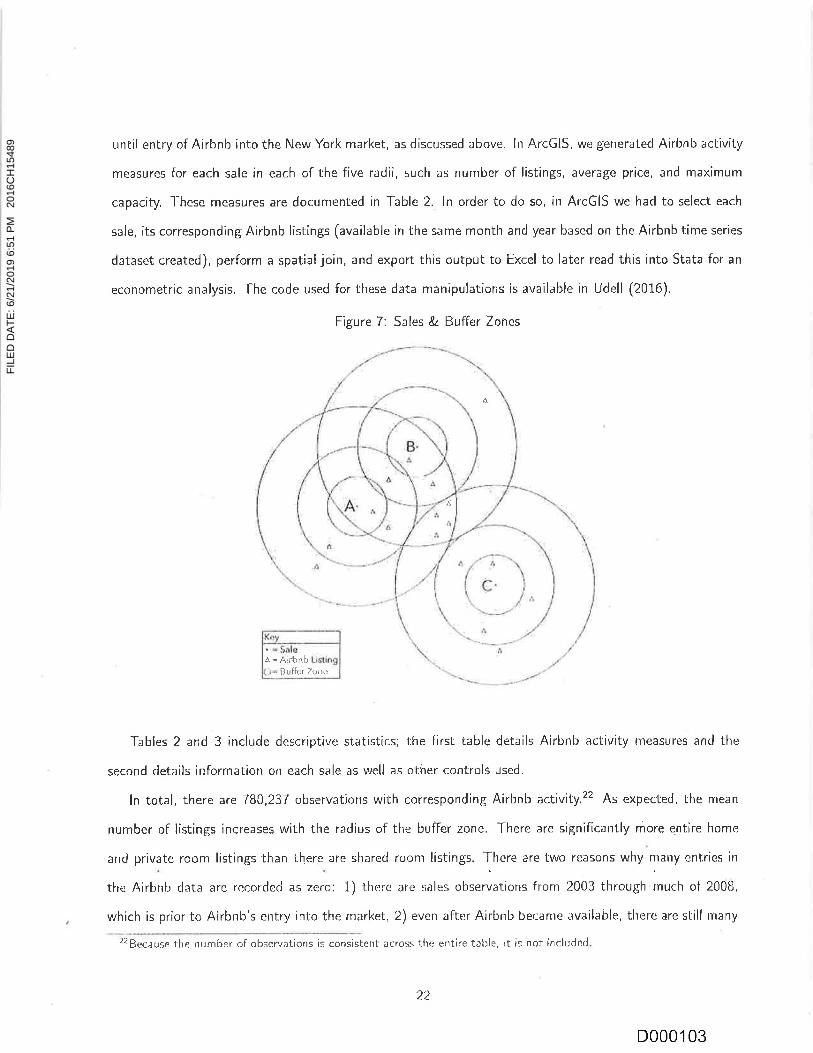
until entry of Airbnb into the New York rnarket, as discussed above. ln ArcGIS, we generated Airbnb activity
measures for each sale in each of the five radii, such as number of listings, average price, and maximum
capacity. l-hese measures are documented in Table 2. ln order to do so, in ArcGlS we had to select each
sale, its corresponding Airbnb listings (available in the same month and year based on the Airbnb time series
dataset createrl), perform a spatial join, and export this output to Excel to later read this into Stata for an
econometric analysis. The code used for these data manipulations is available in Udell (2016).
Figure 7: Sales & Buffer Zones
Tables 2 and 3 include descriptive statislics; the first table details Airbnb activity rneasures and the
second details information on each sale as well as other controls used.
ln total, there are 780,237 observations with corresponding Airbnb activily.22 As expected, the mean
number of listings increases with the radius of the bufFer zone. There are significantly more entire home
and private room listings than there. are shared room listings, There are two reasons why many entries in
the Airl;nb data are recordecl as zero: 1) rherc are sales obs*rvations from 2003 through much r:f 2008,
which is prior to Airbnb's enfty into the rnarket, 2) even after Airbnb becarne available, there arestill many
??Because the number srf observations is consistent lcross the entire tat:le, it is not included
4
a - A:rbnbSufler Zurre
ii
}1
22
D000't03
FILE
D D
ATE:
6/2
1/20
19 6
:51
PM
2016
CH
1548
9

Table 2: Descriptive Statistics: Airbnb Activity Measures
VARIABLES{1) (2)
sdmean(3 ) (4)mtn max
Listing Counts, by Total and TypeListings Count (150m)Listings Count (300m)Listings Count (500m)Listings Count (1000m)Listings Count (2000m)Entire l-lorne Listings Count (150m)Entire Home tistings Count (:OOm)Private Room Listings Count (150m)Private Room Listings Count (300m)Shared Room Listings Count (150m)Shared Room Listings Count (300m)
L.22L4.64411,9940.99i33.40.8553.2490.3381.29A
0.02780,104
5.21719.0647.75157.5490.33.82113.911.5755.4310.2274.577
133439
i,0342,8996,77Q10130978
1822A
35
0
0
0
0
00
0
0
0
U
0
Listing CapacityAvg. Capacity (150m)Avg. Capacity (300m)Max. Capacity (150m)M.rN. Capacity (300m)Avg. Bedroorns (150rn)Avg. Beclroorns {300m)Sunr Bedroonrs (t50nr)Surn Bedroorns (300rn)Sum Beds (150m)Surn Beds (300m)
0.4234.5773.49013.240.1580,3051.3024.9511.8196.899
1.1471.280i5.0254.470'4300.7i35.6162_4.37
7.84128.27
L6
IU387
1,21510
16136459294622
0
0
00U
tJ
0
00
0
Listing PriceAvg. Nightly Priee (150mAvg. Nightly Price (300mSum Price (1,50m)5um Price (:Otlm)
1"50rn)
300m)
23.0q29.34
2t3.744813.819.8524.69
65.1869.00
989.793,61757.8160.49
5,0005,000
25,3087 4,87 45,0005,000
))
0
00
0
0
uMedian Price (
Median Price (
ReviewsSum Reviews {Sum Reviews (
0 4,3960 11,599q
11 77Jt. t t
122.0150nr)300m)
23
L40.4499.6
D0001 04
FILE
D D
ATE:
6/2
1/20
19 6
:51
PM
2016
CH
1548
9

Table 3: Descriptive Statistics: Sales and Controls
mean(1) (2)
sd
(3) (4)mtn max
(s)NVARIABLES
Sales UnitSale PriceSquare Footage of UnitWalkup Building lndicatorPresence of Elevator lndicatorPrewar Building lndicator
683,9221,183
0.05790.3680.379
913,580577.00.2340.4820.485
10,00010.39
000
1.000e*0718,590
1
i1
780,2377BA,X7780,237780,237780,237
Demographics and CrimeMedian Household lncomePercentage \A/hiteMajor FeloniesNon-Major FeloniesMisdemeanors
75,2400.549736.81,,7254,515
35,8740;300427.9700.62,002
11,012 250,0011
2,7765,1051.4,025
776,027779,975765,747765,747765,747
011B3259
Geography and Time of Saleslndicator for Sale in Staten lslandlndicator for Sale in Brooklynlndicator for Sale in the Bronxlndicator for Sale in Manhattanlndicator for Sale in QueensYear of Sale
0.08304.247
4,07420.2830.3132008
0.2760.4310.2620.4500.4643.822
1
1
1
1
i2015
00000
0032
7BA,X7780,237780,23778A,237780,237780,237
parts of New York City where Airbnb is not active. As shown in figure 6, Airbnb listings do not become a
significant factor for the entire New York market until the beginnirig of 201"0.
The difierent Airbnb measures represent different proxies for Airbnb activity.23 lt is worth noting here
that the average nightly price within 300m of a sale is $29.34. ln rnany ways, Airbnb directly competes
with hotels; the $29.34 average price tag suggests that it also opens up a new market, which is a more
affordable alternative to hotels. This is in line with Levin (2011), which suggests that lhese platforms have
superior matching processes, creating a market for these transactions that otherwise might not have taken
place. Airbnb represents an unbundling of the services hotels offer, which allows it to be cheaper in many
cases
ln Table 3 we see that the average sale price is $683,932 while the nredian sale price is $450,000. 31.3%
of sales occurred in Queens, 28.3% occurred in Manhattan,.24.7% occurred in Brooklyn, and the rernaining
15J2% occurred in Strten lsland and the Bronx.
23Most of these Airbnb nreasures proxy for levels of availability, but we can also think about a measure such as the sum ofnightly prices as an indic.-rtion ol the 1:otential (rrightiy) inconre available dLre to Airbnb activity.
24
D0001 05
FILE
D D
ATE:
6/2
1/20
19 6
:51
PM
2016
CH
1548
9

The descriptive statistics presented in tables 2 and 3 allow us to make a quick "back of the envelope"
calculation of the potential impact on property values. Consider the income capitalization approach outlined
in section 3. Airbnb imposes a host fee of 3% of the rental value, in addition to the guest fees that are
added to the nightly rental. [t seems reasonable to expect that there will be many nights when the property
is not rented, but suppose an optirnistic owner of an average property expects to be able to rent 330 nights
pe( year. Then the total annual Airbnb income expected wor-rld be $29.34 x 330 x 0.9? : $9392. Combining
this figure with the mean property value of $683,922 this implies a value of rv : 0.01373 for equation 3.
For other variables in equation 3, we assume that g : 'y (the expected capital gain equals the ownership
risk premium) and apply reasonable estimates to other variables as follows:
Variable Value lnterpretation
r* 0.02 Risk free annual interest rate
a 0.025 Property tax rate as a percent o{ market price
r 0.2g EfFective tax rate on personal income
?i' 0.04 Annual mortgage interest rate
d 0.025 Mairrtenance costs as a percenl of market price
o 0.01373 Airbnb rental as a percent of market price
Using these values in both equations 2 and 3, we can calculate that the availability of Airbnb rentals has
dirninished the user cost of housing by about 17.1%. lf Lrtility levels in the city remain constant (a-s would
be expected in long-run equilibriLrm of an open city), and given unchanged transport cqsts anrJ preferences,
we would expect rents per unit of space to remain unchanged. This reduction in the user cost of hoLrsing
would then imply, via equation 7 a t7.7Yo increase in the price of housing.
These caleulations are at best an approxinration of what we might expect to observe. Not all porlions
of the city are equally exposed to Airbnb activity and market equilibrium may take years to be realized.
Nevertheless, the calculation provides some intuition about the potential magnilude of price impacts.
Not all portions of the city have the same intensity of Airbnb listing.s. Figirre B shows the distribution of
'Airbnb fistings (from any tirne period) across the city, with dots color coded by daily price. lt can be diflicult
frorn the map to tcll how dense the coverage is, so an inset showing midtown Manhattan is provided. -l"his
suggests that as of late 201"5, coverage in the areas of the city with greatest demand for loclging is very
complete.
25
D0001 06
FILE
D D
ATE:
6/2
1/20
19 6
:51
PM
2016
CH
1548
9

Figure B: Airtinb listings in New York City, with inset showing midtown Manhattan
tuYI' o@
E
@ "@
@so@
I6
e
@
@
@ @
@o
€
o
'€
s s.p oE :;,ti.j't =ot1, r,,i. .1 - r,-..
Airbnb Listingsby Price
@ 1S-141
{) 142 - ?91
o 292 -,675
o 676 - 2000
6 2001 - 6500
fr.. 1. ti, :.;-t!|:'r-.r a.l
r.
rr,.1 .ir rt.,,
&
26
D0001 07
FILE
D D
ATE:
6/2
1/20
19 6
:51
PM
2016
CH
1548
9

5 Ernpirical Estimates
We employ two distinct approaches to estimating the impacts of Airbnb properties on house prices. First,
we employ a relativelytraditional hedonic approach as presented and explained in Rosen {1974} or Sheppard
(19q9) and widely used to measure the importance of factors affecting property values, Second, we employ
several quasi*experimental approaches to identify treatment and control groups within the observational
data, and then estimate the average treatment eflect generated by the Airbnb quasi-experiment.
The first approach provides a measure of the associational impact of Airbnb * the change in values that
an observant buyer might detect as the housing market adapts and responds. lt cannot, however, pretend
to provide an analog to the causal impact obtained from a controlled experiment in which the sales price of
identical (or very similar) structures are compared after one of them (the treated property) is subject to the
impact of locally available Airbnb rentals while the other (the control) is not subject to these local impacts.
Because we are fortunate to have a very largc number of individual sales observations, we can apply these
techniques to identifu the experimental data within the large observational data. This offers the prospect of
measuring a causal impact, and it is worth distinguishing between this approach and the use of instrumental
variables that are widely applied in response to concerns about endogenous variables. lnstrumental variable
approaches can (in ideal circumstances) reduce endogeneily bias in eslimaling associational relations, but
cannot be reliecl upon to measure causal impacts.
Our unit of observation is an individual sale that took place in New York City (five boroughs) between
January 2003 and ALrgust 2015. We therefore have a large number of sales both before and after Airbnb units
[ecome actively available.2" For each sale, we inclutJe controls for the propefty itself, the building in which
it is locaterl, local amenities (such as accees to public transportation), local neighborhood characteristics
(demographics and crime), a year of sale fixed effect to capture a time trend of sales prices, and a local
neighborhoocl fixed effect to caplure time invariant neighborhood quality or desirability. For each sale, we
calculate a level of local Airbnb activity, which is the main variable of interest, and corresponds to Airbnb
activity at tlre time of sale. ln most specifications, this Airbnb activity is proxied by the number of listings,
?alt is worrh noting that the sales are nonrinal rathdr than real prices. we include year af sale fixed effects to deal with
this problem. This is, in fact, prefcrable to rrsing a house price index to determirre "real prices" because available house price
indices generally cover a different geographic area thin our data'We compare the index, which is constructed frorn the estinrates on the year of sale fixed efl'ects, to the 5&P/Case-Shiller
NY, NY l-lorle Price lndex to demonstrate its plausibility.
27
D0001 0B
FILE
D D
ATE:
6/2
1/20
19 6
:51
PM
2016
CH
1548
9
but we present estimates that use alternative indices of Airbnb activity as well.
-fhere are two main assumptions of the hedonic identification strategy: 1) with regards to generating the
Airbnb dataset, we are assuming that the date of first review indicates when a property became available
on Airbnb and that once it became available, it never exited the Airbnb market. This allows us to construct
a dataset of Airbnb activity over time and calculate local Airbnb activity at the time of sale and 2) local
neighborhoocl fixed effects capture time-invariant local neighborhood quality. lf thesi assunrptions are valid,
these estimates will reveal the impact of local Airbnb activity on sales prices. lf these assurnptions hold,
because we are controlling for property, building, and neighborhood characteristics, the only thing that is
changing is local Airbnb activity (as well as the overall level of the market, which is captured by year of sale
fixed effects).
The specification we are using in the baseline model follows the form:
ln(Sale Prlcq,.,^s) : o * Blln(Airbnb Activityi,,,) + pl(Property Characteristicsl)'*-
p2(Building Controfs,) .|'. pr(Demographic and Crime Controls;)+ (11)
pa{Year of Sale FEi,) + pr5,(Local Neighborhood FEi") * €icrnt
where ln.(Sale Pricei,..,,1) is equal to the logarithm of property z's sale price, in neighborhood c, in month
m., and year t, and where /J represents a scalar coefficient and p represents a vectol coeflicient.
The independerrt variable is the n;tural log of sale price. The main variable of interest is Airbnb activity
(proxied by diflerent descriptive and proximate measures of Airbnb, as will be discussed in Section 5). For
each sale, square footage, distance to the nearest subway entrance and area clf interest are used as well as
controls fr:r the building, year of sale, locaI erime, and local demographics. ln the ntodel, a time-invariant
Iocal neighborhood fixed effect is included to capture unobservable or uncontrolled for local neighborhood
quality and characteristics. There is significant evidence that housing prices are heavily influenced by the
characteristics of a neighborhood as well as surrounding land use (DiPasquale & Wheaton 1996, p. 3aQ).
As with most microeconometric estimation, there are natural concerns regarding endogeneity of right-
hancl side variables. We are not estimating the individual household dernand for the characteristic of
proxirrrity to Airbnb properties or for listing a property on Airbnb, so the traditional concerns regarding
endogeneity of individual household decisions discussed in Sheppard (1999) do not arise. Endogeneity may
nevertheless be a valid concern if important factors affecting house prices are correlated with the unobserved
2B
D0001 09
FILE
D D
ATE:
6/2
1/20
19 6
:51
PM
2016
CH
1548
9
errors in the hedonic equation. l-hus, for example, if errors e in the hedonic price function are correlated
with measured values of right-hand side variables in equation 11 then estimates may be biased.
For example, we might expect increasing Airbnb activity to be correlated with the error term of the
hedonic if the number of Airbnb properties within a given bufler distance were positively related to unob-
served errors c. Note that the problem does not involve a correlation between Airbnb activity and property
values. The problem arises if we have correlation between Airbnb activity and e, which is the component of
property value that is not explained by the hedonic.
Proving there is no such relationship is extremely difficult. There are several considerations tlrat we
suggest as a basis for regarding our hedorric estimates as reasonable: 1) we include sales data prior to
Airbnb's entry into the New York City market and therefore have at least five years of data (2003 through
most of 2008), where sales are not subject to any Airbnb "treatment,"25 2) local neighborhood fixed
effects, which in our preferred specification are at the level of Census Block-Group, and 3) use of robust
standard errors, which in our preferred specification are clustered at the level of Census Tract, to help deal
with correlation within clusters ancl heteroskedasticiry. Finally, even if we cxpected there to be correlation
belween unexplained errors r. in the heclonic model ancl the number of Airbnb properties very near to the
source of error, this correlation sheiuld be greatly reduced as we consider larger bLrffer areas. A distance
exceeding 1,000 meters in the New York housing nrarket is generally large enough to be associated with
significant neighborhood change. As noted in seclion 4, these larger bLrfler areas also involve many more
properties, and it strains creclulity that the nurnber of Airhnb properties within a kilometer in any directicn
would be significantly al'Fected l:y an unusually under* or over-valued property sale.
While lhis approach is not imrnune from endogeneity concerns and makes other implicit assumptions
concerning stability of trends, the central role of lhe Lreai-rnent variable interacted with the indicator for the
time per:iod after which anytreatment is delivered, coupled with the reduced likelihood that this interaction
variable is correlated with the unobserved c in the rnodel make presentation of these estimates worthwhile.
A final check is provided by comparing the estimates of the "preferred" models from each approach with
the irrtuitive "back of the envelope" calculations presented in section 4 wilI be instructive as indicators of
the reasonableness of the estinrates.
25'l-herefore, tlre change we are identifying, controllirrg for property and local neighborhood characteristics as well as the
overali level of the nrarket, should be attributable solely to Airbnb activity.
29
D000110
FILE
D D
ATE:
6/2
1/20
19 6
:51
PM
2016
CH
1548
9

5.1 Estimating Associative Effects with Hedonic Models
Table 4 presents OLS estimates of the hedorric using several difFerent measures of Airbnb activity, all
measured within 300 meter bufFers. This is followed by Table 5, which shows results for counts of Airbnb
properties measured within buflers of clifferent sizes. The results of Table 5 are then summarized graphically
in Figure 9.
Note in tables 4 and 5 that the variables providing a rneasure of Airbnb activity are always positive
and statistically significanl. A doubling (100% increase) in the number of Total Airbnb accommodations is
associated with a 6.46% increase in property values. Other variables always have the expected signs and
are mostly statistically significant.
From table 5 we note Lhal moving to larger buffers does reduce the magnitude of the estimate, but all
are positive, significant and a doubling of Airbnb activity is associated with an increase of property values
of between 6% and nearly L1%,
While this is a smaller irnpact than suggested by the "back-of-the-envelope" calculation presented above,
it is encouraging to note that these results are almost identical to those obtained by Barron et a!. {2017), who
find associative impacts of between 3o/o and 35a/o on house price indices with 7% in their most completely
specified mode[s.
lJsing the estirnated parameters associatecl with each year in model (1) of table 4 as the basis for
constructing a house price index, we can compare the constructed index with the Case-Shiller-Weiss index
for New York City over the same period. The results are illustratecl in figure 10. While we would not
expect the two indices to be iclenticai, the ciose corrcsponclcnce over the relevant tirrre periocJ encourages
our confidence in the hedonic models.
30
D0001 1 1
FILE
D D
ATE:
6/2
1/20
19 6
:51
PM
2016
CH
1548
9

Variables(1)
ln{Sale Price) ln(Sale
Table 4: OLS estinrates of Airbnb impacis
(2)Price)
(3)
ln(Sale Price)
(4)
ln(Sale Price)
Total Accornnrodations
Total Reviews
Total Rooms
Total Rents
Square Feet
Felonies
Pre-war
Distance ts AOI
Oistance to sutrway
flevator
Y'sw:t
)i,.ruu
$nua
0.0646**+0.00275
0.0393***0.00r73
0.0814***0.00351
6
0.402i.*x0.0178*0.0458*',t(*
0.0r610.0843*'i'*0.0111-0.103
0,0674
-0.0087$0.0?43
0.085s*t'.+0.0235
0.179**t0.0121
0.365{"t*n n1r"
0.464*'tjl0.0164
0,402)r.r**r
0.0178_0.0552{.,N*
0.0162
0.0946*+*
0.0111
-0.10 I0.0674
-0.00880
0.0241
0.0949+ft,
0.0235
0.190'f **
0.0il90.367+*{'n nl'!6
0.407***0.015t
0.402rr{*s
0.0178
-0.04qc'ix*0"0i620.0842*'f'i*
0.0111
-0.1030.0675
-0.0089?
4.4243
0.09{3***0.0?35
0,178***0"0t?1
0.365*{.{,
0.01?8
0.464r<',t*
0.0164
0.0323**x0.00133
0.402x**0.0178
-0.0S12i(**
0.0161
0.0947**i0.0111
-0.102
0.0674
-0.008s74.a242
0.0847*1't
0.0234
0.190*"'{t
0.0120
0.366{.*{,
0.0126
0.4668*$
0.0i61*** - significant at 1%, ** - srgnrli'cant at 5%, * - significant at 1"094
Continued on next page
D000112
FILE
D D
ATE:
6/2
1/20
19 6
:51
PM
2016
CH
1548
9
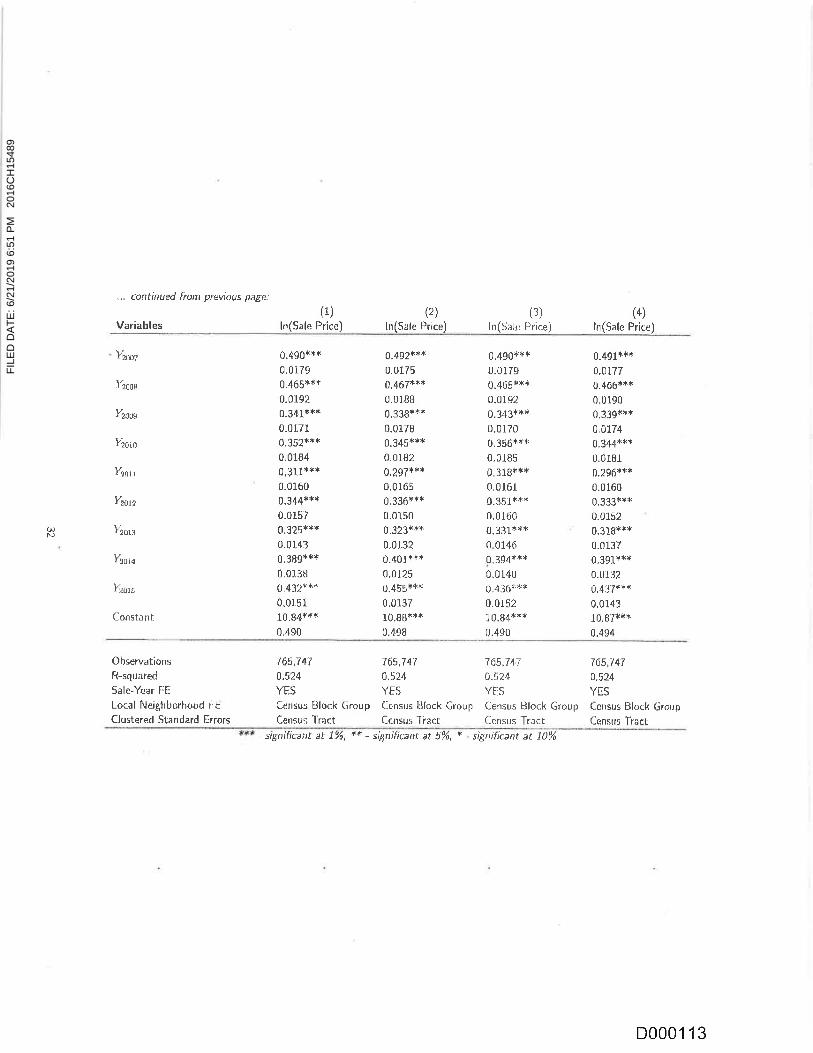
.., t:t)iltinued fiom previous page:
Variables(1i
ln(Sale Price)(2)
ln{Sale Price)(3)
ln(5ale Price)(4)
ln(5ale Price)
bJ
ltoor
)'zcog
Yroos
Earo
Yrnr r
Yxtta
linre
1'*ot.r
Kun
Constant
0,490**t0.0i790"465xi(*0.0192
0.341*,t*0.01_71
0,352***0.0184
0,311*+*0.01600.344**'r0.0157
0.325r'{+r'{
0.0r,43
0.gBgf*+
0.01sB
0.43?**+0.0151
10.94**t0.490
0.492***0.0175
0.467***0.01.88
0.338**rc
0.0178
0.345***0.0182
0,?97t',t*0.0165
0.336***0.0150
0.323***0.0132
o'4olt**0.0125
0.455*+*
0,0137
10.88***0.408
0.490t/f *
0.01790.465*'rc*
0.0t920.343*{r.*
0.0i700.356,t*i<
0.0185
0,3lg*{**0.0161
0.351**'}F
0.0160
0.3318{.*
0.0146
9.394**+0.0140
0.430t**0.0r5210.84t(**
0.490
0.491*f*0.0177
0.466*{<t
0.0190
0.339*x('&
4.01740.344{.**0.0lBl0.2q6***0.0160
0.333{'i**
0.0152
0.319***0.0137
0.391i'ir(*
0.0132
0.43'l***0,0143
10.s?{j**0.494
0bservations
R*squared
Sale-Year FE
Local Neighburhood FF
Clustered Standard Errors
765,747
4.524
YES
Cenrus 8[:ck GroupCensus Tract
765,747
0.524
YE5
Census lSlock Croup
Census Tract
765,747
0.5?4
Y[:5Census !}lock Group
Census Tract
765,747
0.524
YE5Census Block Group
Census Tract- significant at 196, ** - significatt at 5%, * - significant at 10Yi
D0001 13
FILE
D D
ATE:
6/2
1/20
19 6
:51
PM
2016
CH
1548
9
'l.able 5: Ol.5 estimates of Airbnb impacts with increasing buffer sizes
Variables(1) (2)
ln{$ale Price) ln(Sale Price)
(3)ln(Sale Price)
(4)
ln{Sale Price)
(5)
ln{Sale Price}
Airbnbrso
Airbnb3e6
Airbnb5pe
Airbnblno6
Airbnb2es6
Sauare Feet
Felonies
Pre-war
Distance to A0l
0istance to subway
Elevator
Ylaoe
Yroa:;
0.109*:tr0.08555
0.0979**t0.00377
6.0773***0.00309
0.0670***0.00?61
(.)(t
0.403*'i(*0.0180_0.0574***
0.0111
0,0838t**s.0112-0.0993
0.0770
-0.00978
0.0251
0.0904x.*rr
0.0239
0 lg0*i,*0.0122
0.366**f0.0129
0.403***0.01/9-0.0363**0.01610.0838***0.0112-0.100a,8770
-0.0093i0,02500.0007x**0.02390.127***0.01.?1.
0.363***4.0't21
0-403*t *
0.0179-0.0268*
0.0159
0.0831)***
0.011:-0.100
0.0768
-0.00s84
0.0249
0,0907***0.0239
0.176***{1.0t l80.36?''}t t0.01?5
0.402**{.
0.017s-0.0243
0.0156
0.0842***0.011?
-0,09e70.4n2-u.0111
0.02490.fl093**r0.0238
0.175*'**0.fl118
0.362***0.0123
0.0b01+++
0.00249
0.402***0.0179
-0.0307'r,
0,0i580.0840***n,011,?
-0.09$10.0?70
"0.01r30.0248
0,0902x**
0.0238
0,176**'{<
{:}.$116
0.863***4.0L22-
afJ ^ significant at - significant at 10%
Continued on next page
D000'114
FILE
D D
ATE:
6/2
1/20
19 6
:51
PM
2016
CH
1548
9
.,. continued from previous page:
Varlahles
(1)ln(Sale Price)
(2)
ln(Sale Price)
(3)ln(5ale Price) ln(5ale Price)
(5)
ln(5ale Price)
(4)
(^t
Y:rorxi
Y:or,t
Yroo*
Y:ooo
lioro
]iorr
Y'rott
Eors
lior.r
f. rcr:
Constant
0,46i**li0.0168
0,4q0x(**
0.01810,465*!t*0,0194
0.345*'*',l(
0.0168
0.360**'rt0.0185
0,328')***
0.01560,359**i(0.01610.364*'jr*
0,0150
il,42fl'r'x0.01440,46?rr'r*
0.0156l0.Bgi(**0,545
0.462***0,0164
0.499*'tt0.0180
0,464*t*0.0193
0.341**t0.0171
0.X541')ti
0.0185
0,307i"{'f0.01590.327*{'*0"0159
0.328t**0.01.4?
!.385***0.0142
0.428N',i*
0.015s10.?5***0.547
0.461't(**0.0161
0.499*{(*
0.01770.463*t {,
0.0191
0,339***0.0171
0.346+r'.*
0.0184
0.?86***0.01600.303*r10.01520.302*t*0.0142
0-35,r{*,t(
0.0137
0.3q8***0.0149
10,70***0.548
0.46L*t*0.0159
0.488t**0.0t760,464*r:r0,0190
0.330***0.01?0
0.331**t(0.0180
0.255t**0.0r550.269**i0.0145
0.265***0.0136
fll'11?**'f0.0132
0.355:f**0.014810.69***0.55?
0.462**1.
0.0I570.489*ri*
0.0175
0.465*r*r(
0.0189
0.316**'k
0.0168
0.31S*8r
0.0174
0.219r(*t
0.0I480.?28r"*t
0.0135
0.220i(*f0.0120
0:?69s*0.0128
0.908***0.0147
10.73***0.553
Observations
R-squared
Local Neighborhood F[.Clustered Standard Errors
742,3280.524
Census Block Group
Census Tract
?42,328
0.524
Census Slock Group
Census Tract
742_,328
0.525
Census Block Group
Census Tract
742,328
0.525
Census Block 6roupCensus Tract
742,3280.525
Census Slock Group
Census "lract
*** - signifi'cant at 1%, ** - significant at 5%. * - significant at 10%
D0001 15
FILE
D D
ATE:
6/2
1/20
19 6
:51
PM
2016
CH
1548
9

Figure 9: Airbnb impacts for different bufier sizes
s,14
v- lz-
&"1
$.s.*
*"*6
*"s4
c.s2
$ds
6tat*cg'*
F$u
U
o*s$4&ffi r{s* lffi 1S$* g0fis
Figure 10: Comparison of house price index from Airbnh model with CSW index
l'ler{E:nic Hstiirtar*s 1&i'/Case Shi}let
l-{*:rn* Frieq: lrid*x hl?, l4Y },"{*r'ntl Pri** lnd*x
144 224
130
1?0 180
ffi rffi $?s*S**&r$ss {l?we{s}
200
110 160
144rt q" l.,) "o P\ co s (} r f'l ce if, t'}O()(}(}(}c)O!:TYT()-OOOC)c:()C)O()OOf.,&NflN(\(*\I(\NNNC{f{
100
35
D0001 16
FILE
D D
ATE:
6/2
1/20
19 6
:51
PM
2016
CH
1548
9
5.2 Quasi-Experimental Estimation of Airbnb Treatment Effects
The results presented in the preceding subsection cannot be given a clear causal interpretation. Hedonic
models present the association observed in equilibrium between structure and neighborhood characteristics
(such as the presence of Airbnb properties within 300 meters of the properly) and the recorded sale price. As
noted in Sheppard (i999) the hedonic price function arises from the interaction of supply and consumption
choices made in the housirrg market and describes a locus of equilibriurn oulconres rather tlran a behavioral
or causal link.
To properly evaluate the causal impact of Airbnb properties on house prices, we would ideally have a
controlled experiment in which identical properties were identified, one of them exposed to the treatment of
having nearby Airbnb properties and one of them insulated from this treatment, and the sales prices could
then hre compared over a sample of properties to estimate the impact on house prices caused by Airbnb.
-f he impracticality of condr-rcting such an experiment is obvious, but our observalional data permit
application of widely-used26 quasi-experimental approaches. These approaChes permit Lts, given certain
assumptions, to identify the experimental information that are contained within our observational data and
to approxirrate a controlled experimental design. The large size and extensive time over which our dala are
observed nrake this a partieularly appropriate rflethodology for tpplicatiexr.
We employ three methods for evaluating treatment effech: construction of treatment and control
groups based sn nearest-neighbor matching, [:ased on propensity-score nratching, and the use of regression
adjLrstment for determination of tleatment and control groups.
Tabie 6 provides the estimated treatment effects, based on sales prices adjusted {ur plevailing propedy
price levels using the Case-Shiller-Weiss house price index for New York City. Note thal 'treatment' here
means that the sale of a residential property took place at a time when there were Airbnb properties available
within300metersofthesalepropertllocation. Thefirstrowspresentestimatesmakinguse of all properties
with full data in the sample, without regard to location. Subsequent rows, as noted in the first column,
break the data into subsamples based on the distance between the sale property and the CBD, here taken
to be Wall Street in lowei Manh:ttan.
The first cglumn of average treatment effect estimates is obtained using nearesl*neighbor matched pairs
265ee discussion and references in Chapter 21 of Wooldridge (ZOtO) or Chapters I and 2 of Cerulli (2015)
36
D0001 17
FILE
D D
ATE:
6/2
1/20
19 6
:51
PM
2016
CH
1548
9

based on the Mahalanobis distance between observatiorrs, applying large-sanrple bias correction. Beneath
estimate of treatment effects is the estimated standard error. The second column presents estimates of
average treatment eftects constructing treatment and control groups using propensity score matching. The
third column presents estimated average treatment efiects using regression adjustment, followed by the
mean potential outcome for the data and the number of observations.
ln every case, the estimated standard errors are very small so that estimated precision of the estimates is
high. Estimated treatment effects on the population are generally somewhat higher than the associational
estimates obtained using the hedonic models or our 'back-of-the-envelope' calculations, ranging from a nearly
2l% impact estimated using nearest-neighbor comparisons to nearly 35% using regression adjustment.
Table 6: Estimated effect of treatment: presence of Airbnb property within 300 meters
Nearest Propensity Regression Mean PotentialNeighbor Score Adjustment Oulcome Observations
All distances0
Less than 7 km(,
7 km to 11,5 km(f
11.5 km to L7 kmG
More than 17 kmo
0.2094:&**0.007
0.3252'l'{t'*0.058
0.2405**+0.057
0.:1734***0"0?0
0.1051*{.*0.424
0.3171*'.**0.006
0.5142*{**'0.014
0.3113*4('1.0.008
0.2774***0.01.1
0.0490*1r*0.0i4
0.3493x**0.003
0.5490!r*'*0.005
0.2854*',r*0.005
0.1678**',t'i0"007
0.0429't(*{'0.010
13.0494**',kCI.001
13.1592***0.004
13.2848*',f *0.002
12.8657**{.0-002
,l.2.9035**iq0.002
710,422
171,815
189,492
166,121
i82,g94
*** - significant at L percent
Our data include an extended time period during which there were no tr"eated properties. The very first
treated sales occur in 2008 but, as noted above and illustrated in Figure 6, most treated sales take place
after the beginning of 2010. Even in 2012 the majority of property sales are not within 300 meters of a
property ever available on Airbnb and hence 'unlreated'.
For all estimation approaches, we see that the average treatment effects are hi6her for properties located
closer to the commercial center, and lower for those properties located furthe r away. This is not simply an
artifact of rnore inLense treatment (in the sense ol'proxirnity tc nrore Airbnb properties) fcr rnerre centrally
located sales. Table 7 presents a set of estimated treatment efFects for the population that distingLrishes
between difFerent intensities of treatment.
37
D0001 1 B
FILE
D D
ATE:
6/2
1/20
19 6
:51
PM
2016
CH
1548
9
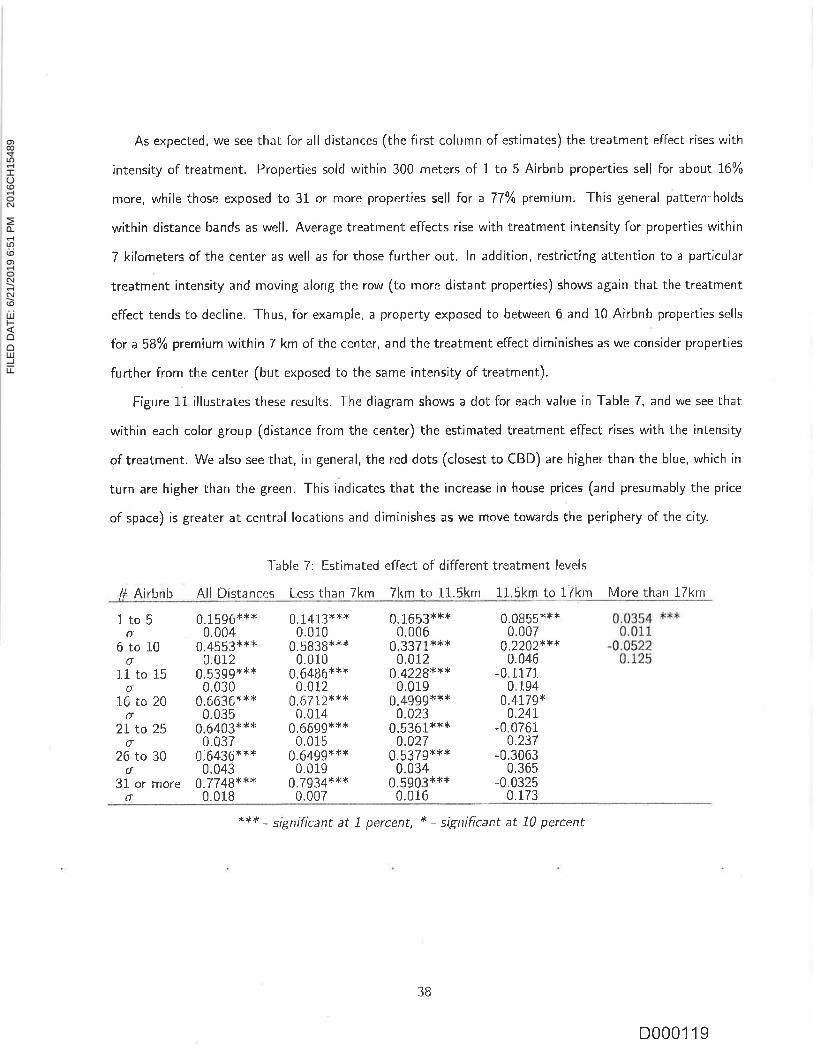
As expected, we see that for all distances (the first column of estimates) the treatment effect rises with
intensity of treatment. Properties sold within 300 meters of 1 to 5 Airbnb properties sell for aboul !6%
more, while those exposed to 31 or more properties sell for a 77% premium. This general pattern^holds
within distance bands as well. Average treatment effects rise with treatment intensity for properties within
7 kilometers of the center as well as for those further out. ln addition, restricting attention to a particular
treatment intensity and moving along the row (to more distant properries) shows again that the treatment
effect tends to decline. Thus, for example, a property exposed to between 6 and 10 Airbnb properties sells
far a58% premium within 7 km of the center, and the treatment effect diminishes as we consider properties
further from the center (but exposed to the same intensity of treatment).
Figure 11 illustrates these results. The diagram shows a dot for each value in Table 7, and we see that
within each color group (distance from the center) the estimated treatment effect rises with the intensity
of treatment. We also see that, in general, the red dots (closest to CBD) are higher than the blue, which in
turn are higher than the green. This indicates that the increase in house prices (and presumably the price
of space) is greater at central locations and diminishes as we move towards the periphery of the city.
# Airbnb
lible 7: Estimated eflect of different treatment levels
All Distances Less than Tkrn 7km to 11.5ktn 115km to l7krn More tharr 17km
1to5(T
6to10o
lL to 15(f
tt( r^ 4ArTJ LU ZU$
2I ta 25o
26 to 30o
0.1596***0.004
0.4553{"{'.*0.012
0,5399***0.030
6 crierl*trV.UVJL'0.035
0.6403***0,037
0.6436',r**0.043
0.7748***0.018
0.1413* **0.01"0
0.5838{c**0.010
0.6486***r1,012
0.671"2***0.014
0.6699***0.015
0.6499**{0.019
0.7934***0.007
0.1.653***0.006
0.3371***a.arz
0,4229***0.019
0.4s99***0.023
0.5361***4.427
0.5379***0.034
0.5903*'ct*0.016
0.0855***0.007
0.22A2*'F*0.046
-0.11710.194
0.4179*4.24t
-0,0?614"237
-0.30630.365
-0 03250.173
0.0354 **80.0i 1
-0.05220.125
31 or more
*** - significant at .7 percent, * - significant at I0 percent
3B
D000119
FILE
D D
ATE:
6/2
1/20
19 6
:51
PM
2016
CH
1548
9

Table B: Estimation with endogenous treatment eflects
Sales outcome All Distances Less than 7 km 7 to 11.5 km 11.5 to 17 km More than 17 km
Treatment0
Square feet areao
Felonies0
Median income6
Percent white(t
Pre-war constructionfi
Wall St. Distance6
Elevator(f
ConstantC
Treatment modelCqlumbus Cir Distance
(fDistance to AOI
0Distance to subway
tfConstant
6
(1)l>x*
0.6456{'i**0.114
0.6556***a.126
-0.04860.050
0.1746+0.101
0.02010.013
0.2222**t<0.050
-0.2505{'{*')t'<0.039
0, Lg05**0.085
7.2420***0.897
-0.0674*',r'.*0,008
0.00010*"0;00004
-0.00024*4"r'{0.00004-0.1927
0.143
1.36131.449
1.0315*>{'c*8.297
-0.08090.136
0.06330.161
0.a6470.1 12
0.3852**0.169
-0.21950.136
0,6893**0.304
5.5297*')k*r.561
1.00Bgr'**0.119
0.5689{<**0.078
-0.08210.051
0.3363***0.065
0.02950.023
0.1551*l'<*0.028
-0.3766**0.178
0.?473'|F{"ft0.089
6.60944'i**'{1.3s6
-0.4914{'.**0.06840,86210"0255
-0,4237')i{{'*0.0679
35.62*{'{.0
r89492186
669.5')r**
0.3840***0;125
0.4784*',r'*0.053
0.02490.050
-0.02980.053
-0.0398*0.021
0.2685t**0.028
-0.26610.21s
0.10180"063
10.1850*',r'.{'1.153
-0.04810.080
0.5623***
0.03110"045
-0.000010.00005
-0.000080.00024-0.5146
0.366
4294050536i1
0.06210.03880.65950.02350.0409*0.0258
0.-0.0
0.0.0
p
o
l
X2f)[
ObservationsNbd clusters.r?(lJ)
-0;1572*0.i.lgg0.851t.0.0700
-0.1338**0.0930
1,660. i976
710422494
4 93.1 3* *x
-0.46550.59601.09790.3650
-0.51110.8240
0.440.5474
i7lB15i57
150.27*+*
-0.0631**!t0:009
0.000090.00005
-0.00029*{,+0.00008,0,1751
0,145
-0.0797f**0.014
0.00016**0.00007
-0.00016**0.00006-4.2977
0.235
*0.1 1BB* **0.06264.72640.0248
-0.0963**,r.0.0467
3.53*0.0602
166r2t268
222"72',1**
0.0520.0290***0.010
0.1770{.*{<0.035
-0.13810.134
-0,0938*0.054
9.9606***0.861
-0.0429'r'**0.012
-0.000090.0u006
*0.00016{'<*f0.00004-0.6097**
0.294
2.550.1 104
182994222
618.7**{*
*** ' significant at 1 percent, ** - sig'nificant at 5 percent, * - significarrt at 1A percent'
3g
D0001 20
FILE
D D
ATE:
6/2
1/20
19 6
:51
PM
2016
CH
1548
9

Figure 11,: lmpact on house prices of different treatment levels at various distances
*
s
I
I
i,titI'11
iti:jjjj
':*S*Gi
*1i
:ii
ii.
$
*ee
It:
.. rj
il S ;:.:r:ri,r-;i
s;3i
{}
i*{}
s**
iiJ
tJ*,
,.- 'j ""
'
,. ..,, '". {ii;I
3l :':',';i::t i*r. *ill.rl* :)*S r?l
$*
There is a natural concern that these results may be an artifact of some endogeneity in the breatment
of properties" Thii is not a fully randomized assignnrent of treatment l-o similar properl;e$, and il nray be
that (despite the results presented in l-able 7) sorne element of high-demand locations might be subjecting
properties closer to the CBD to more intense treatment. We consider the possibility that these impacts
nray be distorted by endogeneity of treatment, and present the resulting estimates in lable B.
As expected, the more demanding estimation approach results in somewhat less precise estimaLes, but
overall the resLrlts are quite cotnparable to those presented in the previous tables. The treatment rnodel
considers three measures of location advantage to identify areas where treatment is more likely, Distance
from Columbus Circle, distance to other areas of interest identified by the Department of Finance, and
distance to the nearest subway station. Only distance to Columbus Circle and to the nearest subway station
are typically estimated with precision. The morlels cluster standard errors by neighborhood.
Overall, the results sllggest average treatnrent effects that are larger in the central locations and dinrinish
(to the point of insignificance) as we move towards the periphery of the city. For all distances cornbined,
the average treatmcnt effect indicales a 64Yo prenrium for treated s"rles taking place rvithin 300 meters of
40
D000121
FILE
D D
ATE:
6/2
1/20
19 6
:51
PM
2016
CH
1548
9
other properties that are available via Airbnb.
lnterestingly, the estimated correlalion p is negative, indicating that unobservable factors that increase
property sales prices tend to occur with unobservables that decrease the chance of nearby Airbnb properties.
This increases our confidence that the estimated average treatment effects are not merely an artifact of
endogenous treatment probabilities, even in those distance bands where the chi-square test indicates that
we must reject the hypothesis of no endogeneity in treatment selection.
6 Conclusions
ln this paper we have presented a variety of estimates of the impacts that properties listed for rent on
Airbnb appear to have on the market value of residential properties in New York City. The direction and
magnitude of these impacts has prompted widespread concern and considerable debate about the impact
on urban structure and housing affordability in New York City and in other cities around the world. Many
jurisdictions have responded by altempting to regulate or impose restrictions on the ability of Airbnb to
operate or of property owners to makes use of Airbnb services.
We present intuitive and formal theoretical arguments that generally support, but do not ensure that
this impact woulcl be for hr:use prices to increase in response to Airbnb listings as long as the Airbnb
properties themselves are not the source of extensive or concentrated negative externalities. This impact
is not guaranteed, however, and empirical investigation is required to determine the sign and magnitude of
impact.
Our theoretical arguments suggest two possibilities: an increase in property values throughout lhe city
that is greater in the center than at the periphery (if Airbnb properties facilitate an increase in population
accommodated in the city), an increase in property values that is greater at the urban periphery and
diminishes (or is rregative) at the urban center (if Airbnb brings increased income to residents or increases
the demand for space for each household). The first possibility is associated with a decline in equilibrium
utility levels. of residents. The second wjth atr increase in utility.
We have presentecl several estirnates of the likely range of inrpacts. A quick 'back-of-the-envelope'
calculation basecl on incorne capitalization suggests that property values should increase about 17%. Hedonic
analysis of house prices indicates that a doubling of thc total number of Airbnb properties within 300 nreters
4I
D000122
FILE
D D
ATE:
6/2
1/20
19 6
:51
PM
2016
CH
1548
9

of a house is associated with an increase in property value of 6% to 9% (depending on model specification),
Consideration of the introduction of Airbnb as an experimental treatment to the housing market, and
estimation of average treatment effects provides the mosl satisfactory approach to evaluation of the impacts
of Airbnb on house prices. Our analysis indicates that sLrbjecting a property to the treatment of having
Airbnb properties available nearby when it is sold increases prices by 35% {for properties that are far from
the center and whose 'treatment' consists of only a few Airbnb properties) to nrore than 65% for properties
that are near the center andf or are'treated' by having a larger number of local Airbnb properties.
Somewhat more speculatively, we note that our analysis is consistent with thinking of Airbnb as increasing
local urban population (by attracting tourists), since this would generate a pattern of property value changes
similar to those we estimate as having taken place. This increase in population, as desirable as it might be
for certain individuals and the temporary occupants of the properties, is associated overall with a decline
in equilibrium utility in the urban area. This observation helps to explain the concern of policy makers and
the (occasional) vehemence of local opposition to Airbnb properties.
Despite the speculative assessment of utility inrpacts, and the clear evidence for impact on house prices,
we advise caution in crafting policies that ban Airbnb or sirnilar shortterm private rentals altogether. Public
policies that reduce house prices in pursuit of housing affordability by diminishing the efficiency with which
an owner can make use of his or her property may fail to be welfare-improving, in the same v/ay as a city
that creates "affeirdable" housing by enceiuraging more crime hardly secms desirable. Evaluating the welfare
consequences r:f Airbnb, and hence the appropriateness of any regulatory action to limit use of Airbnb
services, requires deeper analysis than we have provicled here and much deeper analysis than appears to
have been undertaken to date.
42
D0001 23
FILE
D D
ATE:
6/2
1/20
19 6
:51
PM
2016
CH
1548
9
References
Airbnb (2017), 'About Us', Accessed via https:7/www.airbnb,com/about/about-us.
URL: fr rrps : f /www. a i rbn b, com/ a bout/ a bout-us
Avital, M., Car,roll, J. M., Hjalmarsson, A., Levina, N., Malhotra, A. & Sundararajan, A. (2015),'The
Sharing Economy; Friend or Foe?'.
Barron, K., Kung, E. & Proserpio, D. (2017), 'Thc sharing economy and housing aflordability: Evidence
from Airbnb'.
U R L : irtrps : / /ssr n. com / a bstra ct : 30068 32
Been, V., Capperis, 5., Roca, J., Ellen, 1., Gross, 8., Koepnick, R. & Yager, J. (2015), 'State of New
York City's Housing and Neighborhoods', f:urman Center for Real Estate and Urhan Palicy New York
University 86.
Brueckner, J. (i9B7a), 20: The structure of urban equilibria: a unified treatment of the Mills-Muth model,
rrr E, S. Mills, ed., 'Handbook of Regional and Urban Economics', Elsevier, Amsterdam, pp. 821-845.
Brueckner, J" K. (1gS7b), 'The Structure of Urban Equilibria: A Unificd J"reatment of the Muth-Mills
Model', tlandbook of Regianal and Urban Econarnics 2, 821*845.
Erirstein, J. & Berthe{sen, C. (2016),'N.Y. Governor Cuomo Signs Bill to Fine lllegal Airbn}: Hosts', Busr-
nes.s Week Ailine .
I"JRL: https://www.lsloomberg.com/news/articles/2A$-J0-21f n-y-governor-cuomo-signs-bill-to-fine-
itlegal-airbnb-fiosts
Cerulli, G. (2015), Econontetric Evaluation of Socio-Economic Prograrts, Springcr. lleidelberg.
Cuozzo, S. (20i5), 'NYC Ad<ls Thousands of Hotel Rooms lor Gotharn-Wicle Guest Surge', New York Fost
p. 14.
U R L: http:7f nypost.com/2A15/A1/1li/nyc-adds-thottsanrJs-of-hotel-rooms-l:or-gothanvwide-guest-
surp;e/
43
D000124
FILE
D D
ATE:
6/2
1/20
19 6
:51
PM
2016
CH
1548
9
DiPasquale, D. & Wheaton, W. C. (1996), Urban Economics and Real Fsfafe Markets, Prentice Hall
Englewood ClifFs, NJ,
Einav, L., Farronato, C. & Levin, J. (2015), Peer-to-Peer Markets, Technical report, National Bureau of
Economic Research.
Fradkin, A., Grewal, E., Holtz, D. & Pearson, M. (2015), Bias and Reciprocity in Online Reviews: Evidence
from Field Experlments on Airbnb, rn 'Proceedings of the Sixreenth ACM Conference on Hconomics
and Computation', ACM.
Henwood, D. (2015),'What the "Sharing Economy'' Takes', The Nation 300(7), L2-L5.
Horton, J. J. (2014), 'The Tragedy of Your Upstairs Neighbors: ls the Airbnb Negative Externality lnter-
nalized?', Available af 55RV 2443343 .
Horton, J. J. 8L Zeckhauser, R. J. (2016), Owning, Using and Renting: Some Sirnple Economics of the
"sharing Economy", Technical report, National Bureau of Economic Research.
Kaplan, R. A. & Nadler, M, t. (2015), 'Airbnb: A Case Study in Occupancy Regulation and Taxation',
Universily of ehicago Law Review frialogue S2, 103.
Kokalitcheva, K, (2015), 'He'ies how Airbnb justifies its eye-popping $24 billion valuation',
UQL: http : / /fortu ne. co m / 20 1 5 / 06/ 17 / a i rb n b-va I u a t io n- reven ue /
Kutlner, K. & Shinr, l. {2012), Taming the real estate beasl; Thc effecis of monctary and macroprudential
policies on housing prices and credit, rn'Proper"ty Markefs and Financial Stability', Reserve Bank of
Australia, pp. 231*259.
Levin, J. D. (2011), The Fconomics of lnternet Markets, Technical report, National Bureau of Economic
Research.
Rosen, S, (1q74), 'Hedonic Prices and lmplicit Markets: Prbduct Differentiation in Pur€ Competition', The
Jc:urnal of Political Ecanomy pp. 34-55.
5amaan, R. (2015), 'Airbntr, rising rent, and the housing crisis in los angeles'.
44
D0001 25
FILE
D D
ATE:
6/2
1/20
19 6
:51
PM
2016
CH
1548
9

Exhibit E
FILE
D D
ATE:
6/2
1/20
19 6
:51
PM
2016
CH
1548
9
Bureau of Budget APRIL 2018
InfiroductionNew York City has been suffering through an affordable housing crisis for years. Between 2011
and 2017, New York City lost nearly 183,000 affordable units of housing renting for less than
$1,000 —larger than the entire public housing stock. Affordable housing is increasingly hard to
find, with vacancy rates for apartments renting for less than $1,000 at 1.54%.1 Homelessness
stands at a record high, with over 60,000 homeless people sleeping in shelters every night.
Meanwhile, wages are stagnant and rents continue to climb in all five boroughs.
The rising popularity of homesharing websites such as Airbnb is adding to the problem.2 The
trendy replacement for hotels and hostels in effect removes housing units from the overall supply
—units that might otherwise be available to rent to New Yorkers looking to rent an apartment. The
most basic concept in the field of economics —supply and demand —says that, everything else
equal, a reduction in supply will lead to higher prices. This report, by Comptroller Scott M.
Stringer, evaluates the impact of homesharing on rents in New York City over the period 2009 to
2016.
BackgroundBetween 2009 and 2016, rents rose 25% on average citywide, or $279 per month. Rents rose
most rapidly in Brooklyn, by 35% ($340 per month) followed by Queens by 22% ($242 per month);
Bronx by 21 % ($171 per month); Manhattan by 19% ($276 per month); and Staten Island by 14%
($129 per month).3
During the same period, Airbnb listings skyrocketed, from 1,000 in 2010 to over 43,000 in 2015,
before declining to slightly under 40,000 in 2016 according to data from AirDNA (Figure 1) —most
in in violation of existing State or City laws.4 Airbnb listings are most heavily concentrated in
Manhattan (52% of all listings in 2016) and Brooklyn (35% of all listings in 2016), but are found in
1 Source: Department of Housing Preservation and Development: Selected Initial Findings of the 2017 New York City Housing and
Vacancy Survey (dated February 9, 2018) (http:/l~vwwl.nyc.govlassets/hndldownloads!pdf/abouU2017-hvs-initial-findinas.pdf).
Z There are other homesharing websites, including HomeAway and VRBO, which have smaller presences in the City and for which
listings data was not available. They were therefore not included in this analysis. Presumably their inclusion would have amplified
the results.
3 Source: U.S. Census Bureau, American Community Survey, 2009-2016
4 A report by Attorney General Eric Schneiderman found that 72% of short-term rentals on Airbnb appeared to be illegal
(https:!laq. ny.ctov/pdfs/AI RBNf3%20F2EPOKl". pdf)
Office of the New York City Comptroller Scott M. Stringer
FILE
D D
ATE:
6/2
1/20
19 6
:51
PM
2016
CH
1548
9
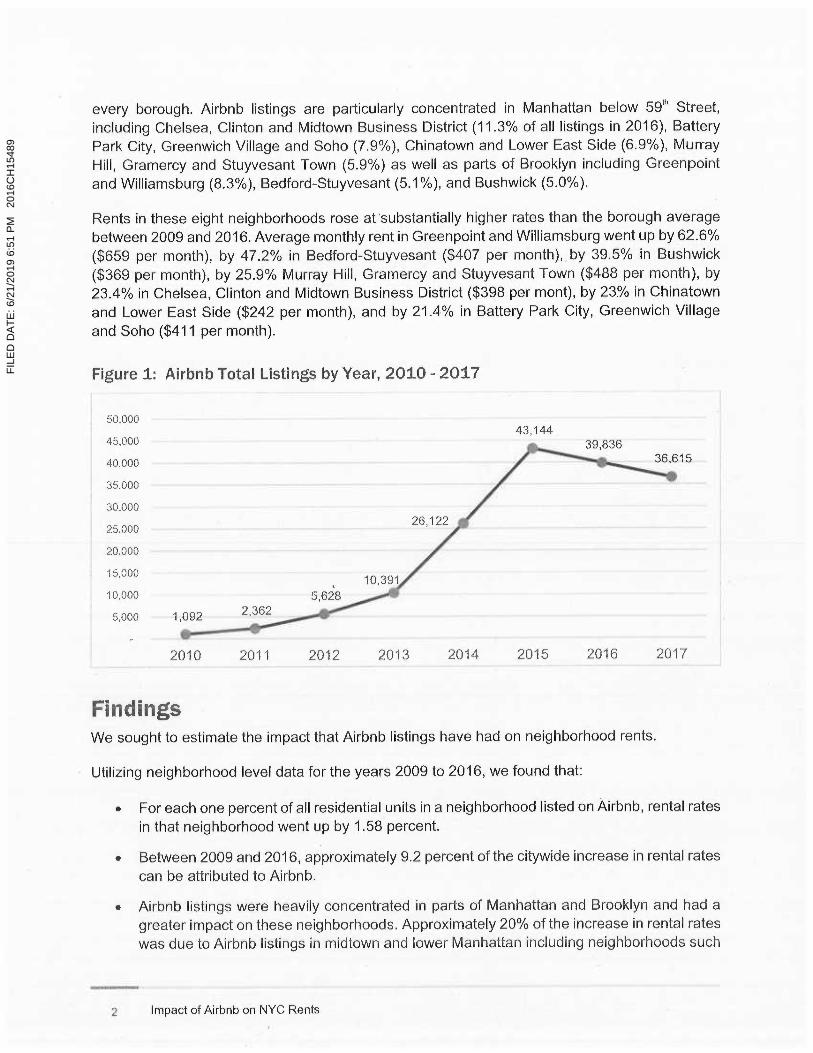
every borough. Airbnb listings are particularly concentrated in Manhattan below 59 h̀ Street,
including Chelsea, Clinton and Midtown Business District (11.3°/o of all listings in 2016), Battery
Park City, Greenwich Village and Soho (7.9%), Chinatown and Lower East Side (6.9%), Murray
Hill, Gramercy and Stuyvesant Town (5.9%) as well as parts of Brooklyn including Greenpoint
and Williamsburg (8.3%), Bedford-Stuyvesant (5.1 %), and Bushwick (5.0°/o).
Rents in these eight neighborhoods rose at~substantially higher rates than the borough average
between 2009 and 2016. Average monthly rent in Greenpoint and Williamsburg went up by 62.6%
($659 per month), by 47.2% in Bedford-Stuyvesant ($407 per month),, by 39.5% in Bushwick
($369 per month), by 25.9% Murray Hill, Gramercy and Stuyvesant Town ($488 per month), by
23.4°/o in Chelsea, Clinton and Midtown Business District ($398 per mont), by 23% in Chinatown
and Lower East Side ($242 per month), and by 21.4% in Battery Park City, Greenwich Village
and Soho ($411 per month).
Figure 1: Airbnb Total Listings by Year, 2010 - 2017
50,00043,144
45,000
40,000
35,000
30,000
25,000
za,000
~ 5,000
~ o,000
5,000 1,
15
2010 2011 2012 2013 2014 2015 2Q16 2017
FindingsWe sought to estimate the impact that Airbnb listings have had on neighborhood rents.
Utilizing neighborhood level data for the years 2009 to 2016, we found that:
• For each one percent of all residential units in a neighborhood listed on Airbnb, rental rates
in that neighborhood went up by 1.58 percent.
• Between 2009 and 2016, approximately 9.2 percent of the citywide increase in rental rates
can be attributed to Airbnb.
• Airbnb listings were heavily concentrated in parts of Manhattan and Brooklyn and had a
greater impact on these neighborhoods. Approximately 20% of the increase in rental rates
was due to Airbnb listings in midtown and lower Manhattan including neighborhoods such
~ Impact of Airbnb on NYC Rents
FILE
D D
ATE:
6/2
1/20
19 6
:51
PM
2016
CH
1548
9

as Chelsea, Clinton, and Midtown Business District; Murray Hill, Gramercy, and
Stuyvesant Town; Chinatown and Lower East Side; Battery Park City, Greenwich Village,
and Soho as well as parts of Brooklyn including Greenpoint and Williamsburg.
• In aggregate, New York City renters had to pay an additional $616 million in 2016 due to
price pressures created by Airbnb, with half of the increase concentrated in the
neighborhoods highlighted above.
Data and Methodology
We obtained Airbnb listings data from AirDNA (https:!(www.airdna.co/), which scrapes listings
data on a daily basis from Airbnb. We gathered zip code level data going back to 2010 when
Airbnb first listed dwellings in New York City, through the end of 2017. We then summed the data
to the neighborhood level, defined by Census Bureau Public Use Microdata Area (PUMA).5
Whenever a zip code crossed PUMA boundaries, we used 2010 population ratios as weights to
divide the number of listings between PUMAs. The number of unique listings in New York City
peaked in 2015 at just over 43,000 and dropped to under 37,000 by 2017.
Rental rate data comes from the annual American Community Survey (2009-16). We use average
monthly gross rent for all renters as our rent measure.6 We also control for neighborhood level
economic and demographic characteristics using data from the American Community Survey.
We pooled eight years of data for 55 neighborhoods, bringing our total number of observations to
440. The dependent variable is the logarithm of average monthly gross rent by neighborhood in
a given year. The independent variable with the coefficient of interest is the share of residential
units listed on Airbnb which is calculated by dividing annual unique Airbnb listings in the
neighborhood by total residential units in the same neighborhood.' We also control for
demographic and economic changes in neighborhood level by including average household
income (in log form), population (in log form), and the shares of college-educated and employed
residents in the neighborhood. We also included year and neighborhood-level fixed effects
(dummy) variables to control for otherwise uncontrolled-for trends and neighborhood
characteristics.
A summary of the regression results is presented in Table 1. We find that as the share of units
listed on Airbnb goes up by one percentage point, rental rates in the neighborhood go up by 1.58
percent, after controlling for neighborhood level demographic and economic changes. The result
is statistically significant at the 1-percent level. Coefficients of other control variables including
household income, population and share of college graduates are positive and statistically
significant at 1-percent level. Employment rate is not statistically different from zero.
S PUMAs are geographic units used by the US Census for providing statistical and demographic information. Each PUMA contains
at least 100,000 people. There are 55 PUMAS in New York City. See htt~s://wwvr.census.qov/aeo;reference/numa.html for more
details.
6 Gross monthly rent includes contract rent, utility costs, and fuel costs. Gross monthly rent amounts are more comparable across
time and households than contract rent which may or may not include utilities and fuels.
~ A table with Airbnb listings, Residential Units and Airbnb Share by PUMA in 2016 can be found in the Appendix.
Office of the New York City Comptroller Scott M. Stringer ;~
FILE
D D
ATE:
6/2
1/20
19 6
:51
PM
2016
CH
1548
9

In order to calculate the Airbnb contribution to total change in rents, we first predict the change in
PUMA level average gross rents from 2009 to 2016 using the regression model coefficients with
existing conditions (i.e. with existing demographic and economic conditions as well as Airbnb
listings). We then compare these predictions with an alternative prediction in which Airbnb listings
are set to zero throughout the entire time period. The difference between the latter and the former
gives the rent change associated with Airbnb growth in the neighborhood. Results are reported in
Table 2 (column labeled "Total Annual Rental Cost of Airbnb to the Neighborhood"), which shows
rental change associated with increase in Airbnb listings at PUMA level. With existing conditions,
from 2009 to 2016, citywide annual gross rents were predicted to go up by 25.3% (approximately
$6.67 billion). If, however, there were no Airbnb listings, the rents would be predicted to go up by
23% (approximately $6.06 billion). Therefore, approximately $616 million, or 9.2 percent of the
overall increase in rents for the period may be attributed to the rise in Airbnb listings.
Airbnb growth, however, was particularly high in certain neighborhoods. For instance, the share
of Airbnb listings reached 4.1 % of residential units in the Chelsea, Clinton &Midtown Business
District neighborhood and 4.6% in Greenpoint and Williamsburg. The largest relative Airbnb
effects on the rental market occurred in Chelsea, Clinton &Midtown Business District (21.6%)
and Murray Hill, Gramercy & Stuyvesant Town (21.5%). Average monthly rents went up by in
these neighborhoods by $398 and $488 respectively out of which $86 and $105 per month could
be attributed to Airbnb growth. The largest absolute effect occurred in Greenpoint and
Williamsburg where average rents increased by $659 between 2009 and 2016, of which $123 can
be attributed to Airbnb growth.
Table 1: Regression Results
dependent Variable: Logarithm of Average Rental Rata
.. -. ~ ..
1.584"""AirBnb Share
(0.389)
0.152`"``Household Income (log)
(0.0349)
0.194"*`Population (log)
(0.0421)
0.436***Share of College Graduates
(0.109)
0.154Employment Rate
(0.111)
2.760"`**Constant
(0.554)
Observations 440
Number of PUMAs 55
R-squared 0.836
PUMA FE YES
Year FE YES
NOTE: Standard errors in parentheses... p<0.01 ~ .. p<0.05, " p<0.1
~ Impact of Airbnb on NYC Rents
FILE
D D
ATE:
6/2
1/20
19 6
:51
PM
2016
CH
1548
9
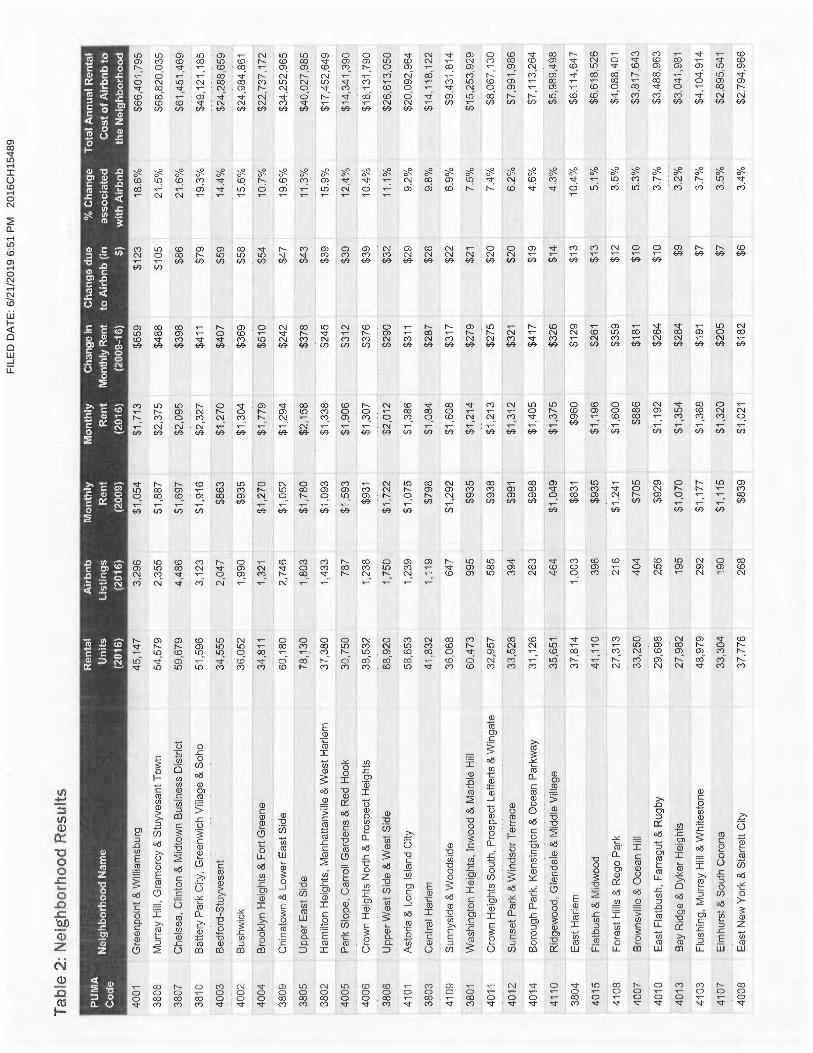
Tabie 2:
Nei
ghbo
rhoo
d Re
sult
s
4001
Greenpoint &Wi
llia
msbu
rg45,147
3,29
6$1,054
$1,713
$659
$123
18.6%
$66,401,795
3808
Murr
ay Hill, Gramercy & Stu
yves
ant Town
54,579
2,35
5$1,887
$2,375
$488
'$105
21.5%
$68,820,035
3807
Chel
sea,
Clinton &Midtown Bus
ines
s District
59,679
4,486
$1,697
$2,095
$398
$86
21.6%
$61,
451,
469
3810
Battery Park City, Gre
enwi
ch Village 8~ Soho
51,596
3,12
3$1,916
$2,327
$411
$79
'19.3%
$49,121,185
4003
Bedf
ord-
Stuy
vesa
nt34
,555
2,04
7$863
$1,270
$407
$59
14.4%
$24,
288,
659
4002.
........
...Bu
shwi
ck36,052
1,990
$935
$1,304
$369
.$58
15.6%
$24,984,861
4004
Broo
klyn
Hei
ghts
&Fort Greene
34,8
111,
321
$1,270
$1,779
$510
$54
10.7%
$22,
737,
172
3809
Chinatown &Lower Eas
t Si
de60,180
2,74
6$1,052
$1,294
$242
',$47
19.6%
$34,252,965
3805
Upper Eas
t Side
78,1
301,
803
$1,780
$2,158
$378
$43
11.3%
$40,027,985
3802
Hamilton Hei
ghts
, Ma
nhat
tanv
ille
&West Harlem
37,380
1,43
3$1,093
$1,338
$245
:$39
15.9%0
$17,
452,
649
4005
Park Slope, Carroll Gardens &Red Hook
30,7
50787
$1,593
$1,906
$312
$39
12.4%
$14,341,390
4006
Crown Hei
ghts
North &Prospect Heights
38,532
1,23
8$931
$1,307
$376
$39
10.4%
$18,131,790
3806
Upper West Sid
e 8~ West Sid
e68,920
1,750
$1,722
$2,012
$290
__$32
11.1%
$26,613,050
4101
Astoria &Long Isl
and Ci
ty58,653
1,23
9$1,075
$1,386
'$311
'$29
9.2%
$20,092,964
3803
Central Ha
rlem
41,832
1,11
9$798
$1,084
$287
$28
9.8%
$14,
118,
122
4109
Sunnyside &Woodside
36,068
647
$1,292
$1,608
$317
$22
6.9%
$9,431,814
3801
Washington Hei
ghts
, Inwood &Marble Hill
60,473
995
$935
$1,214
$279
$21
7.5%
$15,
253,
929
4011
Crown Hei
ghts
Sou
th, Prospect Lefferts &Wingate
32,957
585
$938
$1,213
$275
$20
7.4%
$8,0
67,1
30
4012
Sunset Park &Windsor Ter
race
33,528
394
$991
$1,312
$321
$20
6.2%
$7,991,986
4014
Borough Park, Kensington &Ocean Parkway
31,126
263
$988
$1,405
'$417
$19
',4.6%
$7,113,264
4110
Ridgewood, Glendale &Middle Village
35,651
464
$1,049
$1,375
$326
$14
4.3%
$5,9
89,4
98
3804
East Harlem
37,814
1,00
3$831
$960
$129
',$13
',10.4%
$6,114,647
4015
Flatbush & Midwood
41,110
396
$935
$1,196
$261
$13
5.1%
$6,618,526
4108
_Fo
rest
Hil
ls 8~ Rego Park
27,313
216
_ _
$1,2
41$1,600
_$359
$12
I_. 3.5%
$4,0
88,4
01
4007
Brow
nsvi
lle &Ocean H
ill
33,2
50404
$705
$886
$181
$10
5.3%
$3,8
17,6
43
4010
East Flatbush, Farragut &Rugby
29,698
256
$929
$1,192
'$264
$10 '
3.7%
$3,488,963
4013
Bay Ridge & Dyker Hei
ghts
27,982
195
$1,070
$1,354
$284
$9
3.2%
$3,0
41,9
81
4103
Flushing, Murray Hiil & Whitestone
48,979
292
$1,177
$1,368
$191
$7
3.7%
$4,104,914
4107
Elmhurst &South Corona
33,304
190
$1,115
$1,320
$205
$7
3.5%
$2,8
95,5
41
..4008
East New York &S
tarr
ett City
.....37
,776
.268
$839
$1,0
21$182
$6
3.4%
$2.794.966
FILE
D D
ATE:
6/2
1/20
19 6
:51
PM
2016
CH
1548
9

4016
Sheepshead Bay, Gerritsen Beach & Homecrest
27,490
4102
Jackson Heights
8~ North Corona
32,819
4106
Briarwood, Fresh Meadows 8~ Hiilcrest
28,452
4114
Far Rockaway, Breezy Point &Broad Channel
22,373
3701
Riverdale, Fieldston 8~ Kingsbridge
27,564
4009
Canarsie &Flatlands
27,002
4104
Bayside, Dougiaston &Little Neck
12,621
4111
Richmond H
ill &Woodhaven
23,544
3704
Pelham Parkway, Morris Park &Laconia
29,595
3903
Port Richmond, Stapleton &Mariners Harbor
26,520
4018
Brighton Beach &Coney Island
32,416
3706
Bedford Park, Fordham North &Norwood
39,929
3707
Morris Heights, Fordham South &Mount Hope
41,468
3708
Concourse, Highbridge &Mount Eden
40,145
3709
Castle H
ill, Ciason Point & Parkchester
50,936
3710
Hunts Point, Longwood 8~ Melrose
42,778
4017
Bensonhurst 8~ Bath Beach
34,275
4105
Queens Village, Cambria Heights &Rosedale
16,594
4112
Jamaica, Hollis 8~ St. Albans
32,053
3702
Wakefield, Williamsbridge & Woodlawn
27,747
3703
Co-op City, Peiham Bay & Schuylerville
22,244
3705
Belmont, Crotona Park East €~ East Tremont
47,005
4113
Howard Beach &Ozone Park
11,866
3901
Tottenville, Great Kills & Annadale
8,205
3902
New Springville &South Beach
12,239
167
$918
$1,222
$303
$6
1.9%
$1,880,709
228
$1,1.31
$1,288
$157 '
$6
':3.9%
$2.389.733
100
$1,064
._$1,448
$384
$5_
1.2%
$1,597,232
177
$856
$995
$139
$5
3.5%
$1,302,810
95
$1,011
$1,225
$214
$4
1.7%
$1,211,959
146
$1,000
$1,242
$242
',$4
__ 1.6%
$1,236,019
83
$1,269
$1,542
.$273
$4
1.6%
$667,138
126
$1,132
$1.354
$222
$4
1.9%
$1,169,156
72
$887
$1,126
$239
$3
1.3%
$1,087,022
125
$855
$1.061
$207
$3 '
1.5%
$1,013.387
119
$770
__
$946
_$177
$3
__1.5%
_ __
$1,040,590
66
$854
$1,032
$178
$2
1.1%
$942,338 '
54
$777
$970
$193
$2
1.1%
$1,029,003
86
$750
$934
$184
$2
''1.2%
$1,095,031
64
$81.9
$1,025
$206
$2
0.8%
$1,006,744
..
114
$653
$811
$158
$2 '
1.1%
$876,036
',
87
$899
_ $1.214.
_$314
_ $2
0.7%
$941,936
108
$1.178
$1.325
$147
$2 '
1.4%
$410.678
142
.$990
$1,146
.$156._
$2
1.3%
_$801,327.....
62
$966
..$1.092
..$126
.$1
1.0%
$402,301
37
$970
$1,095
$125
$10.8%
$251,180
70
$712
..$838 '
$126
$1
0.7%
__$506,036
58
_ $1,139
_ $1.254
___
$114
$1
1A%a
_$167.533
20
',$1.094
$1,074
($19) ''
$0
',0.3%
($4;8647
53
$1,048
$1,109
$61
$0
0.8%
_ $72,989
FILE
D D
ATE:
6/2
1/20
19 6
:51
PM
2016
CH
1548
9
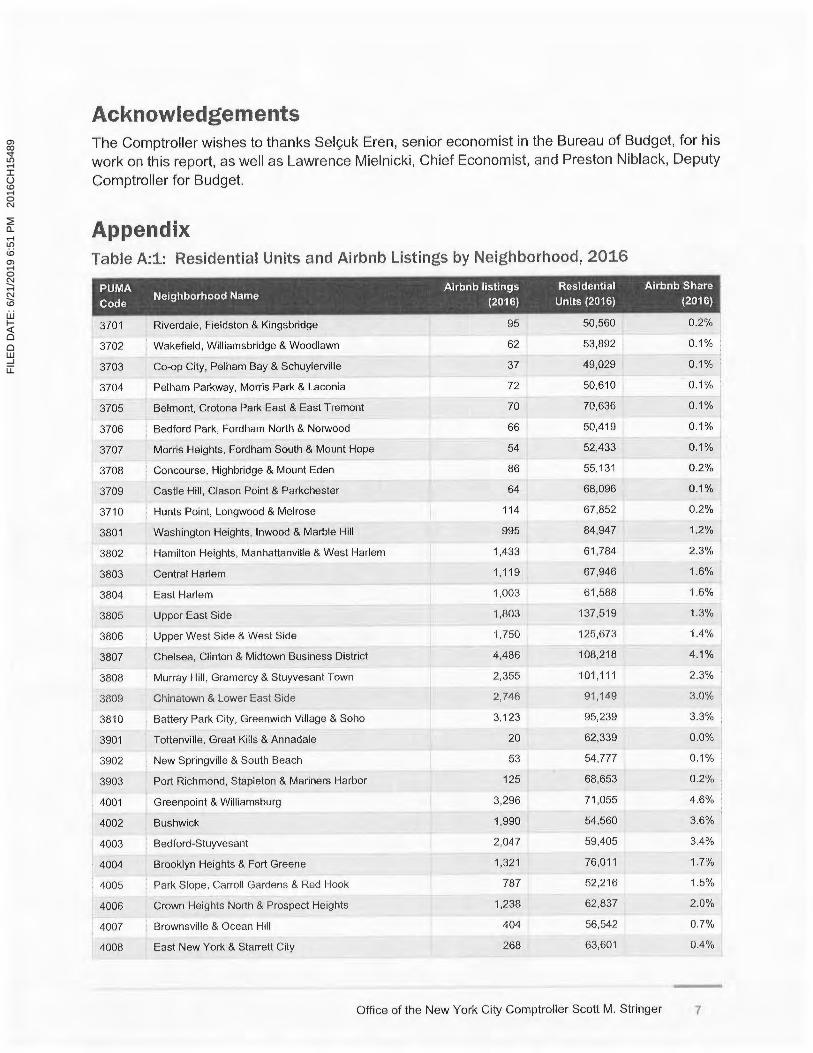
AcknowledgementsThe Comptroller wishes to thanks Seljuk Eren, senior economist in the Bureau of Budget, for his
work on this report, as well as Lawrence Mielnicki, Chief Economist, and Preston Niblack, Deputy
Comptroller for Budget.
AppendixTable A:1: Residential Units and Airbnb Listings by Neighborhood, 2016
3701 Riverdale, Fieldston & Kingsbridge 95 50,560 0.2%
', 3702 ,Wakefield, Williamsbridge & Woodlawn 62 53,892 0.1%
3703 Co-op City, Pelham Bay & Schuylerville 37 49,029 0.1
3704 'Pelham Parkway, Morris Park &Laconia 72 50,610 0.1 % '.
3705 Belmont, Crotona Paris East &East Tremont 70 70,636 0.1
3706 'Bedford Park, Fordham North &Norwood 66 50,419 0.1
3707 Morris Heights, Fordham South &Mount Hope 54 52,433 0.1%
3708 Concourse, Highbridge &Mount Eden 86 55,131 0.2%
3709 Castle Hill, Clason Point & Parkchester 64 68,096 0.1%
3710 Hunts Point, Longwood &Melrose 114 67,852 0.2%
3801 Washington Heights, Inwood &Marble Hill 995 84,947 1.2°/a
3802 Hamilton Heights, Manhattanville &West Harlem 1,433 61,784 2.3%
3803 Central Harlem 1,119 67,946 1.6%
3804 'East Harlem 1,003 61,588 1.6%
3805 Upper East Side 1,803 137,519 1.3%
3806 Upper West Side &West Side 1,750 125,673 1.4%
3807 Chelsea, Clinton &Midtown Business District 4,486 108,218 4.1%
3808 Murray Hill, Gramercy & Stuyvesant Town 2,355 101,111 2.3%
3809 Chinatown &Lower East Side 2,746 91,149 3.0%
3810 Battery Park City, Greenwich Village &Soho 3,123 95,239 3.3%
3901 Tottenville, Great Kills & Annadale 20 62,339 0.0%
3902 New Springville &South Beach 53 54,777 0.1
3903 Port Richmond, Stapleton &Mariners Harbor 125 68,653 0.2%
4001 Greenpoint &Williamsburg 3,296 71,055 4.6%
4002 Bushwick 1,990 54,560 3.6%
4003 ;Bedford-Stuyvesant 2,047 59,405 3.4°/o
4004 Brooklyn Heights &Fort Greene 1,321 76,011 1.7%
4005 Park Slope, Carroll Gardens &Red Hook 787 52,216 1.5%
4006 Crown Heights North &Prospect Heights 1,238 62,837 2.0%
4007 'Brownsville &Ocean Hill 404 56,542 0.7%
4008 East New York &Starrett City 268 63,601 0.4%
Office of the New York City Comptroller Scott M. Stringer 7
FILE
D D
ATE:
6/2
1/20
19 6
:51
PM
2016
CH
1548
9
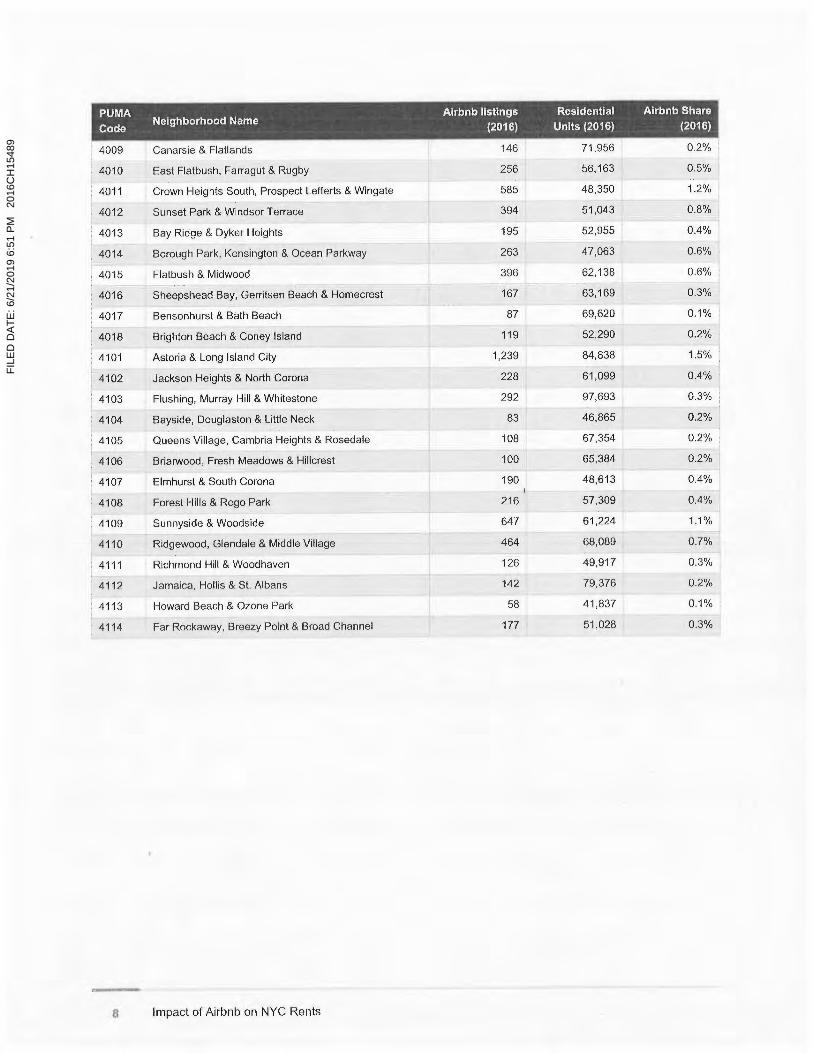
4009 Canarsie &Flatlands 146 71,956 0.2%
4010 East Flatbush, Farragut &Rugby 256 56,163 0.5%
4011 Crown Heights South, Prospect Lefferts &Wingate 585 48,350 1.2%
'; 4012 Sunset Park &Windsor Terrace 394 51,043 0.8°/a
4013 Bay Ridge & Dyker Heights 195 52,955 0.4%
4014 Borough Park, Kensington &Ocean Parkway 263 47,063 0.6%
4015 Flatbush & Midwood 396 62,138 0.6%
4016 Sheepshead Bay, Gerritsen Beach & Homecrest 167 63,169 0.3%
4017 Bensonhurst &Bath Beach 87 69,620 0.1%
4018 Brighton Beach &Coney Island 119 52,290 0.2%
': 4101 Astoria &Long Island City 1,239 84,838 1.5%
4102 Jackson Heights &North Corona 228 61,099 0.4%
4103 Flushing, Murray Hill & Whitestone 292 97,693 0.3%
', 4104 Bayside, Douglaston &little Neck 83 46,865 0.2%
4105 Queens Village, Cambria Heights &Rosedale 108 67,354 0.2°/a
4106 Brianvood, Fresh Meadows & Hillcrest 100 65,384 0.2%
4107 Elmhurst &South Corona 190 48,613 0.4%
4108 Forest Hilis &Rego Park 216 57,309 0.4%
4109 Sunnyside &Woodside 647 61,224 1.1% ',
4110 Ridgewood, Glendale &Middle Village 464 68,089 0.7%
4111 Richmond Hill &Woodhaven 126 49,917 0.3%
4112 Jamaica, Hollis & St. Albans 142 79,376 0.2%
4113 Howard Beach &Ozone Park 58 41,837 0.1%
4114 Far Rockaway, Breezy Point &Broad Channel 177 51,028 0.3%
f~ Impact of Airbnb on NYC Rents
FILE
D D
ATE:
6/2
1/20
19 6
:51
PM
2016
CH
1548
9

Exhibit F
FILE
D D
ATE:
6/2
1/20
19 6
:51
PM
2016
CH
1548
9

1
The High Cost of Short-Term Rentals in New York City
A report from theUrban Politics and Governance research groupSchool of Urban PlanningMcGill University
January 30, 2018
David WachsmuthDavid ChaneyDanielle KerriganAndrea ShilloloRobin Basalaev-Binder
FILE
D D
ATE:
6/2
1/20
19 6
:51
PM
2016
CH
1548
9

2
Executive Summary
This report provides a comprehensive analysis of Airbnb activity in New York City and the surrounding region in the last three years (September 2014 - August 2017). Relying on new methodologies to analyze big data, we set out to answer four questions:
1. Where is Airbnb activity located in New York, and how is it changing?
2. Who makes money from Airbnb in New York?
3. How much housing has Airbnb removed from the market in New York?
4. Is Airbnb driving gentrification in New York?
• Two Thirds of Revenue from Likely Illegal Listings: Entire-home/apartment listings account for 75% ($490 million) of total Airbnb revenue and represent 51% of total listings. 87% of entire-home reservations are illegal under New York State law, which means that 66% of revenue ($435 million) and 45% of all New York Airbnb reservations last year were illegal.
• 13,500 Units of Lost Housing: Airbnb has removed between 7,000 and 13,500 units of housing from New York City’s long-term rental market, including 12,200 frequently rented entire-home listings that were available for rent 120 days or more and 5,600 entire-home listings available for rent 240 days or more.
• $380 More in Rent: By reducing housing supply, Airbnb has increased the median long-term rent in New York City by 1.4% over the last three years, resulting in a $380 rent increase for the median New York tenant looking for an apartment this year. In some
KEY FINDINGS:
Manhattan neighborhoods the increase is more than $700.
• 4,700 Ghost Hotels: There are 4,700 private-room listings that are in fact “ghost hotels” comprising many rooms in a single apartment. These ghost hotels have removed 1,400 units of housing from the long-term rental market, and are a new tactic for commercial Airbnb operators to avoid regulatory scrutiny.
• 28% of Revenue: Commercial operators that control multiple entire-home/apartment listings or large portfolios of private rooms are only 12% of hosts but they earn more than 28% of revenue in New York City.
• Top 10% of Hosts: The top 10% of hosts earned a staggering 48% of all revenue last year, while the bottom 80% of hosts earned just 32%.
• 200% and $100K More: The median host of a frequently rented entire-home/apartment
FILE
D D
ATE:
6/2
1/20
19 6
:51
PM
2016
CH
1548
9
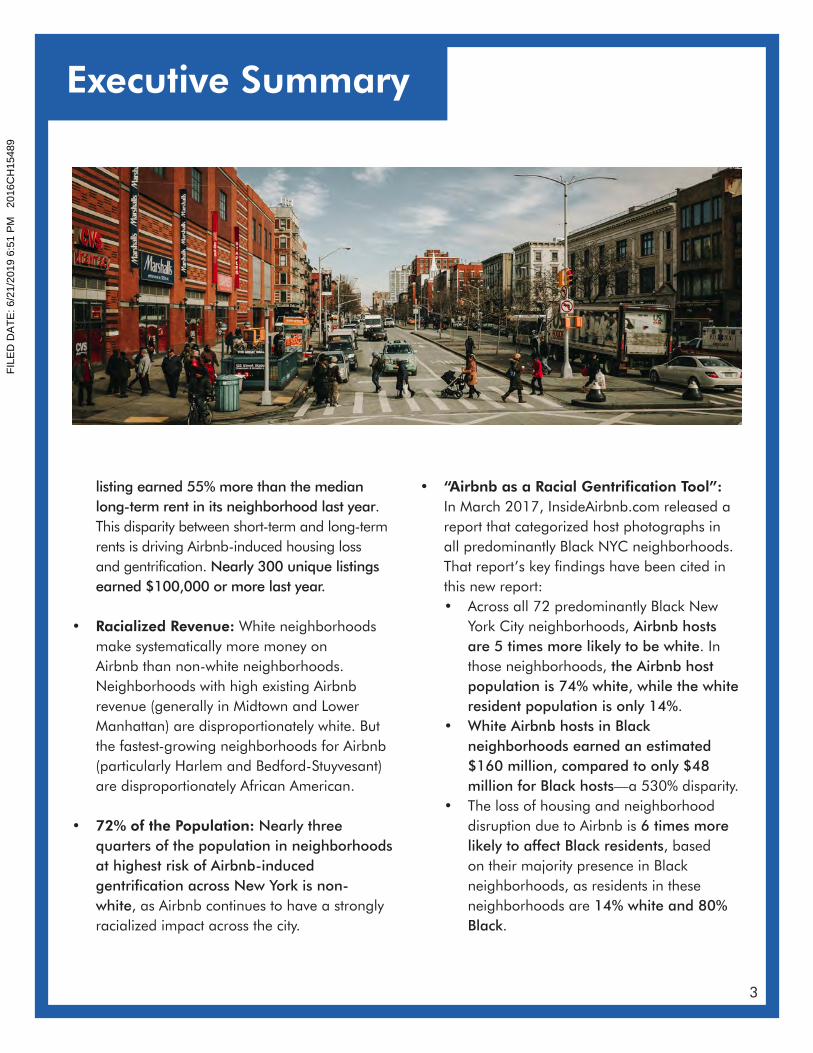
3
listing earned 55% more than the median long-term rent in its neighborhood last year. This disparity between short-term and long-term rents is driving Airbnb-induced housing loss and gentrification. Nearly 300 unique listings earned $100,000 or more last year.
• Racialized Revenue: White neighborhoods make systematically more money on Airbnb than non-white neighborhoods. Neighborhoods with high existing Airbnb revenue (generally in Midtown and Lower Manhattan) are disproportionately white. But the fastest-growing neighborhoods for Airbnb (particularly Harlem and Bedford-Stuyvesant) are disproportionately African American.
• 72% of the Population: Nearly three quarters of the population in neighborhoods at highest risk of Airbnb-induced gentrification across New York is non-white, as Airbnb continues to have a strongly racialized impact across the city.
• “Airbnb as a Racial Gentrification Tool”: In March 2017, InsideAirbnb.com released a report that categorized host photographs in all predominantly Black NYC neighborhoods. That report’s key findings have been cited in this new report:• Across all 72 predominantly Black New
York City neighborhoods, Airbnb hosts are 5 times more likely to be white. In those neighborhoods, the Airbnb host population is 74% white, while the white resident population is only 14%.
• White Airbnb hosts in Black neighborhoods earned an estimated $160 million, compared to only $48 million for Black hosts—a 530% disparity.
• The loss of housing and neighborhood disruption due to Airbnb is 6 times more likely to affect Black residents, based on their majority presence in Black neighborhoods, as residents in these neighborhoods are 14% white and 80% Black.
Executive Summary
FILE
D D
ATE:
6/2
1/20
19 6
:51
PM
2016
CH
1548
9
4
Table of Contents
EXECUTIVE SUMMARY
INTRODUCTION
1. WHERE IS AIRBNB ACTIVITY LOCATED, AND HOW IS IT CHANGING?
2. WHO MAKES MONEY FROM AIRBNB?
3. HOW MUCH HOUSING HAS AIRBNB REMOVED FROM THE MARKET?
4. IS AIRBNB DRIVING GENTRIFICATION?
APPENDIX: DATA AND METHODOLOGY
REFERENCES
AUTHORSHIP AND FUNDING
ACKNOWLEDGMENTS
ABOUT UPGO
p. 2
p. 5
p. 9
p. 18
p. 25
p. 34
p. 43
p. 47
p. 48
p. 48
p. 48
FILE
D D
ATE:
6/2
1/20
19 6
:51
PM
2016
CH
1548
9
5
Community groups and housing advocates in cities across the world have begun to sound the alarm about the impact Airbnb is having on affordable housing in their communities, citing concerns about housing supply lost, racialized gentrification, and impact on residents’ quality of life. To understand Airbnb’s impact on housing in New York, this report presents a comprehensive analysis of three years of Airbnb activity in New York City and the surrounding region. It relies on the most comprehensive third-party dataset of Airbnb activity available, and new methodologies for spatial analysis of big data.
Introduction
Community groups and housing advocates in cities across the world have begun to sound the alarm about Airbnb’s impact on affordable housing in their communities, citing concerns about housing supply lost, racialized gentrification, and impact on residents’ quality of life (see, e.g., BJH Advisors 2016; Lee 2016; Samaan 2015; New York Communities for Change 2015; Wachsmuth et al. 2017; Wieditz 2017). Several years ago, a study by New York Communities for Change and Real Affordability for All found that Airbnb took approximately 20% of vacancies off the market in certain Manhattan and Brooklyn zip codes, and up to 28% in the East Village neighborhood, even though it is technically illegal to rent an entire unit for fewer than 30 days in most buildings. Overall, they estimated that the 20 neighborhoods most popular on Airbnb have lost 10% of rental units (NYCC and RAFA 2015). These neighborhoods are also featured in Airbnb’s neighbourhood guides. More recently, a study found that Airbnb hosts are prone to reject African-American guests even if it means a loss in possible income (Edelman et al. 2017). Another another study found that short-term rentals are growing faster in Black neighborhoods in New
AIRBNB AND ITS CRITICS IN NEW YORK
York, displacing and otherwise disproportionately affecting Black residents while accruing wealth for white residents (Cox 2017).
Quality of life is also a concern for residents who have seen their neighbourhoods transformed into de facto hotel districts (Cócola Gant 2016). In the fall of 2016, residents of New Orleans, still recovering from Hurricane Katrina, held a jazz funeral at city hall (with coffins reading “RIP real neighbors” and “RIP affordable housing”) to mourn neighbourhoods lost to Airbnb tourism in a protest (Litten 2016). Meanwhile, hotel associations complain that short-term rentals effectively function as hotels but have an unfair advantage because they don’t pay taxes and don’t comply with safety and zoning regulations.
Airbnb has effectively created a new category of rental housing—short-term rentals—which occupies a gap between traditional residential rental housing and hotel accommodation. Nonetheless, Airbnb’s impact on cities and housing markets is not well understood, in part because the company takes great pains to cloud its operations from scrutiny. The New York
FILE
D D
ATE:
6/2
1/20
19 6
:51
PM
2016
CH
1548
9
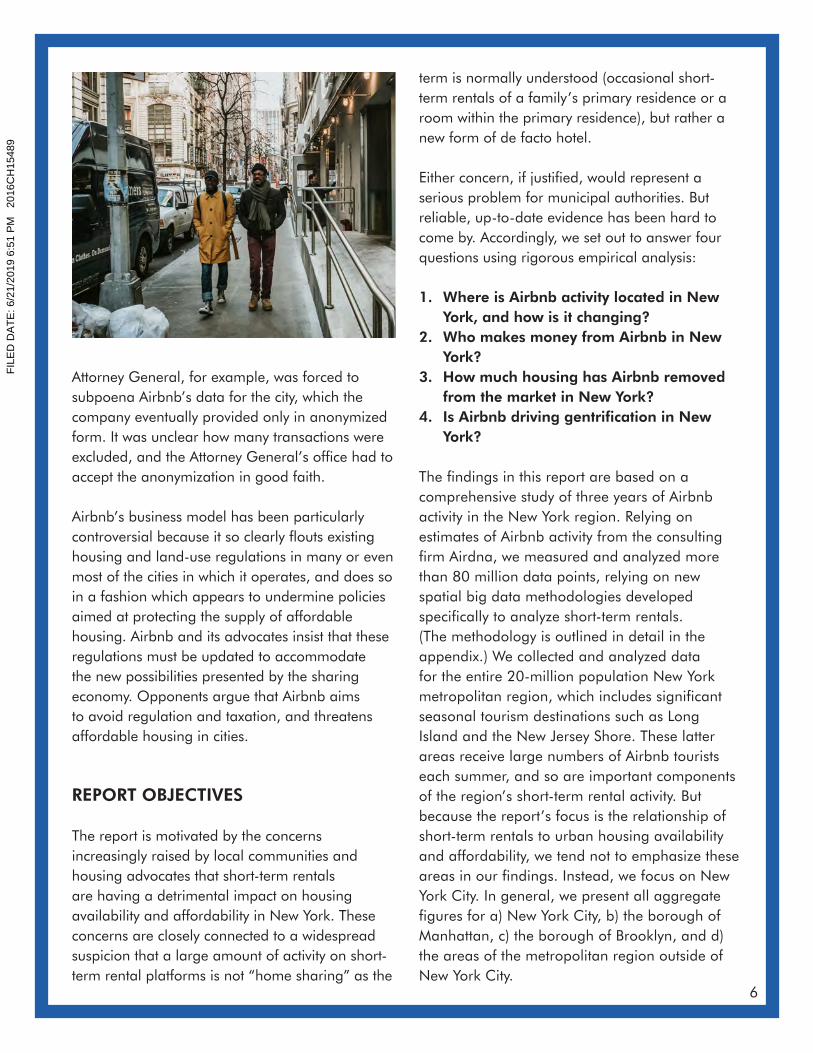
6
Attorney General, for example, was forced to subpoena Airbnb’s data for the city, which the company eventually provided only in anonymized form. It was unclear how many transactions were excluded, and the Attorney General’s office had to accept the anonymization in good faith.
Airbnb’s business model has been particularly controversial because it so clearly flouts existing housing and land-use regulations in many or even most of the cities in which it operates, and does so in a fashion which appears to undermine policies aimed at protecting the supply of affordable housing. Airbnb and its advocates insist that these regulations must be updated to accommodate the new possibilities presented by the sharing economy. Opponents argue that Airbnb aims to avoid regulation and taxation, and threatens affordable housing in cities.
REPORT OBJECTIVES
The report is motivated by the concerns increasingly raised by local communities and housing advocates that short-term rentals are having a detrimental impact on housing availability and affordability in New York. These concerns are closely connected to a widespread suspicion that a large amount of activity on short-term rental platforms is not “home sharing” as the
term is normally understood (occasional short-term rentals of a family’s primary residence or a room within the primary residence), but rather a new form of de facto hotel.
Either concern, if justified, would represent a serious problem for municipal authorities. But reliable, up-to-date evidence has been hard to come by. Accordingly, we set out to answer four questions using rigorous empirical analysis:
1. Where is Airbnb activity located in New York, and how is it changing?
2. Who makes money from Airbnb in New York?
3. How much housing has Airbnb removed from the market in New York?
4. Is Airbnb driving gentrification in New York?
The findings in this report are based on a comprehensive study of three years of Airbnb activity in the New York region. Relying on estimates of Airbnb activity from the consulting firm Airdna, we measured and analyzed more than 80 million data points, relying on new spatial big data methodologies developed specifically to analyze short-term rentals. (The methodology is outlined in detail in the appendix.) We collected and analyzed data for the entire 20-million population New York metropolitan region, which includes significant seasonal tourism destinations such as Long Island and the New Jersey Shore. These latter areas receive large numbers of Airbnb tourists each summer, and so are important components of the region’s short-term rental activity. But because the report’s focus is the relationship of short-term rentals to urban housing availability and affordability, we tend not to emphasize these areas in our findings. Instead, we focus on New York City. In general, we present all aggregate figures for a) New York City, b) the borough of Manhattan, c) the borough of Brooklyn, and d) the areas of the metropolitan region outside of New York City.
FILE
D D
ATE:
6/2
1/20
19 6
:51
PM
2016
CH
1548
9

7
SUMMARY OF KEY FINDINGS
The report provides detailed analysis of three years of Airbnb activity in New York, including profiles of neighborhoods with disproportionate shares of either total Airbnb activity or new growth. The key report findings are as follows:
Two Thirds of Revenue from Likely Illegal Listings: Entire-home/apartment listings account for 75% ($490 million) of total Airbnb revenue and represent 51% of total listings. 87% of entire-home reservations are illegal under New York State law, which means that 66% of revenue ($435 million) and 45% of all Airbnb reservations in New York City last year were illegal.
13,500 Units of Lost Housing: Airbnb has removed between 7,000 and 13,500 units of housing from New York City’s long-term rental market, including 12,200 frequently rented entire-home listings that were available for rent 120 days or more and 5,600 entire-home listings available for rent 240 days or more.
$380 More in Rent: By reducing housing supply, Airbnb has increased the median long-term rent in New York City by 1.4% over the last three years: a $380 rent increase for the median New York tenant looking for an apartment this year. In some Manhattan areas the increase is $700 or more.
4,700 Ghost Hotels: There are 4,700 private-room listings that are in fact “ghost hotels” comprising many rooms in a single apartment or building. These ghost hotels have removed 1,400 units of housing from the long-term rental market, and represent a new tactic for commercial Airbnb operators to avoid regulatory scrutiny.
28% of Revenue: Commercial operators that control multiple entire-home listings or large portfolios of private rooms are only 12% of hosts but earn more than 28% of revenue in New York City.
Top 10% of Hosts: The top 10% of hosts earned a staggering 48% of all revenue last year, while the bottom 80% of hosts earned just 32%.
FILE
D D
ATE:
6/2
1/20
19 6
:51
PM
2016
CH
1548
9
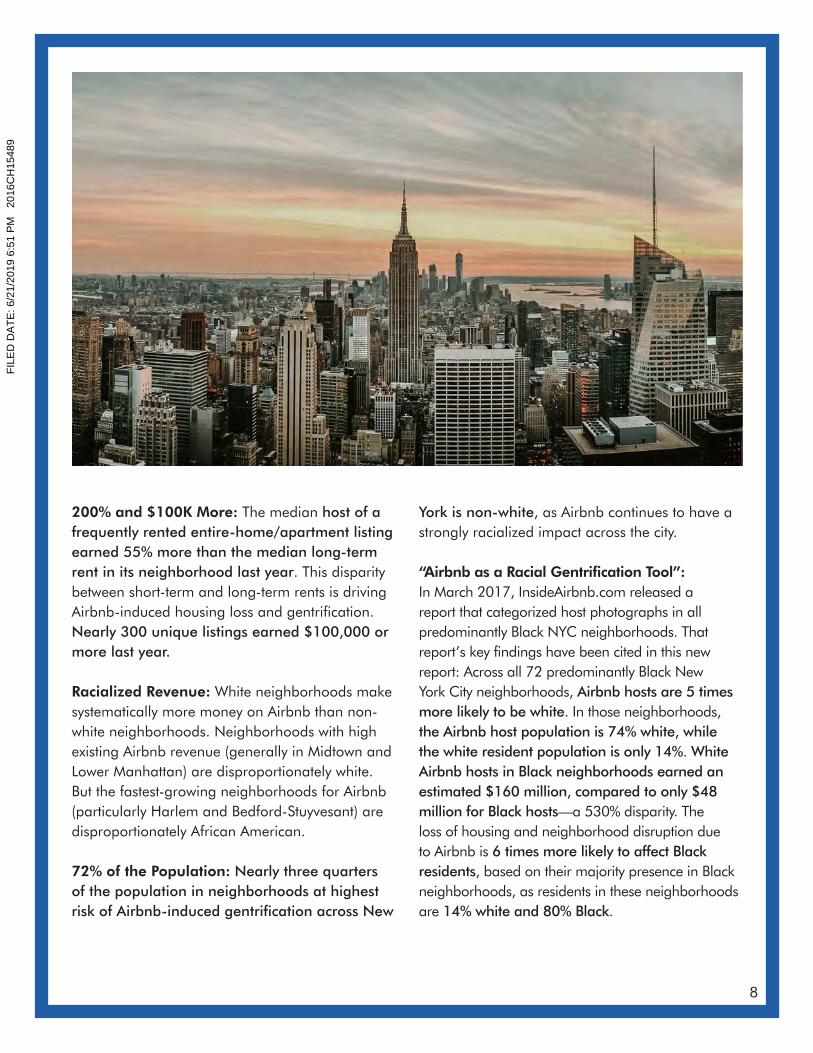
8
200% and $100K More: The median host of a frequently rented entire-home/apartment listing earned 55% more than the median long-term rent in its neighborhood last year. This disparity between short-term and long-term rents is driving Airbnb-induced housing loss and gentrification. Nearly 300 unique listings earned $100,000 or more last year.
Racialized Revenue: White neighborhoods make systematically more money on Airbnb than non-white neighborhoods. Neighborhoods with high existing Airbnb revenue (generally in Midtown and Lower Manhattan) are disproportionately white. But the fastest-growing neighborhoods for Airbnb (particularly Harlem and Bedford-Stuyvesant) are disproportionately African American.
72% of the Population: Nearly three quarters of the population in neighborhoods at highest risk of Airbnb-induced gentrification across New
York is non-white, as Airbnb continues to have a strongly racialized impact across the city.
“Airbnb as a Racial Gentrification Tool”: In March 2017, InsideAirbnb.com released a report that categorized host photographs in all predominantly Black NYC neighborhoods. That report’s key findings have been cited in this new report: Across all 72 predominantly Black New York City neighborhoods, Airbnb hosts are 5 times more likely to be white. In those neighborhoods, the Airbnb host population is 74% white, while the white resident population is only 14%. White Airbnb hosts in Black neighborhoods earned an estimated $160 million, compared to only $48 million for Black hosts—a 530% disparity. The loss of housing and neighborhood disruption due to Airbnb is 6 times more likely to affect Black residents, based on their majority presence in Black neighborhoods, as residents in these neighborhoods are 14% white and 80% Black.
FILE
D D
ATE:
6/2
1/20
19 6
:51
PM
2016
CH
1548
9

9
AIRBNB ACTIVITY ACROSS THE NEW YORK METROPOLITAN REGION
In the past year (September 2016 - August 2017), there were 67,100 listings reserved at least once on Airbnb in New York City — a 4.5% increase from the previous year (64,200 listings), and a 37% increase from the year before that (48,800 listings). It is not the case, however, that there
are 67,100 listings receiving reservations at any given time—there is a large amount of churn in the market and, on average, half of the listings available on Airbnb in a given month receive at least one reservation. Just over 50% (34,000) of these listings are in Manhattan, while 37%
In the last year, Airbnb growth in New York City has slowed down considerably. Revenue-earning listings grew by only 4.5% (to 67,100) citywide, and even shrunk by 3% (to 34,000) in Manhattan. Total host revenue grew by 14% (to $657 million) between 2016 and 2017, a major slowdown from the previous year’s growth rate of 35% (to $576 million). However, growth remains strong in several North Brooklyn and North Manhattan neighborhoods, even as it has stagnated in the areas with historically the most short-term rental activity. Entire-home Airbnb listings are a slim majority of total listings (51%, 34,300 listings) but account for 75% ($490 million) of total revenue. They predominate in Midtown and Lower Manhattan and North Brooklyn, while private-room listings are more common outside this core area. Nearly half of New York City listings in a given month are hosting illegal reservations.
1. Where is Airbnb activity located , and how is it changing?
Listings reserved at least once in the last year
% increase overprevious year
Listings available at least once in the last year
Listingsreservedmonth-to-month
Listingsavailablemonth-to-month
New York City 67,100 4.5% 95,500 16,100 - 25,700 50,000 - 59,100
Manhattan 34,000 -3.0% 49,000 7,900 - 15,600 25,500 - 30,000
Brooklyn 25,000 9.3% 35,100 6,200 - 11,100 18,300 - 21,900
Rest of MSA 18,200 48% 25,000 3,700 - 10,200 12,500 - 18,200
Figure 1a. Airbnb listings in the New York region
FILE
D D
ATE:
6/2
1/20
19 6
:51
PM
2016
CH
1548
9

10
Figure 1b. The growth in revenue-earning Airbnb listings, Sep 2014 - Aug 2017
(25,000) are in Brooklyn. Although listings in the former have decreased year-over-year, they continue to grow robustly in the latter. New York City is responsible for the overwhelming majority of Airbnb activity in the wider metropolitan region (the New York MSA), but listings in the rest of the MSA are growing at more than ten times New York City’s rate (Figure 1a).
The number of revenue-earning listings is the clearest indicator of the fluctuations of the short-term rental market. Figure 1b aggregates this count and represents it spatially in three heatmaps of revenue-earning Airbnb listings, and indicates both the expansion and intensification of listing density in the New York region over the last three years. Manhattan, Midtown, the West Side, and the Lower East Side have consistently seen the greatest concentration of Airbnb activity; off the island of Manhattan, only Williamsburg in Brooklyn is comparable. In the last two years, however, new hotspots have been emerging in Brooklyn (Bushwick and Bedford-Stuyvesant), Manhattan (the Upper West Side and Harlem), and New Jersey (Jersey City).
FILE
D D
ATE:
6/2
1/20
19 6
:51
PM
2016
CH
1548
9
11
AIRBNB’S DECLINING GROWTH IN NEW YORK: MANHATTAN DOWN, BROOKLYN UP
Airbnb’s growth in New York City has decisively slowed down in the last year. For the year ending August, total host revenue grew by 35% (to $576 million) between 2015 and 2016, but only by 14% (to $657 million) between 2016 and 2017. Figure 1c shows the month-to-month change in the number of listings which receive at least one reservation. (These figures are seasonally
Even as the growth of new listings has slowed down in the last year, revenue growth in New York City has stagnated completely (Figure 1d.). While the wider New York region has continued to see moderate (though slowed) revenue growth, average year-over-year growth in the city has been flat for the last six months, with significant shrinkage in Manhattan (an average of -6% over the last six months) balanced out by continuing
adjusted, as discussed in the Appendix.) Two patterns are apparent. First, a slowdown in listing growth across New York City, even as the rest of the region continues to grow. Second, a convergence between Manhattan and Brooklyn, with the latter borough drawing within a few thousand listings of the former for the first time ever.
(although slowing) growth in Brooklyn (averaging 9% over the last six months).
As a result of Manhattan’s decline in contrast to Brooklyn’s growth, the latter borough now accounts for a historically large proportion of New York City’s Airbnb activity—32% ($195 million) of monthly revenue at the end of the study period, compared to 27% ($114 million) at the beginning.
Figure 1c. Seasonally adjusted revenue-earning listings: month-to-month listings (left) and year-over-year growth rate (right)
0
7,500
15,000
22,500
30,000
Sep 1
4
Feb 1
5Ju
l 15
Dec 15
May
16
Oct 16
Mar
17
Aug 17
New York City Manhattan Brooklyn Rest of MSA
-50%
0%
50%
100%
150%
200%
Sep 1
5
Dec 15
Mar
16Ju
n 16
Sep 1
6
Dec 16
Mar
17Ju
n 17
FILE
D D
ATE:
6/2
1/20
19 6
:51
PM
2016
CH
1548
9
12
Figure 1d. Seasonally adjusted host revenue: month-to-month revenue (left), year-over-year growth rate (right)
Figure 1e. New York City’s declining share of the region’s Airbnb host revenue
$0M
$15M
$30M
$45M
$60M
Sep 1
4
Feb 1
5Ju
l 15
Dec 15
May
16
Oct 16
Mar
17
Aug 17
New York City Manhattan Brooklyn Rest of MSA
-50%
0%
50%
100%
150%
200%
Sep 1
5
Dec 15
Mar
16Ju
n 16
Sep 1
6
Dec 16
Mar
17Ju
n 17
0%
25%
50%
75%
100%
Sep 1
4
Nov 14
Jan 1
5
Mar
15
May
15Ju
l 15
Sep 1
5
Nov 15
Jan 1
6
Mar
16
May
16Ju
l 16
Sep 1
6
Nov 16
Jan 1
7
Mar
17
May
17Ju
l 17
FILE
D D
ATE:
6/2
1/20
19 6
:51
PM
2016
CH
1548
9
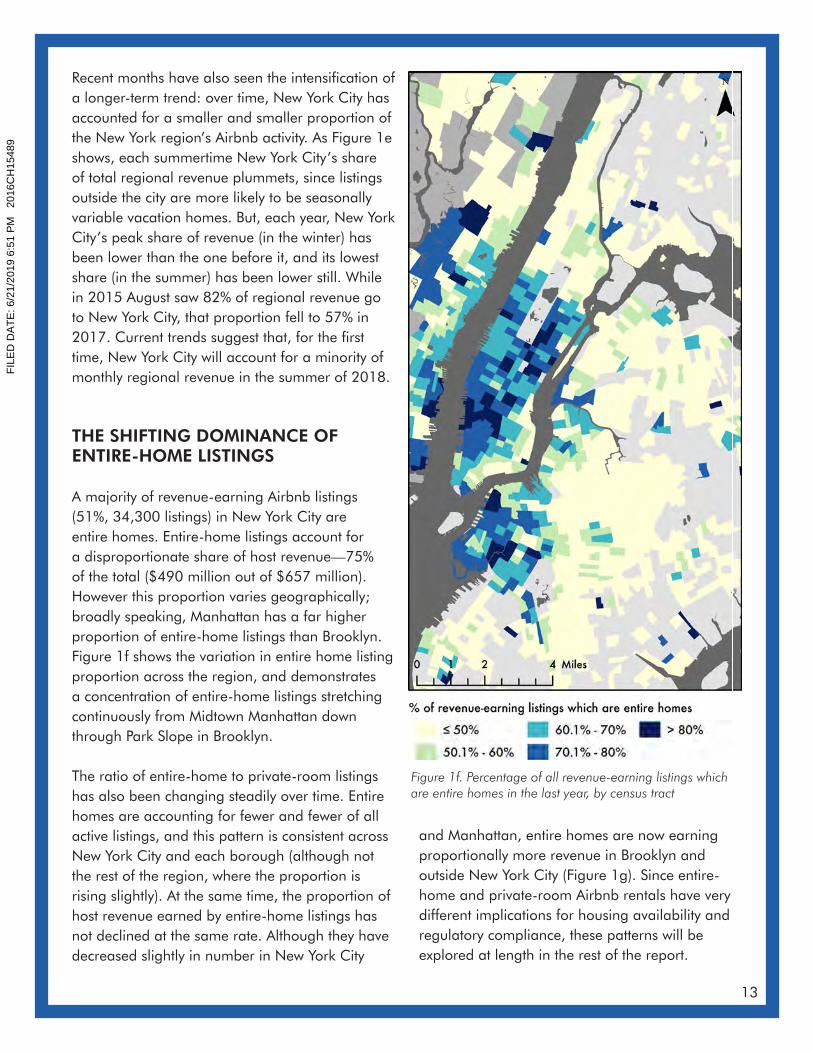
13
Recent months have also seen the intensification of a longer-term trend: over time, New York City has accounted for a smaller and smaller proportion of the New York region’s Airbnb activity. As Figure 1e shows, each summertime New York City’s share of total regional revenue plummets, since listings outside the city are more likely to be seasonally variable vacation homes. But, each year, New York City’s peak share of revenue (in the winter) has been lower than the one before it, and its lowest share (in the summer) has been lower still. While in 2015 August saw 82% of regional revenue go to New York City, that proportion fell to 57% in 2017. Current trends suggest that, for the first time, New York City will account for a minority of monthly regional revenue in the summer of 2018.
THE SHIFTING DOMINANCE OF ENTIRE-HOME LISTINGS
A majority of revenue-earning Airbnb listings (51%, 34,300 listings) in New York City are entire homes. Entire-home listings account for a disproportionate share of host revenue—75% of the total ($490 million out of $657 million). However this proportion varies geographically; broadly speaking, Manhattan has a far higher proportion of entire-home listings than Brooklyn. Figure 1f shows the variation in entire home listing proportion across the region, and demonstrates a concentration of entire-home listings stretching continuously from Midtown Manhattan down through Park Slope in Brooklyn.
The ratio of entire-home to private-room listings has also been changing steadily over time. Entire homes are accounting for fewer and fewer of all active listings, and this pattern is consistent across New York City and each borough (although not the rest of the region, where the proportion is rising slightly). At the same time, the proportion of host revenue earned by entire-home listings has not declined at the same rate. Although they have decreased slightly in number in New York City
Figure 1f. Percentage of all revenue-earning listings which are entire homes in the last year, by census tract
and Manhattan, entire homes are now earning proportionally more revenue in Brooklyn and outside New York City (Figure 1g). Since entire-home and private-room Airbnb rentals have very different implications for housing availability and regulatory compliance, these patterns will be explored at length in the rest of the report.
FILE
D D
ATE:
6/2
1/20
19 6
:51
PM
2016
CH
1548
9

14
Figure 1g. Percentage of all revenue-earning listings (left) and host revenue (right) from entire homes
HOW MANY AIRBNB LISTINGS IN NEW YORK CITY ARE ILLEGAL?
Under New York State’s Multiple Dwelling Law (MDL), short-term rentals of fewer than 30 days are illegal in buildings with 3 or more units unless the owner is present. Any entire-home rental of fewer than 30 days in such a building is therefore almost certainly an illegal rental. Using our dataset in combination with census-tract information from the American Community Survey about building types, we are therefore able to estimate what percentage of Airbnb reservations violate the MDL, and what percentage of listings are in violation of the MDL at any given time.
Private-room rentals will also violate the MDL if the owner is not present, as would be the case with ghost hotels, but it is difficult to make reliable
estimates of the frequency of these illegal rentals because there is no way to reliably know if the owner is present. There are other reasons why a short-term rental might violate of regulations, notably for health and safety standards mandated by the New York City building code, but these cannot be assessed using our existing dataset.
Since the current iteration of the Multiple Dwelling Law was passed in October 2016, we estimate that between 85 percent and 89 percent of entire-home rentals to have been illegal each month. This means, even assuming that all private-room listings are legal, that between 43 percent and 47 percent of reservations in New York City have been illegal. In any given month, between
40%
55%
70%
85%
100%
2015
2016
2017
New York City Manhattan Brooklyn Rest of MSA
40%
55%
70%
85%
100%
2015
2016
2017
FILE
D D
ATE:
6/2
1/20
19 6
:51
PM
2016
CH
1548
9
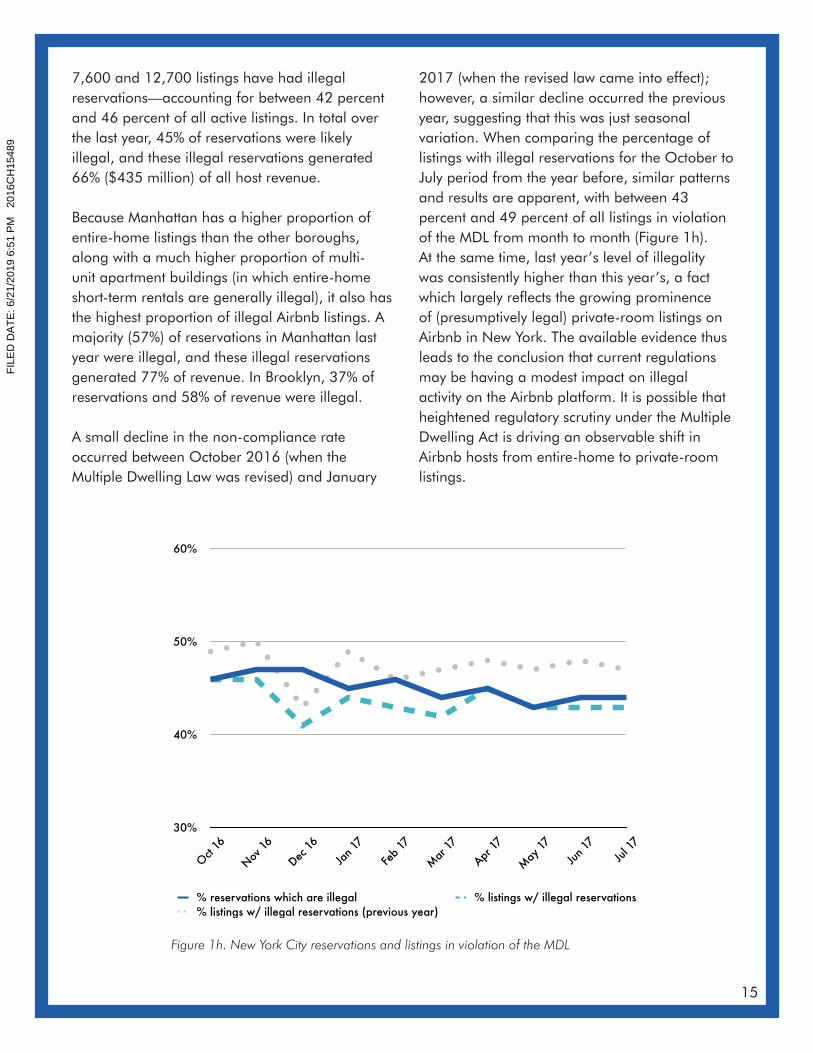
15
7,600 and 12,700 listings have had illegal reservations—accounting for between 42 percent and 46 percent of all active listings. In total over the last year, 45% of reservations were likely illegal, and these illegal reservations generated 66% ($435 million) of all host revenue.
Because Manhattan has a higher proportion of entire-home listings than the other boroughs, along with a much higher proportion of multi-unit apartment buildings (in which entire-home short-term rentals are generally illegal), it also has the highest proportion of illegal Airbnb listings. A majority (57%) of reservations in Manhattan last year were illegal, and these illegal reservations generated 77% of revenue. In Brooklyn, 37% of reservations and 58% of revenue were illegal.
A small decline in the non-compliance rate occurred between October 2016 (when the Multiple Dwelling Law was revised) and January
30%
40%
50%
60%
Oct 16
Nov 16
Dec 16
Jan 1
7
Feb 1
7
Mar
17
Apr 17
May
17Ju
n 17
Jul 1
7
% reservations which are illegal % listings w/ illegal reservations% listings w/ illegal reservations (previous year)
Figure 1h. New York City reservations and listings in violation of the MDL
2017 (when the revised law came into effect); however, a similar decline occurred the previous year, suggesting that this was just seasonal variation. When comparing the percentage of listings with illegal reservations for the October to July period from the year before, similar patterns and results are apparent, with between 43 percent and 49 percent of all listings in violation of the MDL from month to month (Figure 1h). At the same time, last year’s level of illegality was consistently higher than this year’s, a fact which largely reflects the growing prominence of (presumptively legal) private-room listings on Airbnb in New York. The available evidence thus leads to the conclusion that current regulations may be having a modest impact on illegal activity on the Airbnb platform. It is possible that heightened regulatory scrutiny under the Multiple Dwelling Act is driving an observable shift in Airbnb hosts from entire-home to private-room listings.
FILE
D D
ATE:
6/2
1/20
19 6
:51
PM
2016
CH
1548
9

16
Figure 1i. Location of highlight neighborhoods and Airbnb performance last year
Neighborhood(component areas)
Rev.-earning listings(% growth)
Total revenue(% growth)
Midtown Manhattan (Chelsea, Clinton, Mid-town, Upper West Side)
8,800(0.0%)
$126 million (11%)
Downtown Manhattan and Williamsburg (Chinatown, East Village, SoHo-TriBeCa, West Village,Williamsburg)
12,400(-9.2%)
$160 million (1.1%)
Neighborhood(component areas)
Rev.-earning listings(% growth)
Total revenue(% growth)
Eastside Manhattan(Central Harlem, Central Harlem South, Gramercy, East Mid-town)
4,200(4.7%)
$52.1 million (26%)
North-CentralBrooklyn(Bedford, Bushwick South, Crown Heights North, East Williams-burg, Park Slope, Stuyvesant Heights)
10,100(10%)
$75.7 million (23%)
High Growth
High Revenue
NEIGHBORHOOD PROFILES
The broad patterns above can be refined by analyzing a set of distinctive neighborhoods. Figure 1i identifies the 10 New York City neighborhoods with the highest total Airbnb host
revenue, and the 10 other neighborhoods growing the fastest, and clusters them in four groups (Midtown Manhattan; Downtown Manhattan and Williamsburg; East Manhattan; and North-
FILE
D D
ATE:
6/2
1/20
19 6
:51
PM
2016
CH
1548
9
17
Central Brooklyn). The boundaries are taken from neighborhood tabulation areas defined by the city government, which are meant to provide a middle-ground between the very small census tracts used elsewhere in the report, and the very large community districts used for city planning purposes. The map demonstrates at a glance that Airbnb’s areas of historic intensity are on the west side and downtown of Manhattan, while the newer areas of growth are in Brooklyn and outlying parts of Manhattan.
The table in Figure 1h summarizes current performance and growth characteristics of Airbnb listings in each of the highlight neighborhoods. It demonstrates a clear divergence between the historic Airbnb hotspots in Manhattan—which at this point appear to be largely saturated, with an average revenue growth rate of only 4.6% in the last year—and new emerging hotspots further from the center, which are bucking the city-wide trend of growth stagnation and grew their revenue on average 24% in the last year.
FILE
D D
ATE:
6/2
1/20
19 6
:51
PM
2016
CH
1548
9

18
Airbnb revenue is distributed highly unequally among hosts in New York City. Commercial Airbnb operators, who have multiple entire-home listings or large portfolios of private rooms, are 12% of hosts but earn more than one quarter of revenue in New York City. The top 10% (5,000) of hosts earned a staggering 48% ($318 million) of all revenue last year, while the bottom 80% (40,400) of hosts earned just 32% ($209 million). The median listing earned a modest $4,100 last year, but at the high end of the market, more than 280 listings earned $100,000 or more.
2. Who makes money from Airbnb ?
REVENUE GROWTH AND DISTRIBUTION
The previous chapter established that Airbnb host revenue growth is slowing in New York City—most notably in Manhattan, Airbnb’s traditionally most lucrative submarket. This state of affairs makes all the more urgent the question of who is earning the revenue, since there may no longer be a “rising tide to lift all boats”. The simple answer is that revenue is distributed in a highly uneven fashion among New York hosts. Figures 2a and 2b summarize key statistics related to Airbnb revenue in the last year, and show large disparities between both geographical regions and individual hosts. On the first point, the most notable disparity is between Manhattan and Brooklyn: the former has high revenue per listing but slow growth, while the latter has low revenue per listing but faster growth. Across all geographies, the large gap between average revenue per listing and median revenue per listing reveals the unequal distribution of revenue: in general, where the average of a set of cases is much higher than the median, it indicates that a relatively small number of cases has pulled the average higher than the level at which most cases are clustered. However, focusing on revenue characteristics of all active listings in the last twelve months will tend to understate
revenue performance, because, even with a relatively lower growth rate than previous years, many hosts joined in the middle of the last twelve months, and hence drag down average annual revenue. An arguably more accurate portrait of listing performance can be seen by examining only those listings which were active throughout the entire last twelve months. The same pattern is visible here, with the average revenue roughly double the median revenue. This indicates that, even among dedicated, long-term Airbnb listings, there is a large disparity in revenue earnings.
Another way of analyzing inequality in revenue earning among Airbnb hosts is to look at earning percentiles. There were 50,500 income-earning hosts in New York City last year, who earned nearly $660 million between them. Just ten percent of these hosts earned half that revenue (48%, $319 million), and the top twenty percent of hosts earned a staggering 68% ($448 million) of all host revenue. The top 1% of hosts, each of whom earned substantially more than $100,000 on Airbnb last year, managed to earn 12% of total revenue ($76 million). As Figure 2c shows, this unequal distribution of host revenue looks
FILE
D D
ATE:
6/2
1/20
19 6
:51
PM
2016
CH
1548
9

19
$0M
$30M
$60M
$90M
Sep 1
4
Nov 14
Jan 1
5
Mar
15
May
15Ju
l 15
Sep 1
5
Nov 15
Jan 1
6
Mar
16
May
16Ju
l 16
Sep 1
6
Nov 16
Jan 1
7
Mar
17
May
17Ju
l 17
Other NYC Manhattan Brooklyn Rest of MSA
Total revenue(year-over-yeargrowth)
Average rev.per rev.-earninglisting
Median rev.per rev.-earninglisting
Average rev.per listingactiveyear-round
Median rev.per listingactiveyear-round
New York City$657 million (14%)
$9,800 $4,100 $17,200 $10,200
Manhattan$414 million (8.5%)
$12,200 $5,300 $22,200 $13,800
Brooklyn$195 million (21%)
$7,800 $3,300 $13,700 $8,400
Rest of MSA $211 million (82%)
$11,600 $5,000 $17,000 $9,100
Figure 2a. Revenue earned by Airbnb listings in the last year
Figure 2b. Geographic components of seasonally adjusted host revenue
FILE
D D
ATE:
6/2
1/20
19 6
:51
PM
2016
CH
1548
9
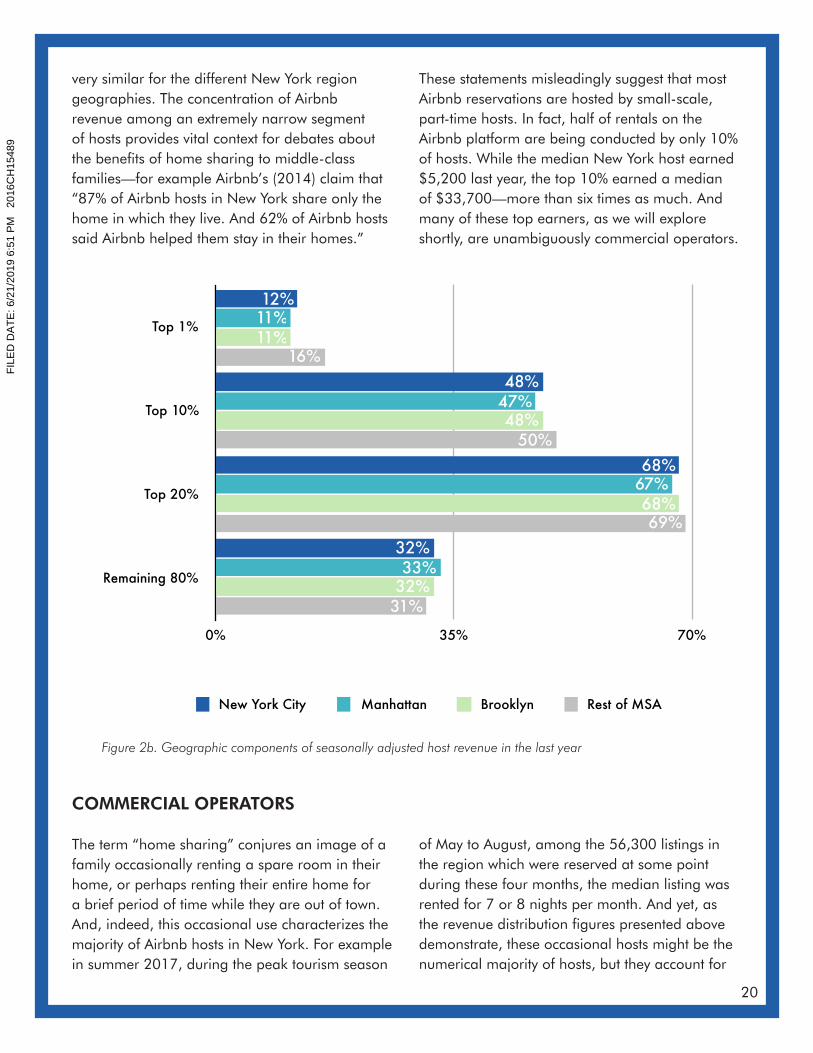
20
very similar for the different New York region geographies. The concentration of Airbnb revenue among an extremely narrow segment of hosts provides vital context for debates about the benefits of home sharing to middle-class families—for example Airbnb’s (2014) claim that “87% of Airbnb hosts in New York share only the home in which they live. And 62% of Airbnb hosts said Airbnb helped them stay in their homes.”
COMMERCIAL OPERATORS
The term “home sharing” conjures an image of a family occasionally renting a spare room in their home, or perhaps renting their entire home for a brief period of time while they are out of town. And, indeed, this occasional use characterizes the majority of Airbnb hosts in New York. For example in summer 2017, during the peak tourism season
These statements misleadingly suggest that most Airbnb reservations are hosted by small-scale, part-time hosts. In fact, half of rentals on the Airbnb platform are being conducted by only 10% of hosts. While the median New York host earned $5,200 last year, the top 10% earned a median of $33,700—more than six times as much. And many of these top earners, as we will explore shortly, are unambiguously commercial operators.
of May to August, among the 56,300 listings in the region which were reserved at some point during these four months, the median listing was rented for 7 or 8 nights per month. And yet, as the revenue distribution figures presented above demonstrate, these occasional hosts might be the numerical majority of hosts, but they account for
Top 1%
Top 10%
Top 20%
Remaining 80%
0% 35% 70%
31%
69%
50%
16%
32%
68%
48%
11%
33%
67%
47%
11%
32%
68%
48%
12%
New York City Manhattan Brooklyn Rest of MSA
Figure 2b. Geographic components of seasonally adjusted host revenue in the last year
FILE
D D
ATE:
6/2
1/20
19 6
:51
PM
2016
CH
1548
9

21
a surprisingly small proportion of the actual rental activity on Airbnb and earn a surprisingly small proportion of the actual revenue.
One way to isolate commercial operators is to look at hosts who have multiple listings on Airbnb. In particular, a host with more than one entire home listing is by definition a commercial operator, since only one of their listings could be their primary residence. Estimating commercial operators this way will dramatically underestimate their numbers, since it will fail to identify hosts who have a single listing which is not their primary residence and which they run as a business, and it will fail to identify hosts who have operate their listings via multiple Airbnb accounts, but it is a useful first approximation. We define a “multi-listing” as an entire-home listing whose host has at least one other entire-home listing, or a private-room listing whose host has at least two other private-room listings. (We set a higher threshold for private-room multi-listings to avoid falsely include a pair of spare rooms in a host’s primary residence; there will be very few homes in the New York region that have both a primary resident living in them and three or more spare bedrooms.) Figure 2d summarizes basic facts
about the nearly 20,000 multi-listings in New York City. Each of these listings, and the 28% ($184 million) of total platform revenue they represent, is by definition a commercial operation which does not represent any reasonable definition of “home sharing”. Instead, these are de facto hotel units which, as the next chapter will explore, are in direct competition with long-term housing for New Yorkers.
Multi-listing hosts consistently earn a disproportionate share of revenue. In the last year, for example, they were just 12% of all revenue-earning hosts in New York (6,200 out of 50,500), but earned 28% of revenue ($184 million out of $657 million). Their share of revenue, however, has been declining substantially across all geographies, despite an ongoing rise in the proportion of listings which are multi-listings (Figure 2e). Multi-listings continue to earn a disproportionately high share of revenue, but by a much narrower margin than in previous years. This appears to be a result of a shift in the composition of multi-listing units from entire homes to private rooms. Across all geographies, private room multi-listings have grown dramatically as a share of all listings, while entire-
Entire-home multi-listings (% of all entire-home listings)
Private-roommulti-listings (% of allprivate-room listings)
Multi-listing revenue(% of total revenue)
New York City 8,300 (24%) 7,700 (25%) $184 million (28%)
Manhattan 5,200 (25%) 2,700 (22%) $110 million (27%)
Brooklyn 2,400 (22%) 3,300 (25%) $56.9 million (29%)
Rest of MSA 4,300 (39%) 2,400 (37%) $78.0 million (37%)
Figure 2d. Multi-listing hosts in the New York region last year
FILE
D D
ATE:
6/2
1/20
19 6
:51
PM
2016
CH
1548
9
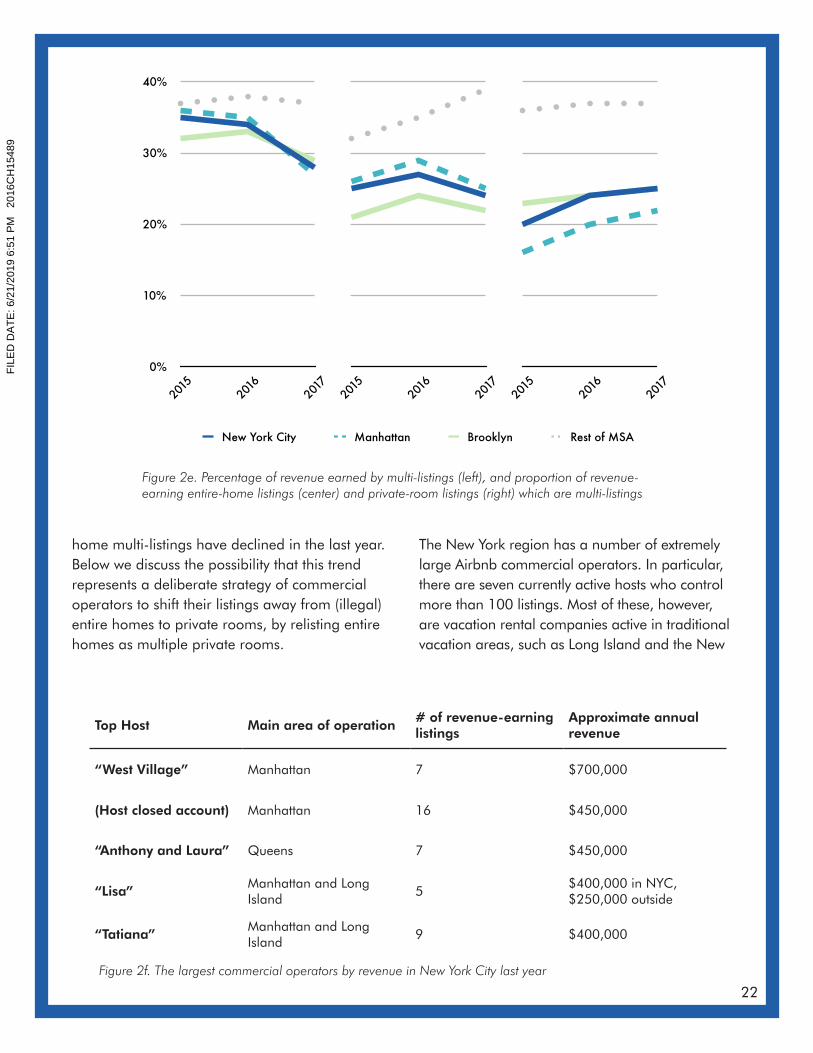
22
home multi-listings have declined in the last year. Below we discuss the possibility that this trend represents a deliberate strategy of commercial operators to shift their listings away from (illegal) entire homes to private rooms, by relisting entire homes as multiple private rooms.
The New York region has a number of extremely large Airbnb commercial operators. In particular, there are seven currently active hosts who control more than 100 listings. Most of these, however, are vacation rental companies active in traditional vacation areas, such as Long Island and the New
0%
10%
20%
30%
40%
2015
2016
2017
New York City Manhattan Brooklyn Rest of MSA
2015
2016
2017
2015
2016
2017
Figure 2e. Percentage of revenue earned by multi-listings (left), and proportion of revenue-earning entire-home listings (center) and private-room listings (right) which are multi-listings
Top Host Main area of operation# of revenue-earninglistings
Approximate annualrevenue
“West Village” Manhattan 7 $700,000
(Host closed account) Manhattan 16 $450,000
“Anthony and Laura” Queens 7 $450,000
“Lisa”Manhattan and Long Island
5$400,000 in NYC,$250,000 outside
“Tatiana”Manhattan and Long Island
9 $400,000
Figure 2f. The largest commercial operators by revenue in New York City last year
FILE
D D
ATE:
6/2
1/20
19 6
:51
PM
2016
CH
1548
9
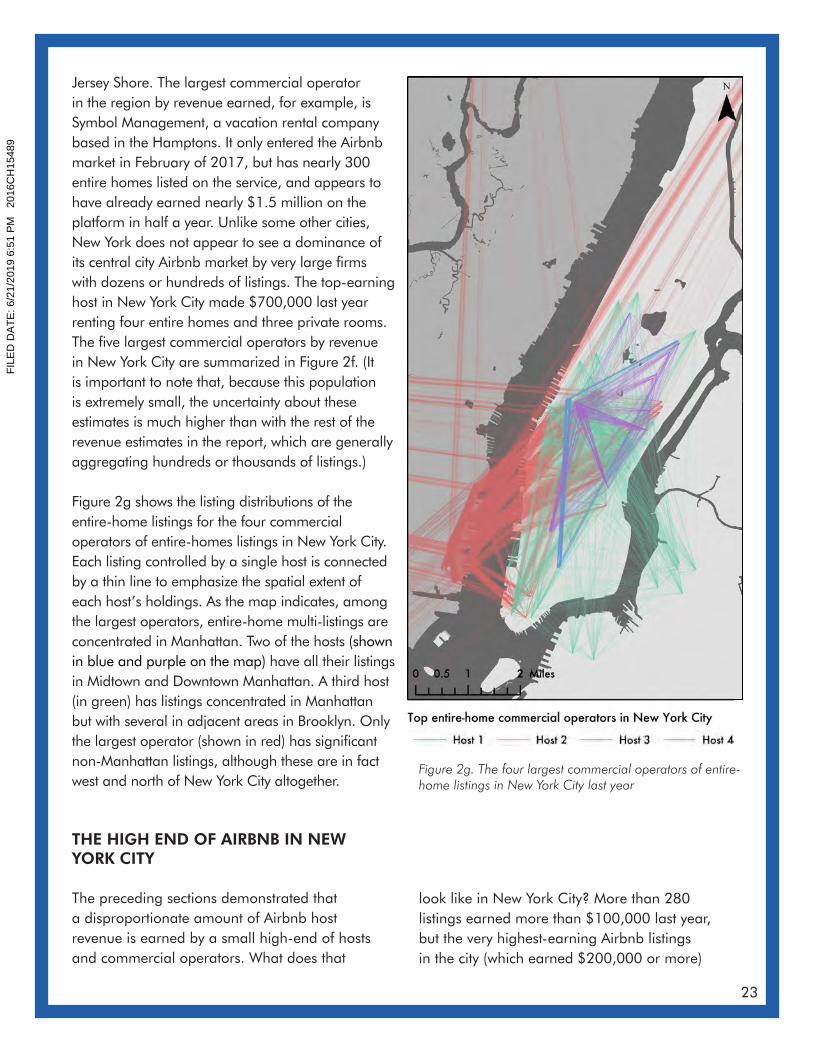
23
Jersey Shore. The largest commercial operator in the region by revenue earned, for example, is Symbol Management, a vacation rental company based in the Hamptons. It only entered the Airbnb market in February of 2017, but has nearly 300 entire homes listed on the service, and appears to have already earned nearly $1.5 million on the platform in half a year. Unlike some other cities, New York does not appear to see a dominance of its central city Airbnb market by very large firms with dozens or hundreds of listings. The top-earning host in New York City made $700,000 last year renting four entire homes and three private rooms. The five largest commercial operators by revenue in New York City are summarized in Figure 2f. (It is important to note that, because this population is extremely small, the uncertainty about these estimates is much higher than with the rest of the revenue estimates in the report, which are generally aggregating hundreds or thousands of listings.)
Figure 2g shows the listing distributions of the entire-home listings for the four commercial operators of entire-homes listings in New York City. Each listing controlled by a single host is connected by a thin line to emphasize the spatial extent of each host’s holdings. As the map indicates, among the largest operators, entire-home multi-listings are concentrated in Manhattan. Two of the hosts (shown in blue and purple on the map) have all their listings in Midtown and Downtown Manhattan. A third host (in green) has listings concentrated in Manhattan but with several in adjacent areas in Brooklyn. Only the largest operator (shown in red) has significant non-Manhattan listings, although these are in fact west and north of New York City altogether.
THE HIGH END OF AIRBNB IN NEW YORK CITY
The preceding sections demonstrated that a disproportionate amount of Airbnb host revenue is earned by a small high-end of hosts and commercial operators. What does that
look like in New York City? More than 280 listings earned more than $100,000 last year, but the very highest-earning Airbnb listings in the city (which earned $200,000 or more)
Figure 2g. The four largest commercial operators of entire-home listings in New York City last year
FILE
D D
ATE:
6/2
1/20
19 6
:51
PM
2016
CH
1548
9
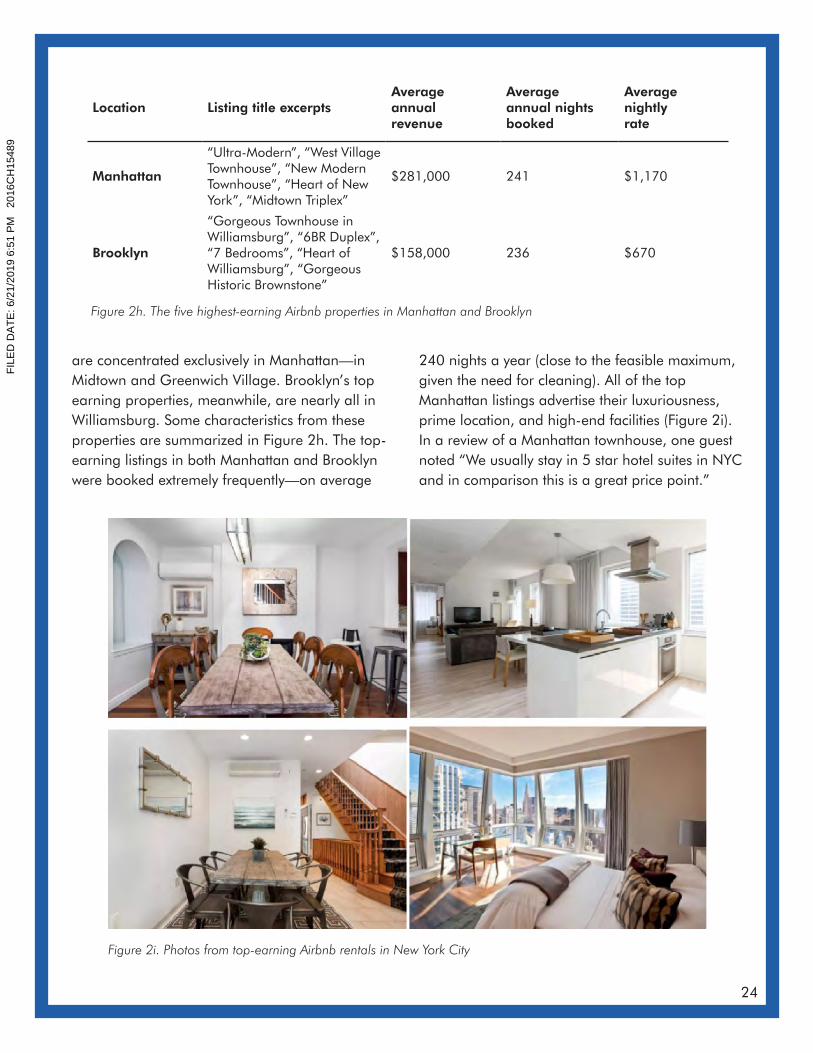
24
are concentrated exclusively in Manhattan—in Midtown and Greenwich Village. Brooklyn’s top earning properties, meanwhile, are nearly all in Williamsburg. Some characteristics from these properties are summarized in Figure 2h. The top-earning listings in both Manhattan and Brooklyn were booked extremely frequently—on average
240 nights a year (close to the feasible maximum, given the need for cleaning). All of the top Manhattan listings advertise their luxuriousness, prime location, and high-end facilities (Figure 2i). In a review of a Manhattan townhouse, one guest noted “We usually stay in 5 star hotel suites in NYC and in comparison this is a great price point.”
Location Listing title excerptsAverageannualrevenue
Averageannual nightsbooked
Averagenightlyrate
Manhattan
“Ultra-Modern”, “West Village Townhouse”, “New Modern Townhouse”, “Heart of New York”, “Midtown Triplex”
$281,000 241 $1,170
Brooklyn
“Gorgeous Townhouse in Williamsburg”, “6BR Duplex”, “7 Bedrooms”, “Heart ofWilliamsburg”, “Gorgeous Historic Brownstone”
$158,000 236 $670
Figure 2h. The five highest-earning Airbnb properties in Manhattan and Brooklyn
Figure 2i. Photos from top-earning Airbnb rentals in New York City
FILE
D D
ATE:
6/2
1/20
19 6
:51
PM
2016
CH
1548
9
25
Airbnb has removed between 7,000 and 13,500 units of housing from New York City’s long-term rental market. In the last year, 12,200 entire-home listings were frequently rented (rented 60 days or more, and available 120 days or more), while 5,600 entire-home listings were very frequently rented (rented 120 days or more, and available 240 days or more). These listings are concentrated in Midtown and Downtown Manhattan, but are growing rapidly in Brooklyn, and taking up a larger and larger portion of the overall Airbnb market over time. Additionally, spatial cluster analysis reveals that 4,700 private-room listings are in fact “ghost hotels” comprising many rooms in a single apartment or building. This is perhaps the fastest growing category of listing in all of New York, and may represent a tactic for commercial Airbnb operators to avoid regulatory scrutiny.
3. How much housing has Airbnb removed from the market?
ENTIRE HOMES CONVERTED TO DEDICATED AIRBNB RENTALS
Despite Airbnb’s public-relations focus on small scale and occasional uses of its platform—the way, for example, that homeowners can help meet their mortgage payments by hosting occasional guests—most regulatory scrutiny of short-term rentals has been focused on entire homes which are frequently rented or available on short-term rental platforms. This is for good reason: every home converted to full-time Airbnb use is subtracted from the pool of long-term rental housing units in a city. In many cases, full-time, entire-home Airbnb listings would have housed long-term tenants, whom the landlord evicted or failed to replace after they left. In other cases, particularly in recently built apartments and condominiums, the unit has spent its entire lifetime on the short-term rental market. Such listings were not literally “removed” from the long-term market, but they represent exactly the same loss of potential rental housing as units that were directly removed. If full-time, entire-home rentals
on Airbnb were prohibited, both these types of unit would end up on the long-term rental market.
Defining the threshold at which an Airbnb listing is likely to have departed the long-term housing market is difficult. There are probably people who travelled extremely frequently during a year, and were able to keep a unit as their primary residence while still renting it on Airbnb for 200 days in the year. And there are probably people who listed their unit year-round but set too high a price or were in an area with insufficient demand, and it only rented 25 days in total despite being otherwise unoccupied by a long-term resident. Setting the threshold too low will generate many false positives—for example by counting as “full-time” an apartment which was on Airbnb for a few weeks after one long-term tenant moved out and before another moved in, or an apartment which the long-term inhabitant puts on Airbnb during periods of occasional travel. On the other hand,
FILE
D D
ATE:
6/2
1/20
19 6
:51
PM
2016
CH
1548
9
26
setting the threshold too high will generate many false negatives, and end up underestimating the impact Airbnb is having on housing markets.
We use two metrics to estimate frequent Airbnb usage: the number of days per year that a unit is booked (“occupancy”), and the number of days that a unit is either booked or available to be booked (“availability”). We define “frequently rented” as 60 days of occupancy and 120 days of availability. Sixty days of occupancy rules out most scenarios of occasional short-term rental, such as a landlord taking advantage of a one-month gap between long-term tenants, or a family leaving on a one-month summer vacation. Setting an additional constraint of 120 days of availability prevents the inclusion of listings which are rented relatively infrequently but with extremely high efficiency; for example, a homeowner who was out of town every weekend and listed their unit on Airbnb would only have 104 days of availability, and so would not be counted as “full-time” by our criteria even if they managed to rent the unit for 60 of those days.
We also define a more stringent threshold of “very frequently rented” as 120 days of occupancy and 240 days of availability. While it is likely that very few frequently rented listings can also house long-
Entire-home listings rented 60 days andavailable 120 days
Percentage ofrevenue-earningentire-homelistings
Year-over-yeargrowth rate
Entire-homelistings rented 120 days andavailable 240days
New York City 12,200 36% 14% 5,600
Manhattan 7,000 34% 20% 3,100
Brooklyn 4,200 38% 14% 2,000
Rest of MSA 3,200 29% 80% 1,100
Figure 3a. Frequently rented (60/120) entire-home listings in the New York region last year
FILE
D D
ATE:
6/2
1/20
19 6
:51
PM
2016
CH
1548
9
27
term resident, it would be nearly impossible for a very frequently rented listing to have a long-term resident, since these listings are on Airbnb for at least 8 months of the year, and have short-term tenants for at least 4 months.
According to these thresholds, there are 12,200 entire-home Airbnb listings in New York City which were frequently rented in the last year—5,600 of which were very frequently rented. These figures set reasonable upper and lower bounds on the number of housing units which have been removed from New York’s housing market by Airbnb. The 5,600 very frequently rented entire homes have almost certainly been subtracted from the city’s rental housing supply. The 12,200 frequently rented entire homes may also all have been removed from the long-term rental market; at minimum, they are at high risk of being removed. Figure 3a summarizes key facts related to frequently rented entire-home listings, while Figure 3b contextualizes these estimates by showing the number of entire-home listings in the New York region which meet a series of different definitions of “frequently rented”.
In New York City, revenue-earning listings increased by 4.5% last year (from 64,200 to 67,100). By contrast, frequently rented entire-home listings increased by 14% in New York City (from 10,700 to 12,200). In other words, frequently rented entire-home listings are growing at approximately three times the overall listing growth rate.
The significance of the frequently rented entire-home listings becomes even clearer when they are expressed as a percentage of total housing on a neighborhood scale. Figure 3c shows the proportion of total housing in each census tract that is frequently or very frequently rented on Airbnb over the last three years. It reveals significant areas of the city where 2% or more of total housing stock has either already been lost to Airbnb or is at serious risk of being lost. Figure 3d summarizes these patterns for the highlight neighborhoods, demonstrating that there are entire neighborhoods where more than 1% of housing has been lost or is under threat of being lost to Airbnb, along with other areas where the year-over-year growth rate of these listings has exceeded 30%.
Figure 3b. Entire-home listings in New York City at different thresholds of “frequently rented”
60 days reserved
60 reserved, 120 available
90 reserved, 120 available
120 reserved
120 reserved, 240 available
0 5,000 10,000 15,000
5,600
7,500
9,800
12,200
13,600
FILE
D D
ATE:
6/2
1/20
19 6
:51
PM
2016
CH
1548
9

28
Figure 3c. The proportion of total housing units frequently (60/120) and very frequently (120/240) rented in New York
FILE
D D
ATE:
6/2
1/20
19 6
:51
PM
2016
CH
1548
9
29
NEW YORK’S GHOST HOTELS
It is likely that most private-room listings on Airbnb are rented by primary residents with a spare room. But using spatial analysis we have identified 4,700 listings across New York City (16% of all private-room listings in the city) which are in fact “ghost hotels”—entire units or even whole apartment buildings which have been converted into many private-room listings by the owner. These 4,700 listings form 1,200 discrete ghost hotels, a number which has increased 79% since 2015 (far faster than the overall rate of Airbnb growth in New York). All told, New York’s ghost hotel operators earned $30.4 million on Airbnb last year.
Most discussion of Airbnb’s impact on housing availability and affordability focuses on entire-home listings, and for good reason—these are the listings which, if rented sufficiently often throughout the year, by definition can no longer be housing a
long-term tenant. Private room listings, by contrast, are generally assumed to have little if any impact on housing markets, since they generally do not displace renters. This assumption is clearly false in a city such as New York where a high percentage of renters live with roommates. A primary tenant who might have previously listed a spare bedroom on Craigslist and found a long-term tenant can now list the spare bedroom on Airbnb. But the impact of private-room Airbnb rentals on the long-term rental market for roommates is difficult to estimate without extensive surveying and interviews to determine what residents were previously doing with the rooms which they are now renting on Airbnb.
There is another possible way in which private-room Airbnb rentals may be reducing rental housing supply for long-term tenants, though. This is the question of whether entire units or
NeighborhoodNumber of 60/120 frequently rented listings (% growth rate)
% of all housing unitsfrequently rented on Airbnb
Midtown Manhattan 2,000 (0.8%) 1.1%
Downtown Manhattanand Williamsburg
2,700 (-2.3%) 1.6%
NeighborhoodNumber of 60/120 frequently rented listings (% growth rate)
% of all housing unitsfrequently rented on Airbnb
Eastside Manhattan 900 (17%) 0.7%
North-Central Brooklyn 1,700 (32%) 0.9%
Figure 3d. Frequently rented (60/120) Airbnb listings in the highlight neighborhoods last year
High Growth
High Revenue
FILE
D D
ATE:
6/2
1/20
19 6
:51
PM
2016
CH
1548
9
30
apartment buildings are being converted into what the Canadian housing advocacy group Fairbnb has called “ghost hotels” (Wieditz 2017). Ghost hotels are entire units or buildings whose individual bedrooms have been listed individually on Airbnb as private rooms. There are various reasons a host might choose to list their units this way, but given that short-term rentals of entire homes are generally illegal in New York, converting apartments into ghost hotels would be a convenient way for a host to avoid regulatory scrutiny.
Using spatial cluster analysis, we identified groupings of private rooms rented by a single host which are highly likely to be located in the same building. The results are startling: across New York City, there are 1,200 ghost hotels, comprising over 4,700 separate private-room listings. Each of these ghost hotels has removed rental housing from the long-term rental market. Most of these ghost hotels comprise three to five private-room listings, and thus appear to be single apartment units. But some have 10 or more listings, and thus are almost certainly multiple units in a building—or an entire building—listed on Airbnb by the landlord. (The top three ghost hotels are detailed in Figure 3e; a traditional hostel which has listed its rooms on Airbnb has been excluded.)
Three facts are striking about New York City’s ghost hotels. The first is the simple fact of their existence. Public discussion and debate about
short-term rentals often assumes the benignness of private-room rentals, because these are thought to be hosted by owner- or renter-occupiers and thus not removing any rental housing options for local residents. The fact that thousands of these listings are actually a surreptitious mechanism for converting apartments (and entire apartment buildings) into hotels is an important fact to be added to the public debate. For example, here is a guest review from a private-room listing in one of the most lucrative ghost hotels in New York:
This is made to look like a couple sharing their
home on AirBNB, but it’s actually more like a
hostel run by multiple people. Very misleading
listing. There are like 20ish tiny rooms and you
can hear people snoring and cleaning and such....
Additionally, for those who believe every small
room is “private”, it’s actually not. On my check in,
I was given room keys for room 116, but my room
was 115, but my key still worked for room 115. My
first day there, I got curious and tried using the keys
on room 116 as well, and they actually worked.
The door key to every single “room” is the same.
The second striking fact is the scale and distribution of the ghost hotel phenomenon. Figure 3f shows the locations of all the ghost hotels operating in New York City over the last twelve months (the size of points is proportionate to the number of private rooms in the ghost hotel). There are ghost hotels across all five boroughs, although
Example listing title# of revenue-earningrooms
Average # of annualnights booked per room
Approx. annualrevenue
“[301] 5 minute WALK to TimesSquare”
11 180 $350,000
“Interfaith Retreat Guest Rooms(Seva)”
11 260 $200,000
“Large Room 15 Minutes toManhattan”
12 220 $200,000
Figure 3e. The largest three ghost hotels in New York City last year
FILE
D D
ATE:
6/2
1/20
19 6
:51
PM
2016
CH
1548
9

31
Figure 3f. Locations of the 1,200 likely ghost hotels in New York City
Brooklyn has the most in both absolute and proportional terms. These hotels earn on average $6,400 per room annually, which is 27% higher than non-ghost-hotel private-room listings (which earn $5,100 annually). In total, New York City’s ghost hotels earned $30.4 million dollars—which is 19% of all the revenue earned by private-room Airbnb listings in the city.
The final striking fact about New York’s ghost hotels is their growth rate. Over the last two years, the number of revenue-earning listings in New York City has grown 37%, from 48,800 in the September 2014 - August 2015 year to 67,100 in the September 2016 - August 2017 year. In the same time period, the number of revenue-earning private-room listings has grown 55%, from 19,600 to 30,300. Ghost hotels are growing
substantially faster than either of these categories, nearly doubling over the same time period. In the year ending August 2015, there were 670 ghost hotels, comprising 2,600 listings and earning a total of $19.3 million for the year. Two years later, the number of ghost hotels had increased 79% to 1,202, comprising 4,700 private-rooms (an 84% increase) earning $30.4 million (a 58% increase). These facts are summarized in Figure 3g, and clearly demonstrate that ghost hotels are a rapidly growing portion of Airbnb activity in New York City. This portion has so far flown under the radar of regulatory scrutiny despite the fact that it is taking an increasingly large number of apartments off the long-term housing market for New York residents. Given that every ghost hotel is by definition a commercial operation and not “home sharing”, new regulatory scrutiny seems warranted.
FILE
D D
ATE:
6/2
1/20
19 6
:51
PM
2016
CH
1548
9

32
# of ghost hotels (% increase from 2015)
# of private rooms in ghost hotels (% of total revenue-earning private rooms)
Annual revenue
New York City 1,200 (79%) 4,700 (16%) $30.4 million
Manhattan 400 (76%) 1,500 (12%) $11.8 million
Brooklyn 520 (49%) 2,100 (16%) $13.0 million
Figure 3g. New York’s ghost hotels
HOW MANY HOUSING UNITS HAS AIRBNB REMOVED FROM THE RENTAL MARKET?
Combining the estimates of entire-home Airbnb listings which have been removed from the rental market with the ghost hotels provides an estimate of Airbnb’s overall impact on long-term rental housing availability in New York. Figure 3h provides these estimates for a range of different New York geographies, while Figure 3i shows the distribution of lost housing across the city. What these figures indicate is that no fewer than 7,000
units have been removed from the market for local residents (very frequently rented, entire-home listings plus ghost hotels), and the number of lost units could in fact be 13,500 or more (frequently rented, entire-home listings plus ghost hotels). This housing loss has been concentrated most heavily in Midtown and Lower Manhattan, but the growth rate of housing loss is highest in North and Central Brooklyn.
Frequently rented entire-home listings
Very frequently rented entire-home listings
Rental units converted toghost hotels
Plausible range for housing lost to Airbnb
New York City 12,200 5,600 1,400 7,000 - 13,500
Manhattan 7,000 3,100 500 3,600 - 7,500
Brooklyn 4,200 2,000 600 2,600 - 4,800
MidtownManhattan
2,000 900 90 1,000 - 2,000
DowntownManhattan andWilliamsburg
2,700 1,200 150 1,300 - 2,900
EastsideManhattan
900 400 60 500 - 600
North-CentralBrooklyn
1,700 900 270 1,200 - 2,000
Figure 3h. Combined estimate of housing lost to Airbnb
FILE
D D
ATE:
6/2
1/20
19 6
:51
PM
2016
CH
1548
9

33
Figure 3i: Combined estimate of housing lost to Airbnb by census tract
FILE
D D
ATE:
6/2
1/20
19 6
:51
PM
2016
CH
1548
9

34
We estimate that, by reducing housing supply, Airbnb has increased the average long-term rent by 1.4% over the last three years, implying that the average New York tenant looking for an apartment this year will pay $380 more annually in rent because of Airbnb. In large parts of the city, hosts of frequently rented entire-home Airbnb listings earn 200% or more the median long-term neighborhood rent, and these areas are 72% non-white. This means there is a powerful economic incentive for landlords to displace tenants and convert apartments to Airbnb de facto hotels in communities of color. High-growth neighborhoods (particularly Harlem and Bedford-Stuyvesant) are disproportionately African American, while neighborhoods with high existing Airbnb revenue (generally in Midtown and Lower Manhattan) are disproportionately white.
4. Is Airbnb driving gentrification ?
AIRBNB’S ECONOMIC DOMINANCE OF NEW YORK’S RENTAL MARKET
Given the fact that Airbnb has taken between 7,000 and 13,500 units of long-term rental housing off the market in New York City, an important question is the extent to which Airbnb is thereby fueling gentrification across the city. Based on an analysis of revenue flows through the housing market, our conclusion is that Airbnb has created a new “rent gap”—a systematic gap between rental revenue under a building’s current use and potential revenue under a different use—which is driving gentrification in a number of Manhattan and Brooklyn neighborhoods (Wachsmuth and Weisler forthcoming). The potential economic returns to the very same apartment may be higher now than they were a few years ago, simply because Airbnb provides a new revenue stream which requires little new investment needed on behalf of landlords. While serious Airbnb entrepreneurs may well refurbish their units to increase their success with the service, the only necessary step for converting
a long-term rental to a short-term rental is to remove the existing tenant.
The implication is that, in areas where there is strong tourist demand, owners of rental units in areas have a strong economic incentive to convert units to short-term rentals. In order to quickly and cheaply realize these higher potential rents, owners of rental units may evict existing tenants, or not replace tenants when they depart. Figures 4a and 4b analyze revenue flows through Airbnb and through the long-term rental market to identify the areas of New York where Airbnb has already had a large impact on housing market revenue flows and the areas where the likelihood of future impact is highest. Figure 4a compares total monthly Airbnb host revenue with total monthly long-term rental revenue by census tract. The hotspots are Midtown Manhattan, the Lower East Side, and Williamsburg—neighborhoods which are all “post-gentrified”, in the sense that they saw massive increases in rents and massive
FILE
D D
ATE:
6/2
1/20
19 6
:51
PM
2016
CH
1548
9
35
displacement over the last several decades, and now have been transformed, to a greater or lesser extent, into affluent neighborhoods. In these areas, Airbnb generally now accounts for 5% or more of the entire housing rental market by revenue.
Across the entire city last year, the median host of a frequently rented entire-home listing earned 54% more than the median long-term rent in the same neighborhood. In fact, 92% of all hosts of frequently rented entire-home listings made more than the median long-term neighborhood rent. Figure 4b shows this pattern across the city; neighborhoods where the ratio of short-term rents to long-term rents is highest are where the data suggests that there is money to be made but landlords haven’t yet seized on the opportunity en masse. In other words, these are the neighborhoods at greatest risk for Airbnb-induced gentrification in the near future. Whereas current Airbnb impacts were concentrated in already-gentrified areas, these at-risk neighborhoods are all still very clearly at the gentrification frontier. Just under 380,000 households in New York City live in these areas—11% of the city’s population. Comparing these two patterns—the percentage of housing revenue that now flows through Airbnb, and the percentage of the median rent which an average full-time Airbnb property earns—allows us to see where Airbnb has already had a major impact on local housing and where it is likely to have an impact in the future. The first pattern indicates where Airbnb has already had a major impact on local housing. The second pattern indicates where there is still money to be made for landlords by converting long-term rental housing to short-term rentals.
IS AIRBNB INCREASING RENTS IN NEW YORK?
Applying a comparative model developed by researchers at UCLA, we estimate that Airbnb has increased long-term rents in New York City by 1.4% over the last three years. This implies that the median renter household looking for a new
apartment will pay $384 more per year because of Airbnb’s recent growth.
The previous chapter demonstrated that Airbnb is very likely removing between 7,000 and 13,500 units of rental housing from the long-term rental
Figure 4a. The percentage of rent payments which now flow through Airbnb
FILE
D D
ATE:
6/2
1/20
19 6
:51
PM
2016
CH
1548
9
36
market across New York City, with the effects particularly concentrated in neighborhoods in Midtown and Lower Manhattan and North Brooklyn. Basic principles of supply and demand suggest that the removal of rental housing
stock will drive up prevailing rents, because the same amount of demand for accommodation will be chasing a smaller supply of available accommodation. But is it possible to directly estimate Airbnb’s impact on rents in New York?Such an estimation can only be done by comparing New York to other city-regions. This is because we need to be able to control for “endogeneity”: factors specific to New York which might suggest a spurious correlation. For example, imagine that New York’s tourism office conducts an extremely successful place-marketing campaign that encourages many new tourists, but also encourages long-term residential relocations. We might observe rising Airbnb activity and rising long-term rents, and conclude that Airbnb activity causes higher rents. But in fact, the tourism campaign was the cause of both the increased Airbnb activity and the higher rents, and our conclusion would be false. If we can compare New York with many other cities, we can minimize these confounders, and find the true association between short-term rentals and long-term rentals.
Conducting such a large-scale comparison is outside the scope of the present study. However, a recent paper by Barron et al. (2017) has gathered data from 100 US cities to answer precisely this question. After controlling for a comprehensive set of factors, they find that a “exogenous” 10% increase in number of Airbnb listings in an area (which is to say, an increase that is not driven by other factors which would have increased rents anyway) predicts a 0.42% increase in long-term rents. Applying this relationship to our data, we find strong evidence that Airbnb has increased long-term rents in New York City. On a city-wide scale, using the broadest possible definition of active listings (used by Barron et al. in their model), active listings increased annually by 116%, 62%, and 33% in the three years between September 2014 and August 2017. Applying Barron et al.’s national average ratio of exogeneity to New York City, this implies that, city-wide, Airbnb drove up
Figure 4b. The profitability of an average Airbnb listing compared to median 12-month rents in the neighborhood
FILE
D D
ATE:
6/2
1/20
19 6
:51
PM
2016
CH
1548
9
37
Figure 4c. Total estimated 2014-2017 annual rent increases attributable to Airbnb
rents by 0.8% in 2015, 0.4% in 2016, and 0.2% in 2017 (all for years ending in August). This is a cumulative 1.4% increase in rents over these three years attributable to Airbnb’s presence in the city. The overall median rent increase in New York City in this time period was 8.7%, which means that Airbnb is responsible for something like 16% of the total increase in rents in New York City in the last three years.1
Zillow’s rent index is generally understood to offer the best estimate of current market rents, which means rents which a prospective tenant is likely to encounter if searching for an apartment. According to Zillow, the current monthly median rent city-wide is $2,354. If Airbnb had remained at its September 2014 levels in New York City over the last three years, Barron et al.’s model implies that the median rent would instead be $2,322. The implication is that the median renter household looking for housing in New York City will pay an average of $384 more in rent this year because of the growth of short-term rentals in the city over the last three years. Of course, Airbnb activity is not distributed evenly across the city. Figure 4c estimates the impact of Airbnb on rents at the census tract scale using Barron et al.’s model. (In the map, zip codes with fewer than 100 listings at the beginning of the study period are suppressed because of reliability concerns, although their data contributed in aggregate to the calculation of the city-wide average.) Figure 4d summarizes the impact for the four profile neighborhoods, along with all the sub-neighborhoods for which reliable data could be collected. Many of these areas have seen estimated increases in annual median rent of $500 or more thanks to the last three years of Airbnb activity. Notably, zip code 10036 in Clinton has seen an estimated increase of $780.
1 Because these figures are derived from a limited subset of data used for a national comparative model, they should be treated as suggestive rather than definitive. For reference, across their entire national dataset, Barron et al. find that Airbnb has driven up rents an average of 0.27% each year, compared to the average of 0.46% each year we find for New York. Given how much faster Airbnb has grown in New York than the country as a whole, our estimates are quite plausible.
FILE
D D
ATE:
6/2
1/20
19 6
:51
PM
2016
CH
1548
9

38
NeighborhoodTotal estimated 2014-2017 annual % rent increase attributable to Airbnb
Range of estimated annual$ increases in median rentby sub-neighborhood
Midtown Manhattan 1.42%Chelsea: $610 - $720Clinton: $690 - $780Upper West Side: $560 - $580
Downtown Manhattan and Williamsburg
1.17%
East Village: $610Lower East Side: $510 - $590West Village: $570Williamsburg: $330
NeighborhoodTotal estimated 2014-2017 annual % rent increase attributable to Airbnb
Range of estimated annual$ increases in median rentby sub-neighborhood
Eastside Manhattan 1.31%
Central Harlem North: $460Central Harlem South: $490East Midtown: $640 - $720Gramercy: $570
North-Central Brooklyn
1.42%
Bedford: $370Crown Heights: $450East Williamsburg: $470Park Slope/Gowanus: $310 - $350Stuyvesant Heights: $530
Figure 4d. Total estimated 2014-2017 rent increases driven by Airbnb across highlight neighborhoods
High Growth
High Revenue
RACIALIZED IMPACTS OF AIRBNB IN NEW YORK
Over the last several years, evidence has mounted that people of color face persistent discrimination on Airbnb. Edelman et al. (2017) found, for example, that prospective guests with distinctively African American names are 16% less likely to have their reservation requests accepted than nearly identical guests with distinctively white names. The Twitter hashtag #airbnbwhileblack amply documents these experiences. But if people of color face persistent discrimination as users of
Airbnb while traveling, how does Airbnb impact communities of color in their home cities? Is Airbnb contributing economically to these communities, or increasing their economic challenges?
Across New York City, we find no correlation between host revenue growth and the racial composition of a neighborhood. But we do find a moderately strong positive correlation ( ρ = 0.229) between host revenue earned in the last
FILE
D D
ATE:
6/2
1/20
19 6
:51
PM
2016
CH
1548
9

39
Neighborhood % of households which are non-white
Eastside Manhattan 57.9%
North-Central Brooklyn 70.8%
year and the proportion of households which are white. In other words, at the level of simple correlation, white neighborhoods make more money on Airbnb than non-white neighborhoods. This pattern is borne out for the high-revenuehighlight neighborhoods, in which white households are dramatically overrepresented. Across New York City, 39.2% of households are white, while 68.4% of households in the MidtownManhattan focus neighborhood are white, as are 56.9% of households in the Downtown Manhattan and Williamsburg focus neighborhood.
The pattern looks quite different for the high-growth neighborhoods, though; the North-Central Brooklyn highlight neighborhood in particular is 70.8% non-white by household, compared to the city-wide average of 60.8% (Figure 4e). The Eastside Manhattan neighborhood is very close to the city-wide average, although in this case this figure is somewhat misleading, since the area combines two disproportionately white Midtown locations (Gramercy and Turtle Bay) with two disproportionately Black and Latino locations (Central Harlem South and Central Harlem North). In spite of this complication,
the overall pattern is clear: the highest-earning neighborhoods for Airbnb tend to be whiter than the city as a whole, while the fastest-growing neighborhoods for Airbnb tend to be less white than the city as a whole.
Narrowing in on the parts of New York City where the average frequently rented entire-home Airbnb listing earns more than double the median long-term rent reveals an even starker picture of racialized gentrification. Because of the large disparity between current long-term rental income and potential future Airbnb income, these areas are under the highest pressure for Airbnb-induced rent increases and loss of rental housing. And these neighborhoods are 72% non-white.
Variations of this fact have been noted by a range of commentators, as well as by Airbnb itself, which has launched an aggressive public relations campaign touting the supposed economic benefits it brings to Black neighborhoods. According to recent research, however, the reality is that most Black residents of areas seeing Airbnb growth are unlikely to see much benefit from this growth. Using facial recognition technology
Neighborhood % of households which are non-white
Midtown Manhattan 31.6%
Downtown Manhattan and Williamsburg 43.1%
Figure 4e. High-revenue neighborhoods are disproportionately white, while high-growthneighborhoods are disproportionately African American and Latino
High Growth
High Revenue
FILE
D D
ATE:
6/2
1/20
19 6
:51
PM
2016
CH
1548
9

40
to identify the race of Airbnb hosts, Murray Cox (2017) has investigated the impact of Airbnb on predominantly Black neighborhoods in New York City. The study found that short-term rentals are growing faster in Black neighborhoods, displacing and otherwise disproportionately affecting Black residents while simultaneously accruing wealth for white residents. The findings conclude that, across Black neighborhoods, Airbnb hosts are five times more likely to be white than the underlying demographics would predict. Seventy four percent of Airbnb listings are operated by white hosts, while white residents comprise only 13.9 percent of the population in those neighborhoods.
Cox (2017) uses a “white disparity index” to calculate the representation of whites people in the Airbnb community compared to their representation in a neighborhood (“An index of 100 means that white Airbnb hosts are representative in the Airbnb host community in the same proportion as their representation in the underlying neighborhood” [ibid, 9]). The highest white disparity index can be found in Erasmus, southeast of Prospect Park in Brooklyn, where white people make up 1.7 percent of
the neighborhood population but 58 percent of Airbnb hosts. Across all the 72 predominantly Black neighborhoods, where white residents make up only 13.9% of the population, white Airbnb hosts earned $159.7 million in the study period, compared to $48.3 million earned by Black hosts in those neighborhoods.
The patterns identified by Cox (2017) suggest that the new growth of Airbnb in Black neighborhoods will not provide the economic benefits that the company claims it will. Indeed, Cox concludes that Black residents are six times more likely than white residents to be affected by Airbnb-induced housing loss in the neighborhoods he examined, since 79.2% of residents of these neighborhoods are Black, and only 13.9% are white. (Likewise, we found that in high-risk neighborhoods across the city, 72% of residents are non-white.) As we have discussed in the current and previous chapters, the expansion of Airbnb activity in these areas is taking long-term housing off the market and increasing rents for new tenants. Meanwhile, Cox’s findings imply that white hosts are disproportionately accruing economic benefit from Airbnb in these areas.
Figure 4f. Case study neighborhoods and approximate locations of Airbnb listings threatening housing supply
Broadway
Atlantic Ave
Linden
Blvd
FILE
D D
ATE:
6/2
1/20
19 6
:51
PM
2016
CH
1548
9
41
CASE STUDY: BEDFORD-STUYVESANT AND EAST NEW YORK
The relationship of Airbnb to gentrification can be illustrated through a more detailed examination of a pair of Brooklyn neighborhoods: Bedford-Stuyvesant and East New York. (These neighborhoods are shown, along with the Airbnb listings which are threatening to remove housing from the rental market, in Figure 4f.) Each of these areas has seen Airbnb growth far outpacing the city-wide average. For example, between 2015 and 2017, the number of frequently rented, entire-home listings in New York City increased 63%, from 7,500 to 12,200. In the same time period, the number of these listings nearly doubled in Bedford-Stuyvesant (a 94% increase from 310 to 610 listings), and nearly quadrupled in East New York, albeit from a very low base (a 275% increase from 12 to 45 listings). Bedford-Stuyvesant is quickly becoming one of the city-wide hotspots for Airbnb activity in New York, while East New York represents the far edge of Airbnb’s expansion in the city.
The median asked rent in zip codes 11216 and 11221, which roughly overlap the western (Bedford) and eastern (Stuyvesant Heights) portions of Bedford-Stuyvesant were $2,320 and $2,316 in September 2014. Three years later, they had increased to $2,485 and $2,466. These are 7.1% and 6.5% increases. In the same time period, the total number of Airbnb listings (active and inactive) in the two zip codes increased from 838 and 706 to 3,499 and 4,615. Applying Barron et al.’s (2017) model, this suggests that approximately one sixth of the rent increase in Bedford’s zip code 11216 could be attributed to Airbnb expansion (1.2%, or $30 a month), while fully a quarter of the rent increase in Stuyvesant Heights’s zip code 11221 could have been caused by Airbnb (1.83%, or $44 a month).
How could Airbnb have had such a dramatic impact on rents in Stuyvesant Heights over the last three years? Last year there were 1,640 revenue-earning
listings in the area. However, many of these listings were part-time, and many more were private rooms in homes occupied by their primary resident. Limiting the tally to only those units at serious risk of being removed from the long-term rental market, 350 entire-home listings were frequently rented, and a further 50 units appear to have been converted into private-room ghost hotels. This means that approximately 400 long-term housing units in Stuyvesant Heights may have been removed from the long-term rental market and converted to full-time Airbnb usage. This is a large number, but less than 1% of the total 47,855 units of housing in the neighborhood. However, the vast majority of those housing units are occupied by long-term residents. Market rents are determined by the intersection of supply and demand for the much smaller number of units available on the rental market at any given point. According to the 2015 American Community Survey (the most recent available), there were 1,557 housing units in the neighborhood vacant and available for rent. If we charitably assume that none of these was directly converted into an Airbnb listing, it still remains the case that full-time Airbnb listings account for something like 20% of the “available” rental housing stock (i.e. all the units vacant and available for rent, plus all the units which would be available for rent if they weren’t full-time Airbnb short-term rentals).
Cox’s (2017) study of Airbnb hosts further demonstrates that, in Stuyvesant Heights, it is white Airbnb hosts who are disproportionately benefiting from Airbnb, while Black residents are bearing the burden of higher rents and fewer available apartments. Cox found white people make up 74.9 percent of Airbnb hosts and generate 63.4% of platform revenue in Stuyvesant Heights, but represent only 7.4 percent of the neighborhood population. This makes it the fourth most disparate in the top 20 predominantly Black neighborhoods, with a white disparity index of 1,012.
FILE
D D
ATE:
6/2
1/20
19 6
:51
PM
2016
CH
1548
9

42
East New York is one of New York City’s poorest neighborhoods, and has suffered waves of disinvestment since the Second World War. However, in 2016 City Council approved a comprehensive rezoning of the neighborhood, ushering in new housing development, some of it subsidized by the City. As development starts to accelerate, gentrification concerns have accelerated as well, and there is evidence to suggest that Airbnb is now growing rapidly in the area, and is beginning to reduce housing affordability and availability particularly in the west wide of East New York.
The median rent in zip codes 11207 and 11208 (which include East New York as well as adjacent areas to the north) increased from $1,985 and $2,108 in September 2014 to $2,225 and $2,191 in September 2017: respectively 12.1% and 3.9% increases in three years. Applying Barron et al.’s (2017) model to zip code 11207 (the western portion of East New York) suggests that approximately a sixth of the total rent increase—2.1%, or $46 a month—could be attributed to Airbnb expansion in this area. The eastern area (zip code 11207) did not have enough Airbnb listings in 2014 to reliably estimate the effects of Airbnb on long-term rents, although the much lower level of Airbnb activity here would suggest a more modest impact on rents. Indeed, the following facts are suggestive: in 2014, the eastern zip code had 6% higher median rent than the western zip code, but by 2017 this situation had reversed, and the western area (where Airbnb usage had surged) had slightly higher rent. Moreover, the
increase in Airbnb usage in the western part of East New York has mapped very closely onto subway access (an important predictor of Airbnb listing success). Nearly all the frequently rented listings and ghost hotels are within 1500 feet of a subway station.The eastern part of the neighborhood does not have subway access, and has not seen the same increase in frequently rented listings.
Unlike Stuyvesant Heights, however, East New York has not seen the same enormously disproportionate share of the economic benefits of Airbnb hosting accruing to the white population. The situation is mixed; on the one hand, Cox (2017) found that white hosts administered 29% of listings in the neighborhood, despite accounting for only 2.5% of the population. On the other hand, he estimated that Black hosts earned 97.9% of the revenue from Airbnb hosting in East New York, actually slightly outpacing Black residents’ 94.6% share of the neighborhood’s population. An important proviso to these findings is that they are more than a year old; given the rapid Airbnb growth in East New York since then, along with the previous scarcity of listings, it is difficult to know how to extrapolate Cox’s findings here to the present.
The conclusion of these case studies (summarized in Figure 4g), as well as the preceding analysis of New York City as a whole, is that Black residents are coming under increased housing availability and affordability stress thanks in part to the expanding Airbnb hosting activities of white residents. In other words, Airbnb is increasing racialized gentrification pressures in New York.
Active listings in 2017 (% growth since 2015)
Airbnb host revenue in 2017 (% growth since 2015)
Freq. rented entire-home listings in 2017 (% growth since 2015)
Estimated annual $ increases in median rent
Bedford-Stuyvesant
3,270 (56.9%) $26.0 million (87.4%) 610 (93.6%)$370 (Bedford)$530 (Stuy. Heights)
East New York 190 (246%) $1.3 million (311%) 45 (275%) $550 (zip 11207)
Figure 4g. Airbnb’s impact on Bedford-Stuyvesant and East New York
FILE
D D
ATE:
6/2
1/20
19 6
:51
PM
2016
CH
1548
9

43
Appendix: Data and methodology
The findings in this report are based on a comprehensive analysis of three years of Airbnb activity in the New York region. The data covers the “New York-Newark-Jersey City, NY-NJ-PA Metro Area”, the US Census Bureau-defined “metropolitan statistical area” (MSA) which contains 24 million residents across the tri-state areas. The study period is September 2014 - August 2017, and every Airbnb listing which existed at any point in this period in the New York MSA has been included in the analysis. Excluding listings which were created but never made available on the Airbnb website (for example because they were created shortly below the end of the study period), the database contains 184,462 listings. For each of these listings, we have information about its reservation status for each day it was active over the three-year period. In total, we analyzed just over 80 million datapoints.
The analysis relies on two data sources. The first is a proprietary dataset of Airbnb activity obtained from the consulting firm Airdna, which has been performing daily “scrapes” of Airbnb’s public website since mid-2014, and aggregating the information. The Airdna data has two parts: a “property file” which provides specific static characteristics of each property listing (such as number of bedrooms, cancellation policies, the listing title, etc.), and a “transaction file” which provides a complete list of daily activities for each property (the listed nightly price and whether the property was available, reserved, or blocked for each day). For 2014 and 2015, this transaction data was taken directly from Airbnb and is thus highly accurate. At the end of 2015 Airbnb stopped disclosing when a non-available property was reserved or was simply blocked from new reservations, which made it impossible to precisely measure occupancy and revenue earned. In response, Airdna developed a machine learning
model to estimate this information based on a combination of its existing historical dataset of activity and other information which remained publicly available (e.g. reviews and ratings). While the activity dataset for 2016 and 2017 therefore cannot be fully accurate, we believe it is the most accurate third-party estimate available, and it enables us to estimate occupancy rates as well as revenues for each property over time.
The second data source is the American Community Survey (ACS), an annual survey performed by the US Census Bureau to serve as a complement to the decennial census. We used the 2015 ACS five-year estimates, which provide reliable data about demographics and housing market performance for the 2011-2015 period, and are the most current government data available. The ACS data was analyzed at the scale of the census tract (a small, stable geographic area of approximately 1,200-8,000 people defined by the Census Bureau).
The methodology for the report was developed specifically to analyze Airbnb activity’s relationship to urban housing markets, and has been used in two previous studies (Wachsmuth et al. 2017; Wachsmuth and Weisler forthcoming), one of which is currently undergoing peer review in a leading scholarly journal. It is a spatial big data methodology designed to extract meaningful patterns out of tens of millions of datapoints, and it is based on two principles:
Be conservative about spatial uncertainty: Although each Airbnb listing is specified on the public Airbnb website with exact latitude and longitude coordinates, these coordinates have been shifted from the real location by up to 150m in a random direction (in order to protect hosts’ privacy). This randomness means that maps which show the
FILE
D D
ATE:
6/2
1/20
19 6
:51
PM
2016
CH
1548
9

44
exact locations of listings (or rely on these locations for their analyses) are misleading inasmuch as they exaggerate the precision of the underlying spatial data. It also can lead to nonsensical situations, such as listings apparently located in the middle of a park or a body of water. For spatial analysis of the listings, we have developed a novel Bayesian spatial inference technique to address this problem. This technique relies on the distribution of housing units across the city to “weight” the probabilities of a listing being located in any position within the 150-m radius in which Airbnb randomized it. In practical terms, this means that a listing which has X-Y coordinates which place it in an area with relatively little housing but very close to an area with a lot of housing will be assigned a higher probability of being located in the highly populated area than the lightly populated one. This inference was carried out at the scale of census tracts, and the results aggregated to either census tracts or to the Neighborhood Tabulation Areas defined by New York City. This method of probabilistic spatial analysis allows our estimates to be more reliable at smaller scales than other approaches, while simultaneously avoiding the false appearance of precision of using exact latitude and longitude coordinates which is common in short-term rental mapping.
Aggregate information at meaningful geographies and timescales: We have two strategies for dealing with other, non-spatial sources of uncertainty and error. First, the analysis presented in this report is almost exclusively conducted with large aggregates of listings, at which scales random error should be relatively minimal. Furthermore, results are presented with conservative precision (i.e. where there is higher uncertainty, numbers are rounded to fewer significant digits), in order to not over-imply precision. Second, there is the possibility of non-random (i.e. systematic) error in the underlying dataset, since it is based on a third-party estimate of Airbnb activity. To mitigate this possibility, we have chosen to present as many of the findings as possible in the form of comparisons over
time. Even where there is some uncertainty about the precise levels of the various estimates, the trends presented are much less subject to this uncertainty, because they have been derived using a consistent methodology over time. For example, an estimate of 8,000 homes taken off the long-term rental market may slightly overstate or understate the real figure, but if we find, using the same methodology, that the estimate was 7,000 for the previous year, then there is good reason to think that the underlying growth pattern is accurate.
SEASONALITY: NEW YORK’S SIX-MONTH SUMMER
Any attempt to measure growth trends of short-term rental activity must contend with the fact that this activity is highly seasonal. New York, like other internationally popular tourist destinations, receives substantially more visitors during the summertime than at other points in the year. Given the increasing popularity of Airbnb as accommodation for tourists, it therefore seems likely that Airbnb activity will also be seasonal. Measuring—and ultimately “controlling for”—this seasonality is necessary to accurately interpret month-to-month changes in Airbnb activity. For example, total monthly Airbnb host revenue in the New York region increased by just over 30% between April and May of 2017. This sounds like a large increase, but is it more, less, or equal to the change we should expect based on past years? We are able to answer this question, as well as any other questions related to growth trends, by constructing seasonal indices. A seasonal index allows a time series to be decomposed into two parts: the routine variation that occurs over a year, and the underlying pattern of growth or decline. Using the “ratio-to-moving-average” method, we calculated seasonal indices for the 35-month period October 2014 to August 2017.
Figure Aa shows three seasonality curves for New York Airbnb activity over the three-year
FILE
D D
ATE:
6/2
1/20
19 6
:51
PM
2016
CH
1548
9

45
study period. For the number of listings available in a given month, the number of listings with reservations in a given month, and the total host revenue earned in a given month, these seasonality curves show the proportion of a year’s activity which occurs in each calendar month, independent of the underlying trends of growth or decline. As the figure indicates, the number of listings active in a given month shows relatively little seasonal variation; in other words, hosts do not appear to add or remove listings from Airbnb in response to changes in demand throughout the year. However, the number of monthly reserved listings (i.e. listings which receive at least one reservation in a given month) does show substantial seasonal variation, and the total amount of revenue hosts earn in a month shows even more variation. In both these cases, the New York region has what can be characterized as a six-month summer. Airbnb activity is at its lowest in January and February, and rises consistently until May, when it plateaus through October. (These six months account for 60% of revenue
earned through the year.) Activity falls steeply in November, and then rises again in December thanks to the holiday season.
Given the highly seasonal nature of Airbnb activity in New York, it is also noteworthy that this seasonality is intensifying. Figure Ab compares revenue seasonality curves for the earliest and latest periods for which it can be calculated (October 2014 - August 2016, and October 2015 August 2017). It shows that the June-September period is starting to account for more and more of the year’s revenue, while revenue from the December-April period is declining. This pattern suggests that Airbnb is hosting increasing proportions of seasonal tourists, and decreasing proportions of off-season visitors (such as business travelers). In the New York regional context, this appears to have been caused by a leveling off of Airbnb revenue growth in New York City (where demand has less seasonal variation) and strong growth in outlying seasonal tourism destinations on Long Island, in Upstate New York, and along the New Jersey Shore.
0%
4%
8%
12%
Janu
ary
Febr
uary
Mar
chApr
ilM
ay June Ju
ly
August
Septe
mber
Octobe
r
Novem
ber
Decem
ber
Monthly active listings Monthly reserved listings Monthly revenue
Figure Aa. Seasonality curves for Airbnb activity in the New York MSA
FILE
D D
ATE:
6/2
1/20
19 6
:51
PM
2016
CH
1548
9
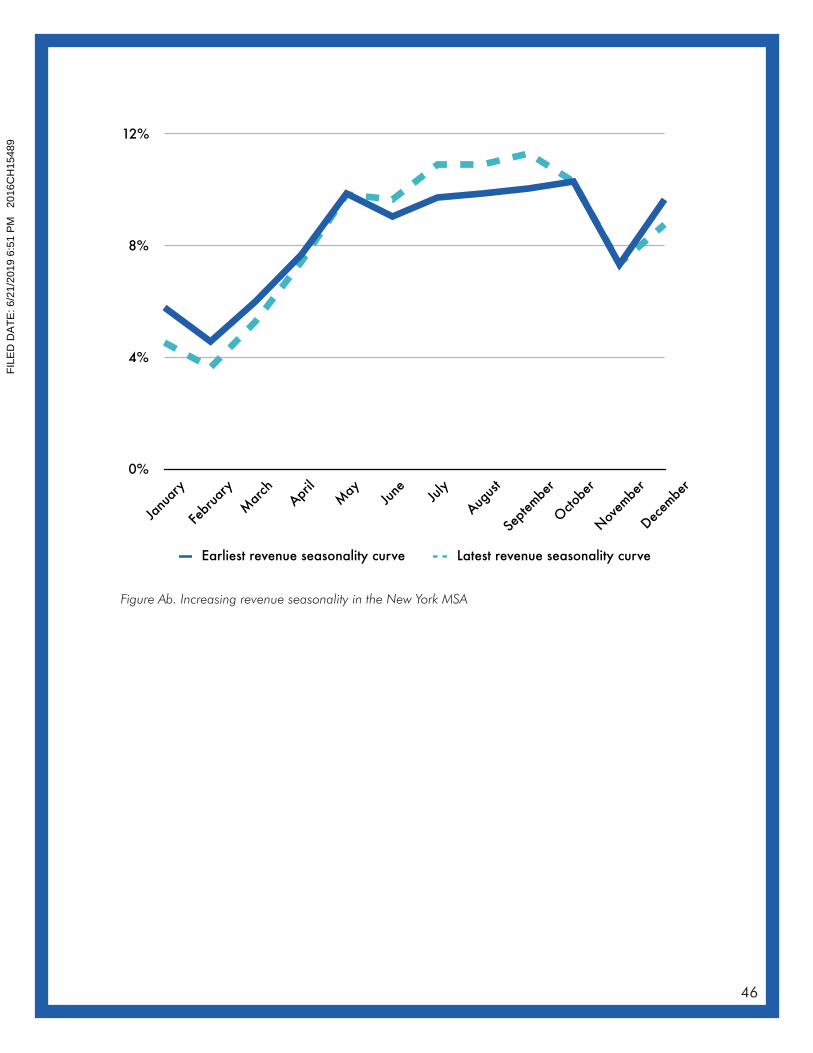
46
0%
4%
8%
12%
Janu
ary
Febr
uary
Mar
chApr
ilM
ay June Ju
ly
August
Septe
mber
Octobe
r
Novem
ber
Decem
ber
Earliest revenue seasonality curve Latest revenue seasonality curve
Figure Ab. Increasing revenue seasonality in the New York MSA
FILE
D D
ATE:
6/2
1/20
19 6
:51
PM
2016
CH
1548
9
47
References
Airbnb. 2014. Airbnb and Housing. Available online at <https://www.airbnbcitizen.com/airbnb-and-housing/>.
Last accessed November 3, 2017.
Barron, K., Kung, E., & Proserpio, D. (2017). The Sharing Economy and Housing Affordability: Evidence from
Airbnb. Retrieved from https://papers.ssrn.com/sol3/papers.cfm?abstract_id=3006832
BJH Advisors. (2016). Short Changing New York City: The Impact of Airbnb on New York City’s Housing Market.
Policy report prepared for Housing Conservation Coordinators and MFY Legal Services.
Cócola Gant, A. 2016. Holiday Rentals: The New Gentrification Battlefront. Sociological Research Online 21 (3):
10.
Cox, M. 2017. The Face of Airbnb, New York City: Airbnb as a Racial Gentrification Tool. Inside Airbnb. Available
online at <http://insideairbnb.com/face-of-airbnb-nyc/>. Last accessed July 4, 2017.
Edelman, B., Luca, M., and Svirsky, D. 2017. Racial Discrimination in the Sharing Economy: Evidence from a Field
Experiment. America Economic Journal: Applied Economics 9 (2): 1-22.
New York Communities for Change and Real Affordability for All. (2015). Airbnb in NYC: Housing Report 2015.
Policy report.
Lee, D. 2016. How Airbnb Short-Term Rentals Exacerbate Los Angeles’s Affordable Housing Crisis: Analysis and
Policy Recommendations. Harvard Law & Policy Review 10: 229-253.
Litten, K. 2016. Neighborhood ‘Mourners’ Want New Orleans Short-Term Rentals Regulated. The Times-Picayune.
Available online at <http://www.nola.com/politics/index.ssf/2016/09/short_term_rental_demonstratio.html>. Last
accessed July 4, 2017.
Samaan, R. 2015. Airbnb, Rising Rent, and the Housing Crisis in Los Angeles. Policy report prepared for the Los
Angeles Alliance for a New Economy.
Wachsmuth, D., Kerrigan, D., Chaney, D, and Shillolo, A. 2017. Short-term Cities: Airbnb’s Impact on Canadian
Housing Market. Policy report. Urban Politics and Governance research group, McGill University. 48 pages.
Wachsmuth., D., and Weisler, A. (Forthcoming). Airbnb and the Rent Gap: Gentrification through the sharing
economy. Environment and Planning A.
Wieditz, T. (2017). Squeezed Out: Airbnb’s Commercialization of Home-Sharing in Toronto. Policy report prepared
for FAIRBNB.CA Coalition.
FILE
D D
ATE:
6/2
1/20
19 6
:51
PM
2016
CH
1548
9
48
AUTHORSHIP AND FUNDING
This report was commissioned by the Hotel Trades Council, AFL-CIO, and is cosponsored by a number of New York City community, housing and tenant advocacy organizations, including New York Communities For Change, Housing Conservation Coordinators, Goddard Riverside Law Project, St. Nick’s Alliance, Cooper Square Committee, Mobilization for Justice (formerly MFY Legal Services), West Side Neighborhood Association, and the Hell’s Kitchen Neighborhood Association. The authors from the School of Urban Planning, McGill University, are exclusively responsible for all analysis, findings, and conclusions.
ACKNOWLEDGMENTS
Guillaume Barreau provided data processing expertise, and Cecelia Cobb performed layout and design work. All photographs are by Jörg Schubert, licensed under CC BY 2.0.
ABOUT UPGO
UPGo, the Urban Politics and Governance research group at McGill University, conducts rigorous, public-interest research into pressing urban governance problems—particularly those that exceed or challenge city boundaries. Our three research themes are 1) local and regional economic development; 2) urban sustainability policy; 3) the impact of globalization on local housing markets. UPGo is led by Prof. David Wachsmuth of McGill’s School of Urban Planning.
FILE
D D
ATE:
6/2
1/20
19 6
:51
PM
2016
CH
1548
9

FILE
D D
ATE:
6/2
1/20
19 6
:51
PM
2016
CH
1548
9

Exhibit G
FILE
D D
ATE:
6/2
1/20
19 6
:51
PM
2016
CH
1548
9

ExV'b
The Sharir:g Econoury and Housing
Affordatrility: Hviderri:er ft'om Airiinb*
Kylc Barlont EcJrvartl Kungt Davide Proserpio$
April 1", 2018
Abstract
We a"ssess thc impact of horrio-sharing on rcsidential horxe priccs
arrd rerr*u, Usirrg a datasei r.:rf Aivbr$ listings from thc eutire Unit'ed
Stir,i;cs and a,n instruniental variablea trstimation st:rafcgy, wc iiu.d llt;rta, 1% increa:ie in Airb;rh listings lea,tls to a 0.018% ircrexwe irr rerrls ancl
tl 0.026% irrcrease in. liouse priccs a,t {,}re rner{iarr owff:}r*occu}:a,rrcy ra,lt:
r.i;rcodc. Ihc cfl'ect is ruock:ra*t:tl i:y thc shart: oi ()wrrer:*(lccul)ir1l'-q, a,
rerult r:onsintcrit r.vith nbseritec lnrrdlards realloca.tirrg thr:ir hr:ules Ii'orn
the lcing-terrn reutrll rnrx'ltet {:er Nhe short-terrr rcrrta.l rua.rlrcN. A sirnplsi
inoclel rationalizcr* thcue fi:rdiugs"
Iieywr;rds: ,$hnring; e(onr)rr)^y" 1;e*r-to,1rcr:r uulrkqli;s. liousiul-q ma.rkets,
Airlrnb
JHL Cbcics: R31, LBo
olVe thank l)ou Davis, R.ichald Glecn, Chun l{rra,ng, Ashe Iigsgoa,rrl, 'Ibrn Clha,ng, r*rr<l
serriiirar.r participar:l,s a.t iirc ARIIUA. Ir;ati<inal L'onl'erelnce, the R.SAI Anriu*l h{r:etings, thcFbdryal Rrxetr,(r lla.rrk <lf Sn.n Franc:isr:o. lher liCI-IJCLA-IISC tlriian }lesqxi.rr:lr $yrn1>o*irrur.rLurl lJrs: p$I ()trnlcretcc for liclpt"ul *onr::renig a.nd *rrggc*lioos. i\il crrots are onr olvrl.
i NRFI& lra,rrorrk(.triher.org.t l)epnrtrueir I of F]conoru ics, I J C i, A ; ekun g(!.rtecon, rrcia . e.h r.$l'la.rshail $chor:l n{ Ilur+irrcrts, UliC: plos*rpilQrnitrslurll.usc.fld$.
l
D000329
FILE
D D
ATE:
6/2
1/20
19 6
:51
PM
2016
CH
1548
9

1 Introduction
T'he sha.ring; econofily represents a. set of peer-t*pccr onlinc rnarkel,placcs tha,t
lacilitatc maiching between demrr,nclers a,rrd su1;plir:rs of rrarious goods ancl
servicc,r$. 'The supplicrs in tliesc rnrr,rke{;s ale ofteln -smail (rxrsil), inelivieluals),
and l;hev oficn sha;r'e exce.iis cir.pac:ity tha,t might otherwisc go inmtilized*-&cnc<r
lhc icrri "sharing r:corrlmy." ]lcouomic l,hcory woi.rld suggest that thr: sharing
econorny iurproves eccuromic efficicrrcll by reducing frictions thal, czr.use capai:ity
to go unclerutilized, antl the expiosive growth of sharing plat{brms (such as
Uber: for ride-shariug arrd Airbnb fr:r horir:-sharirig) tcstifie* tci Llie underl3riug
cleura.nd for such rnarkel,s.l ll'he growlh of the shaling ecclnorrry hzrs alsc.r coure
at tJ:r": cost of great dismpti<xr to tradit,ional rnarkets (Zervas et a1., ?ALT),
at rvell a^s new rcgulateir.y chailelnges, lerxling' t* r:r:nt;r.rn1;ious polic5, tlehntes
n,bor"rt how bost to b.alance irxiividual i:a,rticipanl;s' rights to freely trnnsact, th.cl
c{iicienr:y gains from sha.ring econc;rni<x, t}re <Ilr^m1:tion cans<xl to 1;raditionnl
markets, :urd l;he rr:le of ilre piniforrns thcmseive.q in the rergula,tory proce$$.
Horne-sira,ring, in particukrr, has been the subjeeri r:f intonse r:riticisxi.
1)ia..ure1;,, critii:s &r'guc {.hat, }rome-::hzrring pla,lft:nrrs likc: A.irlxrb raisc the r:osb
i;f li'"*inp; {i-rr: ior:al rc$try*, w}rile tn*.i:ily brxri;fil,ting k:cr"rJ ianrii*ruls :r,ri* nou-
resideirt tourists.l It i* ea*3r to sec thc r:r-rnornit: i:,rgrrment. By rceirrcing
friclit-rns in tire trreer*1,o-perer mar*et for slrort-tErrm renlals, honx*i;haring plat-
folms cn,u$e some la.ncllorcis to su'itr']i frorn supplyirrg th.e tnarket for k:ng-term
::entals-*-in u,'irich re,ridents tlrc rn()Irj lilicly tcr p:lrf,it:i1r*tc**-to supirlvirig,; the
short*i;rxnl rrinrkct*in whi*h non-resid*nt* a,re riri:rc l.ikcly to parfiicii:ate. Re.
causc the iotal supplv cf housing is fixr:ci or iri*l*;fic in the sltnrt rurr, ihi,s
clrives up tLre lernt,al rabe in the lonp;-lcrln. rnarket. Ccnc,orn ovr+r hourc-slta.riiig;'i;
rt'i:ese frictions^ coulci inchide search {rictions in matchii4l cleil*ntl*rs rviih suppLlers.auti irrf<rrmntiorr friction; assc,cia,ted with thc qu*lity of the good bcing l,ransacted, or wiihNhe Lruuhvor'{;}riuess of tiir: l:uyerr or seller, See llirrav et a.l. (2016) for^ a:t ovevierv rif lheccr:nurnir:* of peer-to*Fcler rnarkefis, indrr,ling {&<: spr:cific: trv:hnological ittnctv:r{;itjns lha.t; ha.ve
f:rcililat,erl tl urir growt;h,?Anolher: cr:it;ir:isrr of Airlrlb is {:}urt l;}ie cornprlny dacs rrct <io enougir trt ct:trrba.t r:.tt-ria.l
disclir:rinaiion ori il;s pJatfr:rrm (see Edelruai tlncl Luca (?f}la); Erlr'rlrnnn ii{; d,l. (201 7)), drougir1,.'c will uot a.r.ldless l;hirl issr.re il {hio p*per.
t
D000330
FILE
D D
ATE:
6/2
1/20
19 6
:51
PM
2016
CH
1548
9

irnpa.c;t on housirig affrlrdabilitv has garnered significant attcnliorr frorn ;roli-cymakcrs, and has rnotivatecl many cities to iruposo stricter r-egulations on
hoiue-sha.i:ing.3
Whefher or not home.-sharing incleascs housitrg cost s {bl loca,l rosiclernts
is an crmpilicnl q.uestion. 'Thcrr: arel n, few rea^son$ whv it miglrt not. T'he
rnarket for short-tenn renlals rnay be very srnall cornparecl tr: the ms,rket for
long-terrn rentals. In this cnsc? even large cha,nges to the ,,^lic"rri-tertn nlarket
might not havc a mcasurablc effcc| on the loug-t,e::rn rn;rkel,. I'he short-term
markei, corilcl be smal1---cvcrr if tlre short-ternr re.ntal rate is high relative to the
k:ug*tcnn rate**-if landlords prelfer mrire reliable long*term tenants aud a rnore
stable ineome stream. Aliernatively, i;lre m.arkct fov short-tertn renta,ls <xrukl b<;
dorninaterd by housing units ihat rvoulcl ha,ve ren:aine<l vac*utt in tlte abs<;nce
of liorne,-sha.ring. Owner'-occupiers, those who orvn the horne in which thev
live, ma;. supply Lhe shori;*terrn rerrtal rnarket with spnrc roolll$ and cairnbit
with guc;ts, or tlrtry ma;, supply thoir enLire hornc, during tempr:rary absences.4
1'hssE: other-wisc vacard rentals couid also be vacati<ln hornes tha.t 'r.'oukl not hc
rcrilnel to long*ternr tenants because of ilre restrictiverness of lanllterm ieases.
Irr eithor case, $uch owns.nr u'ould rml; n:akr their homes a.lailable to lr:ng*terrn
i;enarlts, irrclepenclentl;.' of tlle existenc* of a q:onvenienl; horttlsltaring platform.
Iristea.rl. home-sharing provitles Lhern witJt an income iitreruu for tiines when
the,ir l:<lusirrg cnpi*ily would olherwise br: unclerutilizul.
in i;his p?lpe:'l rl'<; siudy lhe effect r:f ircxnersharing on the lorrg*terrrr rcntal
ma,rkct using a comprchensive dataset of aJl US prol:er'ties listeci on Airbnb,
lbc wodrl's lnrgcxl lir.rilt*sha.ring pl*,tfrrrin. We firs{; tl*vc}tp a sir:rplc inod*l of
honsc price,s ancl rcntal rate.s whcn Lr.utilolds rra,tt chcrose to ailocla,tc hulsir4l
betrveen long-{erur xrsi<lents aucl short-tcrrn visilors. The efl'cct of a home.-
sFbr examy:lc, $auta lr.{r:lrica rrui}aws alrori-tcnn, non*{}w}lrr^oeeupied rentnls <lf lixsthan 30 days, as does Nerv Y<u'k .Slnte for apa.rtmt,rnts irr buildings rvith tlu:cre or nloreresicir,rncss. $a,rr ftrurcisco passetl a fiO-clay iurriual har:d cap ou sirort-lcrur rettt;als (whieliw;rs i;utrser<grerrlJy veloed liy the rna.5'or). It is rrncl<xrr, holr'cver, thc dcglce to wJrich bhesqr
rcgulalicriu a.re enfr:rccd. \4,r.r arc a.wtr,r'e lrf ouly qrni: succr:ssl'ttl pro**:ul:ion of a,n A.irl:nb hor*t,r:c<:urring irr Sa,rrla },Ionir:n in July 20iti.
a.A fiequentl;' r:iled exarrrple is lJrai, bi ihe fiight al,tendant, rvlm renih out iris or her honr<r
cn Al'rhnlr wlrilc Nlaveliug for u'ol*.
.>rl
D000331
FILE
D D
ATE:
6/2
1/20
19 6
:51
PM
2016
CH
1548
9
sha,ring pl.atforrn such as Air:bnb is to reduce tlie fi'jctions associatcd rvith
renting cln the sirori;*tcrnr ruar*ei;. ll'om tlre rnoclel vi'e clerire threc tcsi;rllie
preclictions: i) Airbnl: iucrea.ses both rcntal rates ancl house prices in the
Iong'terxr rna,rlct; 2) Lher incle*.se in Jroimc prices is grea,i;er than t]:e increase
in rentill rates. tlnrs ieading to an increase in the price-to-rent ra,tio; and 3)
the ef'ect i:rn rent al raies is srnaller when a greater share of the iandkrrds s,re
olvn.er*occlrpiers. Intuitively, the ownor'-occupancy rate ura.iters beca,use only
nou-orvner*occupiers &r'e on the rn*r6;in of substituting their housing units
betwE:en the long arrcl short*terrn rcntal ma,rkets. Ownel-<lcculriers interract
rvith the short-i,errr nilrkct only to rent out unlrst;cl roorlr.$r or to ruit while
ri.wrly on vnc:niion. but thcv clo not a,lloca,ie theii'lxlrsirg to 1on6,'*Lerm tenalt[s.
'Jl: l;esi the mo<lel, we coilecl prima.ry data soure;cs from Airbnb, Zillow,
anri the C)ensus Bureau. \&/<r construct a panel dataset of Airbnb iistings a,t thc
zipcocie-year-monib levcl frorn data. coilectocl from publiofacirlg pt;,[ir]tj on thc
Airbnb rve;l;sii,<; bc,rtwcen the lieginning of 20J.1. and the enc] cif 2016, ceiver:ing^
the cntire Unil;ed $tatcs. From Zillorv, a website specializing in resitlerrtia} res,l
r:sta;be Lta;rsactiorts, wr* ol':tain a panel qlf hortse price aird rsntal late indic*;,
also a,1; lhe zipcode-ycnr-montlt levr:i, Ziliow provi.des a i:la*{orm for rnatc}t-
irig la.rrrlloreis il'ith lolrg-tenlr l;q;1n11{:;i, and t;hus t;he-rir plice }neasru::es refJcci, sak:
pri<rri a.rxl rental ra{;es jrr l,he markct for long-term housirrg. liirrally, we suppler
rncni, l;his ria,lr-r, with a. rich sct cf tilne*larying zipcercle characterisi;i*s collc*ted
froni tire Cle:r,cus Burer:,u's Amoric*,n Cermrmmitv ,Sru"vc5, (;\CS), suclt as Llie
nietiian househcld incorrre, poiruiaiion (;olini, sh*rre of college gradrrates, anrl
cnii:ltlyrt*nl; ralr"
Ilr i,]re raw correlations, we {incl t}ia1; t}re nurnber of Airbnll listings irr
zipcode z in year*rn*rrth t is 1:r-isitivcllS' associaled wi{;b bot}r house priccs arrd
rcritill rates. In a baselirre Ol,ii rr:grtxsiorr witir no controls, rve find tha* a 1%
irrr:rca.$e in Airbnb lisiiugs is associa,teirl vilh a 0.1% in.crease in rcr*er.l rnfes
ilnd a 0.187i: irrcl*rse in liouse prir:e*s. Of course, these estirnat<j"* strciuld uc.rt
tre iritcr-pretcd as causal, rrnd may instead bc; pickilrg up spurir:us cxrrrelatio:rs.
I,trl cxir,uplc, r:iNitx tlial :ue growing in irr:puiatioii likelv ha,r'e ris;ing rents,
ht,rrsc 1;rices, a.r:<l Lr.rrnrbcls of AirlluJ: listings at tlrc siinrc titrte. lVe thcrcforc
+
D000332
FILE
D D
ATE:
6/2
1/20
19 6
:51
PM
2016
CH
1548
9
exploil the ira.nel uature of our datasct ta contrrll for urtobservcd zipcorlc level
effects rind a.rbitr:ary cii;y level tirne trends. \\ie indride zipcode {ixcd effects to
absorlt any pr)rrnarrent difi'erellccii betwccu zipcodes, rvhile fixed cffccts at t;lte
C)*re Based Sta,tistieal Area (CB,SA)-year*monlh ler.cl control for art-v shocks to
hcxrcing; rnarkr,:t rcnclit;ions i,hilt arel colJlrrlon tlcros$ z,ipcodes rn'itliin a CRSA.s
We firllhcr contfol for unoi:serverl z'iytcode-syieciJit:, time-uarying factors rrs-
ing an instrumental velria,ble that is pla,rrsiblv cxogernous to ioca,l zipcode levrd
shocks to the housing rnarket. Tlo const,rur:i, ihe instntttreut, we exploit tho ftrct
ilyrt Airbnl-r is a young rc:npilriy tirnt has expcriencetl explosive growth over
the pa,st {ive years. Figr:le Lshows worldwirlc Cioogle search intexasi; in Airbnl>
frorp 2008 to 2016. Dcma,nd frrntiarnentals for sholt*tnrm housing *rer rurlikely
to ]rave changrxl so draslicaliy from 2008 to 20i.6 as to fully explain the spike
in irrteire,qt, $o urost of the growth in Airbnb srylrch interest is like)y drivcn
by inforrnation dif{usion ancl teclmr:logi<nl improvcmeuts 1;o Airbnb's pla,tforur
:ls it rna,t,lu{:$ a,s in cofitl)ar}-y. Neither of these shr:u}ci be correlated witir. lo-
cai zipcr:de level unnbserved sirocks to the horising rnarl<et. By itself, global
sealch interesl is not r:rxrugh fcir ;ur insl,rurnent; because u'c alrcndy cortl,rol fc.rr
a.r'iritrarv CBSA levt:l 1;inrc t;r*rxls. Wr; therefr;re inieract lire Gc.rogle seelr:ch
irtclex iilr Airlurlt wil,li ir. lri(,il..iul'c (rf ]tr:ll, "lolrt'isl#'' a. zill,rltirl is itr a llase vear.
2010, Wc rlc{ine "torrli$ty" to be a nloa$rlr<: of a zipcodc's attractirrencss for
tour,iliis ir,rrcl prt.rx.v for it usir4; thc rrunrbt*r of a,ri;rrbii$lrrneni,s ii: thc foocl ser-
vice and acc;ornrnt-rdatir.rns intlu.si;r-v.6 'I'hesc inclucle eating atxl cirinkirtg pla,ce"s,
as well as hotels, becl and brcaktrx;ts, alrd ofher forurs of short-tomr lodging.
ih* irk:iti;ifyiirg ixi,;r-lrrpi;ir,ris ri{ r,iir s1}fitilicettii:ii ilrc tlint: 1) lanrl}orri:i itt tnole
tr:r.ii'isty zi;rcod.*.; ;irc lllort: liliely to switch into the simrt*terrti. rental ma.rkol,
in lcspon*c to l*a,rnin51 iil;r.rut Air:hnb tha.n lanriiords in less toriristy zipcocles;
a;xl 2) <-,x-;.lnte levirls of tr"tur:istirtcss rlrc not systomnlimily correlaied rvith ex-
pr:*{, urrol;srlncri slx:cks to tlre housing utarliet a,t titc zipcode le:vel. ih,o,t art
5'.lhc CH-q.A is a g;r:ogra.lrllir: unit, dtr{incrl by l;he U,S. Oflcc of futana,gen:enl and l]udgel,
1hat rorig,;hl1. cr:lre.*lronds fo an rttban cerrtci: a.trr{ flte <xrtrnlics lhtt,t contrntrl'tl {xr it,.il\,!'e lbcus on i;orrrisnr lltlcrlrrst: Airbll.r ha: histolically been frt.rclneirted rur.rre by t,ourists
iliarr br1sitx:ss trnvr:let,l. Airhlb has sa.id that 9U% r:f its ctrsl;oriFrti it):(] vtlcttl,iotiers, l:ut isl.I,trrlp{,irti; io llrrilr tttir,rkci: rilttrrt': irt {;lttl busilt'ss trin'el *LN:'ior'
i)
D000333
FILE
D D
ATE:
6/2
1/20
19 6
:51
PM
2016
CH
1548
9

aLr;rt r:orreletted irt. tirrte urttlt. Googkt sea;rh.'tnte:rvst for Airbrtb. We disr.:uss Lhe
in$trurrrcnt, its construction, antl exercises suptrlorting the exclusicttr rsstriction
irr rriore cietail in Sections 4 tntl 4.L
Using this irrstmmental va,riahle, we estirna.te that for: zipcodcs rvith the
nrcdia.n owner*occllpo.rlcy r*Lc (72%), a, .17i, increa^sc itr Airtxrb listings leads
to a,0.i]1B% increa^se in. the rc;irtal rate iurd xA.A26YI irtmease in housc 1:ricers.
lVe also firrd that, a* ;:redicted hy our tlieoretical mr"rclel, the effect of Air:bnh
iistings on rcntal rates a.ncl housc irrices is dccrcasing irr the; owller*occltpancy
rate. Fbr aiptxrde*q u'itli a 56% ownel:-occn.pancy rate (the 2Sth percen.tiie),
tJrcr t-'ffcd; of. a LVc increa-.ies ir:. AirL:nb listings is 0.A24% fol lents *nd 11.037%
fr.rr lrousc prices. I'br: ziircodes with a 82% owrlcr-occupir,llclr r:ate (tire 751,h
percontiie), the effec;t csl a1(/a increa.se in Airbnb listings is orrly 0.$74% for rernts
and 0.019% firr htlr:sr: pric.cs. Tircse result.q are r:ongistent with the moc{r:i's
prerlictions that r,he effr:ct rin both renlal r*r,te a.ncl hortse prices will lre posil;ive,
t;hai the efi'ci:t r:n itoust: prices will trc lalgcr tban tlic ctri*l; on lents, and that
l;he effect q,ill bc d*:reasiu6 in owtier'-r:<:cupancy ra{;c:.
Nr:xt, rvr: lesl, the hypr:thesis tjrai the cficc:ls wr: ob.ierve are parlialiv due 1,r.r
absentcer l*ncllor<ln subst,iLut,ing nway frorn tlic rental nnd for.$&1$ *ralliets firr
long*terru lesiclerr[s, irrrrl [trwaxls i;irr,.sholL*tr:ntr ttta.r'lret. 'lb r]rr sr)] tvc crrt:sidet'
tire efl'eci of Airl.rnb ftn hl,u-.:ing vacarlcy rai;es. Beca,usr': zipcod<l ie;r'eil ds;tn, ort
va,ca,nr:iers o.'rr: not inililiLblc ili, a rnr:nt,hl]'--.rt cvctt ycarly*-fietlnsncy, rvs fr:cr-ts
orr zi,luur:rl vrt,(:rriicy r&l;es at tire CBIiA level. We iinri tira| a,rittual CIISA vec.rlrcy
rates travc no rmsociaticin q'ith the numl.rcl of Airbnb listitgx. I'Iowever, lor:king
r.il; lft* di{it-,r'nr[ 1.1,1;t'rs uf vi:r{;ai}(.,v rve fild t,]il;i, t}ie rin:ttl:ier t:f Airbnl: }is{;ings is
posilir'*ly associated rvit,h i;he sharc uf horncs tha,i. a,ve vacalt for se:*onal or
reci'ea,i,ional use (lil*:iy i;o be: part of the short,-term renta,i nta,rkcrt inventory)
aricl ne6qativel.y assor:ir.rttld with lhe stia,re of ironltx that ar'c va.cant-fcx-rent and
vacanl*fr:r-salc (parl, o1. tlrc k:trg-l;crrn marlcct invenlorv). 'Ilrr:se {indings arc
consisterrt wiilr abscrit,r.rer la,ncllt.ird su,itchirry; frorn tlre long- fo the shon-bcrrn
r:ental rnai'kcl.:'
?Ccnsu.$ llurcau urcrlrorlolbgy clrrssificg a hnusing unit: as va.c;a.nl cvtn if it ir l;entporzl,rily
r,rccu1li.ed i'.ry 1.r*:rsoris 'l;ht': rtsrt:r,ily livl, ol$(.]11'lrtll'tl,
{i
D000334
FILE
D D
ATE:
6/2
1/20
19 6
:51
PM
2016
CH
1548
9
R.elated literaturc
We arel aware af onlv two ot;hcr ir.r'arlernic papsrs to dii'cctlv s6udy the effect of
hourc-sharing ori housing costs, and both of theiu fomrs on a specific Uii rnarkci:.
Lec {2010) provirlers a descriptive analysis ol Ailbnh in the Lns A.ngelas housing
nrir,r:I<r:i, .',a'hiio l{orn arrcl h4eranle QALT) use Airbtb iistings tlal;a, fronr lSostort
irr 2015 and 2016 to stucly thc eff'ec;i; of Airbnb ot renial raies. Thcv lirrd
tirat a one standa,rci cleviatii:n increir*sc in Airbnb listiugs ni lhe census tract
lelel lezr,cls ta a$.4,Yo incrcasc in a-sking reni,s. Itt c;ur claia, wc find that a one
stnrrdard deviaiir:n increase in listiugs at tire wit,hin-CBSA zipcode }evel in
?01"$-2016 irnplies a A.54% incrca^se in rents.
\t"e q:ontribute to thc litt:r:a.i,ure coucerning; the cft"ect of horne-sha,ling; otl
housing costs in three ways. First. rve prerscrrt a uroclel that organizes out'
lJrirrking ilhcxri hou' honre*sha,ring is cxpeclecl to rl,{fect housing costs in the
Iong-terin market. Second, rve providc direct cvidencr: for thc urodel's pre*
clicLions, highlighting especiallv the rerie of the o\1tor'-occupancy r*.te ancl of
lhe marginal landowncr'. Ilrird, ltre l:resent lhe first estimates of ti:re ellect of
horne-,.;h:uirig orl horning costs tha,t uilc$ cc,rlprchousir,"c cla,ta. frr:rn arrrt,qs iJrcr
I j.s"
Our papcr also ci:nlrjbutes to thc g;lou,in6 lit,erature r:tr peer-to-pcer rrlirr-
kets. $uch iilcralur:e cov{rrs a witlc arra,v uI. topics, ft:<;rr: l;hc r,:fftrcL r:f th.tl sirnring
ecoLofi]y on labor rna.rkcl ntttr:tlmcs (Chen ei al.. 201.?; Ha,ll a,nd Knreger, ?017;
Ang;ist e,1' al., ?i)1?) io cnLry ii.ud ccrni;etiti,:ir- (Gorig ei; *1.,2017; Horton nnd
Zcckh*,ui;cr, 201"6) to i;t'rist and rrpntat;inn (Fra,dltin ct a1., 2{}L7; Vtouatpio tl;
al., 201.7; 'lrtv*s et al., ?0i5). J-Jcrcii,ust: thc li'r,clati"rre on lhe teipic is cluitc vas{,,
r.ve rcfr:r thc r:caricr t;o llinav et ai. i:20i ti) frrr a,n ovor'l'iew of tlx,r txxxtornics uf
peer.to-prlll rnarlcets anrl to Prosertrlio rrnrl fellis (2017) for il, cornplefc rcview
of the literature on the shaling ci($tlollt;.
h l,errns of stuclies on Airbnb. l-roth Zerva"s et al. {201?) ancl }'arronafo a,nd
ftaclkin (:l{flft) sl;urly t}re irnp:rct of Air}:nh on the ho1;*1 induslr:;.'. Zerva^s et al.
{:tt)L7) f.ccus oil i;hc r:{le*ts r:n irrcurnl:erri;s, w}:ilc F}.rrura,to ancl F"a,dlEin (2i}18)
fcjcns <lir tir* ry-:rnsurnr,rr*. gnJi in wclfa.re. ()ur i;.r,1lr;t lodlEs at a sor:rewhat unique
qxnr{;e rx{, iu t,}ri:; Iittit'aiiur"r,: tlrjr:ii.r)$c rr:c forlrs oti l.}rc ,,rffu,r:i' cf the slrarirl;1 (xilu{il}ry
{
D000335
FILE
D D
ATE:
6/2
1/20
19 6
:51
PM
2016
CH
1548
9
on the rcalloca*ion of gouds frcim one pulpo,{le to anothcr, rvhich rnay cause
locnl exterrralitics" Local externalities are prescnt here because thc supplicrs
are local a.ncl thc tlcmimclers are non-loca,l; transactions in the home-sliaring
rnarket,, therefore, inv-oive a realloca,iion cif r*souru:s frorn locals to norr-loca,1s.
Our" contribution is thercfore to s{;iidy ttris unique type of sha,liug econorny in
whi<*r J:ublic policy ma.y be especiaily silhent.
Ther rest of the pa,pel is organized as follorvs. In Section 2, we pteseni; a
sirnplc urodel of hoixe prices and rental rates wlti:re lantllortls can substitute
betwecn suppiying the long-Lernr. anci the sholt-tr:rrn ntarket. In $ection 3, we
elescribe thc data rn'e coilected f'rrxn Airbnb an<i prer*ernt sorne hasic statistics,
In Sectign 4, we dcscribe our meth.odology ancl prtlscnt exei:ciscs in suppor{,
of the exdusion restriction of our instlutnerrt, apd irr [js-:Nic;n 5 we disfl:$$
the results ancl presett severa,l robust:ress checks io reinfort:e the validity of
our resllts. $cction 6 discusse*; our {indings, the lirnita{;ions of our work, and
i:rovide cxrnclurling retnarhs.
2 M*del
?.L Basic sefup
We c6irciilt:r ft housj)I,51 uia,rkt{, with ir, fixr,:cl sl;ock of huusirtg 11, wiricdr cur be
alltrcatecl ta short-terni housing 5, or long-tcnri lic-tusilr65 I'. S 'l- L * /f. l'ho
lenta.l rate of short-telm housing is Q iinci the rental la,le of long-ttllm housing
is .|}. ?lx,: two h*u,*ilrg r:;.r,rkcts ;tre sttgriietrt*r1--..tcnnnts r.r).t* r:er:<l long-1;*rrn
housirrg c*nnot rllr* in the short-i;errrr rneukr*|, an<l tertants s'ho nrred short-term
housing camrot rent in bhe long-t*rnr rtnr:keli'8
F*r. rrcw, w0 ftjsume that all housing i* rtwnecl by ai:sentee landlorcls n,nd
will rcturn to th.c pr.r*nil"rilii,y of elwncr-or:ctlpicrs later. Each lnncllolcl orvns
8I1 6rrr view, the pi'iurary ririver oL {.hi* rlnrl<r-'[ segtttrlntirtir-.rtt iii ihc lertglfi of lea"{e alrcl
feliuri; righl;u, Locnl resi{icnfs pa,r'l.iciir:li;irt{ irr i}re iotrg-te;rn: re:u{;*l markcl rvill typi*rlllysigl lerao6* of 6 rnonllrs io $ yr:ir1 nnd ale also grait{,e<l tx;rt,nitt rights and pr<;te.ctions l:y l;ho
city. 0* the gilxll lulrxl, lou-resirlent visitors parilciliati:44 in the shrrt:t-ie;r'm rlinrket, still
i.rsur:,lly tirtlrl' rcrrN for a fer.v riays n;rd *t'c rltlt; graltl'r:d Lhr: sn'tut r'itr1hts a-r rt:sidelii t'etlrr'irls'
D000336
FILE
D D
ATE:
6/2
1/20
19 6
:51
PM
2016
CH
1548
9

one unit of housing and clecideg to rent it on Lire shcirt-terur rnarket or thc
long-terrn rnarket, taking renta.l ratEls as g;iven. A lancliorcl will rernt on the
short-tcrnrrnarketif I-cr-r ) /t,whcrc1:-l-cisanaclclitionnlcostof rentirrg
or:. the short-term market. with c licing * colrlfil()n cornirouctti ilnd e being an
idiosyrrcraf,ic cornporrr:nt across l$ncllords.g '-llhe shar:o of lancllards rerrting in
the slrort-ternr markeN is tlrereforel:
f(A - /? * c) * I:'(e < Q * 11* ci (1)
/ is the cumulative distributit"xr fuucfion of e, anri f' > 0. I'he tolal number
of housing urtits in f,hs sirort-tcrrn rna,rket a,re:
^9 * /(O * It * c)f:I (?)
Long-terrn rental ratcs a,re dcterrnined ir: ec;uilibriurn try thc inverse de-
nrand function o{ lor4i-terrn tcnanl,s:
R: r(1,) (:])
with r'o d 0. Shor:t-tcrnr renini rllit:s a,rei dctelinineri exup;olrrLr*ly by *ni:siri*
rns,rketn.It il'he rra,rket, is in steady sLale, so tlxr house i;rit:c ,l:) is equal 1o tJrt:
presmrt value eif clir''ccunl,ed cnsli fiows to tht landkrrrl;
1' .., l)6r E {R-+-rnax {0, C} --" R, * r: * r."}J
03
ir.0I
I --li lIr-F s{Q * It - c)l (4)
wherre y(e":) : #[*: * ale < r]f {:r) gives i,}re expcrtecl net *nr:p}u,s of hcing:l.ble
eRcnting iu ihcl rihori-ierru nrxkr,:[ coult.l l:c cosilicr: ihan in the ]ong-lerm nrarket l>tteii.u$e
ihe tec}nology {'ol rnatch:rig iandlords wit}r tilnrlnts rrul1, bc hislcirically rnorc <leve}optld iuthe lorrg-ternr niarkel. Li.)ncl]ords rnay ]ri;ve i<liosyncratic prefererncers ovr:r r-eni;itrg in the hng-ferru rnarkeN vs, the *hori-i,erm rnarke{; if ilrerl' ha.ve difft.rrcni pr*ft:r.t-.*cr:s ftrr i;lrc stahilil,yprovicietl b.1' loug*tr+nn icnntrl.s.
10.!br ,rx*ruplc, lJrey tx>uld Lre delern:rirred by ekiu{,ic tourisru dtru'ta,rtcl. R,elaxirtg t}risnssuruptiorr an<i allowing I'r*'pricc clasticity in the shr:rt-[erttt ntarkef. wtxllc] trol; chixrg;e t,ir<,;
qu*li la,lir,e: re,gulin-
Cl
D000337
FILE
D D
ATE:
6/2
1/20
19 6
:51
PM
2016
CH
1548
9
tr:l ront in tlul sho*-terru rna.i'kct rclative tc l,he long-terrn mrrket;, ancl.g/ > 0.
2.2 The ef.f'ect of horne-sharing
'l.'he introd.uq:ticrr of a, hourt!$haring platform rc<luces thc col;l; lbr la,ndlords 1,t:
advertise on tlie sherrt-terrrr rnarket,, irnlilying a decline in c. This coultl imppen
fnr a ra,r:iety of rea,sons. By irnpri:r'ing Lhe search and matchirrg ter:hnology in
thc short*tcrm market, the sharing pkltfo::rn m:rv rsluce the time it takes to
iild short-t,crnr tcnanls. liy proviriing irle;nt,ii"r' vcrifical;iun a.nel a repulatiorr
systeirn for uscr feeclback, the platfolrn nlay also help recluce infcrrrnation costs.
We cernsider hov a.n exogenous changc-; io tlie cost of listing in ihc shr"rrl,-
term rnarkef, t':, aflects long*ternr renta.l ra{,es and }rr:ruse prices. Ilrluililrriurlr:r:ncliLions {f )-(3) irnprly t}rat:
(5)
So, bv ck:crensing ths ct.rst of listing in tlre short-tcrrrr rnn,r'liet, the home-sJraring
pla,tlbrin has Lhe efftlct, of raising rtlntal i:a,l.cs. 'l-'lrr: irri;Lrj[;ion is fairlv stra,igJrt;*
ftili,r'a.r't1: {;he h*rrr*-slt*rin1; p}Er.tfinr:r b:rlucr:ii crxn* l&:rdiorcl* t* sq,itch frrxn iJxr
l<xp;*teirrn marlcct tr: ihc shori;*tcrur rnarkelt, i'eriucirrg r;rr,1rply iu th.e lolg'-t;crln
rnn.rkcl and r-i:,ising rcnta.i rates.
i:'r:l horme prices, w$ cal] use ilkluation i4) to writc:
dR 'r'f'I{a z l\
,1". *
I --tr f t1i' '' ''
lf- ==,\ |.43 - (' ,{l!) n,ltL(' r--o Ltl.r.. \ .r(:// l(6i
\tu'e note frcxn Iirlraiion i5) thrlt ""-.1 "
l'# .0, ar-rci *o {f < *f: < ff < O.
'.1.'h*.: Io,ttcr jneqrrnlitv concludm tha.t Jronrc-sharing increases houirtl priccs a,nd
tha,t iJre house i:ricc resilonse rvill be greal,er tha;t tire rerrial ra,te rcspo:rse.
'I'his is becrr,use lrorne-siraring increases the vaiuc ol horncorvrlcrship tlrrough
tu'o r'.ha.ixu:lu. First, it, raises the rentai rate wlriclr is l,hcn c;apita,liz<,xl intr: irou*e
prirr:s. l'ct, if tlii*.wt:n; Jrorxc-Rharing's onl-r, e1I'ert;, lLeu lhr:r 1.rric:e re-l1rr).r:se
a.nd tirc renta,l'ra.ie response woulcl $s proporticnal by the discounl; fzxtor.
1(}
D000338
FILE
D D
ATE:
6/2
1/20
19 6
:51
PM
2016
CH
1548
9
Instead, tire iltlrliticinal incltra.so in blrc value of hcirneowncrsltip comes from
the cnhr:,ncccl o1:{;iot va,lus of rcnting iu the short-ternt market. lleca,use of
thi* *econcl channc;I. priccs will re*poncl everr rnorc l;itan retrtal ra,tes to thel
introduction of a horns.sharing piatfbrrn.
2.3 Owner-occltpiers
We now lclax llrc assrmrption that ail homcowttt:rs are elbsentse lancllarcls
lry also r:,llorving for owner-occupit;rs. L,et Hn ber ihe tntrnber of housirrg unit.t
r.iwned by absentee iaudl.orcls a,nd let ff., be tlie n*lrber of l:ousing units owncd
by owrer-ciccupiers. We stili dciine ,1, a^q thE: rrumber of hoirsing units:r.lL:ca,ted
to lexr.g-term resitlcu.i;s-includirrg owner*ofil11i:iers--a,ntl thcrefore the tut.nbeir
of n:niers ix L*IIn, Weassume tha.t iJo is fixed, and thaL.l'1, will be deterrnineel
by ecluilil;rium hcruse prlces $,trd renta,l l':-r:tes.1r
\Ve a.llow ownclr-occupiers to interar:t with the short-terrn iroitsing uta.rkct
l:y ussuruing tha.l a fracLion 1 <if thcir hoirsing iurit; is sXu€i:;q ca1:acii,5'. l'his
oxce$s capacity can be thexrglit erf a,s the unil's spare r{}glnli clt' thc tirne that
i;he owner s1;*ids a.wrry fi:om llis ttr her home. Owner-occtti:icr"s J.rave the t:hoice
to either hclcl tiurir clxccrz{:r capr:i.:ity vacn,ilt? ol io ntt:i it, srtli, {,}u Lhe s}nri-l;clttt
milrlcet. 1'hr,iv ixrnnot rerrt r:xe:css co,pacily oit thc long*tcrtn mi':lket, dr:c to tlrt
.na,iule of lc+a-ses anrl rentqrr protecticns. T'he l":cnt{it to lr:nling; excess r:apacily
on the short teyin nrarket i* Q * r:* e, wlt*rr': c ancl. r, are again i;hc: cxlst ;rnti Lhr,:
icliosynclatic preleren<:e fbr listing on th<; slrort.lerm ma,lkei, rcsl:c*fively. If*xce.s$ ca,pacih'reinains lunrsccl, thc rwner neii,her pa,)rs 6r (:ost ttur elclives any
benefit f::om i;hc excc$s capaciix. Owner*oc;cupiers rvill rr:ltt: oli Lhi: sliorl*tr:rtll
:narketilQ*c*(>0,a.ndihus/(Q-r:) isihetlurrct-ifcirvner-or::ctt1':iersrvho
rent; their excer$$ r:apacity on the short*term :na,rket.
Note that; tlrc choice of the own()r-occupier is tci ciil:.er rent r:rl thc silolt-
ierm uiarkerb, or to lrolcl excess capa,city t'acanL. ll'hus, participation in iJrc
L;'tt I{,, is r:or: lixed. ljren nll of i,h,l housing sl;ock wili be orvued by eil}nr ajr$<:n{,r,vo
lalldiercl$ or o\r'rrc1i-o(icltpieru. cl*pentling on rvlii<:h h:ls t,irer hip,her :ret plexrrt{; vtrltrri ol owuitt11.
In tlr<: Airpendix, w* nuluericall}, sttlve a uroclel with ltcteirr5lerteurti* zlgetiiu which a,llorv* lirr1,n ettdoqetlotilj share ttf o,ltserttet: larrdiords, ancl show thnb the rlralitalivc t'csuits of iliisticctiorr *1,ili lroid.
11
D000339
FILE
D D
ATE:
6/2
1/20
19 6
:51
PM
2016
CH
1548
9

short-ierrn ruarket by orvncr-occupiers tloes not crhange thc overall suppJy of
hogsing ailocatcd to the lor4;-t;errn r:arkct, .L, It a.lso cloes nct changc ,5,
whiclr is bv Elc{ini{,ion crqual t,a II -- L (wa thinic of ^5"
as the mrmber r"rf r.udls
tlra* a,rci yserrrtanerttl,y aliocrated towarcls short*tr:rm housitrg, r.r.s tlei;crrrtinod ]:"v
absenl;ee la.ndk:rds.) The eqrrililrliurn supply of short a,ttd lortg-tcrrn housing
arc ihelefore:
S*J(Q*ll-c)H"L:II*fQ*R*4n"
(7)
(8)
Reltal ra,tes ir: the long-terrn rna,rkr:L crintintre to l:e detertnincrl by the
invsrsc cleniaucl curve of residents, r(tr). The equilibriur:n i:e$ponric of retttal
raics l,o a. change in c becomes:
(0)dn"d;
I{"f1 ^- rtJ't I{o
<0
T:klga,iion (9) is similar to ltrqua,iion {5) except th.at If is re1:l;iced with l'1".
Iic;uirticirr (3) thcrefcrre m*ken r:lear that iL is the al:i:e.rtte* la,ntliorrls who a,lh,:cl
tlru rerrtal r&tc l'*$l)oltsc* to A-irbrrir |:ec*;ust il is they who :*<: ctn th* nta,t'gin
bsfn'cen o^ub,s1;ituting tlrclir urfts between il:e sho* *uel lotig-f<)r'nl ma.rlmts.
\4/heir l,he sh*.re ol oq,rxrr*occripierx is higlr., therenla,l rate red;pttnse tn l\irbrrh
will be low. ki fact,, the le$pon{ie of rcrttal ral;es to Airbrrb cnulcl be zero if ;r11
la,ndlorcis are olv]:ier-ocrupi*rs.
$ir:r:o lang-icx'nr re:xiclcr.il;s a,r$ cx:iln{i(} }touLogenecufi, &ll rxlui}il:rium rvil}r a'
pr:sitive share of l:oth rentors a:rd olvtler-occupiers i:equircs l;l*l,t llcruse prices
n:.irke residents intiifferent lle{,we:exr reuting and ownintr4:
I" "" T*[n + rs(o * c)] (r 0)
Ilquzr,tion. (L0) says tiiat the i:rice tha* residents arer rvillilg to pu,;, for a ]rcxne is
cqual i,c ill* plesenl. v;r,lut; of long-t;crrn rcrrts plus the prexenf, vlrlus: oi renfing
oxcos$ tnpai:il;, to the shod-lerm urarltl!, 'J.'he resl:*:rser of pt'ie:r:s to it. t:ltartgt+
t.)
D000340
FILE
D D
ATE:
6/2
1/20
19 6
:51
PM
2016
CH
1548
9
ln c is:d,P
,k,lan rl--;- * ^l!lL fl.C'
1
i-rt (11)
So, again, rve see that pricex are rnore responsivrt to a dec;rease in c tha.n renlai
ratcs,
To sur,rrnarize the results of this section, s'c dorivod f,lree tesiahlc irnpli-
calions. Ilirst, lenta,l rates nhould irrcrcfi,$c in response to the introduction of a,
horne-sharing; platform. This is bec:xrse horne-sha,r"ing cau.se$ somo la,nrlown-
els to substitute a.warv from supplyirrg the Long'ierm rental rna.rkct and intc.r
tlie shc;rt-tcrn rental rnarkct.. Sccontl, hornti prices shoulcl irtcreiise as well,
trut by ;l,n even greiltel arnount than rentn. 'I'lis is bercause home-sharing af-
fects housc priccs through two c:hannels: first bv iircre:a.sing the rental ra,hr:,
n hich tircr: gets capitalizcd into irouse ;:riccs, :rnd ss;ond by dii:e<;tly incren;-
ing thc n,bilil.y for lanrJkrrcls to rrtilize tlut ltorne fuliy. Finaily, lhe leultrl r*lr:
reslrollsa will ire smaller rvlrr:n tliere is a, grcater sha;:e of owt)et-occupiers. 'Ilris
is br*a,uso nwufi:-occu;rit+rs nre rrclt on thc rnargin i.rf ,qul:stitutiug bctween thc
1r:rng-l,er:m antJ shr:lt-tcrur rnarklts, wlterca,s s,bsentee lancllorcls are'1' \tle now
liu:ri to ic,rling i.besc predic:l,inns in tlre dri,la,.
3 ll;rta and Bilckground on Airbnlr
:3.1 B;r.clcground on Airbnl:
Rccognizccl b3r rnost as i;hr* picnccr r:f thc sir"aring ecoilonry, Airbr*r is a. pecr--
Lo-peer nur,rkeiplii"cc f'or slmrt*terrn reritlrlu, wlrerc t]re suppiicr.t (]rosts) oft'cr
t.lifii:rent kinrls of ilrx;omurc.rclatious (i.r:. shareti l'ootrl$r entirc ltoutt:s, or ev()ll
yurts a,nrl trccrhouscs) io prospt*tivc rentcrs (guests). Airbnb was foundeci in
2008 ancl lias rxperiencccl tlra,matic growth. going frorn just a ferv hundr<xl
hosts in 20U.3 to rtr'<:r thrcc miilir:n proped,ies supplied by over one niillion
l?Arlr:th.er cdass of liotuct-lrvtteys we have -l'ei; to c{isr:rrss is vacnl,ion-lroirt$ owilers. Orvrrtrsof vacrtiou h+rnets cx.n b<,r lrcat;*d eibher as o..r'n*t't;ccupiers with hii{r 7 (ker:e 1 is ther atrrouni:
of tiure s1:ent liviug irr their'prirriary rr:sirielce), <i:: a$ atrseuiee laudiorcl*, rlcpelrditig on howeler^rtic iltey arr: n,itJr respect to lciepirrg'lhe hctrurl as a wrca.titlrt lrro;rcrty v-s. rentitt,g it i;o alang;-Nr:rrn Neurrnl. lu cit,hcr casc, th* krl5 irlplir:ri.i,icn* rrf tlie rrro,lel rrili ttoi chartge.
13
D000341
FILE
D D
ATE:
6/2
1/20
19 6
:51
PM
2016
CH
1548
9

lrosts in 150,000 citicis r,rrxJ 52 countries in 2017. Ovcr 130 niilion guesl* have
lscd Airbrib, a.rxl rvith a markel vaJrta,tion of over $3l.ll, Airl:nb is cxe of the
worlcl'ri Lar:gest accourmorlation bra,ncls.
3.2 Airbnb listing* cla.ta
Our rnajn sou]:ce of data corncs clir-ecily from tire Airbnb wcbsite. \Ve coilected
consunrcr-facing irrforrrration a,irout tho cornirlete set of Airbnir propertics 1o-
c*letl in the Unjleci Si;ates and :.r.i:out the lrt.rsts who offer t]tern. Tlre dai;a
collcction pr{Jcess spannctd * pcriotl of a,pproximately five 5,snr'$, frr:rn micl*?Ol2
to tire end of 2016. Scratr)ori woro perforrned a,t irrcgular intervals Lictween ?012
trs 20J.4, a,nd at a weleklv ini;r:rval starting Ji'r'nua.rv ?fll.5.
Our scra4ring algoril;lun r:ollected all listing irrformation ar,'a,ilable to users
of thc rvebsite. includlng rhe prope*y loca.tiott, tirc tlail5, itrice, l,lte a,vcr'?rgt,
sta.r ral;ing, a list of photos, the g^ucst capacity, fhe n.unrber nf bedroorns alrd
bathrrrorns, a lisl, of amonities such as Wil'i arrd ilir conditioning, e;tc.., and the
list of all reviews fi:oru guest,s who irave slayetl at thc proircrty.l:r Airbnb host
infrrrmatio:r irrcludes i,lrtl host narnc nnd photograph, a trrierf pro{ilc tlesu:ipl;ion,
*ncl tlre 3'rrar'-n:ronth in rvhiclt fhe ur:*r i*gi*;i;crdel ils :r hosl olr Airbnb.
O1r {lna.l riai,riset, r-p:ri,ainr dctail<xl infonnation a.bout 1,09?,{i{)7li"ttings anrl
68?,803 hosts spanning a period of ninr,r yeor'$. frcm 2008 to 201$' l3s;nrso of
Airlxrb's ciornitance in the horre-shnriug nmrke'i, 'we believel lirai; thi,s data
lepresents the rnr:st conrprt:hcno'ivc trlicturc of ircxle"sharing; in tire lI,S. ever
construcier1 for inrt:pr;ndent re$ofi.rch,
ii.3 C;riculating thc Imrrrber of A"irbnb lislirrgs, 2008-
201"6
Once rr'e have collected the data, thr,r ncxt stcp is to <lefiue & tneasu)'e of Airbnl;
sr.tppl5r, T'his t;ask requires trvo t*roi<xls: first, wc nceld to <'hoose the gcogral>ltir:
llsAirbnb clor.rs nub revea.l llu: r:xar:tl slrt:et addless ol c{rot'dinulqii cf tbe propt'tlty iorprivaly t'c4iicrn$i i:r)vtevr,:r, the lis'l:ing's cii,v, street, attd zipc<xlr,: ccrrtuil<tr:ri to thc: pro;rerl,.lts
renl lucllion..
14
D000342
FILE
D D
ATE:
6/2
1/20
19 6
:51
PM
2016
CH
1548
9
granularity r:f otir ttleasure; st:cond, r.ve need to dcfirlcl tirc crttry and exit rlates
of r:ach listing to tbc Airbub plai;fornl. ll.egnrdiug the geographic ag;grcga,tion,
we cogduct q:ur ruain &rraly$is at l,he zipcocle lertel fr:r a few reasclns. First, it is
tlre iowcst levei of geography for wirich we {,14,n reliably assign lisiings witltou{;
crror (otlrer than user input cmor').id ficcr:ntl, neigirborhoocls arc a natural
unit r:f analysis for horming rnarki:ls bet:ause therir is signi{icarit' }ieicrogcrleity
ig housipg rnar-kets acro$s ncrigirborhooels'w'ithin cities, but cornpa,ra.l,ively less
heterogeneity withi:r nei.qliborhoocls. Zipr-:odes will hc oul plox"y for neigli-
b<lrhoods. Thircl, conducting the a.ualysis at the zipcode levcl as opposecl to
the city lcvel lxrlps with irlentification. ?his is <lue to cur abiliiy to cr:rnpa.re
zipcocles withirr r;ities, t.hus cr:ntralling f.oi: any unol:served city ievel fir,ctors
tha,t uray be i:nlclafccl to Airbirb lxrt ali a{l'ect, neighln'}ri:orls rvithin a ciiY,
euch x; a. city-wide shock to ltr,bor productiviLy'
'fhe seconcl clioice, lrow to cieterrminc thc entry and exit d*tc of each listing,
(,o11re$ less naturally. Firsi, t.rur sr:ra,pitig a,lgor:ithnl did ntlt ct:nstantly rnonitor
a lisLing's stal;us to clcterminc whether it r.l'as activc ot ttctN, but rrrt'her oJ;ti.rincd
snapshots o{ the pro;:t,:rly available for rent iri t;lte US a.t dif{srcnt lrointii in
tirle liri,il drc <xtd of ?0.14. ancl :rt th<: rvctdciy k:verl starting irr 20,15. $cconei,
cven il it rlicl sr:, m*lsuring aci.ivc: srrgrpiy rvould still hrl r:lr:r,ik;rrging'11' .'Lhus,
i,g 111sl,ruct the n.uubel cf lisiing;il going bath in tirne, we ernl:loy a varici,)' til
urc*lrsxi$ fi:llciv"'ing Ttervah *1, n.l. {2017),.w}ricir }'!'c lilllllll)t}tize in'f!r,ble 1'
laAirbnb dncs rcpor.'t the li.Liitucl* a,nr1 lungilude ol oach property, but r:rnly trp tn aperltirbation of ;l ferv hundrcci rneters. So il would bn p<issihle, trr.rt rxxnplicai;ecl, to aggre4ate
ihe lirrtings {;o fincr geogrnpirics wit;h sotrrt'r crror'i6llstimating ther nurnher r:f Lct,ive lisl.ings is a. <:iui,llengc cven foL AiI'lrnb' Despite the
l*ic{; i,lirrl Airbrrb ofl'r:rs rut i:ir$\r wiiv io uitli,tl Jrrcll}t}r1;i{.fi, tr.ir.ir;1" tirnes ltcislr; rtcglcr.ri; 1;o do
scr, r:rez,riilg "sta.le va{,&.i1cics" thai: secr,r a,r,ailab}e fi:r n:rr[ brrl iu actualit-t' are noi. lrrati]titr
Q:1;r), risirrg propriettr.rv r-lata, 0irrn Airhuir, e-qtitttates thaN l:etwcen. 21t/<t to 32Ta tsf gw:st'
rr;qr;-i;rrits elrc rr':jcctecl tl.rrtl io tki.; cll'rrr!;.
15
D000343
FILE
D D
ATE:
6/2
1/20
19 6
:51
PM
2016
CH
1548
9
Tabb L: Methods for Cotnputing the Nurnbel of l,istings
Listing is considcred active
Method IMetheid 2
Mol;liod 3
sta.rting frorn host join datefor: li rxrntln altc;r host join dzr.te, and after evcr), guest r<;view
for 6 months *fter irost, jtiin ciz*e, and aftr:r evcry guest review
Nf<;thorl 1 is our pref'errecl cht.rice to measrlre Airhnb supply and. will be
our main independeurt, ver,riable in. all the anal.r'ses pr-uscnt,crl in this ptlper.
T'his mcasure compuies a iisting's cntry riate as tire da,te il,s ir*si; registered on
Airtrnb a.nd a.ssuutes ihat listings never exit. The advaritage of using the hr:st
join datc as the entry date is tirat fcrr a, rnajority o1 1i*rttt14s, this is the mi-rst
accurafe firea,qure of u'hen thc lislirrg r.vns firsi. llosted. illhc disath,a.ntager of
this rnm,sure is that it is likcl]' to overestimate the listing:s tha,t are available
on Airbnb (a.nd i;rx;epting rcservations) at an,v poirtt it tims. Hoil'eveL, a.s
tlisexrssql in Zerrus ol rr.1. (201"7), such civelestims,lion r.r'oirlcl ca,use bia,sels ouly
if, a,{{;r.;r coni,rolling l'or severnl zi1:exrcle c'}ia.ra{;{;eli.itici;, il is *orrela.teci rvith the
crror ucrnr.16
A.,vale of ttre fact th.a,t nretircd L is iur irirpcr{ect menslll'c of Airixrli tupply,
rse also expcrimcnt with altcr:na,1;ivr: dt-rfiniticns r:f Airtxb listir:gs' entrv and
exit. h,lethods 2 arrrl 3 exploit oril hnowiedge of each listing's revie'uv tlates to
determine rvhcthcr r:, li*ting is ar:tive. 'llh.e beinist'ic wc ri.ge is a^s folkrurs: *Iistin."q enters thc rni-rrkel. rvhei: Lhr,: l:osl rsgistere witir Airbnb anci l*tays acti.ve
for ur, rnonihs, We refer to rn as th.e listingis 'I'imc'lb Live ('I".|'L). llach titrre
a,Iisting is teviervecl Lhe T'TL is exf,endrxl l:3'itr moribhs from the revielw clatr:.
If a listing exceeds ti:e 'I'T'1, without, any rcviews, it is consirJeretl irmclive, ;\listing llecornt;s aciive again if ib rcr:eivcs a llew review. In exu a,ntrlysis, wg
iest fwa differeni llTl,s, 3 months and 6 rnortths.
16'J.}leabsenceof bir.r^siut;lrii;ryr<-'asur<,.isa,lsar:cnfirrietibylb.rrona,Loe.rrrl itadkiu (201It)
where u*in5; Airbnb propicta.ry dilta."resnltetl in ths: iianre eslimatts ol:tairteti by Zen'a,* ct u,l.
{2ti1?)(r'hcrc i'lic daia, colleclk;n itnd nx,:asures of Ailbnb su!pl.r" a.t'c :iiruil*.r tr: thoxe usod
in thi* papt:r:).
1"0
D000344
FILE
D D
ATE:
6/2
1/20
19 6
:51
PM
2016
CH
1548
9
Despitcl tlr.e ftrct that our clill'erent lnetr^$ure$ of Airl:nb supply rely r:n dif-
fer<trit lrcur*isi,ics ancl da,ta,, becanse of Airbnb's trernentictus growth. all our
rlca$ur.e$ of Airbnb supply alc cxlrcurcly cxllrelatcd. The cot't'clatjr:n bcbwcen
methr:d 1 and each other rnea*ure is abi:ve 0.t)5 iii e,ll cnses. In the Alrpendix'
we pte"{iefit rolirsi;ne,gs c}r<x*s of our rnilin resulls 'iet tlrr; dif{'erent rneasurels nf
Airbnb supply disc;ussed atrove, and shorv i;hat ::esults elle qualitativeiy ancl
qua:rti tatively unchangecl.
S.4 Zillow: rental rates and house prices
Ziik:l...cr:rn is ar:. onfne real eslate company that providr:s estinrates of hclustl
and rent*l prices {br over 110 miilion horr:.es fi.r.ro$ri tire Il.S. hL adclition ta
giving va,lu* rxiiu.r*es of hontes, Zilk>w pror''ides a snt of indexes tirat track
a,lcl predict; hone va,lues nnd rentrr,i prices at a, rnonthtv lev*l a.nd at dillerent
geogrn4:hical granuiariti es,
Iior horne p::ieres, wo rrr)c: the Ziikrrv l{<jme \ralue Index (ZIiVI) which. esti-
:nates tlte rrteciia,n transaclion price for the actual stock of ltomes in a giv<xr
geograpfuir: rrnit a,nd point in tin:e. 'I'hc acivlurta6le o{i using lhe ZHVi is i{rai;
it isr rr,wdiablc at tlte zipcoclc-rncttrllr lcr/{:i terr over 13,000 zipc'i:dci;.
Ilcrr reltal nnce,$, we uee tire ZiLlav ll.ent lntlex ZI\I). Like the 7,TM,'AiL-
Iorv's rernt inriex is meant 1,o rellect tl:e rnediarr monthly rtxtal ratc for iire ac-
tual stock 6f homcs in a gtxrgra.piric unii and ;:oint in tintc. Crucialiy, Zillow's
rent index is [a,se{ r;n rcni;ill I'ist ytrires and i,g therr:fore i} rllca$ure of preVail-
ilg relts for ncrv tena.nts. f his is l,he relcvan.i r:curpzrrisoir for a' homctlwltelt
eicri<lir44 wlx*llulr to pla.ce hel iurit r:n l.hc sh<ri-tcrrn or lang-l,enn narkel.
h,{orcr:vcr. btxlause Zillow is not corrsidered a platlor-m for fincling sltort-term
housing, iim ZII,I should be refie,rtivc of renta.l prices in the lortg-term marircL.
3.5 Other clata solu.'ce$
Wc supplenrerrt tlie al:or..c da,ttr. witir scvcr*l additionai soltr*er;. Wc use rnonihll'
Gr:clgle lfentls dLr.l;a for the'sci:,rdt Lc:rrn "airbltl-ru, lt'liich lve dol'villcladr:rl di- '
rectly ii:orn (jorLgle. 'l'hirr in<lex lncfisurc$ ltc,rv ofien pcuplc ra'orld*'ic1e selcr,rch
77
D000345
FILE
D D
ATE:
6/2
1/20
19 6
:51
PM
2016
CH
1548
9
fr:r the terrn "airl:rlb" cttt Googl<-., a,r:d is lorrnalizecl to have a valttc of 10{J
at the peak monfh. lVe uso CouriW Business Jlatferns dat,a to tnea"sure the
nurnLrcr of csta,l)lishlirents iti Lhc food selviccs a,nrl acjcomlllodt),lions indus|l'i'
(NAICS c<:<Ic 72) fr:r r:ach zipcocle in 2010. \4/e coiled; frcirn the Amcrican
Cornmrxrity Survev (ACS) zipcorie lev-el 5*v<nr cstima,ies oi media,n irouschokl
i1cl:nre, poirulation, share of 25-tj0 years old with l.:ncltelors' clegrees tlr higher'
ernployrnell rate, ald owrter-occupancy rato. FinallS', we obta"in artrtua.j. l-ycar
estimates of housir4l racallcy ra.tcs at the Corc llixed Stati'qi;ical Areii (CBSA)
klrrel frorn the s*rne sour{)c.
3.6 Sumrnary statistics
Figgre 2 shtnvs thc geographic distlil:utir:n of Airhnl: listing;s in .Iune ?011
alrl ,iur:s 2016. The rnap shows sigriilicarit geographic lteterogerneity irr Airblrb
listings, rvitb rnost Airbnb lislings occurring in ialge cities a,nd along the coasts.
lVfr:rcover, tlrere exisi,s significa,ni geographic hcterogcrteily in the g*rot'th c.rf
Air:brrb ovcr time. Ilrour 2011 {,o 201"6, tltt: nurn}:er of Airbiri: listings in some
zil:cct{rrs gr*w by a, facfol of 30 r:r mt>r't:i iu othcr,s t}lere rtn,s rio growth ir,t, n.[1.
Ifigur:e il slmwi; tirc tottr,i rinmber cf Air:lrnh li,rtlngs orcli;irntr in our dafas*i
usi:rg mcthods L-iJ. Usiug mel,hod 1 rm <ruL lireferled melhocl, we ril:selve t;l:ai:
lrorn. ?011 to 201S, the total nurnber of Airbnb lisiings greu, by a facteir of 30,
rcaciring over l. million iistings in 2016.
'ihbJ.n 2 givcs a. $rluse of the riar,l of Airbnb relative tr: thr: horrsiag stoe:li a,t
{,fue zipc:ude level, fr:r i|1e 100 largerst cIlSjAx L:y lropuiaiil* in orn: clltll. svr,rrr
in 2016, Airbnl.i remains n snrilll perceil.tase of tire total hcusing si"ock fttr rnosf
zipr,:odes. The rneclian r:atio of Airbrrb listings i;o llousing stock is 0.i11%, anrl
the !]0{,h perccrntile is i.B8%. Wheru cr:rnparing tr: the stoc}i of vacallt: hornes.
Airtxtb iregins tr: a,ppca,r more siguilicaui. 'l'he rrttdiart rntiti of Airbnb listings
to vacant ltornes L- 2.63%, ancl the 901;h irer<xxtilc is 20%. Perhaps tho iuost
salicnt comparieon--at, lclas{, frorn t}re per*ipectivr: <lf a potential rentcr'-is t}ri:
lLtill:tr of Airl:l*> ilrl,iilgs reltrtivc to {,hc si;rrck ttf ltsr:ttcs listcrd 6it v;r*.rni' l,tid
for rcnf. lfhi:; statisti.c reurhes l3.7%in thc rneclialr ziJ:cr:ttc in 2016 nn<I "t29*a
18
D000346
FILE
D D
ATE:
6/2
1/20
19 6
:51
PM
2016
CH
1548
9
in tlre g0th per:ccntile zipcocie. 'I-his implies that in the mtxliair zipcocle, a local
rcsidc:rt lookirig fbr a longl*tr:rm reutai uniL will find that a]:out 1 in I of the
pettr:nti*lly ava.ila,blc ira:nes a,re lieing pla,ceti on Airbnir instcacl of being made
availabb to long-terrn resideirts. Frarnecl in this 1\'&v) concerrx a.boui, i;hc eflcct
of Air"bnb on thr; l:ousing markct do rtot lrl:irea.t utlfouncleri.
4 Methoclology
Lt>t, Y;"1.l:e eit,her the i:rice index or tlx; rcnt int-lex for ziptxrde a in CBSA c in
y<lar-nrcntlr 1,,Iet Ai;rtt'n1.r6.1 }:c a, rnonstffe of Airllnb suppl"y, aricl bt ott't"ateir,2111s
be the owner-eccupancy rate in ?01-0.1? Wr: a,$sunre the followilrg ca,rrsal rela*
i;ir:nship betweea Ya,s &tLd Airbnbi.*s:
lnY,*: c] * /)Airtntha6 1' ^7Ai,rbnbe"6 X o{)f'a,t(4c,201{) *- Xi,:s?} * f,211 tlz)
u.he;-e )ir* is a yecLor of obstlrvecl tinc-va,;ying zitrl<xrckr chil,ra,cleris|ics, nud
{.;.,i 0oniaini; unobservcd iir,ctors which rna-v arir-litiorrallv in{hreJ}iJc Y."6. lf the
uncrbscrvul hr,r.:turs tl.i.'f rlrir:ol"l(:]laled rvitli Ait'tntba,1, exrncliliott:Ll r:n X;'r. then
w{! rji.)Jl c*nsis{,cutl.y esl,imaNe li aiicl '1 l.iy Ol,S. }low*t'ct:, r;31 ill}tl .Air'futlsi*1
may be *rlrelat*'rcl through u:robriet"\ted fnct<trs a,l the z"ipr:ocle, cii,.y, a,r.id tirne
levr,ils. We s,llou,r 6i,i to cc;tLl*iir unni:servc<l zipcrsdr: level fn,ctoril di, autl ttn-
r:l-rscr'\.'e(1 titue.-r'ar;'itrg facri;oi:s tJra.t a{Icr:i all zi1:corles ri'ithin a' CBSA ct1ualiY,
#,,y,. lVr:itingl cict ** bt.4- 8,* "l't"r, k)quni'ion. (12) btxxxrxrs:
luY,;"1.* tx*!3A'irbttbt"t"l^iAi'rhrt'bi,tsx.oQ'r'a,tr:i,.p6ro*X;,,rrl-i-6;-i-fj,,r*(i", (13)
Even after r:nn|rolling for unol:s*r'vc;tl fi*tars a.t tJ:e zilrcodc ar.rrl CI3SjA-
year-nrontlr ievel, there rnur,y sli}l be some unobsen'erci zi4trnd,e-sytrx:it'ic, tinte-
au,ry'irtg factols coutaiucd il {11 t}ra{ are correlated rn'ii}r Air"ttrtb;r,s. 'Ib ac}dress
17$ir: use ihc ilrvn*r.qrc{llpnt}c5'raf;e in 20i0 tr; nrinirnize cor}ccrns ill:orrt ti:trtlc'g,t:neity olthc ownc'r^6cr:lpancy I'tr,fr:i. {n Nhc A,1rp*:ndix, wc *liow i bn.b the reritrlls lrr"e rrtbusl to u*qinl{ t'hc
cxrttl;enttrlora.nr..oull ou'irerrt;ccupar)oy ra,l<: r:a,lculi,:,i;ed iipnr ALI$ 5-yea,r estirnates frorn'2011 i.o
2il1G.
I (l
D000347
FILE
D D
ATE:
6/2
1/20
19 6
:51
PM
2016
CH
1548
9

this issue, we r:or:$tru(:t a.n instrurncnta,l va.riable t'hic.h is pia,usibly uncorre-
iated rvith loca.l shocks to thc housirig rnarket a,N tirc zii:code ievel, {i1' }:trt
liliely i,o a{fect the lurmbcr ol Airbnli lisi;irrge.
Our instrurnent begins with the rx,.orldrviele Google'I}'encls search inclcx for
tlx; t<xm "airbul;l", C1, which meaiiules lhc qua,ntitly of Google sealclies ftir
"airbnb" in 1'er:''-rrrclirl,ir l. $uch lrencls repres<;nt r) nletl-sure of iln extent {,o
which a.\rrzrcne$$ of Airbnb has diftusc:d to the public, inchrcling b<ith derua,n-
ders anct suppliers of short-terrn rental horising. Figure 1 plots g; frorn 2008 to
2016, a.nt1 it is representntive of thc cxplosive grorvth erf Airbtrb r"rver the past
t*n yearii. Cnicially, tire scnrch index is not likeiv to be re{lectir'e of grorvth
irr overali tourism deinixrd, because it is unlikely t,o havc r-:hanged so rmrclt
over tliis reiatively'short timc period, N'loreorrer, it shorilci noi be r<ilectivc of
overn,ll grorvth irr the suppl;r of shorliterm housirtg, e:ecept to the cxtent that
it is <iriven by Airbnb.
I'he C}3$A-Siearrnonth fixe,cl e{ftxts 0.6 alrearly a.}rsorb a,ny uno}:served va,ri*
ati6n at thc venr-noni;h levcl. Therefare, to cr:mplcte our instrumeiil; rve itlie;ra,ct g* with a rnerrrillle cif how atlt&ciive a zipeoele is far tcxrrists in basc
vear ?010, lrt,roio. \\ic rnc:txuro "touri*tjncts" using litc rtutnber of ei;t*l"rlislt-
ux:nLs in tht lcod serviees and accogunoda,tior* irxiustr:y (NAIalS rrt.rrlc J2) i11
;r sir*t:i{ic z,ipcode, Zii:cotlcs with morc lcsi;ir,urants a.rtcl }rotels rnitv be rnore
atl,xxtivc l<l tourists l:eci,ursr,'thc:sc ;r.rc sorvices tlis,i tourists trr:eti to collstlr;ls
locrillr.*-lhus, it ura{,tcrs liow lululy of t}r.ese services Are llear t}io tourist's place
ol st;,rv. A.lberrratiyehr, t;hr,r larger nurnber of restaur*,nts ancl h*rels rnay reff.ect
an irndrrrlying local iuitclrtitrY l}'ti*f t'nurisl,s v*luil.
Orrr r4rern,Ling assurnption is Lhnt la,ndJ.orcls in inor:e tourisl;y zipcndcs a,re
rnorr: iikoly tr: sradtch from the lonp;terrn ma,rket to the sirolt^tt'rmr lria,riret, in
r1;spotltie ti.r iea,rniu.g a.bout Ailbnl.r. j.ancllords in utort) tourist.v z,ipcorlcs n:ay
l:e,-r rnorc iikely lo sivitch beca,use thcy cn.n lrooh thcir: toolll,$ ntore frequenill,,
a1d at higher prices, iha:r in non-touristy zipcodes. \&'e can verify t;his assuntp*
i,ioir by exarniuing, ths rclationshil.i bctrve*rt Cooglc trcttd$ artd lhe dift'erence
in Airbnh listings fr:r nore tourisN5r and less to.uristy zipcr:rLrs. i"i'igtlre 4 sliorvs
tJur.l sllrr:h dj{fcrr':rrctl iucrLc;,rsc:s ns Air:ilnb itlvarci}csfi increasem urnfitinittp; ottr
2A
D000348
FILE
D D
ATE:
6/2
1/20
19 6
:51
PM
2016
CH
1548
9

iryJ:oihesis.
Iri orcler ft,n' ihe instrulrent to be ral.id, zict * 9t x lti,zgut must be url.corro-
latc{ with thc zi1-rcode*spr:cific, tims"r'aiying s}rr:cks to t}re llottsing rnarkc{,, $,1.
'llhis rvolirl be tr"ue if eith*r: erx-a.lrtc toriristirrcss in 2010 (/t,ro:o) is inclependenl
ol zitr:tcde level shocks ({i,r), or gt'owth in n'orldwicle Air:hnb sca,rc}tcs (gr) io
independent of zipcode lex+l shocks. "Ib sce horv our instru:uemt atlcbesses irr:-
tenl,jal confrrun.cJing factors, consicler clranges in zipcode level crim<; rale as an
omittecl va,r:in,blc. It is urrlikr,;ly t;ha{, c}ranges to crime ra.tes across aii zipr:odes
a.re systcrn*r,t;ically corr:elaied in tiure u'itl:. worldwide Airbnb sea,rciras. Iiven ifthey u,<;re, t).rey woulcl have to correlatc in suc'h o, wll,y that thrl cctrreiiliicin is
slrsi;ernaticaily stlorrgcll or rverlker in rnolc touristy zipcodes. h'loreovel, these
}i:r,ses wouki have tr: be systcrnai;icaiiy presunt within all cities in r:ur su,mpie.
Of cc-iurse, \1'e cannot rtile this possibilitV out complciciy. 1&r: t?rcref<xe norv
turn to a cleta.ilecl discussicin of ttre insi,rument anti its valkliq', a,ncl preseni
iiorlr) $X{rr'(:iscs tha,t suggesl, that the exogeneity a,ssuurptinrr is likelV satislied"
4."I l)iscussion: Validity of tire instrumental variable
'.1.'.[rr.r r:ons1;n:ction <tf ilt irislrumettl,a,'l vai:ia.l)]c rtsirrg tJtt ini,craction iif. .i p]ausi*
bi.y t.:ragenous tirne-su:ies {Googlc trrnek;) rvif}r a triolerr*ialiy endogcitttts crc}slj-
seciionrr.l expo$rire variable (tire touristiness rncnsl-tre) is n,n n,p;troach bhnl rvu^s
y:olinir:r,rizcd l:y l3artik (199i) a,rxi lhat has been used in n:irl,ily pronine:rl re-
ceilt papefs (Ireri (2012); l)ube iirxl Vrt'gas i201i)); Nurm i,rucl Qia,n {?014);
.Hanna;urd Oiiw (?01"5); I)iaxrorxl (2016)). '
'lhe npplor.rrfi is popular bocttuse one c:al! often argue tliai some ag5';regttte
tirnc trenrl, r..v'hich is exogeituns to iocal conclitions, rvill affs:t difl'crent spatial
units s-vstema,tkaliy along sorne cross-sectir:ntil exlrosure r,'ariable. Ilt tltc clm-
sic IJrutik (f 991) cxa,rr:ple, naticnal i;ri:nds irr itrciusir.v-specific prr:cluct;ivity a.re
iutcra,ctcrl rvith the historical local intlustrS' cornpclsition ir: crei'r'tc an instru-
nrcni {bl k:cal labor rlcrnaind. Sucir. inttmurent r.vill be valicl if ihe interraction of
{;}rg a,gglega.tq: iim* t,rexrd wi1,h thc <,:xprrsrirc vn,rintrlc i.s int}cpcrttlctfi, etf t}te error
tenn. 'flhi* <xxrld ha,ppcn if citircr the.ti:ne irend is ittcicptueleni;.of llte u:roi:
,)1
D000349
FILE
D D
ATE:
6/2
1/20
19 6
:51
PM
2016
CH
1548
9
teun (Jl[g;,{."r] : 0) or if the exposurc variable is independent of tlte error
tenrr (E[h;,:oro, {,i.*] * 0). Wtrile lhis rnay seem plausibk: at firsi; glance, Chris-
tia,n and Ba.i:rer;t (2017) pairrt out that if there are long-r-uu tirno trtlnels in the
error terln, and if these long-run trends a,re systrlrria{;fually difler:er:t along fhe
exporlltc variable, i;hen the exclgeneii,.y assunrpticrn rnav 1'ai1. In our context,
a, siory tha,t rn:iy be told is the following. Suppose i;here is a long*rtm trend
towarcls gc;ntrification, witich leacls to higher house plices over iirne. Sup.
pose also iliad the t;ren<i of grxrtri{ir:al,ir:u is higher in nrore touristy zipcodcs.
Sigce there is a,lso a systernatic long-run trencl in the tintasci:ies variable, 91,
tlre instrun:entr E1hi,2s76 is nr: longer independent of fhe erl'ol tcttlt, and ZSLS
estirnates intry reflctl; tlre cifr*ts of gentri{ication ratiter thari }rome*sharirtg,
We now proceecl io nra.ke four i.ri'gurnents fcrr rvhy the exogeneity cr:nditioir
is likely to holcl in our seiting.
Parallel pre*trenrls
As Clirisiian and Barrett (201.7) noterl, Lh* fivst sta,gt: of this iustrumerrtal
varia,blc il;.r;:r:o:rch is a,rtalcg',ctus i;er a di{lbrt;nce-in-di{t'crcnces (DD) cocllicien{;
esti,rn.r.tes. In lur c*se, since iJr.e s;:eerifir:al;ion includ*s,yerru'*:nonth arrel ziirr:ot*e
fi.xcd effercis, the varinl;ion in itrc insfnurrt:lrfi (:orlle$ frorn co:ttparing Aill-rnb ]ist-
ilgs beLween high.- and low-Airbrrll elwalc[ess year-mcnths, and b*i;w"cen l.righ-
ancl low-tourisi,incss z,ipc*cl*s. Ilecause of Lhis, Clhr:istiarr anrl llarrett (201.7)
.luggclit testir4; rvhcthrlr sp*,lial units rvi{Jr c}if{clent levels of the exp*sure t'{rri-
n.[ln iravei parii.llel trerxJs in periods l:*fore g1 iakcs efi*ct. 'lhis is riimilar i,o
i;*;[ing n'het]rer c:r:n.trol a,nd treatmen| groups hnve parallei pre-trr:ncis in Dl)
l.lalvsis. 1r do Lhis, wr: 1:lot thc Zillow liouse price inciex far zipcoclus in dif-
{ercni quartile$ of 201i} toruis;tiness ([r,royr), froni 2009 to the r:n<l of ?0]-6.18
Tire rtxuits are shown irr Figure 5. Tire figure shows that tlrcre are no dif-
ferentia,l pre-i,rends in the ZiLLaw Home-Vah"re Index (ZHVI) fcrr zii:code*c irt
diftere.nt quzrrLilcs of tour:istin<rss until afterr ?{}12, r.vhich also }ra,ptrrens to bt:
v;heu intcrcsl in Airbnb l.iegan tc grow a,ccor<{ing to lrigr.rre "1. llhis i.q trtt*
lli\{ib cannot repeat tiris exei'r:i*e wil}r r:cnlell rn,tcs l:ex:rluse 7.illo* rtNr{la,l prirn data <lirl
nof. beg,il rrrri;il ?011 ar 2012 {r-rr tno$t 'ripcr;rli*.
1r)
D000350
FILE
D D
ATE:
6/2
1/20
19 6
:51
PM
2016
CH
1548
9

troth whcl computing fhe rarv a,vor{r{lcs nf ZilTYI witiriri c1uafl;ile (top pancil)
an{ w}re1 compul;ing the average ol. t}rt': r'e-"iduals after controlling for zipcode
an<I C:i3$A-year-rnonth fixed effcct"- (bottom pa,nei). T'he laclt of tlificrential
pre-brencls suggasts th;rt zipartie^s with di{fererrt lcvels of txxrristiness cio nof
ge;imrrJly ha,r'c diliirrtrtt lr:ng-rutr house price t;rentls, btri; they oniv bega.r: to
rlivergc a,ft,*v 2A72 wltcrrr Airl.rnb s{,artecl to becovnc weil knor,vn'
Placekro test
'l lie al:ove test is not pr::-fectl, utirer:ially bcr:au,se 201 2 lia.pperx; to ber the yeal ln
whic|. house priccs bcga,n l;o rec:cvnr fium the Great Rece;sion, Becausc o1'this,
it is possibie that touristv ziltcodes have a diffrlrrlrrt recover.v pattern iltan nolt-
touristy zipcocles. trVe therctbre cr:nsitler a secorrcl tesi to support the valiclity
of thc irrstlurnent. F'.oc&ll llttr{, our. innftunrontal vluinbit rerliss on the a;surrtp*
tio1. thal increases in Airbnb a,warencstr (mex"sureci usiug Google trends) wiil.
differegtia.ll"v *fi'ect 1,1're numl:cr of Airirnb lisiings in high-tourjstincss zipcodes
ancl in lou'i;<;uristincss zi1:trock;s. Iitrlltrrvirrg Chr:istian ii,nd Barrett (2017) we
iplplerrreirt 1r form of rrrnclornizatiou infelcncc t* te'qt whellter this Nype of in-
stprrn*ti; is rci:,lly cxogcrlous. 'J.'he idoa. irciilutl tJris te*! is tha* lry randoniring
the cnclogcrr,:r-rs varia.J,rJe r:f inicrn-qi {i;be nurnbcr oI Airbnb lis{ings is a specific
zigrcock:) while hoiding ccxrslanl c;vcrylhing olse shoirld elilninatc (or *t lcast,
atterruate) the causal cfl'er:t o{ Airl.rrrl,r'
'lll dr: fr{l we kcrqr cc;tt*ttrnt ir:urjstin**, (Joog'le trendii, ttre zi;lcodm ex-
lxxiencing; fllly Airilrlb erttl,ry, observirl.rle time-l'a,lying zipcode characteristir*,
hgu*in.g rn$,rkot lnriablc,*, :ur.rl the aggreg*.rte ntrmber eif Airbnb iistin.grl in ertry
year-rntilth perioil. Hrnvev{-x, arro}rg the: zipcodcs with positive Air}:ti}: cu-
try, we ra,nclornly erssig:r tlie spccific riuinber af Airblrb listing* amt':ng ihese
zipcodes; ft.rr exar.npltl, we ranrlornl}' &*si*tr to zipcode i thcr r.'ariable Ai.rtmb;;,,t,
(i.e,, i;he Air|nb counts c;f zipcxxler r ol CIStjA c for evcr)' 1. spa,nning the periocl
frorn 201l to 2016).
Note tlu.* thiii ncw ria.t,s,sri stiil 1;reserves posuil:le sources cif cncir:g,*cncitv
sucli a,s.zipcoclc,: touristilress a.ncl sp.ur:ioris timo trcirxls; ltorveve.r, tlie randr:miza.*
ijorr clin:inn,i:its il ur;i,irr #{)lirc{) r:f vn,ri*ticltt notxl.trrl li:r our instlurttr:rtt tu rvork
'lt/:t.)
D000351
FILE
D D
ATE:
6/2
1/20
19 6
:51
PM
2016
CH
1548
9

J:eca,use now it is not necessarily the r:asc tha.t, for tlie sa,ure level of Airbnl:
awarcrte*i$, high-touristiness zipcodes ex;:erietrce strclnger Airbnb gr<irvth than
low*touristiur:ss z,iJ:cr:rJrx. This means lliiLl a 2S[,S e*;iiura.tc of thc elled; of
Airbnb u*ing tlr.is clata-soL shoultl prodr.rce rr:sult.t tita.l a,re irxiistinguishable
fi6rn zelru {or tmrc}r sna,llsl t}ran the estirn*,ttr* on t}re rcal clataset), unless
thsre is silrne spuri<-rus correlalion between the instruuient e,nd oul dependeiii;
varia.bk; (i.e., the erxclusiolt restliction does not holil.).
Wc cstimate ttre 2SL,9 sJler:ifi*riion otr this dataset ftrr 10tl tlraws of ran'
tlouriz,ecl allocations of Airhnb iistings alnong zipcodes, and lind that'the mea-
suted effrrt of Airbnb cornpletely disilp;rerr.rs fol all of our depenelcrtt r,ariablcs,
i.e., rent inclr:x, price inclex, a,nd price-io-Lcnt la,tir:.le 'llhus, ihis test stronglS,'
supports the vaiiclity of oul instmrnetrtr.
IV has rro efl'ect in non-Airbnb zipcodes
Tcr further provitl* su1;port to the vrr,liditl' of our instnrment we porforrn iln*
gtlrct ttxt which con$ist$ of t*xx'kinil rvliel,hr:r the instrumtxrtell vp.riable i:rediets
house pricc,q o,rrd renlai r';ltes in zi1:corie;s thni wer*e ncver <lbservecl tc have anSr
Aitt;11!r listings. Lf lirs insi.r ument is rmlicl, thcn iL should r:rilv be cr:rrelatcrJ t<>
house prices antl i:enI;a,l ]:a1;{iri throlrgh ils c{fert on Air]rrrb iisbings, Eo in areas
with lo Airb:rb rve shoulcl tr.<lt sr:c a llositivc relatiorulril: l;etrveerr thc instru''
nrent and lurse ;:rices a,nrl rcuttr.l rates.z() Tb texf [his, we r*slerifr tlre T,illow
rent irxlex, hortsc pt'ice lndcx, *.ntl pric+: 1;c-rr:ni ra.tlo {oru: tlxee outcprntls of
iltcrciit) on l;he iustrurnenNal vnriable directlv. using only data frorn zipcotles
in rvhich wo llev*r obs,i.vvr,rcl a.n-r, Airhtrb listings. llnble S repolt* l,he results i:f
ie'f|sr lredi{ur esiixra,ile (starxla,r'd error:} ol /} errrci 1 are 0.1 ? (l .2S) arxl 8.7?e-07 (B.aae-07)'
for the rept, irrderx,'.23 (1.0S) nnri 1.51.1er06 (1.0ac-0ti) for tix.: price irxlcx, and -'27 i1.45)alrl 1.56e-06 (1.27c-0{i) for tbc pricc-to-rent raiio
?0?his exerrcisc is simila,r in spirit io an exr:rcisc perf<rrtncd in Mn:'t;in aud Yurukoglu
{2917) l,o snpport liro valiclity of an ins{,rurneut. In Ma,rtin artd Y.untkoglu (201.?), tire
clial:m{ lrosiiian of Fox |iewii irr i;hc ca.blc Iiric up is tsed ils a.n jnsl;rttruent i'or: ihe ef{ec{: of
Frta. vir:wcrsfuip on ]l<.rpr.rbl.ican volinSq. 'I'lrey shc:rv i]rill, tbc filt,rtrc cha.nttel posil;ion of F'ox'Nerws is lgt cor.rnlntcd rvitir ltcpulilicarr rtfing iu the tjr'r.e pet'iocls l:rerfore'F<rx Nr:rvs. 'I'ilis is
a1*log6u.s to 1s shor+"ing; thai onr instrurri*nt. is noi. q:on'ela.!:ul rvit'h'hor.rse pt:icr,:s attd rertts
in zipr,r<:ilt:s t'i.tlrr;ul', A irbrrh.
,.4
D000352
FILE
D D
ATE:
6/2
1/20
19 6
:51
PM
2016
CH
1548
9

t?rese regressions ancl sliorvs thr*, coltditiorrr'r,l on tlie fix.ed efJi:cts ancl z,ipcode
rlemographics, we <1o riot {ind a,rry slatistically significant relii,ti<inship between
Lhe instlurncnt n,n<l housc pliccs/rr:rital ra.tes in ziltco<les without, Airbnb. 11
arrytlring, te firtd that tlir:t'tr is a, rte.(tati,ue rr:la,tionsliip bt;t;weeri the ilstru-
rnent &nel house prkes/t'enLa.l rntes in zipcotlcs without Airl-rnir, thi:ugh the
estirnates a,re imprecise and the sa.mplc size is considcrai:ly rerlucecl when corl*
siciering only such r.ipcodes.2l Thus, tirero dor:s not sl:ein to he any e;virlerrce
thnt the insi,rurncnl wrukl tre positir''eiy correlated rvith house pr:ices/r<x.tal
raies, except through its efli;ci, o:r shrtrt-tcrm renials.
Robustness to the irrclusion of demographic controls
Of course, ihe *:,bove t+-qt, io sulrport thc val.idity of tho instrument is rxrt lter-
fect either:. The snnrplc of zipcodcr tiro,t ucvc-rr liod nny Airbrrb liatings mrlcl
be fir1{a,rnentally djfl'ercnt from ilte sa.rnple of zipccldes t}ral i1itl,22 Wc therqr
forc rnake onc {inal argrtment, t;r: support tiie laliditV <ll oul itt$i,r:umetr{,, whic}i
is ttrat the lcgrcssiorr rcsults r,t'e rvill tr;resent iu $jcc'{;iori 5 a,r* rr:rbusi to the
inclusion of zipr:r:de clcxrL<;gra,phir: chir,rnctcristi<:s. Beeattse the inclu<led de*
groglaph.ic cclr:trol.s {popr:ial;ion, hous*lur}t1. illt.:t'.inlr:. share of ceille5qc'ecllreat;eil,
and erirl:llayurent rntc) ar:o liliriy lxsit; rtrc;lstn'ctiltlllis of zipc*de lcvel econortric
cutcorne$, thcy an: likcly {,o bc higlil"v corrciated with oth*r trnobservcd fac*
tors th:ri afl'ect zilxxrde level liou:;ing rnarkeLs. illheir:fore, ihc f:i,r:t that our*
rr:sulis arc !:rot r:,{lcc,lcr1 by iJresc c*ntrc}s suggcs{;s tha{; il is unlilcely titg,t t}re
iirstnuue.rrt is correlaled with ':l]ter uilol:servcd zipcodc lcvel facbcirs that affect
housiii$ rna.rketri. 1ll* see llris, ccxr.qiiler thsi: story *,hcrul gentrlfication positcd
*|ove. If ihe relal.iexiship betscr:n Airbnl-r listings a;:rl ]ioiisc priu+s/rcxrter,l
rates is spnriously drivcn Lry gclrtr:ilica,l,ion. tlten one wouid expcct the esti
rna,tt-rcl eflexlt tc i:c rcduccrl once contLr:llirrg for neighborhoori icvcl inconre a,trd
r,xluca,tion; how<.:ver', sincc hhis docs irot lrap;te;n, gerrtrifii:l*iotl scx:lll$ unlihcly
tr: i:e a.n ornittecl driver ol 1;he '-csults.
zr]f wqr regrc*s itouse price* and rentril ra{:ell on ihe irtstrtlineirt ftlr zil:<xirl*s rid{Il Aidxrl:,lt'er firrd a posiiive o,rrrl sl*i;igdically sigui{ic:ariL rtlaliotrship.
'22lpclenrl, lt-bble a shows i.har lhere is a siJqrrificant cl.illererrr;rr'rr'ltrirr t:otrt1:rlring zi1:cocles
thgt rlixierlr,e<l llnd ix;'o'i:L *l-lsr:rvccl any Airbn!r lisl,ilrgs.
t(
D000353
FILE
D D
ATE:
6/2
1/20
19 6
:51
PM
2016
CH
1548
9

5 Results and Extensions
5.1. The elTect of Airl:nb nn hotrse prices a.ncl rents
We b*gin tx r*pclrting resrdls in which Airbnbi,"T is rtea$urertl as thc log of
gne pfum the rurnber of listings as rueil$luo(l by rnethod 1 in'Ilrbk* 1.2i1 l)oing
so. \ve estintate a specificat;iolt sitrflat' to tlrnt used iu Zen'as eI al' (20L7)
ancl Farrona.to anrl Fradkin (201.3), rvhele the a.uthors estiml*c thc impacl, of
Airlrrlb on the h.otel irrdustrv,
lVe cronsi<ier tiree dependent vir,riables: the log of tix.r Ziliow Rent lndex,
t;he log of tho Zilbrv llome-Va.lue Inclex, a,nd the krg of tltc plice-l<;-rent ra,-
tio. In clrcler tc rnafuitain. ouL mea"$tlre of tourjsthse,ss, h,i,2s116, &5 & pre-periocl
variable, only <iata from 2011 t,o 201(i a.re usccl. This tirne frame covers all
uf tlie trrerio<I of significant growth in Airbrrb (tce Figure li). \\tr also include;
oniy data from the 100 largcst CBS/Ls, &$ Irea$uled bv 2tl1tl pr:prdatiun"2a
Since the regressiop i:r ltrqua.tion l-3 iras two endogenrlu$ regre$sarc (Airbnbarl
antl Ai,r'ttn,ba*1 X oeI'(r,t*;c,2010)r i,rva instrurnetrts are usecl frrr the two-stage teast
$quilre$ estirn{rfiott (.g1 x /t;,2n10 ar:.cl 91 x /r;,zoro x r1aro,te;",21116).
1.h,blc 5 r*ports the rctrqr*snio.n resulbs whcl {;ire rle1:rcnrleltl, r'a.riat:le in ihe
log fii.ifu:w rt;ut irrd*x. {lolunn I repr.rri:.: i}n results &'orn a sirnplc OLli relims-
sioir of log- ZIU on log listingu and nc conlrr:ilr. \\rithout conirols, a 1% ilrc:reatle
irr Airbrrb iisl,ingx is asscci*ted rvilh a tl.A\S% inclea"se i:r nxrtni rates. Col-
gmn ? intdurtrcs aipcode an<l C)ll$A-;'eo.r-rncutth lixr:d efl'ectil. Wit,h the fixed
cfTects, ilrr: gstimri,l;ecl cocfficierrt on Airbnb cleclines l:Y nn orciel of nagni*
tgcle. Cjoluxrn lj ittclucles ihe jnl,eru:tir:n of Airbnb liriiing* with tim zipcr.rcle's
owner-ogcrilpri,ncry n*e. Column ij slTnws thel ir.npcirl;rnce of controlling for
owler*occLlpancy rd,te, as it significarrtly metliates the eft'ect of Airbrrb list-
ings. Colurng 4 inclueles tilne-varyiug ziircr:de level cha.lrr,cL<llistics, iuclucling
i;he log tota,l population. i,lie log nrcdian household ittct-tttte, tite share of 25-S0
2a\4tj,r add <:r:ur to thc nurnbr,:r of lislirgu Nr: avr:icl {;nliing }<lg;s ol zero. In t,he Online
Alrpeirelix, r,g) xlrow thai our rcxulig arr: xrbrrs{, lo rirotrrping obscrtal:ious r'.'il}r 0 listirrgs arrr{
rrsing tri(iis{;irtg*) irrsNtxd.,dltru tOti largr:st Cil$As <ixrslillutr: t;he majolitv of *liri:rib liiitings (ovcr 80%). ln the
Onliur: A1i1r*ntiix we slx,rw fir*l our reuults t.rc r*lrtt*-t to 1,h* inclrrrli(rti oJ: h'tilu] CI3liA*'
')ri
D000354
FILE
D D
ATE:
6/2
1/20
19 6
:51
PM
2016
CH
1548
9

yea.rs old rvith Bncirelcrs' clegrt:es or hiSher, artd ti:e eurploymerii rate' Br,r-
c,,rusr;: thcsc nle?Lsrlres are uaL asaiiable at a rnotrthly fi'erlucncy, rve linca.rly
interpolate thcm to thr: runthly level using ACS 5-year estirna.tes frorn 201,1
to 201"6.25 Coirirnn 4 shows tlrat thc rr:sults n.re robust to the incltnion c"rf
these zipcorle cierraglaphics. Irinail.y. coluntrrs 5 ii,rr<l 6 report llre 2SLS re-
srilts usirrg'llie instrumental variable rvitlmut and with time-varying zipcode
characterislics as contrrols. Using the results frorn column {i -- otr prcforretl.
spccificatiorl -- we estirna,tc f,ha,t it 1% irtcreasr+ in AirbnJ: listings in zilrcodes
wiih th.e meclinu owner*occup&ncy tate {72%) lea,ds to n, 0.018% iucrease in
reriis. As plrrlicied hy our rnodcl. the effect of Airbnl: is signi{icanbly <k:clin-
ing in the owncr*ocr:up;r,ncy ratc. A* lt$o,4 owllel-oc-:ctlpirncry latc (the 2$tli
percentile), i;lre elTcct of a 1% increase in Airb::b iistirrgs is to increa^se rents
bv 0.0247*, and ai 82% owrrer-occlrlp:l,ilcy ra.te (the 75th pr:rcnritilcr), thc c{fcct
of a. 1% increese in Airhntr listings is to ilcrt'casc rcrits lry A.01.4Ya.
'Ihble 6 rc-peats lhe rcgres*iions willi the log Ztllou'hou,*tt price indcx a,s
the ilellen<1cn{; variablc. As -lvith t}te renla,l rfi,tt':sj. lt'(: lirtd. l;}ra,l cantrolling
for oqrrer-t.rcclilllarrcJi ral,e is verY irnl:ur[anl;, ;ts L]rc i;stinal,ccl tlireel eifs:i of
Air:lxrl; lintings incn:ixes iry an orcier of ungrrifudc wlten conlroiliug for tltc
interaciion vs. nr:t. I\rther, inr:luding cieutogrn.phic cxintriils still ilocs ttot
afftict tlm resnlts. tjsing thc r:cellicienis reportecl itr colurnn ti of 'l*bb {i, we
estinrnt* i,lrnt a l% imrrer:nc in A.irltir.li li*Lintr;x k*r{s to *$.{l?ri<% increase in
|cluse i:riu,ls lbr a z,i;:code with a rnsdiilit owller-occtlp;lJlcy ru.tq:. 'I'h* t;llect
increirsen to 0.{)37% in zipcodes witir an owner-oc(:uptrlr(jv riri.r: eqrtal to tlre 25t}T
i;*rccptile, i,r,r:lil ,lr;cr*ages to ii.tlli]% in ziprxrilt* t,'ii;h li.ti {i}vllcl'tlrli:i11:a;1c3" I'r:,t<>
ecpral to the TSl,h percentile.
It is worf\ noting the;N in botir tl:e r*nlal la.lc a:rd ltot:sr. pricc regr:ssions,
the 2$LS c,stirnates (colunrn* 5 arrci {i of Tatrles 5 and 6) a.re ab.,:tlt tx'ice as large
a.s i,lie OLS estinrates (coiurnrts 3 ancl ,l of Tables 5 a,nd 6) . 'fhis goes ag*intit
oli: igitiai iltuitiorr thnl ornit|cd factors (such as gcnlrificatir.rii) a,re rnost likel,v
to [e posilivcly a;ory'e1atr:cl with both Airbnb lit;tir:gs n,nd iiouse pdctrs,;/rcnln,
thus crcntir:.g a i.rositive bi*r,s. ijowever) we not<; {,hzr.l lhc OLij estitltnte rna,y
?sj:l.ciiull.li *r'c rroN seusi[ivc t0 difJcrr:nt; t,.Yp*s r:f inir.:t1.:rri;rli$rrs
z{
D000355
FILE
D D
ATE:
6/2
1/20
19 6
:51
PM
2016
CH
1548
9

also be nega.tivelv biascxl or bjasecl torvards zero for two reasr:rls. Ilir:st, there
niay be meilfiure[ter* <lrror ir: the ttue amount of hoine-sharing, ]eacling to
attcnrratit>n bias. I\4ensuremcnt error mny arise from t,he fact tllat r.vr: only
r,rstimate tlre rrumber of Airbr:b listirrgs, atrd w<l clo noi knou' their extr,ct enlry
ar.rl exit. lvlgasurernerd; erloy uury r:,lsei a,t'ise frorrr t'he farct tbat tirerrc arr: othel
fuorne*sharing platforms besides Airbnl;, that we do not rllea$tlre" Our erlt irna,ttr
for the num}er of listings is ihereforc n, noisy me&sttre of tiie trur: nurnbe,.- of
short-fiert1 ren[a]s. Secr:ud, sirmfi;aneity bias may be nega,t,ive; if higher rerrtal
ratas in thc: long-terrn rcnta,l market would catrsie a decrcase in thtr nuntbel of
Airbn]: listings, r:eteris trtanbus. This is irtte in our nlodcl be<:elttss i:.rt increase
i1. iirc long;-tcnn rcnta.l n*e (holtling- Q fixtxi), would dcerease the nunrbcr of
lancilords chogsing {;o supply tire short-tcl:m rnarkel,, and it is likely to i:e true
in rea.lily as well.
Filally, Table ? reports thcr r<lgression results u.hen log pric*tu-rent ratio
is lsed as thr,: tlepr:nclcxrt variatrie. Cr:lumn 6 shnws that i:hc c{[ex;t of Airbnb
listings ein tfuc price*to-rcni; ratio is positirre, and t]ra,t, sirniiarly l;a rnnt,i; a,trd
prices, the c{Icci iu dcc}iniug irr r:rvner-r:ccup&11cy rate. r\1, {,Irc l'neclinu .}$lner-
ofixt"p{t.t1cy ral,c, {tr 1% increa^se in Airbub lisiingx learls to ii. statj^qtically signif"
icant 0.01;r/o ittcreaso in th* price-'lci*retrl; ra,liti.
"L'<: summnrize t}1e lesults in l.'al:les 5-7, lve s]rot.cd i;iin,t 1) &,lr incrrease
i1 Airblb li*tilgs k:a,rls to hoth higher lr<;use 1:ricer: a.ncl rsrr*;rl r*lt:*; ?) the
efllct i,q higher fi;r house prices than it is f'or rcutal ratcs; anrl 3) lhe eflec;t
iS clecrea^sing in thc zipcode's o\4rnel*c,cctl1rani:y r*te. ll.'hcse lesuh;s :tle all
cglsisl*1t wil'[: i,hc meicl*tr prr:sri:f*cl in;Q*<;f,icri 2, tlrts pri.rviclinil crlirlcrttr: lha.';
irnrnc-sirarigg ilcloed inc;lea*qe,s hciusing cr:sfs by rcallocating long-tcrrn rcxrtals
to the gfuorf,-term ma,rket, but illso that ]rome-sharing inr:teasc.s ]:otnoownets'
oplion value lbr: utilizing exc:e$$ ca1:acity.
f\.2 }?.obus{,neti$ check$
We lqtrv repori a numbcl of rcibrrstnqrss checkrr lo leinfclclc t;lrrr vlliclitv t)f tittr
cstirna,tes. First, w: re-cstii:r*i,c t:ur specilicabion usirrg riiflerrexrh sulisarnples of
28
D0003s6
FILE
D D
ATE:
6/2
1/20
19 6
:51
PM
2016
CH
1548
9

tl;e dat*. The rriain purpose of thrxe c'hoc;ks is to coufirm ihal tire results arc
not being driven by only n, select, rnrrnber uf cities, zipc<ides, or tirrtt-r pcriods.
In doing $o, our goal is to liu:ther redrtcc conceln$ about possilrle omitte<l
r.ar.ieibles correlated rvith k:catiorr and tirne that may drive thi: resuits prenenterl
in Srlctir-rn 5.1. lltil cxa,rnplc, <:onsirler the z,ipr'odrl loci:.tion arrcl s3rccificall3t
wlietlier jl 'is lr:elaiecl r:lose No tire city center. Onc may ar:gue that zipttt>dax
cleisc io th.c cii;y center woulcl hal'r,, t:xl:erienced * positive increase irr rertti;
a1{ hr:use pricrcs in.clcpenclently of thc presoncc of Airbnb (antl nf criutse suclt
ziJrco<les are also r.ror:e likely to ha,r,'e a higher munber of Airbnb listirgs).
Secontl, r're perfi:rrn a specific.:ation t<;st ther,L uses an alternnl,ivi: frmctiona,l
for.m of Airbnb supply, Tlris l,est gr.rarcis aga,inst concet:Ils rciated to our r:ltoice
of using a log-log s1:er:ification to r,:stinate the iripa,ct of Airbnb orr tlL.e hr:usittg
:na,rket.
Zipcodes near and far from the city-cerrter
Ii'irst, w: repe&t; the 2[iLS rtlgre*;sions with ful] slntrols sq;artr.tely fcl' zipco<1es
thirt are "llear" 1;o their CiSSA's city *:rri;er a.rtrl filr zi1:urclt:s that a;'e "far"
flcrn thc cil;1' 4y,'11,'r. Th.c cit,1,* eenter is cbfurined usin14i\'{icrcrsoft's BJng h4a1ts
Alll, and zi1.:code cen*roicis are ohtainerl fi:orit ihc Census l}ureau. A zipcoilr: is
t:ornLrxl a$ "il{t&t'" to i:il* CBD if it, is clox:r thatr the CI"}SA inediart, ali(l "firr'*
slherwise. The {irst trro lnws ,:f Table 8 report thr: results. "l}re tpr*,iil;r,live
rqsults haftl in both thr: ncar and fa,r sarnpkN;, thorigh it stccms thsLt thil r,:flircts
rnr: largcr irr the fii,r' g;rautrr. 'flds conJir:rns that the lersults are not, lieing" solcil3'
drircn by a few eipcoclc* i:llse to dorvr*own ?Ireir"$) a.rrcl that horn**sltaI'irLg is
lraviug a.rr impact cven on zii:c:ocles iha.t are fiilther from the cit'i'tpttter"
Early ancl late time periods
SE:cond, r.ve rcpea,t the regressions,sepa,rately for trvo titne periods: 2t)11-2013
and 2t)14-2t110. Rowg 3-4 of I'ablcr B repr:ut the;se rcsuli;s, Again, tltr,r rnain
cp:rlita.Live rcsults ciltt l;c scen in both timer 1:criods, i;horqi: tlrc cffect; of orvner-
occlrp{trrcy raic ,seemii lci be a lot rvcalier in'i;he carlier ;:eriorl thn,n in tln l;r.tei:
,x)
D000357
FILE
D D
ATE:
6/2
1/20
19 6
:51
PM
2016
CH
1548
9

pei'iod. \4/e specula.te thal, this could Lre cluc 1;o the possibilitl, that Airbnb {irst
attracte<i those users u'il;ir sllaro roomrj or houscs not r:n i;hc long-terrn rnalket
(e.g., vacatir:n rentals), and that oniy recetrtly Airl,rnl> bccatne an a.ttrnc{;ive
optio:r for larrdlords that previously rented in i;he lor43-terrrt rnarket'
Lzrrg-c and small Cl3SAs
Finally, we repeat thc regr-<ssions separately f<l: t}re 30 la.rgest CBSAs, a.rrd
fcrr the CBSAs ra,nhecl 31-100 in 201t) population. Rows 5-6 ol 'ila.ble I report
ihe ro,$qlts. Tirc qualitative resulis holcl fr:r both samples, l,hciugh bh'e results
are uot sfzitis{,icallv significairt irr the rarrk 31-100 sarnple w}ten the outco.rne i-s
;:rice-to-rcttt ra;Lio. The e;ffecis of Airlrnb appetrr to be sl;roriger in thc largcr
citics, rvirich coul<l be driven by n number of l'actr:rs, inelucling dif{'ercnces in
housing rlenrand anql houxiug supply clu$tiieitie$.
Lcg-density specifi catinn
In r;1ur ruaiu results, we kave used a lng*lr:g specilicatiott k: tncir.surc the e{ft:ct
of Airl-:nb listings nn hottst: priccs iln.cl renta,i rales. T'his i.* l:ecarts<; such
specifir:ation provielcs us iviti e.:alrii1., interpr*lalik: <:oeflicicrrl,s iir llx: furtr: of
elastir.:it1, t,ha,t is tlfl,en used irr cornpeiiiive setting;s, aixl i',; has l-:ecn used i:i
tlrg p;xt in thr: *ontext of Air:bnh {Farrona,to a,nd !}'ndkin, 2018; Zt;lvas e:i;
t*1.,2017)" llou<:vcr, a,,+ Zelvas et al. (20i7) *l.rservecl, lhe k-igJog specifica[iou
irnplics consta.n{: elastieily, a,n as*umption tlra,t uiighi nol haltl iu our settings.
il-g rpake sut'e tltal; ort:: rtxtlli;$i are noi; <lrivr.ln by tlie lop;krg clroice \ve use
nri altern*tive specificatiou in whktr Airbrtba,T in Equa,iir:n (1.3) is me?lsuled as
i,[e lnmbcl of Airbnb listings <livjdecl lry tire to{;i.rl occul:iecl housing stoch.26
1V<.: c*,11 tltis rncn^*ut'c "Airlinb dertsil;y."
\&re i:r1.rolt tJrc rcsull,s using the log-rlensil;.y s;:tlcificl*iorr in Tal:ie L We
rt:1lr"rr*{; OLS rcuults in coluinn 1 and 2SLS rcsults in cohtmn 2. 'L'he ntairr results
ccntimrc to hokl <lunlitat.iverly: 1.) higtrel Airbnb clensity ieads to l:iglicr ]rouser
i;riccs anel renia.l r'ates; 2) thsr cft"ect is higlicr for'?ritusc priccs i,han rental tii.tos;
zi;l)r,Lt,lr o1 l;r;t;il otr:upir:d hau:;i*g gtr:q:k i;; l\'our Atifi lt'--vcrr.r e:ii:iltrit{:cs ft:<xlr 2{J11. to iltl-l{i
:1u
D000358
FILE
D D
ATE:
6/2
1/20
19 6
:51
PM
2016
CH
1548
9
&nd 3) thil cflcct is ciecrcasirig in orvner-occ;upeIleY rate.
One of Lhe downsides of Nhe log*densitv specificatir:n is tha,t Airbrib density
is <xtrernel5, sliewe<127 arcl using 91 x hi,2{J111art t}re irutnrtrlent, thc fit:'st st,age
bccornes very"iveak and x,e i'ail to rcjcct untleridentification.2s 14/e tlrereltrre
repolt result;s using an augrncnt,ecl sr:t r:f insi;ruments formecl tty intera,r:ling
secon.cl orrier polynornials af g, lt;,2111sr, 3.rrd ooratei,26111' In L]rtl Appenciix, we
shorv thai the qiralitative resuits are rol:ust to il mrrnber of eli{ferenL se1;s of
instlurncirts, buL that thr: cocff.ciert;s tre *o:rtelhat sensjtive to tirc t:iroir:e of
instrunrcnts. This is wh;' the k:g-log speci{icatir:n' which hi:-s proveir to tre very
robust, reirrains ctur p::cferrecl specificaiion'
Additional checks
I1 the Onlirre Appcudix, lvo lcport a numbor of aeiclitioual robustness chechs,
such a^s using alternative measures of Airbnb listings, thc rr{Iect r:f includ.ing
r::velr slilall(:)r: CBSAs, arrrl tfte *:f*lcr:t of drc4rping zipcoel.e* with zero or i.r, strta,ll
lunrber: of lisiir:gs. 'Jlhe rnain rcsults a,re robusi; to al} these alternatir.'e spcci-
fi**ionii.
,5.:t &{I'ect m.a,gnituderi
il i,his section rvc ccnsider {.he *coneimic sig'nifi*r,nce cif r:ur estirnrrkicl effr:r:ts.
Our baseliner rcsult, is tlr:rt a 1% iucr*ast irr Airl;nb iisiings lcads to aQ.tl18%
inr:rcasc in rcnts ancl a. A"026% incirca,se iri ltousr: priccls, at il rnecliau owner*
occllpff,rlc."y ra.te zi1:c*dr:. Thc n:*l!;m fc$,1-on:gl&r grov;th r*te in Ajrbni: list"
int{s q,'a;i 2B% a,cro,.;s zi;rcodeii in tlie top 100 CB$iAs. 'Ibkem at t}re sa,mplc
rneclian, tiieti. Airbnb grorvth cxl:lairis 0.li% in ir,nnital rcrtt growth a,n& 0.7$/a
of amrual price gr:r:wth,
Anothcl.r way to E:alculate elltlcl size is to c*lcrila{;<: lhc Airbir}: conl,ribu[ion
t6 yea,r-over-par rent a.ncl l:rmse price growttr {i;r each zipcerdc by mu.ltfulying
rneclian ycnFover*)'eil,r <*r:lrrges in lag listirrgs by the estitnatecl cr:efficients f -+-
??T'he ske.vvne:ss is 139.56 corr4;ared to a rirean of 0"0{}7 and varialce ol 0.0$.2*11 rhe regt regr'*ssion. a.n uncler:icleniifica,l;ir:n iest; rtring i,lie Kleil:erp;err a'rrtl Paap {2006)
r{r ll\t slafistic fu,il* io rejr:r;i underidtuljfic*t;ir:lr rviili a. p-r,aluc af [l.ii(jf,:{].
31
D000359
FILE
D D
ATE:
6/2
1/20
19 6
:51
PM
2016
CH
1548
9
I x o*ro,te4,2010. \rye report thcse eftects in Ta,l:le .l.0 fcrr the median zipcodcs in
the 1-0 iar:g<:st ClBSAs, as well as for the meclian zipcarle in our sample of 100
la,rgest CB$As. Wer also inciucle the avera'ge yeax*on-y{li}r rerri; il'rt<l price grr:rvl,}r
for comparisol. While lhe size of i,he Airlxrb r:r:ntril-rrition may seem lir.rge, we
cnul;ion that e;si;ini*ting tire efleci at the sarnple tned.ia,n rn*rsks substa.ntiaJ
hctcro;genelit)r in thc :rci;ral expericrir:es ol <liffcrt;ltt, zipcocles, and ignores tltc
ver-y likciy possibiiiir of heterog<lneous treatrneni; elTects. \4/e alsio note tha*
our cstirnatrxi effecis are con$istent with thosc fcrunrl iu Horn aud MerErnl,cr
(z}fi), rvho stud5, i;]re effect of Airbni: orr rents in Bcston fror:r 201"5-201$.
'I'he.;' found that a oue standrl,rd deviation int;r:unse in Airtrnb list'ings led to a
0.4,% inme*se in lents. In or: data, tlre rvithin-CBSA stanrlarci deviation irr
].t':g listings is 0.27 fbr 2ti15-201.6, which nt iln n'rcdian owner-ooctlpancy r*lte:
implies a 0.54% increase iu lcnt-q using; our cstimates.
5.4 The eff<lct of horrre-sharing on hqrusing reallocation
Wc clase the paper by prescnting iiornc sugl4cstivc evidence tltat httr.ne-sharinp;
afltr:l's rcntal i:ir'tr:s and ltottsr: prir:cs hhrougir the realloctr'lii'rn of hnirsiug stock'
T'CI {lo [lris, r,c invt*tig;at* t]re cfk:r,l of Airblrb *r: lxirsiug'vilr:nncics. B*r:alrrc
v&c:Lilcy clata is not rrvailabler ill, tltql zipcnrler level ert a r:ronttrly or nnnua,L
frequency. s'e lbclls orr arrnual CRiiA levr:i r':,lt:nltcies. We r{}gres$ r.'aea,n<ry rate*
iul thc CLI$A-yc;ar level on the nurntier of Airbnb listings, yen,r fixed effect"q,
antl {.ll}ij.r\ fixerl eiiects. I}nta ori vncalcicrs txlitrt: lrotu attttua.l AC$ l-y*rir
csl;irnatcs a{; the il}3SA le;vel.ze 'lable 1.1 repolts the resrdts.
'l'!rc fir"st iJring {,o nute in 'I'a};lt 11 is thai thc nulnbtr of Airbnb lislings
nL the CIB:jA ievel a,ppeii,r$ unc;oLrciat*<i wii;h li:e iol,al rrurnbor u{ vacancies,
once coltrolling; fi:r CITSA and year fi:teil effect,s (cerlunui 1.). However, whetr
urc lrrr,:ak thg va,r:aur:,y raier clorryn bv the type of vacalloy? wt] find a posil;ive a,ird
statisticall-v significa,nt relation with the shar<* of irotucs classified a*g vacant
for $e;r,sonai or remeationiil usr: ilnrl a negiltive: ald sta.tisticall"l' sjgli1i,,nrtu'
zr'lVe <urrpnte the l;ofal riurnl:er ol vii,cu.rrr:ir:s n.5 stllll of the nunrber of vi".rcurl, sca"sonal
3?
D000360
FILE
D D
ATE:
6/2
1/20
19 6
:51
PM
2016
CH
1548
9

asrjoci.r*ion wiih thc share of hcttnes that are vacariFfor'-r'ent ir,nd vaca,nt-fop
salc.
It is iurl:or:tarr| lo note that tlte C:ensus Bnreau classifi.es homri-o ari v${ailt
even if tlrey are temporar:ily occupictl by per"sons who usually live elservhcro.
Thus, hornr:u a.ilocrital permaleutly to the sherrt-terra market are su1:lrosccl1,o
he classifieii ru var;ant, aud rvill likcly also J:e classifiecl as s<;a"*onal 01' t'ocrcr-
ational hornes lly their ownor$ and/or neighbors.s0 Tire positivc associal;ion of
Airbnb r.r'ith vi.rca,nt-s<;asorral bc,mes, ancl the nclga,tivel association with vaci:,nt-
lbr-rcnt ane{ vacant-fcr**oalc hornes is tlierefr:re con*i*qtcnt wit}r absentee lantl-
lords substibuting s'6'6y from the rr.:ntal rxrcl for*sale rnarliets fr:r long*tenn
residents and a,lklca,ting in.stea,<l to iire "-hort-tcrn marltet.
6 l)iscussion 8e Conclusion
ll'he results ;:rcserntcxl in this p&por suggest ihat the increasecl abiiity to home-
sharc hErs Lr:d to incrca.ses in bolh rental rates an.<l hons<l i:riecx. llic irtcrerases
in rcntal ratcs and hoiise pri<.:cs or:cur iirrr:uglL twit cJra,nneili. In the fi.rsi;
cfrapneJ, horrNr"sha.ring inclrei.rses reni;i,rl r:r,tes b.v itrducing s<;rn* inndlt:rds to
switch {}orn suppiying the nrarkci for }cng-tcrnr rcnt*ls to supl.riyiug thc mark*t
for shor:t-term r*rrkrls. "llhe inr:rcusc in ::cnia,l ra.tcs t}lrough this chtulric{ is thcn
ca,pitaliz,ecl inLo house plirrcs. frr t]rcr sc,q:t.rnti cha.rrncl, hlnl*sha,r'ir4; iucleases
houstl prir:es rlir:ectl-v by ena,bling lx>rlteorrrnt;rs to gerlcrai;e incorne frorn excess
honsing cilpnci[y. ilhis r:arises fhe value of owning rclativc to reni;ing, a.ncl
tircr-erfcrc iucrorr,ses the 1;rice*tr:*t'etrl r*iio dir<*tiy.
I.he relsuits in this p{}per contribuNe {:c the dsb*te surrornicliug home-
sharing *ird its iu4>a,t:t on the housiug rnarkr:t.. \\.1hi1e Airbnb a.ircl proporrent*
of the sharing ecouorrry arguc that tlte plntfornr is not re*;pollsibl.t: foi' higlN:r
hou$e tr,iri.cxr* a,nei rcutnl rrr,tt:s,l] c:riticu of lrornei."sha'ting argue that Airbnb does
il0Whel a. |ronrcr js var-trtrt, Cqrusrrs wnrJ<erg lvill iui:rlrvierv neighbors iJ-ruul, ihql c,cclrlra,Il{j}t
clrarac:teri*ti<:-" of {,ltc horrx:.31Fgr cxarnpir'r, Airblib r1i*prwed ilre finrliirg;s of *, receut reporl, oil lire cfft:ci;s r:f ihe 1:lai-
fr:rrtr gn lhe ir()lsing rnarkcl ir: Ntcvi 1fuik Cily. Se*: http*:1,/wr.:w.ci1iyiab.coru/eqdty/201$103/uliat*aj.rbnb*d:itl* Lo*aou-york* c !.t;,./li52749/.
?')!ld
D000361
FILE
D D
ATE:
6/2
1/20
19 6
:51
PM
2016
CH
1548
9
raise hogsing costs for local residents. This paper: provirles evideitce conf"innirig '
this latter'lrypothesis, arrd it does so rming the mosl cetrnprehensive rlatasct
about horre..sha,ring in {lie tlS arailal:lc to rlo,lcr. I\4orcovcr, tiris lxrptil a,lso
provides evidcnce iha,t, honx>sharing itrcLetxcs the vo,lue of homes by ,r11o*ttt*
owurlr$ l;o ltetter utiliee c:xcesri capacitv. for *xarnple by allowing o\l'nt)r$ tei reiit
spare bexlroorns, or the cntire homc wben on va,catir:n.
'furning to horv cities and rnunicipalii;ies sh<x"rld de*rl with the st*xly in*
crease in horne-sharing, our view is that reguin,tions on honte-siraring should
(at ntost) sesk to limit the reallocation of housing stock from iotrg-tertn rerltals
to short-term rentals. '*'ithout discoura.giug tire rtse r.rf homeghei,ring i:.1, owllcr'-
nccupiers. One reg'ulatoly *pproa,t;b sxrld be tc aniy levy occupatrcy tax on
fuorne slrarers who renl the entirc hornc feil a.n exlended period of time, or to
require a pror:f of ow:rer'-occlrpancy in order to avoid paying ocnupa,nciy ttlx.
Of course, this rcsea,rch does not corrre wititcut limil,ations. First, we must
recoglize thal, our ;lirbnb daia is imperfect: rvhile we: obstlrve prolrertie;; listed
on Airbnb, rve do nct obgen e exact cntry alr<i oxil; of lhcse properties. Ilov,r-
evel, using Airbnb 1;r'oprietar.y tlatn Farronata arnci Fr:xlkin (2018) obta,in vely
similar elasiicity estimatr.s to Zerva^s et al. (2017) wlm use a sim.ila,r apilroilc;li"
ter ours to r:}t*l,in Airbnb data r.r.nci fiir;rr$ure Airbnb supply, 'l}ris, nloug ri.'it}i
r:ilr (xtensir.e sct nf robusiness checks, reffs.lur:e,s us aboitt thel ra,licliLy of our
rrlsrrlts.
$ecorrd, wr: rx:)ed to kee;: in rnind thal in settings rvhen) thc eflccls arc likely
tg be heterogcneou$, a ?$l,S estirnate cloes not rcprcsent the Average L're;at-
i:netrt H{tect {r,\TA) biti, irt*tcacl r} l,i:r::rl Avcr*,ge lllrea.ime:rt }llfibct (LAl'ff}, or
the elfect r:f Air:bnb on the *ubset of "compli<;r",zipceicles * thosrl zipcoelcs {,hat
.*rer i1<iuced by tlrc instr-urncnt, to change the ra,Iue of the enclogcttous rcgrcs-
xlr. Thus, our t*iirna,l,c do rtot nr:ct*srr,rily reflect; the averagc efft:cf of Airbnl.r
on &ny zipcotlcs. Dcsl:ilc this limila,lion, h.cnur:vcr, 1r,'e c:"ttirn*let rnagnituclcx;
that are similar to tlmse obtained l:y ;1oto er.nd l\,{era.lte (2il17} for tire cit;r e;
lJostop. Filally. our model elr.ir:s nai; t*,kc i::rto n,ccr:uttt possibic s1:illover e{l'eclr*
Lhe neighboring ziirtxrde.$ ciul have ort each otherr.
ilb surnmarizc thc stt*e of tirc litcrature r:n lloms**]rarinp;. rcst:arch (in-
34
D000362
FILE
D D
ATE:
6/2
1/20
19 6
:51
PM
2016
CH
1548
9
clu<1ir41 tiris papcr:) has ftrunrl that home-sharing 1) raist:s iocal rental rates b;;
c*rusilg a reEilioca.ficin of the housing stock; 2) r:aisr:s house prices through i:ioth
the capir*iizatiori of rcrrts a.ncl the increa^serl ability tc; use excsts capacity; rrntl
3) indgce.s market entry by slur.ll suppli.ers of slttilt-ieirin housing rvho coml>ete
r.r,ith traditional suppliers (Zervas el, al, (201?), Ii"arrona,to and F:acikin (2018)).
lfo:e resear:cl: is needed, itotl'ever, in or<lc;r- tr: achiev'e a cortplete wel.ft;:e ana.l-
ysis r:f horne*shaling. Fbr example, hnme-,sliot'ing may h*n'e positive spillover
eftects tx ioc;r,l llusincsses if it rlrives a net incrense in iourism tir:matrEl. On the
other hand, honre-sha.ring uray have negative spiliot:er e{fects if tourists croate
nega,tive extotnalitics, su.ch as noise or congostiol, for loca,l rcsidents. More-
orrer, horne-sha,rirrg introdur:cs an intclesting $elv rnecha,rtism for scaling clown
tlre ioca,l housing supply in resl:r:nse tcl ncgrrtive clcma,ncl shtlclcs*a. rnechanism
tiiat was not possible when ali of the rcsidcntial housing stor.:k was alklcxrt<ld
to the krn.g*terrn market. lJrrrl.ersianding the impact sf 6sc:h ntecltanism on tlre
housing mir,lhct is a.n open t;luantion Lo clate. We leave th$;c rosca.rcrh questions
ftrr futurc work.
R.ei"erences
Angrist, Josh, Sydttce C)aldrvcll, and .lon;,rtlu'rrr. Llali. "Lii:er verstls taxi;
A rlrirc's e-ve view," 2017.
Bartii*, Tirnothy J., Who EerteJits frorrt,,9l,ttl,r: untl Lar.:al llcortorn'it. I)et;el'
6ltntes,t Psli.r:zr-t;?,I{1la,ln*zrio. [',iI: W.11. tlp.iolrn hrxtilute fc;t: ltlrnr:loYi:rienl;
llest:a,rch, L!i91.
Chen, I!,1. Keith, .Iuditir A. Chevalier, Ileter iI. Rossir anci llmilyOelhlsen, "Tire Value of Fbxiblrr Work: Evidenc;e frorn Uber l)river$,"
\4rt:rking Pa,per' ?3296, NlSIilR 20f7.
Chr:istian, Paui and Christopher P. Ilarrett. "Revisiting t?rtl Effrrct, of
Irborl 4ir1 on (krri{lici;: A l4ei}x;rloiogier*l Oa,utiott.," 14trr:}ring Fa.pr:r B1?1.
l&'orkl Bank ?0i"7.
,ii)
D000363
FILE
D D
ATE:
6/2
1/20
19 6
:51
PM
2016
CH
1548
9
l)iarnond, Rebecca, "T'he Deterrninarrts and Wblfarc* Irrtr:licafions of U$
WOrkers' I)iverrging Location Chr:iccs hy Skill: 1980-2000," Am,erit:a,n, Eco-
nom:ir Re.tieut,2{)7t), 106 (3), 479*5?4.
I)rbc, Oeindrila and Juan F Vargas, "Cornmo<tity pricc shorks anrl civil
rcxiflict: llviejence from Colornl:tia,," T'h'c [l.tttsi.eut o! Et:orr,trn'it: Stu,dies,207.3,
BA U). i3B4*r421.
Edelman, Benjamin G and htichael I:ucB, "Digital discriminaLion: Tltr'r
case of airi:nb.ccun." Working Pnper, Harvar<l l3usiliess School 2014'
Edelrnan, Rerfarnin, Michael Luca, ancl l)an fivirsky" "R.acial rlisc:rimi-
naiion irr tlre sl:ra.,ring ecolromy: Hviclcrrcc frorn a fickl c,l:.ptrrim ertl,," A.tlltricrtrt
Itr can, onvic,l tsu,nt *I : "tlpp li,t:d fr cona mi,c.s. 2AL7, I {2), "I*'}2.
Einav, T"iran, Chiara Farronato, and Jonathan Levin, "Ireer*1,<rPeer
fuIarkcts," Armu,al .R,eu'ie'u r4f Ecrsnond'r":s, Ocloi:er 201ii, 8, 615*635'
Farronato, Chiara and Andrey fl'adkin, "'lhe rvelfalr,: el{tx:ts of pccr
cntrv in the *ccr:rnn:o<la,1,iotl rnarltct;: 'L'he case of airb:ib," '11':clrtrical ltr:1rori,
|inticnal lltroau of }Jcon*rnic K,E:sea.rch \&ir:r:king Jl.4rtx' 20lE'
Ilradkin, Andrey, "$rzrr<*r fyir:{,ions :r,rrt1 ihe clelign ollnniirtc rn;r,rkelflplar,**;,"
lYcrrlting Paper, &4assac,husttth Instii'r.rtrr c.,J' "li;rim olog;y 20 1 5.
..* , Elena Grewal, and David Holtz, "Tlrr; dcterminillrts of otrli*e tet'iew
ir:fonni:rtivcnesx: $lvirlence frorn field exptirilnc:tt.s ou Airl.rtrl.r," Tbr-,itrtt'cal
Repori, \Vorking Pa,per ?017,
Gong, Jing, Br:ad N. Greenwood, and Yiping Song, "[Jber ir{ight, I-tuy
N,Ie a Merc*detzBenz: An.Srnpir:ical Investiga.tior of the Sharing liconorny
anrl Durable Goods Put:ch&$e," S/rrrking Papei', SSIiN 2017.
Ifall, Jonathan V. anel Alan. R. I{rnegcr, "Atr Atra}ysi* ol 1:i:e La.l":or
Market f,ol'l]ber's l)i'ivei'-Par:[ners ju i,irc 1-nitcd $triies,'.' .fI"]l..ltsnieta,20Tf .
i36
D000364
FILE
D D
ATE:
6/2
1/20
19 6
:51
PM
2016
CH
1548
9

Hanna, Rema and Paulina Oliva, "The effeci of pollttion on labor sripply:
Evidenc* from a naLural experirnr:nt in Mexics Citl'," Jou,rnul af Public
Econ,ondcs, 2015, 19tJ, tt8-79.
lforn, Keven ar:.d Marh Merante, "Is llomc Sharing l)riving Up Rents/
Evirlenc<r frorrr Airl:nb iu Bostotr," Jonrrtttl ttf l{ttu,sir4S Econurtzics,2AlT.
I{orton, John J. ancl Richard J. Zecklnauser, "Ovu'nirlg;, Using ancl Reut*
in6g: Some $irnple Hcemornics r:f tlte "Sha,ring Econotnv"," \&torliing Fa,pelr
22029,1\BEn. 2016.
Khibergen, hank and Richard Faap, "Generalizcd l*xlixxrcl R,ank Tlsts
Llsing tlre llingular Va,k:c T)ecrxnpiisiti.tsn," .faurtto,l al Et:onorrtetrics, 2006,
JSS (1), s7^126.
Lee, Dayne, "Ho1v Airl:nb Shor:t-Ttrrrn Rents,ls Exacerl:al,e Los Angeles's
A{ir;rriairle Housing Crisis: Analysis and Polir:y Recommettclaiions, " I{ nruard,
Ltu t7 Palicy Reuiew, !Q16, pp. 229*254.
Mart,in, G.r*gory .J. and A.li Yunrk"oglu., "l3ia*; ir.r Cri,blc New'q: Persr;asicrn
,utdl:)tii)itrizirtiotr," A1'n,e?-i,&)rt, frtnn.rt'rtt.'i't: Ik:ti*'ttt,2*1"i, jAY it)), 2561 25i;9.
Nunn, Nirfhan ancl Nan*y Qian, "{l$ {bod airl;r.nrl civil ccn{lici;"" Arnetirurt
{lcananric lleuieu,2A14, I04. {6), 1630*06.
Peri, Giovarrrd, "'Ihe effe*t of irnrrdgra.i;ion on pruduciiviiy: Evidence fi'c"rtn
IlS siares." R,t:ui,r:ut t$ Eusn.arn'ir:s t{rrrJ, St,u,f;is'tic:s,2A12, 9l/ {t), 348*35"q.
Pri:se:.'picl, D;rvicle and Gcrard Tellis, "Bariug the Sharing lln:nonr"v:
C)oncep{;s, Classi{icalion, Iiiudings. a.r:.d }iuture Di::ecticris." VY*r*i,ng lt*1xx',
2A:,7.
* , \Mendy Xu, ancl Georgios Zervas, "You Gei Wirat lbu Give: Theorv
anti Evidence of Reciprocity iu tJre Shrlring F)t:crrtotny," 20I7.
Zeri,as, Georgios, Dayid.ei irroserpia, anc{ .Iqhn l3yers, "A first lnoh At
()niine rcputa.i.iotr i:n Airbirli, u']l[:rc cr'cr]r gl,rw is allr:rtt,: ir,ternqtl,t'X0J5.
37
D000365
FILE
D D
ATE:
6/2
1/20
19 6
:51
PM
2016
CH
1548
9

,*. , -- r and .Johrr W. Elyer.s, "The Risc c;f thc Sharing llcouomlr: EsLirnating
blrr ltrrpiLct of Airlrnb on tltc Hoi;el Industrv," JoTtrttt,*.l o.f lt{rtrket'irt'g }lesenrch,
2017, 54 (5), ti87-"705.
JL\
D000366
FILE
D D
ATE:
6/2
1/20
19 6
:51
PM
2016
CH
1548
9
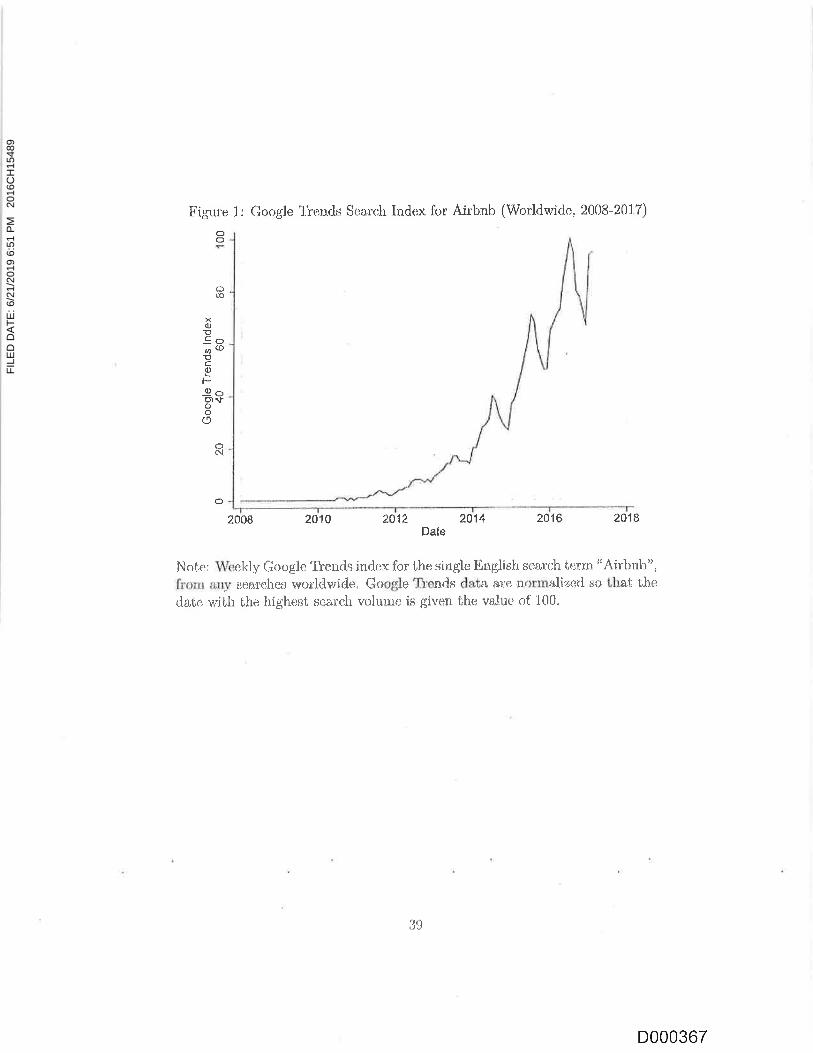
Figure 1: Ck:ogle tenel.q Searc.h lndex for Airbnb (Worldwide, 2008-301.7)
c)
oq!
o2008 2010 2A12 2014 2016 2018
Date
Not,e; Wrreklv Googl* iibencls indr:x for the single finglish s*rx;h i;ertn "Airtrnlt",fmxr a,ny nrarche;r w$rklwieie" G**gle TJ"end*r dst;l s*:ar n.{}r,s?pili%€tl so tbat thed*itl wilh tlre highest gear<{r vi:ltu:rr: is gi.ven the valuer r:f 100.
o00
xd)-oc(f,a<D!c)
t-*o6U).trooo
:39
D000367
FILE
D D
ATE:
6/2
1/20
19 6
:51
PM
2016
CH
1548
9
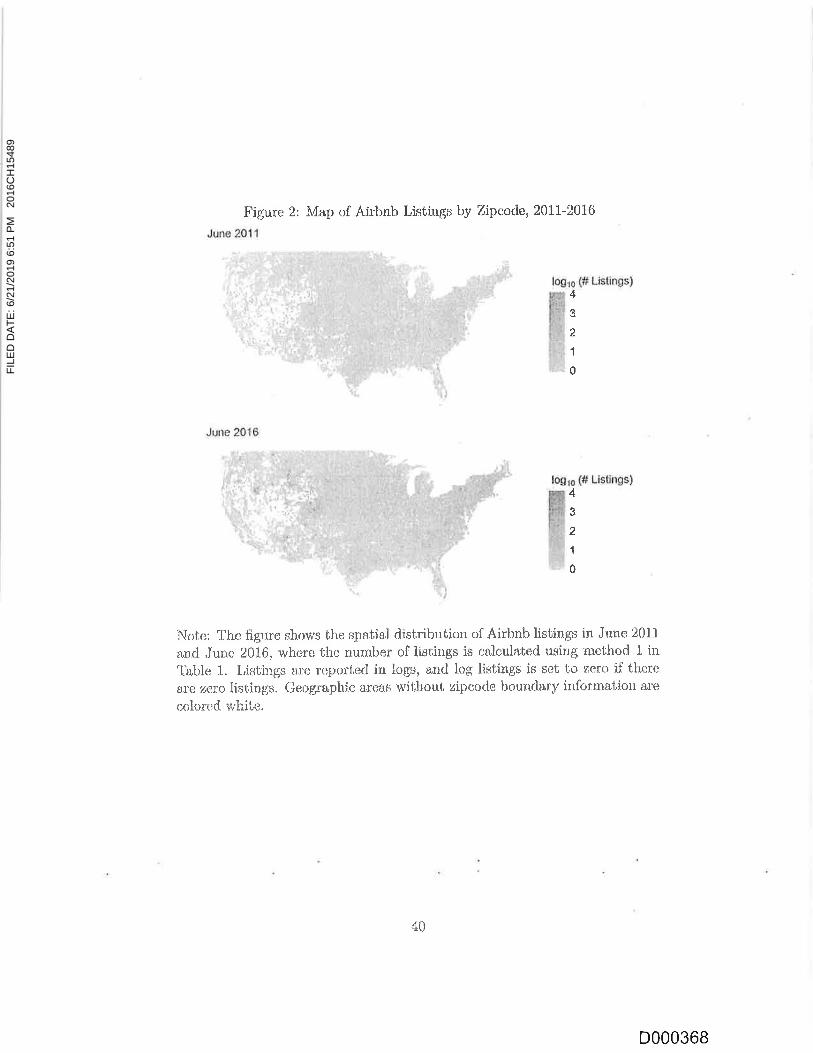
Figure 2; Xdap of Airbnb Listings by Zipcode' 201.1"-2016
June 2011
June 2016
logro (# Listings)
Ilosro ff Listings)
4.:
2
1
0
4
3
2
1
0
Nnte: 'Ihe figur* shows the sp*.tial distribr.rtion of A.irbnb listings in June 2011
ancl .Iune 201,6, rvhertr the nurnber of listirrgs is calculnted using rrrel.hod 1 in"llable 1. Lislirrgs c;:e repolted in ia61*, ar:d log listin6; is xet to rerer if there
{rre zero listings. Geographie a,re,*s rvithont zip*ode bounrlary irrformation are
coloxrd whil,*.
40
D000368
FILE
D D
ATE:
6/2
1/20
19 6
:51
PM
2016
CH
1548
9

Figu*r 3: Tbtal Numbcr of Airbnb Listings (US. 2008-2016)
1,A00,000
7n0,000
50c,000
250,000
Jan 2008 Jan 2010 Jan 201P Jan Jeo 20'16
400,000
300,000
200,000
100,000
Jan S00t Jan ztll{) Jan 2r)1? Jan PO14 Jan g01S
300,000
200.000
100,000
Jan Jan 2010 Jar| ?012 Jan 2014 J&n 2016
":'{)-
a-oc_c)
a
.>o-(f.:
U).c:c-!)-!"-
.hI1.u)
<noc-o.b
NoLe; llhis figur:e plnts the number of .Airbrrb listiugs over tirne. using cach ofthe iJ rncthocls rlcscribecl in 'ilal:lt-: 1.
4I
D000369
FILE
D D
ATE:
6/2
1/20
19 6
:51
PM
2016
CH
1548
9

-aXd)gHhi o"
fi;1oo.(', ocd)'j: c.9fr€5.bBLla3co 50'rPg69!EE,i5 -c
Irigure 4: T'esting the IV operating assurnptiorr
tq 75 100
Google trends
Note: This figrrre pl*ts the rliffer*nce in ikc n*r*ber of Airlxrb lisi*rrgs far l"righ-
ancl luw*tr:lristin*,ris zipcriclc or.'er tlic Google tre.nd valucs. We use the sample
me<lian value of touristine,ss l,o crcai,c twi: equallS' sized groulx o{ high- and
l"ow-touristiness rip codos.
00
al
af
a
a
at
aI
I
{t
taI
a
il tt I
la
taoe
Ia
at
Itl
att
tr
D000370
FILE
D D
ATE:
6/2
1/20
19 6
:51
PM
2016
CH
1548
9

Iiigure $: 'JlenrL$ in Zillow Humc Vahrc Lrdr,rx by "'itiu.rstiltess" of Zi;:mdr:
Zillow Home Value lndex
oc..l Ic6Tti,so.6o
co
T<:Nct,o
I
200s 2a1a 1 2012 2013 2014 201$ 2016 7
-1
Quanile for touistinfiss in 2010
-*
2 --"" 3 '", 4
Zillow Honre Value lndex (residuals){r1q
Cf,NreA€
{,.*O(3do,g$e:l {:gidlff
a{aI
2009f"
?010 zIfl ?".Afi 201X!l
2"A14 2015 ?016 2017I
I
Quaniit for toilritihes$ irl ?010
2 -*"*** " 3 4
Noi;e: T[c top pa,uel plots Nh* Z]IVI ii:dex, ncit:rrnlizt:il tt: January ?011*.0, avcliLgfrJ
rvithin clifl'ereril, gror{)s of zipcodes ba,sccl on their ievel of "to'"rristirtess" in 2010.
tburisiirress i$ rnt:asured as thc nurnbcr of estii.bli*hrncuts iil the food scrvices and
&{;comlnoda,tions sectr:r {l{AiCij code ?2) irr 3010, n:r<i t}r.e zipr:uelex arc separateel
iltc four eetrually sized ftroultri. 'llln botlorn j)inl(::l ploi,'j l;irc xrsiduzils tn:m.a, resrc^ssion
e,rf i;hc ZIIVI on zil:cotle fixed cfli.:ci;s trnd Cl3$A-rrruittli lixecl i:ffet:i;s,
A,J
D00037'1
FILE
D D
ATE:
6/2
1/20
19 6
:51
PM
2016
CH
1548
9

Ta.ble 2: Sire af Airbnh llelative to the I{otising Stock (zipcodes, 100 largest
CBtiAs)
i>lt) yt2i p50 p7$ P90
lwr* ilAIlAirbnb Lisl;ir41,*
Ilcusing Units
Airlrrrb Lieting* *s a Pcrceutogo of'Ibtal llousing UtiisRenter-r:*cnpied lJnitsVaeri,ut lJrritsVar:arrt-for-ren[ Units
June 9016Airbnb ListingsHausiirg Lluito
Airbnb Listingu as ar. Percenlage ofTbtol Houoing UnitsRerrter-r:ccupied Un itsVnc*-n[ Uuit,tVncm6".for*ronf Units
.03
.13
'1.72
.t1
.It72.63
13.70
,00
?,507.i9
4?.80
0i,0s8
0
2,815
4?,$20
07,437
2.
12,1i20
1:1,219
7
18,037
0000
0000
.00
.00
,00
.00
.08ae
.9S
4.6{t
.CIz
.06
.20
1,01
.00
.00
"Ofl
"0rl
.0s
.33oo
s.0s
IL,097
.tJ
7.61.0
44 t441.8,44it
1.88t.st
20.0012i).00
Nltsl: This t*hlc rcporl;s Lhe size of Airbnb reiativt': icl the housiilg lii,o{.:k, by zipcocles
fpr the t.t)0"1nr1ges* {}S$As-as uien$rreel by ?010 pr:;ruladio:T . The rur*rbEtr ef rlirburb
li*tings is cnlculatetl using rneblrr:d I in il},ble 1.. Ilata on hou*ing siocks, occtlps,ncy
characteristics. arlCi v&cancie$ corlxl fro)Il A.CS zipcode levd 5-ycar estimntes'
lq̂4
D000372
FILE
D D
ATE:
6/2
1/20
19 6
:51
PM
2016
CH
1548
9

Table 3: I\r Valirtity Chcch: Comelation Betwecn hNitruurent and RtrntsfPrices
in Zipcorles Without Airbnb
(1) (2) (3)
De1: r'ar; Irr ZIu Dep var: ln ZHVI Dep va,rl la'&HVI/ZXl
College $hrn:e
F;mployrncnt ll"a,tc
!)2 x lli,2s16
ln Populatiotr
ln lr4ediau lIH Incorne
Zipc.ode FECB fiA-year-rn ontir F'],1
Observatior:nIt'Sign,'ilimnat lettls: *'p{:0.1, 4+ P<0.05,
*** p{0.01
Ngtcl Thi* tablc repori,t regr<w*ion rei+rrllg wlren ouicorne.q of intere$t *re r*gre*eed on thei*strymental variable directly, for zipantlee that w*re nqver obsi:rv(xl to hme rr.r4y Airi:nb list-ings, Beeausr: zipcode dernograpiric ciraracterislies art: rot ar,"nilnlile :ri a montirly frcqueric.J",
zip<xrd*-monlh me,a.surer* itrr household income, llopulirti<:u, college $hn*c, tlt:d eIril:loynrenL
nrte sre interpr:lated liom the 20l l thru 201{i ACS 5-year eshirnateri. Clusfercd sta,ndard
errorg a.t the ziptlodtl ltlvel ar*r repor{;eri in pa.rentJresis.
*{).000
(o.ooo)
0.011(0.013)
.-0.002
(0.011.)
0.054*(0.032)
0.045(0.031)
*0.000
0.ooo)
0,{J45i<**
(0.016)
*0.001
(0.010)
0.120***(0.038)
-0.017(t).033)
.-il.000
(0.000)
0.032(0.020)
0.004(r).020)
0.07(i(0.052)
*-0.063
(0.047)
YesYcn
61854
$.979
Yrrs
Yei;
508?$
0.s94
Yes
Ycs4:ir{j40.0{i4
4,)
D000373
FILE
D D
ATE:
6/2
1/20
19 6
:51
PM
2016
CH
1548
9
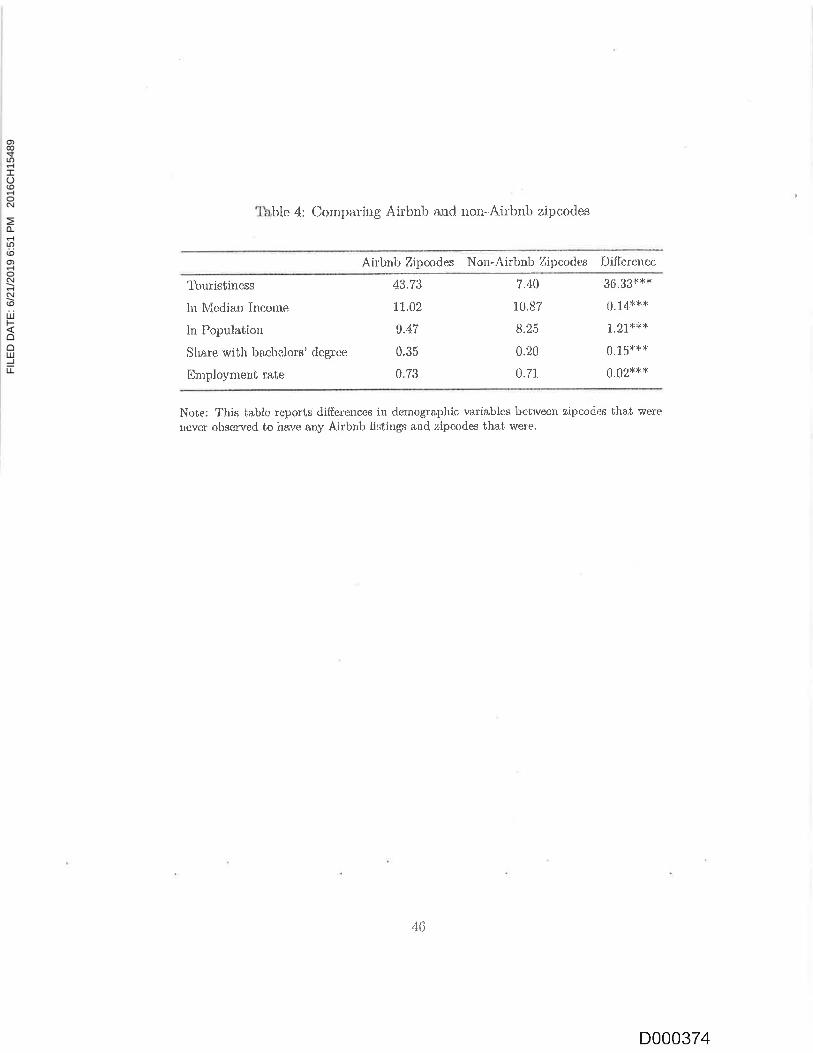
ll"b,bk 4: Con4:aring Airbnb and nort-Aillrnb zipcodas
Airbnb Zipmde.s Nori-Airbnb l4ipcodes Diflerence
Tourisl,iness
ln Median Lrcome
ln Population
Stra,re wiNh bacltelors' rlep;rcel
I}lrTployment rate
+o.lo
fi.42
9.47
0.35
0.?3
7.40
10.87
8.25
0,20
0.7t
l6.gl**{,
0.14***
t.21'K**
0.1q***
0.02***
I\iote: Tlris i;abie reporis di{l"crences in denrographic variables betrveen zipcodee thal werencver ob*eived to have any Airbnb listiugs orrd ziJrcodes that rvere.
4S
D000374
FILE
D D
ATE:
6/2
1/20
19 6
:51
PM
2016
CH
1548
9

T'able 5: The ll{tt*t of Airbub cn l*:rita,l ll,ates
(1) (2j i3) (4) (51 (s)
In Airbnb Lislingr
-,. x Owneroccup*u*y ll*tc (90i0)
In ()opulatiotr
ln r\.{edian l:ll{ lncorne
Oolle.ge -share
Iimpl*yment li.+te
0.098'*t(.a.002)
0.00tlt**(0.0orj
a.022*t*(0.001)
'''''{J.0?t*t*(0.002)
{}.021t* '{0,001)
-a.a22* u4
ta.oaz)
0,&5Q'*tr(1.0{}7)
0.0: ti'4(0.005)
0.0s3"{*{0.013)
0.().tB**e(0.0i4)
0.Q{0**"(0.00,11
...-0.0il8*8F
().00J)
{J.041*<*(0.nm)
* 0.03ii&6r
{o.oo3)
0.(142**+
irt.00?)
0,01 7"*.(0.006)
0.05?*"*(0.013)
0.Oiifi*t *
(0.01.1)
Zipcode FHClI$A-year-r:rolth Fl)hxtrumcntnl Varitllle015{{{'lrsttlo}rsvI
I(leibergen-Piup Ii' $laii$iic
iilrtJi(etu lrrelv.' i t<tl'l, " p{0'{lS. *i* pill),0l
Ngter il'htl uun)ber of Ailbnb listings is citk:ulated u$i$g ltlebhod 1 irr '.lhble 1. lli,: &r,'oid
taking lhe iog gf a zero' ono is added tc thc nunrber of Airi:nb listitrgs befr:re tirkirrg logs'
l.'hc iristrrlnclt*l vlr,riabl*i fi:e !1, X lr.;,2X1g tlnd q1 x-lz;,2g14 N oof&tciat' Beca,uxl zilicode tlc'
for househ*l{ iuco*re , popul&tion} ecllego ..share, o.nd ernploy:nelti r&tfi a,re irrtcrl:ola,t<lcl frr,un
t|er 2t.111 thru 2U16 AC$ $-yearr e.ntirn{r,1;eii, Clusler:cd sNarrdard erlor$ &t thc zipcode klv<ll
*rre reported ill Pruelrlhe*is.
NoNot\0
0,198,11
0.1?0
YcxYHti\ r:r
04{xKlil.tlt'1
Ys'Yr,rNo
ri{08410.991
l'{'tYesNtr
0.gtl
YcsYe,r
Yer6,1{.}841
0.99.t$17.3
YO€
YtxiY.,*
(i,10ti07
0.991iio4.2
64lltsf)?
47
D000375
FILE
D D
ATE:
6/2
1/20
19 6
:51
PM
2016
CH
1548
9
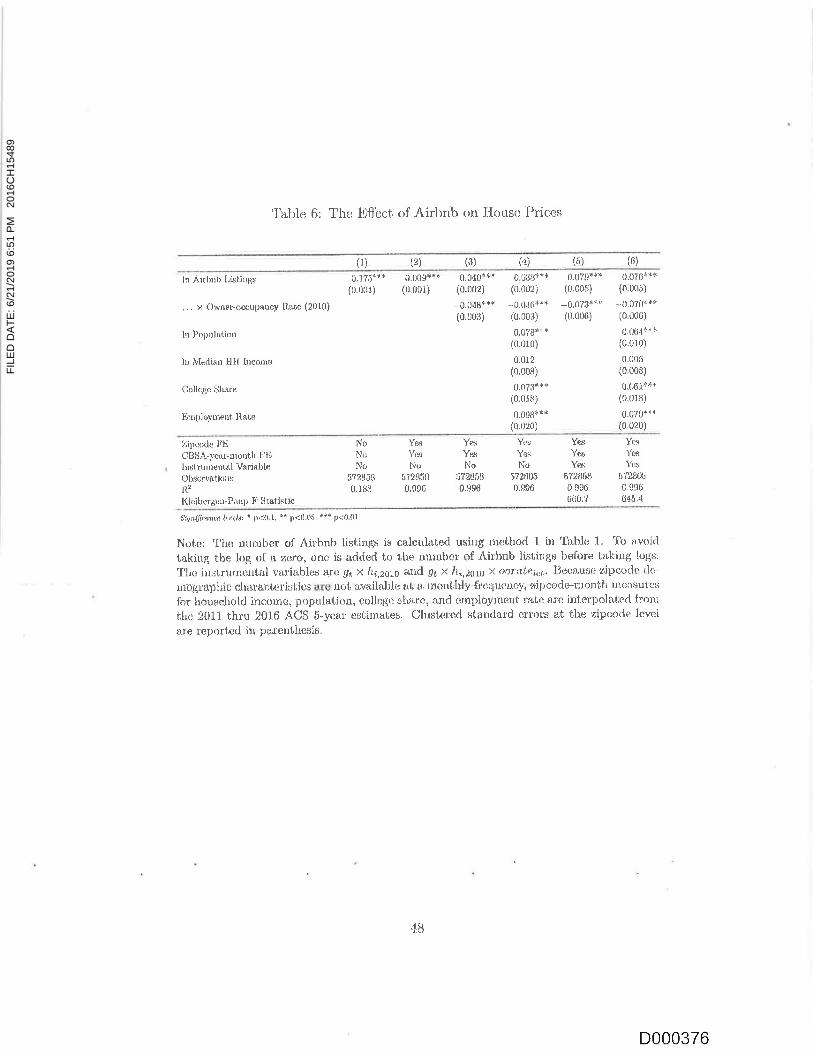
Table 6: I'he fi{l'e<* of Airbnb orr l{ousc Prices
(1) (2i i3) ({) (5i t6)
h Ai:1nb Ll+thgs
... x Ourrer-occup&uct ll.tie {r01Ci
In Populrrtir:n
ln ilfedir+n III'I ltrcor::e
Cr:llege lihare
Hmpi,rymeut. llate
0. I75n**(0.004)
Zilxnde I;!iCl)$iA-yerrrnonth FElrntrumont&l Varinbk:Ob{efvatl.JilsllI(toibqr&r:n- Prtrp [r 'qiEdiistic
Sitn$encc ktds: * p<Il-1. !v P<{}'(15'
$}i pdl}.{}l
Nole: 'I'he $rrutl)er of A.ii'bnh listing;s is calculrr.te<l usirrg rncthori 1 irr'firiile 1. 'Ib rrvoirl
friking tlre log nf a %ero, or1$ is added to the rrumber of Airhrrb listings llefore Lakitrg log:s.
T'hc i.rrstrumental v:lri;i.bler* iL.rc !fu x [;.2111s fl,u<l a1 x ll;,pg1e x oartltc:i<:r' I]ecalisr: zip*oti.e rie-
tnogrr4iliic ehnrarteri$tlcij arc rlot awiiabl* a,i a, rrto*tl*y"*:cqn*[{jy, ai;rcod*'"moni}t ttteasutr:s
tgr fuouseirolcl irr*ornc. p{}pulatiou, eollq;* ehnl't,. rlnd ornp}oytnent rai;{J are irrterpolaled frollrtlie ?011 thru 2016 AC$ S-year'{rstirna.te$. Clu*turcd sl,and*rd erl$rs at tlie aipcode lcr.'e1
&r'e r(iported in pare$tiresiu.
n.009*t"(o.00ii
0i0{0d4.*
{0.00?)
-0.0.tr8s,*(o.o03)
0.tH$*tt$.aa2i
-0.046*'*{0.003)
ti.07g8*t
{0.010)
0.01?(0.008)
0.07J***
{0.0i8)
0-0t8***(0.020)
0.0?g***0.005)
-0.0734*r(1.006)
0.t]7G**i({r.0{r5)
^u.0?0{s*(0.00ri)
{1.t-,64*.}(o.ol0)
0.flu5
{0.008)
0.0618*f
io.0l8)
u.0704n{'(0.r)20)
i\o
No57?8!{!0.188
Ye:Yp*Na
Yecl\0
Yt*!'erl\0
ISYesYex
6'nf'l)80.s960i,0.7
}'s1'e$
\1st7!8050.99G
645.,r
iiTti'105t?2{]nti57285fj0.990 O.liss 0.(,!)6
4B
D000376
FILE
D D
ATE:
6/2
1/20
19 6
:51
PM
2016
CH
1548
9
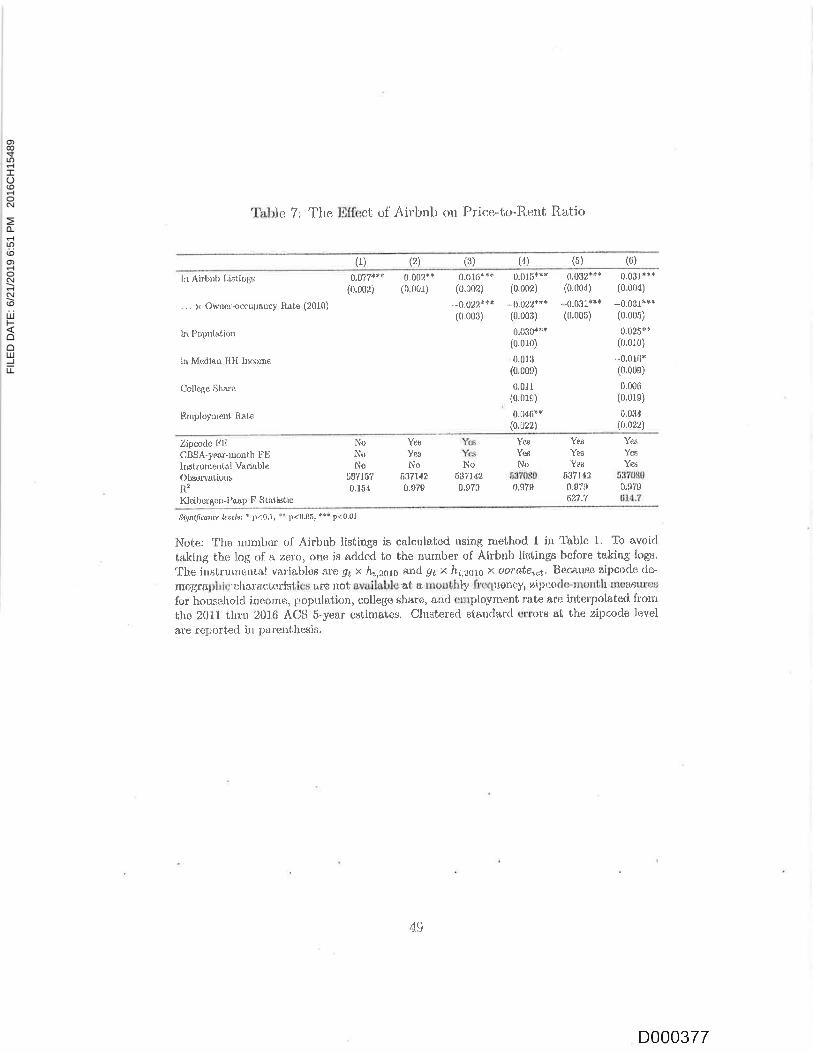
Table ?; TIrr: Iilli*ct of Airbnb eitt Plic*t*Relrt Raticr
(1) (2) (3) (4) (s) (6)
ln Airbrrb Listingx
,,, x Ownaroccupturcy itote (2010)
ln Polxrlalion
ln Mrxli*n IIll Inconre
(,'olle4e iihara
Snrpltry:ueul, llate
a.a7T4**
i0.002j
{1.002**(0.{J01}
0^$1.6**'*({i.002)
--0.02?*+*(0.003)
0.015*"f
{o,oo*}
(0.003)
0.030t**{0.oro)
-.-0.c1$
(0.00e)
0.01 1
{0.01e)
0.04fie*
$.a22'
0.0:i?***(0.0u4)
....0.0'i1*t*
{0.00n)
0.03.l *$*(0.004)
*0.031***(0.005)
0.025**(0.01{l)
."0,0lti*(r,00e)
0.006(0.01s)
0.03d(0.t)22)
Zip$da li'tiCI]$ A-:yr*r-tronth FIIlngin.ltnental Varitble()l$eruuLiuus
n:Kleib*rgur-P*ap F St&tisiic
Signiliurtt le*b: $ p<0,1, " pd0.05' *a* p<0 0I
Note: ?hg nuntbol of A.irbub listiugs is caicul*led u$ing metho(l t in 1'clble I' To avoiel
takilg tirc log trl a, zero? orre is added bo the number of Aitbrrb liatings before taking logx.
'I'lre itrstrurrr*nlal variable* &rc .{6 x &i,lgo anil .91 X lr;,s61s Y. oot'$tei&. lSecalrNe zipcr:rle tle-
111ugrapMe fhar&r:b*d$fft::s &!s.fiot'&veil&b1sa*-* *xrnfh$-froq*oney; *tipr$-xle-r+xl*iliil'$}se6ttrlss
fr:r h.r:asehoki inccme, popub\tion, college sbar$, and eruplayruenf, r,!te ':Lre
interyrola,ied ftomflio 2011 thnr 201.S ACii $-yeal e$iifirete$. Clusterecl standnrcl eu'ort &t the zipeode l<;vtll
are rcported in pareirthexis.
NoNoNo
5e7r $?0.154
YtxYr*I'io
Ye.g
Y.'*s
I'io
Ye;Yt*Yfii
63?080
0.$70614.?
l'€6Yes
Notro70s00.s?0
YsriYexYes
6S?l 'rx0.{r?$en.7
6:,j7141tt!:1714n
0.s79 0.979
4!)
D000377
FILE
D D
ATE:
6/2
1/20
19 6
:51
PM
2016
CH
1548
9

Ta,ble B; lioirustness Checks (Aiternative $a,mplcs)
l'ancl ADe1: vnr; ln ZIiI
Panel BIlop v*r: ln ZHVI
Pancl C
Oep var: ln Z\.|.V$'I'RI
Sruuplc:
(locl{icicut:
ai,vbtb ...xaorute(i) (2i
{.beliidc:rrl,;u.h'tmh ...xulrdte(1) (2)
Cncllicie.nt:airbnb ,., x rxrate(1) (2)
Zipcodxi: Ncru t:ity cetrtcr
Zipcocler: Far lron crity c*rttcr
0.030'i**
{0.003)$.059***
(rJ.0{}5)
-0.0?2**n
{o.oo4)-0.0{1*f*
(0.005)
-0.r'10$
(0.005J-0.0e3f'*f
(o.ilo{i)
-{J.041 ***
{0.004)-0.01{l**f
(0.004)
(0.008)
0.04{)v**(0.004)
0.099***(o.uo{J}
0,090E"*({r.007)
0.031*$*(0"006)
0.{,59t*t -0,04?*** 0.028**'r -(t.$24***(o.0o6) (o.oo?) (0"006) (o.oo?)
0 09?**{. -0.0$:i*t<,t 0.035*** -0.039***(o.oOs) (0.0CI6) {o.oo7)
Ycare: 2011-2013
Ye,nn: 2014-2{}1ii
0IlSAs: pop. rnnk l*30
CBSAs: pop. runk $1.100
0.0.1.r':i'i!*
(0.003)0.0e2*+*(fi.006)
0.054*a*(0.004)
6.{t22**',r(CI.003)
-0.003(0.0t16i
-{}.126*}i*(o.olo)
0.00s(0.004)
0.061**t{0.00e)
0.0404**(0.00r)0.00t)
(!.006)
0.011e(0.{,{J6l
_0.0gdr*r(0.0i0)
-0,019***(0.005)-0.004(o.0ori)
-0.08':***(0.007)
-0.025***{o.oo8)
Sigdliance buels: s p<lt).1, "' p{fJ-t},r:' '"" p<[.].{Jl
Notcs; ?hig tglllo reprj*t$ l[c rcgr**sione roporled in rolurnn li of 'llrhles 5-?, pr:rf<rrmed xeparately on
djffe.r.errt *trbsanlple*. "Near ir: city cr:nter" is the *amplc of *,ipcode* tha0 thet ers below the m*di*ndi.;ilaiir:g i$ #B$, wedr,ii ,he rnetliiiji i8 liil*rr1 ',*]thiii CBSAS; -Sar-triffi t'ry'ee$tw'' iB"thexxnrplc'zipcndrx
th*,i ar* *hov*r tlre m*dia* rli**r:ncci t,i1 CBI]. Cily centef coot'dinatq$ are r*covered ugillg lihe Mieroeoft 13l:16
APi, and zii:code eentroid coordlnat*s *re froln the U'$, Cetwus llureau.
50
D000378
FILE
D D
ATE:
6/2
1/20
19 6
:51
PM
2016
CH
1548
9
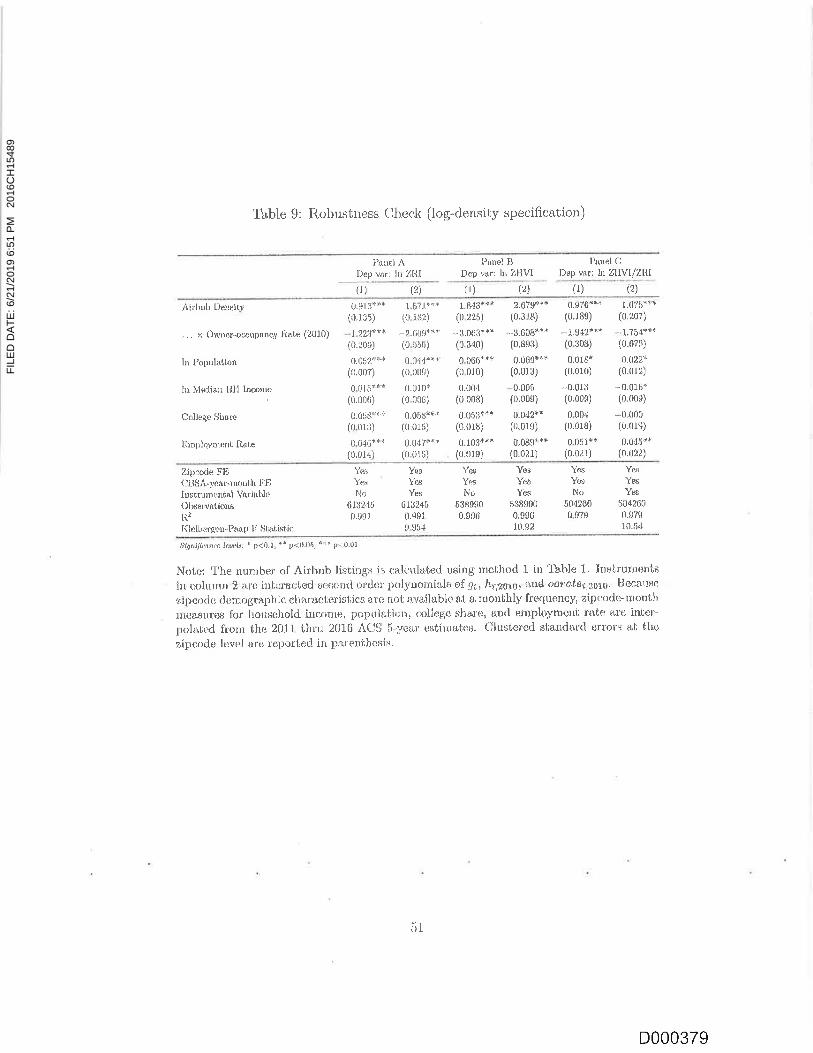
Tabie [}: Iiobustness Check (krg<lexrsity specifir:ation)
Parrel ADcp v*r: ln ZI{.I
Pauel R I'ilnel (lDep vur: hr ?HVI Dcp vr.rr: ltr ZTIYI/?'P.I
(1) (2) {1) (2j il) (2)
Airhrb Deuliity
. ,. x Orvner-uccrpurr*y }i*i.e (2010)
ln Pclpulation
irr l,lsliau lIIl Incuute
Cnllege $irnre
Err4rioynrent Ilnle
0.$l 3*$*({r,136)
.-..1.223**E
{0.:0e)
0.0liz**t(0.0{r7)
0.015{**(ri.006)
0.058E**(0.013)
0.046n**(0.01.1)
1.5?l*ts(0.i$2)
* 2.609P**(0.535i
0.04,1***(0.00f)
0.010f(o.oc6i
0.0ss*n"(0.015)
0.047**t(0.0r5)
1.8{:le{*(0 22$)
-..3.0d3.**(c,340)
0.0{j6+t*(o.0io)
0.004
ifi.oos)
0-051)t{{
{0.0r8)
0.lillJ*"*0.olei
?.679***().318)
..-3.608q!*
(0.8r}3)
0,06fi*''fio.ur3)
....0.005
ii,.009)
0.t1422"(0.01r)
0.08$'*+(0.021)
0.97C*+6
{o.lfi(J)*l.s42ra'{0.308)
0.018*(0.0r0)
--0.0r3(o.0oe)
0.004
io.0r8)
0.051*i{0.021}
1.0?5"'*(0.96?)
.- 1.7\4t*a{0.6?5)
!:!.022.*
(0.0r2)
-0.u16*(0.00s)
^*0.000((,.ol'J)
0,0,15t*(0.022)
Zi1>ca<l<: FF;C'illiA-"reat-rronth FliIt)stnDrent*l V?rltlliil0(Jlxitn vrrl,ionss2taIil*ibcr g*rr-Parp P' 5l{tii6tic
.llgd/ir:ora'c leurlr: * p.::0,1, t'pL:t),05, t" tF:{1,01
Noir:: Tlie number of Airhnb listings i,: r:aleiila*lql usin$ rni:thod 1 in'Ib.ble 1. Irir*lrtlnrr:nts
iri colu-rnn l nro irlt$r'ar;i;sd $sr:orxl oirler trxilyltolnilil* o{ gi, lra;gsm:-&ird'o$?:{6i€g;g01r}. Bcr'ultle
?ipr.(xl(l rlemr:graphir: char*rcl;*ri*tics $,re &ot &v&ilai:Ic l,i & rilolrlhly lrequency, zip<rrtistrtcrttlttrl$g^errcls for Jr6uuehoid Lrccnre. p$pui{rtionl colicge s}tu,t'tt, autl etrlpl(]yrnetrt rtlt,+ ttl'e in{er-
Folal,c{! lirxrr tlic 2{1.ti l,hru 201fi AC$ 5-;'car c*titua,l.*$. Clr$tered si:o"rtei*'rci error:J af the
ripcorkr ievel are r6tr)ori,{xl in pareni}icsi*.
YerYrsi\o
l'tyi\te:tIto
,.tst
Y'ea
ksYm
61324S
0.1i91
9.95.1
0.t$6
}'asYagYes
s38l1r00.99610.9?
Yes
YerNo
504260fl.fi?!)
YesYesIS
$0426{r0.t)?910.ri4
5iJ8f)!r0tiI3?.$
rll.
D000379
FILE
D D
ATE:
6/2
1/20
19 6
:51
PM
2016
CH
1548
9
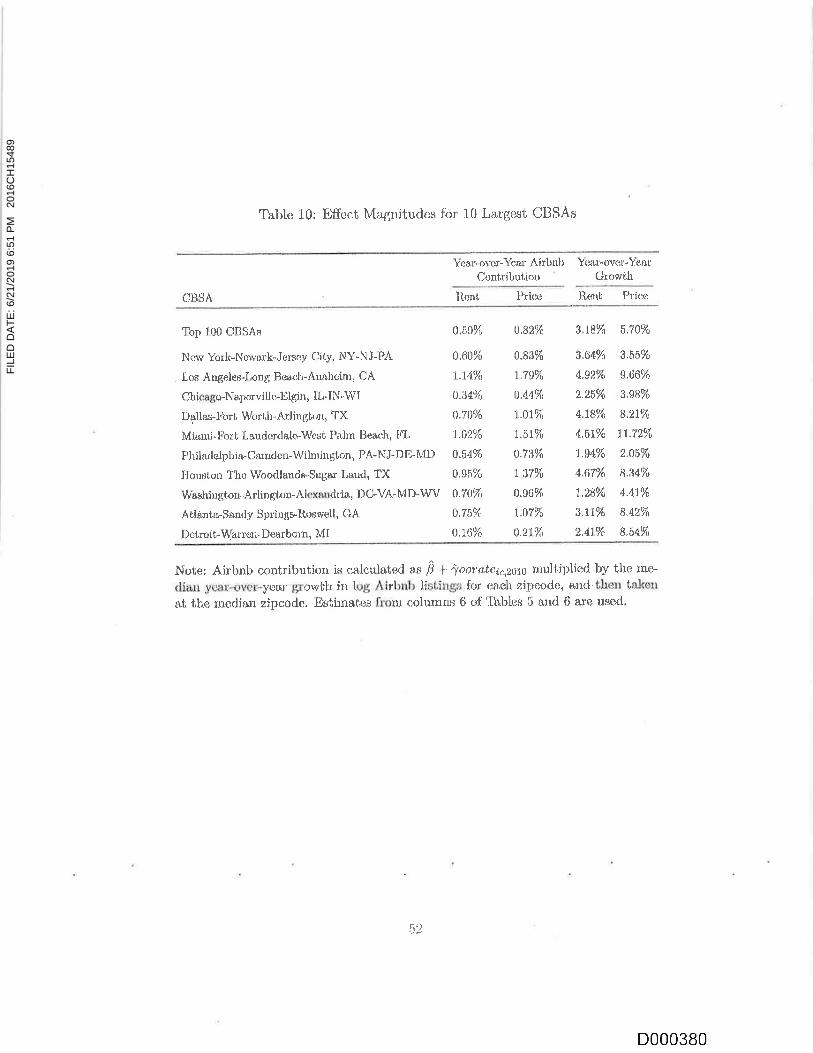
Table 10: IlfftN:t \{r:,gnitudes f.or .1.0 Lar:f,elit CII$As
Year-or,rx-Yca.r' A irbnl:Coniribuiion
'ltrni Pric,e Re'nt l:'r'ice
\?,ru-ovtx,Y.eiu()rowNh
CBSA
Top L00 CBSAs
New Yorlr-Newnrk-Iclsey City, NY-NJ-PA
t os Angeier-Lcxg Beach.Arurheinr, CA
Chicago-NapervillcJllgin, {L-IN'WI
D$las-I.bri \4lrrrth-Arlingkur, TX
Miarni-llbrt l,audr:rdnlc"lVest tslrlrn [:]c:x:h, Ii'L
Phil*delphia-Caruderr-Wilnington, PA-NJ-DIiMD
Iilouston Tho Woodland*,SqJar Landr TX
Washiugton-Arlington-Alexnudria, DGVA-lv{ D-lrfV
Aflanta-Snndy $priugs-R,oswell, GA
Det nrit-W2'rerrr-Dea.rbort, MI
a.6g% a.82Yo 3'18% $.70%
a.60%
7.T4ola
$.340/:
0.?{}e/t
l.AzYt
0.5,4Y('
0,fi5%
A.7AY<t
0,7i,Yl
Q.16s/<:
0.83%
1.79%
0.44Ya
1.01%
1.51%
a.7:101!
l.37Yo
0.s0%
7.A7Ye
a.u.%
3.(j4%
4.92Y*
2.254/t
4.t8%
4.61%
1.94%
4.fr7%
1..28%
3.'j,to/t)
2.tt1.%
3.55%
e.{j(.i%
3.1r8%
8.21Yc
11"72Yv
2,A54ft,
8,fr,l%
4.41%
8.42%
8.54%
Noi;e: Airlxrb contril:ution i$ celeulated as p -l- ]oorateir,s6ln *rultiplied by the :ne-
dian;'e66"'qver.trnrgrowbh irr'log Air$nlr lir{ringn for e*e}r r,ipeode, e!}d-fitr}€n {sJftm
at {he media,n zipcode. Estiuraliss frr:m colurnr!$ 6 of ll.hblc* 5 anei $ ere us€d.
ra);) /"
D000380
FILE
D D
ATE:
6/2
1/20
19 6
:51
PM
2016
CH
1548
9

Ta,ble 11.: T'he Efl'er:t of Airbrrb otr Vaconry R.ai;r,;s
(1)All Vm:a.nt ljniis
(2)Serxunal Hcnt*s
(3)Vacant-firr-I{eirl
14)Vrrca.nt,-ibr-ii rr.l*
ln Airbnb Lirting, 0.00r(0.004)
0.008**(o.0oil
-0.005**+i0.o0r)
-0.00o*t:f(0.0{i1)
Zipcodc FSCl3SA-year-rnonth tr'E
Otr$erv{,"tion$11z
Yes000
4.923
Yt*Yes
6000.929
Y"es
Ybs
600
0.841
Ye*,
Ym(;00
4.722
Si.gniJit*rut: lrrtr'|r: $ P(0'1, ** p40.05, *i* p{0.01
Note: Vatalcy rai;e i-c regre"sscd rin the i<ig ntnllbex of Airbnb listings ai thc CIISA-yea,l'level.
'I'hr: uum[er of Airbnb lixtings is calculatcti us;ug u]sthod 1 in'Iblrle 1. Ttr avcrid tnkirrg the
log of a ?ero, ()ne is acldecl to the nuinber of Ailbnb listings belirre ta.king iogs, The depen-
tlepi; varia}le is the nuniber of var:arr{; rurits divideid by tlre 'Lotal nnrrrber of }rorrsing unifs.
I)at6 on va,{iallcies cerlges ti.rrm annrro,l AC$ ,l-year estima,te$. 'Sea*onal hotrn:.s at'c ltousitrg
units des13ribod as beiug lor seasonal, recreaLion*l, or occ;asional use. Note that accor'ding
f9 Censpg rnotlmclology, h.ou*ing units occtrpied ternpornrily by pcrsons wlxr ueually live
elsex'here are clp,$sified a* ra,cani rtuits.
0.t
D000381
FILE
D D
ATE:
6/2
1/20
19 6
:51
PM
2016
CH
1548
9
For Onlinc Publication: Appenclix
A Model witkr trndogenCIus Ow:rer'-Occutrliers
Thc ilotjel i1 Scction 2 can be q:xtendcd to aiiow tlte sltare ol owncr-occrrpiers
tg 5e endogellous. Flowever, ex-ante hetr,;rcgeneitrv in poiential huyers nends to
be introclucecl or elsc an equi.libriruu r.vith trll threc of renters, owner-occupieri;,
a,nd absentee lanellc,r<ls rvortll recluire that Bcprations {4) :r,nd (10) both be
r:qr.ral. If they were not, then either iong-term rcside.nts rvill outbid absentee
iurdlords to cwn all the housing, or tlie oppr-:sit* will happen.
We inirocluce he-rterogerreitS, in tlre rnr:st ptl.lsimonious u{llr possible" Con-
sider a set ol l{ inrlivichrals who potentia,lly itrtera.cfi with a bcal ]rcx.ising
markei. Jlacfi irrdivi<lual can choosc tt: bc a, tenter, &n owner-occupicr, an ab*
senLee li.rntllord, or rlone of the abtivc;. I,et us norrrialize thc trtililv for "tiorte of
the a}ove" tt: zero. The present value oL ritility that person i gcts frcm b*ing
a l'cn{,er is;
1
u,i,r.* 1"r * ,-*--rll f.r,;.r
* ?Jr * €d.r
I{cr:cr, {./ is t}re ;:resexr1, vs,lue of a,::renities that t}re indiviciu:rl g,er'* froxr bcing
a resi{errrt i1 this milrket. t'; R is tire pt'escnl va.}ite of tertts. e ;,,' is a,n icliosyn*
crritic utility shock whictr is k:rorvn ex-anie. 'J-'lx; prescni; valuc tiril,t lrersou r
g;*ts frixi bcing a,n orvtxx: itl:
,u,i."* * U * t:'+ j;rr( Q ^ c:) +- e2,o
* 1to * f.i,r,
Ilerg, U is ngain tlie 5:resent value of allteriitics, P is tlrr: pulc'ha;e priin of
l,rorising. a,nct i$f.l(Q ^ t:) is t;he 1:rt':seni valtie of retiis leceivsl fi'cur sclling
ilxr:gg$ c6,p1ci1;"y* on ttre i:eer-Lcrpeer rna::ktlt. Fi:.rally, the prescnt r,'c,lrre tha,t
.-J -t
D000382
FILE
D D
ATE:
6/2
1/20
19 6
:51
PM
2016
CH
1548
9
pcr$on z gct*s lrom bcing a.n absentce ianclk:rrl is:
1
ui,& : *P + "-:n tIt + g(Q - R - r:)] -i- e;,,' L*A':::::: 11,o -l- €i,4
l,br: a.na,lytical trac{,abilii,y, 1et the utility s}rocks ca bc ciistriltulecl i.i.cl. type L
extx;rrie value. 'Ihe sha.ie of indirrirluals that choose option j out of j * {r,a.t'}is:
oxp$j* I * )Jae 1.,o,a1
exP u1'
'llx; ccpriiibrium conditiclns detemrining /l and P ale;
('qo"{- so)N : }J
and:
tl * l(Q - n. - c)Js*lV *.s"N
illl1c iirst, courlil;ictr i:; l,he rra.rkr:-[ e&,ii.r,ring cr:ndil,ion for []ic hr:using lnatkrlt as
a rvfuuie; i.c. thc num]rer r:f nbsentee landlcrtls pius owuer*occupitlrs is rxlt;rl to
tl.p lrr;gsin{.$tock. J.tte sr:colrcl ccxxliiiort is t'}re marl<cl cl*aritrg coirdilion for
ll"rc k:lgrtcrm ::en.fa.l markri; i.c" the rrurnber of t'ent,er$ is tx1ua.l to the nurnber
gf abseltge }&ndl$rcjs allocntilg housilrg tcl the lu.tg-terrin tnarlret.
\Ve leaver the qlcr:ivafit.ur of ;r.nnlytieal rcsult* for tliis rnotlel tc; frrture x'ork
6r' enter'prisiiiil stuclents. Fbr this A1:pen.tlix. rve rvill sirnpl-v present sorrc
ri.i:r1r:ril:a,l is:$1h,$ whi*h ate conrisi;eirt rvi.tlr ;:,li thc !i11' p;:el<licti*ng in Sect,i*rt
2, (jl,lor.>sivtfi AI =* lt), Il : 2, {I * $500,000, fi '* 0'95, T * 0.1, Q * $25,000,
ancl letting the clistril:ution of idiosyncratic r'retsts to iisling irr the nhort*tErrnt
lrir,riiei; }e uniform frorn $0 to $100,000. wc cousicl.cr a cha:rge of c from oc
(rrrr lror:elsiraring) f,r.) c * 0 (r:ostlcss hoi:re-sharir4i). 'llable 1.2 bclorv shows thc
resglis. Consistent with the model, the intr:oductir:n of licxne-sharing unclcr
theriic tfloclqrl p*rarl<:tcrs results in a urr:dcsl intreasc iir l;oth rentai rr*cs a.n<i
honse pri<x;s, arid {,he increiuse in ir<irrse 1:rices is iargr,:r than fht,: increixc in
,,,ritnl ratc. 'Ihc qualitai,ive rjesuiie; *,rc rnbust io rlitl'erq'.r:t parartrclell c.hoices.
55
D000383
FILE
D D
ATE:
6/2
1/20
19 6
:51
PM
2016
CH
1548
9

'Ih,ble 1"2; SirnLrlatiorr Resuits
C * OO 61 ,,.,, $59ft A
llentPlici;
$25,069$502,773
$2,i,193$507,702
0.49%tJ.98(/a
B Additional Robustness Checks
Alter:native measures of Airbrrb supply
In this section, .r.vo perform a mrmber of atltlitional r<;busi;ne*s clrecks. First,, rve
sliov tirat our rlain results are robust to the alternative methods *f r:alculating
Airbnb supply, as di-*ctissecl in Scction 3. Ilows I arrtl 2 of 'lh,ble 1-3 r:eport the
r*grcssion resuits rvhcrr irrethads 2 urd 3 are ttsecl to rneasurc Airbnb su.pply
ilstea<i of mcthotl 1. llhe results are l:a.rely changc,tl, rvhie;h is not surprising
givep thc high cerrrcl*l;iou lictwecn the thrce llloiiiitlr(ift1 rlcspite level difter,rx;cs,
Altern;riive Ci:l$A s*r::rple
Ser:orxl, rve sturr.v thal; or.rr rtlain resril.ts are,. roliusl to i;ire inciusior:. of sinaili:r
r:ii;ii.,s, l:oy{rncl t}rc 100 kr,rgest CB$As. }n rows il a'rtd 4 of 'I*ble 13, wc t'epur*t
::eqr&ssion rcsulLs when the sampie incllclcs the top 150 CB$As and tirer top
?0tl CI3$As. Again, the resull,* are not rmrclt cltatrged. sr"rgg;csl.iug lhat the
itclusigg sf slrrallei: cjfies rrill ui;{, tlriv* tire lrxuli;s iLow;iwalds ;ii11*ilicrirliJr-.
Iixclucling al-:ser:vations with xero {rL a small r:unr.ber of listings
Ilinally, r:ue is.stte r.vilh iJre log'log speci{icafion is Lhal, rve lake the iop; of aue
phrs the munber of listings to a,voirl kiking logs of zerr;. We norn' shorv that
thq.. results a,re rohrmt lxr tliis ciroicx':. Row 5 of 'Ihbkr 13 reports regressir:n
lcsul.ts rvhen irriikxirl r:f arleling l io tixl numbcl of lisiings, rve iristearl simpl5
rlrop n,l} .2iptxide-rnouih ohservalioirs in whic} the rLulnbcr erl listi:rgs is zero.
'1'fue R.T:If:i r,ar:lable ix tliereifrrr+ 1*g{dlti,rting*) ill".itcrxl of }ug{1-{ illisl.in;1s)' }l.ori'
ilu
D000384
FILE
D D
ATE:
6/2
1/20
19 6
:51
PM
2016
CH
1548
9

6 aclditional.ly drops a,lI zipcode-rnonth r:bserv;ltir:ns il x.hich tlte nunibcr of.
listir:.gs is lcss thatr 5. 'l'lr.e results rcnla,in rpra,litativedy and quo.nlibalirely
siruilar untlcr this alterna,tive cttoico.
{Jsing ccntcrn;ror:aneou$ owrt.er-occuparrcy rate
A.s <irxcribed in Sectiort 4, rr.'e interilct Ai'r'br*i"s wil,h oortd;eric,2'l'r thc otl'ner*
occuparrcy ra.tc in 20J-0, 1,o reduce endogcneity {:ollcerll$. Howcver, thc results
arc rtrlrust to uSing the cOutemllor{nneou.$ olvner-Occupalrciy t*t,e, oot'o,tei,"s.32
I{ow 7 gf Table 13 report-s tho rcsults t'hen lr-e use cotrtetllporotreous owtter-
occupa,ncY rate.
C,-' ZSLS R,esults using Airbrrb l)ensity
In th.is serctit:rr, we rcport sOme ZSLS result* using vttlious c'hoices of insi;ru-
prguts firr t,he lr:g-dclsity sptxificatiott to silaw tirat the qualitative reslrh;s ilrcr
xll:u..rt tliis choice. Ilowever, as u'c shall show- the rnagnitueies nre sornewhil,t
sensitivc. ,'{e noted in {Jre ltrairr trrxl., ttsitrg c1 x ht,nrno a^'i thr' instruirx;ul resu.li,s
in ultlerirlgr3t;ifii:a,Lion. ]n pr'*,ctir:i:, u'e fild {Jrat uiiitrg k x hi,noysls*or,i1,1,21;i,1
irs tlle irrsl;rutrtcnl;, tvhert; Sttt<:k;xile is tlle total h.ousirrg stock in 201"0, givtls
reasonable rgsuits. iiigurc 6 and 'I'a}:le i"4 repcat thc IV validit-V suppolt exer'*
cises rliscussecl in Secl,ion 4.1 fol this instrurmnl. Ali;cmal;ivel-v, highcr orilcr
pol;;norniills t:f tire inslrumenl; fwitiroui divi<ling i.ry sloci"a,2n1o) nppea.r to r.vork
as wcll, ihough the es{,inra,tui &l'c rlrrite scnsitive to the sircxtific rhoir:t: r:f il-slruutctt.l,.s.
Wrl :rpcri: rcsuLts for tlrrco 2SLS regr:e*sion u;*ing difl'crcnt setrs of ilr-
struments in Table 15. In colulnns (1) of erx:h panel, the irrstrumr:ttf.s arc
g1 x h,;,zarcf strsck42111s itterilcted with or:ra.fr:;,2016. Iri colurnrt-s (2), tire itisfru-
rpeut*q a,rc ui tltird tx'der 1:oiynontial of !51. x lla,261.s interacted with or:r'*fe;,2a;16'
In r:eriumns (3), ihe instruments are thc friil interactions betu'een sccond orcier
lrglynuirrials of .r;;, lli,tgut, Aild t-,ts't'u,{ttr.zua. 'J}re ipnerr-r,l qtta}i{,a,tivt': rcsuh; iti
il'(iontrull:ora.11{.)ouri r,wuu!.-o,r,upa.ncy rr.lte is inl,clpt.rl;rLr:il1:,ct i:,he tnont[r.ly leve] usiug AtJS
i:-.ycar cri,irtli),k{; fl'orrl l7{i11 i;o 2i}J.6.
tlt
D000385
FILE
D D
ATE:
6/2
1/20
19 6
:51
PM
2016
CH
1548
9
thal tlre t.lirect eflect of Airbnb ricrrsity is pr:sitivc, rvhile lhe intera,ctir:n wiih
owner-occllpt),ncv latc is nelqative, consi.stuil; with thel rcsults r.isir41 tlic hg-log
s1rer:i{ica,tir.ru.
,i8
D000386
FILE
D D
ATE:
6/2
1/20
19 6
:51
PM
2016
CH
1548
9

Fignre 6: 'Ikencls in Zillow l{orne Va.hre Index l>y lt"a,2s1sf stockilultt
Zitlow Horne Value lndex
10 2011 2012 a 16 2017
*-1Quartile fortouri€ilnosa ifi ?0't0
2
-3 -4Zillow Home Value lndex {residuals}
200s 11 2012 2C13 2014 5
1
aiurnilB l{i loi{islin$s rn 2010
2 -*.
3 **-*--- 4
c.{
;eN'.co
hi '1d0ot[Bta6
sN5ol
-q0C)
*O
c,(\trOgaidciE6C(!
co
r4.-6 :.4-aHot
7
Noter T[e top panel pirts t]rc ZHVI in<ii:x, nc]rln{diuetl i;o January ?0L1*0, &v{?:rtrged
vdi;lrin rliflereul; g1ot.lp$ of zipcodes iiased crt h,.i,21n0f stoc.ki,2010' i'e. the rrumber of
estabirlshmenls in food servic*s and accomnotlations scsfor ir 2010 tlivided by the
l1:1si1g stack iu 201.0. 'J.'he zipcodos are theu $ep&ratcct into four equsily siued
g"r.ollp,$. 'I'he bottom pane). plots the resiclu&ls fronr a re$ression of the ZI{VI on
zipcaiic fixed e{fetts a,n,<i Lrll$A-month fixed efliects.
ir{}
D000387
FILE
D D
ATE:
6/2
1/20
19 6
:51
PM
2016
CH
1548
9
llable 13: Adclitiona,l Robitstness Checks
Panel ADep vat: ln ZIII
Pslel I Parrel CI)e1r ulr: lrr Zi{Vl Dep var: ll:r'LtlYl/'/,Xl
RoLrustntxs Ciresk:
Cotrllicieui:airbt$t ,,. x otr'utt
{1) (r)
Crxlficicnt: Coetlit:icntrairlmb ... x oorate(r) (?)
oirbnb(L)
x oaraLie
(?)
Meihod ? for r:niculating ll li,*tirrgs 0.048***(o.oor)
Methr:d 3 for c*ltuiating lf listing* 0.048+*:r
0.00i|)
CBfiAs pop. r*rrk 1-15{1 0.040s+*(o.rlr)3)
CIJSAs pop. rarrk I-200 0'038***{0.00?)
-0.{r40***(0,004)
-0"041"+*
{o.fjo4)
-0.033***(0.f10;1)
-0.031**8
i0.003)
-0.04I***(0.00,1)
-0.041***(0.005)
..0,03r,**4(o.0o3j
0.0,x?f**(0.006)
0.097***(0.006)
0.0?lt**{0.005)
0.0s?f**{0.rJil4}
0.092***(0,olo)
0.09i*+*{0.022)
0.t\74**t({,.ofi:t)
-0.0*2***(o.oo8)
-0.093*"+(0,008)
-0.0fi?&**(0.0r16)
-0.06$***(o.o06)
_{i.0u"1t4.E
(0.00?)-0.096Nx"
(o.Oue)
-0.0?{l**t(0.000]
0.03{i+**(o.oo5)
0.03(i***
0.005)
-0.037**t(0.006)
-0.037r*x(0.006)
.0.0:]1.***(0.005)
*0.03tJ**q4
(0.004)
,{i.030'ef*(il.0fr,'i)
*0.04{lf *"(0.008)
_0.031**x(0.00s)
0,030**?.
{0.004)0.027"**(0.003)
I)r:op obn. with zctc listingx
Drap obs. wilh <li }istin6u
Co$,crlpora.*eous orvnpJ-occ tnte
0.049**{(o.o0r,)
0.034**(0.014)
a.042*t*(o.one)
0.04$$*(il,020)
0.04***t(il.003)
0.030*t*(r.0n4)
S\ttnifirlr.tun lctr*ls: * p<i0.1. s{ p4O.t}it, *-" p{u.0r
Noto.'i: Thi* ialiltr repr:rts result,- from rol:u.slne$$ {:her:kr4 de$ctllii:d Jn Appendlx sr:*tlcrn B'Irr egch c6.{e, 2$l,ii r6nuh;ii &re ropsrted wliere ilte irixtruirtqtlt is 91 x /i;,2610. t i* added lxrfore
iaking fhe log eif thr,: number of listingx, e:{cep| i:r rows 5 and 6 whsre the lerg(/flistinp) irtakct directly.
s0
DOOO3BB
FILE
D D
ATE:
6/2
1/20
19 6
:51
PM
2016
CH
1548
9

'Iable 14; IV Validity Circck for 91 x h4266f stttcl;i.261x
(1)
I)e,p r';.Ll'; 1r: Zii,I(2) (3)
Dcp rar: lu ZIIVI Dep var: ln ZTIYIIZII)
gt .Y h;.trnrtf sl;oclci,2$1x
in Population
ln [,{eclia.n HH Incorne
College Silir;rr:
Employmcnt Raic
0.0{)7
(0.012)
0.011(0.013)
0.002(0.0r1)
0.05,{"(0.032)
0,04{j(0.031)
0.0i.3(0.011)
0.045***(0.016)
-0.001{o.o16i
0.r20'*'t'((o.o3B)
*-0.0r.6
*0,004
(0.014)
0.03?(0.020)
fJ"004
(r).020)
a.077(0.05r )
*0.003(0.047)
Zipcode FDCIISA-year.-montir FE0brrervationsR?
Signilk;ortrc lerrels.' * ir<ti.l., ** p{t}.0$, *** p'd{)-01
Nolo: 'll.hig.irJrle raprrrts.rr:r{rcJ*ciffr r:esrrlt* r.vlren e"rttl;cotnrx *f inf,t:re;l: fl.r,f rcgreii.ltfid.ort the
insi;i.itgrenl;al var!abi<,1 dirr:ctly, flir ziyrencies thir,[ l\'exr t.nlvett'oltscrv<xl lrr: ]tave a.nv Airbnb li*t-ings. llcc*rus* zipc*tlr elenoglaphic charrrr:teristi*tt ilre rlot *vrailabie *,t a. rnorthly ir*lqtretrcy'
zipcade-nronth ni*i.rslrres i'ar liouuoh$ld ilcottte, ;;cpuliiiicn, coll*gt'r *ha.rr:' aucl tlmploytncnt
rate are interltol;rted fro:rr tlir: 2lll.l. fhru 2016 ACS ir-ytrllr: t:sl,itntlt;**. Clustercel *tandarcl
crrots {r.{; tlrc zipeo<le k:vel a.re teprxl;ed in pnrorthesi:r'
Yes
Yes6't8544.979
(0.033)
Yes
Yes50s750.0p4
Yes
Yes431t.i4
0.964
61
D000389
FILE
D D
ATE:
6/2
1/20
19 6
:51
PM
2016
CH
1548
9

Tallia 15: 2SLS ll.r.'sult;s lor Log-Density $pet'i{id:ion
Prrorl Allep uw: 1*'ZllI lX1l rrrr ln ZllVi
P,rncl C$ep rs: ln ZllVllTRl
I'nrcl R
(r)(1) (?l (3) r) (2) (3)
6)p
,lirhni) Dcnsii.l'
,., x ()*n({"orrupinct itsr{ i2010)
ln i:'atul^liotl
ln ill.rli*n llli lnqoarc
C'ollrds Slrk
llnttrlmsrt iL.[t
L0'f,l'"*(0.2r5)
- t.1t?*(0,r04)
0.0i4***i{,.00r}i
{,.0rr{*(0.0u:)
{l.glntt* rr(].orr)
0,u{,1! c4
i0.01$)
l,w{*i '{l!.;!1:,}
*a.ryd{r"10,?01r)
0.tf,ix$tri{).rJrr}
0.r)0$(r.0011i
0.070"*'i0.019)
t.tro"i! "i0-!10)
1 t7t'4',(0.181)
"..2.(($'*.!(0 $$)t),(144t tr
(r).rJta]
$.c10*
{{1.{iriil}
0.iitt,!*{0.nt1|i
{l.t}t7'."{0-n1.1)
i0.30,:i*:1.?81"""
iil 8?,r)
t).c{j.'tt,1
{0.013)
-..r,$3(0,00$)
a.t46*it0.018)
0.0$i'*,io.rJli
3.601*r *(0.16?)
-d.8r!"t(1 r#{i
0.0{0}!(tJ.ol,i
-0.00$i0.0rri)
0.0.(fl3
0.l1rl)t.1l3g! '
{"0.t'at
1r.31*i
-$,(i$3e*.(0,F$t
0,$6$"1(0.61;ll
-0.t{)5(0.oolri
a.B4r&"(0.fi1r)
0.08!io"r(il-0rt)
'l.tl91*t
{tJ.$?3i
-2.!rl9*ri0.rli;fi)
0.01t(0.01r)
--0.{t1Bf
{0.n10}
0,itl,:(0.01$)
{t.r32"*(n.0-frri
1_ri??8'(!.r;o)
-.3.1?3's*(,.i;r1]
().013)
*0.ill*'*(0.0rt0)
-..0.{,{11
(0.0r9)
0.{},i0}'l0.ua'j
t0.2$7i
(),6?n)
lt.{.}:3'(u.olr)
-0.0t6r().0{),})
-..{!.$x}
i0.01i,)
0.046"*i0.0r9)
?ipalr lrl:'CII${-5wr.wNrth $l'lIr*lrur*rl*l V;*iniiirfll.xr"t r*tiD*$.*K,.it{,rsrFl'Brii l.' $btiriiL
{iltx.t:i0,ssrl$-3?
.. YeYrx
fi3t.gtt.s!{)5.8i1i
lrJ
li;|49fii0.1196
10,s3
Yr
l:!1i0.90
0,$!nt
t.bTI
33$tS)iltrdta.$1,
Y. r*l',q
a1 3r{t(r.tt:ir.t5i
l'ts "rc-. '|GYte YJ* !j*V*o. Y{i Yr*
i.ti.lrti] r04?il0 ir{l.r?{nt
{t.n9,.,r18
0.97' 0.9?0t0.61
.\ir^,tHil* f,rrs 'rl0.t. .' pLon+ *" ll4ll,sl
wrat&.tara" trr coluuran {i1}, tho in6*rlr$tr &rc t{llt iti('{*tld 6{coud ordor pr:ly*onisla of .9{, tr,k}r$. itrd otatel.2ata,
D000390
FILE
D D
ATE:
6/2
1/20
19 6
:51
PM
2016
CH
1548
9

Exhibit H
FILE
D D
ATE:
6/2
1/20
19 6
:51
PM
2016
CH
1548
9
The economic costs andbenefits of AirbnbNo reason for local policymakers to let Airbnb bypasstax or regulatory obligations
Report • By Josh Bivens • January 30, 2019
• Washington, DC View this report at epi.org/157766
FILE
D D
ATE:
6/2
1/20
19 6
:51
PM
2016
CH
1548
9
SECTIONS
1. Summary • 1
2. Overview of theeconomics of Airbnb• 3
3. Potential benefits ofAirbnb introductionand expansion in U.S.cities • 6
4. Potential costs ofAirbnb introductionand expansion • 13
5. Conclusion: Airbnbshould have to play bythe same rules asother lodgingproviders • 19
About the author • 21
Endnotes • 23
References • 24
Summary“The sharing economy” refers to a constellation of (mostly)Silicon Valley–based companies that use the internet astheir primary interface with consumers as they sell or rentservices. Because this term is “vague and may be amarketing strategy” (AP 2019), we refer to these firms lesspoetically but more precisely as “internet-based servicefirms” (IBSFs).
Economic policy discussions about IBSFs have becomequite heated and are too often engaged at high levels ofabstraction. To their proponents, IBSFs are usingtechnological advances to bring needed innovation tostagnant sectors of the economy, increasing the quality ofgoods and services, and providing typical Americanfamilies with more options for earning income; thesefeatures are often cited as reasons why IBSFs should beexcused from the rules and regulations applying to theirmore traditional competitors. To skeptics, IBSFs mostlyrepresent attempts by rich capital owners and venturecapitalists to profit by flouting regulations and disguisingtheir actions as innovation.
The debates about whether and how to regulate IBSFsoften involve theories about their economic costs andbenefits. This report aims to inform the debate by testingthose theories. Specifically, it assesses the potentialeconomic costs and benefits of the expansion of one ofthe most well-known of the IBSFs: the rental businessAirbnb.
Airbnb, founded in 2008, makes money by chargingguests and hosts for short-term rental stays in privatehomes or apartments booked through the Airbnb website.It started in prototype in San Francisco and expandedrapidly, and is now operating in hundreds of cities aroundthe world. Airbnb is frequently depicted as a boon fortravelers looking for lower-cost or nontraditionalaccommodations, and for homeowners looking to expandtheir income stream. But in many local markets, the arrivaland expansion of Airbnb is raising questions about itspotential negative impacts on local housing costs, qualityof life in residential neighborhoods, employment quality inthe hospitality industry, and local governments’ ability to
1
FILE
D D
ATE:
6/2
1/20
19 6
:51
PM
2016
CH
1548
9

enforce municipal codes and collect appropriate taxes.
In our cost-benefit analysis, we find:
The economic costs Airbnb imposes likely outweigh the benefits. While theintroduction and expansion of Airbnb into U.S. cities and cities around the worldcarries large potential economic benefits and costs, the costs to renters and localjurisdictions likely exceed the benefits to travelers and property owners.
Airbnb might, as claimed, suppress the growth of travel accommodation costs, butthese costs are not a first-order problem for American families. The largest andbest-documented potential benefit of Airbnb expansion is the increased supply oftravel accommodations, which could benefit travelers by making travel moreaffordable. There is evidence that Airbnb increases the supply of short-term travelaccommodations and slightly lowers prices. But there is little evidence that the highprice of travel accommodations is a pressing economic problem in the United States:The price of travel accommodations in the U.S. has not risen particularly fast in recentyears, nor are travel costs a significant share of American family budgets.
Rising housing costs are a key problem for American families, and evidencesuggests that the presence of Airbnb raises local housing costs. The largest andbest-documented potential cost of Airbnb expansion is the reduced supply of housingas properties shift from serving local residents to serving Airbnb travelers, which hurtslocal residents by raising housing costs. There is evidence this cost is real:
Because housing demand is relatively inelastic (people’s demand for somewhereto live doesn’t decline when prices increase), even small changes in housingsupply (like those caused by converting long-term rental properties to Airbnbunits) can cause significant price increases. High-quality studies indicate thatAirbnb introduction and expansion in New York City, for example, may haveraised average rents by nearly $400 annually for city residents.
The rising cost of housing is a key problem for American families. Housing costshave risen significantly faster than overall prices (and the price of short-termtravel accommodations) since 2000, and housing accounts for a significant share(more than 15 percent) of overall household consumption expenditures.
The potential benefit of increased tourism supporting city economies is muchsmaller than commonly advertised. There is little evidence that cities with anincreasing supply of short-term Airbnb rental accommodations are seeing a largeincrease in travelers. Instead, accommodations supplied via Airbnb seem to be anearly pure substitution for other forms of accommodation. Two surveys indicate thatonly 2 to 4 percent of those using Airbnb say that they would not have taken the tripwere Airbnb rentals unavailable.
Studies claiming that Airbnb is supporting a lot of economic activity often vastlyoverstate the effect because they fail to account for the fact that much of thisspending would have been done anyway by travelers staying in hotels or otheralternative accommodations absent the Airbnb option.
Property owners do benefit from Airbnb’s capacity to lower the transaction costs of
2
FILE
D D
ATE:
6/2
1/20
19 6
:51
PM
2016
CH
1548
9
operating short-term rentals, but the beneficiaries are disproportionately white andhigh-wealth households. Wealth from property ownership is skewed, with higher-wealth and white households holding a disproportionate share of housing wealthoverall—and an even more disproportionate share of housing wealth from nonprimaryresidences because they are much more likely to own nonprimary residential property(such as multi-unit Airbnb rentals).
The shift from traditional hotels to Airbnb lodging leads to less-reliable taxpayments to cities. Several large American cities with a large Airbnb presence relyheavily on lodging taxes. Airbnb has largely blocked the ability of these cities totransparently collect lodging taxes on Airbnb rentals that are equivalent to lodgingtaxes on hotel rooms. One study found that the voluntary agreements Airbnb hasstruck with state and local governments “[undermine] tax fairness, transparency, andthe rule of law.”
City residents likely suffer when Airbnb circumvents zoning laws that ban lodgingbusinesses from residential neighborhoods. The status quo of zoning regulations incities reflects a broad presumption that short-term travelers likely impose greaterexternalities on long-term residents than do other long-term residents. Externalitiesare economic costs that are borne by people not directly engaged in a transaction. Inthe case of neighbors on a street with short-term renters, externalities include noiseand stress on neighborhood infrastructure like trash pickup. These externalities arewhy hotels are clustered away from residential areas. Many Airbnb rental units are inviolation of local zoning regulations, and there is the strong possibility that these unitsare indeed imposing large costs on neighbors.
Because Airbnb is clearly a business competing with hotel lodging, it should besubject to the same taxation regime as hotels. In regard to zoning regulations, thereis no empirical evidence that the net benefits of Airbnb introduction and expansionare so large that policymakers should reverse long-standing regulatory decisionssimply to accommodate the rise of a single company.
Overview of the economics of AirbnbAirbnb runs an online marketplace for short-term lodging rentals. It largely does not owndwellings or real estate of its own; instead, it collects fees by acting as a broker betweenthose with dwellings to rent and those looking to book lodging.
The perception that Airbnb tries to foster is that its “hosts” are relatively typicalhouseholds looking to earn supplementary income by renting out rooms in their homes orby renting out their entire residence when they’re away. Critics argue that Airbnb bookingshave become increasingly concentrated among a relatively small number of “hosts” thatare essentially miniature hotel companies.1
3
FILE
D D
ATE:
6/2
1/20
19 6
:51
PM
2016
CH
1548
9

Potential economic benefitsAt a broad level, the potential economic benefits and costs of Airbnb are relativelystraightforward.2
The key potential benefit is that property owners can diversify the potential streams ofrevenue they generate from owning homes. Say, for example, that before Airbnb arrived ina city, property owners setting up residential rental properties faced transaction costs sohigh that it only made economic sense to secure relatively long-term leases. Thesetransaction costs incurred by property owners could include advertising for and screeningof tenants and finding alternative accommodations for themselves if they were rentingtheir own dwellings. But if the rise of internet-based service firms reduced thesetransaction costs and made short-term rentals logistically feasible and affordable for thefirst time, it could allow these property owners to diversify into short-term rentals as well aslong-term rentals.
Another potential benefit is the increased supply (and variety) of short-term rentalsavailable to travelers. This increased supply can restrain price growth for short-termrentals and make traveling more affordable.
Finally, one well-advertised potential benefit of Airbnb is the extra economic activity thatmight result if the rise of Airbnb spurs an increase in visitors to a city or town. Besides theincome generated by Airbnb property owners, income might be generated by thesevisitors as they spend money at restaurants or in grocery stores or on other activities.
Potential costsThe single biggest potential cost imposed by Airbnb comes in the form of higher housingcosts for city residents if enough properties are converted from long-term housing toshort-term accommodations. If property owners take dwellings that were available forlong-term leases and convert them to short-term Airbnb listings, this increases the supplyof short-term rentals (hence driving down their price) but decreases the supply of long-term housing, increasing housing costs for city residents. (We refer to all long-term costs ofshelter as “housing,” including rentals and owners’ equivalent rental costs.)
Another large potential city-specific cost of Airbnb expansion is the loss of tax revenue.Many cities impose relatively steep taxes on short-term lodging, hoping to obtain revenuefrom out-of-town travelers to spend on local residents. The most common andstraightforward of these revenue raisers is a tax on traditional hotel rooms. If Airbnbexpansion comes at the expense of traditional hotels, and if the apparatus for collectingtaxes from Airbnb or its hosts is less well-developed than the apparatus for collectingtaxes from traditional hotels, this could harm city revenues.
A further potential cost is the externalities that property rentals (of all kinds) impose onneighbors, for example, noise and/or use of building facilities. Since hosts are often noton-site with their renters, they do not bear the costs of these externalities and hence maynot factor them into rental decisions. Of course, one could argue that such externalities
4
FILE
D D
ATE:
6/2
1/20
19 6
:51
PM
2016
CH
1548
9
are also incurred with long-term rentals not arranged through Airbnb. But if the expansionof Airbnb increases total short- and long-term rental activity, or if short-term rentals imposelarger externalities than long-term rentals, then Airbnb expansion can increases theseexternalities.
Finally, if Airbnb expansion comes at the expense of traditional hotels, it could have anegative impact on employment. First, since some of the labor of maintaining Airbnblodgings is performed by the property owners themselves, the shift to Airbnb fromtraditional hotels would actually reduce employment overall. Second, since the task ofcleaning and maintaining rooms and even greeting Airbnb renters is often done by third-party management firms, the shift from the traditional hotel sector to Airbnb rentals coulddegrade job quality.
The rest of this report evaluates the potential scope of each of these benefits and costs,and ends with an overall assessment of the effect of Airbnb expansion.
5
FILE
D D
ATE:
6/2
1/20
19 6
:51
PM
2016
CH
1548
9
Potential benefits of Airbnbintroduction and expansion in U.S.citiesThis section elaborates on the potential benefits identified in the previous section. Foreach benefit, it assesses how likely the benefit is to emerge, provides empirical estimatesof the magnitude of the benefit, and discusses the likely distribution of the benefit.
Potential benefit one: Property owners candiversify into short-term rentalsThe most obvious benefit stemming from the creation and expansion of Airbnb accrues toproperty owners who have units to rent. Owners of residential property have essentiallythree options for earning a return on the property: They can live in the residence andhence not have to pay rent elsewhere, they can rent it out to long-term residents, or theycan rent it out to short-term visitors.
If the only barrier to renting out residential property to short-term visitors were theassociated transaction costs, then in theory the creation and expansion of Airbnb could bereducing these transaction costs and making short-term rental options more viable. It doesseem intuitive that transaction costs of screening and booking short-term renters would behigher over the course of a year than such costs for renting to long-term residents (or thecosts of maintaining owner-occupied property). However, the potential benefits are onlythe difference between what the property owner earned before the introduction of Airbnband what the property owners earned from short-term rentals booked through the Airbnbplatform.
These potential benefits are likely quite skewed to those with more wealth. While housingis more widely held than most other assets, the total value of housing wealth is (like allwealth) quite concentrated among white and high-income households. Further, because ofthe myriad benefits of owning one’s own residence, it is likely that much of the benefit ofAirbnb’s introduction and expansion accrues to those with more than one property (onefor occupying and one or more for renting).3 The distribution of property wealth generatedby nonprimary residential real estate is even more concentrated than housing wealthoverall. Figure A shows, by wealth class, the distribution of housing wealth overall and ofhousing wealth excluding owner-occupied housing.
This figure shows that the potential benefits of Airbnb introduction and expansion toproperty owners are highly concentrated. To put it simply, any economic occurrence thatprovides benefits proportional to owning property is one that will grant these benefitsdisproportionately to the wealthy. In 2016, for example, 60.0 percent of primary housingwealth (housing wealth in households’ primary residences) was held by the top 20 percent
6
FILE
D D
ATE:
6/2
1/20
19 6
:51
PM
2016
CH
1548
9

Figure A Housing wealth—particularly wealth from owning anonprimary residence—is skewedShare of total primary and nonprimary household housing wealth in the U.S.economy held by each wealth class, 2016
Note: Primary housing wealth is wealth from owner-occupied housing. Nonprimary housing wealth iswealth from nonowner-occupied housing. The wealth classes depicted overlap, with the top 20 percentbroken down into households falling within the 80th to 90th, 90th to 95th, and 96th to 99th percentiles.
Source: Author’s analysis of microdata from the Federal Reserve Board Survey of Consumer Finances(2016)
PrimaryNonprimary
Bottom50
percent
Bottom80
percent
Top 20percent
80th-90th 90th-95th 96th-99th Top 1percent
0
25
50
75
100%
of households. (Not shown in the figure is that this share has increased by 5.4 percentagepoints since 1989.) As we noted earlier, however, many Airbnb listings are actually ownedby households with multiple units to rent. Given this, Figure A also shows the share ofhousing wealth from nonprimary residences held by various groups. This “nonprimaryhousing wealth” is far more skewed. For example, the top 20 percent hold 90.1 percent ofthis type of wealth.
Figure B shows the distribution of housing wealth by race and ethnicity. Across racialgroups, more than 80 percent of wealth in one’s primary residence was held by whitehouseholds. African American households held just 6.5 percent of wealth in primaryresidences, Hispanic households held 6.0 percent of this type of wealth, while householdsof other races and ethnicities held 6.9 percent. Not shown is the change in the share ofwealth in primary residences held by racial and ethnic groups: Primary housing wealthheld by nonwhite households has risen a bit (by roughly 6 percentage points) since 1989.As with the distribution by wealth class, the holdings of nonprimary housing wealth by raceand ethnicity are again even more skewed, with white households holding more than 86percent of this type of wealth. African American households hold just 5.0 percent ofnonprimary housing wealth, Hispanic households hold 3.6 percent, and households ofother races and ethnicities hold 5.2 percent.
7
FILE
D D
ATE:
6/2
1/20
19 6
:51
PM
2016
CH
1548
9
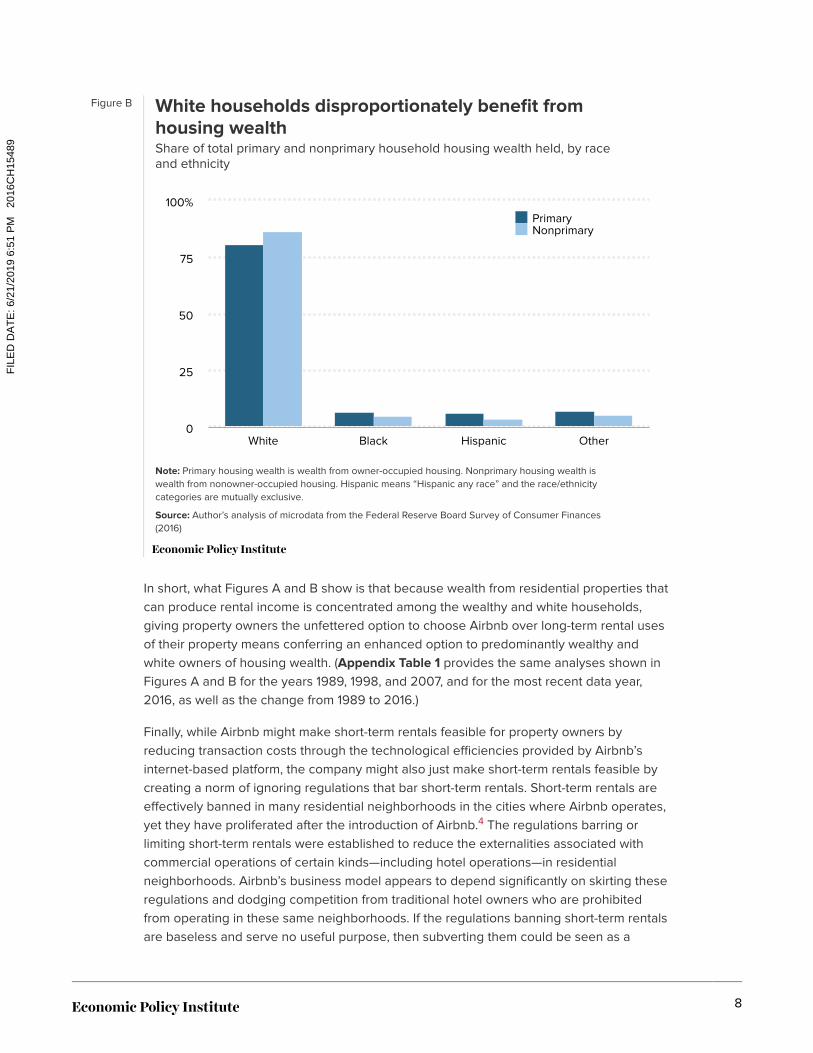
Figure B White households disproportionately benefit fromhousing wealthShare of total primary and nonprimary household housing wealth held, by raceand ethnicity
Note: Primary housing wealth is wealth from owner-occupied housing. Nonprimary housing wealth iswealth from nonowner-occupied housing. Hispanic means “Hispanic any race” and the race/ethnicitycategories are mutually exclusive.
Source: Author’s analysis of microdata from the Federal Reserve Board Survey of Consumer Finances(2016)
PrimaryNonprimary
White Black Hispanic Other0
25
50
75
100%
In short, what Figures A and B show is that because wealth from residential properties thatcan produce rental income is concentrated among the wealthy and white households,giving property owners the unfettered option to choose Airbnb over long-term rental usesof their property means conferring an enhanced option to predominantly wealthy andwhite owners of housing wealth. (Appendix Table 1 provides the same analyses shown inFigures A and B for the years 1989, 1998, and 2007, and for the most recent data year,2016, as well as the change from 1989 to 2016.)
Finally, while Airbnb might make short-term rentals feasible for property owners byreducing transaction costs through the technological efficiencies provided by Airbnb’sinternet-based platform, the company might also just make short-term rentals feasible bycreating a norm of ignoring regulations that bar short-term rentals. Short-term rentals areeffectively banned in many residential neighborhoods in the cities where Airbnb operates,yet they have proliferated after the introduction of Airbnb.4 The regulations barring orlimiting short-term rentals were established to reduce the externalities associated withcommercial operations of certain kinds—including hotel operations—in residentialneighborhoods. Airbnb’s business model appears to depend significantly on skirting theseregulations and dodging competition from traditional hotel owners who are prohibitedfrom operating in these same neighborhoods. If the regulations banning short-term rentalsare baseless and serve no useful purpose, then subverting them could be seen as a
8
FILE
D D
ATE:
6/2
1/20
19 6
:51
PM
2016
CH
1548
9

benefit of Airbnb. But allowing large corporations such as Airbnb to simply ignoreregulations—rather than trying to change them through democratic processes—is hardlythe basis of sound public policy.
Potential benefit two: Increased options andprice competition for travelers’ accommodationsAirbnb is essentially a positive supply shock to short-term accommodations. Like allpositive supply shocks, it should be expected to lower prices. There is some accumulatingevidence that Airbnb does exactly this. Zervas, Proserpio, and Byers (2017) examine theeffect of Airbnb expansion across cities in Texas. They find that each 10 percent increasein the size of the Airbnb market results in a 0.4 percent decrease in hotel room revenue.They find that most of this revenue decline is driven by price declines. Evidence of thepositive supply shock is particularly evident in the 10 American cities where Airbnb’spresence is largest. Dogru, Mody, and Suess (2019) find a negative correlation betweenAirbnb expansion and hotels’ average daily rates in the 10 U.S. cities with the largestAirbnb presence.
Besides cost, the introduction and expansion of Airbnb could improve the perceivedquality of accommodations available. There is some limited evidence that this is the case:a survey by doctoral candidate Daniel Adams Guttentag (2016) finds that “convenientlocation” is one of the top reasons given by Airbnb guests when asked why they chosethe service. But the Guttentag 2016 survey also identifies “low cost” as the single most-identified reason people give when asked why they chose Airbnb.
However, it should be stressed that this potential benefit of Airbnb introduction andexpansion is overwhelmingly a redistribution of welfare, not an increase in economywidewelfare. Very few people have claimed that Airbnb’s spread within a given city has leddevelopers to build more accommodations in the city overall. Instead, owners or thirdparties have often turned long-term rental units into short-term lodging via Airbnb.
The question then becomes, “Has this redistribution of potential accommodations from thelong-term to the short-term market increased economic welfare overall?” One way thatAirbnb could be increasing economic welfare overall is if it were helping travelers dealwith rising travel accommodation costs.
By looking at trends in prices and spending in the short-term lodging sector, we can get acommonsense check on whether high prices for short-term travel accommodations are apressing economic problem for ordinary American households. If the price of short-termtravel accommodations were rising rapidly, then presumably an increase in supply thatrestrained price increases would be valuable (or at least more valuable than if these priceswere not showing any particularly trend). The two lines in Figure C show changes in theconsumer price index for travel accommodations compared with changes in the overallprice index for personal consumption expenditures (PCE). According to Figure C, in the2010s, the price of short-term travel accommodations has grown faster than prices overallonly since 2014—this is the same year that ushered in the large-scale expansion of Airbnb.
9
FILE
D D
ATE:
6/2
1/20
19 6
:51
PM
2016
CH
1548
9
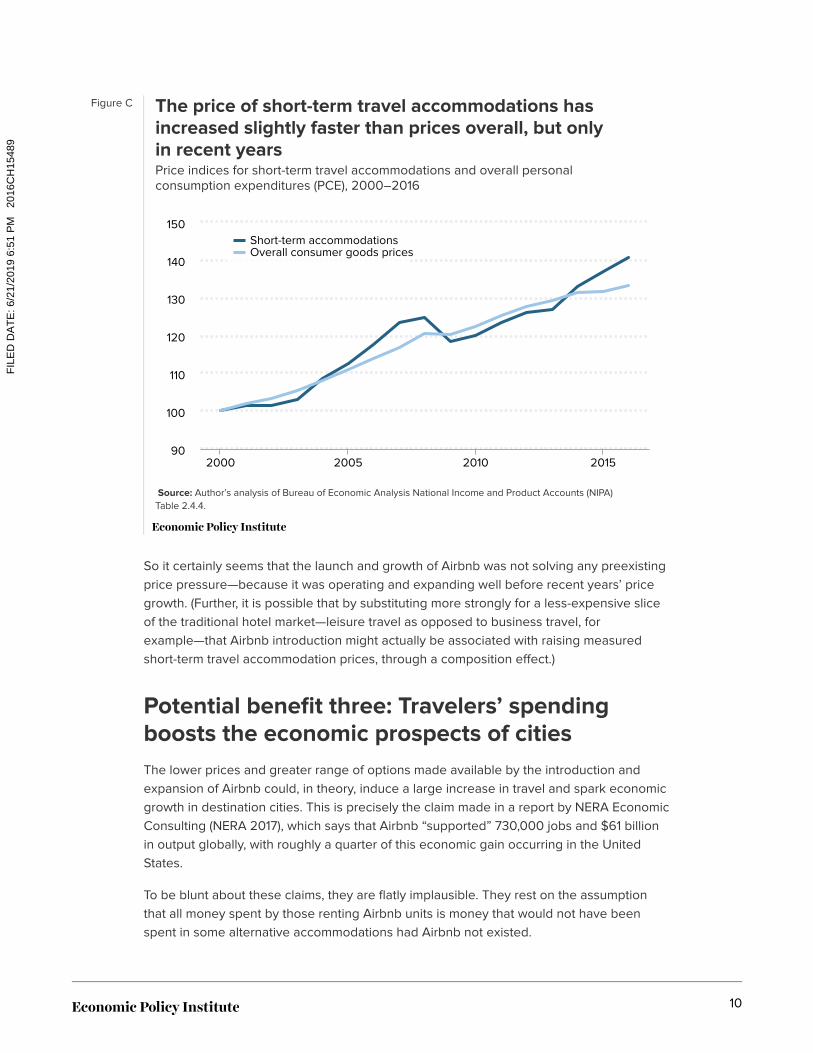
Figure C The price of short-term travel accommodations hasincreased slightly faster than prices overall, but onlyin recent yearsPrice indices for short-term travel accommodations and overall personalconsumption expenditures (PCE), 2000–2016
Source: Author’s analysis of Bureau of Economic Analysis National Income and Product Accounts (NIPA)Table 2.4.4.
Short-term accommodationsOverall consumer goods prices
2000 2005 2010 201590
100
110
120
130
140
150
So it certainly seems that the launch and growth of Airbnb was not solving any preexistingprice pressure—because it was operating and expanding well before recent years’ pricegrowth. (Further, it is possible that by substituting more strongly for a less-expensive sliceof the traditional hotel market—leisure travel as opposed to business travel, forexample—that Airbnb introduction might actually be associated with raising measuredshort-term travel accommodation prices, through a composition effect.)
Potential benefit three: Travelers’ spendingboosts the economic prospects of citiesThe lower prices and greater range of options made available by the introduction andexpansion of Airbnb could, in theory, induce a large increase in travel and spark economicgrowth in destination cities. This is precisely the claim made in a report by NERA EconomicConsulting (NERA 2017), which says that Airbnb “supported” 730,000 jobs and $61 billionin output globally, with roughly a quarter of this economic gain occurring in the UnitedStates.
To be blunt about these claims, they are flatly implausible. They rest on the assumptionthat all money spent by those renting Airbnb units is money that would not have beenspent in some alternative accommodations had Airbnb not existed.
10
FILE
D D
ATE:
6/2
1/20
19 6
:51
PM
2016
CH
1548
9
Say, for example, that guests at Airbnb properties spent $10 million in New York City in2016, including the money spent at restaurants and theaters and other attractions whilevisiting the city. The rental payment these guests make is included in the NERA numbers,but is expressed as extra income for Airbnb hosts. NERA then takes this entire $10 millionin spending (both nonaccommodation spending by visitors and the extra income going toAirbnb hosts) and runs it through input–output models to generate multiplier effects thatyield their final numbers for output and employment supported in each city.
There are a number of problems with the NERA study. First, it is surprisingly opaque. Itdoes not provide overall global and U.S. spending numbers or break these numbers intotheir components: nonaccommodation spending by Airbnb guests and income generatedfor Airbnb hosts. It also does not report the assumed size of the multiplier. Rather, itprovides final numbers for global and U.S. output and employment that are functions ofprimary spending flows multiplied by the effects of their input–output model. The studystates that it uses the well-known IMPLAN model, but IMPLAN can generate multipliers ofvarying size: It would be valuable to know just how large NERA is assuming the multipliereffects of this Airbnb-related spending is, just as a plausibility check.
Second, the study seems clearly written to maximize the perceived support Airbnb mightprovide local economies—both now and into the future. For example, toward the end ofthe report NERA provides several tables showing projected support for output andemployment for years after the study (from 2017 to 2025). These projected futurecontributions to output and employment dwarf the contribution that is apparent in theactual data analyzed by NERA. But these projections rely on overoptimistic assumptionsabout Airbnb’s future growth. For example, NERA forecasts growth of 75 percent forAirbnb arrivals in 2017,5 but another study (Molla 2017) suggests that these arrivals in factgrew by closer to 25–50 percent, with growth rates particularly slowing in the U.S. and theEuropean Union.6
What is by far the most important weakness of the NERA analysis is its reliance on theassumption that all spending done by travelers staying at Airbnb properties is spendingthat would not have been done had Airbnb not existed. The possibility that Airbnb visitorswould still have visited a city even if Airbnb units were unavailable—by securing alternativeaccommodations—is completely ruled out by the NERA analysis. This is obviously anincorrect assumption. For example, it assumes that Airbnb and traditional hotels are notseen as potential substitutes for each other in the minds of travelers. But research hasshown that they are quite close substitutes. Zervas, Proserpio, and Byers (2017) empiricallyassess the effect of Airbnb’s expansion on the hotel industry in the state of Texas. In theirintroduction, they write, “Our hypothesis is that some stays with Airbnb serve as asubstitute for certain hotel stays, thereby impacting hotel revenue….” In their discussionsand conclusions section, they summarize what their empirical investigation has found:“Focusing on the case of Airbnb, a pioneer in shared accommodations, we estimate thatits entry into the Texas market has had a quantifiable negative impact on local hotel roomrevenue.” Put simply, this result is completely inconsistent with the assumption that Airbnbhas no potential substitutes for those using its services. This in turn means that at leastsome of the economic activity “supported” in local economies by spending done byAirbnb guests is activity that would have been supported absent Airbnb, likely by these
11
FILE
D D
ATE:
6/2
1/20
19 6
:51
PM
2016
CH
1548
9

same guests staying in traditional hotels or other accommodations.
As discussed in a previous section, Guttentag (2016) reports the findings of a survey ofAirbnb users. Among other questions, the survey explicitly asks how substitutabletravelers find Airbnb lodgings. The precise question is, “Thinking about your most recentAirbnb stay—If Airbnb and other similar person-to-person paid accommodations services(e.g., VRBO) did not exist, what type of accommodation would you have most likely used?”Only 2 percent of Airbnb users responded to this question with the assertion that theywould not have taken the trip. The remaining 98 percent identified other lodgingpossibilities that they would have used. In a similar survey that included some businesstravelers, Morgan Stanley Research 2017 reports near-identical findings, with between 2and 4 percent of respondents saying that they would not have undertaken a trip but forthe presence of Airbnb.7 In both the Morgan Stanley Research survey and the Guttentagsurvey, roughly three-fourths of the respondents indicated that Airbnb was substituting fora traditional hotel.
If the Guttentag 2016 and Morgan Stanley Research 2017 findings are correct, this impliesthat NERA overstates the support Airbnb provides to local economies by somewherebetween 96 and 98 percent. It is possible that some flows of spending might support morelocal spending when associated with Airbnb instead of traditional hotels—for example, onecould argue that income accruing to Airbnb hosts is more likely to be spent locally thanmoney paid to large hotel chains. However, the reverse is also true—for example, Airbnbrentals are far more likely to come equipped with a kitchen, and so Airbnb lodgers mightbe more likely to eat in rather than patronize restaurants.
Additionally, the local spillover spending associated with Airbnb expansion might not beuniform across neighborhoods. Alyakoob and Rahman (2018) document a modest increasein local restaurant spending associated with expanding Airbnb presence. Essentially,restaurants located away from central hotel cores in cities are unlikely to attract many out-of-town tourists. But if Airbnb penetration in outlying neighborhoods increases, restaurantsthere might now be able to tap some of this tourist market. Alyakoob and Rahman find thatevery 2 percent rise in Airbnb activity in a given neighborhood increases restaurantemployment in that neighborhood by 3 percent. Crucially, Alyakoob and Rahman make nosuch calculation for potential employment-depressing effects of restaurants closer totraditional hotels. Further, they find that the boost to restaurant employment given bygreater Airbnb activity does not occur in areas with a relatively high share of AfricanAmerican residents.
Finally, given that the overwhelming share of jobs “supported” by Airbnb are jobs thatwould have been supported by guests in some alternative accommodation, it seems likelythat even if there is a slight increase in spending associated with a slight (about 2 percent)increase in visitors to a city due to Airbnb, there may well be a decline in jobs. We havenoted previously that it is quite possible that traditional hotels are a more labor-intensivesource of accommodation than are Airbnb listings. If, for example, Airbnb operatorsemploy fewer people to provide cleaning and concierge and security services, then eachdollar spent on Airbnb accommodations is likely to support less employment than eachdollar spent on traditional hotel accommodations.
12
FILE
D D
ATE:
6/2
1/20
19 6
:51
PM
2016
CH
1548
9
We can gauge the employment effect with a hypothetical scenario that assumes that theGuttentag 2016 and Morgan Stanley Research 2017 analyses are correct and that only 2 to4 percent of the spending supported by Airbnb represents net new spending to a locality.In this case, if even half of the overall spending “supported” by Airbnb is a pureexpenditure shift away from traditional hotels, and if traditional hotels are even 5 to 10percent more labor-intensive than Airbnb units, then introducing Airbnb would actuallyhave a negative effect on employment.8
Even if one grants that 2 to 4 percent of the output supported by Airbnb in host cities isnet new spending, this spending is just a redistribution away from other, presumably less-Airbnb-intensive, localities. Given that Airbnb has tended to grow in already rich anddesirable cities, it is unclear why inducing the transfer of even more economic activityaway from other cities toward thriving cities would ever be viewed as a positive policyoutcome.
In short, the results of the NERA study should be ignored by policymakers seeking anaccurate sense of the scale of Airbnb expansion costs and benefits.9
Potential costs of Airbnb introductionand expansionThis section elaborates on the potential costs highlighted in the overview section. Itassesses the likely outcome of these costs, estimates their empirical heft, and assessesthe likely distribution of these costs.
Potential cost one: Long-term renters face risinghousing costsThe mirror image of Airbnb’s positive supply shock to short-term travel accommodations isits negative supply shock to long-term housing options. Again, none of the literaturereviewed in this paper suggests that the introduction and expansion of Airbnb has spurredmore residential construction overall, so as more units become available to Airbnbcustomers, this means that fewer potential housing units are available to long-term rentersor owner-occupiers in a city.
Earlier, we saw that price increases in short-term travel accommodations have been in linewith overall consumer price increases in recent years, suggesting that there is no obviousshortage in short-term accommodations. (It is important to note that the tracking of short-term travel accommodation prices and overall prices was tight well before Airbnb wasexerting any serious effect one way or the other on prices.) However, national prices oflong-term housing are rising faster than overall prices, suggesting a shortage of long-termhousing. Because of this above-inflation growth in long-term housing costs, any trend thatexacerbates this increase is more damaging than if these prices had been relatively flat inrecent years. Figure D shows inflation in the price indices for housing (long-term rentals as
13
FILE
D D
ATE:
6/2
1/20
19 6
:51
PM
2016
CH
1548
9
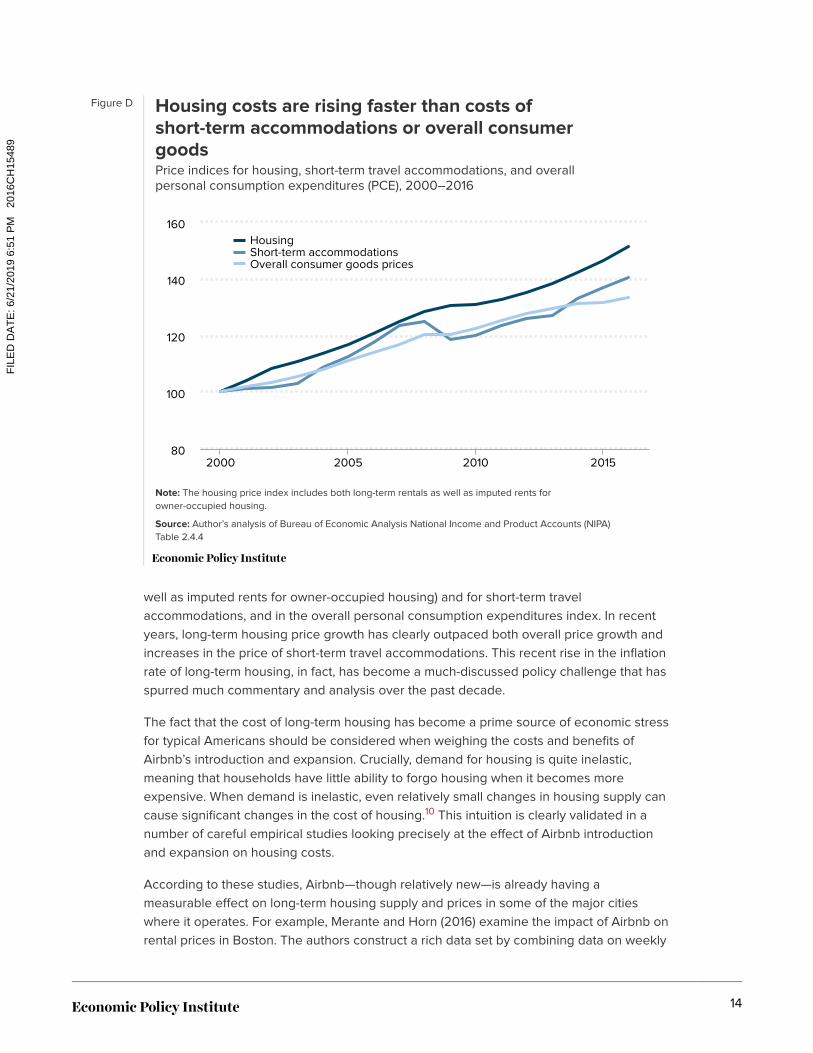
Figure D Housing costs are rising faster than costs ofshort-term accommodations or overall consumergoodsPrice indices for housing, short-term travel accommodations, and overallpersonal consumption expenditures (PCE), 2000–2016
Note: The housing price index includes both long-term rentals as well as imputed rents forowner-occupied housing.
Source: Author’s analysis of Bureau of Economic Analysis National Income and Product Accounts (NIPA)Table 2.4.4
HousingShort-term accommodationsOverall consumer goods prices
2000 2005 2010 201580
100
120
140
160
well as imputed rents for owner-occupied housing) and for short-term travelaccommodations, and in the overall personal consumption expenditures index. In recentyears, long-term housing price growth has clearly outpaced both overall price growth andincreases in the price of short-term travel accommodations. This recent rise in the inflationrate of long-term housing, in fact, has become a much-discussed policy challenge that hasspurred much commentary and analysis over the past decade.
The fact that the cost of long-term housing has become a prime source of economic stressfor typical Americans should be considered when weighing the costs and benefits ofAirbnb’s introduction and expansion. Crucially, demand for housing is quite inelastic,meaning that households have little ability to forgo housing when it becomes moreexpensive. When demand is inelastic, even relatively small changes in housing supply cancause significant changes in the cost of housing.10 This intuition is clearly validated in anumber of careful empirical studies looking precisely at the effect of Airbnb introductionand expansion on housing costs.
According to these studies, Airbnb—though relatively new—is already having ameasurable effect on long-term housing supply and prices in some of the major citieswhere it operates. For example, Merante and Horn (2016) examine the impact of Airbnb onrental prices in Boston. The authors construct a rich data set by combining data on weekly
14
FILE
D D
ATE:
6/2
1/20
19 6
:51
PM
2016
CH
1548
9

rental listings from online sources and data from Airbnb listings scraped from web pages.They find that each 12 Airbnb listings per census tract leads to an increase in asking rentsof 0.4 percent. It is important to note that this is a finding of causation, not just correlation.They put this finding in perspective as follows:
If Airbnb’s growth rate in 2015, 24%, continues for the next three years, assumingconstant mean rents and total number of housing units, Boston’s mean asking rentsin January 2019 would be as much as $178 per month higher than in the absence ofAirbnb activity. We further find evidence that Airbnb is increasing asking rentsthrough its suppression of the supply of rental units offered for rent. Specifically, aone standard deviation increase in Airbnb listings [an average of 12 units percensus tract] relative to total housing units is correlated with a 5.9% decrease in thenumber of rental units offered for rent. (Merante and Horn 2016)
Barron, Kung, and Proserpio (2018) undertake a similar exercise with different data. Theycreate a data set that combines Airbnb listings, home prices and rents from the online realestate firm Zillow, and time-varying ZIP code characteristics (like median householdincome and population) from the American Community Survey (ACS). To account for thefact that rents and Airbnb listings might move together even if there is no causalrelationship (for example, if both are driven by the rising popularity of a given city), theyconstruct an instrumental variable to identify the causal effect of rising Airbnb listings onrents. Using this instrument, they find that a 10 percent increase in Airbnb listings in a ZIPcode leads to a 0.42 percent increase in ZIP code rental prices and a 0.76 percentincrease in house prices. They also find that the increase in rents is larger in ZIP codeswith a larger share of nonowner-occupied housing. Finally, like Merante and Horn, theyfind evidence that Airbnb listings are correlated with a rise in landlords shifting away fromlong-term and toward short-term rental operations.
Sheppard and Udell (2018) also undertake a similar exercise, looking withinneighborhoods of New York City. Their key finding is that a doubling of Airbnb activitywithin a tight geographic zone surrounding a home sale is associated with a 6 to 11percent increase in sales prices. Their coefficient values are quite close to those fromBarron, Kung, and Proserpio (2018).11
Wachsmuth et al. (2018) apply the regression results identified by Barron, Kung, andProserpio (2018) to the large increase in Airbnb rentals in New York City. They find a 1.4percent increase in NYC rents from 2015 to 2017 due to Airbnb’s expansion in that city. Forthe median NYC renter, this implies a $384 annual increase in rent from 2015 to 2017 dueto Airbnb’s expansion over that time.
Potential cost two: Local government taxcollections fallFor the localities making policy decisions regarding the expansion of Airbnb, perhaps thesingle biggest consideration is fiscal. Across the United States, total lodging taxes aresignificant: For the 150 largest cities, the all-in lodging tax rate (including state, county, and
15
FILE
D D
ATE:
6/2
1/20
19 6
:51
PM
2016
CH
1548
9
city taxes) averaged more than 13 percent (Hazinski, Davis, and Kremer 2018). Thetemptation for any given locality to set relatively high lodging tax rates (particularly whencompared with overall sales tax rates) seems clear—city residents pay little of the lodgingtax but still enjoy the benefits funded by the tax. For a number of cities, the total revenuecollected is substantial. In 2016, for example, New York City and Las Vegas each collectedwell over $500 million in lodging taxes, and San Francisco collected just under $400million.
It seems odd to exclude Airbnb stays from the lodging tax, yet the tax treatment of Airbnbrentals is inconsistent and incomplete. The company has entered into a number of taxagreements with state and local governments and is clearly trying to build the impressionthat it wants to help these governments collect taxes. Yet a number of tax experts arguethat Airbnb’s efforts to collect and remit lodging taxes (as well as other taxes) have beenwholly insufficient.
A description in Schiller and Davis 2017 of the state of Airbnb’s tax agreements as of early2017 highlights the patchy, voluntary nature of the tax regime that Airbnb faces:
Airbnb, whose operations in some instances may violate traditional local zoning andrental ordinances, has sought to legitimize its business by negotiating agreementswith cities under which it will collect local sales and lodging taxes. “Workingtogether, platforms like Airbnb can help governments collect millions of dollars inhotel and tourist tax revenue at little cost to them,” the company stated in a “policytool chest” it offered in late 2016.
Overall, by Airbnb’s count, the company is collecting sales, hotel, or other taxes in26 states and the District of Columbia (DC) as of March 1, 2017. State-level taxes arecollected in 18 of those states. Among this group, some or all local-level taxes arealso being collected in every state except Connecticut, which lacks local lodgingtaxes. In the remaining eight states, Airbnb collects a patchwork of local taxes butno state taxes. In three states—Alaska, Maryland, and New Jersey—Airbnb’s taxcollection is limited to a single locality (Anchorage, Montgomery County, and JerseyCity, respectively). The company has dramatically expanded its tax collectionpractices in recent years and appears poised to continue its expansion in themonths and years ahead. Airbnb recently announced that it will soon begincollecting state lodging taxes in Maine, for instance.
Dan Bucks, a former director of the Montana Department of Revenue and former executivedirector of the Multistate Tax Commission, wrote a report assessing the tax agreementsthat Airbnb has struck with state and local governments in different parts of the country.His central finding is that these agreements “[undermine] tax fairness, transparency, andthe rule of law” (Bucks 2017).
Bucks examines 12 of the Airbnb tax agreements from across the country that had beenmade public by mid-2017. He describes them as follows:
Airbnb devises and presents to tax agencies what are typically ten to twelve-pagedocuments covering back-tax forgiveness, prospective payments, information
16
FILE
D D
ATE:
6/2
1/20
19 6
:51
PM
2016
CH
1548
9
access and multiple other terms that produce, as this report documents, seriousnegative consequences for society. Airbnb labels these documents as “voluntarycollection agreements,” which they most assuredly are not. These Airbnb-drafteddocuments do not guarantee the proper collection of taxes due. They block taxagencies from verifying the accuracy of Airbnb payments. Airbnb may be seekingto superficially to liken these documents to the high quality “voluntary disclosureagreements” that states use to bring non-compliant taxpayers into full conformitywith the law. However, these documents profoundly undermine sound taxadministration and the rule of law. For these and other reasons detailed below, wewill not use Airbnb’s misleading label for these documents but will refer to themobjectively as “Airbnb agreements.” (Bucks 2017)
The most specific criticism Bucks makes is that these agreements have largely been keptsecret from the public, in clear contrast to other “voluntary disclosure agreements.” Thissecrecy, combined with agreements to “cede substantial control of the payment and auditprocesses to Airbnb,” make it impossible for tax authorities to ensure proper payment oflodging taxes. Bucks also argues that these agreements between Airbnb and state andlocal governments provide large benefits to third parties (Airbnb hosts) who are notsignatories and are not obligated to provide anything in exchange for these benefits.
In 2016, an analysis from AlltheRooms.com forecast that Airbnb’s failure to ensure the fullpayment of lodging taxes was on track to cost subnational governments a combined $440million in revenue unless policymakers moved to guarantee proper payment. Of the total,$110 million in lost revenue was for New York City alone. In October 2016, shortly after theAlltheRooms.com analysis was released, New York City passed restrictions on Airbnbadvertisements for rentals of less than 30 days when an owner is not present. While theserestrictions may have stemmed the loss of revenue relative to the AlltheRooms.comprojection, the analysis that predated the restrictions highlight how the unregulatedexpansion of Airbnb, and its cannibalization of traditional hotel business market share,could still have large fiscal implications for New York and other cities.
Finally, even if Airbnb were to fully comply with the local jurisdiction’s tax system onlodgings and pay the same tax rate per dollar earned as traditional hotels, there likelywould still be some small fiscal losses stemming from Airbnb’s expansion. The primaryappeal of Airbnb to most travelers is lower-price accommodations, so even if the same taxrate were paid on Airbnb rentals as is paid on hotel rooms, the lower Airbnb prices wouldlead to less tax revenue accruing to local governments.
Potential cost three: Externalities inflicted onneighborsWhen owners do not reside in their residential property, this can lead to externalitiesimposed on the property’s neighbors. If absentee owners, for example, do not face thecost of noise or stress on the neighborhood’s infrastructure (capacity for garbage pickup,for example), then they will have less incentive to make sure that their renters arerespectful of neighbors or to prevent an excessive number of people from occupying their
17
FILE
D D
ATE:
6/2
1/20
19 6
:51
PM
2016
CH
1548
9
property.
These externalities could be worse when the renters in question are short term. Long-termrenters really do have some incentive to care about the neighborhood’s long-run comityand infrastructure, whereas short-term renters may have little to no such incentive. Further,some Airbnb hosts are renters themselves who are subletting a long-term rental propertyto short-term travelers, which may further shield the ultimate property owners from bearingthe costs faced by immediate neighbors. In cities where the spread of Airbnb has becomea political issue, hundreds (if not thousands) of complaints have been made in thisregard.12
The potential for such externalities has been broadly recognized for a long time and was aconsideration leading to the prevalence of zoning laws that ban short-term travelaccommodations in residential neighborhoods. There is a reason, for example, why TimesSquare in New York City is a cluster of hotels while the Upper East Side is largely a lessnoisy cluster of residential dwellings. There is of course no reason why such past zoningdecisions need to be completely sacrosanct and never changed, but these decisions weremade for a reason, and changes to them should be subject to democratic debate.
While researchers have often noted the possibility that Airbnb may impose externalities onthe communities surrounding Airbnb units, we know of no empirical estimates of theseexternalities. If these externalities were powerful enough in degrading the desirability ofneighborhoods, they could in theory lead to reduced rents and home prices. From theevidence of the previous section, we know that Airbnb adoption in neighborhoods hasactually boosted rental and home prices. But this price boost doesn’t mean theseexternalities don’t exist—it simply means that price-depressing externalities are offset bythe supply effect of moving properties out of the long-term rental market.
Miller (2016) makes an interesting (if likely too abstract) policy proposal for dealing with theexternalities associated with home rental via Airbnb. He proposes creating a market in“transferable sharing rights,” in which, for example, each resident of a neighborhoodwould be given the right to rent out one housing unit for one night. Most residents in aneighborhood won’t want to rent out their home. But those who do want to rent out unitsusing Airbnb would want far more than the right to rent out these properties for just onenight. To obtain the right to rent out their properties for more nights, they would need topurchase permits from their neighbors. The price it takes to obtain these permits wouldprovide a good indicator of the true costs of the externalities imposed by Airbnb. A citythat experimented with these tradeable sharing rights could provide very usefulinformation.
Potential cost four: Job quantity and qualitycould sufferWe have noted already that when Airbnb enters and expands in a city, it shifts travelerbusiness from hotels to Airbnb, leading to downward price pressure for hotels. This shiftfrom traditional hotels to Airbnb properties also implies either a shift in jobs or a reduction
18
FILE
D D
ATE:
6/2
1/20
19 6
:51
PM
2016
CH
1548
9

in jobs. As an example, take hotel cleaning workers. As more visitors to a city pick Airbnbunits over traditional hotel accommodations, the need for cleaning doesn’t go away.Instead, it is either foisted on Airbnb proprietors, done by third-party cleaning services, orleft unmet and thus implicitly imposing costs on both travelers and the surroundingneighborhood (think of improperly disposed-of trash).
Given that much of the growth of Airbnb in recent years has been driven by hosts withmultiple properties (which, when in a single location, are in effect mini hotels), it is notsurprising to see an emergence of cleaning services specifically serving Airbnb hosts.13
These new cleaning services may be less likely to offer decent wages relative totraditional travel lodging; it may also be more difficult for workers to unionize in thiscontext. For example, in the 10 U.S. cities with a particularly large Airbnb presence(including New York City, Los Angeles, and Chicago), combined unionization rates formaids and cleaners in the hotel industry are nearly double the unionization rates of maidsand cleaners in other industries in the economy.14
In some sense, the shift in cleaning jobs from traditional hotels to cleaning services forAirbnb hosts is likely analogous in its economic effects to what happens when traditionalhotels outsource their own cleaning staffs. Dube and Kaplan (2010) demonstrate largenegative wage effects stemming from this type of domestic outsourcing for janitors andsecurity guards. Their findings are reinforced by recent analysis of the German labormarket by Goldschmidt and Schmieder (2017), who find similar large negative effects ofdomestic outsourcing on a range of occupations, including cleaners. While these studiesdo not directly examine the effect of substituting in-house hotel cleaning jobs for Airbnbcleaning jobs, they both track the effect of “fissuring” between the entity that uses andpays for the service and the entity that manages the service providers. This fissuring hasbeen a key and troubling feature of the American labor market in recent decades, and it ishard to see how the substitution of Airbnb for traditional hotels does not potentiallyconstitute another layer of this fissuring.15
This potential for Airbnb to degrade the quality of cleaning jobs is recognized even by thecompany itself: Airbnb offers hosts the opportunity to advertise that they have taken the“living wage pledge” by committing to pay a living wage to the cleaners and servicers oftheir properties. It is not clear how commitment to this pledge is (or can be) enforced,however.
Conclusion: Airbnb should have to playby the same rules as other lodgingprovidersThe current policy debates sparked by the rise of Airbnb have largely concerned taxcollections and the emergence of “mini hotels” in residential neighborhoods. At itsinception, Airbnb advertised itself as a way for homeowners (or long-term renters) to rentout a room in their primary residence, or as a way for people to rent out their dwellings for
19
FILE
D D
ATE:
6/2
1/20
19 6
:51
PM
2016
CH
1548
9

Figure E Housing costs matter much more to householdbudgets than short-term lodging costsShares of average household personal consumption expenditures devoted tohousing vs. short-term travel accommodations, 1979, 2000, and 2016
Note: The housing price index includes both long-term rentals as well as imputed rents forowner-occupied housing.
Source: Author’s analysis of Bureau of Economic Analysis National Income and Product Accounts (NIPA)Table 2.5.5
0.6% 0.8% 1.0%
13.7%14.9%
15.8%
Short-term accommodationsHousing
1979 2000 20160
5
10
15
20%
short periods while they themselves are traveling. However, in recent years Airbnb listingsand revenues have become dominated by “multi-unit” renters—absentee property ownerswith multiple dwellings who are essentially running small-scale lodging companies on anongoing basis.
This evolution of Airbnb into a parallel hotel industry raises questions about thepreferential treatment afforded to this rental company. These questions include, “Why isn’tAirbnb required to ensure that lodging taxes are collected, as traditional hotels are?” And,“Why is Airbnb allowed to offer short-term rentals in residential neighborhoods that are notzoned for these uses, while traditional hotels are not allowed in these sameneighborhoods?”
While there are plenty of other considerations, the spread of Airbnb seems at its core tobe a shift of potential housing supply from the long-term residential housing market to themarket for short-term accommodations. This shift of supply can lower prices for travelersbut raise housing prices for long-term residents. This seems like a bad trade-off, simplybased on the share of long-term housing expenses versus short-term travel expenses inaverage family budgets. Figure E presents the share of total personal consumptionexpenditures accounted for by housing and by short-term travel accommodations. As thefigure shows, housing costs eat up far more of the average household’s budget, and risinghousing prices mean that long-term housing has grown more as a share of family budgets
20
FILE
D D
ATE:
6/2
1/20
19 6
:51
PM
2016
CH
1548
9

than short-term travel accommodations.
This rising cost of housing has become a major economic stress for many Americanhouseholds. Anything that threatens to exacerbate this stress should face close scrutiny. Areasonable reading of the available evidence suggests that the costs imposed on renters’budgets by Airbnb expansion substantially exceed the benefits to travelers. It is far fromclear that any other benefits stemming from the expansion of Airbnb could swamp thecosts it imposes on renters’ budgets.
There may be plenty wrong with the status quo in cities’ zoning decisions. But the properway to improve local zoning laws is not to simply let well-funded corporations ignore thestatus quo and do what they want. As this report shows, there is little evidence that the netbenefit of accelerated Airbnb expansion is large enough to justify overturning previousconsiderations that led to the regulatory status quo—in fact, the costs of further Airbnbexpansion seem likely to be at least as large, if not larger, than the benefits.
About the authorJosh Bivens joined the Economic Policy Institute in 2002 and is currently EPI’s director ofresearch. His primary areas of research include macroeconomics, social insurance, andglobalization. He has authored or co-authored three books (including The State of WorkingAmerica, 12th Edition) while working at EPI, has edited another, and has written numerousresearch papers, including for academic journals. He appears often in media outlets tooffer economic commentary and has testified several times before the U.S. Congress. Heearned his Ph.D. from The New School for Social Research.
21
FILE
D D
ATE:
6/2
1/20
19 6
:51
PM
2016
CH
1548
9
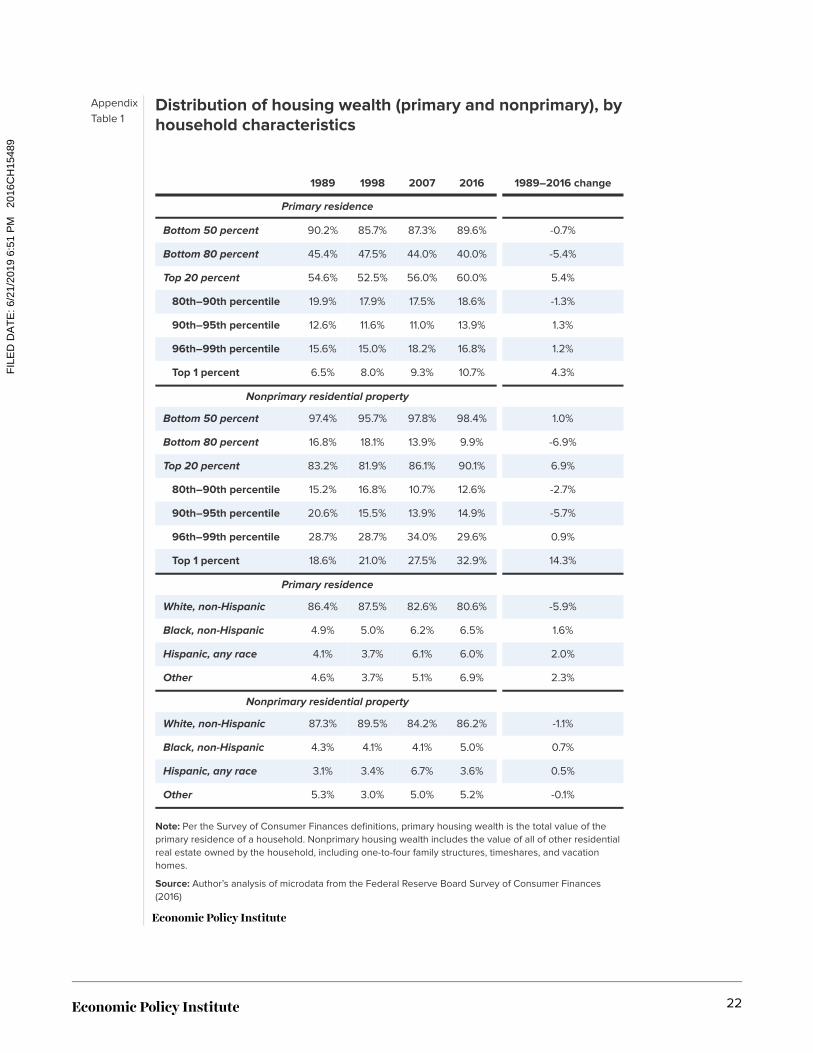
AppendixTable 1
Distribution of housing wealth (primary and nonprimary), byhousehold characteristics
1989 1998 2007 2016 1989–2016 change
Primary residence
Bottom 50 percent 90.2% 85.7% 87.3% 89.6% -0.7%
Bottom 80 percent 45.4% 47.5% 44.0% 40.0% -5.4%
Top 20 percent 54.6% 52.5% 56.0% 60.0% 5.4%
80th–90th percentile 19.9% 17.9% 17.5% 18.6% -1.3%
90th–95th percentile 12.6% 11.6% 11.0% 13.9% 1.3%
96th–99th percentile 15.6% 15.0% 18.2% 16.8% 1.2%
Top 1 percent 6.5% 8.0% 9.3% 10.7% 4.3%
Nonprimary residential property
Bottom 50 percent 97.4% 95.7% 97.8% 98.4% 1.0%
Bottom 80 percent 16.8% 18.1% 13.9% 9.9% -6.9%
Top 20 percent 83.2% 81.9% 86.1% 90.1% 6.9%
80th–90th percentile 15.2% 16.8% 10.7% 12.6% -2.7%
90th–95th percentile 20.6% 15.5% 13.9% 14.9% -5.7%
96th–99th percentile 28.7% 28.7% 34.0% 29.6% 0.9%
Top 1 percent 18.6% 21.0% 27.5% 32.9% 14.3%
Primary residence
White, non-Hispanic 86.4% 87.5% 82.6% 80.6% -5.9%
Black, non-Hispanic 4.9% 5.0% 6.2% 6.5% 1.6%
Hispanic, any race 4.1% 3.7% 6.1% 6.0% 2.0%
Other 4.6% 3.7% 5.1% 6.9% 2.3%
Nonprimary residential property
White, non-Hispanic 87.3% 89.5% 84.2% 86.2% -1.1%
Black, non-Hispanic 4.3% 4.1% 4.1% 5.0% 0.7%
Hispanic, any race 3.1% 3.4% 6.7% 3.6% 0.5%
Other 5.3% 3.0% 5.0% 5.2% -0.1%
Note: Per the Survey of Consumer Finances definitions, primary housing wealth is the total value of theprimary residence of a household. Nonprimary housing wealth includes the value of all of other residentialreal estate owned by the household, including one-to-four family structures, timeshares, and vacationhomes.
Source: Author’s analysis of microdata from the Federal Reserve Board Survey of Consumer Finances(2016)
22
FILE
D D
ATE:
6/2
1/20
19 6
:51
PM
2016
CH
1548
9

Endnotes1. According to a recent report, “a significant—and rapidly growing—portion of Airbnb’s revenue in
major U.S. cities is driven by commercial operators who rent out more than one residentialproperty to short-term visitors” (CBRE 2017).
2. Horton and Zeckhauser (2016) provide a deep dive into the economics of internet-based servicefirms. Slee (2017) provides an excellent popularization of some of the economic issuessurrounding IBSFs from a deeply critical perspective.
3. The most obvious benefit to living in housing that one owns is the tax treatment of mortgageinterest payments on owner-occupied property, which can be deducted from federal taxes.Another benefit is that the implicit rental income earned by owner-occupiers is not taxed (themoney that owner-occupiers are saving by not having to pay rent elsewhere could be viewed asimplicit rental income).
4. Wachsmuth et al. (2018), for example, find that just under half of Airbnb listings in New York Cityhad likely taken illegal reservations.
5. “Arrivals” is a term referring to each stay in a unit, regardless of length of stay.
6. For example, Molla (2017) highlights more recent forecasts for 2017 indicating a large slowdown inU.S. Airbnb expansion.
7. The range of 2 to 4 percent represents the range of findings across 2015, 2016, and 2017. Thevalue was 4 percent in 2015, 2 percent in 2016, and 3 percent in 2017.
8. The arithmetic on this is relatively straightforward. The NERA 2017 study asserts that Airbnbsupports $14 billion in spending and 130,000 jobs in the United States. This implies each $107,690supports a job. Say that half of this spending is the direct cost of accommodations and that itrepresents a pure expenditure shift away from traditional hotels. Assume further that traditionalhotels are 5 percent more labor-intensive—so each traditional hotel job is supported by $102,300in spending (5 percent less than the ratio identified by Airbnb). This shift from traditional hotels toAirbnb hence reduces employment by 3,400 jobs for each $7 billion in spending. Even if overallspending were to rise by 2 percent due to Airbnb’s expansion, this would increase employment byonly roughly 2,600 jobs. The key insight here is that once one allows Airbnb to substitute for otherforms of accommodation, the link between output and employment might change significantly.
9. Airbnb itself has commissioned and reported on a number of studies claiming that the share ofguests who would not have taken the trip absent Airbnb is as high as 30 percent. Even thisnumber is far larger than the independent assessments of Guttentag (2016) and Morgan StanleyResearch (2017), but it does highlight just how outlandish the NERA assumption on this is.
10. In a review of housing markets, Albouy, Ehrlich, and Liu (2016) note that “Housing demand isincome and price inelastic.”
11. The geographic unit implicitly being examined by Sheppard and Udell (2018) is not intuitive. Theirobservation is an individual home sale. They then track Airbnb listings within five different radii ofthe sale: 150, 300, 500, 1,000, and 2,000 meters. They interact the number of Airbnb listings withcategorical variables for each of the five “buffer zones” defined by the radii and use this as anexplanatory variable predicting sales prices.
23
FILE
D D
ATE:
6/2
1/20
19 6
:51
PM
2016
CH
1548
9
12. See Office of New York State Attorney General 2014.
13. Lawler (2014) notes that Airbnb was testing out dedicated cleaning services for its hosts as earlyas 2014.
14. Unionization rates derive from the author’s analysis of data pooled from 2008–2017 from theOutgoing Rotation Groups (ORG) of the Current Population Survey (CPS). Code and results areavailable upon request. The 10 cities are Boston, Chicago, Los Angeles, Las Vegas, Miami, NewYork City, San Diego, San Francisco, Seattle, and Washington, D.C. In these 10 cities, theunionization rate for maids and cleaners was 23.2 percent in the traveler accommodation industry,but 12.1 percent in all other industries.
15. See Weil 2017 for an overview of labor market fissuring.
ReferencesAlbouy, David, Gabriel Ehrlich, and Yingyi Liu. 2016. “Housing Demand, Cost-of-Living Inequality, andthe Affordability Crisis.” National Bureau of Economic Research (NBER) Working Paper no. 22816,November 2016.
AllTheRooms.com. 2016. Vacation Rental Market Analysis: 440 Million Reasons to Tax AirbnbVacation Rentals, October 2016.
Alyakoob, Mohammed, and Mohammed Saifur Rahman. 2018. “Shared Prosperity (or Lack Thereof)in the Sharing Economy.” Purdue University working paper, May 2018. http://dx.doi.org/10.2139/ssrn.3180278.
Associated Press (AP). 2019. “Question from Washington on Oct. 11, 2016” (search result for “sharingeconomy”). AP Stylebook subscription-based website, accessed January 4, 2019.
Barron, Kyle, Edward Kung, and Davide Proserpio. 2018. “The Sharing Economy and HousingAffordability: Evidence from Airbnb.” Working paper, March 2018.
Bucks, Dan R. 2017. Airbnb Agreements with State and Local Tax Agencies: A Formula forUndermining Tax Fairness, Transparency and the Rule of Law. March 2017.
Bureau of Economic Analysis. Various years. National Income and Product Accounts (NIPA), Tables2.4.4 and 2.5.5. Accessed September 2018.
CBRE Hotels’ Americas Research (CBRE). 2017. Hosts with Multiple Units—A Key Driver of AirbnbGrowth: A Comprehensive National Review Including a Spotlight on 13 U.S. Markets. March 2017.
Dogru, Tarik, Mararand Mody, and Courtney Suess. 2019. “Adding Evidence to the Debate:Quantifying Airbnb’s Disruptive Impact on Ten Key Hotel Markets.” Tourism Management,forthcoming June 2019.
Dube, Arindrajit, and Ethan Kaplan. 2010. “Does Outsourcing Reduce Wages in Low-Wage ServiceOccupations? Evidence from Janitors and Guards.” Industrial and Labor Relations Review 63, no. 2:287–306.
Federal Reserve Board. 2016. Survey of Consumer Finances microdata. Accessed August 2018.
Goldschmidt, Deborah, and Johannes Schmieder. 2017. “The Rise of Domestic Outsourcing and the
24
FILE
D D
ATE:
6/2
1/20
19 6
:51
PM
2016
CH
1548
9
Evolution of the German Wage Structure.” Quarterly Journal of Economics 132, no. 3: 1165–1217.http://doi.org/10.1093/qje/qjx008.
Guttentag, Daniel Adams. 2016. “Why Tourists Choose Airbnb: A Motivation-Based SegmentationStudy Underpinned by Innovation Concepts.” PhD diss., University of Waterloo.
Hazinski, Thomas, Anthony Davis, and Daniel Kremer. 2018. 2018 HVS Lodging Tax Report – USA.HVS Convention, Sports, and Entertainment Consulting, September 2018.
Horton, John, and Richard Zeckhauser. 2016. “Owning, Using and Renting: Some Simple Economicsof the ‘Sharing Economy.’” National Bureau of Economic Research Working Paper no. 22029,February 2016.
Lawler, Ryan. 2014. “Airbnb Is Testing Out an Affordable Cleaning Service for Hosts in SanFrancisco.” Techcrunch.com.
Merante, Mark, and Keren Mertens Horn. 2016. “Is Home Sharing Driving Up Rents? Evidence fromAirbnb in Boston.” University of Massachusetts Boston Department of Economics Working Paper no.2016-03.
Miller, Stephen. 2016. “First Principles for Regulating the Sharing Economy.” Harvard Journal onLegislation 53: 149–202.
Molla, Rani. 2017. “Airbnb Is On Track to Rack Up More Than 100 Million Stays This Year—and That’sOnly the Beginning of Its Threat to the Hotel Industry: As Long as Regulation Doesn’t Stop It, That Is.”Recode, July 19, 2017.
Morgan Stanley Research. 2017. Surprising Airbnb Adoption Slowdown in US/EU, and What It Meansfor Hotels and OTAs. Report on Global Insight AlphaWise survey, November 2017.
NERA Economic Consulting (NERA). 2017. Airbnb’s Global Support to Local Economies: Output andEmployment. Prepared for Airbnb, March 2017.
Office of New York State Attorney General. 2014. Airbnb in the City. Prepared by the Office of theAttorney General of the State of New York’s Research Department and Internet Bureau, October2014.
Schiller, Zach, and Carl Davis. 2017. Taxes and the On-Demand Economy. Institute on Taxation andEconomic Policy, March 2017.
Sheppard, Stephen, and Andrew Udell. 2018. “Do Airbnb Properties Affect House Prices?” WilliamsUniversity working paper, January 2018.
Slee, Tom. 2017. What’s Yours Is Mine: Against the Sharing Economy. New York: OR Books.
Wachsmuth, David, David Chaney, Danielle Kerrigan, Andrea Shillolo, and Robin Basalaev-Binder.2018. The High Cost of Short-Term Rentals in New York City. Urban Politics and Governanceresearch group, School of Urban Planning, McGill University, January 2018.
Weil, David. 2017. The Fissured Workplace: Why Work Became So Bad for So Many and What CanBe Done to Improve It. Cambridge, Mass.: Harvard Univ. Press.
Zervas, Georgios, Davide Proserpio, and John W. Byers. 2017. “The Rise of the Sharing Economy:Estimating the Impact of Airbnb on the Hotel Industry.” Journal of Marketing Research 54, no. 5:687–705.
25
FILE
D D
ATE:
6/2
1/20
19 6
:51
PM
2016
CH
1548
9

26
FILE
D D
ATE:
6/2
1/20
19 6
:51
PM
2016
CH
1548
9

Exhibit I
FILE
D D
ATE:
6/2
1/20
19 6
:51
PM
2016
CH
1548
9

11
March 2017D.C. Working Families
Short-term rentals: a new challenge to housing affordability in the District of Columbia
Airbnb’s Impact in Washington D.C.
Selling the District Short
FILE
D D
ATE:
6/2
1/20
19 6
:51
PM
2016
CH
1548
9
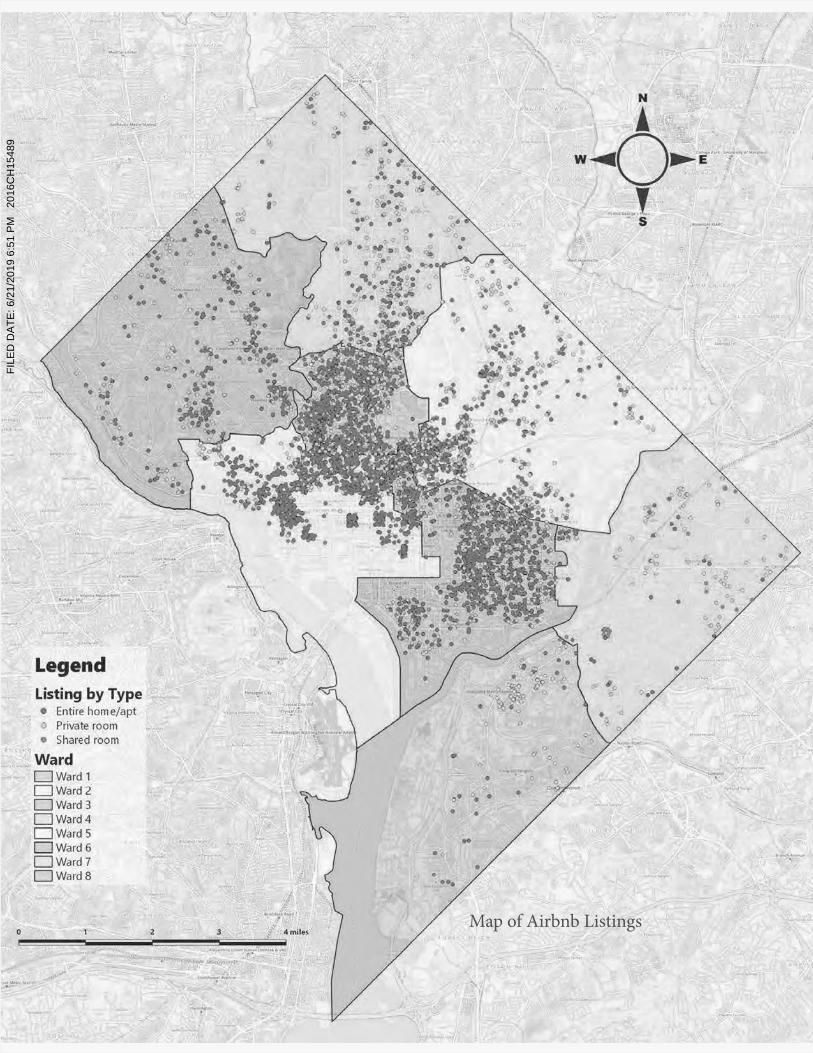
222222
Map of Airbnb Listings
FILE
D D
ATE:
6/2
1/20
19 6
:51
PM
2016
CH
1548
9
33
Table of ContentsExecutive Summary..................................................................................................................................2Topline Findings.......................................................................................................................................3
I. INTRODUCTION_____________________________________________________________________________4Short-Term Rental Market & Rise of Airbnb.........................................................................................5Airbnb Impact on Affordable Housing & Gentrification.....................................................................6Airbnb Impact on Quality of Life...........................................................................................................8Purpose and Scope of Work....................................................................................................................8
II. FINDINGS: AIRBNB IN THE DISTRICT OF COLUMBIA____________________________________________________________________________ 9Airbnb Prevents Thousands of Housing Units From Being Used by D.C. Residents ......................9Illegal Entire Home/Apartment Listings Dominate Airbnb...............................................................10STR Platforms Create a Powerful Incentive to Remove Housing from the Market.........................13Commercial and Entire-Home/Apartment listings Dominate Airbnb Revenue..............................15Airbnb Listing Concentration by Neighborhood.................................................................................16Rent Increases in Top Airbnb Neighborhoods.....................................................................................17The Cascade Effect and Gentrification..................................................................................................19Case Study: Rent-Controlled Building in Columbia Heights.............................................................21Airbnb is Growing Rapidly.....................................................................................................................22
III. METHODOLOGY ____________________________________________________________________________ 23Data............................................................................................................................................................23Calculating Commercial Listings...........................................................................................................23Calculating Revenue Estimates...............................................................................................................24
APPENDIX____________________________________________________________________________ 26Definitions.................................................................................................................................................26Sources.......................................................................................................................................................28
FILE
D D
ATE:
6/2
1/20
19 6
:51
PM
2016
CH
1548
9
44
Executive Summary
This report examines the proliferation of short-term rentals (STRs) in the District of Columbia, with a focus on their impact on the residential
recommends additional measures that should be taken to better protect D.C. neighborhoods against the rapid growth of online platforms that facilitate investment in commercial short-term rentals.
The growth of the commercial STR market has serious negative implications for housing affordability and quality of life for D.C. residents. While the District grapples with a serious housing
residential units into short-term rentals makes it
to live. Commercial short-term rental operations may be pushing steeper rent increases across the
housing laws on short-term rentals.
D.C. law already prohibits the conversion of
platforms have solicited thousands of illegal listings in a matter of a few years. The District government currently lacks the necessary enforcement tools to adequately address this new widespread systematic violation of its laws.
because of the high listing prices commanded by entire-home/apartment rentals on the STR
enforcement measures to ensure compliance with D.C. law.
listing platforms such as Airbnb. While there are a number of short-term rental platforms operating in D.C. facilitating short-term rental
As of October 2016, Airbnb had 5,295 listings in the District of Columbia, and grew by 37.8 percent in the previous year.
FILE
D D
ATE:
6/2
1/20
19 6
:51
PM
2016
CH
1548
9
55
Topline Findings This report defines commercial listings as listings by hosts with multiple listings in the District of Columbia, since it is impossible to live in more than one unit at a time. Such units are likely to represent housing that is removed from the market.
Airbnb has approximately 5,295 listings in the District; approximately 37 percent (1,980 listings) are commercial listings. This suggests that Airbnb removes a significant number of units from the housing market.
Commercial listings represent an estimated 52% of total Airbnb revenue in the District. The fact that commercial listings appear to constitute a majority of Airbnb’s D.C. revenue demonstrates that commercial use is a major function of the platform and a core component of its business. Airbnb includes some exceptionally expansive operations in the District, including one operator who has 65 listings in D.C. alone.
Of the total number of Airbnb listings in the District, 3,567 or 67 percent of them are entire-home/apartment listings. These listings represent situations where the operator is not present to host or supervise guests, and are illegal.1 Such listings command higher prices and create a strong incentive to remove housing from the market in order to profit from commercial STR operations.
Eighty-two percent of total revenue from Airbnb in the District was derived from illegal entire-home listings.
In nineteen different neighborhoods within the District, commercial listings are equivalent to at least 10 percent of vacant housing stock. This suggests that if commercial STR units were restored to the market, housing would become significantly more available in those neighborhoods. In eight of these neighborhoods, commercial Airbnb units are equivalent to 15 percent of vacant rental housing units.
STR platforms create a strong financial incentive for investors to convert residential housing to STR use. In the District’s top 20 neighborhoods for Airbnb use, the average monthly rent was $2,752, but the average illegal listing had the capacity to generate up to $5,711, for an estimated potential profit margin of 152 percent. Because STR platforms allow owners to quickly turn a profit through rental arbitrage, STRs may play a significant role in expediting gentrification in such neighborhoods.
Airbnb is growing rapidly in the District. From October 2015 to October 2016, Airbnb grew by 37.8 percent, and commercial listings grew by 34 percent.
This report defines commercial listings aslistings by hosts with multiple listings in the District of Columbia, since it is impossible to live in more than one unit at a time. Such units are likely to represent housing that is removed from the market.
Commercial listings represent an estimated 52% of total Airbnb revenue in the District. The fact that commercial listings appear to constitute a majority of Airbnb’s D.C.revenue demonstrates that commercial use is a major function of the platform and a corecomponent of its business. Airbnb includessome exceptionally expansive operations in theDistrict, including one operator who has 65listings in D.C. alone.
In nineteen different neighborhoods withinthe District, commercial listings are equivalent to at least 10 percent of vacant housingstock. This suggests that if commercial STR units were restored to the market, housing would become significantly more available in those neighborhoods. In eight of these neighborhoods, commercial Airbnb unitsare equivalent to 15 percent of vacant rentalhousing units.
Airbnb is growing rapidly in the District. From October 2015 to October 2016, Airbnbgrew by 37.8 percent, and commercial listings grew by 34 percent.
(Endnotes)From OctFrom Oct1 D.C. Zoning Code.11 DCMR Subtitle U 251.1.by 37.8 percent, and commercial listings by 37.8 percent, and commercial listings
FILE
D D
ATE:
6/2
1/20
19 6
:51
PM
2016
CH
1548
9

66
IntroductionBackground on the District of Columbia Rental Market
The District of Columbia faces an increasingly critical shortage of affordable housing that threatens residents’ ability to live, work, and raise families in the District. According to a March 2015 report by the D.C. Fiscal Policy Institute, rents have soared over the past decade, while incomes have remained the same. The District lost nearly half its supply of low-cost units between 2002 and 2013, with the number of low-cost apartments (those renting for less than $800 a month) dropping from almost 60 thousand in 2002 to 33 thousand in 2013. The supply of moderately-priced apartments ($800 to $1,000 per month) has also dwindled by nearly 30 percent since 2002.2
Very low-income households have been the most severely affected by this trend; 64 percent of them spend half or more of their incomes on housing. For households with incomes around $22,000 per year, monthly rents increased by $250 in the past ten years (adjusting for inflation), while incomes remained flat, forcing them to spend an average of 50 percent of their income on rent. Even moderate-income families have felt the pinch, with incomes up to $54,000 experiencing similarly severe cost burdens.3 As the cost of housing eats up an increasing proportion of household budgets, a growing number of residents are at risk of being unable to afford necessities like food, clothing,
healthcare, and transportation without leaving the District.4 The housing crisis in the District of Columbia can be attributed to numerous causes: a booming population, rising construction costs, increasing income inequality, the proliferation of low-wage work, limited land availability, and a waning public commitment to subsidizing affordable housing, especially at the federal level.5 In response to these trends, elected officials and community allies have fought to secure considerable public investment in increasing the availability of affordable housing and providing relief for working families. In both fiscal years 2016 and 2017 Mayor Muriel Bowser and the D.C. Council took a major step forward by committing $100 million annually to the Housing Production Trust fund.6At the same time, worker justice advocates and allied elected officials have won major victories in improving the pay of D.C.’s working class residents, which will bring some of the District’s housing choices closer, and within reach for thousands of families.7
FILE
D D
ATE:
6/2
1/20
19 6
:51
PM
2016
CH
1548
9

77
Short-term Rental Market & The Rise of Airbnb
While these hard-won victories represent important steps toward addressing the District’s affordable housing crisis, new multinational corporations have developed business models that undermine this progress. Airbnb and similar online short-term rental platforms are facilitating the widespread conversion of housing units into illegal hotel rooms, in a bid to profit from the District’s already-scarce housing stock.
Airbnb commenced its D.C. operations in 2009.8 In the past year (October 2015 through October 2016) the number of total District listings on the platform has grown from 3,843 listings to 5,295—an increase of 37.8 percent. By comparison, over the latest one-year period for which data is available (2014-2015), housing inventory in the District grew at approximately 1.1 percent (±.02 percent), while the District’s population nearly twice as quickly at 2.0 percent.9
This massive growth is occurring despite the fact that under current law, the conversion of rental housing into traveler accommodations is prohibited in the District of Columbia.10
Furthermore, zoning regulations require that an individual can short-term rent only his or her permanent residence.11 Anyone seeking to start a business as a short-term rental host is required to obtain a Basic Business License,12 comply with the zoning code, and comply with the Rental Housing Act, which includes the District’s rent control policy. If these laws were adequately enforced, they would virtually eliminate illegal commercial listings
on Airbnb and significantly curb the negative impacts of short-term rental activity in the District.
Lawmakers have long recognized the need to protect affordable housing and neighborhood quality through rental housing laws and the zoning code. These laws pre-date the rise of Airbnb and other platforms and were developed without internet hosting platforms in mind. For example, the zoning code prohibits bed and breakfasts as a home occupation
in apartment buildings, likely because policymakers determined that residential apartment living is not compatible with high-traffic businesses with large numbers of guests entering the building with no security or safety precautions.13 The fact that such businesses are now facilitated by online hosting platforms does not change the real-world impacts that caused leaders to outlaw them in the first place.
What is new, however, is the mass solicitation and development of illegal listings by online hosting platforms. Platforms like Airbnb have made it easy and convenient for hosts to ignore and frustrate the purposes of the laws and regulations designed to preserve neighborhood quality of life and protect housing affordability.
This report sheds light on the proliferation of these illegal
short-term rentals in the District and the extent to which their impact on the supply of long-term residential housing may drive up rents and exacerbate gentrification in many D.C. neighborhoods. These troubling findings make clear that while the District already has laws in place to prevent this form of rental arbitrage, significant improvements in enforcement must be made to stop illegal operators and ensure affordable housing units remain available for District residents.
Under current law, the conversion of rental housing into traveler accommodations is prohibited in the District of Columbia.
FILE
D D
ATE:
6/2
1/20
19 6
:51
PM
2016
CH
1548
9

88
Airbnb Impact on Affordable
Airbnb has worked hard to create an image of itself as primarily a platform to facili-tate “home-sharing,” 14 which means that hosts dwell in the same unit with guests. The idea is for travelers to build personal relationships with local residents for a more “authentic,” intimate experi-ence visiting a city. However, that is not how most people use Airbnb; only about a third of Airbnb listings are actual-ly used for home-sharing by local residents. Instead, stud-ies have shown that Airbnb generates the majority of its revenue from real-estate inves-tors and commercial operators who do not live on the prop-erty and instead rent out their units full time as a business venture.15,16 Whenever a housing unit is used for a short-term rental instead of a home for a resi-dent, it reduces the supply of housing. Reduced housing supply puts upward pressure on rental prices—potentially forcing some residents to leave
their neighborhoods or even move out of the District en-tirely. STRs may contribute to higher rental prices across the District, because when hous-ing becomes unavailable in one neighborhood, residents are pushed to seek housing in other neighborhoods, driving up rents across the board. Previous studies Several studies have demon-strated links between a high concentration of Airbnb list-ings—particularly the com-mercial entire-home/apart-ment variety—and a decline in the supply and increase in the price of residential rental housing. A June 2016 report by Hous-ing Conservation Coordina-tors Inc. and MFY Legal Ser-vices Inc. used 2015 AirDNA data17 to assess the interaction between the short-term and traditional rental market in New York City. The report found that having a high con-centration of Airbnb “Impact Listings”—those most likely to result in the reduction in
the supply of residential rental units—was strongly correlated with rapidly rising rental pric-es.18 According to their analy-sis, the average rent in the top twenty Airbnb neighborhoods in New York increased nearly twice as quickly as in the city as a whole. The report did not explore whether Airbnb was a cause of gentrification in those neighborhoods, but the strong correlation suggests that the problem of Impact Listings is particularly severe in gentrifying neighborhoods, and potentially exacerbates gentrification. Furthermore, the report determined that if the 8,058 units defined as Impact Listings were made available on the rental market, the number of available rental units citywide would increase by 10 percent.19Another study was con-ducted by The Real Deal, a monthly New York real estate news magazine, using Airb-nb scrape data and empirical studies of the housing market in New York, which provided
STRs may pose a substantial threat to the availability and affordability of housing in the District by displacing long-term owners and renters and depleting D.C.’s limited housing resources – in turn driving up rents.
FILE
D D
ATE:
6/2
1/20
19 6
:51
PM
2016
CH
1548
9
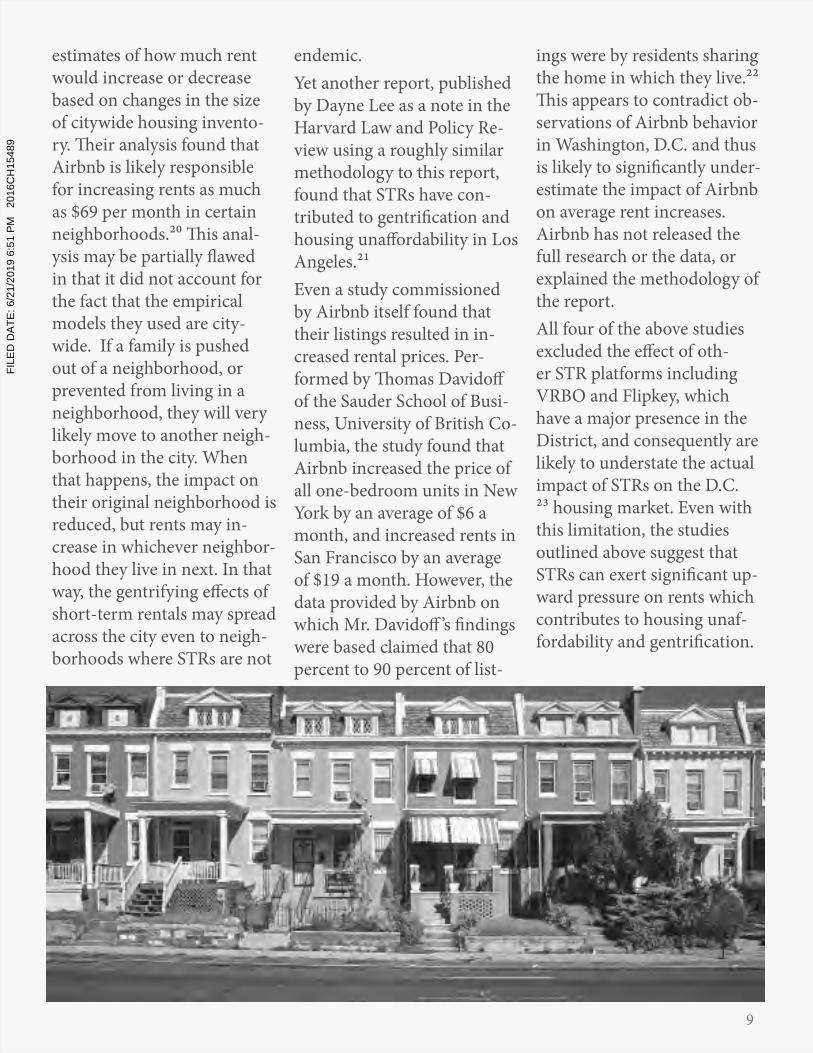
99
estimates of how much rent would increase or decrease based on changes in the size of citywide housing invento-ry. Their analysis found that Airbnb is likely responsible for increasing rents as much as $69 per month in certain neighborhoods.20 This anal-ysis may be partially flawed in that it did not account for the fact that the empirical models they used are city-wide. If a family is pushed out of a neighborhood, or prevented from living in a neighborhood, they will very likely move to another neigh-borhood in the city. When that happens, the impact on their original neighborhood is reduced, but rents may in-crease in whichever neighbor-hood they live in next. In that way, the gentrifying effects of short-term rentals may spread across the city even to neigh-borhoods where STRs are not
endemic.Yet another report, published by Dayne Lee as a note in the Harvard Law and Policy Re-view using a roughly similar methodology to this report, found that STRs have con-tributed to gentrification and housing unaffordability in Los Angeles.21Even a study commissioned by Airbnb itself found that their listings resulted in in-creased rental prices. Per-formed by Thomas Davidoff of the Sauder School of Busi-ness, University of British Co-lumbia, the study found that Airbnb increased the price of all one-bedroom units in New York by an average of $6 a month, and increased rents in San Francisco by an average of $19 a month. However, the data provided by Airbnb on which Mr. Davidoff ’s findings were based claimed that 80 percent to 90 percent of list-
ings were by residents sharing the home in which they live.22 This appears to contradict ob-servations of Airbnb behavior in Washington, D.C. and thus is likely to significantly under-estimate the impact of Airbnb on average rent increases. Airbnb has not released the full research or the data, or explained the methodology of the report.All four of the above studies excluded the effect of oth-er STR platforms including VRBO and Flipkey, which have a major presence in the District, and consequently are likely to understate the actual impact of STRs on the D.C. 23 housing market. Even with this limitation, the studies outlined above suggest that STRs can exert significant up-ward pressure on rents which contributes to housing unaf-fordability and gentrification.
FILE
D D
ATE:
6/2
1/20
19 6
:51
PM
2016
CH
1548
9
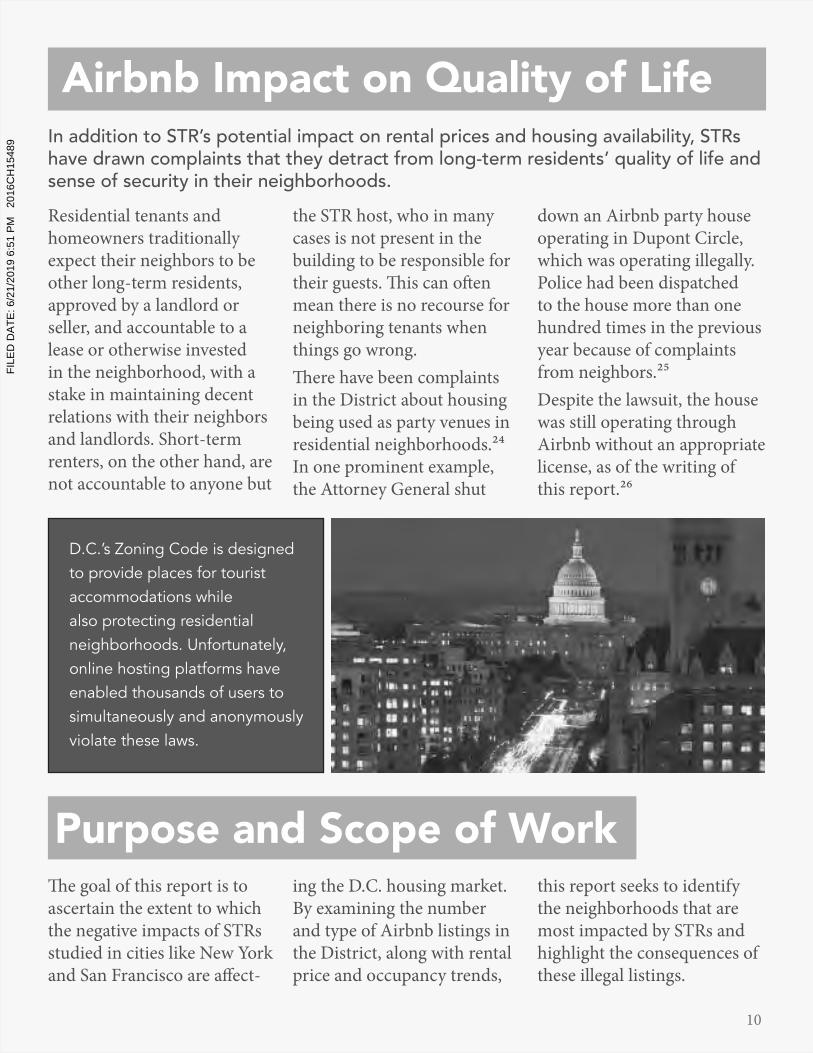
1010
Airbnb Impact on Quality of Life
Residential tenants and homeowners traditionally expect their neighbors to be other long-term residents, approved by a landlord or seller, and accountable to a lease or otherwise invested in the neighborhood, with a stake in maintaining decent relations with their neighbors and landlords. Short-term renters, on the other hand, are not accountable to anyone but
the STR host, who in many cases is not present in the building to be responsible for their guests. This can often mean there is no recourse for neighboring tenants when things go wrong.There have been complaints in the District about housing being used as party venues in residential neighborhoods.24 In one prominent example, the Attorney General shut
down an Airbnb party house operating in Dupont Circle, which was operating illegally. Police had been dispatched to the house more than one hundred times in the previous year because of complaints from neighbors.25Despite the lawsuit, the house was still operating through Airbnb without an appropriate license, as of the writing of this report.26
In addition to STR’s potential impact on rental prices and housing availability, STRs have drawn complaints that they detract from long-term residents’ quality of life and sense of security in their neighborhoods.
Purpose and Scope of WorkThe goal of this report is to ascertain the extent to which the negative impacts of STRs studied in cities like New York and San Francisco are affect-
ing the D.C. housing market. By examining the number and type of Airbnb listings in the District, along with rental price and occupancy trends,
this report seeks to identify the neighborhoods that are most impacted by STRs and highlight the consequences of these illegal listings.
D.C.’s Zoning Code is designed to provide places for tourist accommodations while also protecting residential
online hosting platforms have enabled thousands of users to simultaneously and anonymously violate these laws.
FILE
D D
ATE:
6/2
1/20
19 6
:51
PM
2016
CH
1548
9
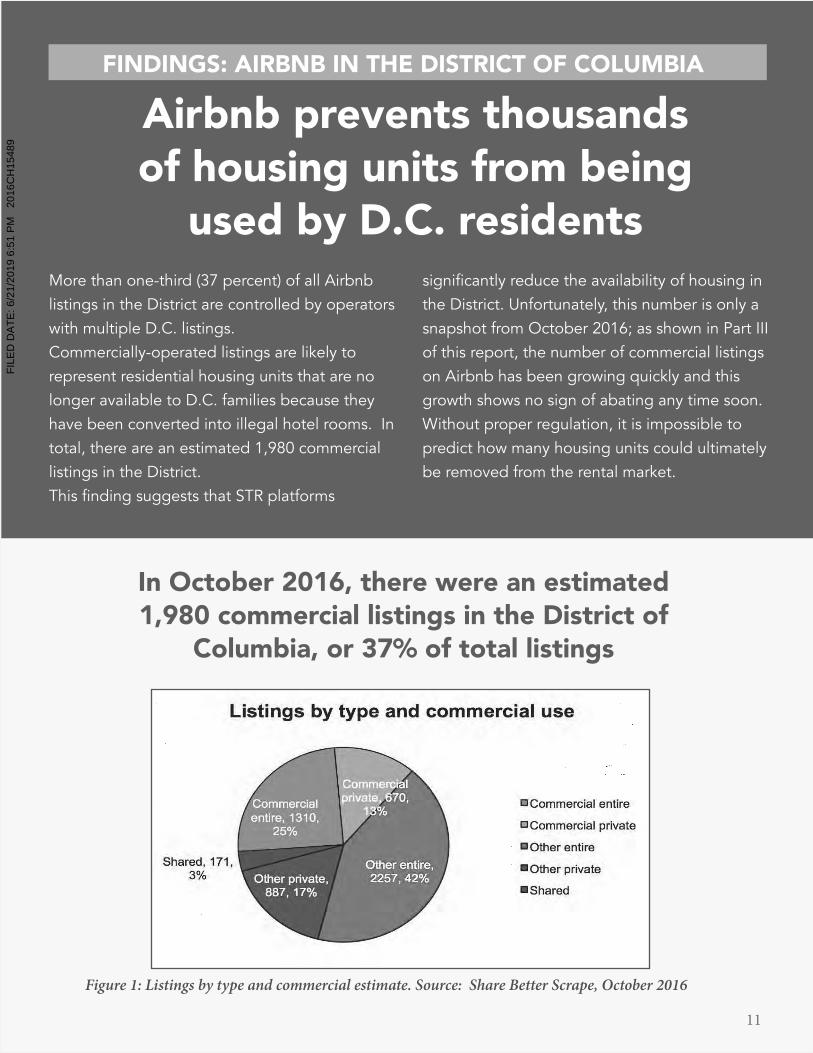
1111
FINDINGS: AIRBNB IN THE DISTRICT OF COLUMBIA
In October 2016, there were an estimated 1,980 commercial listings in the District of
Columbia, or 37% of total listings
Airbnb prevents thousands of housing units from being
used by D.C. residentsMore than one-third (37 percent) of all Airbnb listings in the District are controlled by operators with multiple D.C. listings. Commercially-operated listings are likely to represent residential housing units that are no longer available to D.C. families because they have been converted into illegal hotel rooms. In
listings in the District.
on Airbnb has been growing quickly and this growth shows no sign of abating any time soon.
predict how many housing units could ultimately be removed from the rental market.
Figure 1: Listings by type and commercial estimate. Source: Share Better Scrape, October 2016
FILE
D D
ATE:
6/2
1/20
19 6
:51
PM
2016
CH
1548
9

1212
Illegal entire-home/apartment listings dominate Airbnb
While Airbnb portrays itself as mainly facilitating home-sharing, in which hosts share a spare couch or bed-room with a guest in the spirit of hospitality and meeting new people, home-sharing is a relatively minor function of the platform.
67% of all Airbnb listings in the District are entire-home/ apartment rentals in which the operator is not present to host guests.
Sixty-seven percent of its listings (3,567) are entire apartment list-ings, and only 33 percent (1,728) are private or shared rooms. “Shared rooms” account for only
3 percent of listings in the Dis-trict. This means the majority of Airbnb’s listings are illegal listings in which the operator is not pres-ent to host guests.
Figure 2: Number of listings per type. Source: Share Better Scrape, October 2016
FILE
D D
ATE:
6/2
1/20
19 6
:51
PM
2016
CH
1548
9

1313
Entire-home listings pose a variety of problems. Such listings by definition typically lack a responsible individ-ual managing the listing in person, which gives rise to heightened concerns about quality of life impacts. 27 There have been several reports of entire-home listings being used as party houses in the District. In apartment build-ings, they can present serious quality of life and security
concerns, as they allow un-supervised visitors access to apartment buildings, where they have no accountability to the unit’s neighbors.More importantly, the prev-alence of entire-home/apart-ment listings is a particular threat to the availability of housing in the District. Of course, commercial private room listings are also likely to deprive D.C. residents of an affordable room. But commer-
cial entire-home/apartment listings completely remove lodgings designed for a house-hold and convert them to short-term, commercial use.As discussed below, the ability to post entire-room listings creates a strong temptation for investors to remove hous-ing from the market in order to take advantage of the high prices short-term rentals can command.
FILE
D D
ATE:
6/2
1/20
19 6
:51
PM
2016
CH
1548
9
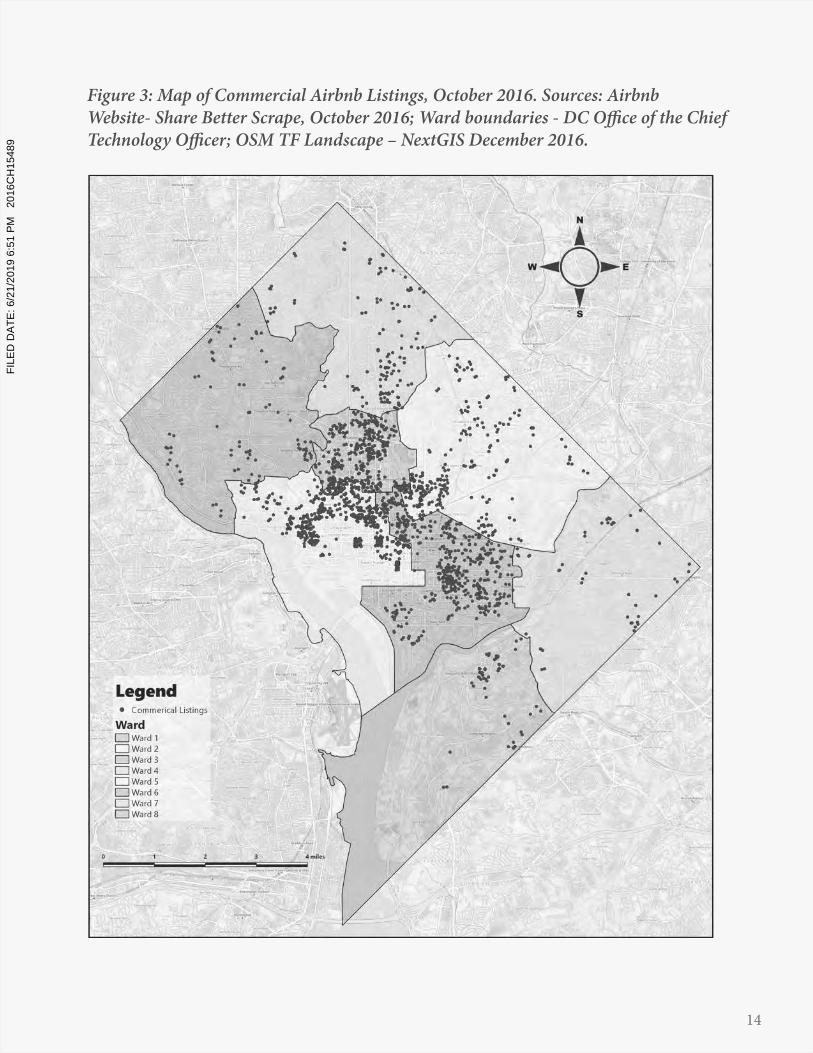
1414
Figure 3: Map of Commercial Airbnb Listings, October 2016. Sources: Airbnb Website- Share Better Scrape, October 2016; Ward boundaries - DC Office of the Chief Technology Officer; OSM TF Landscape – NextGIS December 2016.
FILE
D D
ATE:
6/2
1/20
19 6
:51
PM
2016
CH
1548
9
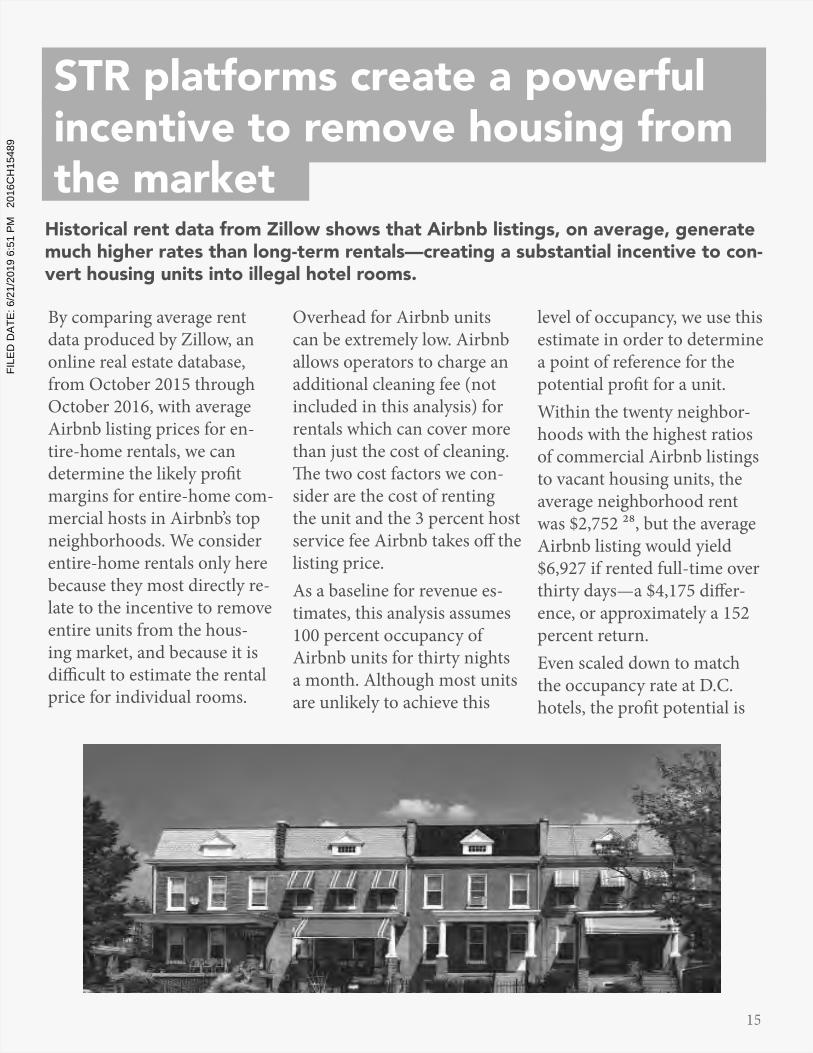
1515
By comparing average rent data produced by Zillow, an online real estate database, from October 2015 through October 2016, with average Airbnb listing prices for en-tire-home rentals, we can determine the likely profit margins for entire-home com-mercial hosts in Airbnb’s top neighborhoods. We consider entire-home rentals only here because they most directly re-late to the incentive to remove entire units from the hous-ing market, and because it is difficult to estimate the rental price for individual rooms.
Overhead for Airbnb units can be extremely low. Airbnb allows operators to charge an additional cleaning fee (not included in this analysis) for rentals which can cover more than just the cost of cleaning. The two cost factors we con-sider are the cost of renting the unit and the 3 percent host service fee Airbnb takes off the listing price.As a baseline for revenue es-timates, this analysis assumes 100 percent occupancy of Airbnb units for thirty nights a month. Although most units are unlikely to achieve this
level of occupancy, we use this estimate in order to determine a point of reference for the potential profit for a unit.Within the twenty neighbor-hoods with the highest ratios of commercial Airbnb listings to vacant housing units, the average neighborhood rent was $2,752 28, but the average Airbnb listing would yield $6,927 if rented full-time over thirty days—a $4,175 differ-ence, or approximately a 152 percent return.Even scaled down to match the occupancy rate at D.C. hotels, the profit potential is
STR platforms create a powerful incentive to remove housing from the market
Historical rent data from Zillow shows that Airbnb listings, on average, generate much higher rates than long-term rentals—creating a substantial incentive to con-vert housing units into illegal hotel rooms.
FILE
D D
ATE:
6/2
1/20
19 6
:51
PM
2016
CH
1548
9
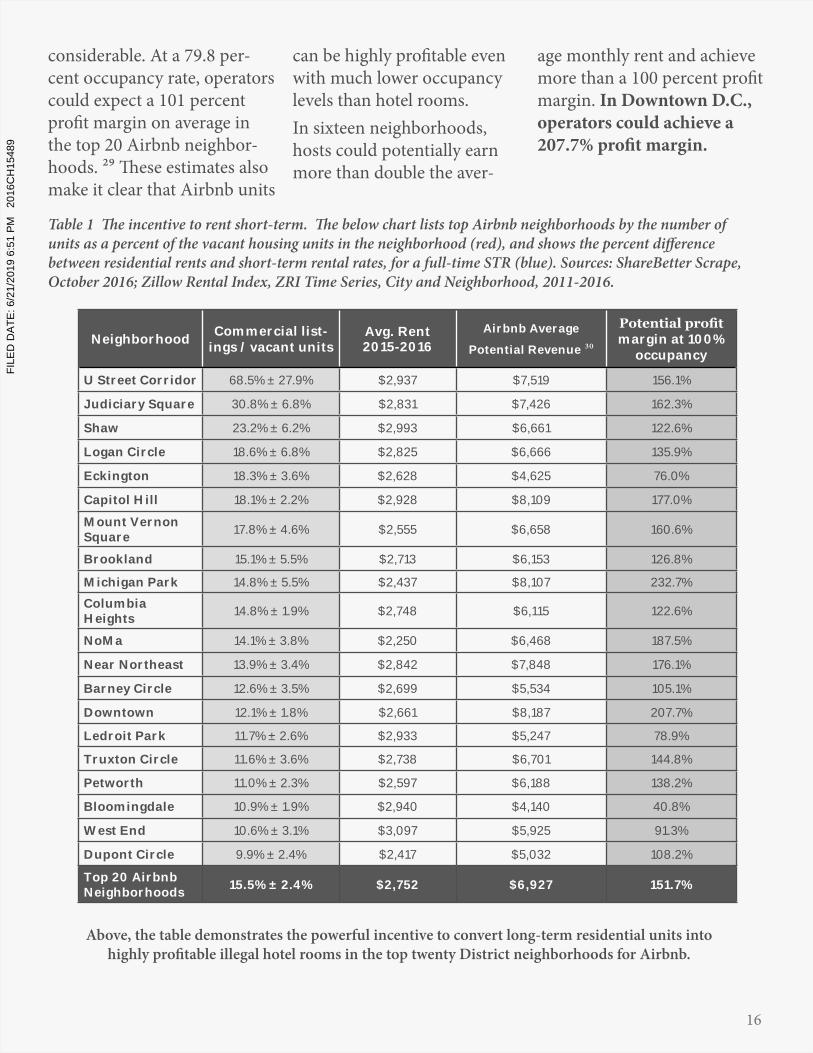
1616
considerable. At a 79.8 per-cent occupancy rate, operators could expect a 101 percent profit margin on average in the top 20 Airbnb neighbor-hoods. 29 These estimates also make it clear that Airbnb units
can be highly profitable even with much lower occupancy levels than hotel rooms.In sixteen neighborhoods, hosts could potentially earn more than double the aver-
age monthly rent and achieve more than a 100 percent profit margin. In Downtown D.C., operators could achieve a 207.7% profit margin.
Table 1 The incentive to rent short-term. The below chart lists top Airbnb neighborhoods by the number of units as a percent of the vacant housing units in the neighborhood (red), and shows the percent difference between residential rents and short-term rental rates, for a full-time STR (blue). Sources: ShareBetter Scrape, October 2016; Zillow Rental Index, ZRI Time Series, City and Neighborhood, 2011-2016.
Above, the table demonstrates the powerful incentive to convert long-term residential units into highly profitable illegal hotel rooms in the top twenty District neighborhoods for Airbnb.
Neighborhood Commercial list-ings / vacant units
Avg. Rent 2015-2016
Airbnb Average
Potential Revenue 30margin at 100%
occupancy
U Street Corridor 68.5% ± 27.9% $2,937 $7,519 156.1%
Judiciary Square 30.8% ± 6.8% $2,831 $7,426 162.3%
Shaw 23.2% ± 6.2% $2,993 $6,661 122.6%
Logan Circle 18.6% ± 6.8% $2,825 $6,666 135.9%
Eckington 18.3% ± 3.6% $2,628 $4,625 76.0%
Capitol Hill 18.1% ± 2.2% $2,928 $8,109 177.0%
Mount Vernon Square 17.8% ± 4.6% $2,555 $6,658 160.6%
Brookland 15.1% ± 5.5% $2,713 $6,153 126.8%
Michigan Park 14.8% ± 5.5% $2,437 $8,107 232.7%Columbia Heights 14.8% ± 1.9% $2,748 $6,115 122.6%
NoMa 14.1% ± 3.8% $2,250 $6,468 187.5%
Near Northeast 13.9% ± 3.4% $2,842 $7,848 176.1%
Barney Circle 12.6% ± 3.5% $2,699 $5,534 105.1%
Downtown 12.1% ± 1.8% $2,661 $8,187 207.7%
Ledroit Park 11.7% ± 2.6% $2,933 $5,247 78.9%
Truxton Circle 11.6% ± 3.6% $2,738 $6,701 144.8%
Petworth 11.0% ± 2.3% $2,597 $6,188 138.2%
Bloomingdale 10.9% ± 1.9% $2,940 $4,140 40.8%
West End 10.6% ± 3.1% $3,097 $5,925 91.3%
Dupont Circle 9.9% ± 2.4% $2,417 $5,032 108.2%
Top 20 Airbnb Neighborhoods 15.5% ± 2.4% $2,752 $6,927 151.7%
FILE
D D
ATE:
6/2
1/20
19 6
:51
PM
2016
CH
1548
9

1717
Commercial and entire-home/apartment listings dominate Airbnb revenue
In order to get a clearer picture of the role commercial and entire-home listings play on Airbnb, we examine the importance of such listings in contributing to the total revenue generated by the platform in the District.This question is important to understanding whether commercial and investment use of STR hosting plat-forms are a major component of these platforms’ busi-ness. If heavy commercial and investment use of STR hosting platforms were the exception rather than the norm, it might suggest that enforcement policy should be more targeted to finding and stopping bad opera-tors. In that case, platforms would have an incentive to work with cities to promote lawful use of their plat-form, in order to maintain a good public image.On the other hand, if commercial and entire-home
use are a major component of STR platforms’ business, platforms may find it imperative to prevent general compliance with the law. In that case, it would be nec-essary to regulate the platforms themselves.As outlined above, commercial units account for a major component of Airbnb usage—an estimated 37 percent of listings are controlled by commercial oper-ators. When considering revenue, commercial listings are even more prominent.
Commercial listings represent an estimated 52 percent of revenue for Airbnb rentals in the Dis-trict of Columbia. 31
The reason for this is that, as expected, commercial listings are much more heavily used than other listings.Airbnb’s dependence on illegal entire-home listings is especially striking. The data shows that entire-home listings account for more than three-quarters of total D.C. revenue for Airbnb.
Entire-home listings account for 82 per-cent of revenue for Airbnb rentals.
These revenue figures demonstrate that commercial and entire-home listings—not home sharing—represent the core of Airb-nb’s business.Unfortunately, they also may explain why Airbnb has been reluctant to share data that would help officials enforce existing short-term rental laws or to remove illegal listings from their website. A major portion of Airb-nb’s profits depend on illegal rentals.
Figure 4: Map of Airbnb listings by type, Octo-ber 2016. Sources: Airbnb Website- Share Better
Scrape, October 2016; Ward boundaries - DC Office of the Chief Technology Officer; OSM TF
Landscape – NextGis December 2016.
FILE
D D
ATE:
6/2
1/20
19 6
:51
PM
2016
CH
1548
9
1818
Likely due to their high profit-ability, commercial STRs may remove a significant portion of housing inventory that should be available for District residents. In nineteen different neigh-borhoods, commercial Airbnb listings are equivalent to more than 10 percent of vacant hous-ing stock.
In eight different neighborhoods, this figure exceeds 15 percent. These neighborhoods are partic-ularly impacted by the growth of Airbnb, and may suffer the greatest increases in rental prices because of reduced housing sup-
ply. (See Table 2, below.)
Airbnb units are most highly concentrated in Wards 1, 2, and 6—areas which are the most convenient to Downtown and the monuments, museums, and landmarks of the federal district. These wards contain a mix of high-priced and rapidly gentrify-ing neighborhoods. Wards 1 and 2 also have high concentrations of affordable units, and in partic-ular have more rent-controlled units than any other wards.32
The proliferation of short-term rentals may threaten that
housing. A flagrant example of short-term rentals removing rent-controlled housing from the market is discussed in the case study below, in which an entire rent-controlled building is con-verted to short-term rental use.
Although these wards are the mostly highly affected, the map below reveals that Airbnb is gaining a significant presence in all eight wards of the District.
Airbnb Listing Concentration by Neighborhood
because of reduced housing sup- term rentals may threaten that
FILE
D D
ATE:
6/2
1/20
19 6
:51
PM
2016
CH
1548
9
1919
Rent Increases in Top Airbnb Neighborhoods
•The median rent increase across Airbnb’s top 20 neighborhoods was 14.9%, compared to the District-wide average rent increase of 11.0%.
• In those neighborhoods, rent is rising 35 percent faster than in the District as a whole.
average rent increases than the District-wide average.
• In neighborhoods like Eckington, Capitol Hill, and LeDroit Park, the average rent increase was nearly double the District-wide average increase.
Rental pricing data from Zillow shows that rents haven risen more quickly in the top twenty Airbnb neighborhoods from 2011-2016, with a median increase of 14.9 percent compared to the citywide average of 11.0 percent.33
While the table below demonstrates that many of the top neighborhoods for Airbnb were also some of the most rapidly gentrifying neighborhoods in the District, it does not prove Airbnb caused the increase. For example, it is possible that commercial STR operations are most viable in gentrifying neighborhoods, and that they locate in such neighborhoods for that reason.
Regardless of the cause, commercial STR operations are most prominent in gentrifying neighborhoods, and therefore take away housing where it is needed most.
FILE
D D
ATE:
6/2
1/20
19 6
:51
PM
2016
CH
1548
9
2020
Neighborhood# Of Illegal Commercial
Listings
# Of Vacant Rentals
Illegal Commercial Listings as % of vacant
rental housing
% Rent Increase
2011-2016
U Street Corridor 102 149 ± 60.8 68.5% ± 27.9% 11.87%
Judiciary Square 76 247 ± 54.4 30.8% ± 6.8% 5.45%
Shaw 54 233 ± 62.4 23.2% ± 6.2% 15.72%
Logan Circle 48 258 ± 93.8 18.6% ± 6.8% 9.23%
Eckington 48 263 ± 52.6 18.3% ± 3.6% 23.21%
Capitol Hill 207 1143 ± 136.5 18.1% ± 2.2% 21.59%
Mount Vernon Square 62 349 ± 90.0 17.8% ± 4.6% 10.25%
Brookland 18 119 ± 43.5 15.1% ± 5.5% 14.88%
Michigan Park 17 115 ± 43.0 14.8% ± 5.5% 16.27%
Columbia Heights 166 1123 ± 148.0 14.8% ± 1.9% 10.35%
NoMa 37 262 ± 70.5 14.1% ± 3.8% 6.78%
Near Northeast 37 266 ± 64.5 13.9% ± 3.4% 20.32%
Barney Circle 19 151 ± 42.3 12.6% ± 3.5% 17.27%
Downtown 145 1201 ± 179.4 12.1% ± 1.8% 12.95%
Ledroit Park 31 266 ± 59.0 11.7% ± 2.6% 19.55%
Truxton Circle 22 190 ± 58.4 11.6% ± 3.6% 15.29%
Petworth 56 507 ± 103.7 11.0% ± 2.3% 18.45%
Bloomingdale 52 475 ± 82.0 10.9% ± 1.9% 19.86%
West End 75 709 ± 206.7 10.6% ± 3.1% 8.84%
Dupont Circle 45 454 ± 110.6 9.9% ± 2.4% 6.19%
Median of Top 20 Airbnb D.C. Neighborhoods 14.9%
D.C. City-Wide Average 11.0%
Table 2: Top Twenty D.C. Airbnb neighborhoods marked by higher median rent increases over the last five years, higher than the city-wide average. Sources: Airbnb website - Share Better Scrape, October 2016; Housing vacancy data, neighborhood – American Community Survey 5-year Estimates, 2015 – neighborhoods defined as sets of Census tracts assigned based on to DC Office of Planning, Google, and other data sources; Housing data, citywide – American Community Survey 5-year Estimates, 2015. Rent data: Zillow Rental Index, 2016. Five neighborhoods with unreliable housing estimates or low numbers of Airbnb listings were excluded from the list.
FILE
D D
ATE:
6/2
1/20
19 6
:51
PM
2016
CH
1548
9
2121
The Cascade Effect and Short-term rentals have the potential to hasten
First, short-term rentals increase the potential for residential build-ings to be used as vehicles for speculative investment without providing housing for residents. For example, in the case study below, an investor purchased a rent-controlled apartment build-ing in Columbia Heights, kept the building free of tenants, and instead rented out rooms to tourists using STR platforms. 34 This allowed the owner to earn income from the building without operating it as a residential apartment building.
The owner was able operate this way for a long time in part because there were no long-term tenants to complain about rent control viola-tions. If the laws restricting com-mercial STRs had been enforced, the most practical means of gener-
ating income through the building would have been to renovate the building and offer it for permanent residents to rent in compliance with housing laws. Instead, up to twenty families were deprived of housing in Columbia Heights.
Second, at the neighborhood level, any single unit taken off the market likely means that one less family will be able to reside in that neigh-borhood—thanks to extremely low vacancy rates. This family will then need to move to a different neigh-borhood, increasing demand-side pressure on that area’s housing mar-ket. In the aggregate, this may cause a cascade effect, in which rent rises not just in the top Airbnb neigh-borhoods where people are unable to find a place to live, but also in the overflow neighborhoods where
families are moving.
Finally, short-term rentals may induce landlords to increase rents, by increasing the amount of rent a subset of tenants is willing and able to pay. At the same time, short-term rentals may create the opportunity for landlords to push steeper rent increases. Contrary to Airbnb’s message that STRs help “middle-class families” stay in their homes in the face of increas-ing rents, Airbnb may instead be contributing to increasing rents by reducing housing supply. In fact, some property management com-panies have been holding discus-sions with Airbnb on allowing STRs in their building in exchange for a cut of the revenue. 35
FILE
D D
ATE:
6/2
1/20
19 6
:51
PM
2016
CH
1548
9
2222
Table 3 Percent of potential units removed because of commercial Airbnb activity. Sources: Airbnb website - Share Better Scrape, October 2016; Housing data, neighborhood – American Community Survey 5-year Estimates, 2015 – neighborhoods defined as sets of Census tracts assigned based on to DC Office of Planning, Google, and other data sources; Housing data, citywide – American Community Survey 5-year Estimates, 2015. Five neighborhoods with unreliable housing estimates or low numbers of Airbnb listings were excluded from the list.
Neighborhood Total housing inventory Vacant units Commercial
listingsCommercial listings /
vacant units (%)
U Street Corridor 6977 149 ± 60.8 102 68.5% ± 27.9%Judiciary Square 3081 247 ± 54.4 76 30.8% ± 6.8%Shaw 2402 233 ± 62.4 54 23.2% ± 6.2%Logan Circle 4791 258 ± 93.8 48 18.6% ± 6.8%Eckington 1932 263 ± 52.6 48 18.3% ± 3.6%Capitol Hill 14119 1143 ± 136.5 207 18.1% ± 2.2%Mount Vernon Square 5822 349 ± 90.0 62 17.8% ± 4.6%Brookland 1779 119 ± 43.5 18 15.1% ± 5.5%Michigan Park 2674 115 ± 43.0 17 14.8% ± 5.5%Columbia Heights 14801 1123 ± 148.0 166 14.8% ± 1.9%NoMa 2890 262 ± 70.5 37 14.1% ± 3.8%Near Northeast 2906 266 ± 64.5 37 13.9% ± 3.4%Barney Circle 2025 151 ± 42.3 19 12.6% ± 3.5%Downtown 10065 1201 ± 179.4 145 12.1% ± 1.8%Ledroit Park 1444 266 ± 59.0 31 11.7% ± 2.6%Truxton Circle 1407 190 ± 58.4 22 11.6% ± 3.6%Petworth 7486 507 ± 103.7 56 11.0% ± 2.3%Bloomingdale 3927 475 ± 82.0 52 10.9% ± 1.9%West End 4885 709 ± 206.7 75 10.6% ± 3.1%Dupont Circle 5559 454 ± 110.6 45 9.9% ± 2.4%
DISTRICT OF COLUMBIA 303,312 29,922 ± 905 1,980 6.6% ± 0.2%
FILE
D D
ATE:
6/2
1/20
19 6
:51
PM
2016
CH
1548
9
2323
Columbia Heights is one of the most rapidly gentrifying neighbor-hoods in the District of Columbia.In November 2015, the Latino Economic Development Cen-ter (LEDC) discovered a 21 unit rent-controlled apartment build-ing in Columbia Heights that they believed was being used for illegal short-term rental use instead of permanent housing.
The LEDC became aware of the property when they were alert-ed that an ownership stake in the building was being sold. The owners were required to notify the Department of Housing and Com-munity Development (DHCD) of the sale because under the Tenant Opportunity to Purchase Act (TOPA), the building’s tenants had the right to purchase the building themselves.
An LEDC community organizer who went to visit the property to alert the tenants of their TOPA rights was barred from entering by a woman who identified herself as a friend of the owner.
Closer inspection of the offer of sale revealed that the owners testified to the District government that the building had exactly one tenant—the “friend” the organizer had previously encountered—and all twenty other units were vacant.
Additional research showed that several units in the apartment were listed on Flipkey, Homeaway, and seemingly on Airbnb. 36 The build-ing owner and sole tenant were mentioned frequently as managers or owners of the building in the listings and reviews.
It appeared that the building had been partially or entirely convert-ed into a hotel instead of being used to provide affordable hous-ing for District residents.
Further inspection of several short-term rental hosting platforms re-vealed that the owner also owned at least three other residential buildings which were being used as short-term rentals instead of permanent housing.
LEDC sent correspondence to both DCRA, which regulates business licensing and enforces zoning, and DHCD, which administers the rent control law, all of which were apparently being violated. DCRA insisted they could not inspect the property unless the LEDC organiz-er was able to get an invitation from the owner. DHCD did not follow up at all. An LEDC organizer then testified at a Budget Oversight Hearing under the D.C. Council Committee on Business Consumer and Regulatory Affairs on February 29, 2016.
In December 2016, Ward 1 Coun-cilmember Brianne Nadeau and the D.C. Working Families Party conducted an exposé on the prop-erty in order to highlight the risk commercial short-term rental oper-ations pose to housing affordability in the District. 37
Case study: Rent-Controlled Building in Columbia Heights
FILE
D D
ATE:
6/2
1/20
19 6
:51
PM
2016
CH
1548
9
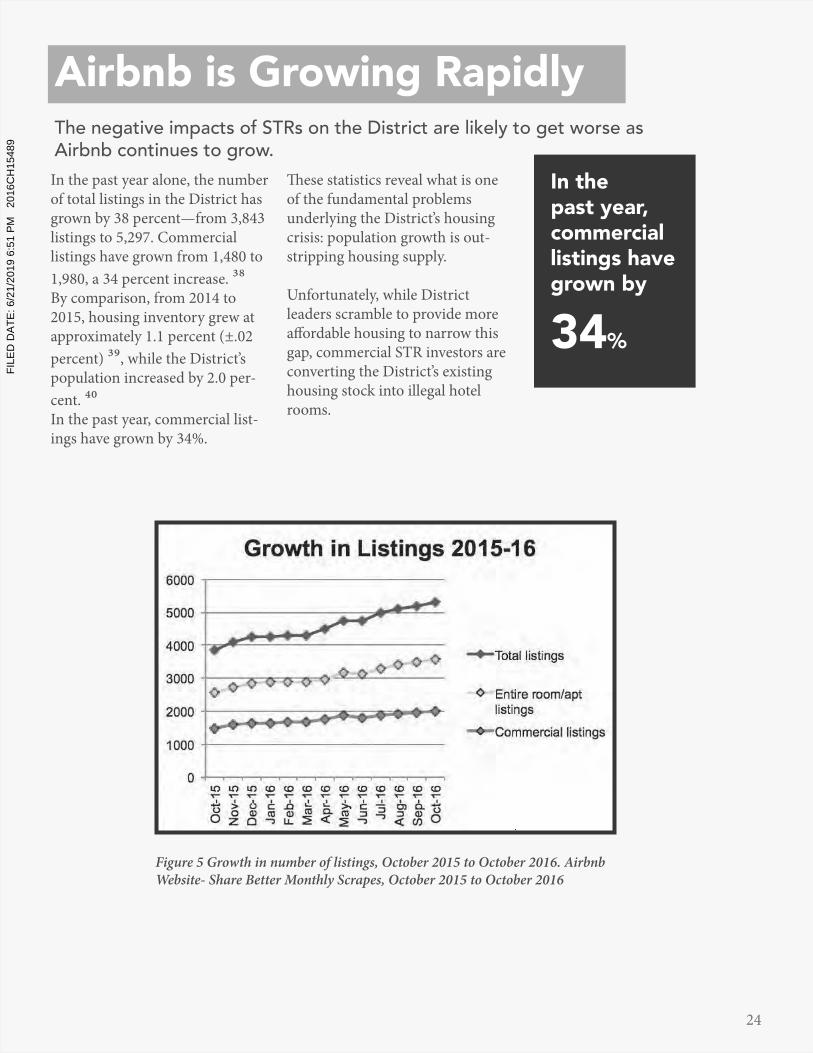
2424
In the past year alone, the number of total listings in the District has grown by 38 percent—from 3,843 listings to 5,297. Commercial listings have grown from 1,480 to 1,980, a 34 percent increase. 38By comparison, from 2014 to 2015, housing inventory grew at approximately 1.1 percent (±.02 percent) 39, while the District’s population increased by 2.0 per-cent. 40In the past year, commercial list-ings have grown by 34%.
These statistics reveal what is one of the fundamental problems underlying the District’s housing crisis: population growth is out-stripping housing supply.
Unfortunately, while District leaders scramble to provide more affordable housing to narrow this gap, commercial STR investors are converting the District’s existing housing stock into illegal hotel rooms.
Airbnb is Growing RapidlyThe negative impacts of STRs on the District are likely to get worse as Airbnb continues to grow.
Figure 5 Growth in number of listings, October 2015 to October 2016. Airbnb Website- Share Better Monthly Scrapes, October 2015 to October 2016
In the past year, commercial listings have grown by
34%
FILE
D D
ATE:
6/2
1/20
19 6
:51
PM
2016
CH
1548
9

2525
MethodologyData
The data used in this report was provided by ShareBetter, a national coalition of neighbors, community activists and elected officials who advocate for effective regulation of short-term rentals to protect neigh-borhoods and affordable housing. Because Airbnb has a history of de-clining to provide reliable data on its service, the most effective way to obtain this information is through automated observation of activity visible on the Airbnb website. 41
This process is known as “scrap-ing.” ShareBetter has obtained data from web scrapes performed on a monthly basis dating back to September 2015. A majority of the figures in this report are based on an October 2016 web scrape. 42It bears noting that although Airb-nb is the most well-known STR hosting platform, it is only one of several that operate in the District. This report does not include data from these, although HomeAway,
Flipkey, and VRBO also have a significant presence in D.C. The principal reason for this omission is that it is impossible to know which listings are cross-listed on multiple platforms. To include data from all STR hosting platforms would likely cause the analysis to over-estimate the number of STRs in the District. Instead, by excluding listings from other sites, it is likely that this re-port understates the prevalence and growth of STRs in the District.
In order to identify and calculate the number of commercial listings, this report estimates commer-cial listings as all entire-home/apartment and private room listings by hosts with multiple
listings. 43 Shared rooms are ex-cluded from this calculation. Given the available data, this metric is the best way to estimate the likelihood that an STR will be used as a com-mercial enterprise, and deprive a D.C. resident of potential housing.
For the rest of this report, this met-ric is called “Commercial Listings.”The appendix provides a more de-tailed discussion on how the metric of commercial listings was selected.
Calculating Commercial Listings
FILE
D D
ATE:
6/2
1/20
19 6
:51
PM
2016
CH
1548
9

2626
Calculating Revenue EstimatesThis report analyzes estimates of the revenue generated by each category of listing, defined by type (“entire-home” vs. ”private room” vs. ”shared room”) and commercial use (“commercial” vs. ”other”).44Revenue estimates by type and commercial use were derived using the following methodology using scrape data: First, we estimate revenues by sum-ming the prices of all listings for each category. Then, finding that
commercial listings are much more heavily used than other listings, we multiply the un-weighted revenue estimate by the average number of reviews for each category to obtain the estimated proportions of reve-nue from each category. Based on a November 2015 report by Airbnb, entire-home listings appear to have a substantially sim-ilar distribution of activity level as other listings. 46
Therefore, if we were to assume that commercial and other listings did not have significantly different levels of transient usage, it would be reasonable to estimate the propor-tion of revenue obtained from each category by summing the prices for all listings in each category, as shown in Figure 1.Under this estimate, commercial listings would represent 43 percent of total revenue.
However, it would be incorrect to assume that commercial listings have the same level of activity as other listings. As expected, com-mercial listings are much more heavily used than other listings. The best proxy we have for activity level is the total number of guest reviews for each listing. We assume in the below discussion that num-ber of guest reviews is, on average, linearly related to the number of
total nights the listing has been The average number of guest reviews for commercial entire-house listings is 24 percent higher than for other en-tire-house listings, and the average number of reviews for commercial private room listings is 92 percent higher than for other private room listings. Therefore it is possible to obtain an estimate of the proportion of revenue from each category by
multiplying the revenue estimates in Figure 1 by the average reviews for each category booked.
Figure 6:Sum of listed prices by category. Source: Share Better Scrape, October 2016 45
FILE
D D
ATE:
6/2
1/20
19 6
:51
PM
2016
CH
1548
9

2727
Figure 7: Average reviews by category. Source: Share Better Scrape, October 2016
The average number of guest reviews for commercial entire-home listings is 24 percent higher than for other en-tire-home listings, and the average number of reviews for commercial private room listings is 92 percent higher than for other private room listings. 47
Therefore, it is possible to obtain an estimate of the proportion of revenue from each category by multiplying the revenue estimates in Figure 1 by the average reviews for each category. 48
Figure 8 Estimated revenue by commercial/other listings and type. Source: Share Better Scrape, October 2016.
FILE
D D
ATE:
6/2
1/20
19 6
:51
PM
2016
CH
1548
9

2828
This report makes several distinctions between rentals in order to differentiate which listings are depleting the housing inventory and better estimate the size of their im-pact.
Shared Rooms
Private Rooms
“Shared Rooms” are rentals in which the guest sleeps in a room that will simultaneously be used by the host (ie. on a couch in the living room). These listings are unlikely to represent situations where a permanent tenant would be displaced, except in a few cases where they appear to be a part of Airbnb hostels..
“Private Rooms” are those in which guests have the privacy of their own room but the host is expected to be present during the guest’s stay. These listings may or may not displace long-term tenants because they have the potential to be used to fill vacant rooms in multi-bedroom apartments, which could otherwise be filled by long-term roommates. They can also deprive families of larger units by incentivizing hosts to rent or purchase larger units than they need.
Entire-Home/Apartment
“Entire-home/apartment” rentals grant guests private access to the entire dwelling unit. These listings are the most likely to displace permanent residents and are also the most viable as commercial units, commanding roughly double the average price of a “Private Room” listing.
Operator
Sixty-six percent of listings in the District are “entire home/apartment” listings. That means that, in a majority of cases, the person who listed the property is not actually hosting the guest. For that reason, we use the term “operator” as a generic term for a person who controls an STR listing. We will use the term “host” specifically to refer to situations in which a permanent resident of a dwelling unit actually hosts guests in their home.
“Commercial Listings” are those that are most likely to be principally used as a revenue source rather than as a permanent dwelling, thus displacing local residents. Commercial listings are primarily responsible for STRs’ negative impact on the D.C. housing market.
Because Airbnb has refused to publish accurate, anonymized data that would enable researchers and policy-makers to understand and address the impact of STRs, this report estimates the number of commercial listings based on the number of entire-home and private room listings by hosts who have posted multiple listings.
This metric is not perfect but is likely a fair approximation of the number of units being used for commercial purposes. Hosts who post multiple listings cannot live in all of their listings, and may not live in any of their listings. The metric may over-count commercial listings because in some cases hosts may live in one of their listings permanently and rent out another unit as an investment (which would represent one commercial unit, not two), or post multiple listings for the place where they live, which Airbnb may allow in some cases.
Commercial Listings
FILE
D D
ATE:
6/2
1/20
19 6
:51
PM
2016
CH
1548
9
2929
On the other hand, the metric may under-count commercial listings because some hosts post under several host names. Moreover, many hosts may operate exactly one commercial listing (not where they live), and not post any other units on Airbnb. Such commercial units would not be included under this metric. Finally, com-mercial operators may operate multiple units, but only one inside the District. This would not be included in our count of commercial listings either.
In any case, the number almost certainly understates the total number of commercial STRs in the District because of Airbnb being the only platform that is included. On balance, the “multiple listing” metric is probably the best approximation possible for commercial listings, given the available data, so it is the one used in this report.
Neighborhoods
This report examines neighborhood-level effects from short-term rentals. Such an effort necessarily leads to the difficulty of comparing hyper-local data drawn using different boundary lines.
This difficulty is addressed by using a variety of data sources, mainly Google and Office of Planning desig-nations, to map Census tracts to neighborhood names. Each Airbnb listing was mapped into a Census tract using the listing’s approximate coordinates scraped from the Airbnb website and the official tract boundaries (provided by the D.C. Office of the Chief Technology Officer).
Zillow’s Rental Index provides neighborhood-level data based on their own neighborhood designations; these designations are highly comparable with this report’s set of neighborhoods. ZRI’s neighborhood designations were then mapped to the same set of neighborhood designations.
Thus, the Airbnb listings, the Census figures, and the Zillow rental estimates have been mapped to the same set of neighborhoods with the same boundaries. This method is not exact but should result in reasonable com-parisons for the purposes of the methodology used by this report.
FILE
D D
ATE:
6/2
1/20
19 6
:51
PM
2016
CH
1548
9
3030
Sources1. D.C. Zoning Code.11 DCMR Subtitle U 251.1.2. D.C. Fiscal Policy Institute, “Going, Going, Gone: DC’s Affordable Housing Crisis,” March 12, 2015, Accessed August 26, 2016, https://assets.documentcloud.org/documents/1685683/d-c-affordable-housing-report.pdf. 3. Ibid.4. Ibid.5. Claire Zippel, “DC’s housing affordability crisis, in 7 charts,” Greater Greater Washington, April 30, 2015, accessed August 3, 2016, http://greatergreaterwashington.org/post/26526/dcs-housing-affordability-crisis-in-7-charts/; Roger Lewis, “Decline of affordable housing has many causes,” Washington Post, January 12, 2012, accessed August 3, 2016; Jenny Reed, “Disappearing Act: Affordable Housing in DC is Vanishing Amid Sharply Rising Housing Costs,” (Washington, DC: DC Fiscal Policy Institute, 2012), 9, accessed August 3, 2016, http://www.dcfpi.org/wp-content/uploads/2012/05/5-7-12-Housing-and-Income-Trends-FINAL.pdf; Megan Bolton, et al., Out of Reach: Low Wages and High Rents Lock Renters Out, (Washington, DC: National Low Income Housing Coalition, 2015) accessed August 3, 2016, http://nlihc.org/sites/default/files/oor/OOR_2015_FULL.pdf.6. “Mayor and Council support investments in affordable housing,” CNHED (blog), April 14, 2015, accessed August 3, 2016, https://www.cnhed.org/blog/2015/04/mayor-and-council-support-investments-in-affordable-housing/. 7. For example, see Aaron Davis, “D.C. gives final approval to $15 minimum wage,” Washington Post, June 21, 2016, accessed August 3, 2016, https://www.washingtonpost.com/local/dc-politics/dc-gives-final-approval-to-15-minimum-wage/2016/06/21/920ae156-372f-11e6-8f7c-d4c723a2becb_story.html. 8. Airbnb. “Overview of the Airbnb Community in Washington, D.C.” November 16, 2015.9. U.S. Census Bureau, “Housing units,” 2014 and 2015 American Community Survey 1-Year Estimates, Table B25001, accessed Jan-uary 26, 2016; U.S. Census Bureau, “Total Population,” 2014 and 2015 American Community Survey 1-Year Estimates, Table B01003, accessed January 26, 2016. The Census also estimates the number of households, though less reliably. From 2014 to 2015 the ACS shows a 1.59 percent increase (±0.98 percent) in the number of households which is not reliable enough an estimate for meaningful comparison with the growth in housing units. See ACS 1-Year Estimates “Households and Families” Table S1101. 10. Rental Housing Act of 1985, as amended. D.C. Code §42-3506.01.11. D.C. Zoning Code.11 DCMR Subtitle U 251.1. 12. D.C. Code §47-2851.02.13. 11 DCMR Subtitle U 251.1 (j)(2) 14. Sarah Kessler, “Secrets Of Running A Six-Figure Airbnb Business,” Fast Company, November 5, 2013, accessed August 2, 2016, http://www.fastcompany.com/3021179/secrets-of-running-a-six-figure-airbnb-business.15. Eric Newcomer, “Airbnb Seeks New Funding at $30 Billion Valuation,” Bloomberg, June 28, 2016, accessed August 4, 2016, http://www.bloomberg.com/news/articles/2016-06-28/airbnb-seeks-new-funding-at-30-billion-valuation; BJH Advisors, “Short Changing New York City – The Impact of Airbnb on New York City’s Housing Market,” June 2016, accessed August 26, 2016, http://www.hcc- nyc.org/documents/ShortchangingNY C2016FINAL protected_000.pdf.16. For those who are predominantly interested in home-sharing to meet new people, the web service Couchsurfing, which predates Airbnb, facilitates home-sharing but does not allow hosts to charge their guests.17. Airdna.com, 2016. AirDNA is a third-party firm that uses advanced artificial intelligence and machine learning technology to model Airbnb occupancy based on listings and historical Airbnb occupancy data, and markets its research to STR investors.18. The variables had a correlation of 0.93. The correlation coefficient is a statistical measure which falls between -1 and 1. It indicates the interdependence of variables in a data set. A correlation of 1 indicates that two variables vary together perfectly linearly in the same direction. Strong correlation suggests two variables are likely related, but does not prove one causes the other.19. BJH Advisors, “Short Changing New York City – The Impact of Airbnb on New York City’s Housing Market,” June 2016, accessed August 26, 2016.20. Ariel Stulberg, “How much does Airbnb impact rents in NYC?” The Real Deal, October 14, 2015, accessed August 1, 2016, http://therealdeal.com/2015/10/14/how-much-does-airbnb-impact-nyc-rents/. 21. Dayne Lee, “How Airbnb Short-Term Rentals Exacerbate Los Angeles’s Affordable Housing Crisis: Analysis and Policy Recom-mendations,” Harvard Law and Policy Review, 10:1 (2016): 229-253, accessed December 12, 2016, http://harvardlpr.com/wp-content/uploads/2016/02/10.1_10_Lee.pdf.22. Laura Kusisto, “Airbnb Pushes Up Apartment Rents Slightly, Study Says,” Wall Street Journal (blog), March 30, 2015, accessed August 1, 2016, http://blogs.wsj.com/developments/2015/03/30/airbnb-pushes-up-apartment-rents-slightly-study-says. 23. A visual inspection of the websites for Flipkey and VRBO on August 1, 2016 found 1,991 listings for Washington, D.C.24. For example, see Robert Devaney, “ANC Report: Airbnb; Yarrow Marmout,” Georgetowner, July 1, 2015, accessed January 26, 2016, http://www.georgetowner.com/articles/2015/jul/01/anc-report-airbnb-yarrow-marmout/.25. Benjamin Freed, “DC Sues Owner of Airbnb House Often Used for Parties,” Washingtonian, May 8, 2016, https://www.washingto-nian.com/2015/05/08/dc-sues-owner-of-airbnb-rental-house-used-for-parties/.
FILE
D D
ATE:
6/2
1/20
19 6
:51
PM
2016
CH
1548
9

3131
26. “Doug,” https://www.airbnb.com/rooms/789295, accessed January 26, 2016. According to the D.C. Property Information Verifica-tion System, the house has a license for single family rentals. The address of the house is 2220 Q Street NW. See https://pivsservices.dcra.dc.gov/PIVS/Search.aspx, accessed January 26, 2016. Single family housing rental licenses are prohibited to be used for transient occupancy (14 DCMR 201.3) and are intended for families to rent as housing on a long-term basis. 27. Use of Airbnb rentals as party houses in the District has not yet been extensively covered by the press, but there have been frequent conversations at the neighborhood level. For example, see Robert Devaney, “ANC Report: Airbnb; Yarrow Marmout,” The Georgetown-er, July 1, 2015, accessed December 7, 2016, http://www.georgetowner.com/articles/2015/jul/01/anc-report-airbnb-yarrow-marmout/; and Benjamin Freed, “DC Sues Owner of Airbnb House Often Used for Parties,” Washingtonian, May 8, 2015, accessed December 7, 2016, https://www.washingtonian.com/2015/05/08/dc-sues-owner-of-airbnb-rental-house-used-for-parties/. There has been exten-sive national coverage of this issue; for example, see Ron Lieber, “New Worry for Home Buyers: A Party House Next Door,” New York Times, October 9, 2015, accessed December 7, 2016, http://www.nytimes.com/2015/10/10/your-money/new-worry-for-home-buyers-a-party-house-next-door.html.28. Zillow Rental Index, ZRI Time Series, City and Neighborhood. Average weighted by number of residential units per neighborhood; neighborhood averages are the mean of monthly estimates from October 2015 through October 2016.29. D.C. hotels had an estimated 79.8 percent occupancy rate in 2016. Jon Banister, “DC’s Hotel Influx Expected To Hurt Occupancy, RevPAR in 2017,” Bisnow, October 3, 2016, accessed January 26, 2016, https://www.bisnow.com/washington-dc/news/hotel/dc-ho-tel-occupancy-expected-to-decline-as-supply-boom-continues-65939.30. Monthly figure obtained by deducting 3 percent host service fee from neighborhood average for commercial entire-unit listings, then multiplying by thirty31. See Figure 3 Estimated revenue by commercial/other listings and type..32. Peter A. Tatian and Ashley Williams. A Rent Control Report for the District of Columbia. (Washington, DC: Urban Institute, No-vember 2011), 7, accessed August 3, 2016, http://www.urban.org/sites/default/ files/alfresco/publication-pdfs/412347-A-Rent-Control-Report-for-the-District-of-Columbia.pdf33. For neighborhood data the report uses neighborhood level time-series data. For the citywide average, the report uses the citywide time-series data. Zillow Rental Index. For methodology, see Bun, Yeng, “Zillow Rent Index: Methodology,” Zillow.com, March 12, 2012, accessed August 5, 2016, http://www.zillow.com/research/zillow-rent-index-methodology-2393/.34. Sufficient neighborhood-level data do not exist to provide reliable averages across the top 20 neighborhoods; the median provides a useful measure of central tendency across these neighborhoods.35. Laura Kusisto. “Rent Your Place on Airbnb? The Landlord Wants a Cut.” Wall Street Journal, December 16, 2015, accessed August 3, 2016. http://www.wsj.com/articles/big-landlords-airbnb-discuss-partnerships-1450200473. It is a little surprising that more companies have not sought such arrangements. This likely reflects the serious legal, health, safety, and quality of life complications inherent in allowing short-term rental use in residential apartment buildings.36. Airbnb makes it difficult to pinpoint addresses, but the owner of the building had a profile with apartments listed in extremely close proximity to the site.37. Andrew Giambrone, “‘Sting Operation’ Reveals Questionable Airbnb Use at Building in Columbia Heights,” Washington City Paper, December 15, 2016, accessed January 31, 2016, http://www.washingtoncitypaper.com/news/housing-complex/blog/20846838/sting-operation-reveals-questionable-airbnb-use-at-building-in-columbia-heights.38. Analysis of Share Better scrape data, October 2015 to October 2016.39. U.S. Census Bureau, “Housing units,” 2014 and 2015 American Community Survey 1-Year Estimates, Table B25001, accessed January 26, 2016.40. U.S. Census Bureau, “Total Population,” 2014 and 2015 American Community Survey 1-Year Estimates, Table B01003, accessed January 26, 2016. The Census also estimates the number of households, though less reliably. From 2014 to 2015 the ACS shows a 1.59 percent increase (±0.98 percent) in the number of households which is not reliable enough an estimate for meaningful comparison with the growth in housing units. See ACS 1-Year Estimates “Households and Families” Table S1101. 41. Airbnb has consistently refused to provide data on its activities, and has sued cities that have attempted to obtain data from the company. See for example Lien, Tracey and Emily Alpert Reyes, “Airbnb sues San Francisco – its hometown – to block new rental law,” Los Angeles Times, June 28, 2016, accessed August 3, 2016, http://www.latimes.com/business/technology/la-fi-tn-airbnb-sues-sf-20160627-snap-story.html. In 2015, Airbnb voluntarily released data on its operations in New York City, however, it was discovered that the company had scrubbed 1,500 listings. See Bromwich, Jonah, “Airbnb Purged New York Listings to Create a Rosier Portrait, Report Says,” New York Times, February 11, 2016, accessed August 3, 2016, http://www.nytimes.com/2016/02/12/business/airbnb-purged-new-york-listings-to-create-a-rosier-portrait-report-says.html.42. At the time of writing, data from November 2016 were available; however, November saw a steep spike in listings likely resulting from anticipated bookings from the inauguration and related events. October 2016 was chosen instead because it is more likely to be characteristic of the District’s STR market long-term.43. See the Appendix for definitions of listing types.44. “Shared rooms” are not broken up by commercial use, since we do not count any shared rooms as commercial—even though some of them are. It is reasonable to assume that, in most cases, shared rooms do not displace a resident; or, if they do, it takes several shared rooms to displace one resident, as might be the case for a hostel posting rooms on Airbnb.
FILE
D D
ATE:
6/2
1/20
19 6
:51
PM
2016
CH
1548
9
3232
45. The dollar figures shown do not have any real life meaning; however, figures are shown in dollars rather than percent because the summed prices are used to calculate the actual estimated proportions ofrevenue by category shown in Figure 3. Lighter colors are used in this chart because these figures represent an intermediate step in the calculation of estimated revenue.46. Airbnb, “Overview of the Airbnb Community in Washington, D.C.,” November 16, 2015.47. It should be noted that these are averages of total number of reviews, not average reviews for each listing, because the scraped data does not indicate the age of a listing. Therefore, a new listing with a smaller number of reviews may in fact be more active than an older listing with more reviews. Thanks to the large number of listings, however, assuming listing age is independent from use intensity and whether a listing is commercial or not—and there is no obvious reason to doubt it—the above percent differences should accurately estimate the actual differences in use intensity between the two types of listings.48.
FILE
D D
ATE:
6/2
1/20
19 6
:51
PM
2016
CH
1548
9

Exhibit J
FILE
D D
ATE:
6/2
1/20
19 6
:51
PM
2016
CH
1548
9
REPORT OF BRYAN ESENBERGMarch 28, 2019
A. Introduction
I am a Deputy Commissioner in the City of Chicago's Department of Housing, and I havebeen asked to determine whether there is support for the proposition that house sharing has atendency to reduce the availability of affordable housing, thereby contributing to the problem ofhomelessness. I have also been asked to review and respond to the report of Dr. Adrian Moore,submitted by the plaintiffs in the case of Mendez, et. al. v. City of Chicago, et. al., 16 CH 15489.
B. Qualifications
My educational background is as follows:
1998 BA Economics, Indiana University2006 MA Real Estate, University of Illinois —Chicago
2. My employment background is as follows:
City of Chicago, Dept. of Housing [formerly Planning &Development], Chicago, IL
05/17 to present
Deputy Commissioner, Multifamily Finance and Housing Preservation
■ Oversee the City's investment in multifamily affordable housing and housing
preservation programs■ Direct the planning and coordination of multifamily financing tools to include tax
credits, bond cap, TIF and HUD funding totaling over $100M annual■ Provide day to day management for the underwriting team and act as the division
liaison for interdepartmental coordination■ Represent the division in strategic planning sessions for new funding sources, bonus
programs and pilot programs to increase affordable housing opportunities andimprove neighborhoods
City of Chicago, Dept. of Planning and Development, Chicago, IL
11/13 to 05/17
Assistant Commissioner, Housing Preservation
■ Oversaw the management and implementation of the Troubled Buildings Initiative
[TBI], the MicroMarket Recovery Program [MMRP] and the Neighborhood
Stabilization Program [NSP]
FILE
D D
ATE:
6/2
1/20
19 6
:51
PM
2016
CH
1548
9

Provided guidance and direction to MMRP community partners, technical liaisonsand delegate agencies under a revised community forward strategy to address vacantbuildings and neighborhood changeLeveraging MMRP and TBI, worked with the Dept. of Law, Dept. of Buildings andcolleagues at DPD to develop and monitor the integration and collaboration ofdisparate division programs to achieve joint and related programmatic goals resultingin an expedited process to reclaim abandoned buildingsManaged division day-to-day operations in absence of Deputy Commissioner fromDecember of 2014 to February 2016
NHS Redevelopment Corporation, Chicago, IL10/06 to 11/13
Real Estate Manager
■ Manage day to day operations, budgeting and strategic planning for the real estate anddevelopment operations of NHS Chicago.
■ Grew the Troubled Buildings single receivership program from 12 units to over 150units annually. Affected over 1000 units of housing through the program.
■ Assisted with City's MicroMarket Recovery Program strategy including vacant
building acquisition, leveraging receivership and defining end use for vacant
buildings. Raised $300,000 in private contributions to rehabilitate 3 homes in the
West Humboldt MMRP for long term, affordable Veteran housing on 500 Central
Park.■ Improved property management operations for a scattered site portfolio of low
income rentals across 289 MF units and 22 SF properties. Introduced energy
efficiency measures to reduce expenses, implemented an asset management plan andtransitioned management operations to third party vendors.
3. As a result of my educational and employment background, I have knowledge andexperience that assist me with addressing the issues I have been asked to address in this report.Specifically, my BA in Economics and MA in Real Estate have been the foundation for mycareer in understanding Chicago's real estate markets, developing affordable housing andadministering government housing programs.
C. Materials Reviewed
In connection with this matter, I have reviewed the following materials:
The City's answers to plaintiffs' first and second sets of interrogatories.
2. The documents produced by the City, marked D 1 — 618.
FILE
D D
ATE:
6/2
1/20
19 6
:51
PM
2016
CH
1548
9
3. The report of Dr. Moore (Moore deposition exhibit 3).
4. The transcript of the deposition of Dr. Moore, including the deposition exhibits.
I have also performed some research of my own, as discussed below.
D. Affirmative Opinions
In my opinion, there is substantial support for the proposition that house sharing has atendency to reduce the availability of affordable housing, thereby contributing to the problem ofhomelessness. Reports discussed at Dr. Moore's deposition include:
"How Airbnb Short-Term Rentals Exacerbates Los Angeles's Affordable HousingCrisis," Dayne Lee, Harvard Law &Policy Review, vol. 10 pages 229 — 253 (2016),Bates numbers D304 — 328, Moore deposition exhibit 4. This report concluded, amongother things, that Airbnb increases rents and reduces the affordable housing stock. Id. at234, D309. The author noted that "[e]ach apartment or home listed year-round on Airbnbis a home that has been removed from the residential housing market ..." Id. In addition,"the pressure that STRs [short-term rentals] place on rent prices pushes units out of themargins of affordability for low- and middle-income residents, an effect that cascadesthroughout the city." Id. at 240, D315.
• "From Air Mattresses to Unregulated Business: An Analysis of the Other Side ofAirbnb," John W. O'Neill, professor of hospitality management and director of theCenter for Hospitality Management at Penn State (2016), D15 — 55, Moore depositionexhibit 7. This report found, among other things, that 58% of Airbnb's Chicago-arearevenue came from operators who listed properties for rent more than 180 days per year,96% came from operators who listed units for rent more than 30 days per year, and 38%came from operators listing multiples units for rent. Id. at D33. The neighborhoods withthe most properties listed on Airbnb were Lake View, Boystown, the Magnificent Mile,Streeterville, Lincoln Park, Sheffield Neighbors, the Old Town Triangle, Old Town, theGold Coast, Wicker Park and West Town. Id.
"Is Home Sharing Driving up Rents? Evidence from Airbnb in Boston," Mark Merante.and Keren Mertens Horn, University of Massachusetts Boston, Department of Economics(2016), D391— 426, Moore deposition exhibit 9. This report concluded that in Boston,"a city where the demand for rental housing is outpacing supply and pushing up rentsquickly, home sharing is contributing to this dynamic ..." Id. at 21— 22, D412 — 413.
"Hosts with Multiple Units — A Key Driver of Airbnb Growth: A ComprehensiveNational Review Including a Spotlight on 13 U.S. Markets," CBRE Hotels, Jamie Lane,Senior Economist and R. Mark Woodworth, Senior Managing Director and Head ofLodging Research (March 2017), D56 — 79, Moore deposition exhibit 8. This reportfound, among other things, that revenue generated by multi-unit entire-home hosts inChicago increased by 100% between October 2014 and September 2016, that 77% of
FILE
D D
ATE:
6/2
1/20
19 6
:51
PM
2016
CH
1548
9
Chicago revenue came from entire-home rentals, and that 24% of the total revenuegenerated by multi-unit hosts came from hosts with ten or more units. Id. at 3, D58, 13,D68.
"Do Airbnb properties affect house prices?" Stephen Sheppard and Andrew Udell,Williams College Department of Economics (January 1, 2018), D80 —125, Mooredeposition exhibit 5. This report "presented a variety of estimates of the impacts thatproperties listed for rent on Airbnb appear to have on the market value of residentialproperties in New York City" and noted that "[t]he direction and magnitude of theseimpacts has prompted widespread concern and considerable debates about the impact onurban structure and housing affordability in New York City and in other cities around theworld." Id. at 41, D122.
• "The Impact of Airbnb on NYC Rents," Office of the New York City Comptroller ScottM. Stringer (Apri12018), copy attached as Exhibit A. This report found that between2009 and 2016, rental rates rose dramatically in most neighborhoods of New York City,and its empirical analysis attributed 9.2% of the rental rate increase to Airbnb.
"The Sharing Economy and Housing Affordability: Evidence from Airbnb," KyleBaxron, Edward Kung and Davide Proserpio (April 1, 2018), D329 — 390, MooreDeposition exhibit 6. Using a dataset of Airbnb listings from the entire United States,this report found that a 1 %increase in Airbnb listings leads to a 0.018% increase in rents.Id. at 1, D329. The authors concluded that "home-sharing increases rental rtes byinducing some landlords to switch from supplying the market for long-term rentals tosupplying the market for short-term rentals." Id. at 33, D361. They also stated that theirstudy provided evidence confirming they conclusion that Airbnb raises housing costs forlocal residents. Id. at 33 — 34, D361 — 362. The data reviewed included "effectmagnitudes" for the nations' ten largest metropolitan areas, including the Chicago area.Id. at 52, D380.
All of these reports support the proposition that house sharing has a tendency to reducethe availability of affordable housing, and there is no reason to believe that they would not applyto Chicago. In my opinion, these reports axe of a type that would be reasonably relied upon bypolicy makers and advisers in positions such as mine in forming opinions and inferences uponthe subjects that the reports address.
In addition, ~my research has disclosed the following studies that further support theproposition:
"The High Cost of Short-Term Rentals in New York City," David Wachsmuth, DavidChaney, Danielle Kerrigan, .Andrea Shillolo, Robin Basalaev-Binder, Urban Politics andGovernance research group, School of Urban Planning, McGill University (January 30,2018), copy attached as Exhibit B. This report provided a comprehensive analysis ofAirbnb activity in New York City and the surrounding region, from September 2014through August 2017. Id. at 2. Key findings were, among other things, that Airbnb had
4
FILE
D D
ATE:
6/2
1/20
19 6
:51
PM
2016
CH
1548
9

removed between 7,000 and 13,500 units of housing from New York City's long-termrental market, and that by reducing housing supply, Airbnb had increased the medianlong-term rent in New York City by 1.4% over the last three years. Id.
• "The economic costs and benefits of Airbnb," Josh Bivens, Economic Policy Institute(January 30, 2019), copy attached as Exhibit C. This report stated, among other things:"The largest and best-documented potential cost of Airbnb expansion is the reducedsupply of housing as properties shift from serving local residents to serving Airbnbtravelers, which hurts local residents by raising housing costs.... High-quality studiesindicate that Airbnb introduction and expansion in New York City, for example, mayhave raised average rents by nearly $400 annually for city residents." Id. at 2.
"Selling the District Short," D.C. Working Families (March 2017), copy attached asExhibit D. The report stated, among other things: "The growth of the commercial STRmarket has serious negative implications for housing affordability and quality of life forD.C. residents." Exhibit D at 4.
In my opinion, these reports too are of a type that would be reasonably relied upon bypolicy makers and advisers in positions such as mine in forming opinions and inferences uponthe subjects that the reports address.
E. Responses to Dr. Moore
In his report, Dr. Moore makes a number of arguments with which I disagree. These arelisted and discussed below:
Dr. Moore states that studies which rely on New York City data "may not berepresentative." Report at 7. He also claims "[t]here is a rule of thumb in economics`New York City is always an outlier' —meaning that what is true in New York City is nottypical of the rest of the United States." Id. at 10. He further states that "[t]here is noclear reason to think the effects of home sharing on rents would [be] as strong as in in[sic.] New York City ..." Id. At his deposition, Dr. Moore could cite no academicliterature supporting these opinions. Moore deposition transcript at 22. His mainexplanation was that New York City is more dense than other cities, and its real estatemarket is less "flexible." Id. at 22-24. It is true that New York City is more dense thanChicago, but I see no reason to believe that the effects of Airbnb found in New York Citywould not be expected to occur in Chicago as well. Even if, as Dr. Moore suggests, theywould not be as strong, that does not mean that they would not be significant. In fact, as Idiscuss below, in my position with the City of Chicago's Department of Housing, I haveobserved such effects in Chicago first hand. In addition, as discussed above, similarreports have been issued using data from Los Angeles, Boston, Washington D.C. andcities nationwide, and those reports have all reached similar conclusions.
• Dr. Moore states that "the type of business and vacation travelers who use Airbnb are notlooking for apartments at the bottom of the market." Report at 9. At his deposition, Dr.
FILE
D D
ATE:
6/2
1/20
19 6
:51
PM
2016
CH
1548
9

Moore admitted that he did not do. any study of Chicago Airbnb listings, to see if this wasaccurate for Chicago. Moore deposition transcript at 30, 39. Working with my staff, Idid do such a study. We found that the most Airbnb listings are indeed in better offneighborhoods. However, we also found that there are many Airbnb listings in almostevery neighborhood of Chicago. A map of these results shows 7,1671istings attached asExhibit E. The report authored by the Office of the New York City Comptroller found asimilar pattern in New York City. Exhibit E, Table 2 and Appendix.
Dr. Moore states that "while conversion to home sharing might affect the total rentalhousing market, it's unlikely that those effects are sufficiently strong among thepopulation of renters most vulnerable to disruption to .push them into homelessness."Report at 10. This ignores the spillover effect of house sharing. As noted in "HowAirbnb Short-Term Rentals Exacerbates Los Angeles's Affordable Housing Crisis,"discussed above, the pressure that short-term rentals place on rent prices "pushes unitsout of the margins of affordability for low- and middle-income residents, an effect thatcascades throughout the city." Id. at 240, D315. In other words, if rent prices increase inthe neighborhoods where house sharing is most common, some people who cannot affordthose rents move into less expensive neighborhoods, which raises the rents there. This inturn spills over to less well-off neighborhoods, where at some point people who couldbarely afford the rent before have to move out or get evicted. These people becomehomeless or at least require governmental assistance to secure housing.
• Dr. Moore draws a distinction between "the effect of home sharing on homelessness" andits effect "on rental prices." Report at 10. I agree that there are many causes tohomelessness. However, an individual's inability to pay the rent can be one of them. Ifsomeone is just barely able to pay the rent, and if the rent goes up, then that person has tomove out or be evicted. If that person is already at the bottom of the economic ladder,then there may be no new place to move into, and that person will become homeless or atleast need governmental assistance to secure housing.
Dr. Moore did not include in his report any reference to his deposition Exhibits 7 and 8,discussed above. Those reports included Chicago data showing that a large percentage ofhouse share listings are by investors and developers, as opposed to individuals who trulywant to share the unix in which they live. At his deposition, Dr. Moore said he did notinclude those reports because he did not consider them relevant to the issue of whetherhouse sharing has an impact on the availability of affordable housing. Moore depositiontranscript at 34-36. As he put it, given a certain number of units listed on Airbnb, itdoesn't matter who owns the unit. Id. at 44-45. However, Dr. Moore's conclusionignores the disparate impact upon the rental market between a host who rents out an extraroom versus an. absentee host who rents out an entire home or building. Specifically, inthe case of the live-in host, renting out a room does not remove housing from the long-term rental market. By contrast, when an investor or developer reserves multiple unitsfor short-term rentals, this does remove those units from the long-term rental maxket.Therefore, in my opinion, Dr. Moore's conclusion that the impact on the available stockof housing is the same, regardless of who is listing the unit, is incorrect.
FILE
D D
ATE:
6/2
1/20
19 6
:51
PM
2016
CH
1548
9

In my position with the City of Chicago Department of Housing, I have seen the effectsof house sharing first-hand. In particular, the following single room occupancy hotel ("SRO")was recently converted into a building that will be reserved. for short term rentals: 2001 NorthCalifornia. This is in the Logan Square neighborhood of Chicago. Typically, SROs housepeople of limited means who are not in a position to sign long-term lease agreements. When thisSRO was converted, the City had to help provide resources and assist with finding replacementhousing for many people who had previously lived in those buildings. The City required thedeveloper to provide relocation assistance to the residents who will be displaced by this propertybeing removed from the market and no longer being operated affordably. The relocationassistance included a cash settlement for losing their home and help in identifying a new place tolive.
F. Conclusion
For the reasons summarized above, I believe there is substantial support for theproposition that house sharing has a tendency to reduce the availability of affordable housing,thereby contributing to the problem of homelessness.
FILE
D D
ATE:
6/2
1/20
19 6
:51
PM
2016
CH
1548
9

Exhibit E
FILE
D D
ATE:
6/2
1/20
19 6
:51
PM
2016
CH
1548
9

FILE
D D
ATE:
6/2
1/20
19 6
:51
PM
2016
CH
1548
9

Exhibit K
FILE
D D
ATE:
6/2
1/20
19 6
:51
PM
2016
CH
1548
9

IN THE CIRCUIT COURT OF COOK COUNTY, ILLINOISCOUNTY DEPARTMENT, CHANCERY DIVISION
LEILA MENDEZ and ALONSO ZARAGOZA,
Plaintiffs,
v.
CITY OF CHICAGO, a municipal corporation;And ROSA ESCARENO, in her officialcapacity as Commissioner of the City ofChicago Department of Business Affairs andConsumer Protection,
Defendants.
Case No. 16 CH 15489
Hon. Sanjay T. Tailor
CITY OF CHICAGO'S RESPONSE TO PLAINTIFFS' SECONDSET OF INTERROGATORIES
Defendant City of Chicago ("City") responds to Plaintiffs' Second Set of Interrogatories
as follows:
INTERROGATORY NO.26
Identify each and .every fact the City will rely on to show that the stated purpose of theAmendment's 2% surcharge — "to fund housing and related supportive services for victims ofdomestic violence," Chi. Muni. Code 3-24-030(C) — bears a reasonable relationship to theobject of the Ordinance.
Response: The City objects to this Interrogatory on the grounds that it is vague and
lacks foundation. Subject to and without waiving these objections, the City states
that the surcharge's stated purpose is the same as the object of the Ordinance and
therefore, by definition, bears a reasonable relationship to it.
INTERROGATORY NO.27
Identify each and every object of the Amendment's 2%surcharge.
FILE
D D
ATE:
6/2
1/20
19 6
:51
PM
2016
CH
1548
9

Response: The purpose of the surcharge is to fund housing and related supportive
services for victims of domestic violence.
INTERROGATORY NO. 28
Identify any and all public policies that the City alleges support the Amendment's 2%surcharge.
Response: One public policy consideration supporting the surcharge is caring for
victims of domestic violence. Survivors and victims of domestic violence often
report that lack of safe and affordable housing is one of the primary barriers they
face in choosing to leave an abusive partner. Studies indicate that house sharing has
a tendency to reduce the availability of affordable housing, thereby contributing to
the problem of domestic abuse victims lacking affordable housing. Each housing
unit that is used for short-term house sharing rentals is a unit that it not available for
use as permanent or transitional housing for victims of domestic violence. This also
negatively impacts the housing available to the City and non-profit organizations
seeking to shelter victims of domestic violence.
Another related policy consideration is to reduce the number of homeless
people in Chicago. Domestic violence is seen as a predictive factor of homelessness.
Studies indicate that domestic violence significantly contributes to homelessness due
to lack of available and affordable housing for those seeking to escape a domestic
abuse situation. A related policy consideration is to comply with HUD's federal
mandate to prioritize domestic violence victims when addressing issued of
homelessness. Compliance with that mandate is necessary in order to secure access
2
FILE
D D
ATE:
6/2
1/20
19 6
:51
PM
2016
CH
1548
9
to the limited federal resources provided to combat homelessness. Investigation
continues. The City will supplement this Response as appropriate.
INTERROGATORY NO. 29
Identify the "related supportive services for victims of domestic violence" the City funds,has funded, plans to fund, or may fund with revenue from the Amendment's 2% surcharge.
Response: The surcharge will enable the City to maintain existing shelter beds, fund
additional shelter beds, and build a new shelter for victims of domestic violence.
Additionally, the City currently supports approximately 30 different programs
through various partner organizations who offer services to survivors of domestic
violence. Some of these services include a 24/7 domestic violence hotline,
immediate crisis counseling, safety planning, explanation of victim rights under the
Illinois Domestic Violence Act, emotional support and guidance, crisis intervention,
shelter placement, legal advocacy, linking survivors to medical and health services,
child care, job training and housing options. Investigation continues. The City will
supplement this Response as appropriate.
INTERROGATORY NO. 30
Identify each person who provided information needed to respond to any interrogatory orrequest herein, including which interrogatory (by number) was addressed by each such personrespectively.
Response: Stefan Schaffer-City of Chicago Chief Resilience Officer, Christopher
Wheat-Asst. to the Mayor, Anne Sheahan-Assistant to the Mayor, Robin Ficke-
Research Director for World Business Chicago and Maura McCauley-Director of
Homeless Prevention, Policy and Planning for the Chicago Department of Family
3
FILE
D D
ATE:
6/2
1/20
19 6
:51
PM
2016
CH
1548
9

and Support Services all either provided or confirmed the accuracy of information
used in answering Interrogatories Number 28 and 29.
Weston HanscomDeputy Corporation CounselCity of Chicago Law DepartmentRevenue Litigation Division30 N. LaSalle, Suite 1020Chicago, IL 60602(312) 744-9077
Jason RubinSenior CounselCity of Chicago Law DepartmentRevenue Litigation Division30 N. LaSalle, Suite 1020Chicago, IL 60602(312) 744-4174
4
Respectfully submitted,
OF CHICA
has n Rubin
eston Hanscom
Attorneys for
DefendantsFILE
D D
ATE:
6/2
1/20
19 6
:51
PM
2016
CH
1548
9

CERTIFICATION
On this day, November 7, 2018, under penalties as provided by law pursuant to Section 1-109 of the Code of Civil Procedure, the undersigned certifies that the answers to Interrogatories asset forth in this document are true and correct to the best of his knowledge, information and belief.
Stun SchafferChief Resilience Officer for City of Chicago
FILE
D D
ATE:
6/2
1/20
19 6
:51
PM
2016
CH
1548
9

CERTIFICATE OF SERVICE
I, Jason Rubin, an attorney, hereby certify that on November 7, 2018, I caused the
foregoing City of Chicago's Response to Plaintiffs' Second Set of Interrogatories to be
served on:
Jeffrey SchwabLiberty Justice CenterCook County No. 49098190 S. LaSalle Street, Suite 1500Chicago, Illinois 60603i schwab(u~ liberty] usticecenter. org
via messenger delivery and electronic mail; and on
Jacob HuebertChristina SandefurTimothy SandefurGoldwater Institutej huebert(a~ goldwaterinstitute.orgesandefur(a~~~oldwaterinstitute.orgtsandefur(c~ ~oldwaterinstitute.org
via electronic mail.
FILE
D D
ATE:
6/2
1/20
19 6
:51
PM
2016
CH
1548
9

Exhibit L
FILE
D D
ATE:
6/2
1/20
19 6
:51
PM
2016
CH
1548
9

FILE
D D
ATE:
6/2
1/20
19 6
:51
PM
2016
CH
1548
9
1
Expert Report of Adrian T. Moore, Ph.D.
1. Opinions to be expressed.
a. The studies shared by defendant are few, mostly rely on New York City data—which may not be representative, and find very small to modest effects of home sharing on rents, and no direct connection to homelessness.
b. Chicago has long suffered a shortage of affordable housing with no evidence the problem is worse since the advent of home sharing.
c. An extensive literature finds that housing price increases beyond construction costs (which are stable) are driven predominantly--90% by best estimate--by local land use and housing regulations.
d. Studies directly link land use and housing regulations to increased homelessness, with effects that considerably exceed those of home sharing cited by defendant.
e. Income problems explain most of homelessness. f. City of Chicago has many policy options to address land use and housing regulations
that could reduce housing costs and rents and help homelessnes. Housing markets are dynamic if not fast moving and will adapt to the technology change of home sharing if allowed to.
2. Basis for opinions to be expressed The economic theories and literature on housing supply and regulation have been part of my career’s work with state and local jurisdictions on affordable housing issues. I have 22 years of experience analyzing housing markets and regulations, including testifying before local and state government bodies on their effects. In preparing these opinions I reviewed the most important and the most recent academic literature on licensing of firms and regulations concerning licensing and market entry, including (in order cited): Dayne Lee, “How Airbnb Short-Term Rentals Exacerbate Los Angeles's Affordable Housing Crisis: Analysis and Policy Recommendations,” Harvard Law & Policy Review, Vol. 10, 2016, pp.229-253. Office of the New York City Comptroller Scott M. Stringer, The Impact of Airbnb on NYC Rents, April 2018.
FILE
D D
ATE:
6/2
1/20
19 6
:51
PM
2016
CH
1548
9

2
Stephen Sheppard and Andrew Udell, “Do Airbnb properties affect house prices?” Williams College Department of Economics Working Papers, January 1, 2018. Kyle Barront, Edward Kung, and Davide Proserpio, “The Sharing Economy and Housing Affordability: Evidence from Airbnb,” Available at Social Science Research Network, April 1, 2018. Phil Nyden, James Lewis, Kale Williams and Nathan Benefield, Affordable Housing in the Chicago Region: Perspectives and Strategies, Institute for Metropolitan Affairs, Roosevelt University & Center for Urban Research and Learning, Loyola University Chicago, & Community Partners, 2003. Morgan Stanley, Global Insight: Who Will Airbnb Hurt More - Hotels or OTAs?, November 15, 2015. Daniel Guttentag, Steven Smith, Luke Potwarka, and Mark Havitz, “Why Tourists Choose Airbnb: A Motivation-Based Segmentation Study,” Journal of Travel Research, 2018, 57(3), pp.342–359. Up for Growth National Coalition, Holland Government Affairs, ECONorthwest, Housing Underproduction in the U.S.: Economic, Fiscal and Environmental Impacts of Enabling Transit-Oriented Smart Growth to Address America’s Housing Affordability Challenge, 2018. William A. Fischel, Do Growth Controls Matter? A Review of the Empirical Evidence on the Effectiveness and Efficiency of Local Government Land Use Regulation, Lincoln Institute of Land Policy, 1990. Harvard Joint Center for Housing Studies, America’s Rental Housing: Expanding Options for Diverse and Growing Demand, 2015. Jason Furman, “Barriers to Shared Growth: The Case of Land Use Regulation and Economic Rents,” The Urban Institute, November 20, 2015. Christopher J. Mayer and C. Tsuriel Somerville, "Land Use Regulation and New Construction," Regional Science and Urban Economics, 2000 30, (6), pp.639-662. John M. Quigley and Steven Raphael, "Regulation and the High Cost of Housing in California," The American Economic Review, 2005, 95 (2), pp.323–328. Edward L., Glaeser and Bryce A. Ward, “The Causes and Consequences of Land Use Regulation: Evidence from Greater Boston,” Journal of Urban Economics, 2009, 65, pp.265-278. Housing Markets and the Economy: Risk Regulation, and Policy, Cambridge, MA: Lincoln Land Institute (2009)
FILE
D D
ATE:
6/2
1/20
19 6
:51
PM
2016
CH
1548
9
3
Rethinking Federal Housing Policy: How to Make Housing Plentiful and Affordable, Washington, D.C.: The AEI Press (2008). Edward L. Glaeser and Joseph Gyourko, “The Impact of Building Restrictions on Housing Affordability,” FRBNY Economic Policy Review, June 2003. Edward L. Glaeser, “Reforming Land Use Regulations,” Brookings Institution, April 2017. Edward L. Glaeser, Joseph Gyourko, and Raven Saks, “Why is Manhattan so expensive? Regulation and the rise in housing prices,” The Journal of Law and Economics, 2005, 48, no. 2, pp. 331-369 Keith R. Ihlanfeldt, “The Effect of Land Use Regulation on Housing and Land Prices,” Journal of Urban Economics, 2007, 61.3, pp.420-435. Adam Millsap, Samuel Staley, and Vittorio Nastasi, Assessing the Effects of Local Impact Fees and Land-use Regulations on Workforce Housing in Florida, James Madison Institute, 2018. William Tucker, How Housing Regulations Cause Homelessness, National Affairs The Public Interest, 1991, pp.78-88. Todd Swanstrom, “No Room at the Inn: Housing Policy and the Homeless,” Journal of Urban and Contemporary Law, 1989, Vol. 35:81, pp.81-105. Steven Raphael, “Homelessness and Housing Market Regulation” in Ingrid Gould-Ellen and Brendan O’Flaherty (eds.), How to House the Homeless, Russell Sage Foundation, 2010, pp 110-135. Brendan O’Flaherty, “Wrong Person and Wrong Place: For Homelessness, the Conjunction Is What Matters,” Journal of Housing Economics, 2004, 13(1), pp.1–15 Stephen Malpezzi and Richard K. Green, “What Has Happened to the Bottom of the U.S. Housing Market?” Urban Studies, 1996, 33(1), pp.1807–20. National Coalition for the Homeless, https://nationalhomeless.org/about-homelessness John M. Quigley, Steven Raphael, and Eugene Smolensky, “Homeless in America, Homeless in California,” The Review of Economics and Statistics, February 2001, 83(1), pp.37–51. Ron J. Feldman, “The Affordable Housing Shortage: Considering the Problem, Causes and Solutions,” The Region, Federal Reserve Bank of Minneapolis, September 2002. Christina Sandefur, “Life, Liberty, and the Pursuit of Home-Sharing,” Regulation, Fall 2016, 39(3), pp.12-15.
FILE
D D
ATE:
6/2
1/20
19 6
:51
PM
2016
CH
1548
9
4
3. Qualifications I hold a master’s and Ph.D. in economics from the University of California at Irvine. I have performed economic analysis of land use and housing policies at Reason Foundation, a non-profit research organization based in Los Angeles, for the last 22 years, the last 17 of which as vice-president in charge of the research division. I have served on local, state, and federal advisory commissions on regulatory and economic policy issues, and published many reports and articles in professional, trade, academic and popular magazines on regulatory and economic issues. In particular, I have supervised and conducted research and published articles on the effects of policies governing housing markets. 4. Publications Authored Within the Preceding 15 Years Contracting For Road and Highway Maintenance, with Geoffrey F. Segal and Samuel McCarthy, Reason Public Policy Institute, March 2003. California Citizen’s Budget, with Carl DeMaio, Adam Summers, Geoffrey F. Segal, Lisa Snell, Vincent Badolato, and George Passantino, Reason Public Policy Institute and Performance Institute, April 2003. Decentralizing Federal Employment, with John P. Blair and Geoffrey F. Segal, The Buckeye Institute for Public Policy Solutions, June 2003. Getting the Right People for the Right Job: Solving Human Capital Challenges with Competitive Sourcing, with Geoffrey F. Segal and John P. Blair, Reason Foundation, September 2003. Movin' Juice: Making Electricity Transmission More Competitive, with Lynne Kiesling, Reason Foundation, September, 2003. Private Competition for Public Services: Unfinished Agenda in New York State, with . J. McMahon and Geoffrey F. Segal, Manhattan Institute, December 2003. Frequently Asked Questions about Water / Wastewater Privatization, with Geoffrey F. Segal, Reason Foundation, September 2003. A Legislative Guide to Competitive Sourcing in the States (and Elsewhere), with Geoffrey F. Segal and Rebecca Bricken, National Federation of Independent Businesses, July 2005.
FILE
D D
ATE:
6/2
1/20
19 6
:51
PM
2016
CH
1548
9
5
Offshoring and Public Fear: Assessing the Real Threat to Jobs, with Ted Balaker, Reason Foundation, May 2005. Rebuilding After Katrina: Policy Strategies for Recovery, with Lisa Snell, and Geoffrey Segal, Reason Foundation, October 2005. Addressing California’s Transportation Needs, with Ted Balaker, George Passantino, Robert W. Poole, Jr., Adam Summers, and Lanlan Wang, Reason Foundation, September 2006. Undermining the Future: Problems with November's Bond Initiatives, and Alternatives, with George Passantino and Adam B. Summers, September 2006, Reason Foundation, September 2006. The Bond Propositions on California's November Ballot: Where Would the Money Be Spent?, Reason Foundation, September 2006. The Emerging Paradigm: Financing and Managing Pennsylvania's Transportation Infrastructure and Mass Transit, with Geoffrey Segal and Matthew Brouillette, Commonwealth Foundation, March 2007. The California High-Speed Rail Proposal: A Due Diligence Report, with Wendell Cox and Joeseph Vranich, Reason Foundation, September 2008 Ten Principles of Privatization, with Len Gilroy, Reason Foundation, July, 2010 Restoring Trust In the Highway Trust Fund, with Robert W. Poole, Reason Foundation, August, 2010 19th Annual Highway Report: The Performance of State Highway Systems (1984-2008), with David T. Hartgen, Ravi K. Karanam and M. Gregory Fields, Reason Foundation, September, 2010 Corrections 2.0: A Proposal to Create a Continuum of Care in Corrections through Public-Private Partnerships, with Leonard Gilroy, Reason Foundation, January, 2011 Reducing Greenhouse Gas Emissions from Automobiles, with Wendell Cox, Reason Foundation, November, 2011 Impacts of Transportation Policies on Greenhouse Gas Emissions in U.S. Regions, with David T. Hartgen & M. Gregory Fields, Reason Found. (Nov. 2011) Reducing Traffic Congestion & Increasing Mobility in Chicago, with Samuel Staley, Reason Foundation, July 2012.
FILE
D D
ATE:
6/2
1/20
19 6
:51
PM
2016
CH
1548
9
6
The XpressWest High-Speed Rail Line from Victorville to Las Vegas: A Taxpayer Risk Analysis, with Wendell Cox, Reason Foundation, August 2012 California Voters’ Guide: November 2012 Ballot Propositions, Reason Foundation, October 2012 California High-Speed Rail: An Updated Due Diligence Report, with Joseph Vranich and Wendell Cox, Reason Foundation, April 2013 Savings for Fresno: The Role of Privatization, with Leonard Gilroy, Reason Foundation, May 2013 20th Annual Highway Report on the Performance of State Highway Systems, with David Hartgen, Gregory Fields, and Elizabeth San José, Reason Foundation, July 2013 Still A Loser: The Tampa to Orlando High-Speed Rail Proposal, with Wendell Cox, Reason Foundation, December 2013 Pension Reform Handbook: A Starter Guide for Reformers, with Lance Christensen, Reason Foundation, July 2014. Occupational Licensing Kills Jobs, with Matthew Laird and Samuel Staley, February 2016 Urban Containment: The Social and Economic Consequences of Limiting Housing and Travel Options, with Wendell Cox, March, 2016 The Changing Workplace And The New Self-Employed Economy, May, 2018 Cannabis Legalization and Juvenile Access, May, 2018 A Common Sense Approach to Marijuana-Impaired Driving, with Teri Moore, January, 2019
FILE
D D
ATE:
6/2
1/20
19 6
:51
PM
2016
CH
1548
9

7
The Link between Home Sharing and Homelessness Is Weak and Small, Overwhelmed by Policy Decisions 1. SUMMARY Defendant argue that studies indicate that house sharing reduces affordable housing and contributes to homelessness. I argue that:
a. The studies shared by defendant are few, mostly rely on New York City data—which may not be representative, and find very small to modest effects of home sharing on rents, and no direct connection to homelessness.
b. Chicago has long suffered a shortage of affordable housing with no evidence the problem is worse since the advent of home sharing.
c. An extensive literature finds that housing price increases beyond construction costs (which are stable) are driven predominantly--90% by best estimate--by local land use and housing regulations.
d. Studies directly link land use and housing regulations to increased homelessness, with effects that considerably exceed those of home sharing cited by defendant.
e. Income problems explain most of homelessness. f. City of Chicago has many policy options to address land use and housing regulations
that could reduce housing costs and rents and help homelessnes. Housing markets are dynamic if not fast moving and will adapt to the technology change of home sharing if allowed to.
2. City of Chicago’s Argument City of Chicago, in response to plaintiff’s interrogatory no. 13 states, “Studies indicate that house sharing has a tendency to reduce the availability of affordable housing, thereby contributing to the problem of homelessness. Each housing unit that is used for short term house sharing rentals is a unit that is not available for use as permanent housing for residents.”1 In addition, defendants have provided plaintiffs with several reports to support this statement:
A 2016 study that points to correlation between increasing listings of Airbnb and lower vacancy rate of apartments in Los Angeles. It argues that, unlike many other commodities a shortage of housing supply cannot be quickly resolved with new construction, so rapid
1 Mendez v City of Chicago, Defendants’ Responses to Plaintiffs’ First Set of Interrogatories, p.7.
FILE
D D
ATE:
6/2
1/20
19 6
:51
PM
2016
CH
1548
9

8
growth of short-term rentals like Airbnb constitutes a supply shock to the rental housing market.2
A 2018 report by the New York City comptroller that says of Airbnb, “the trendy replacement for hotels and hostels in effect removes housing units from the overall supply.” It finds that between 2009 and 2016 rental rates rose dramatically in most neighborhoods of New York City and its empirical analysis attributes 9.2% of the rental rate increase to Airbnb.3
An unpublished but useful 2018 Williams College working paper also looks at data from New York City and finds that “doubling the total number of Airbnb properties within 300 meters of a house is associated with an increase in property value of 6 to 9%.” It does not go on to calculate how much of the rising property values translates into a rise in rent.4
A 2018 Social Science Research Network working paper using national data finds that “a 1% increase in Airbnb listings leads to a 0.018% increase in rent and a 0.26% increase in house prices at the median owner occupancy rate zipcode.”5
These reports constitute the body of evidence linking home sharing to homelessness, and indeed are cited by others than City of Chicago. Given the very short time in which data on Airbnb has been available, there is not much published research on this association. The statement from City of Chicago I opened with provides a fair summary of this research. 3. Reasons to Doubt the Linkage of Home Sharing and Homelessness and the Appropriate
Degree of Policy Response Housing supply cannot change much in the short run—construction takes time, as does permitting, environmental review, inspections, etc. Though there is almost always a certain about of real estate that owners don’t have available in the market for economic or financial reasons that can be brought to market more quickly than new construction if conditions change. The argument that property owners shifting housing units from long-term rentals to home sharing replaces the supply of long-term rental housing with the short- to medium-term seems to make sense, but the key questions are:
2 Dayne Lee, “How Airbnb Short-Term Rentals Exacerbate Los Angeles's Affordable Housing Crisis: Analysis and Policy Recommendations,” Harvard Law & Policy Review, Vol. 10, 2016, pp.229-253. 3 Office of the New York City Comptroller Scott M. Stringer, The Impact of Airbnb on NYC Rents, April 2018. 4 Stephen Sheppard and Andrew Udell, “Do Airbnb properties affect house prices?” Williams College Department of Economics Working Papers, January 1, 2018. 5 Kyle Barront, Edward Kung, and Davide Proserpio, “The Sharing Economy and Housing Affordability: Evidence from Airbnb,” Available at Social Science Research Network, April 1, 2018.
FILE
D D
ATE:
6/2
1/20
19 6
:51
PM
2016
CH
1548
9

9
Are affordable housing shortages new in Chicago or appreciably worse since the advent of Airbnb?
Are the effects of home sharing on home prices and homelessness substantial and are supply restrictions the best response?
What policy choices determine home prices and rents, and how large are those effects relative to home sharing?
Do analyses of rental housing markets consider home sharing a significant factor? 3.1. Affordable housing problems in Chicago predate homes sharing. Chicago’s affordable housing problems long pre-date the advent of Airbnb. A 2003 study examined Chicago’s housing problem in detail and makes several relevant points.6 First it cites an analysis of rental housing markets in Chicago conducted by the Metropolitan Planning Council in 2000, which concluded that “the Chicago area rental market fell far short of being able to meet the current and anticipated demand for rental housing.” If the amount of housing being built and added to the supply is not keeping of with the amount demanded you have a classic economic shortage which tends to drive up prices. Second, the housing report goes on to provide over 100 pages of analysis of the many social, economic and policy forces that are restricting and distorting Chicago’s rental housing market, ranging from the distribution of building sites relative to jobs to racial barriers to distortions in federal funding. In other words, the study finds various forces are restricting housing supply. Third, it emphasizes that the location of the most affordable rental housing tends to be far from areas of economic growth. Consider defendants’ argument that when an apartment converts to Airbnb it displaces people who wind up being homeless and needing city services. But people who are financially and unable to afford moving to another apartment if their lease is canceled tend to live in apartments near the bottom of the market.7 In contrast, the type of business and vacation travelers who use Airbnb are not looking for apartments at the bottom of the market.8 They are looking for higher quality apartments. Indeed, the apartments at the bottom of the market where the most vulnerable
6 Phil Nyden, James Lewis, Kale Williams and Nathan Benefield, Affordable Housing in the Chicago Region: Perspectives and Strategies, Institute for Metropolitan Affairs, Roosevelt University & Center for Urban Research and Learning, Loyola University Chicago, & Community Partners, 2003. 7 See discussion in section 4.3 below about income and homelessness. 8 Middle class tourists visiting a city like Chicago, likely from a suburban community or small city, are almost certainly not looking for apartments in the poorest neighborhoods of Chicago. A Morgan Stanley analysis in 2015 found “~66% of U.S. Airbnb users earning over $75k/year,” Morgan Stanley, Global Insight: Who Will Airbnb Hurt More - Hotels or OTAs?, November 15, 2015. Daniel Guttentag, Steven Smith, Luke Potwarka, and Mark Havitz, “Why Tourists Choose Airbnb: A Motivation-Based Segmentation Study,” Journal of Travel Research, 2018, 57(3), pp.342–359 found that over 80% of Airbnb users are on leisure travel.
FILE
D D
ATE:
6/2
1/20
19 6
:51
PM
2016
CH
1548
9
10
people live are typically not in the places close to key business centers and tourist sites that Airbnb users seek. So, while conversion to home sharing might affect the total rental housing market, it’s unlikely that those effects are sufficiently strong among the population of renters most vulnerable to disruption to push them into homelessness. 3.2 The effects of home sharing on homelessness are indirect and small. The empirical evidence for defendants’ core argument, as listed in section 2 above, does not measure the effects of home sharing on homelessness, but rather on rental prices. It is assumed that higher rents and fewer vacancies create an impact on homelessness. Those studies find home sharing raising rents up to 9%, but that is based only on two studies of data in New York City and one national dataset that found the lowest average impact on rents—less than 1%. There is a rule of thumb in economics “New York City is always an outlier”—meaning that what is true in New York City is not typical of the rest of the United States. There is no clear reason to think the effects of home sharing on rents would as strong as in in New York City—indeed that city may be the upper bound. Ultimately they are not large effects, especially based on such limited data and mostly unpublished work. Clearly other, much larger forces are at work, as discussed in the next section. Policy responses based on such a small share of the cause of a problem are not serious attempts to address the problem. Policy interventions that skew the market may have much larger effects than the problem they attempt to address when aimed at such a small target. 4. The Major Movers of Rental Prices and Homelessness: Land Use Regulations and Income 4.1. Land Use and Housing Regulations and Housing Prices Harvard’s Joint Center for Housing Studies’ definitive survey of America’s rental housing market in 2017 finds rental vacancies are increasing nationwide and thoroughly discusses the challenges that the rental housing market faces with no mention of Airbnb or the rise of home sharing. Home sharing is simply not a problem that even shows up on the radar screen relative to long running major factors that shape the rental market. An extensive literature finds that the cost of constructing housing is relatively stable compared to the economy as a whole, and that housing is very affordable in much of the United States but that some cities experience considerably higher prices and affordable housing shortages. As explained further on, land-use and growth restrictions, zoning, and housing regulations explain roughly 90% of the home price differentials between markets with similar amenities. In other
FILE
D D
ATE:
6/2
1/20
19 6
:51
PM
2016
CH
1548
9
11
words, most of the problem with lack of affordable housing in Chicago and high rents is attributable to decisions by the city that raise the cost of housing. Housing Underproduction in the U.S., a very thorough 2018 study, finds that “from 2000 to 2015, 23 states underproduced housing to the tune of 7.3 million units, or roughly 5.4% of the total housing stock of the U.S., which has created the supply and demand imbalance that is reflected in today’s home prices.”9 An important 1990 review of research on prices in housing and land markets first drew attention to how land use regulations, zoning, and growth controls have significant and substantial effects on home prices—and those effects increase with the degree of restriction of the market.10 More recently, the Harvard Joint Center for Housing Studies 2015 report on America’s rental market pointed out that:
Local land use restrictions often restrict the area available for multifamily development, particularly in the suburbs, which can increase the competition for available sites and raise land costs. Parcel assemblage and acquisition are also costly in locales where demand for market-rate rentals is strong. In addition, development economics rest heavily on allowable densities, but local zoning restrictions often limit the number of units in multifamily development. This raises per unit construction costs and ultimately the rents the developers must charge to be profitable.11
The California Legislative Analyst’s Office examined the causes of high housing prices in California, concluding that “[C]ommunity resistance to housing, environmental policies, lack of fiscal incentives for local government to approve housing, and limited land constrains new housing construction. A shortage of housing along California’s coast means households wishing to live there compete for limited housing. This competition builds up home prices and rents.” Of course, this is precisely true of large downtowns like Chicago as well.
9 Up for Growth National Coalition, Holland Government Affairs, ECONorthwest, Housing Underproduction in the U.S.: Economic, Fiscal and Environmental Impacts of Enabling Transit-Oriented Smart Growth to Address America’s Housing Affordability Challenge, 2018. 10 William A. Fischel, Do Growth Controls Matter? A Review of the Empirical Evidence on the Effectiveness and Efficiency of Local Government Land Use Regulation, Lincoln Institute of Land Policy, 1990. 11 Harvard Joint Center for Housing Studies, America’s Rental Housing: Expanding Options for Diverse and Growing Demand, 2015.
FILE
D D
ATE:
6/2
1/20
19 6
:51
PM
2016
CH
1548
9
12
Jason Furman, while chairman of the President’s Council of Economic Advisers in 2015, spoke about the causes of high housing and rental costs to the Urban Institute and provided a great review of the literature.12 Among the findings he discussed are that:
When construction markets are relatively competitive, the gap between house prices and construction costs should largely reflect the cost of buying land – a cost that increases with tighter land-use restrictions... [T]he gap between real house prices and construction cost has grown over time, even if we exclude the period of rapid house price increases in the mid-2000s… Real house prices in 2010 to 2013 are 56% above real construction costs… [A]fter around 1970, more stringent regulations played a much bigger role proportionately, implying that relaxing zoning constraints could bring house price is more in line with construction costs and reduce the economic rents accruing to landowners. Cross-sectional evidence also provides a similar picture... We can observe that some of the largest US cities with both restrictive zoning rules and desirable public goods tend to have persistently high housing prices relative to the cost of construction. Moreover, more cities saw an increase in these price markups than saw a decrease during the 1990s. Zoning restrictions…are supply constraints. Basic economic theory predicts – and many empirical studies confirm – that housing markets in which supply cannot keep up with demand will see housing prices rise. Mayer and Somerville (2000) conclude that land-use regulation and levels of new housing construction are inversely correlated, with the ability of housing supply to expand to meet greater demand being much lower in the most heavily regulated metro areas. Quigley and Rafael (2005) show that new construction is not as prevalent in areas characterized by growth restrictions. Glaeser and Ward (2009) found that an increase in one acre in a Greater Boston town’s average minimum lot size is associated with about 40% fewer new permits.13
12 Jason Furman, “Barriers to Shared Growth: The Case of Land Use Regulation and Economic Rents,” The Urban Institute, November 20, 2015. 13 Furman elegantly summarizes these important works so I need not. See Christopher J. Mayer and C. Tsuriel Somerville, "Land Use Regulation and New Construction," Regional Science and Urban Economics, 2000 30, (6), pp.639-662; John M. Quigley and Steven Raphael, "Regulation and the High Cost of Housing in California," The American Economic Review, 2005, 95 (2), pp.323–328; and Edward L., Glaeser and Bryce A. Ward, “The Causes and Consequences of Land Use Regulation: Evidence from Greater Boston,” Journal of Urban Economics, 2009, 65, pp.265-278.
FILE
D D
ATE:
6/2
1/20
19 6
:51
PM
2016
CH
1548
9

13
From Furman, “Barriers to Shared Growth.” Furman goes on to compare the National Association of Realtors Housing Affordability Index to the Wharton Residential Land Use Regulatory Index, and concludes that “restricted supply leads to higher prices and less affordability… this house price appreciation experienced especially in those cities towards the right of the figure presents affordability challenges for nearly all but they can hit the poorest Americans the hardest.” His analysis is shown in his Figure 3 above. Chicago is in the middle of the figure—the Wharton Residential Land Use Regulatory Index puts Chicago in the middle of the pack with respect to land use regulations. This means that while the housing market in Chicago is not as restricted as in, say, Boston, there are nearly 100 points in the Housing Affordability Index between Chicago and the least restrictive cities like St. Louis, Indianapolis, and Kansas City. This shows that Chicago has many policy options available to loosen up the housing market and lower home prices and rents. Harvard economist Edward Glaeser has published dozens of papers on land-use regulations and policies and costs.14 In a joint paper with Joseph Gyourko for the Federal Reserve Bank of New
14 Too many to list, including two books: Housing Markets and the Economy: Risk Regulation, and Policy, Cambridge, MA: Lincoln Land Institute (2009) and Rethinking Federal Housing
FILE
D D
ATE:
6/2
1/20
19 6
:51
PM
2016
CH
1548
9

14
York in 2003 examining the evidence of the impact of building restrictions on housing affordability they find that:
● Zoning and other restrictions on building account for 90% of the value of a home above construction costs.
● High levels of land use regulation are highly correlated with high housing costs. ● The market would lead to higher density in high cost areas, but cost and density are
poorly correlated, indicating that policies prevent the market outcome.15 In a 2017 report for the Brookings Institution Glaeser summarizes his years of research and states: 16
If demand alone drove prices, then we should expect to see places that have high costs also have high levels of construction. The reverse is true. Places that are expensive don’t build a lot and places that build a lot aren’t expensive. Naturally, there are also a host of papers showing the correlation between different types of rules and either reductions in new construction or increase in prices or both. The problem with empirical work on any particular land-use control is that there are so many ways to say no to new construction. Since the rules usually go together, it is almost impossible to identify the impact of any particular land use control. Moreover, eliminating one rule is unlikely to make much difference since anti-growth communities will easily find ways to block construction in other ways. Empirically, there is also a little evidence that these land use controls correct for real externalities. For example if people really value the lower density levels that land use controls create, then we should expect to see much higher prices in communities with lower density levels, holding distance to city center fixed. We do not. (Glaser and Ward, 2010) Our attempt to assess the total externalities generated by building in Manhattan found that they were tiny relative to the
Policy: How to Make Housing Plentiful and Affordable, Washington, D.C.: The AEI Press (2008). For more, see his CV at https://scholar.harvard.edu/files/glaeser/files/ed_glaeser_cv_2.10.15.pdf 15 Edward L. Glaeser and Joseph Gyourko, “The Impact of Building Restrictions on Housing Affordability,” FRBNY Economic Policy Review, June 2003. 16 Edward L. Glaeser, “Reforming Land Use Regulations,” Brookings Institution, April 2017.
FILE
D D
ATE:
6/2
1/20
19 6
:51
PM
2016
CH
1548
9

15
implicit tax on building created by land use controls (Glaeser, Gyourko and Saks 2005).17 Reforming local land use controls is one of those rare areas in which the libertarian and the progressive agree. The current system restricts the freedom of the property owner, and also makes life harder for poor Americans. The politics of zoning reform may be hard, but our land-use regulations are badly in need of re-thinking.
Just to show these results are not confined to studies in the Midwest and Northeast, a pair of studies of Florida cities are informative. A 2007 study examined data from 112 Florida jurisdictions in 25 counties and found that land use regulations have substantial effects on the price of housing and vacant residential land.18 Building on that work, another study used data from Florida cities to examine the home price effects of regulation and construction delay due to permitting and licensing processes, finding a range of 4% to 11% increase from regulatory costs and another almost 2% increase from delay.19 The bottom line is, there is a rich literature digging into what drives high housing costs in some cities that finds the vast majority of the blame rests on land use restrictions and housing regulations. Recall the Glaeser and Gyourko conclusion that zoning and other restrictions on building account for 90% of the value of a home above construction costs. 4.2. Land Use and Housing Regulation and Homelessness There has been some direct examination of the relationship between housing regulation and homelessness. A very early simple examination of homelessness relative to median home prices in 40 large U.S. cities found about 42% of the variation in homelessness is explained by median home prices.20 So even if a rise in home sharing does affect home prices by a few percent, less than half of that affect passes on to an effect on homelessness, attenuating the impact of home
17 See Edward L. Glaeser, Joseph Gyourko, and Raven Saks, “Why is Manhattan so expensive? Regulation and the rise in housing prices,” The Journal of Law and Economics, 2005, 48, no. 2, pp. 331-369 and Glaeser and Ward,” The Causes and Consequences of Land Use Regulation.” 18 Keith R. Ihlanfeldt, “The Effect of Land Use Regulation on Housing and Land Prices,” Journal of Urban Economics, 2007, 61.3, pp.420-435. 19 Adam Millsap, Samuel Staley, and Vittorio Nastasi, Assessing the Effects of Local Impact Fees and Land-use Regulations on Workforce Housing in Florida, James Madison Institute, 2018. 20 William Tucker, How Housing Regulations Cause Homelessness, National Affairs The Public Interest, 1991, pp.78-88.
FILE
D D
ATE:
6/2
1/20
19 6
:51
PM
2016
CH
1548
9
16
sharing on homelessness. The majority of the effect on home prices is from land-use restrictions and regulations on housing. A 1989 law review article argued persuasively that:21
1. Homelessness is primarily caused not by personal deficiencies, but by structural problems in metropolitan housing markets. 2. As a housing market problem, it is primarily a matter of inadequate supply, not inadequate economic demand. 3. A major cause of the inadequate supply of low income rental housing in large metropolitan areas with expanding service economies is the unintended effects of government policies. 4. Q.E.D.: to solve the problem of homelessness, it is not enough simply to spend more money on shelters; instead, housing policies, at all levels of government, must be redirected.
Building codes increased the cost of new construction, often beyond what was necessary for health and safety, thus helping to move the bottom of the rental market out of the reach of the very poor. Recent research indicates that strict enforcement of housing codes can lead to displacement of the poor, who cannot afford the increased rents necessary to cover the repairs, thus reducing the supply of low income housing. The homeless problem is caused primarily by inadequate supply, not inadequate demand (or simple poverty). The supply problem is rooted in the transformation of cities from centers of industry to centers of high-level service employment. Subsidizing demand, in the form of housing vouchers, does not address the underlying shortage of low-rent housing. Instead of helping those who need it the most, many policies protect the privileged position of entrenched housing interests, thereby hindering the ability of regional housing markets to adapt to changing needs—especially the needs of low income renters. Progress on the homeless problem, then, requires that we dismantle those policies that have helped cause the problem: tax incentives targeted to the wealthy homeowners, suburban zoning regulations designed to keep out low income rental housing, central city economic development policies that boost gentrification without regard to displacement—to name only a few.
21 Todd Swanstrom, “No Room at the Inn: Housing Policy and the Homeless,” Journal of Urban and Contemporary Law, 1989, Vol. 35:81, pp.81-105.
FILE
D D
ATE:
6/2
1/20
19 6
:51
PM
2016
CH
1548
9

17
An exceptionally thorough analysis of the connection between housing market regulations and homelessness is the chapter by UC Berkeley economist Steven Raphael, “Homelessness and Housing Market Regulation,” in the 2010 book How to House the Homeless.22 It provides a detailed and data-driven analysis of how a wide range of regulations increases the cost of housing and shift the distribution of housing toward the higher end of the market, discouraging construction of low-cost housing. For the lowest income population seeking housing, even the minimum-quality units are often out of reach in heavily regulated cities.
Empirically, point-in-time counts of the incidence of homelessness as well as period-prevalence counts are generally higher in regions of the country where housing is more expensive (see, for example, the number of studies cited in O’Flaherty 2004). John Quigley, Steven Raphael, and Eugene Smolensky (2001) demonstrate this positive association using several data sets that count the homeless during the mid-1990s and earlier.23
Raphael goes on to argue that there are several parts to the explanation for homelessness, including poverty and physical and mental illnesses, but “that the housing market itself may be a particularly important determinant of homelessness.”24 He goes on to examine specific regulations and housing standards that prevent housing from being built without such things as private kitchens or private bathrooms, and how people at high risk of homelessness are most in need of this type of minimalist or SRO housing (single room occupancy, low income single room apartments with shared kitchens and bathrooms). Note that this margin of housing is for people at high risk for homelessness, not the higher end apartments typically demanded by middle class vacation travelers and sometimes converted to home sharing.25 Expanding on this, Raphael argues:
Zoning regulation often restricts the amount of land within a municipality available for residential development and then dictates the density and quality of the housing that can be built. Growth controls, growth moratoria, exaction fees leveled on new development, and lengthy and complex project approval processes
22 Steven Raphael, “Homelessness and Housing Market Regulation” in Ingrid Gould-Ellen and Brendan O’Flaherty (eds.), How to House the Homeless, Russell Sage Foundation, 2010, pp 110-135. 23 Ibid, p. 112. See Brendan O’Flaherty, “Wrong Person and Wrong Place: For Homelessness, the Conjunction Is What Matters,” Journal of Housing Economics, 2004, 13(1), pp.1–15 and Quigley, Raphael, and Smolensky, “Homeless in America.” 24 Raphael, “Homelessness and Housing Market Regulation,” p.114 25 Op.cit note 8 above.
FILE
D D
ATE:
6/2
1/20
19 6
:51
PM
2016
CH
1548
9
18
tend to discourage new housing construction and the nature of new housing that is ultimately supplied to the local market. Although such regulations may not prohibit construction of minimum-quality housing, they do constrain production processes and likely restrict supply. These alternative forms of housing-market regulation impact housing costs by increasing production costs, restricting housing supply, and increasing housing demand. All three factors will ultimately be reflected in an area’s housing prices.26
He points out that empirical research finds the impact of these kinds of regulations particularly affect housing for lower income people.
Steven Malpezzi and Richard Green (1996) study how the degree of regulatory stringency affects the price of rental housing at various points in the rental-housing quality distribution—low, medium, and high. To the extent that regulations have an impact on the supply of relatively low-quality housing, one might expect larger impacts on low- and moderate-income households. Their results indicate that moving from a relatively unregulated to a heavily regulated metropolitan area increases rents among the lowest-income renters by one-fifth and increases home values for the lowest-quality single-family homes by more than three-fifths. The largest price effects of such regulations occur at the bottom of the distribution in units that are disproportionately occupied by low- and moderate-income households.27
Raphael summarizes the research:
Thus, the existing research on the effects of land-use regulatory stringency on housing prices and supply consistently documents several findings. First, housing is more expensive in regulated markets, which cannot be explained by higher land values. Second, the supply of housing is less responsive to changes in demand in more regulated markets, suggesting that demand pressures result in greater price increases the more stringent the regulatory environment is. Finally, the effect of land- use regulation on prices is greatest on the housing units that are most likely to be occupied by low- and moderate-income households.28
26 Ibid, p.115. 27 See Stephen Malpezzi and Richard K. Green, “What Has Happened to the Bottom of the U.S. Housing Market?” Urban Studies, 1996, 33(1), pp.1807–20. 28 Raphael, “Homelessness and Housing Market Regulation,” p.118.
FILE
D D
ATE:
6/2
1/20
19 6
:51
PM
2016
CH
1548
9
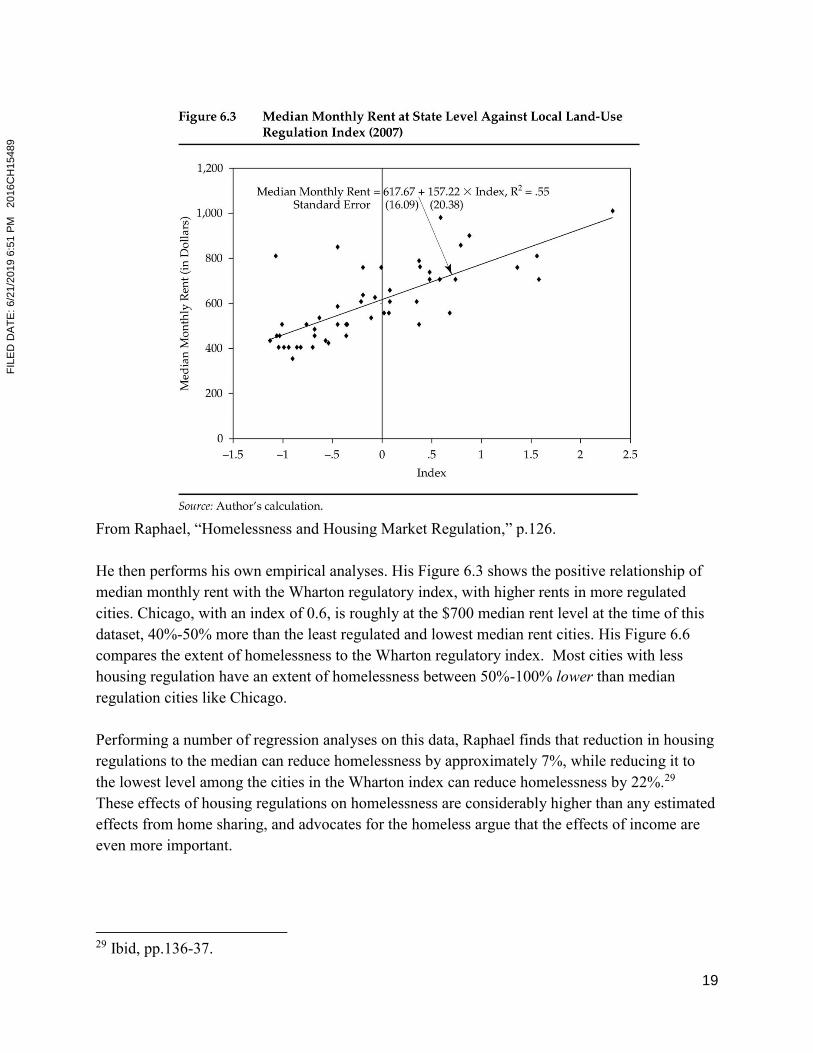
19
From Raphael, “Homelessness and Housing Market Regulation,” p.126. He then performs his own empirical analyses. His Figure 6.3 shows the positive relationship of median monthly rent with the Wharton regulatory index, with higher rents in more regulated cities. Chicago, with an index of 0.6, is roughly at the $700 median rent level at the time of this dataset, 40%-50% more than the least regulated and lowest median rent cities. His Figure 6.6 compares the extent of homelessness to the Wharton regulatory index. Most cities with less housing regulation have an extent of homelessness between 50%-100% lower than median regulation cities like Chicago. Performing a number of regression analyses on this data, Raphael finds that reduction in housing regulations to the median can reduce homelessness by approximately 7%, while reducing it to the lowest level among the cities in the Wharton index can reduce homelessness by 22%.29 These effects of housing regulations on homelessness are considerably higher than any estimated effects from home sharing, and advocates for the homeless argue that the effects of income are even more important. 29 Ibid, pp.136-37.
FILE
D D
ATE:
6/2
1/20
19 6
:51
PM
2016
CH
1548
9

20
From Raphael, “Homelessness and Housing Market Regulation,” p.133. 4.3. Income and Homelessness Indeed, homelessness also has many causes but the chief one is poverty. As the National Coalition for the Homeless puts it:
Homelessness and poverty are inextricably linked. Poor people are frequently unable to pay for housing, food, childcare, health care, and education. Difficult choices must be made when limited resources cover only some of these necessities. Often it is housing, which absorbs a high proportion of income that must be dropped. If you are poor, you are essentially an illness, an accident, or a paycheck away from living on the streets.30
30 National Coalition for the Homeless, https://nationalhomeless.org/about-homelessness
FILE
D D
ATE:
6/2
1/20
19 6
:51
PM
2016
CH
1548
9
21
A seminal work on the relationship between rents and homelessness found appreciable effects in California if rent to income ratios rise. It is not obvious how true this is in less volatile housing markets than California’s and it is clear in their results that level of income is much more important to their finding than level of rents.31 An article published by the Federal Reserve Bank of Minneapolis in 2002 argues extensively that problems of income are much more important in creating homelessness than are problems in housing supply.
After examining the data for the United States and for the Twin Cities, a metropolitan area reputed to have a severe affordable housing shortage, we find that low incomes are the primary reason why the poor live in unaffordable rental units. Even if costs fell significantly—by an amount roughly equal to estimates of the increase in cost due to regulation—the vast majority of the poor living in the United States and the Twin Cities would still live in rental units considered unaffordable. 32
In other words, problems with income are much more important for explaining homelessness than are housing supply and costs, while land use and housing regulations lead to nearly all housing supply and cost issues, leaving home sharing with very little impact on homelessness. Defendants have a vast menu of policy options to help people with low incomes to improve their lot and to deal with shocks such as sickness, temporary job loss, etc. that can cause them to become homeless. 5. Conclusion Analyses of the housing market, and particularly of rental housing markets, do not consider home sharing to be even worth mentioning as a factor influencing the market. Research on the causes of housing shortages and high housing costs attribute 90% to overly restrictive land use and housing regulations. Analyses of the causes of homelessness say that problems of income are much more important than problems of housing supply, and that land use and housing regulations directly increase homelessness to an appreciable degree. Meanwhile, the measured effects of home sharing on housing are real, but small.
31 John M. Quigley, Steven Raphael, and Eugene Smolensky, “Homeless in America, Homeless in California,” The Review of Economics and Statistics, February 2001, 83(1), pp.37–51. 32 Ron J. Feldman, “The Affordable Housing Shortage: Considering the Problem, Causes and Solutions,” The Region, Federal Reserve Bank of Minneapolis, September 2002.
FILE
D D
ATE:
6/2
1/20
19 6
:51
PM
2016
CH
1548
9

22
Housing markets are dynamic, if not as fast moving as other goods markets. Technology, supply, and demand all change over time. Property owners are responding to profit opportunities to get more return on their investment in apartments and other homes by taking advantage of the technology of home sharing. Their property right enables them to take advantage of this opportunity, and such shifts are part of what drives changes in the market. For example, it creates incentives for property owners to improve their properties in order to increase revenue.33 It also creates more incentive to expand housing supply, which is precisely the thing that helps address rising housing costs and homelessness. A short-term effect such as a shift from long-term rentals to home sharing will create a response in the market. If supply and demand are allowed to move, and are not restricted by over regulation of land-use and housing, supply and price differentials will close. It won’t be long before the immediate profit opportunity that home sharing represents relative to long-term rentals is offset by the higher operational costs such as frequent cleanings, etc. compared to the convenience and income stability of long-term renters. Large and long running interventions in the market during a time of transition driven by technological innovation such as home sharing will prevent market dynamics from moving toward beneficial outcomes for all.
33 Christina Sandefur, “Life, Liberty, and the Pursuit of Home-Sharing,” Regulation, Fall 2016, 39(3), pp.12-15.
FILE
D D
ATE:
6/2
1/20
19 6
:51
PM
2016
CH
1548
9

23
I declare under penalty of perjury that the foregoing is true and correct to the best of my knowledge and that this disclosure was executed on February 7, 2019.
Adrian T. Moore, Ph.D.
FILE
D D
ATE:
6/2
1/20
19 6
:51
PM
2016
CH
1548
9

Exhibit M
FILE
D D
ATE:
6/2
1/20
19 6
:51
PM
2016
CH
1548
9
Dr. Adrian T. Moore
February 28, 2019
(312) 704-4525
DCM Court Reporting, Inc.
1
STATE OF ILLINOIS )
) SS:
COUNTY OF C O O K )
IN THE CIRCUIT COURT OF COOK COUNTY, ILLINOIS
CHANCERY DEPARTMENT
LEILA MENDEZ and ALONSO )
ZARAGOZA, )
)
Plaintiffs, )
) No. 16 CH 15489
vs. )
)
CITY OF CHICAGO, a Municipal )
Corporation and ROSA ESCARENO, )
in here official capacity as )
Commissioner of the City of )
Chicago Department of Business )
Affairs and Consumer )
Protection. )
)
Defendants. )
The Discovery Deposition of
DR. ADRIAN T. MOORE, taken before Jeannine Scheff
Miyuskovich, a CSR and Notary Public within and for
the County of McHenry and the State of Illinois,
taken pursuant to the provisions of the Code of Civil
Procedure of Illinois and the Rules of the Supreme
Court thereof pertaining to the taking of depositions
for the purpose of discovery, taken at 30 North
LaSalle Street, Suite 1020, Chicago, Illinois, at
10:15 a.m., on the 28th day of February 2019.
REPORTED BY: JEANNINE SCHEFF MIYUSKOVICH, CSR
FILE
D D
ATE:
6/2
1/20
19 6
:51
PM
2016
CH
1548
9

Dr. Adrian T. Moore
February 28, 2019
(312) 704-4525
DCM Court Reporting, Inc.
2 (Pages 2 to 5)
2
1 A P P E A R A N C E S:2
3 GOLDWATER INSTITUTE BY: MR. JACOB HUEBERT
4 500 East Coronado Road Phoenix, Arizona 85004
5 (602)462-5000 [email protected]
6
-AND-7
LIBERTY JUSTICE CENTER8 BY: MR. JEFFREY SCHWAB
190 South LaSalle Street9 Suite 1500
Chicago, Illinois 6060310 (312) 263-7668
appeared on behalf of the Plaintiffs.12
13
CITY OF CHICAGO14 BY: MR. WESTON W. HANSCOM
MR. RICHARD DANAHER15 30 North LaSalle Street
Suite 102016 Chicago, Illinois 60602
(312) 744-907717 [email protected]
appeared on behalf of the Defendant.19
20
21
22
23
24
3
1 I N D E X2
3 WITNESS: PAGES:4
5 DR. ADRIAN T. MOORE,6
7 EXAMINATIONBY MR. HANSCOM.......................... 4
8
EXAMINATION9 BY MR. HUEBERT.......................... 42
10 FURTHER EXAMINATIONBY MR. HANSCOM.......................... 51
11
12
13 EXHIBITS:14
15 Deposition Exhibit No. 1................ 416 Deposition Exhibit No. 2................ 617 Deposition Exhibit No. 3................ 718 Deposition Exhibit No. 4................ 1719 Deposition Exhibit No. 5................ 1720 Deposition Exhibit No. 6................ 1821 Deposition Exhibit No. 7................ 3322 Deposition Exhibit No. 8................ 3523 Deposition Exhibit No. 9................ 3624 Deposition Exhibit No. 10............... 40
4
1 DR. ADRIAN T. MOORE,
2 having been first duly sworn, was examined and
3 testified as follows:
4 EXAMINATION
5 BY MR. HANSCOM:
6 BY MR. HANSCOM:
7 Q. Could you state your full name for the
8 record, please.
9 A. Adrian Moore.
10 Q. We were introduced, but I'm Wes Hanscom, one
11 of the attorneys for the City of Chicago. And if any
12 of the questions I ask you are unclear to you, please
13 let me know. Okay?
14 A. Okay.
15 Q. So let's just start by marking this as
16 Exhibit No. 1.
17 (Deposition Exhibit No. 1
18 was so marked, and the
19 proceedings continued as
20 follows.)
21 BY MR. HANSCOM:
22 Q. (Document tendered.)
23 Okay, Dr. Moore, I've handed you what
24 we've marked as Exhibit 1, and my first question
5
1 is whether that is a copy of your bio as printed from
2 the Reason Foundation's website?
3 A. That's what it looks like without pulling up
4 the website and confirming, but it looks right.
5 Q. Okay, on the second page at the end, there's
6 a summary of your educational background?
7 A. Yes.
8 Q. It mentions you earned a Ph.D. in economics
9 from the University of California, Irvine, is that
10 correct?
11 A. Yes.
12 Q. When did you earn that?
13 A. 2000.
14 Q. And then it says you hold a masters in
15 economics from the University of California, Irvine,
16 is that correct?
17 A. Yes.
18 Q. And when did you earn that?
19 A. '98.
20 Q. And then you have a masters in history from
21 California State University, Chico, correct?
22 A. Yes.
23 Q. And when did you earn that?
24 A. '87.
FILE
D D
ATE:
6/2
1/20
19 6
:51
PM
2016
CH
1548
9

Dr. Adrian T. Moore
February 28, 2019
(312) 704-4525
DCM Court Reporting, Inc.
3 (Pages 6 to 9)
6
1 Q. And where did you get your undergraduate
2 degree?
3 A. University of California, Riverside.
4 Q. And when was that?
5 A. '84.
6 Q. What was your major there?
7 A. History.
8 MR. HANSCOM: Okay, let's mark this as Exhibit 2,
9 please.
10 (Deposition Exhibit No. 2
11 was so marked, and the
12 proceedings continued as
13 follows.)
14 BY MR. HANSCOM:
15 Q. (Document tendered.)
16 I'm handing you what's been marked as
17 Exhibit No. 2. It's titled About Reason Foundation,
18 and I'll ask if that is a summary concerning About
19 Reason Foundation from the Foundation's website.
20 A. Yes.
21 Q. Where is the Reason Foundation located?
22 A. The headquarters is in Los Angeles,
23 California.
24 Q. And where are you located?
7
1 A. Sarasota, Florida.
2 Q. How many locations does the Foundation have?
3 A. Do you mean offices?
4 Q. Yes.
5 A. Most Reason employees tele-communicate.
6 Q. And how many employees are there?
7 A. I don't know the exact number.
8 Q. Just roughly?
9 A. The vicinity, 90.
10 MR. HANSCOM: Let's mark this as Exhibit 3,
11 please.
12 (Deposition Exhibit No. 3
13 was so marked, and the
14 proceedings continued as
15 follows.)
16 BY MR. HANSCOM:
17 Q. (Document tendered.)
18 I'm handing you what's been marked as
19 Exhibit No. 3. I'll ask if that is the copy of the
20 report you had prepared in this case that we're here
21 for today.
22 A. Yes.
23 Q. Okay. You can keep that there. I will be
24 asking you questions about it.
8
1 How did you come to be involved in this
2 case?
3 A. I was approached by Christina Sanford
4 (phonetic) with the Goldwater Institute who asked
5 me if I had worked on this issue, and then we spoke
6 about the case, and then she introduced me to Jacob.
7 Q. And this issue being what?
8 A. Housing policy and home sharing.
9 Q. When did this conversation happen?
10 A. I don't remember. Last year.
11 Q. Do you remember where it happened?
12 A. Email.
13 Q. Have you worked with the Goldwater --
14 A. Institute?
15 Q. -- Institute before?
16 A. As an expert witness?
17 Q. In any way.
18 A. Yes.
19 Q. And could you describe generally what that
20 is?
21 A. We've collaborated on a lot of public policy,
22 work policy research, events around a wide range of
23 issues over a lot of years, maybe 15 years.
24 Q. Have you worked with the Liberty Justice
9
1 Center before?
2 A. Yes.
3 Q. And could you describe what the nature of
4 that has been?
5 A. To save my life, I can't remember what year
6 it was, but some years ago I was a -- I worked with
7 them on a case having to do with licensing of shuttle
8 services in Bloomington, Illinois.
9 Q. Have you served as an expert witness for the
10 Goldwater Institute or Liberty Justice Center
11 before?
12 A. Not with Goldwater before but that one time
13 with Liberty Justice Center.
14 Q. That was the one with the bus service?
15 A. Yes.
16 Q. Do you remember what the basic issue was that
17 you testified about?
18 A. The city refused to issue a license to
19 an applicant and there were -- there was some
20 economic justifications offered for that refusal, and
21 I was asked to analyze those justifications.
22 Q. Was that a court case?
23 A. Yes, though it wound up -- as I recall, we
24 never went to -- I didn't get deposed in that one.
FILE
D D
ATE:
6/2
1/20
19 6
:51
PM
2016
CH
1548
9
Dr. Adrian T. Moore
February 28, 2019
(312) 704-4525
DCM Court Reporting, Inc.
4 (Pages 10 to 13)
10
1 So it didn't go that far.
2 Q. It somehow got settled?
3 A. Yes.
4 Q. Was that in court in Bloomington, Illinois?
5 A. I don't remember.
6 Q. What was the name, again, of the woman that
7 you said you spoke with from Goldwater about this
8 case?
9 A. Christina Sanford.
10 Q. Do you remember what Ms. Sanford told you
11 about the case at that time?
12 A. Not in any detail. I think -- it was in very
13 general terms, and we didn't really talk about any
14 details until I was speaking with Jacob.
15 Q. What is your understanding of what your
16 assignment was in this matter?
17 A. The City has offered some economic arguments
18 in favor of its policies and provided some literature
19 in support of that, and I was asked to assess the
20 merits of those arguments and that research.
21 Q. What materials have you been provided with?
22 A. I was provided a -- the Complaints, some
23 Interrogatories, if that's the right name for them,
24 the documents provided by the City. I don't know if
11
1 that was discovery or what that was but many hundreds
2 of pages of documents. That's all I've been
3 provided.
4 Q. Were you told whether the documents that you
5 were provided that the City had produced was a full
6 set of the documents the City had produced?
7 A. That was my understanding, yes.
8 Q. And when were you provided with those?
9 A. I can't remember exactly when the first set
10 came. It was in the fall. And then I believe I got
11 a final set in January, if I remember right.
12 Q. Do you remember was that a second production
13 of --
14 A. No. I think it was a little -- some
15 additional documents.
16 Q. Some additional documents the City had
17 produced?
18 A. You know, I'm not sure. I can't quite
19 remember the sequence. I would have to go through
20 my files.
21 Q. Is there anything else, other than what
22 you've mentioned, that you were provided with in
23 terms of documents?
24 A. No.
12
1 Q. What basic activities did you conduct in
2 preparing your report?
3 A. So in economics, there's a pretty standard
4 procedure for tackling an issue, essentially, and
5 we casually call it doing a lit review which is if
6 you're going to write an economic paper on any topic,
7 the first thing you do is you have to understand what
8 everybody has written on it so that you're not just
9 doing something that's already been done.
10 And so that you have a command of what's
11 already known and what isn't known. That usually
12 informs your work to either confirm a known result or
13 development a new result. So I applied that pretty
14 standard approach to conducting the research to
15 insure that I understood what the literature -- the
16 existing literature was on the questions that I
17 essentially set up which are based on the arguments
18 that the City has made.
19 Q. What research did you do?
20 A. As is usual with this approach, if you're
21 working in an area that you've done work, you already
22 have files. So I had a lot of research already
23 available. I reviewed that. I reviewed the
24 citations to identify related work, acquired that,
13
1 reviewed its citations. So you do this iterative
2 process citation driven.
3 That gets you most of the way there, and
4 then you search, you look at who are the prominent
5 people that have worked in this field and who have
6 they worked with and what work have they done, fill
7 some gaps that way.
8 But it's a largely a citation-driven
9 process that gets you -- if you keep cascading
10 through, you eventually find all of the work that's
11 been done that's germane to a particular topic.
12 Q. And how did you do the follow-up searchs?
13 Do you use Google? Do you use some other
14 technique?
15 A. So some Google, though, Google is not as
16 great for scholarly work these days as it used to be.
17 So there are a lot of scholarly journal index systems
18 that academic university libraries use, and so it's a
19 pretty straightforward economic literature indexing
20 system that you can go into.
21 And there's also what's called the Social
22 Science Research Network which is a pretty thorough
23 index of economic research.
24 Q. And which of those tools did you use in this
FILE
D D
ATE:
6/2
1/20
19 6
:51
PM
2016
CH
1548
9
Dr. Adrian T. Moore
February 28, 2019
(312) 704-4525
DCM Court Reporting, Inc.
5 (Pages 14 to 17)
14
1 case?
2 A. All of them.
3 Q. You mentioned having had a file already.
4 What types of subjects were being treated
5 in the materials in those files?
6 A. I had a pretty extensive collection of
7 literature on what influences housing market
8 outcomes, so what are the forces that drive supply
9 and demand prices in housing markets. That's an area
10 I've worked on for about 25 years, so I had a lot.
11 Ultimately, out of all of this stuff I
12 cited, I had about half of it already on hand.
13 Q. Did you have materials on house sharing in
14 your files?
15 A. Yes.
16 Q. Do you recall what those were?
17 A. No.
18 Q. Are they referenced in your report?
19 A. Yes.
20 Q. Are you being compensated for your work in
21 this matter?
22 A. No.
23 Q. Is the Reason Foundation being compensated
24 for it?
15
1 A. No.
2 Q. What is your basic reason for putting in the
3 time for no compensation?
4 A. A combination of a long running interest in
5 the topic and practice of partnering -- I've been an
6 expert witness on quite a few cases over the years,
7 and it's usually been on areas that I work on. So it
8 seems like a natural extension of my research work in
9 this area to apply it.
10 So I see it as part of being an expert in
11 the subject, but it's also the case that it -- this
12 work fits within the mission of my organization, and
13 so I have a lot of discretion over how I can fill
14 that mission and so...
15 Q. And your organization being the Reason
16 Foundation?
17 A. The Reason Foundation, yes.
18 Q. About how many hours have you put into this
19 project?
20 A. I pay attention to that when I'm being
21 compensated. When I'm not, I don't.
22 In preparing this document, I would say I
23 put in about 50, 60 hours.
24 Q. And does that include the time spent doing
16
1 the research?
2 A. Yes.
3 Q. Can you give an approximate breakout of the
4 percentage of that time that was spent doing research
5 as opposed to writing the report?
6 A. 70 percent research, 30 percent writing.
7 Q. Okay.
8 Let's take a look at the report, and
9 I have a few questions in there. So this is
10 Exhibit 3.
11 On the first page, there is a heading
12 number two titled Basis for Opinions to be Expressed;
13 do you see that?
14 A. Yes.
15 Q. And at the bottom, it starts a list of
16 some academic literature that you reviewed,
17 correct?
18 A. Yes.
19 Q. The first one listed says Dayne, D-A-Y-N-E,
20 Lee, How Airbnb Short-Term Rentals Exacerbate
21 Los Angeles' Affordable Housing Crisis, Analysis and
22 Policy Recommendations, close quote, and it's Harvard
23 Law and Policy Review; do you see that?
24 A. Yes.
17
1 MR. HANSCOM: Let's mark this as Exhibit 4,
2 please.
3 (Deposition Exhibit No. 4
4 was so marked, and the
5 proceedings continued as
6 follows.)
7 BY MR. HANSCOM:
8 Q. (Document tendered.)
9 My question is whether that is the item
10 that I just mentioned?
11 A. Yes.
12 Q. Over at the top of the second page, the first
13 item listed is Stephen Sheppard and Andrew Udell,
14 U-D-E-L-L, Do Airbnb Properties Affect Housing --
15 excuse me -- House Prices, Williams College; do you
16 see that?
17 A. Yes.
18 MR. HANSCOM: Let's mark that as 5, please.
19 (Deposition Exhibit No. 5
20 was so marked, and the
21 proceedings continued as
22 follows.)
23 BY MR. HANSCOM:
24 Q. (Document tendered.)
FILE
D D
ATE:
6/2
1/20
19 6
:51
PM
2016
CH
1548
9

Dr. Adrian T. Moore
February 28, 2019
(312) 704-4525
DCM Court Reporting, Inc.
6 (Pages 18 to 21)
18
1 I hand you what's been marked as
2 Exhibit 5. Does that appear to be a copy of that
3 study?
4 A. Yes.
5 Q. And then the next one listed is Kyle Barront,
6 B-A-R-R-O-N-T, and other people, The Sharing Economy
7 and Housing Affordability Available at Social Science
8 Research Network; do you see that?
9 A. Yes.
10 (Deposition Exhibit No. 6
11 was so marked, and the
12 proceedings continued as
13 follows.)
14 BY MR. HANSCOM:
15 Q. (Document tendered.)
16 Handing you what's been marked as
17 Exhibit 6, I'll ask you if that is a copy of that
18 item?
19 A. Yes.
20 Q. Back in your report, which is Exhibit 3, if
21 we could flip to page seven, please?
22 A. Yes.
23 Q. In your summary, the paragraph with the
24 smaller letter a, you mention that studies relying on
19
1 New York City data may not be representative; do you
2 see that?
3 A. Yes.
4 Q. What is your basis for saying that?
5 A. There's a common saying among economists that
6 New York City is always an outlier, and what that
7 means is that when you plot data on virtually
8 anything, of cities in the United States, New York
9 is almost never on the fitted line of the rest of
10 the cities.
11 So it has unique -- it consistently has
12 unique empirical results from the rest of the country
13 so much so that you're expected as an economist to
14 look for that, you're expected to account for that,
15 and you expect to see that when you review someone's
16 work.
17 We don't exclude it. We just recognize
18 that it tends to be outside of the norm of results
19 for other cities in America.
20 Q. Have you had personal experience with that in
21 your own studies?
22 A. Yes.
23 Q. Can you give details?
24 A. Whoo, boy, the most recent thing I would
20
1 say was some work I did eight or nine years on
2 electricity prices and factors that affect them,
3 and we looked at a number of cities in the northeast
4 compared to a number of cities in the southwest,
5 and New York was not like the other cities in the
6 northeast. It was -- it didn't substantially affect
7 our results, but it was my most recent example of
8 seeing New York as an outlier.
9 Q. And how was it different?
10 A. When you look at -- if you make graphs of
11 say, in this case, electricity prices per capita over
12 time or wholesale versus retail electricity cost
13 changes year-by-year or month-by-month -- and I think
14 we were looking at month-by-month back then -- you
15 know, imagine that you create a graph that shows that
16 for all of the cities, and the standard economic
17 procedure is you then do a statistical measurement
18 that attempts to find the trend.
19 So the trend line is a pretty common
20 representation of what a lot of our statistical
21 models do. That rule of thumb for New York is it
22 will almost never be close to that line. It will
23 usually stand out from the scatter of dots that
24 you're connecting with that line.
21
1 And so in this case, you would see -- we
2 would see New York out of the pack of results, and
3 that's sort of a layman's representation of what
4 outlier means.
5 An outlier means that the results from
6 this particular observation are further from
7 the norm than most -- than the common variance. So
8 you have a lot of -- some are a little above. Some
9 are a little below the line. And then you've got one
10 or two that are just way out. And New York is almost
11 always one of the ones that's way out.
12 Q. Was that particular case the subject of
13 one of your publications that's listed in your
14 report?
15 A. I believe so.
16 Q. Could you see if you could identify which one
17 that was?
18 A. Oh, boy, oh, boy, oh, boy.
19 If I remember right -- it is not in this
20 list. It was a journal article, and I don't think
21 I included all of my journal articles in this
22 list.
23 Q. Do you remember in that matter having an
24 opinion as to what it was about New York that made it
FILE
D D
ATE:
6/2
1/20
19 6
:51
PM
2016
CH
1548
9

Dr. Adrian T. Moore
February 28, 2019
(312) 704-4525
DCM Court Reporting, Inc.
7 (Pages 22 to 25)
22
1 unrepresentative?
2 A. No, I don't think we did. Understanding that
3 was not germane to our research question.
4 Q. Do you know of any academic literature that
5 states the point that you're making about New York
6 being an outlier?
7 A. I have not delved into that so, no, I don't
8 know of -- so let me clarify.
9 Are you asking are there papers that
10 specifically attempt to explain why New York is
11 always an outlier?
12 Q. Or that even just says --
13 A. Points that out.
14 Q. -- something -- correct.
15 A. I can't name one right now.
16 Q. In this case, can you explain what about
17 New York would be different from Chicago to make
18 you think that data from New York would not be
19 representative here?
20 A. The -- New York's density alone, Manhattan
21 in particular, is -- orders of magnitude higher than
22 any other City in America, including Chicago.
23 There's -- Chicago is far more comparable to Phoenix
24 than New York is to Chicago on just that scale. So
23
1 that's a big part of it.
2 The amount of available developable space
3 is extremely limited New York in a way that it isn't
4 in other major US cities. So those are probably the
5 two most important kind of physical factors. I
6 definitely heard among economists that there's a
7 demographic driver, too. New York has its -- kind
8 of its own demographic in some ways that I would
9 think in this particular case would probably be a
10 factor.
11 But in the existing literature, there's no
12 -- there's nothing that attempts to address this.
13 I'm talking about the literature discussed in my
14 report. So, you know, we don't really know.
15 Q. How would the factor you mentioned
16 such as density affect the issue of the impact
17 of house sharing on availability of affordable
18 housing?
19 A. The ability of -- for adjustments to happen
20 in the market, and I'm using that in the broadest
21 sense, supply, demand, adjustments, adding to supply
22 changes and takes all of those things -- are
23 influenced by the flexibility of the market.
24 The slower it moves, that gets
24
1 incorporated into behavioral responses, and so a
2 denser less flexible market like New York is going
3 to have a different shape to the elasticity curves
4 and reactions that you see in the market compared
5 to cities that are not so constrained.
6 Q. Is Chicago a more flexible market for
7 housing?
8 A. Than New York?
9 Q. Than New York.
10 A. I think so.
11 Q. And do you why do you think so?
12 A. Two main reasons.
13 One is there is -- I do cite in my
14 statement the Wharton Index which scores Chicago
15 as more flexible than New York City, but also just
16 having worked on housing markets, the -- one of the
17 things that makes New York unique is that the suburbs
18 are so dense. You know, think of Brooklyn and Queens
19 compared to -- if you go 10 miles from Manhattan,
20 you're going to see a very different environment than
21 if you go 10 miles from where we're sitting in a
22 direction other than the lake.
23 So that profile, that density profile, has
24 a big influence on where development can occur, where
25
1 people move in anticipation of changes in the market,
2 where jobs locate in anticipation of access to
3 workers, all of these things.
4 Chicago has a lot more opportunity for
5 things to shift in appreciable ways than the much
6 denser and almost over-developed New York profile
7 does.
8 Q. And when you talk about flexibility, are you
9 talking about ability to build more housing units
10 over time?
11 A. That's a subset. I'm talking about
12 flexibility as a word to capture -- you can have
13 significant changes in supply and demand for
14 housing in a given zone either because of a lot of
15 construction, a lot of re-development shifting from
16 residential to commercial or vice versa or people
17 moving in and out.
18 All of those things can happen more
19 readily if you pick a random Chicago suburban
20 neighborhood than if you pick a random New York
21 suburban neighborhood.
22 Q. So if a study says that in New York house
23 sharing is having an effect of raising rental prices,
24 your view would be that might support the idea that
FILE
D D
ATE:
6/2
1/20
19 6
:51
PM
2016
CH
1548
9
Dr. Adrian T. Moore
February 28, 2019
(312) 704-4525
DCM Court Reporting, Inc.
8 (Pages 26 to 29)
26
1 that could happen in Chicago as well but not as much?
2 Would that be a fair way to put it?
3 A. No. I would say so in economics, basically
4 when you have a hypothesis, you know, that's a
5 lunch-time discussion; you know, I can make a logical
6 argument this might be so, and you can kick that
7 around.
8 When you find a data set and you test that
9 hypothesis, so say you go into New York, and you use
10 New York data and you find, ah, I have found evidence
11 in support of this hypothesis, then it becomes a
12 research question.
13 So on this question, we are at that stage
14 where the finding of a result by a paper or two using
15 New York data only indicates that there's something
16 to be researched here. But, no, I should say if you
17 had done this in San Francisco or Atlanta, it would
18 be treated the same. Results from a city mean that
19 there's something worth investigating.
20 It is not remotely a conclusion. So
21 I don't think any economist would say based on a
22 result from New York, we can draw policy conclusions.
23 Q. And you'd say the same thing about a study of
24 any other city?
27
1 A. Yes. It really -- yes.
2 Q. Okay. Let's go back to your work and
3 still on page seven. Number two is titled City
4 of Chicago's Argument; do you see that?
5 A. Yes.
6 Q. And the second paragraph of that says
7 Defendants have provided Plaintiffs with several
8 reports; do you see that?
9 A. Yes.
10 Q. And then you have a list of some bullet
11 points. The first bullet point at the bottom of page
12 seven is a 2016 study concerning Los Angeles.
13 Now is that the Exhibit 4 that we already
14 marked?
15 A. Yes.
16 Q. And then if we can flip over to the top of
17 page eight, the next bullet point mentioned a 2018
18 report by the New York City Comptroller; do you see
19 that?
20 A. Yes.
21 Q. Are you sure that that is a report that the
22 Defendants provided to the Plaintiffs?
23 A. Yes.
24 Q. And do you recall whether that had these
28
1 numbers on them, and they are called Bate numbers,
2 like Exhibit 4 has?
3 A. It does have those on it.
4 Q. Do you recall what they are, or do you have
5 them?
6 A. I could pull it up. It might take me a
7 while to find it because the large PDF files I
8 received were unindexed.
9 MR. HANSCOM: Let's go off the record for a
10 second, please.
11 (WHEREUPON a discussion was
12 held off the record, and
13 the proceedings continued
14 as follows.)
15 MR. HANSCOM: While we were off the record, I
16 mentioned that we did not see that in our copy of
17 what we produced, but I think counsel and the witness
18 are going to check, and we'll see if we can pin that
19 down later.
20 BY MR. HANSCOM:
21 Q. The next bullet point mentions a Williams
22 College working paper, and that is what we marked as
23 Exhibit 5, correct?
24 A. Yes.
29
1 Q. And then the one after that is a 2018 Social
2 Science Research Network Working Paper, and I believe
3 that's the one we marked as Exhibit 6?
4 A. Yes.
5 Q. Did you find any other studies than the ones
6 you have listed in your report that deal with the
7 subject of what impact house sharing has on the
8 availability of affordable housing?
9 A. Do you mean that address that as their
10 central question?
11 Q. Well, let's just even say that -- got into
12 that issue at all.
13 A. No. One of the arguments that I make in my
14 statement is that when I looked at research that
15 tried to explain the problem of lack of housing in
16 urban areas, other than these ones we just discussed,
17 none of them mentioned home sharing, and I find that
18 to be an indication that it is not considered an
19 important contributor.
20 Q. Did you find any studies not mentioned in
21 your report that purported to look at the question
22 of whether house sharing affects availability of
23 affordable housing?
24 A. No. I think I stated -- I state in my
FILE
D D
ATE:
6/2
1/20
19 6
:51
PM
2016
CH
1548
9

Dr. Adrian T. Moore
February 28, 2019
(312) 704-4525
DCM Court Reporting, Inc.
9 (Pages 30 to 33)
30
1 report that these reports constitute the body of
2 evidence linking home sharing and homelessness and,
3 indeed, cited by others in the City of Chicago.
4 As far as I can find, no one has done any
5 other empirical work on this cite. I find no
6 citations anywhere in any other work.
7 Q. It's not like you found a study and decided
8 not to include it in your report?
9 A. No.
10 Q. Flipping to page nine of your report, at the
11 bottom just above the footnotes, you mention that
12 the type of business and vacation travelers who use
13 Airbnb are not looking for apartments at the bottom
14 of the market, correct?
15 A. Yes.
16 Q. Did you do any studies of where Airbnb
17 listings are in Chicago?
18 A. No.
19 Q. Do you know if there would be a way to do
20 that?
21 A. If Airbnb would give you the data, you could.
22 Q. Well, a person could go to the Airbnb website
23 and plug in zip codes, for example, correct?
24 A. Right.
31
1 If you wanted to see the listings?
2 Q. Right.
3 A. Yes, you could do that. That would give you
4 the listings at that point in time that were
5 available.
6 Q. Have you ever lived in Chicago?
7 A. No.
8 Q. Have you visited here before?
9 A. A lot.
10 Q. Have you had any long stays in Chicago?
11 A. No.
12 Q. Are you familiar with which neighborhoods
13 in Chicago you would expect to have the most Airbnb
14 listings?
15 A. Yes.
16 Q. Which ones?
17 A. Well, I'm just a -- the most meaning where
18 you would have a denser accumulation of listings
19 would be, you know, downtown. I would expect the --
20 you know, north side and out near O'Hare, Rosemont --
21 yeah, Rosemont area would probably be my just
22 impressionistic choices.
23 But when I was looking for my statement, I
24 did not find -- I didn't find anybody who had put
32
1 that together because that was a question I had as
2 well was has someone basically explained the
3 distribution of home sharing in Chicago. I couldn't
4 find any of that analysis, so it would have to be
5 done.
6 Q. Have you ever acted as a house-sharing host?
7 A. No.
8 Q. Have you been a house-sharing quest?
9 A. Yes.
10 Q. How often have you done that?
11 A. On average, at least once a month. I travel
12 for business a lot.
13 Q. Do you sometimes stay at hotels rather than a
14 house sharing?
15 A. Yes.
16 Q. How do you decide which one to pick?
17 MR. HUEBERT: Objection. This pertains to his
18 personal experience and not his expert testimony.
19 You can answer.
20 THE WITNESS: My first rule is if it's only one
21 night, I stay in a hotel because I don't get any
22 benefit from the kitchen primarily. If it's more
23 than one night, I consider Airbnb. Location -- I
24 should say not just Airbnb but other home-sharing
33
1 services. Then I look at location, and then I look
2 at price, and then I look at amenities. I like
3 certain things.
4 MR. HANSCOM: Let's mark this as Exhibit 7,
5 please.
6 (Deposition Exhibit No. 7
7 was so marked, and the
8 proceedings continued as
9 follows.)
10 BY MR. HANSCOM:
11 Q. (Document tendered.)
12 Handing you what's been marked as
13 Exhibit No. 7, it has the title From Air Mattresses
14 to Unregulated Business, an Analysis of the Other
15 Side of Airbnb. At the top, it's got the date
16 of 2016, and this has Bate numbers D15 through D55.
17 Do you recall seeing this before?
18 A. Yes.
19 Q. And in what -- how was it that you came to
20 see this?
21 A. It was included in the -- as I recall, it was
22 included in the documents the City provided.
23 Q. This is not cited in your report, correct?
24 A. Right.
FILE
D D
ATE:
6/2
1/20
19 6
:51
PM
2016
CH
1548
9

Dr. Adrian T. Moore
February 28, 2019
(312) 704-4525
DCM Court Reporting, Inc.
10 (Pages 34 to 37)
34
1 Q. Why did you not cite this in your report?
2 A. Because it -- I did not think it had
3 information germane to the questions I was
4 addressing. It's got useful information in it but
5 nothing on supply and demand effects. Just on growth
6 of home sharing.
7 Q. Well, this does have some data in it from
8 Chicago that relates to the issue we were talking
9 about, correct?
10 A. Which issue?
11 Q. Neighborhoods where the house sharing is most
12 common.
13 A. Oh, it does, yes, yes.
14 Q. If you go to the page with D33 as the number,
15 that has some statistics for Chicago, correct?
16 A. Yes. So some -- right. So these are the
17 neighborhoods with the most properties listed, but it
18 doesn't give me the other neighborhoods. So I don't
19 know quite what -- you know, is it most as in just
20 one more, or is it most as in three times as many. I
21 don't know.
22 Is the sixth at 290, or is the sixth at
23 100? It doesn't tell me that. So I don't know that.
24 Yeah, I didn't find anything in there that I thought
35
1 was useful for my statement.
2 MR. HANSCOM: Let's mark this as Exhibit 8.
3 (Deposition Exhibit No. 8
4 was so marked, and the
5 proceedings continued as
6 follows.)
7 BY MR. HANSCOM:
8 Q. (Document tendered.)
9 Handing you what's been marked as
10 Exhibit 8, this has the title Hosts with Multiple
11 Units, a Key Driver of Airbnb Growth. It's dated
12 March 2017, and it has Bate numbers D56 through D79;
13 do you see that?
14 A. Yes.
15 Q. Do you recall seeing that as well in the
16 documents that were produced?
17 A. Yes.
18 Q. It says it's from CBRE; do you see that?
19 A. Yes.
20 Q. Do you know who that is?
21 A. That is a very large real estate corporation.
22 Something, something, something Richard Ellis. I
23 can't remember what the CB stands for.
24 Q. This was not cited in your report either,
36
1 correct?
2 A. That's correct.
3 Q. Why did you not cite this?
4 A. It addresses the trend in how many -- the
5 trend in home-sharing owners who have multiple units
6 versus only have one unit, and that did not seem
7 germane to the topic I was addressing.
8 Q. If you turn to the page marked D68, they have
9 Chicago data listed there, too, correct --
10 A. Yes.
11 Q. -- on the topic you mentioned?
12 A. Which topic?
13 Q. The topic about basically the portion of the
14 house sharing that's multi-unit versus --
15 A. Right. Yes.
16 Q. -- single?
17 MR. HANSCOM: This is 9.
18 (Deposition Exhibit No. 9
19 was so marked, and the
20 proceedings continued as
21 follows.)
22 BY MR. HANSCOM:
23 Q. (Document tendered.)
24 Handing you what's been marked as Exhibit
37
1 9, it's titled Is Home Sharing Driving Up Rents?
2 Evidence from Airbnb in Boston. It says Working
3 Paper. It's Department of Economics, University
4 of Massachusetts and Bate numbers D391 through 426;
5 do you see that?
6 A. Yes.
7 Q. And did you review this as well with the
8 papers produced by the City?
9 A. I don't remember this one.
10 Q. It is not cited in your report, is that
11 correct?
12 A. It isn't, yes.
13 Q. Do you know why you did not cite this in your
14 report?
15 A. I don't remember seeing it so...
16 Q. Back to your report, at the bottom of
17 page 10, in the last lines, you state that in your
18 opinion, land use and growth restrictions, zoning and
19 housing regulations explain roughly 90 percent of the
20 home price differentials between markets with similar
21 amenities, correct?
22 A. Yes.
23 Q. What would you put in the other 10 percent?
24 A. The biggest part of other 10 percent would
FILE
D D
ATE:
6/2
1/20
19 6
:51
PM
2016
CH
1548
9
Dr. Adrian T. Moore
February 28, 2019
(312) 704-4525
DCM Court Reporting, Inc.
11 (Pages 38 to 41)
38
1 be construction cost changes. It's pretty standard
2 in the literature to differentiate between
3 construction cost changes and other factors.
4 So this -- the 90 percent is net
5 of construction cost changes. So that would
6 be most of it. Probably most of the rest would
7 be economic growth. Growing areas have very
8 different housing markets from shrinking areas or
9 steady state.
10 Q. And when you use the phrase markets there,
11 I take it you're referring to different geographical
12 areas, different cities and so on?
13 A. Yes.
14 MR. HANSCOM: I would like to take about a
15 five-minute break.
16 (WHEREUPON a short recess
17 was taken, and the
18 proceedings continued as
19 follows.)
20 MR. HANSCOM: We only have a few more minutes
21 here.
22 THE WITNESS: Okay.
23 BY MR. HANSCOM:
24 Q. So if you could look back at what was
39
1 Exhibit 4.
2 A. Okay.
3 Q. So that study had to do with Los Angeles,
4 correct?
5 A. Yes.
6 Q. And then Exhibit 5, that was a New York City
7 study, correct?
8 A. Yes.
9 Q. And Exhibit 6 I think did not focus on any
10 one city, am I correct?
11 A. No, it did not. It's a national data set.
12 Q. And Exhibit 9 I know you said you didn't
13 recall, but it is titled Evidence From Airbnb in
14 Boston, correct?
15 A. Yes.
16 Q. And you're not aware of any studies that have
17 focused on Chicago, correct?
18 A. Correct.
19 Q. And, obviously, you did not do your own
20 full-blown study for Chicago?
21 A. Correct.
22 MR. HANSCOM: We could mark this as Exhibit 10,
23 please.
24
40
1 (Deposition Exhibit No. 10
2 was so marked, and the
3 proceedings continued as
4 follows.)
5 BY MR. HANSCOM:
6 Q. (Document tendered.)
7 This is a printout from a website. It was
8 produced as D1 through 5, and the title at the top is
9 Host Compliance.
10 Do you remember seeing this in the papers
11 you reviewed?
12 A. Yes.
13 Q. Are you familiar with this Host Compliance?
14 A. Yes.
15 Q. Who are they?
16 A. I don't really know who they are. I just
17 have encountered their website and documents
18 before.
19 Q. This particular article is titled Are
20 Short-Term Vacation Rentals Contributing to the
21 Housing Crisis; do you see that?
22 A. Yes.
23 Q. At the top of the second page, it says, "The
24 rise and growth of short-term rental platforms such
41
1 as Airbnb, Home Away and Flip Key has created plenty
2 of debate amongst local governments, the hotel
3 industry, the real estate lobby, housing activists
4 and local residents about the impact of such rentals
5 on the availability of affordability of long-term
6 rental housing." Do you see that?
7 A. Yes.
8 Q. Would you agree with that statement?
9 A. I don't know. I don't feel like I have a
10 good sense of how many places are having this debate.
11 I'm aware of it in three cities, and I live in a
12 vacation -- a short-term rental dense state where it
13 is not part of the discussion.
14 Q. It is not part of the discussion in Florida?
15 A. In Florida, it's -- there is lots of issues
16 about home sharing, but it's not the long-term rental
17 question.
18 Q. And what are the three cities you're
19 mentioning?
20 A. Miami, Washington and New York -- Chicago,
21 Washington and New York.
22 Q. What about Boston? One of these studies was
23 in Boston.
24 A. Yeah, I haven't heard anything about how much
FILE
D D
ATE:
6/2
1/20
19 6
:51
PM
2016
CH
1548
9
Dr. Adrian T. Moore
February 28, 2019
(312) 704-4525
DCM Court Reporting, Inc.
12 (Pages 42 to 45)
42
1 of an issue this is in Boston.
2 Q. And another study was in Los Angeles?
3 A. That wasn't a study.
4 That was a law review article that made
5 arguments about Los Angeles but didn't actually do
6 empirical work.
7 Q. And other than those cities, you're not aware
8 of this being an issue elsewhere?
9 A. No, not that I can think of.
10 MR. HANSCOM: Okay.
11 I think that's all we've got. Thank you.
12 THE WITNESS: Thank you.
13 MR. HUEBERT: I'll have a few questions.
14 MR. HANSCOM: Okay.
15 EXAMINATION
16 BY MR. HUEBERT:
17 BY MR. HUEBERT:
18 Q. We discussed -- on your page eight of
19 your report, which was Exhibit 3, we discussed
20 a 2018 report by the New York City Comptroller or
21 rather you testified regarding that.
22 Do you recall now how that came to your
23 attention?
24 A. Yes.
43
1 The City -- the documents provided by
2 the City may not have included the actual report.
3 Without going through them, I can't be sure. But
4 they -- it did include articles that referenced
5 the report, and that's how it came to my attention.
6 Q. You discussed earlier how -- first of all,
7 you discussed people not looking for short-term
8 rentals at the bottom of the housing market.
9 Can you explain your basis for that
10 conclusion?
11 A. I looked at some reports that are -- my
12 footnote number eight discusses this, looking at the
13 income level and types of travel that home-sharing
14 users -- so the demographics of home-share users and
15 the types of travel that dominate home sharing. And
16 it's relatively high income, on average over 75,000
17 a year and, overwhelmingly, leisure travel.
18 And so I reason from that that vacationers
19 who make upper-middle-class incomes are not looking
20 to stay in remote shabby, you know, poor apartments.
21 They are looking to stay close to tourist locations
22 and vacation homes.
23 Q. It was suggested earlier that you might
24 be able to go onto the Airbnb website to see
44
1 where properties are listed in the City of
2 Chicago.
3 A. Right.
4 Q. Would seeing where properties are listed
5 on Airbnb necessarily tell you where and how
6 frequently properties are actually rented
7 short-term?
8 A. No.
9 You lack data on frequency, you know,
10 percent occupancy. You know, more popular places
11 would be occupied much of the year. Other places
12 would be -- could be occupied very occasionally.
13 And in order to answer that question
14 about distribution of use, you would have to know
15 all of that. You would have to know also about
16 properties going in and off because there's a lot of
17 turnover in home-sharing properties so where they're
18 springing up and where they're retracting because
19 they're not worth the cost.
20 Q. In Exhibit 8, which was the CBRE report,
21 you stated that you didn't think the details on
22 rentals of multi-unit -- short-term rentals in
23 multi-unit buildings versus single-family homes were
24 germane to your analysis.
45
1 Can you explain why you don't consider
2 that to be germane to the question you're analyzing?
3 A. If there's -- so who owns the properties has
4 not been posited to influence the effects on the
5 supply of, you know, long-term rental properties
6 nor can I think of any logical connection between the
7 two.
8 So if all of the Airb -- all of the
9 vacation rentals in Chicago were owned by one person,
10 that does not tell you anything about how many there
11 are or how they affect the housing market. It only
12 tells you who owns them.
13 Q. Turning to Exhibit 9, do you recall seeing
14 this document before this deposition?
15 A. No.
16 Q. Have you had an opportunity to briefly look
17 at what this document is --
18 A. Yes.
19 Q. -- since we began this deposition?
20 A. Yes.
21 Q. And did you see any conclusions that this
22 study reaches?
23 A. Yes.
24 Q. And what did you see?
FILE
D D
ATE:
6/2
1/20
19 6
:51
PM
2016
CH
1548
9
Dr. Adrian T. Moore
February 28, 2019
(312) 704-4525
DCM Court Reporting, Inc.
13 (Pages 46 to 49)
46
1 A. They conclude that for census tracks in
2 the highest decile of Airbnb listings relative to
3 total housing units, this increase in asking rents
4 ranges from 1.3 to 3.1 percent.
5 Q. Do you think that that -- understanding
6 that you have not reviewed this study in detail,
7 do you think that there is any reason why that
8 conclusion could lead one to conclude that
9 short-term rentals generally or in Chicago in
10 particular would tend to increase rents or
11 increase homelessness?
12 A. No.
13 Assuming their methodology is sound and
14 there are no confounding factors that were
15 unaccounted for which I haven't had a chance to
16 review for that, what the results indicate is that
17 a -- relatively more Airbnb is associated with a very
18 small increase in rents on average as a statistical
19 average using their methodology.
20 What that means, if say average rents are
21 $750, which would be really low for a major urban
22 area, a 1 to 3 percent rent increase would be $15
23 a month or something like that on 750 per percent.
24 So between 15 and $20 a month.
47
1 Nobody raises their rent by 15 or $20
2 a month. What that means is it's a statistical
3 average, so what they're saying is that one out of
4 every hundred or one out of fifty landlords is
5 raising their rents by a hundred dollars.
6 So this isn't a widespread shock. This is
7 a tiny effect of the margin affecting, in reality, in
8 the housing market only a small percentage of units.
9 So to draw conclusions from that on overall
10 availability and the effect on people's housing
11 situations would be a stretch way beyond what the
12 data actually shows.
13 Q. And you said the conclusion -- in describing
14 the conclusion, I think the word decile was in there.
15 Can you --
16 A. Yes.
17 Q. -- explain what that means?
18 A. So let me find that page that we were on.
19 There we are.
20 For the census tracks in the highest
21 decile of Airbnb listings. So what they did is they
22 divided census tracks in the Boston area by how dense
23 the Airbnb listings were, and they then looked at the
24 top 10 percent.
48
1 So the 10 percent of census tracks in
2 Boston that has the most Airbnb listings is what
3 they base that result on, not average across the city
4 or typical but the most extreme -- the most extreme
5 effect they could find was 1 to 3 percent using the
6 most extreme situation.
7 Q. In all of the -- in the items you reviewed
8 that are listed on the bottom of page seven and the
9 top of page eight of your report, across those
10 reports, did you see any consistent deficiencies
11 in their analysis, anything that these studies
12 were consistently ignoring that you would think
13 would be important to make a determination about the
14 issues they seek to analyze or the issue in this
15 case?
16 A. Yeah.
17 So the first thing that struck me is that
18 you have a small sample. So we have hard empirical
19 results primarily from New York, so only one city
20 which may be an outlier. When we have one paper that
21 uses a national data set and is not subject to that
22 problem and they find a magnitude of result, that's
23 one-tenth of the magnitude of the small sample
24 studies that only look at New York. And I would say
49
1 that if I added the Boston analysis in, it would be
2 one-twentieth of the effect -- I'm sorry, one-fifth
3 of the effect.
4 So the more comprehensive the data in
5 this -- the space is, at least from the information
6 we had so far, the smaller the effect is. The other
7 thing is that all of this literature is looking at
8 second- or third-order influencers on the fundamental
9 question. None of this is data on homelessness.
10 This is comparing the effects of home
11 sharing on rents and then concluding that if -- then
12 reasoning from that that an effect on rents must
13 affect total supply, and effect on total supply must
14 affect the number of people who have housing versus
15 don't, the don'ts being the homeless and, therefore,
16 we have a problem.
17 So in each of the steps of that causal
18 chain, there are many other influences, orders of
19 magnitude stronger.
20 The reason I spend a lot of time arguing
21 about -- in my statement about the effects
22 of land use and housing regulations is because,
23 overwhelmingly, the literature says that 90 -- that
24 explains 90 percent of the differences. Construction
FILE
D D
ATE:
6/2
1/20
19 6
:51
PM
2016
CH
1548
9
Dr. Adrian T. Moore
February 28, 2019
(312) 704-4525
DCM Court Reporting, Inc.
14 (Pages 50 to 53)
50
1 costs explains a big chunk of the rest, economic
2 fortunes, a bunch of the rest.
3 So you're really addressing a very, very
4 tiny set of the influences on this question. That is
5 a -- and it's tiny and it's third order attenuated by
6 many other factors.
7 So if I -- if you wanted to solve the
8 problem of homelessness, you could gamble that this
9 small initial literature indicates a policy change
10 that might have a very, very small third-order effect
11 on the problem you're trying to address, or you could
12 make policy changes that we have a robust literature,
13 says has a 90 percent probability of substantially
14 effecting the problem you're trying to address in the
15 form of homelessness.
16 Q. And the first bullet point on the bottom
17 of page seven, this is the report concerning
18 Los Angeles.
19 A. Yes.
20 Q. Did this report engage in what you would call
21 a thorough economic analysis?
22 A. No.
23 It opens by looking at some comparative
24 statics in the growth and home sharing and the change
51
1 in rent levels in Los Angeles and then reasons from
2 that argument about the relative effects. It does
3 not perform any statistical analysis to link the two
4 differently.
5 And, in fact, specifically states in the
6 paper that it's an argument from correlation that
7 he's making.
8 Q. So the analysis it does is not up to your
9 professional standards as an economist?
10 A. It's not an economic analysis. It's a legal
11 analysis.
12 MR. HUEBERT: That's all.
13 MR. HANSCOM: I've got a little follow up.
14 FURTHER EXAMINATION
15 BY MR. HANSCOM:
16 BY MR. HANSCOM:
17 Q. If you were a landlord and you had a tenant
18 who was living in your unit, I assume you would not
19 list it for rental as a house share while the tenant
20 was there, correct?
21 MR. HUEBERT: Objection. Irrelevant. Calls for
22 speculation.
23 You can answer.
24 THE WITNESS: I don't think it would be legal to
52
1 do so.
2 BY MR. HANSCOM:
3 Q. Well --
4 A. Like if I had a tenant, I can't give
5 somebody else the keys for that apartment and
6 let him go in there. They have -- the tenant has
7 rights to privacy in the space they're renting and
8 not have strangers come wondering in to sleep on
9 their bed.
10 Q. Exactly.
11 So you can't really have one unit
12 available for both, advertising for house share and
13 at the same time have a tenant in there?
14 MR. HUEBERT: Objection. Calls for a legal
15 conclusion.
16 You can answer.
17 THE WITNESS: I would say you can't advertise on
18 home sharing and have a long -- a tenant with a
19 long-term lease.
20 BY MR. HANSCOM:
21 Q. The Boston study that's Exhibit 9 that you --
22 A. Yes.
23 Q. -- were looking at again, if you can turn to
24 the end of it, page 21 under the Conclusions, this is
53
1 D412.
2 At the bottom, it said, "In a city where
3 the demand for rental housing is outpacing supply and
4 pushing up rents quickly, home sharing is
5 contributing to this dynamic," correct?
6 A. That's what it says, yes.
7 Q. Do you know the phrase single-room occupancy
8 hotel?
9 A. Yes.
10 Q. And those are sometimes called SROs?
11 A. Yes.
12 Q. Do you know if there are SROs in Chicago?
13 A. I do not. I looked at that issue a little
14 bit in my work. I found some general work. Nothing
15 Chicago-specific.
16 Q. If a developer bought one of those and turned
17 it to house share, that would be an example of the
18 multi-unit house sharing that is referenced in one of
19 the reports, correct?
20 A. In other words, if someone owned a building
21 that had multiple units all offered on house sharing,
22 yes, I think that would.
23 Q. And do you know whether under the Chicago
24 hotel tax ordinance there is the tax applying to
FILE
D D
ATE:
6/2
1/20
19 6
:51
PM
2016
CH
1548
9

Dr. Adrian T. Moore
February 28, 2019
(312) 704-4525
DCM Court Reporting, Inc.
15 (Pages 54 to 57)
54
1 people who live in SROs?
2 MR. HUEBERT: Objection. Calls for a legal
3 conclusion.
4 You can answer.
5 THE WITNESS: I don't know.
6 So you mean pre-existing SROs that are not
7 offered for -- on home sharing?
8 BY MR. HANSCOM:
9 Q. Correct, where people are living there
10 basically for longer periods than 30 days.
11 A. I don't.
12 Q. You don't know?
13 A. Yeah, I don't know.
14 MR. HANSCOM: Off the record a second.
15 (WHEREUPON a discussion was
16 held off the record, and
17 the proceedings continued
18 as follows.)
19 MR. HANSCOM: Just one last quick topic.
20 BY MR. HANSCOM:
21 Q. That New York City's Comptroller's report,
22 do you know which of the reports that the City
23 did produce it's referenced in?
24 A. I had that on here.
55
1 MR. HANSCOM: Or, Counsel, if you know.
2 MR. HUEBERT: We don't know offhand, but we can
3 certainly tell you when we're done here.
4 If you just want the information, that
5 will be easy enough.
6 MR. HANSCOM: Yeah, okay. That would be good.
7 Bate number whatever.
8 MR. DANAHER: Yeah, the Bates number.
9 MR. HUEBERT: There was a news article about it
10 that was included in the materials but not the report
11 itself.
12 MR. HANSCOM: Okay. That's all we've got.
13 MR. HUEBERT: Okay.
14 MR. HANSCOM: Thank you.
15 (Whereupon said
16 deposition adjourned.)
17
18
19
20
21
22
23
24
56
1 STATE OF ILLINOIS ) ) SS:
2 COUNTY OF C O O K )3
IN THE CIRCUIT COURT OF COOK COUNTY, ILLINOIS4 CHANCERY DEPARTMENT5 LEILA MENDEZ and ALONSO )
ZARAGOZA, )6 )
Plaintiffs, )7 ) No. 16 CH 15489
vs. )8 )
City OF CHICAGO, a Municipal )9 Corporation and ROSA ESCARENO, )
in here official capacity as )10 Commissioner of the City of )
Chicago Department of Business )11 Affairs and Consumer )
Protection. )12 )
Defendants. )13
14 I, DR. ADRIAN T. MOORE, state that I have15 read the foregoing transcript of the testimony given16 by me at my deposition on the 28th day of February17 2019, and that said transcript is a true and accurate18 record of the testimony so given by me at said19 deposition except as I have so indicated on the20 errata sheet(s) provided herein.21 _____________________________
DR. ADRIAN T. MOORE22
SUBSCRIBED AND SWORN TO23 before me this _______ day
of ___________, A.D., 2019.24 _________________________
57
1 ERRATA SHEET
2 Examination of: Dr. Adrian T. Moore
3 Date taken: 2-28-19
4 Page Line
5 ____ ____ Change: _____________________________
6 Reason: _____________________________
7 ____ ____ Change: _____________________________
8 Reason: _____________________________
9 ____ ____ Change: _____________________________
10 Reason: _____________________________
11 ____ ____ Change: _____________________________
12 Reason: _____________________________
13 ____ ____ Change: _____________________________
14 Reason: _____________________________
15 ____ ____ Change: _____________________________
16 Reason: _____________________________
17 ____ ____ Change: _____________________________
18 Reason: _____________________________
19 ____ ____ Change: _____________________________
20 Reason: _____________________________
21 ____ ____ Change: _____________________________
22 Reason: _____________________________
23 Deponent's
24 Signature________________________ Date _________
FILE
D D
ATE:
6/2
1/20
19 6
:51
PM
2016
CH
1548
9

Dr. Adrian T. Moore
February 28, 2019
(312) 704-4525
DCM Court Reporting, Inc.
16 (Pages 58 to 60)
58
1 ERRATA SHEET
2 Examination of: Dr. Adrian T. Moore
3 Date taken: 2-28-19
4 Page Line
5 ____ ____ Change: _____________________________
6 Reason: _____________________________
7 ____ ____ Change: _____________________________
8 Reason: _____________________________
9 ____ ____ Change: _____________________________
10 Reason: _____________________________
11 ____ ____ Change: _____________________________
12 Reason: _____________________________
13 ____ ____ Change: _____________________________
14 Reason: _____________________________
15 ____ ____ Change: _____________________________
16 Reason: _____________________________
17 ____ ____ Change: _____________________________
18 Reason: _____________________________
19 ____ ____ Change: _____________________________
20 Reason: _____________________________
21 ____ ____ Change: _____________________________
22 Deponent's
23 Signature________________________ Date _________
24
59
1 STATE OF ILLINOIS )
2 ) SS:
3 COUNTY OF McHENRY )
4
5
6 I, Jeannine Scheff Miyuskovich, CSR and
7 Notary Public in and for the County of McHenry and
8 the State of Illinois, do hereby certify that on the
9 28th day of February 2019, I reported in shorthand
10 the testimony of DR. ADRIAN T. MOORE, to the best of
11 my ability.
12 I further certify that said witness,
13 DR. ADRIAN T. MOORE, was by me first duly sworn to
14 testify to the truth, the whole truth and nothing but
15 the truth in the cause aforesaid before the taking of
16 the deposition; that the testimony was reduced to
17 writing in the presence of said witness by means of
18 machine shorthand, and afterwards said stenographic
19 notes were reduced to typewriting.
20 I further certify that I am in no way
21 related to any of the parties to this suit, nor am I
22 in any way interested in the outcome thereof.
23 I further certify that this certificate
24 annexed hereto applies to the original and
60
1 typewritten copies only, signed and certified
2 transcripts only. I assume no responsibility for the
3 accuracy of any reproduced copies not made under my
4 control or direction.
5 In testimony whereof, I have hereunto set
6 my hand and affixed my notarial seal this 5th day of
7 March 2019.
8
9
10 ____________________________
11 Jeannine Scheff Miyuskovich
12 CSR No. 084-003551
13
14
15
16
17
18
19
20
21
22
23
24
FILE
D D
ATE:
6/2
1/20
19 6
:51
PM
2016
CH
1548
9

Dr. Adrian T. Moore
February 28, 2019
(312) 704-4525
DCM Court Reporting, Inc.
Dr. Adrian T. Moore
February 28, 2019
(312) 704-4525
DCM Court Reporting, Inc.
61
A
A.D 56:23
a.m 1:23
ability 23:19
25:9 59:11
able 43:24
academic 13:18
16:16 22:4
access 25:2
account 19:14
accumulation
31:18
accuracy 60:3
accurate 56:17
acquired 12:24
acted 32:6
activists 41:3
activities 12:1
actual 43:2
added 49:1
adding 23:21
additional 11:15
11:16
address 23:12
29:9 50:11,14
addresses 36:4
addressing 34:4
36:7 50:3
adjourned 55:16
adjustments
23:19,21
Adrian 1:15 3:5
4:1,9 56:14,21
57:2 58:2
59:10,13
advertise 52:17
advertising
52:12
Affairs 1:11
56:11
affect 17:14 20:2
20:6 23:16
45:11 49:13,14
affixed 60:6
affordability
18:7 41:5
affordable
16:21 23:17
29:8,23
aforesaid 59:15
ago 9:6
agree 41:8
ah 26:10
Air 33:13
Airb 45:8
Airbnb 16:20
17:14 30:13,16
30:21,22 31:13
32:23,24 33:15
35:11 37:2
39:13 41:1
43:24 44:5
46:2,17 47:21
47:23 48:2
ALONSO 1:5
56:5
amenities 33:2
37:21
America 19:19
22:22
amount 23:2
analysis 16:21
32:4 33:14
44:24 48:11
49:1 50:21
51:3,8,10,11
analyze 9:21
48:14
analyzing 45:2
AND- 2:6
Andrew 17:13
Angeles 6:22
27:12 39:3
42:2,5 50:18
51:1
Angeles' 16:21
annexed 59:24
answer 32:19
44:13 51:23
52:16 54:4
anticipation
25:1,2
anybody 31:24
apartment 52:5
apartments
30:13 43:20
appear 18:2
appeared 2:11
2:18
applicant 9:19
applied 12:13
applies 59:24
apply 15:9
applying 53:24
appreciable
25:5
approach 12:14
12:20
approached 8:3
approximate
16:3
area 12:21 14:9
15:9 31:21
46:22 47:22
areas 15:7 29:16
38:7,8,12
arguing 49:20
argument 26:6
27:4 51:2,6
arguments
10:17,20 12:17
29:13 42:5
Arizona 2:4
article 21:20
40:19 42:4
55:9
articles 21:21
43:4
asked 8:4 9:21
10:19
asking 7:24 22:9
46:3
assess 10:19
assignment
10:16
associated 46:17
assume 51:18
60:2
Assuming 46:13
Atlanta 26:17
attempt 22:10
attempts 20:18
23:12
attention 15:20
42:23 43:5
attenuated 50:5
attorneys 4:11
availability
23:17 29:8,22
41:5 47:10
available 12:23
18:7 23:2 31:5
52:12
average 32:11
43:16 46:18,19
46:20 47:3
48:3
aware 39:16
41:11 42:7
B
B-A-R-R-O-N...
18:6
back 18:20
20:14 27:2
37:16 38:24
background 5:6
Barront 18:5
base 48:3
based 12:17
26:21
basic 9:16 12:1
15:2
basically 26:3
32:2 36:13
54:10
basis 16:12 19:4
43:9
Bate 28:1 33:16
35:12 37:4
55:7
Bates 55:8
bed 52:9
began 45:19
behalf 2:11,18
behavioral 24:1
believe 11:10
21:15 29:2
benefit 32:22
best 59:10
beyond 47:11
big 23:1 24:24
50:1
biggest 37:24
bio 5:1
bit 53:14
Bloomington
9:8 10:4
body 30:1
Boston 37:2
39:14 41:22,23
42:1 47:22
48:2 49:1
52:21
bottom 16:15
27:11 30:11,13
37:16 43:8
48:8 50:16
53:2
bought 53:16
boy 19:24 21:18
21:18,18
break 38:15
breakout 16:3
briefly 45:16
broadest 23:20
Brooklyn 24:18
build 25:9
building 53:20
buildings 44:23
FILE
D D
ATE:
6/2
1/20
19 6
:51
PM
2016
CH
1548
9

Dr. Adrian T. Moore
February 28, 2019
(312) 704-4525
DCM Court Reporting, Inc.
62
bullet 27:10,11
27:17 28:21
50:16
bunch 50:2
bus 9:14
business 1:10
30:12 32:12
33:14 56:10
C
C 1:2 2:1 56:2
California 5:9
5:15,21 6:3,23
call 12:5 50:20
called 13:21
28:1 53:10
Calls 51:21
52:14 54:2
capacity 1:9
56:9
capita 20:11
capture 25:12
cascading 13:9
case 7:20 8:2,6
9:7,22 10:8,11
14:1 15:11
20:11 21:1,12
22:16 23:9
48:15
cases 15:6
casually 12:5
causal 49:17
cause 59:15
CB 35:23
CBRE 35:18
44:20
census 46:1
47:20,22 48:1
Center 2:7 9:1
9:10,13
central 29:10
certain 33:3
certainly 55:3
certificate 59:23
certified 60:1
certify 59:8,12
59:20,23
CH 1:7 56:7
chain 49:18
chance 46:15
CHANCERY
1:4 56:4
change 50:9,24
57:5,7,9,11,13
57:15,17,19,21
58:5,7,9,11,13
58:15,17,19,21
changes 20:13
23:22 25:1,13
38:1,3,5 50:12
check 28:18
Chicago 1:8,10
1:22 2:9,13,16
4:11 22:17,22
22:23,24 24:6
24:14 25:4,19
26:1 30:3,17
31:6,10,13
32:3 34:8,15
36:9 39:17,20
41:20 44:2
45:9 46:9
53:12,23 56:8
56:10
Chicago's 27:4
Chicago-speci...
53:15
Chico 5:21
choices 31:22
Christina 8:3
10:9
chunk 50:1
CIRCUIT 1:3
56:3
citation 13:2
citation-driven
13:8
citations 12:24
13:1 30:6
cite 24:13 30:5
34:1 36:3
37:13
cited 14:12 30:3
33:23 35:24
37:10
cities 19:8,10,19
20:3,4,5,16
23:4 24:5
38:12 41:11,18
42:7
city 1:8,10 2:13
4:11 9:18
10:17,24 11:5
11:6,16 12:18
19:1,6 22:22
24:15 26:18,24
27:3,18 30:3
33:22 37:8
39:6,10 42:20
43:1,2 44:1
48:3,19 53:2
54:22 56:8,10
City's 54:21
Civil 1:18
clarify 22:8
close 16:22
20:22 43:21
Code 1:18
codes 30:23
collaborated
8:21
collection 14:6
College 17:15
28:22
combination
15:4
come 8:1 52:8
command 12:10
commercial
25:16
Commissioner
1:10 56:10
common 19:5
20:19 21:7
34:12
comparable
22:23
comparative
50:23
compared 20:4
24:4,19
comparing
49:10
compensated
14:20,23 15:21
compensation
15:3
Complaints
10:22
Compliance
40:9,13
comprehensive
49:4
Comptroller
27:18 42:20
Comptroller's
54:21
concerning 6:18
27:12 50:17
conclude 46:1,8
concluding
49:11
conclusion
26:20 43:10
46:8 47:13,14
52:15 54:3
conclusions
26:22 45:21
47:9 52:24
conduct 12:1
conducting
12:14
confirm 12:12
confirming 5:4
confounding
46:14
connecting
20:24
connection 45:6
consider 32:23
45:1
considered
29:18
consistent 48:10
consistently
19:11 48:12
constitute 30:1
constrained
24:5
construction
25:15 38:1,3,5
49:24
Consumer 1:11
56:11
continued 4:19
6:12 7:14 17:5
17:21 18:12
28:13 33:8
35:5 36:20
38:18 40:3
54:17
contributing
40:20 53:5
contributor
29:19
control 60:4
conversation 8:9
COOK 1:3 56:3
copies 60:1,3
copy 5:1 7:19
18:2,17 28:16
Coronado 2:4
corporation 1:9
35:21 56:9
correct 5:10,16
5:21 16:17
22:14 28:23
30:14,23 33:23
34:9,15 36:1,2
36:9 37:11,21
FILE
D D
ATE:
6/2
1/20
19 6
:51
PM
2016
CH
1548
9
Dr. Adrian T. Moore
February 28, 2019
(312) 704-4525
DCM Court Reporting, Inc.
63
39:4,7,10,14
39:17,18,21
51:20 53:5,19
54:9
correlation 51:6
cost 20:12 38:1,3
38:5 44:19
costs 50:1
counsel 28:17
55:1
country 19:12
County 1:2,3,17
56:2,3 59:3,7
court 1:3,20
9:22 10:4 56:3
create 20:15
created 41:1
Crisis 16:21
40:21
CSR 1:16,24
59:6 60:12
curves 24:3
D
D 3:1
D-A-Y-N-E
16:19
D1 40:8
D15 33:16
D33 34:14
D391 37:4
D412 53:1
D55 33:16
D56 35:12
D68 36:8
D79 35:12
DANAHER
2:14 55:8
data 19:1,7
22:18 26:8,10
26:15 30:21
34:7 36:9
39:11 44:9
47:12 48:21
49:4,9
date 33:15 57:3
57:24 58:3,23
dated 35:11
day 1:23 56:16
56:23 59:9
60:6
Dayne 16:19
days 13:16
54:10
deal 29:6
debate 41:2,10
decide 32:16
decided 30:7
decile 46:2
47:14,21
Defendant 2:18
Defendants 1:12
27:7,22 56:12
deficiencies
48:10
definitely 23:6
degree 6:2
delved 22:7
demand 14:9
23:21 25:13
34:5 53:3
demographic
23:7,8
demographics
43:14
dense 24:18
41:12 47:22
denser 24:2 25:6
31:18
density 22:20
23:16 24:23
Department 1:4
1:10 37:3 56:4
56:10
Deponent's
57:23 58:22
deposed 9:24
deposition 1:14
3:15,16,17,18
3:19,20,21,22
3:23,24 4:17
6:10 7:12 17:3
17:19 18:10
33:6 35:3
36:18 40:1
45:14,19 55:16
56:16,19 59:16
depositions 1:20
describe 8:19
9:3
describing 47:13
detail 10:12 46:6
details 10:14
19:23 44:21
determination
48:13
developable
23:2
developer 53:16
development
12:13 24:24
differences
49:24
different 20:9
22:17 24:3,20
38:8,11,12
differentials
37:20
differentiate
38:2
differently 51:4
direction 24:22
60:4
discovery 1:14
1:21 11:1
discretion 15:13
discussed 23:13
29:16 42:18,19
43:6,7
discusses 43:12
discussion 26:5
28:11 41:13,14
54:15
distribution
32:3 44:14
divided 47:22
document 4:22
6:15 7:17
15:22 17:8,24
18:15 33:11
35:8 36:23
40:6 45:14,17
documents
10:24 11:2,4,6
11:15,16,23
33:22 35:16
40:17 43:1
doing 12:5,9
15:24 16:4
dollars 47:5
dominate 43:15
don'ts 49:15
dots 20:23
downtown
31:19
Dr 1:15 3:5 4:1
4:23 56:14,21
57:2 58:2
59:10,13
draw 26:22 47:9
drive 14:8
driven 13:2
driver 23:7
35:11
Driving 37:1
duly 4:2 59:13
dynamic 53:5
E
E 2:1,1 3:1
earlier 43:6,23
earn 5:12,18,23
earned 5:8
East 2:4
easy 55:5
economic 9:20
10:17 12:6
13:19,23 20:16
38:7 50:1,21
51:10
economics 5:8
5:15 12:3 26:3
37:3
economist 19:13
26:21 51:9
economists 19:5
23:6
Economy 18:6
educational 5:6
effect 25:23 47:7
47:10 48:5
49:2,3,6,12,13
50:10
effecting 50:14
effects 34:5 45:4
49:10,21 51:2
eight 20:1 27:17
42:18 43:12
48:9
either 12:12
25:14 35:24
elasticity 24:3
electricity 20:2
20:11,12
Ellis 35:22
Email 8:12
empirical 19:12
30:5 42:6
48:18
employees 7:5,6
encountered
40:17
engage 50:20
environment
24:20
errata 56:20
57:1 58:1
ESCARENO
1:9 56:9
essentially 12:4
FILE
D D
ATE:
6/2
1/20
19 6
:51
PM
2016
CH
1548
9
Dr. Adrian T. Moore
February 28, 2019
(312) 704-4525
DCM Court Reporting, Inc.
64
12:17
estate 35:21
41:3
events 8:22
eventually 13:10
everybody 12:8
evidence 26:10
30:2 37:2
39:13
Exacerbate
16:20
exact 7:7
exactly 11:9
52:10
Examination
3:7,8,10 4:4
42:15 51:14
57:2 58:2
examined 4:2
example 20:7
30:23 53:17
exclude 19:17
excuse 17:15
Exhibit 3:15,16
3:17,18,19,20
3:21,22,23,24
4:16,17,24 6:8
6:10,17 7:10
7:12,19 16:10
17:1,3,19 18:2
18:10,17,20
27:13 28:2,23
29:3 33:4,6,13
35:2,3,10
36:18,24 39:1
39:6,9,12,22
40:1 42:19
44:20 45:13
52:21
EXHIBITS 3:13
existing 12:16
23:11
expect 19:15
31:13,19
expected 19:13
19:14
experience
19:20 32:18
expert 8:16 9:9
15:6,10 32:18
explain 22:10,16
29:15 37:19
43:9 45:1
47:17
explained 32:2
explains 49:24
50:1
Expressed 16:12
extension 15:8
extensive 14:6
extreme 48:4,4,6
extremely 23:3
F
fact 51:5
factor 23:10,15
factors 20:2
23:5 38:3
46:14 50:6
fair 26:2
fall 11:10
familiar 31:12
40:13
far 10:1 22:23
30:4 49:6
favor 10:18
February 1:23
56:16 59:9
feel 41:9
field 13:5
fifty 47:4
file 14:3
files 11:20 12:22
14:5,14 28:7
fill 13:6 15:13
final 11:11
find 13:10 20:18
26:8,10 28:7
29:5,17,20
30:4,5 31:24
31:24 32:4
34:24 47:18
48:5,22
finding 26:14
first 4:2,24 11:9
12:7 16:11,19
17:12 27:11
32:20 43:6
48:17 50:16
59:13
fits 15:12
fitted 19:9
five-minute
38:15
flexibility 23:23
25:8,12
flexible 24:2,6
24:15
flip 18:21 27:16
41:1
Flipping 30:10
Florida 7:1
41:14,15
focus 39:9
focused 39:17
follow 51:13
follow-up 13:12
follows 4:3,20
6:13 7:15 17:6
17:22 18:13
28:14 33:9
35:6 36:21
38:19 40:4
54:18
footnote 43:12
footnotes 30:11
forces 14:8
foregoing 56:15
form 50:15
fortunes 50:2
found 26:10
30:7 53:14
Foundation 6:17
6:19,21 7:2
14:23 15:16,17
Foundation's
5:2 6:19
Francisco 26:17
frequency 44:9
frequently 44:6
full 4:7 11:5
full-blown 39:20
fundamental
49:8
further 3:10
21:6 51:14
59:12,20,23
G
gamble 50:8
gaps 13:7
general 10:13
53:14
generally 8:19
46:9
geographical
38:11
germane 13:11
22:3 34:3 36:7
44:24 45:2
give 16:3 19:23
30:21 31:3
34:18 52:4
given 25:14
56:15,18
go 10:1 11:19
13:20 24:19,21
26:9 27:2 28:9
30:22 34:14
43:24 52:6
going 12:6 24:2
24:20 28:18
43:3 44:16
Goldwater 2:3
8:4,13 9:10,12
10:7
good 41:10 55:6
Google 13:13,15
13:15
governments
41:2
graph 20:15
graphs 20:10
great 13:16
Growing 38:7
growth 34:5
35:11 37:18
38:7 40:24
50:24
H
half 14:12
hand 14:12 18:1
60:6
handed 4:23
handing 6:16
7:18 18:16
33:12 35:9
36:24
Hanscom 2:14
3:7,10 4:5,6,10
4:21 6:8,14
7:10,16 17:1,7
17:18,23 18:14
28:9,15,20
33:4,10 35:2,7
36:17,22 38:14
38:20,23 39:22
40:5 42:10,14
51:13,15,16
52:2,20 54:8
54:14,19,20
55:1,6,12,14
happen 8:9
23:19 25:18
26:1
happened 8:11
hard 48:18
Harvard 16:22
heading 16:11
FILE
D D
ATE:
6/2
1/20
19 6
:51
PM
2016
CH
1548
9
Dr. Adrian T. Moore
February 28, 2019
(312) 704-4525
DCM Court Reporting, Inc.
65
headquarters
6:22
heard 23:6
41:24
held 28:12 54:16
hereto 59:24
hereunto 60:5
high 43:16
higher 22:21
highest 46:2
47:20
history 5:20 6:7
hold 5:14
home 8:8 29:17
30:2 32:3 34:6
37:1,20 41:1
41:16 43:15
49:10 50:24
52:18 53:4
54:7
home-share
43:14
home-sharing
32:24 36:5
43:13 44:17
homeless 49:15
homelessness
30:2 46:11
49:9 50:8,15
homes 43:22
44:23
host 32:6 40:9
40:13
Hosts 35:10
hotel 32:21 41:2
53:8,24
hotels 32:13
hours 15:18,23
house 14:13
17:15 23:17
25:22 29:7,22
32:14 34:11
36:14 51:19
52:12 53:17,18
53:21
house-sharing
32:6,8
housing 8:8 14:7
14:9 16:21
17:14 18:7
23:18 24:7,16
25:9,14 29:8
29:15,23 37:19
38:8 40:21
41:3,6 43:8
45:11 46:3
47:8,10 49:14
49:22 53:3
HUEBERT 2:3
3:9 32:17
42:13,16,17
51:12,21 52:14
54:2 55:2,9,13
hundred 47:4,5
hundreds 11:1
hypothesis 26:4
26:9,11
I
idea 25:24
identify 12:24
21:16
ignoring 48:12
Illinois 1:1,3,17
1:19,22 2:9,16
9:8 10:4 56:1,3
59:1,8
imagine 20:15
impact 23:16
29:7 41:4
important 23:5
29:19 48:13
impressionistic
31:22
include 15:24
30:8 43:4
included 21:21
33:21,22 43:2
55:10
including 22:22
income 43:13,16
incomes 43:19
incorporated
24:1
increase 46:3,10
46:11,18,22
index 13:17,23
24:14
indexing 13:19
indicate 46:16
indicated 56:19
indicates 26:15
50:9
indication 29:18
industry 41:3
influence 24:24
45:4
influenced
23:23
influencers 49:8
influences 14:7
49:18 50:4
information
34:3,4 49:5
55:4
informs 12:12
initial 50:9
Institute 2:3 8:4
8:14,15 9:10
insure 12:15
interest 15:4
interested 59:22
Interrogatories
10:23
introduced 4:10
8:6
investigating
26:19
involved 8:1
Irrelevant 51:21
Irvine 5:9,15
issue 8:5,7 9:16
9:18 12:4
23:16 29:12
34:8,10 42:1,8
48:14 53:13
issues 8:23
41:15 48:14
item 17:9,13
18:18
items 48:7
iterative 13:1
J
Jacob 2:3 8:6
10:14
January 11:11
Jeannine 1:15
1:24 59:6
60:11
JEFFREY 2:8
jhuebert@gol...
2:5
jobs 25:2
journal 13:17
21:20,21
jschwab@libe...
2:10
Justice 2:7 8:24
9:10,13
justifications
9:20,21
K
K 1:2 56:2
keep 7:23 13:9
Key 35:11 41:1
keys 52:5
kick 26:6
kind 23:5,7
kitchen 32:22
know 4:13 7:7
10:24 11:18
20:15 22:4,8
23:14,14 24:18
26:4,5 30:19
31:19,20 34:19
34:19,21,23
35:20 37:13
39:12 40:16
41:9 43:20
44:9,10,14,15
45:5 53:7,12
53:23 54:5,12
54:13,22 55:1
55:2
known 12:11,11
12:12
Kyle 18:5
L
lack 29:15 44:9
lake 24:22
land 37:18 49:22
landlord 51:17
landlords 47:4
large 28:7 35:21
largely 13:8
LaSalle 1:22 2:8
2:15
law 16:23 42:4
layman's 21:3
lead 46:8
lease 52:19
Lee 16:20
legal 51:10,24
52:14 54:2
LEILA 1:5 56:5
leisure 43:17
let's 4:15 6:8
7:10 16:8 17:1
17:18 27:2
28:9 29:11
33:4 35:2
letter 18:24
level 43:13
levels 51:1
Liberty 2:7 8:24
9:10,13
libraries 13:18
FILE
D D
ATE:
6/2
1/20
19 6
:51
PM
2016
CH
1548
9
Dr. Adrian T. Moore
February 28, 2019
(312) 704-4525
DCM Court Reporting, Inc.
66
license 9:18
licensing 9:7
life 9:5
limited 23:3
line 19:9 20:19
20:22,24 21:9
57:4 58:4
lines 37:17
link 51:3
linking 30:2
list 16:15 21:20
21:22 27:10
51:19
listed 16:19
17:13 18:5
21:13 29:6
34:17 36:9
44:1,4 48:8
listings 30:17
31:1,4,14,18
46:2 47:21,23
48:2
lit 12:5
literature 10:18
12:15,16 13:19
14:7 16:16
22:4 23:11,13
38:2 49:7,23
50:9,12
little 11:14 21:8
21:9 51:13
53:13
live 41:11 54:1
lived 31:6
living 51:18 54:9
lobby 41:3
local 41:2,4
locate 25:2
located 6:21,24
location 32:23
33:1
locations 7:2
43:21
logical 26:5 45:6
long 15:4 31:10
52:18
long-term 41:5
41:16 45:5
52:19
longer 54:10
look 13:4 16:8
19:14 20:10
29:21 33:1,1,2
38:24 45:16
48:24
looked 20:3
29:14 43:11
47:23 53:13
looking 20:14
30:13 31:23
43:7,12,19,21
49:7 50:23
52:23
looks 5:3,4
Los 6:22 16:21
27:12 39:3
42:2,5 50:18
51:1
lot 8:21,23 12:22
13:17 14:10
15:13 20:20
21:8 25:4,14
25:15 31:9
32:12 44:16
49:20
lots 41:15
low 46:21
lunch-time 26:5
M
machine 59:18
magnitude
22:21 48:22,23
49:19
main 24:12
major 6:6 23:4
46:21
making 22:5
51:7
Manhattan
22:20 24:19
March 35:12
60:7
margin 47:7
mark 6:8 7:10
17:1,18 33:4
35:2 39:22
marked 4:18,24
6:11,16 7:13
7:18 17:4,20
18:1,11,16
27:14 28:22
29:3 33:7,12
35:4,9 36:8,19
36:24 40:2
market 14:7
23:20,23 24:2
24:4,6 25:1
30:14 43:8
45:11 47:8
markets 14:9
24:16 37:20
38:8,10
marking 4:15
Massachusetts
37:4
masters 5:14,20
materials 10:21
14:5,13 55:10
matter 10:16
14:21 21:23
Mattresses
33:13
McHenry 1:17
59:3,7
mean 7:3 26:18
29:9 54:6
meaning 31:17
means 19:7 21:4
21:5 46:20
47:2,17 59:17
measurement
20:17
MENDEZ 1:5
56:5
mention 18:24
30:11
mentioned
11:22 14:3
17:10 23:15
27:17 28:16
29:17,20 36:11
mentioning
41:19
mentions 5:8
28:21
merits 10:20
methodology
46:13,19
Miami 41:20
miles 24:19,21
minutes 38:20
mission 15:12
15:14
Miyuskovich
1:16,24 59:6
60:11
models 20:21
month 32:11
46:23,24 47:2
month-by-mo...
20:13,14
Moore 1:15 3:5
4:1,9,23 56:14
56:21 57:2
58:2 59:10,13
move 25:1
moves 23:24
moving 25:17
multi-unit 36:14
44:22,23 53:18
multiple 35:10
36:5 53:21
Municipal 1:8
56:8
N
N 2:1 3:1
name 4:7 10:6
10:23 22:15
national 39:11
48:21
natural 15:8
nature 9:3
near 31:20
necessarily 44:5
neighborhood
25:20,21
neighborhoods
31:12 34:11,17
34:18
net 38:4
Network 13:22
18:8 29:2
never 9:24 19:9
20:22
new 12:13 19:1
19:6,8 20:5,8
20:21 21:2,10
21:24 22:5,10
22:17,18,20,24
23:3,7 24:2,8,9
24:15,17 25:6
25:20,22 26:9
26:10,15,22
27:18 39:6
41:20,21 42:20
48:19,24 54:21
news 55:9
night 32:21,23
nine 20:1 30:10
norm 19:18 21:7
north 1:21 2:15
31:20
northeast 20:3,6
notarial 60:6
Notary 1:16
59:7
notes 59:19
number 7:7
FILE
D D
ATE:
6/2
1/20
19 6
:51
PM
2016
CH
1548
9
Dr. Adrian T. Moore
February 28, 2019
(312) 704-4525
DCM Court Reporting, Inc.
67
16:12 20:3,4
27:3 34:14
43:12 49:14
55:7,8
numbers 28:1,1
33:16 35:12
37:4
O
O 1:2,2 56:2,2
O'Hare 31:20
Objection 32:17
51:21 52:14
54:2
observation
21:6
obviously 39:19
occasionally
44:12
occupancy
44:10 53:7
occupied 44:11
44:12
occur 24:24
offered 9:20
10:17 53:21
54:7
offhand 55:2
offices 7:3
official 1:9 56:9
oh 21:18,18,18
34:13
okay 4:13,14,23
5:5 6:8 7:23
16:7 27:2
38:22 39:2
42:10,14 55:6
55:12,13
once 32:11
one-fifth 49:2
one-tenth 48:23
one-twentieth
49:2
ones 21:11 29:5
29:16 31:16
opens 50:23
opinion 21:24
37:18
Opinions 16:12
opportunity
25:4 45:16
opposed 16:5
order 44:13 50:5
orders 22:21
49:18
ordinance 53:24
organization
15:12,15
original 59:24
outcome 59:22
outcomes 14:8
outlier 19:6 20:8
21:4,5 22:6,11
48:20
outpacing 53:3
outside 19:18
over-developed
25:6
overall 47:9
overwhelmingly
43:17 49:23
owned 45:9
53:20
owners 36:5
owns 45:3,12
P
P 2:1,1
pack 21:2
page 5:5 16:11
17:12 18:21
27:3,11,17
30:10 34:14
36:8 37:17
40:23 42:18
47:18 48:8,9
50:17 52:24
57:4 58:4
pages 3:3 11:2
paper 12:6
26:14 28:22
29:2 37:3
48:20 51:6
papers 22:9 37:8
40:10
paragraph
18:23 27:6
part 15:10 23:1
37:24 41:13,14
particular 13:11
21:6,12 22:21
23:9 40:19
46:10
parties 59:21
partnering 15:5
pay 15:20
PDF 28:7
people 13:5 18:6
25:1,16 43:7
49:14 54:1,9
people's 47:10
percent 16:6,6
37:19,23,24
38:4 44:10
46:4,22,23
47:24 48:1,5
49:24 50:13
percentage 16:4
47:8
perform 51:3
periods 54:10
person 30:22
45:9
personal 19:20
32:18
pertaining 1:20
pertains 32:17
Ph.D 5:8
Phoenix 2:4
22:23
phonetic 8:4
phrase 38:10
53:7
physical 23:5
pick 25:19,20
32:16
pin 28:18
places 41:10
44:10,11
Plaintiffs 1:6
2:11 27:7,22
56:6
platforms 40:24
please 4:8,12 6:9
7:11 17:2,18
18:21 28:10
33:5 39:23
plenty 41:1
plot 19:7
plug 30:23
point 22:5 27:11
27:17 28:21
31:4 50:16
points 22:13
27:11
policies 10:18
policy 8:8,21,22
16:22,23 26:22
50:9,12
poor 43:20
popular 44:10
portion 36:13
posited 45:4
practice 15:5
pre-existing
54:6
prepared 7:20
preparing 12:2
15:22
presence 59:17
pretty 12:3,13
13:19,22 14:6
20:19 38:1
price 33:2 37:20
prices 14:9
17:15 20:2,11
25:23
primarily 32:22
48:19
printed 5:1
printout 40:7
privacy 52:7
probability
50:13
probably 23:4,9
31:21 38:6
problem 29:15
48:22 49:16
50:8,11,14
procedure 1:19
12:4 20:17
proceedings
4:19 6:12 7:14
17:5,21 18:12
28:13 33:8
35:5 36:20
38:18 40:3
54:17
process 13:2,9
produce 54:23
produced 11:5,6
11:17 28:17
35:16 37:8
40:8
production
11:12
professional
51:9
profile 24:23,23
25:6
project 15:19
prominent 13:4
properties 17:14
34:17 44:1,4,6
44:16,17 45:3
45:5
Protection 1:11
56:11
provided 10:18
10:21,22,24
FILE
D D
ATE:
6/2
1/20
19 6
:51
PM
2016
CH
1548
9
Dr. Adrian T. Moore
February 28, 2019
(312) 704-4525
DCM Court Reporting, Inc.
68
11:3,5,8,22
27:7,22 33:22
43:1 56:20
provisions 1:18
public 1:16 8:21
59:7
publications
21:13
pull 28:6
pulling 5:3
purported 29:21
purpose 1:21
pursuant 1:18
pushing 53:4
put 15:18,23
26:2 31:24
37:23
putting 15:2
Q
Queens 24:18
quest 32:8
question 4:24
17:9 22:3
26:12,13 29:10
29:21 32:1
41:17 44:13
45:2 49:9 50:4
questions 4:12
7:24 12:16
16:9 34:3
42:13
quick 54:19
quickly 53:4
quite 11:18 15:6
34:19
quote 16:22
R
R 2:1
raises 47:1
raising 25:23
47:5
random 25:19
25:20
range 8:22
ranges 46:4
re-development
25:15
reaches 45:22
reactions 24:4
read 56:15
readily 25:19
real 35:21 41:3
reality 47:7
really 10:13
23:14 27:1
40:16 46:21
50:3 52:11
reason 5:2 6:17
6:19,21 7:5
14:23 15:2,15
15:17 43:18
46:7 49:20
57:6,8,10,12
57:14,16,18,20
57:22 58:6,8
58:10,12,14,16
58:18,20
reasoning 49:12
reasons 24:12
51:1
recall 9:23 14:16
27:24 28:4
33:17,21 35:15
39:13 42:22
45:13
received 28:8
recess 38:16
recognize 19:17
Recommendat...
16:22
record 4:8 28:9
28:12,15 54:14
54:16 56:18
reduced 59:16
59:19
referenced
14:18 43:4
53:18 54:23
referring 38:11
refusal 9:20
refused 9:18
regarding 42:21
regulations
37:19 49:22
related 12:24
59:21
relates 34:8
relative 46:2
51:2
relatively 43:16
46:17
relying 18:24
remember 8:10
8:11 9:5,16
10:5,10 11:9
11:11,12,19
21:19,23 35:23
37:9,15 40:10
remote 43:20
remotely 26:20
rent 46:22 47:1
51:1
rental 25:23
40:24 41:6,12
41:16 45:5
51:19 53:3
rentals 16:20
40:20 41:4
43:8 44:22,22
45:9 46:9
rented 44:6
renting 52:7
rents 37:1 46:3
46:10,18,20
47:5 49:11,12
53:4
report 7:20 12:2
14:18 16:5,8
18:20 21:14
23:14 27:18,21
29:6,21 30:1,8
30:10 33:23
34:1 35:24
37:10,14,16
42:19,20 43:2
43:5 44:20
48:9 50:17,20
54:21 55:10
reported 1:24
59:9
reports 27:8
30:1 43:11
48:10 53:19
54:22
representation
20:20 21:3
representative
19:1 22:19
reproduced 60:3
research 8:22
10:20 12:14,19
12:22 13:22,23
15:8 16:1,4,6
18:8 22:3
26:12 29:2,14
researched
26:16
residential
25:16
residents 41:4
responses 24:1
responsibility
60:2
rest 19:9,12 38:6
50:1,2
restrictions
37:18
result 12:12,13
26:14,22 48:3
48:22
results 19:12,18
20:7 21:2,5
26:18 46:16
48:19
retail 20:12
retracting 44:18
review 12:5
16:23 19:15
37:7 42:4
46:16
reviewed 12:23
12:23 13:1
16:16 40:11
46:6 48:7
Richard 2:14
35:22
richard.danah...
2:17
right 5:4 10:23
11:11 21:19
22:15 30:24
31:2 33:24
34:16 36:15
44:3
rights 52:7
rise 40:24
Riverside 6:3
Road 2:4
robust 50:12
ROSA 1:9 56:9
Rosemont 31:20
31:21
roughly 7:8
37:19
rule 20:21 32:20
Rules 1:19
running 15:4
S
S 2:1
sample 48:18,23
San 26:17
Sanford 8:3
10:9,10
Sarasota 7:1
save 9:5
saying 19:4,5
47:3
FILE
D D
ATE:
6/2
1/20
19 6
:51
PM
2016
CH
1548
9

Dr. Adrian T. Moore
February 28, 2019
(312) 704-4525
DCM Court Reporting, Inc.
69
says 5:14 16:19
22:12 25:22
27:6 35:18
37:2 40:23
49:23 50:13
53:6
scale 22:24
scatter 20:23
Scheff 1:15,24
59:6 60:11
scholarly 13:16
13:17
SCHWAB 2:8
Science 13:22
18:7 29:2
scores 24:14
seal 60:6
search 13:4
searchs 13:12
second 5:5 11:12
17:12 27:6
28:10 40:23
54:14
second- 49:8
see 15:10 16:13
16:23 17:16
18:8 19:2,15
21:1,2,16 24:4
24:20 27:4,8
27:18 28:16,18
31:1 33:20
35:13,18 37:5
40:21 41:6
43:24 45:21,24
48:10
seeing 20:8
33:17 35:15
37:15 40:10
44:4 45:13
seek 48:14
sense 23:21
41:10
sequence 11:19
served 9:9
service 9:14
services 9:8 33:1
set 11:6,9,11
12:17 26:8
39:11 48:21
50:4 60:5
settled 10:2
seven 18:21 27:3
27:12 48:8
50:17
shabby 43:20
shape 24:3
share 51:19
52:12 53:17
sharing 8:8
14:13 18:6
23:17 25:23
29:7,17,22
30:2 32:3,14
34:6,11 36:14
37:1 41:16
43:15 49:11
50:24 52:18
53:4,18,21
54:7
SHEET 57:1
58:1
sheet(s) 56:20
Sheppard 17:13
shift 25:5
shifting 25:15
shock 47:6
short 38:16
short-term
16:20 40:20,24
41:12 43:7
44:7,22 46:9
shorthand 59:9
59:18
shows 20:15
47:12
shrinking 38:8
shuttle 9:7
side 31:20 33:15
Signature 57:24
58:23
signed 60:1
significant
25:13
similar 37:20
single 36:16
single-family
44:23
single-room
53:7
sitting 24:21
situation 48:6
situations 47:11
sixth 34:22,22
sleep 52:8
slower 23:24
small 46:18 47:8
48:18,23 50:9
50:10
smaller 18:24
49:6
Social 13:21
18:7 29:1
solve 50:7
somebody 52:5
someone's 19:15
sorry 49:2
sort 21:3
sound 46:13
South 2:8
southwest 20:4
space 23:2 49:5
52:7
speaking 10:14
specifically
22:10 51:5
speculation
51:22
spend 49:20
spent 15:24 16:4
spoke 8:5 10:7
springing 44:18
SROs 53:10,12
54:1,6
SS 1:1 56:1 59:2
stage 26:13
stand 20:23
standard 12:3
12:14 20:16
38:1
standards 51:9
stands 35:23
start 4:15
starts 16:15
state 1:1,17 4:7
5:21 29:24
37:17 38:9
41:12 56:1,14
59:1,8
stated 29:24
44:21
statement 24:14
29:14 31:23
35:1 41:8
49:21
states 19:8 22:5
51:5
statics 50:24
statistical 20:17
20:20 46:18
47:2 51:3
statistics 34:15
stay 32:13,21
43:20,21
stays 31:10
steady 38:9
stenographic
59:18
Stephen 17:13
steps 49:17
straightforward
13:19
strangers 52:8
Street 1:22 2:8
2:15
stretch 47:11
stronger 49:19
struck 48:17
studies 18:24
19:21 29:5,20
30:16 39:16
41:22 48:11,24
study 18:3 25:22
26:23 27:12
30:7 39:3,7,20
42:2,3 45:22
46:6 52:21
stuff 14:11
subject 15:11
21:12 29:7
48:21
subjects 14:4
SUBSCRIBED
56:22
subset 25:11
substantially
20:6 50:13
suburban 25:19
25:21
suburbs 24:17
suggested 43:23
suit 59:21
Suite 1:22 2:9,15
summary 5:6
6:18 18:23
supply 14:8
23:21,21 25:13
34:5 45:5
49:13,13 53:3
support 10:19
25:24 26:11
Supreme 1:19
sure 11:18 27:21
43:3
sworn 4:2 56:22
59:13
system 13:20
systems 13:17
T
T 1:15 3:5 4:1
FILE
D D
ATE:
6/2
1/20
19 6
:51
PM
2016
CH
1548
9

Dr. Adrian T. Moore
February 28, 2019
(312) 704-4525
DCM Court Reporting, Inc.
70
56:14,21 57:2
58:2 59:10,13
tackling 12:4
take 16:8 28:6
38:11,14
taken 1:15,18,21
38:17 57:3
58:3
takes 23:22
talk 10:13 25:8
talking 23:13
25:9,11 34:8
tax 53:24,24
technique 13:14
tele-communi...
7:5
tell 34:23 44:5
45:10 55:3
tells 45:12
tenant 51:17,19
52:4,6,13,18
tend 46:10
tendered 4:22
6:15 7:17 17:8
17:24 18:15
33:11 35:8
36:23 40:6
tends 19:18
terms 10:13
11:23
test 26:8
testified 4:3 9:17
42:21
testify 59:14
testimony 32:18
56:15,18 59:10
59:16 60:5
Thank 42:11,12
55:14
thereof 1:20
59:22
thing 12:7 19:24
26:23 48:17
49:7
things 23:22
24:17 25:3,5
25:18 33:3
think 10:12
11:14 20:13
21:20 22:2,18
23:9 24:10,11
24:18 26:21
28:17 29:24
34:2 39:9 42:9
42:11 44:21
45:6 46:5,7
47:14 48:12
51:24 53:22
third 50:5
third-order 49:8
50:10
thorough 13:22
50:21
thought 34:24
three 34:20
41:11,18
thumb 20:21
time 9:12 10:11
15:3,24 16:4
20:12 25:10
31:4 49:20
52:13
times 34:20
tiny 47:7 50:4,5
title 33:13 35:10
40:8
titled 6:17 16:12
27:3 37:1
39:13 40:19
today 7:21
told 10:10 11:4
tools 13:24
top 17:12 27:16
33:15 40:8,23
47:24 48:9
topic 12:6 13:11
15:5 36:7,11
36:12,13 54:19
total 46:3 49:13
49:13
tourist 43:21
tracks 46:1
47:20,22 48:1
transcript 56:15
56:17
transcripts 60:2
travel 32:11
43:13,15,17
travelers 30:12
treated 14:4
26:18
trend 20:18,19
36:4,5
tried 29:15
true 56:17
truth 59:14,14
59:15
trying 50:11,14
turn 36:8 52:23
turned 53:16
Turning 45:13
turnover 44:17
two 16:12 21:10
23:5 24:12
26:14 27:3
45:7 51:3
type 30:12
types 14:4 43:13
43:15
typewriting
59:19
typewritten 60:1
typical 48:4
U
U-D-E-L-L
17:14
Udell 17:13
Ultimately
14:11
unaccounted
46:15
unclear 4:12
undergraduate
6:1
understand 12:7
understanding
10:15 11:7
22:2 46:5
understood
12:15
unindexed 28:8
unique 19:11,12
24:17
unit 36:6 51:18
52:11
United 19:8
units 25:9 35:11
36:5 46:3 47:8
53:21
university 5:9
5:15,21 6:3
13:18 37:3
Unregulated
33:14
unrepresentat...
22:1
upper-middle-...
43:19
urban 29:16
46:21
use 13:13,13,18
13:24 26:9
30:12 37:18
38:10 44:14
49:22
useful 34:4 35:1
users 43:14,14
uses 48:21
usual 12:20
usually 12:11
15:7 20:23
V
vacation 30:12
40:20 41:12
43:22 45:9
vacationers
43:18
variance 21:7
versa 25:16
versus 20:12
36:6,14 44:23
49:14
vice 25:16
vicinity 7:9
view 25:24
virtually 19:7
visited 31:8
vs 1:7 56:7
W
W 2:14
want 55:4
wanted 31:1
50:7
Washington
41:20,21
wasn't 42:3
way 8:17 13:3,7
21:10,11 23:3
26:2 30:19
47:11 59:20,22
ways 23:8 25:5
we'll 28:18
we're 7:20 24:21
55:3
we've 4:24 8:21
42:11 55:12
website 5:2,4
6:19 30:22
40:7,17 43:24
went 9:24
Wes 4:10
WESTON 2:14
whanscom@ci...
2:17
Wharton 24:14
whereof 60:5
wholesale 20:12
FILE
D D
ATE:
6/2
1/20
19 6
:51
PM
2016
CH
1548
9

Dr. Adrian T. Moore
February 28, 2019
(312) 704-4525
DCM Court Reporting, Inc.
71
Whoo 19:24
wide 8:22
widespread 47:6
Williams 17:15
28:21
witness 3:3 8:16
9:9 15:6 28:17
32:20 38:22
42:12 51:24
52:17 54:5
59:12,17
woman 10:6
wondering 52:8
word 25:12
47:14
words 53:20
work 8:22 12:12
12:21,24 13:6
13:10,16 14:20
15:7,8,12
19:16 20:1
27:2 30:5,6
42:6 53:14,14
worked 8:5,13
8:24 9:6 13:5,6
14:10 24:16
workers 25:3
working 12:21
28:22 29:2
37:2
worth 26:19
44:19
wound 9:23
write 12:6
writing 16:5,6
59:17
written 12:8
X
X 3:1
Y
yeah 31:21
34:24 41:24
48:16 54:13
55:6,8
year 8:10 9:5
43:17 44:11
year-by-year
20:13
years 8:23,23
9:6 14:10 15:6
20:1
York 19:1,6,8
20:5,8,21 21:2
21:10,24 22:5
22:10,17,18,24
23:3,7 24:2,8,9
24:15,17 25:6
25:20,22 26:9
26:10,15,22
27:18 39:6
41:20,21 42:20
48:19,24 54:21
York's 22:20
Z
ZARAGOZA
1:5 56:5
zip 30:23
zone 25:14
zoning 37:18
0
084-003551
60:12
1
1 3:15 4:16,17
4:24 46:22
48:5
1.3 46:4
10 3:24 24:19,21
37:17,23,24
39:22 40:1
47:24 48:1
10:15 1:23
100 34:23
1020 1:22 2:15
15 8:23 46:22,24
47:1
1500 2:9
15489 1:7 56:7
16 1:7 56:7
17 3:18,19
18 3:20
190 2:8
2
2 3:16 6:8,10,17
2-28-19 57:3
58:3
20 46:24 47:1
2000 5:13
2016 27:12
33:16
2017 35:12
2018 27:17 29:1
42:20
2019 1:23 56:17
56:23 59:9
60:7
21 52:24
25 14:10
263-7668 2:10
28th 1:23 56:16
59:9
290 34:22
3
3 3:17 7:10,12
7:19 16:10
18:20 42:19
46:22 48:5
3.1 46:4
30 1:21 2:15
16:6 54:10
312 2:10,16
33 3:21
35 3:22
36 3:23
4
4 3:7,15,18 17:1
17:3 27:13
28:2 39:1
40 3:24
42 3:9
426 37:4
5
5 3:19 17:18,19
18:2 28:23
39:6 40:8
50 15:23
500 2:4
51 3:10
5th 60:6
6
6 3:16,20 18:10
18:17 29:3
39:9
60 15:23
602)462-5000
2:5
60602 2:16
60603 2:9
7
7 3:17,21 33:4,6
33:13
70 16:6
744-9077 2:16
75,000 43:16
750 46:21,23
8
8 3:22 35:2,3,10
44:20
84 6:5
85004 2:4
87 5:24
9
9 3:23 36:17,18
37:1 39:12
45:13 52:21
90 7:9 37:19
38:4 49:23,24
50:13
98 5:19
FILE
D D
ATE:
6/2
1/20
19 6
:51
PM
2016
CH
1548
9

Exhibit N
FILE
D D
ATE:
6/2
1/20
19 6
:51
PM
2016
CH
1548
9

FILE
D D
ATE:
6/2
1/20
19 6
:51
PM
2016
CH
1548
9
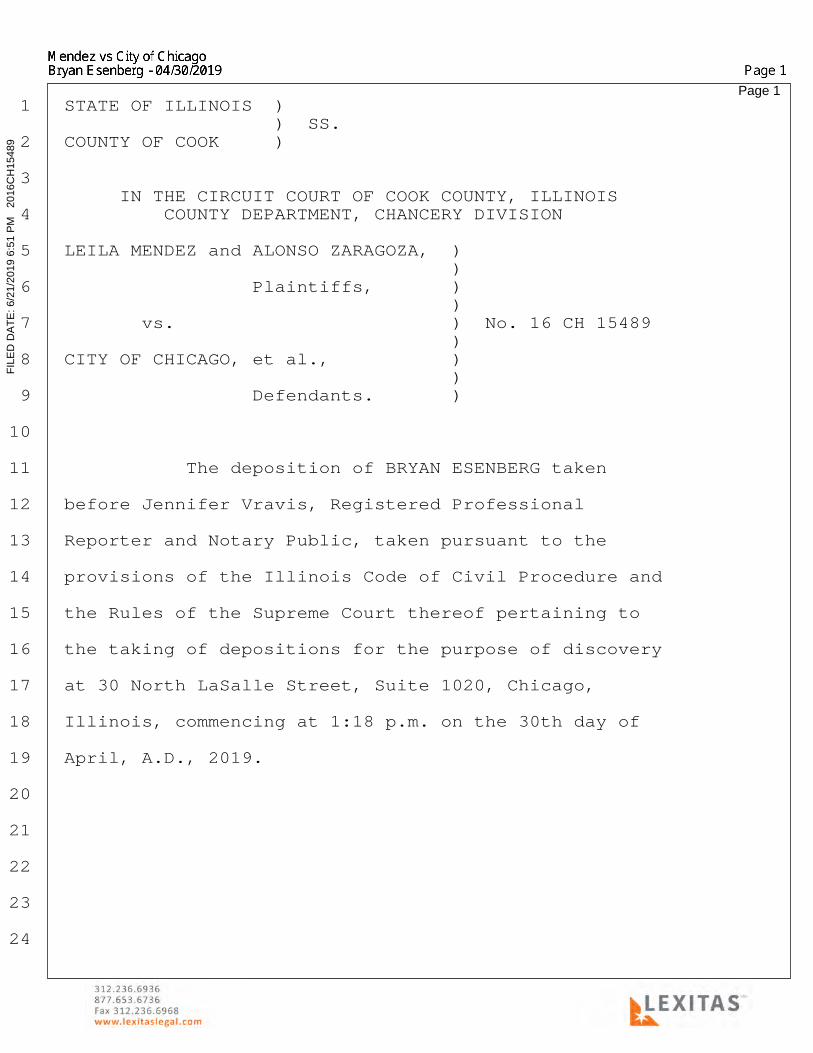
Page 1·1· ·STATE OF ILLINOIS· )· · · · · · · · · · · · )· SS.·2· ·COUNTY OF COOK· · ·)
·3· · · · · IN THE CIRCUIT COURT OF COOK COUNTY, ILLINOIS·4· · · · · · COUNTY DEPARTMENT, CHANCERY DIVISION
·5· ·LEILA MENDEZ and ALONSO ZARAGOZA,· )· · · · · · · · · · · · · · · · · · · · )·6· · · · · · · · · · Plaintiffs,· · · ·)· · · · · · · · · · · · · · · · · · · · )·7· · · · · vs.· · · · · · · · · · · · ·)· No. 16 CH 15489· · · · · · · · · · · · · · · · · · · · )·8· ·CITY OF CHICAGO, et al.,· · · · · ·)· · · · · · · · · · · · · · · · · · · · )·9· · · · · · · · · · Defendants.· · · ·)
10
11· · · · · · · The deposition of BRYAN ESENBERG taken
12· ·before Jennifer Vravis, Registered Professional
13· ·Reporter and Notary Public, taken pursuant to the
14· ·provisions of the Illinois Code of Civil Procedure and
15· ·the Rules of the Supreme Court thereof pertaining to
16· ·the taking of depositions for the purpose of discovery
17· ·at 30 North LaSalle Street, Suite 1020, Chicago,
18· ·Illinois, commencing at 1:18 p.m. on the 30th day of
19· ·April, A.D., 2019.
20
21
22
23
24
FILE
D D
ATE:
6/2
1/20
19 6
:51
PM
2016
CH
1548
9
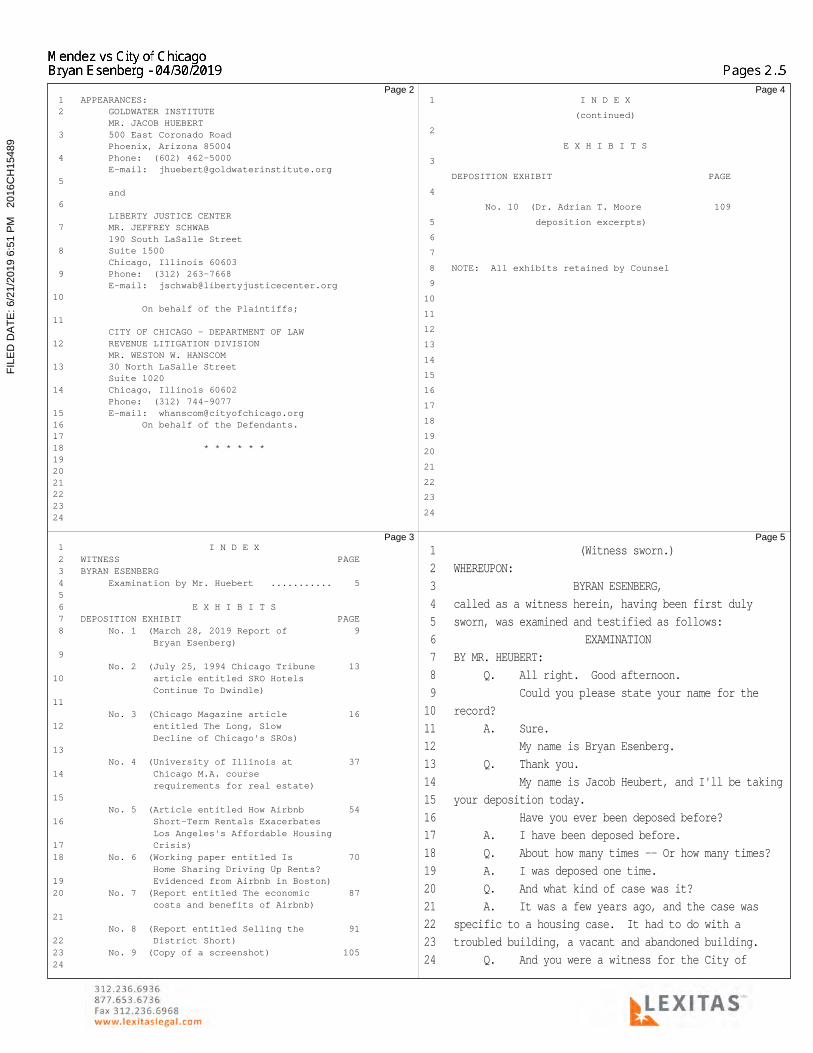
Page 2·1· ·APPEARANCES:·2· · · · GOLDWATER INSTITUTE· · · · · MR. JACOB HUEBERT·3· · · · 500 East Coronado Road· · · · · Phoenix, Arizona 85004·4· · · · Phone:· (602) 462-5000· · · · · E-mail:· [email protected]·5· · · · · and·6· · · · · LIBERTY JUSTICE CENTER·7· · · · MR. JEFFREY SCHWAB· · · · · 190 South LaSalle Street·8· · · · Suite 1500· · · · · Chicago, Illinois 60603·9· · · · Phone:· (312) 263-7668· · · · · E-mail:· [email protected]· · · · · · · · On behalf of the Plaintiffs;11· · · · · CITY OF CHICAGO - DEPARTMENT OF LAW12· · · · REVENUE LITIGATION DIVISION· · · · · MR. WESTON W. HANSCOM13· · · · 30 North LaSalle Street· · · · · Suite 102014· · · · Chicago, Illinois 60602· · · · · Phone:· (312) 744-907715· · · · E-mail:· [email protected]· · · · · · · On behalf of the Defendants.1718· · · · · · · · · · · · ·* * * * * *192021222324
Page 3·1· · · · · · · · · · · · · I N D E X·2· ·WITNESS· · · · · · · · · · · · · · · · · · · ·PAGE·3· ·BYRAN ESENBERG·4· · · · Examination by Mr. Huebert· ·...........· · 5·5·6· · · · · · · · · · · ·E X H I B I T S·7· ·DEPOSITION EXHIBIT· · · · · · · · · · · · · · PAGE·8· · · · No. 1· (March 28, 2019 Report of· · · · · · 9· · · · · · · · · Bryan Esenberg)·9· · · · · No. 2· (July 25, 1994 Chicago Tribune· · · 1310· · · · · · · · article entitled SRO Hotels· · · · · · · · · Continue To Dwindle)11· · · · · No. 3· (Chicago Magazine article· · · · · ·1612· · · · · · · · entitled The Long, Slow· · · · · · · · · Decline of Chicago's SROs)13· · · · · No. 4· (University of Illinois at· · · · · 3714· · · · · · · · Chicago M.A. course· · · · · · · · · requirements for real estate)15· · · · · No. 5· (Article entitled How Airbnb· · · · 5416· · · · · · · · Short-Term Rentals Exacerbates· · · · · · · · · Los Angeles's Affordable Housing17· · · · · · · · Crisis)18· · · · No. 6· (Working paper entitled Is· · · · · 70· · · · · · · · · Home Sharing Driving Up Rents?19· · · · · · · · Evidenced from Airbnb in Boston)20· · · · No. 7· (Report entitled The economic· · · ·87· · · · · · · · · costs and benefits of Airbnb)21· · · · · No. 8· (Report entitled Selling the· · · · 9122· · · · · · · · District Short)23· · · · No. 9· (Copy of a screenshot)· · · · · · ·10524
Page 4·1· · · · · · · · · · · · · I N D E X
· · · · · · · · · · · · · ·(continued)
·2
· · · · · · · · · · · · ·E X H I B I T S
·3
· · ·DEPOSITION EXHIBIT· · · · · · · · · · · · · · PAGE
·4
· · · · · ·No. 10· (Dr. Adrian T. Moore· · · · · · ·109
·5· · · · · · · · · deposition excerpts)
·6
·7
·8· ·NOTE:· All exhibits retained by Counsel
·9
10
11
12
13
14
15
16
17
18
19
20
21
22
23
24
Page 5
·1· · · · · · · · · · · · (Witness sworn.)·2· ·WHEREUPON:·3· · · · · · · · · · · ·BYRAN ESENBERG,·4· ·called as a witness herein, having been first duly·5· ·sworn, was examined and testified as follows:·6· · · · · · · · · · · · ·EXAMINATION·7· ·BY MR. HEUBERT:·8· · · · Q.· · All right.· Good afternoon.·9· · · · · · · Could you please state your name for the10· ·record?11· · · · A.· · Sure.12· · · · · · · My name is Bryan Esenberg.13· · · · Q.· · Thank you.14· · · · · · · My name is Jacob Heubert, and I'll be taking15· ·your deposition today.16· · · · · · · Have you ever been deposed before?17· · · · A.· · I have been deposed before.18· · · · Q.· · About how many times -- Or how many times?19· · · · A.· · I was deposed one time.20· · · · Q.· · And what kind of case was it?21· · · · A.· · It was a few years ago, and the case was22· ·specific to a housing case.· It had to do with a23· ·troubled building, a vacant and abandoned building.24· · · · Q.· · And you were a witness for the City of
FILE
D D
ATE:
6/2
1/20
19 6
:51
PM
2016
CH
1548
9
Page 6
·1· ·Chicago in that case?·2· · · · A.· · Correct.·3· · · · Q.· · Were you an expert witness in that case?·4· · · · A.· · I was not.·5· · · · Q.· · So you were -- you were a fact witness who·6· ·testified as to things that you happened to know·7· ·because of your job?·8· · · · A.· · Correct.·9· · · · Q.· · Okay.· I'm going to ask you a series of10· ·questions as you know since you've done this.· You're11· ·required to answer them fully, accurately, and to the12· ·best of your ability.· Okay?13· · · · A.· · Correct.14· · · · Q.· · A deposition, as you know, is not like a15· ·normal conversation.· The court reporter is going to be16· ·taking down everything we say so we have to be careful17· ·not to talk over each other.· Okay?18· · · · A.· · Okay.19· · · · Q.· · When you answer my questions you have to20· ·answer audibly and clearly so the court reporter can21· ·take down what you say.22· · · · · · · So, for example, if your answer to a23· ·question is a yes or no you can't just nod or shake24· ·your head or such, but you have to actually say yes or
Page 7
·1· ·no.· Okay?·2· · · · A.· · Understood.·3· · · · Q.· · If at any time you don't understand my·4· ·question or need me to repeat it for any reason you'll·5· ·let me know.· Okay?·6· · · · A.· · Okay.·7· · · · Q.· · And otherwise when I ask you a question I'll·8· ·assume that you understood it and that you answered it·9· ·fully, accurately, and to the best of your ability.10· ·Okay?11· · · · A.· · Okay.12· · · · Q.· · If you need to take a break at any time we13· ·can do that.· If there's a question that's pending I'll14· ·ask you to answer the question that's out there, but15· ·once that's done you can ask for a break and we can do16· ·that.· Okay?17· · · · A.· · Okay.18· · · · Q.· · Have you talked to or otherwise communicated19· ·with anyone about your deposition?20· · · · A.· · I have communicated with the Department of21· ·Law.22· · · · Q.· · And who did you communicate with?23· · · · A.· · So specifically Wes Hanscom and24· ·Rueben (phonetic).
Page 8
·1· · · · Q.· · And when did you communicate with them about·2· ·that?·3· · · · A.· · So we discussed today briefly in terms of·4· ·the rules for discussion -- or deposition.· We met I·5· ·believe yesterday or two days ago as well just to kind·6· ·of go through -- actually it was last week, I·7· ·apologize -- similar exercise, and then otherwise we·8· ·had talked about some of the exhibits in the past.·9· · · · Q.· · Did you review any documents to prepare for10· ·this deposition?11· · · · A.· · I did.· I did read the exhibits.12· · · · Q.· · And so which exhibits?13· · · · A.· · I believe there was a number of exhibits.14· · · · Q.· · Do you mean the exhibits to your expert15· ·report or the exhibits to the other expert report in16· ·this case?17· · · · A.· · So I -- I'm not sure what the answer would18· ·be.· I've definitely read a number of reports that19· ·were -- I read all the reports that were cited in my20· ·expert report, and I believe a number of those had been21· ·provided or cited by the other expert.22· · · · MR. HEUBERT:· Okay.· I'm going to ask the court23· ·reporter to mark this document here as Exhibit 1.24
Page 9
·1· · · · · · · · · · · · (Deposition Exhibit No. 1·2· · · · · · · · · · · · ·marked as requested.)·3· · · · · · · · · · · · (Discussion off the record.)·4· ·BY MR. HEUBERT:·5· · · · Q.· · Okay.· So you've been handed Exhibit 1.·6· · · · · · · Is this the expert report you prepared in·7· ·connection with this case minus the exhibits that were·8· ·attached to it?·9· · · · A.· · It appears to be that.· Yes.10· · · · Q.· · Could you, please, turn to page 7 of the11· ·report?12· · · · A.· · Sure.13· · · · Q.· · Wait.· I may have said the wrong number so14· ·just a second here.15· · · · · · · I meant page 4 -- I didn't mean page 4. I16· ·meant page 7.· I apologize for my confusion.17· · · · A.· · Okay.18· · · · Q.· · Okay.· So in the first paragraph on this19· ·page you reference a building in the Logan Square20· ·neighborhood of Chicago, correct?21· · · · A.· · Correct.22· · · · Q.· · Rents have risen a lot in Logan Square in23· ·recent years, haven't they?24· · · · A.· · Yes.
FILE
D D
ATE:
6/2
1/20
19 6
:51
PM
2016
CH
1548
9

Page 10
·1· · · · Q.· · Do you have a sense of how much they've·2· ·risen?·3· · · · A.· · I do not.·4· · · · Q.· · Do you have a sense of when they started to·5· ·rise dramatically?·6· · · · A.· · I do not.·7· · · · Q.· · Do you have -- Why do you think rents have·8· ·risen so much in Logan Square?·9· · · · A.· · I don't know why rents have risen10· ·specifically in Logan Square, but there are a number of11· ·factors of rents increasing throughout the city.12· · · · Q.· · And what would some of those factors be?13· · · · A.· · I mean definitely demand issues,14· ·homeownership issues, issues around location15· ·preferencing, and issues around supply and the16· ·production of supply.17· · · · Q.· · And when you say demand issues what do you18· ·mean?19· · · · A.· · So I think in some estimate we're getting20· ·increasing numbers of people hoping to move into the21· ·city in specific neighborhoods that are becoming22· ·popular like Logan Square.23· · · · Q.· · And when you say supply issues what do you24· ·mean?
Page 11
·1· · · · A.· · So supply issues in that the supply issues·2· ·are basically real estate supply and demand concerns in·3· ·that there are a number of available units for rental,·4· ·how many of those are being converted over to·5· ·homeownership, how many of those are being taken·6· ·offline and out of the market.·7· · · · Q.· · There's at least one other factor that you·8· ·mentioned besides demand issues and supply issues.·9· · · · · · · Do you recall what that was?10· · · · A.· · Other than location preferences?11· · · · Q.· · Oh, okay.12· · · · · · · And do location preferences tie into what I13· ·already said about demand issues with just people14· ·prefer to live there --15· · · · A.· · Yeah.· I think location is a function of16· ·demand.17· · · · Q.· · So because of the rising rents in Logan18· ·Square people are concerned about a lack of affordable19· ·housing there, aren't they?20· · · · A.· · It seems to be a problem for a lot of people21· ·right now.22· · · · Q.· · So is there a lack of affordable housing23· ·there in Logan Square?24· · · · A.· · I do not know.
Page 12
·1· · · · Q.· · Looking again at this paragraph on page 7 of·2· ·your report you reference single-room occupancy hotel·3· ·or SRO.·4· · · · · · · Can you explain what that is?·5· · · · A.· · Sure.·6· · · · · · · Single-room occupancy is a zoning·7· ·classification for a type of hotel or living situation·8· ·that is predominately for low-income or formerly·9· ·homeless or currently homeless individuals.· The10· ·difference between that and a traditional rental11· ·situation is that you rent a room that may be not a12· ·complete unit.· So it may actually just be a room with13· ·a shared bathroom facility and that the leasing terms14· ·are much more flexible all the way to the night or the15· ·week.16· · · · Q.· · Do you know how many SRO buildings are17· ·operating in Chicago now?18· · · · A.· · I do not know how many are operating19· ·currently, but it is definitely a concern to the City20· ·so the City has an SRO preservation ordinance to21· ·maintain as many of them as possible.22· · · · Q.· · Do you have a ballpark figure of how many23· ·there are?24· · · · A.· · I do not.
Page 13
·1· · · · Q.· · Do you know how many SRO units are being·2· ·rented or are available for rent in Chicago now?·3· · · · A.· · I do not know.·4· · · · Q.· · Do you have any sense of the ballpark of·5· ·that?·6· · · · A.· · I do not.·7· · · · Q.· · Okay.· But one thing you could say for sure·8· ·is Chicago used to have a lot more SROs than it has·9· ·now; is that fair to say?10· · · · A.· · So one thing I can say for sure is that over11· ·the last five to ten years there's been an increasing12· ·effort with the City to preserve what is left of the13· ·SROs and we have an ordinance to help us do that.14· · · · Q.· · But before five or ten years ago, decades15· ·ago, there were a lot more SROs than there are now?16· · · · A.· · I do not know.17· · · · Q.· · Okay.· I'm going to hand you Exhibit -- Or18· ·I'm going to ask the court reporter to mark another19· ·exhibit here.· This will be Exhibit 2.20· · · · · · · · · · · · (Deposition Exhibit No. 221· · · · · · · · · · · · ·marked as requested.)22· ·BY MR. HEUBERT:23· · · · Q.· · Okay.· Do you see that this appears to be a24· ·Chicago Tribune article called SRO Hotels Continue To
FILE
D D
ATE:
6/2
1/20
19 6
:51
PM
2016
CH
1548
9
Page 14
·1· ·Dwindle from 1994?·2· · · · A.· · It appears to be that.· That's true.·3· · · · Q.· · If you turn to the second page, please, and·4· ·look at the -- Just a second --·5· · · · · · · · · · · · (Brief pause.)·6· ·BY MR. HEUBERT:·7· · · · Q.· · -- second page there's a paragraph that·8· ·begins from 1973 to 1994.·9· · · · · · · Do you see that paragraph?10· · · · A.· · I do.11· · · · Q.· · And you say it says during that time period12· ·SRO housing fell from 52,130 units to 13,554 units.13· · · · · · · Do you know whether those figures are14· ·correct?15· · · · A.· · I do not.16· · · · Q.· · Do they seem about right to you?17· · · · A.· · I have no context to make that answer.18· · · · Q.· · Okay.· Do you know whether that would at19· ·least reflect the general trend of the decline during20· ·that time period?21· · · · A.· · I really do not know.22· · · · Q.· · Do you see there's a paragraph that begins23· ·the report by the non-for-profit Lakefront SRO Corp.?24· · · · A.· · Uh-huh.
Page 15
·1· · · · Q.· · Have you heard of that organization?·2· · · · A.· · I did.· They're -- They're now called Mercy·3· ·of Lakefront.·4· · · · Q.· · Okay.· Would you consider it to be reputable·5· ·and reliable when it comes to this sort of information?·6· · · · A.· · You'd have to define this sort of·7· ·information.·8· · · · Q.· · Well, would it -- information about the·9· ·number of SRO units available in the city.10· · · · A.· · I think they're a great, qualified,11· ·affordable housing developer.· I do not know if they're12· ·qualified to report on SROs for the city of Chicago.13· · · · Q.· · Okay.· And then there's a paragraph that14· ·begins with the words the loss of this affordable15· ·housing.16· · · · · · · Do you see that paragraph?17· · · · A.· · I do.18· · · · Q.· · And then later in that paragraph it says19· ·nearly 70 percent of the SROs in the West Loop have20· ·been demolished since 1985.21· · · · · · · Do you know whether that was correct as of22· ·that time?23· · · · A.· · I do not know.24· · · · Q.· · I'm going to ask the court reporter to mark
Page 16
·1· ·another exhibit here, and then I'm going to hand it to·2· ·you.·3· · · · · · · · · · · · (Deposition Exhibit No. 3·4· · · · · · · · · · · · ·marked as requested.)·5· ·BY MR. HEUBERT:·6· · · · Q.· · Do you see that this is an article --·7· ·appears to be an article from Chicago Magazine called·8· ·The Long, Slow Decline of Chicago's SROs?·9· · · · A.· · It does appear to be that.10· · · · Q.· · Oh, I'm sorry (tendering).11· · · · · · · Okay.· And you see there's sort of a block12· ·quote there that starts on the first page, and at the13· ·bottom of the page it says -- continuing on to the14· ·second page it says "But on the whole, the number of15· ·SROs in Chicago has declined noticeably in the last16· ·five years.· In 2008 there were 106 licensed SROs.17· ·Today, there are 81."18· · · · · · · It starts in 2008.· Today means five years19· ·later in 2013.20· · · · · · · Do you know if that information is correct?21· · · · A.· · I do not know if it's correct.22· · · · Q.· · Is it consistent with what you understand to23· ·be the general trend during that time period for SROs24· ·in Chicago?
Page 17
·1· · · · A.· · I don't know about that time period, but·2· ·there's a general trend in Uptown that SROs are being·3· ·privatized which is why the City has an ordinance to·4· ·preserve SROs.·5· · · · Q.· · On page 4 of the next to last paragraph do·6· ·you see that it says in 1986 the Tribune reported that·7· ·the city had lost 17,000 SROs units since 1976,·8· ·including 3,000 alone in the West Loop space that now·9· ·houses the Presidential Towers?10· · · · · · · Do you know whether any of those numbers are11· ·correct?12· · · · A.· · I do not.13· · · · Q.· · Do you know if they're consistent with the14· ·general trend in Chicago between 1976 and 1986?15· · · · A.· · I do not.16· · · · Q.· · Do you know those numbers to be incorrect?17· · · · A.· · I do not know them to be incorrect.18· · · · Q.· · And is that also true of the other numbers19· ·regarding the number of SRO units I've given you don't20· ·know them to be either correct or incorrect?21· · · · A.· · That would be true.22· · · · Q.· · We may have already covered this, but is it23· ·fair to say that in recent decades there has been an24· ·overall decline in the number of SRO buildings in the
FILE
D D
ATE:
6/2
1/20
19 6
:51
PM
2016
CH
1548
9

Page 18
·1· ·city of Chicago?·2· · · · A.· · I don't know about recent decades.·3· · · · Q.· · Is there a time period up to the present·4· ·when you know there has been a decline in the number of·5· ·SROs in Chicago?·6· · · · A.· · So SROs in general are grandfathered in·7· ·their zoning so they're existing buildings and as they·8· ·age often there's -- there is a lot of private·9· ·development interest in purchasing those buildings10· ·often because of the location and so what we've done in11· ·the city is create a preservation ordinance to begin to12· ·preserve affordability with those SROs as long as13· ·possible.14· · · · Q.· · Okay.· And the ordinance was considered15· ·necessary because without it more of these buildings16· ·would be put toward uses other than SROs as they age17· ·and developers want to put them toward some other18· ·purpose that they would consider to be more profitable?19· · · · A.· · That would be fair.20· · · · Q.· · Okay.· The SRO ordinance you've referenced21· ·that was enacted in 2014; is that right?22· · · · A.· · I believe that's correct.23· · · · Q.· · Do you know how many SRO buildings the city24· ·had at that time?
Page 19
·1· · · · A.· · The City owned those buildings or existed?·2· · · · Q.· · That were in the city at that time.·3· · · · A.· · I do not know.·4· · · · Q.· · Do you know how many SRO units were in the·5· ·city at that time?·6· · · · A.· · I do not.·7· · · · Q.· · So I'm going to tell you my understanding of·8· ·certain provisions of this SRO ordinance, and you can·9· ·then -- and I'll stop and ask you at different points10· ·if my understanding is correct and if that's not how it11· ·works you can correct me.12· · · · · · · Now, my understanding of the SRO ordinance13· ·is that if somebody owns an SRO building and wants to14· ·sell it they have two choices.· One choice would be to15· ·pay the City a preservation fee of $20,000 per unit in16· ·that building and if they do that they can sell the17· ·building right away basically to anybody with no18· ·special restrictions on the future use of the building.19· · · · · · · Is that one of the options?20· · · · A.· · I believe that's correct.21· · · · Q.· · Okay.· And then my understanding of the22· ·other choice is that if you want to sell your building23· ·you give the City notice and then you have to wait24· ·180 days to see if any offers to buy the property come
Page 20
·1· ·in from anybody who wants to maintain the property as·2· ·affordable housing; is that right so far?·3· · · · A.· · I believe that's correct.·4· · · · Q.· · And if someone who wants to keep the·5· ·property as affordable housing makes an offer within·6· ·that 180-day period the owner then has to negotiate in·7· ·good faith with that would-be buyer for the rest of the·8· ·180-day period; is that right?·9· · · · A.· · They don't have to negotiate for the rest of10· ·the 180-day period.· No, that's not correct.· But they11· ·can use that 180 days to negotiate.12· · · · Q.· · I see.13· · · · · · · But -- Okay.· Are you saying they don't have14· ·to negotiate at all?15· · · · A.· · It depends on the buyer and the seller.16· · · · Q.· · Okay.· And then if that -- that buyer who17· ·wants to use the building for affordable housing and18· ·the seller reach an agreement they have to enter a19· ·contract where the buyer has to maintain the property20· ·as affordable housing for 15 years; is that right?21· · · · A.· · I don't know if the ordinance specifies it22· ·exactly but that would be the intention.23· · · · Q.· · Now, if an owner and a would-be buyer engage24· ·in negotiations during that 180-day period and don't
Page 21
·1· ·reach a deal then my understanding is the owner has·2· ·120 days in which he or she can sell the building to·3· ·anyone; is that correct?·4· · · · A.· · I believe that's correct.·5· · · · Q.· · And then if the owner doesn't sell it within·6· ·that 120-day period the owner has to go back basically·7· ·to square one and start the whole process over with·8· ·another 180-day period; is that correct?·9· · · · A.· · I believe that's correct.10· · · · Q.· · Okay.· Now, in addition to all that there11· ·are anti-displacement and relocation requirements that12· ·somebody who sells an SRO has to comply with; is that13· ·right?14· · · · A.· · That is correct.15· · · · Q.· · Okay.· And one of those requirements is if16· ·an SRO is going to displace residents but there will be17· ·some new affordable housing units in the new building,18· ·whether that's an actual new building or renovated19· ·building, they have to be invited back except if there20· ·isn't room for all of them then there's a lottery to21· ·decide who gets to be invited back; is that correct?22· · · · A.· · I believe that's correct.23· · · · Q.· · And if a conversion or construction makes an24· ·SRO building temporarily uninhabitable then the owner
FILE
D D
ATE:
6/2
1/20
19 6
:51
PM
2016
CH
1548
9

Page 22
·1· ·has to arrange for comparable temporary accommodations,·2· ·including moving expenses, for those temporarily·3· ·displaced tenants; is that your understanding?·4· · · · A.· · I don't know if that's 100 percent correct.·5· · · · Q.· · Is there something in particular you think·6· ·might have been incorrect?·7· · · · A.· · I'm not sure about the responsibility of·8· ·the -- of the developer to house all the individuals·9· ·temporarily, but there is a need to provide relocation10· ·assistance.11· · · · Q.· · If an SRO resident is displaced because a12· ·building is sold, converted, or demolished then the13· ·owner or purchaser has to pay that person the greater14· ·of $2,000 or three months' rent -- and that 2,000 might15· ·be adjustable for inflation.· I'm not sure about16· ·that -- does that sound right?17· · · · A.· · It sounds -- It sounds correct, but I'd have18· ·to verify it.19· · · · Q.· · And if an SRO owner takes the option to pay20· ·the preservation fee, paying that $20,000 a unit to the21· ·City, instead of going through the 180-day period then22· ·the owner also has to pay an additional relocation fee23· ·to the tenant of $8600; is that consistent with your24· ·understanding?
Page 23
·1· · · · A.· · I'm not sure about the numbers, but the idea·2· ·seems to be somewhat consistent.·3· · · · Q.· · Okay.· Going back to your report, Exhibit 1,·4· ·on page 7 you refer to an SRO building -- or a former·5· ·SRO building at 2001 North California in Chicago.·6· · · · · · · Do you know what I'm talking about?·7· · · · A.· · I do.·8· · · · Q.· · It says in your report that this building·9· ·was recently converted into a building that will be10· ·reserved for short-term rentals.11· · · · · · · Do you recall that?12· · · · A.· · That's correct.13· · · · Q.· · Do you know whether this building was sold14· ·to a new owner who intends to -- or intended to convert15· ·it for short-term rental use or is it just being16· ·converted by the same owner who owned it before?17· · · · A.· · It's being sold to a new owner.18· · · · Q.· · Do you know if the original owner, you know,19· ·the first owner went through the 180-day process or20· ·paid the $20,000 a unit fee to the City?21· · · · A.· · So the owner went through the -- the latter22· ·process.· He did not pay the fee.· They went through23· ·the time line.24· · · · Q.· · And did they sell to somebody who would use
Page 24
·1· ·part of it for affordable housing or did they sell it·2· ·during that 120-day period where they're not restricted·3· ·in the new use of the building?·4· · · · A.· · They were sold to the 120-day period where·5· ·they're not restricted.·6· · · · Q.· · So nobody wanted to buy this building·7· ·apparently to use it for affordable housing?·8· · · · A.· · No.· I don't know that anybody came to a·9· ·consensus with the -- with the seller during the10· ·negotiation period so I couldn't say that honestly.11· · · · Q.· · How do you know the building -- Well, has12· ·the building been converted to use for short-term13· ·rentals yet, do you know?14· · · · A.· · So the current operator is in the process of15· ·pulling permits.· The new owner is in the process of16· ·permits.17· · · · Q.· · Okay.· So the sale is complete?18· · · · A.· · The sale is complete.19· · · · Q.· · Okay.· And how do you know it is being20· ·converted for use as short-term rentals?21· · · · A.· · So the new owner told us it's being22· ·converted for short-term rentals.23· · · · · · · This particular owner operates similar24· ·buildings and their leasing strategy is short-term
Page 25
·1· ·rentals.·2· · · · Q.· · And that's for the entire building?·3· · · · A.· · That is their strategy.· Yes.·4· · · · Q.· · Doesn't Chicago's home sharing ordinance·5· ·restrict the number of units in a building that can be·6· ·used for short-term rentals?·7· · · · A.· · I'm not an expert on that.·8· · · · Q.· · So you don't know -- Do you know whether·9· ·they're going to use all of the units for short-term10· ·rentals?11· · · · A.· · I do not know.12· · · · Q.· · Do you know how many units they're going to13· ·use for short-term rentals?14· · · · A.· · I do not know.15· · · · Q.· · Do you know whether it's more than one unit?16· · · · A.· · I believe it's more than one unit.17· · · · Q.· · Do you know whether it's more than two?18· · · · A.· · I do not know specifically.19· · · · Q.· · So is that no?20· · · · A.· · So I do not know if they're going to do more21· ·than one unit or more than two units.22· · · · · · · What I do know is they told me that their23· ·leasing strategy is to do short-term rentals.24· · · · Q.· · How many -- Do you know how many units will
FILE
D D
ATE:
6/2
1/20
19 6
:51
PM
2016
CH
1548
9

Page 26
·1· ·be in the converted building?·2· · · · A.· · I believe there is 24 units total.·3· · · · Q.· · And were residents of the building as an SRO·4· ·displaced as a result of this sale?·5· · · · A.· · Yes.·6· · · · Q.· · Do you know how many there were?·7· · · · A.· · I do not know.· We have that list, but I do·8· ·not know off the top of my head.·9· · · · Q.· · And those residents should have received10· ·whatever assistance the short-term rental ordinance11· ·calls for for the -- either the previous owner or the12· ·new owner to provide to them?13· · · · A.· · Correct.14· · · · Q.· · Did those residents also receive additional15· ·assistance from the City?16· · · · A.· · No -- Well, actually let me -- how would you17· ·define additional assistance?18· · · · · · · They did not receive any additional cash19· ·from us.20· · · · Q.· · Is there something else they received?21· · · · A.· · So I don't know, but I believe they may have22· ·been connected with like DFSS or support services to23· ·help in the relocation.24· · · · Q.· · What kind of services might DFSS have
Page 27
·1· ·provided to --·2· · · · A.· · DFSS focuses more on tenants specific or·3· ·human engagement services so they may have provided·4· ·options for housing or they may have provided options·5· ·for resources; but I'm not from the department, nor am·6· ·I very familiar with that.·7· · · · Q.· · If those people did go to DFSS do you know·8· ·whether that would impose additional costs on DFSS to·9· ·deal with those people?10· · · · A.· · Oh, I don't know.11· · · · Q.· · Do you know whether the displaced SRO12· ·residents found new lodging?13· · · · A.· · I do not.14· · · · Q.· · Do you know whether any of those displaced15· ·residents are now homeless?16· · · · A.· · I do not know.17· · · · Q.· · Do you know whether the building at18· ·2001 North California would still be operating as an19· ·SRO if the current owner weren't using it for20· ·short-term rentals?21· · · · A.· · Are you asking me if the current owner22· ·bought it would they maintain as an SRO?23· · · · Q.· · I'll try to rephrase the question.24· · · · · · · Is it your position that if the current
Page 28
·1· ·owner weren't using this building at least in part for·2· ·short-term rentals the building would still be in use·3· ·as an SRO?·4· · · · A.· · I do not know the intentions of the current·5· ·owner after they purchased the building, but I do know·6· ·that the short-term rental situation creates an issue·7· ·around long-term leasing that makes it difficult for us·8· ·to negotiate for any on-site affordability in addition·9· ·to what they're already doing because they are not10· ·maintaining leases.11· · · · Q.· · Who's not maintaining the leases?12· · · · A.· · The -- The current owner.· The new owner.13· · · · Q.· · Well, they might be having some long-term14· ·leases, right?15· · · · A.· · They may, but the description they provided16· ·to us is that they're going to lease using short-term17· ·rental strategies.18· · · · Q.· · Okay.· But again you don't know what19· ·percentage of the leases would be used for short-term20· ·versus long-term rentals?21· · · · A.· · I do not.22· · · · Q.· · If you're a landlord in Logan Square right23· ·now and you only care about making money then it would24· ·make sense to rent out your place at market rates for
Page 29
·1· ·long-term rentals rather than SRO rates if you had a·2· ·choice, right?·3· · · · MR. HANSCOM:· Object to the form but go ahead if·4· ·you can.·5· ·BY THE WITNESS:·6· · · · A.· · I mean I think that's part of the challenge,·7· ·correct, that we have an opportunity created through·8· ·short-term rentals that provides immediate cash to·9· ·investors and owners that may be greater than market10· ·rents and so there becomes an incentive to do those11· ·things unless you have to otherwise.12· · · · · · · So unless you were forced to maintain13· ·affordability that's probably unlikely they would14· ·maintain affordability.15· · · · Q.· · And that would be true whether we're talking16· ·about short-term rents or long-term rents, right, in a17· ·market like Logan Square where rents for everybody are18· ·increasing?19· · · · A.· · It depends on the ability of the property.20· ·If we have existing relationships with the building21· ·through zoning requirements or investments then it22· ·makes it less true.23· · · · Q.· · Can you explain what you mean a little bit24· ·more?
FILE
D D
ATE:
6/2
1/20
19 6
:51
PM
2016
CH
1548
9

Page 30
·1· · · · A.· · So if we were invested into a property then·2· ·they have an obligation to rent it affordably·3· ·regardless of the location.· So while they may have a·4· ·desire it doesn't mean they have an option.·5· · · · · · · So similar to an SRO they're granted a·6· ·certain zoning status based on their willingness to·7· ·rent affordably so maintaining that zoning status·8· ·moving forward is also a condition of renting it·9· ·affordably.10· · · · · · · So regardless of location it becomes kind of11· ·an ability to preserve affordability or protect12· ·affordability.13· · · · Q.· · You referenced the City being invested in a14· ·property.15· · · · · · · What do you mean by that?16· · · · A.· · So part of my role is to invest funds into17· ·buildings to create affordable options.18· · · · Q.· · So literally the City invests money in19· ·buildings?20· · · · A.· · Correct.21· · · · Q.· · And does it become a part owner or does that22· ·just place certain restrictions on the person who is23· ·the owner?24· · · · A.· · So we become a lienholder and it does put
Page 31
·1· ·restrictions on the owner and what they can do with·2· ·their tenancy.·3· · · · Q.· · Was that the case with this building in·4· ·Logan Square we were talking about?·5· · · · A.· · So in this building they had received --·6· ·they were conditioned on their zoning approval.· Their·7· ·zoning was grandfathered in as an SRO and so to·8· ·maintain that zoning you have to -- under the·9· ·definition of an SRO you have to maintain at least10· ·90 percent of the building as affordable.11· · · · Q.· · When they sold the building for a new use12· ·did they have to get a zoning change?13· · · · A.· · I think they intend to get a zoning change.14· · · · Q.· · Does their current zoning not allow them to15· ·do non-SRO rentals?16· · · · A.· · I do not believe their current zoning allows17· ·them to do non-SRO rentals because they're zoned as an18· ·SRO.19· · · · Q.· · And that's a unique, specific zoning20· ·designation for SROs?21· · · · A.· · Yes.22· · · · · · · SROs in general are units that are less than23· ·a certain square footage that we would consider to be24· ·not necessarily a habitable or unit size and SROs may
Page 32
·1· ·not have an individual bathroom or a kitchen which we·2· ·require for a particular unit, so SROs are frankly·3· ·grandfathered in.·4· · · · Q.· · So I think you said this but I want to make·5· ·sure I understand, your understanding is that this·6· ·building on North California cannot engage in any·7· ·short-term or long-term rentals until it gets a zoning·8· ·change?·9· · · · A.· · Unless it's going to continue to operate as10· ·an SRO.11· · · · Q.· · And does your office have to approve that12· ·zoning change?13· · · · A.· · My office does not.· The zoning office does.14· · · · Q.· · Does it have to go through the city council15· ·to get that change?16· · · · A.· · Yes -- Or I believe it goes through the17· ·zoning board of appeals.· I'm not sure if that18· ·qualifies as city council.19· · · · Q.· · Your job title is deputy commissioner in the20· ·City of Chicago's Department of Housing; is that21· ·correct?22· · · · A.· · That is correct.23· · · · Q.· · How long have you had that job?24· · · · A.· · So I've been with the deputy commissioner
Page 33
·1· ·now since I believe 2017.· July of 2017, I believe.·2· · · · Q.· · Okay.· And I see on page 1 of your report·3· ·here underneath where it says deputy commissioner·4· ·there's a number of bullet points.· The first one says·5· ·oversee the City's investment in multifamily,·6· ·affordable housing and housing preservation programs.·7· · · · · · · Could you elaborate on what that means?·8· · · · A.· · Sure.·9· · · · · · · So what I do is I oversee a number of10· ·resources and programs that allow us to invest funds in11· ·new construction and rehab and ultimate preservation of12· ·affordability throughout the city.13· · · · Q.· · And could you explain what the next bullet14· ·point means?15· · · · A.· · So the next bullet point says direct the16· ·planning and coordination of multifamily financing17· ·tools to include tax credits, bond cap, TIF and HUD18· ·funding totaling over $100 million annual and what that19· ·means is I have a 100-million-dollar annual budget that20· ·includes loan composing; tax credits; bond cap; TIF,21· ·which is a funding source; and other HUD funds which22· ·often are CDBG and home.23· · · · Q.· · And these are funds you can deploy to invest24· ·in properties in the way you were telling me about
FILE
D D
ATE:
6/2
1/20
19 6
:51
PM
2016
CH
1548
9
Page 34
·1· ·earlier?·2· · · · A.· · Yes.·3· · · · Q.· · Okay.· The next bullet says provide·4· ·day-to-day management for the underwriting team and act·5· ·as the division liaison for interdepartmental·6· ·coordination.·7· · · · · · · Could you elaborate on what that means?·8· · · · A.· · Sure.·9· · · · · · · So I have a team of underwriters who look at10· ·every deal and work with the developers for -- to11· ·ensure our investment is meeting the qualification of12· ·underwriting criteria that we've established and then13· ·my role is also to be the liaison with all the other14· ·departments that are involved in these activities.· So15· ·in the event if there's a zoning action I would meet16· ·with a zoning officer.17· · · · Q.· · And then finally the next bullet point18· ·begins represent the division in strategic planning19· ·sessions.20· · · · · · · Can you elaborate on that one?21· · · · A.· · Sure.22· · · · · · · So the bullet says represent the division in23· ·strategic planning sessions for new funding sources,24· ·bonus programs, and pilot programs to increase
Page 35
·1· ·affordable housing opportunities and improve·2· ·neighborhoods.· So the role of the department is to·3· ·increase affordable housing throughout the city and to·4· ·improve neighborhoods of disinvestment.·5· · · · · · · What I often do is provide kind of that·6· ·affordable housing standpoint in those scenarios in·7· ·conversations and I use my expertise of having managed·8· ·these programs for a number of years to talk about what·9· ·works, what doesn't work, and what are some new ways we10· ·can generate affordable housing.11· · · · Q.· · Underneath that the report indicates that12· ·you were an assistant commissioner for housing13· ·preservation in the City of Chicago Department of14· ·Planning and Development.15· · · · · · · Could you describe your duties in that job?16· · · · A.· · Sure.17· · · · · · · So -- So at that point I was managing many18· ·more of the programs and so technically I oversee that19· ·division at this point.· I'm supervising the now20· ·A.C. of that position, but the role was much more21· ·engaged on neighborhood development activities, vacant22· ·and abandoned buildings, and working with community23· ·groups to help redevelop the neighborhood and create24· ·affordable housing opportunities.
Page 36
·1· · · · Q.· · The next item listed there on page 2 of·2· ·Exhibit 1 it says you were a real estate manager for·3· ·NHS Redevelopment Corporation.·4· · · · · · · Could you describe your duties in that job?·5· · · · A.· · Sure.·6· · · · · · · So NHS Redevelopment Corporation is a·7· ·nonprofit affordable housing developer and my role was·8· ·to oversee their real estate activities, which was·9· ·anything from managing their bank and availability10· ·programs to helping develop affordable housing, and a11· ·lot of the programs that I worked on actually became12· ·programs that I managed when I became assistant13· ·commissioner.14· · · · Q.· · I see in your report that you received a15· ·bachelor's degree in economics from Indiana University16· ·in 1998; is that correct?17· · · · A.· · That's correct.18· · · · Q.· · Did you have to write an undergraduate19· ·thesis?20· · · · A.· · I did not.21· · · · Q.· · As an undergraduate did you do any research22· ·regarding the housing market?23· · · · A.· · I did not.24· · · · Q.· · Did you graduate with honors?
Page 37
·1· · · · A.· · I did not.·2· · · · Q.· · I see also that you received a master's·3· ·degree in real estate from the University of Illinois·4· ·Chicago in 2006; is that correct?·5· · · · A.· · That's correct.·6· · · · Q.· · What is a master's degree in real estate?·7· · · · A.· · A master's in real estate particularly at·8· ·UIC is the combination of what is their urban planning·9· ·program and their MBA program, and so while if you had10· ·a master's in economics you would take 16 courses11· ·dedicated to economics.12· · · · · · · My classwork is specific to real estate, but13· ·it was all engaged in -- it was specific to real estate14· ·finance, real estate economics, and real estate theory.15· · · · Q.· · Do you have a sense of what people who get16· ·that degree use it for?17· · · · A.· · I do not.18· · · · Q.· · Did you write a master's thesis?19· · · · A.· · I did not.20· · · · MR. HEUBERT:· I'm going to hand the court reporter21· ·another exhibit.22· · · · · · · · · · · · (Deposition Exhibit No. 423· · · · · · · · · · · · ·marked as requested.)24
FILE
D D
ATE:
6/2
1/20
19 6
:51
PM
2016
CH
1548
9
Page 38
·1· ·BY MR. HEUBERT:·2· · · · Q.· · Do you recognize this?·3· · · · A.· · I do not.·4· · · · Q.· · Okay.· Do you see that it's a list of course·5· ·requirements for people who receive an M.A. in real·6· ·estate at University of Illinois Chicago?·7· · · · · · · Is that what it appears to be?·8· · · · A.· · If that's what you're telling me it appears·9· ·to be sure.10· · · · Q.· · Well, you see there's the URL there with11· ·uic.edu and it kind of spells that out.12· · · · · · · Were these the requirements for that degree13· ·at the time that you received it?14· · · · MR. HANSCOM:· The first part says admission15· ·requirements, but then you're referencing the degree16· ·requirements?17· · · · MR. HEUBERT:· Yeah.· In fact, yeah, I -- we can18· ·focus on the degree requirements.19· ·BY THE WITNESS:20· · · · A.· · So on page 1 the degree requirements I21· ·believe that's accurate.22· · · · · · · On page 2 I definitely recall a number of23· ·these classes.· I don't know if all of the classes were24· ·required at the time.· I'm not sure if this is saying
Page 39
·1· ·all of the classes are required now.·2· · · · Q.· · Do you recall which of these classes you·3· ·took?·4· · · · A.· · I do recall a number of the classes.· Yes.·5· · · · Q.· · Can you tell me which ones of these you·6· ·recall taking?·7· · · · A.· · So I recall Real Estate Finance,·8· ·Econ/Finance 472; Finance 500, Introduction to·9· ·Corporate Finance; Urban Space, Place and Institutions,10· ·UPP 501; Land Use Law, UPP 553.· Professional Topics11· ·was a topic class so I do remember taking it, but the12· ·topics changed.13· · · · · · · Areas of concentration minor in14· ·concentration was urban planning.· I remember taking15· ·UPP 533, Development Finance Analysis.16· · · · · · · I do not recall the other classes.17· · · · Q.· · Anything you learned in the real estate18· ·finance class inform the opinions you offered in your19· ·report in this case?20· · · · A.· · Yeah.· I think the opinions I offer in my21· ·report were pretty simple in terms of the supply of22· ·law.· I mean, you know, it's supply and demand, and so23· ·I'm sure corporate finance had some assistance but24· ·that's generally around net present values and the cost
Page 40
·1· ·of dollars.· I think more specifically it starts with·2· ·an understanding of economics as an undergraduate·3· ·working throughout my career.·4· · · · Q.· · Were you talking about real estate finance·5· ·or introduction to corporate finance?·6· · · · A.· · I think you asked me about introduction to·7· ·corporate finance.·8· · · · Q.· · Okay.· How about real estate finance?·9· · · · A.· · Real estate finance still is also it's --10· ·The difference between finance and economics is finance11· ·is really focused on the dollars and what's the cost of12· ·a dollar and how does that value over time and so it's13· ·really an understanding of that functionality.14· · · · · · · So supply and demand issues, which is our15· ·concern, is really more of an economics concern.16· · · · Q.· · Okay.· So the finance courses you're saying17· ·are not especially relevant to the opinions you've18· ·offered in this case?19· · · · A.· · I would say that.· Yes.20· · · · Q.· · What about the urban space, place, and21· ·institutions course?22· · · · A.· · I would say yes.23· · · · Q.· · Yes what?24· · · · A.· · Yes, it is relevant.
Page 41
·1· · · · Q.· · Okay.· Can you explain how?·2· · · · A.· · So drawing back on my memory of urban space,·3· ·place, and institutions really talks about location and·4· ·spaces of location and how neighborhoods blend together·5· ·or work together and what those neighborhoods do to·6· ·build up into a community or a city and so it begins to·7· ·the lay the groundwork for planning as a -- as a·8· ·theory.·9· · · · Q.· · And how does that relate to the opinions you10· ·offered in this case?11· · · · A.· · So understanding particularly how the city12· ·works across each of the neighborhoods realistically13· ·and there was a number of references to the cascading14· ·effects of rent changes and I think that plays directly15· ·to that.16· · · · Q.· · Did anything in the course address the17· ·effects the short-term rentals in the housing market?18· · · · A.· · I do not believe short-term rentals existed19· ·when I went to graduate school.20· · · · Q.· · Did anything in the course address the21· ·effects of increased long-term rents on homelessness?22· · · · A.· · I don't believe it went into homelessness at23· ·all.24· · · · Q.· · On the -- Excuse me.
FILE
D D
ATE:
6/2
1/20
19 6
:51
PM
2016
CH
1548
9

Page 42
·1· · · · · · · How about the land use law course did that·2· ·cover things that you applied in forming your opinions·3· ·in this case?·4· · · · A.· · It may have.· Land use law is a foundational·5· ·theory of real estate law so it may have had some·6· ·implications, but I can't remember directly what those·7· ·would have been.·8· · · · Q.· · And you mentioned the professional topics·9· ·course could be various topics.10· · · · · · · Do you recall what the topic of your11· ·professional topics course was?12· · · · A.· · Not specifically, but it had to do with the13· ·development analysis.14· · · · Q.· · Is there anything in that that you think15· ·is -- that you applied in forming your opinions in this16· ·case?17· · · · A.· · I do not recall.18· · · · Q.· · Going down to the development finance19· ·analysis course is there anything covered in that20· ·course that you applied in forming your opinions in21· ·this case?22· · · · A.· · I do not recall.· I believe this case --23· ·this class was much more specific to finance.24· · · · Q.· · Do you have any academic degrees that aren't
Page 43
·1· ·listed on your report?·2· · · · A.· · I do not.·3· · · · Q.· · Have you ever published anything in any·4· ·academic journals?·5· · · · A.· · I have not.·6· · · · Q.· · Have you ever published articles anywhere·7· ·else?·8· · · · A.· · Academic articles, no.· But I have been·9· ·featured in articles, but I've not written any10· ·articles.· No.11· · · · Q.· · Okay.· When you say featured in articles you12· ·mean quoted or --13· · · · A.· · Quoted or asked for, yes.14· · · · Q.· · Do you have any experience performing an15· ·econometric analysis?16· · · · A.· · I do not.17· · · · Q.· · Do you have any experience in performing18· ·statistical analysis?19· · · · A.· · I do not.20· · · · Q.· · Did you play any role in drafting Chicago's21· ·ordinance regulating home sharing?22· · · · A.· · I did not.23· · · · Q.· · You advise anyone to your knowledge who24· ·played any role in the drafting the home sharing
Page 44
·1· ·ordinance?·2· · · · A.· · I did not.·3· · · · Q.· · Before Chicago enacted its surcharge on home·4· ·sharing did you advise anyone that the City should do·5· ·that?·6· · · · A.· · I did not.·7· · · · Q.· · Do you know where the idea of the home·8· ·sharing surcharge came from?·9· · · · A.· · I do not.10· · · · Q.· · How did you become involved in this lawsuit?11· · · · A.· · So I -- I believe I was referred by someone12· ·in another department and -- and Wes was I believe the13· ·first person to reach out to me and asked my14· ·familiarity with short-term rentals and understanding15· ·really kind of what I did for the City.16· · · · · · · I believe that's how I got involved.17· · · · Q.· · Do you remember who the person in the other18· ·department who contacted you about that was?19· · · · A.· · No.· I was contacted directly by the20· ·Department of Law.· I'm not sure who referred me.21· · · · Q.· · Oh, I see.22· · · · · · · If you look at your report, Exhibit 1, on23· ·page 4 there's a paragraph in the middle of the page24· ·between the bullet points.
Page 45
·1· · · · · · · Do you see there it says in my opinion these·2· ·reports are of a type that would be reasonably relied·3· ·upon by policymakers and advisors in positions such as·4· ·mine in forming opinions and inferences upon the·5· ·subjects that the reports address?·6· · · · · · · Do you see what I'm talking about?·7· · · · A.· · I do see it.· Yes.·8· · · · Q.· · What do you mean by policymakers and·9· ·advisors in positions such as mine?10· · · · A.· · So when I was describing my role I think11· ·that last bullet point we talked about kind of12· ·strategic planning and so often what I do is I make13· ·policy or I advise others who are making policy around14· ·the creation or preservation of affordable housing.15· · · · Q.· · Do you ever give advice regarding tax16· ·policy?17· · · · A.· · I do not deal with taxes -- No.· I take that18· ·back.19· · · · · · · Yes.· We have made recommendations to the20· ·State for tax policy which is related to affordable21· ·housing.22· · · · Q.· · Can you explain that a little bit?23· · · · A.· · Other than the State and the County the24· ·County in particular has had a -- what they call a
FILE
D D
ATE:
6/2
1/20
19 6
:51
PM
2016
CH
1548
9

Page 46
·1· ·Class 9 designation for affordable housing that they·2· ·got rid of last year so some of the advocate community·3· ·has been pushing for changes to the tax code to help·4· ·homeowners -- help landowners or developers that own·5· ·and rent affordably that their taxes should also·6· ·reflect that designation.·7· · · · Q.· · When you say policymakers and advisors in·8· ·positions such as mine who are you including in that·9· ·category?10· · · · A.· · So I would -- I would say the deputy11· ·commissioner level as well as managing deputy at the12· ·commissioner level who often work with the legislative13· ·staff within the City to create laws and policy.14· · · · Q.· · Are you talking about specific officials in15· ·the city of Chicago or are you talking about a broader16· ·group of some kind of professionals?17· · · · A.· · So in this context I'm talking about the18· ·city of Chicago, but I think equally it could be a19· ·broader group of professionals or lawmakers.20· · · · Q.· · And -- And how would you describe that21· ·category of people?22· · · · A.· · So initially I described it as the deputy23· ·commissioners, managing deputy commissioners, and then24· ·commissioners of the various departments working with
Page 47
·1· ·the Mayor's Office, but there is also instances·2· ·particularly as I relate to the Class 9 where we worked·3· ·with the advocate community who was working with the·4· ·State and the state representatives.·5· · · · Q.· · So you mean state legislators?·6· · · · A.· · Yeah.·7· · · · Q.· · And so you're including state legislators in·8· ·the group of policymakers here?·9· · · · A.· · So I think in this case I was specifically10· ·talking about the deputy commissioners, managing deputy11· ·commissioners, and the commissioners in the city as12· ·well as the Mayor's Office who make policies and laws,13· ·but as I reflect on it there's no reason why these14· ·types of reports wouldn't help any policymaker.· I mean15· ·these are exactly the type of reports that we would16· ·look at.17· · · · Q.· · Well, how do you decide what report to rely18· ·on when you're considering what policies are19· ·appropriate for the City to adopt?20· · · · A.· · So I think we rely on a number of reports as21· ·opposed to one specific report.22· · · · Q.· · Okay.· Well, how do you decide which ones?23· · · · A.· · I think it's through consensus more than24· ·anything else.· As everybody reads the reports and
Page 48
·1· ·begins to believe in digesting what they're saying if·2· ·there's consensus amongst those who are engaged in the·3· ·reports as well as the various reports and what they·4· ·say I think that's how you end up choosing them.·5· · · · Q.· · And who would this consensus be among?·6· · · · A.· · It depends on what we're talking about or·7· ·law or policy.·8· · · · · · · So it could be as small as -- if I was doing·9· ·a policy within my division it could be as small as me10· ·and my underwriting team and maybe the commissioner.11· ·If I working across the city I may engage the12· ·Mayor's Office and potentially some of the aldermanic13· ·and elected officials.14· · · · Q.· · When you're deciding what reports to rely15· ·on, understanding that you're going to have to reach a16· ·consensus with others, but when you're deciding which17· ·ones you think should be relied on do you consider who18· ·authored the report?19· · · · A.· · I think there's definitely a consideration20· ·for who authored the report, but I don't know what21· ·value I'd weight that with compared to other22· ·considerations.23· · · · Q.· · Okay.· And what kinds of authors would you24· ·be more likely to rely on?
Page 49
·1· · · · A.· · I believe we'd be more likely to rely on·2· ·university authors or larger, familiar research·3· ·institutions.· And generally I think we try to -- to·4· ·rely on particularly -- I particularly try to rely on·5· ·agencies that don't have any sort of intentional or·6· ·bias perspective on -- on any agenda.·7· · · · Q.· · Do you consider whether a report was peer·8· ·reviewed?·9· · · · A.· · So I do not consider whether a report is10· ·peer reviewed.· No.11· · · · Q.· · Do you consider where it was published?12· · · · A.· · I'm concerned with who published it.13· · · · · · · In terms of where I mean for our purposes we14· ·generally stick to the U.S.15· · · · Q.· · I suppose I meant where it was in the sense16· ·of whether it was in an academic journal, whether it17· ·was on a website; whether it was a, you know, policy18· ·study put out by some kind of foundation that that sort19· ·of thing do you consider the source in that sense.20· · · · · · · One sort of source would be the author.· The21· ·other sort of source would be like the publisher.22· · · · A.· · So we would consider the author and the23· ·publisher, but I wouldn't necessarily consider the24· ·medium.
FILE
D D
ATE:
6/2
1/20
19 6
:51
PM
2016
CH
1548
9
Page 50
·1· · · · Q.· · And what publishers would you be more likely·2· ·to rely on?·3· · · · A.· · So similarly, so nonprofits or research·4· ·institutions or universities.·5· · · · Q.· · Do you consider whether the author of a·6· ·report applied a reliable methodology?·7· · · · A.· · So there are others that may consider that·8· ·more than I would.· Yes.·9· · · · Q.· · I'm asking about you.10· · · · A.· · So I can -- I'm more concerned about the11· ·size of the -- of those engaged.12· · · · · · · So methodology, yes; but whether it's the13· ·econometrics or a statistical analysis, no, I do not.14· ·But if it's a large enough sample size then, yes, I do.15· · · · Q.· · How do you know whether a sample size is16· ·large enough?17· · · · A.· · So usually the report will describe it.18· · · · Q.· · Well, how do you make a judgment if it's19· ·large enough if you're not familiar with the20· ·econometric or statistical methods?21· · · · A.· · I think my judgment is much more simple than22· ·that.· If it's a few tens or a few hundreds then I'm23· ·not that interested, but if it's, you know, a much more24· ·measurable effect that can be replicated or understood
Page 51
·1· ·on a larger level then I am interested.·2· · · · Q.· · Well, how do you know whether tens or·3· ·hundreds are an appropriate sample size in a given·4· ·field?·5· · · · A.· · So I think every field is different.· So it·6· ·would have to be -- it would have to be something that·7· ·we'd be looking at, but I don't know that tens or·8· ·hundreds would affect policy decisions.·9· · · · Q.· · Okay.· But you did say you judge the10· ·reliability of a report by its sample size so I'm still11· ·trying to figure out how you determine what's an12· ·appropriate sample size.13· · · · A.· · Yeah.· No.· I think a sample size is going14· ·to be respective to the topic and report at hand so I15· ·don't know that there's a binary answer to that.16· · · · Q.· · Do you consider an author or publisher's17· ·political or ideological background in deciding whether18· ·to rely on its report?19· · · · A.· · That has not been a factor that I've had to20· ·consider or been known or aware of to have to consider.21· · · · Q.· · Going back to your statement that the22· ·reports you list are of a type that would be reasonably23· ·relied upon by policymakers and advisors in positions24· ·such as mine, how do you know what other policymakers
Page 52
·1· ·and advisors would rely on outside of the city of·2· ·Chicago?·3· · · · A.· · So I don't know for sure what other·4· ·policymakers outside the city of Chicago would rely on,·5· ·but I do engage a number of other cities both·6· ·domestically and internationally and we do discuss·7· ·topics and we do share policy papers and so my·8· ·assumption is that they rely on similar types of·9· ·analysis as these.10· · · · Q.· · Let's turn to page 3 of Exhibit 1, which is11· ·your report.12· · · · · · · The bullet points that start there are13· ·reports that the plaintiffs' expert reviewed; is that14· ·right?15· · · · A.· · Are you asking me or are you asking your16· ·colleague?17· · · · Q.· · I'm asking you.18· · · · A.· · If you're telling me that, yes, I believe19· ·so.20· · · · Q.· · Okay.· Well, I mean I -- right, that's how21· ·it's set up here reports discussed at Dr. Moore's22· ·deposition included and then there's bullet points and23· ·so that's what we're talking about.24· · · · · · · And the first thing on here is an item
Page 53
·1· ·called How Airbnb Short-Term Rentals Exacerbates Los·2· ·Angeles's Affordable Housing Crisis by Dayne Lee.·3· · · · · · · Do you see what I mean there?·4· · · · A.· · I do.·5· · · · Q.· · That article is actually a student note from·6· ·a law journal, isn't it?·7· · · · A.· · I do not know.·8· · · · Q.· · Do you know whether law students' notes are·9· ·peer reviewed?10· · · · A.· · I do not.11· · · · Q.· · Do you know whether this student was peer12· ·reviewed?13· · · · A.· · I do not know.14· · · · Q.· · Are law review student notes something you15· ·normally rely on in formulating policy advice or making16· ·policy decisions?17· · · · A.· · I do not know.18· · · · Q.· · Do you know whether the author here Dayne19· ·Lee has any training in economics?20· · · · A.· · I do not know.21· · · · Q.· · Have you read the entire note by Dayne Lee?22· · · · A.· · I've read this -- the excerpt that was23· ·provided to me -- the study that was provided to me.24· · · · Q.· · Were you provided with the complete article?
FILE
D D
ATE:
6/2
1/20
19 6
:51
PM
2016
CH
1548
9
Page 54
·1· · · · A.· · I believe so or at least the 229 to 253.·2· ·It's been some time.· I'd have to go back and confirm.·3· · · · Q.· · What methodology did this article apply?·4· · · · A.· · Other than laws of supply and demand I do·5· ·not know -- I do not recall.·6· · · · MR. HEUBERT:· All right.· I'm going to hand the·7· ·court reporter this as our next exhibit, and can you·8· ·please mark this as the next exhibit.·9· · · · · · · · · · · · (Deposition Exhibit No. 510· · · · · · · · · · · · ·marked as requested.)11· · · · MR. HEUBERT:· I'll give you this copy (tendering).12· · · · · · · I apologize that these are printed on both13· ·sides.· We realized kind of too late that we did that.14· ·Hopefully that won't make it too hard to find what15· ·we're talking about.16· · · · MR. HANSCOM:· Do you want a break?17· · · · THE WITNESS:· No.· I'm fine.18· · · · MR. HANSCOM:· Okay.19· ·BY MR. HEUBERT:20· · · · Q.· · Okay.· If you could turn to the page marked21· ·down in the lower right-hand corner D00309.22· · · · A.· · Mine's cut off.23· · · · MR. SCHWAB:· He might not be able to see that.24
Page 55
·1· ·BY MR. HEUBERT:·2· · · · Q.· · Oh, I'm sorry.· Okay.· Well, how about do·3· ·you have the page numbers at the top?·4· · · · A.· · I do.·5· · · · Q.· · Okay.· Could you go to page 234?·6· · · · A.· · (Complying.)·7· · · · Q.· · And then you'll see there's a section·8· ·heading here Airbnb Increases Rents.· It starts that·9· ·way.10· · · · A.· · Uh-huh.11· · · · Q.· · This is the section of this article that12· ·discusses how the author believes Airbnb increases13· ·rents particularly in Los Angeles, correct?14· · · · A.· · Correct.15· · · · Q.· · At the beginning of the last paragraph on16· ·this page, which is not a complete paragraph on this17· ·page, it says each apartment or home listed year-round18· ·on Airbnb is a home that has been removed from the19· ·residential housing market and added to the city's20· ·aggregate stock of hotel rooms.21· · · · · · · That's not necessarily true, right?22· · · · A.· · I do not know.23· · · · Q.· · I mean a person could list their place on24· ·Airbnb all the time and then when it's rented out go
Page 56
·1· ·stay with a friend or family member or something like·2· ·that so that it wouldn't actually be removed from the·3· ·residential housing market.·4· · · · A.· · Well, if it's listed year-round it is not·5· ·available for rent.·6· · · · Q.· · But it could be the person's residence that·7· ·they stay in and then they just -- you know, if they·8· ·rent it out a few times a month during those days they·9· ·go stay with a friend or family member, they just go10· ·stay somewhere else for a while but otherwise they live11· ·there it's serving as a residence for them; it's not12· ·being taken out of the stock of residential housing;13· ·that can happen, right?14· · · · A.· · It is taken out of the stock and when they15· ·go rent somewhere else they're also taking that out of16· ·the stock.17· · · · Q.· · Right.· But the scenario I'm describing is18· ·this person doesn't go rent another place.· They live19· ·in this place, their stuff is there, they rent it out20· ·sometimes and when they do rent it out they go stay21· ·with their parents say so it's not being removed from22· ·the stock of residential housing, right; it's still23· ·that person's residence?24· · · · A.· · It's still their residence but not made
Page 57
·1· ·available to anybody other than short-term rentals so·2· ·it's not available for lease by an actual tenant.·3· · · · Q.· · That person is the tenant.· In fact, that·4· ·person could be a long-term tenant, right?·5· · · · · · · They could be leasing it from somebody else·6· ·long term.·7· · · · A.· · How would you make the distinction between·8· ·that person and just an investor/owner who doesn't live·9· ·there at all?10· · · · Q.· · I mean that is the distinction.· That's the11· ·distinction I'm drawing, this is somebody who --12· · · · A.· · So is the building available for rent or13· ·not?14· · · · Q.· · It's used as long-term -- In my hypothetical15· ·that I'm presenting to you it is used as this person's16· ·long-term residence, they have no other long-term17· ·residence, but sometimes they let somebody stay there18· ·and they go hang out someplace else so in that19· ·situation nothing is changing in the housing market,20· ·right, nothing is any different than if they didn't21· ·list it as a short-term rental at all.22· · · · A.· · I think there's a lot of difference.23· · · · Q.· · How is the housing market different if a24· ·person does that versus if they don't?
FILE
D D
ATE:
6/2
1/20
19 6
:51
PM
2016
CH
1548
9
Page 58
·1· · · · A.· · Well, that person is not living there.·2· · · · Q.· · Well, they are living there just not for the·3· ·occasional periods of time when someone is staying·4· ·there short-term.·5· · · · A.· · If they're listed year-round I don't see how·6· ·that's occasional.·7· · · · Q.· · Well, that's the hypothetical I just·8· ·presented to you.·9· · · · A.· · I don't work in hypotheticals.10· · · · · · · The hypothetical that I presented is it's11· ·taken out of the market.12· · · · Q.· · You have to answer the questions that I ask.13· ·You can't give me a different hypothetical.14· · · · A.· · I believe there's an effect.· It's taken off15· ·the market.· The person isn't living there.16· · · · Q.· · Do you understand that it's not on the --17· ·it's not on the market anyway the way I'm setting this18· ·out for you.19· · · · · · · A person -- If I -- Okay.· I have my house20· ·that I live in.· If I occasionally do short-term21· ·rentals on it and go stay with my mom during that time22· ·nothing in the housing market has changed, right,23· ·because my house is still my house just like it always24· ·was?
Page 59
·1· · · · · · · I'm not renting a different place.· Nobody·2· ·else is renting my place.·3· · · · · · · It's the same except that there's a·4· ·short-term renter who pops in, but for purposes of the·5· ·housing market nothing is different, right?·6· · · · A.· · I mean you're not living in your house and·7· ·you're staying elsewhere.·8· · · · Q.· · But I'm not driving up rents, right, through·9· ·my activity?10· · · · A.· · Well, we don't know that.11· · · · Q.· · How would that activity I just described12· ·potentially drive up rents?13· · · · A.· · Well, if someone would actually like to live14· ·in that unit and you're not living there and you've15· ·removed that unit from the marketplace and so you16· ·reduce supply.17· · · · · · · So your hypothetical becomes worse if you18· ·have two houses or three houses.19· · · · Q.· · Right.· I'm not talking about that.20· · · · · · · I'm talking about I only have one house --21· · · · A.· · Right.22· · · · Q.· · -- it's got all my stuff in it, and I go23· ·stay with my parents, which I could do even if I didn't24· ·have a short-term rental --
Page 60
·1· · · · A.· · Right.·2· · · · Q.· · -- right?·3· · · · · · · If I didn't have a short-term rental and I·4· ·go stay with my mom for a few days I'm not affecting·5· ·the housing market surely, right?·6· · · · A.· · Any time you live, own, or operate a·7· ·building you're affecting the housing market.·8· · · · Q.· · But the fact that I go visit somebody·9· ·doesn't change anything with respect to the housing10· ·market, right?11· · · · A.· · No.· You're living there has already12· ·affected the housing market.13· · · · Q.· · Right.14· · · · A.· · You owning that place is affecting --15· · · · Q.· · Right.16· · · · A.· · -- the housing market.17· · · · Q.· · Yes.· Yes.18· · · · · · · Owning it affects it, but the fact that I go19· ·visit somebody for a few days and leave it vacant say20· ·that doesn't change anything in the housing market,21· ·right?22· · · · A.· · If you leave your house for a few days it23· ·does not change anything in the housing market.24· · · · Q.· · And that's true whether or not a short-term
Page 61
·1· ·guest from out of town is occupying it while I'm out·2· ·for a few days, right?·3· · · · A.· · If you're out for a few days and a guest is·4· ·there for a few days it doesn't change anything so long·5· ·as you're not occupying another unit in the city.·6· · · · Q.· · Okay.· And if a home previously wasn't·7· ·rented out long term and then starts being rented out·8· ·on a short-term basis could we really say it was·9· ·removed from the housing market?10· · · · A.· · Yes.11· · · · Q.· · Why can we say that?12· · · · A.· · Because it's no longer available for other13· ·people to live in it.14· · · · · · · Your house is a function of the housing15· ·market.16· · · · Q.· · Turning to the next page 235 at the top of17· ·the next page the author makes the claim in the last18· ·sentence on this page in 2014 rents in these19· ·neighborhoods, which he's just listed, were 20 percent20· ·higher and increased 30 percent -- 33 percent faster21· ·than rents citywide.22· · · · · · · Oh, and those are the neighborhoods that23· ·he's identified are the ones where Airbnb listings are24· ·most concentrated.
FILE
D D
ATE:
6/2
1/20
19 6
:51
PM
2016
CH
1548
9
Page 62
·1· · · · · · · And so in this paragraph the author is·2· ·alleging correlation, not causation, right?·3· · · · A.· · I'm not sure what you mean by that.·4· · · · Q.· · So the author is saying these are the·5· ·listing -- these are the neighborhoods where Airbnb·6· ·listings are concentrated --·7· · · · A.· · Okay.·8· · · · Q.· · -- and in those neighborhoods rents went up·9· ·faster than in other neighborhoods, but he is not10· ·saying here that necessarily the fact that these have11· ·the most Airbnb listings is responsible for the12· ·increase in rents.· It could be.13· · · · · · · He's not saying it's not, but he's only14· ·saying the fact that these have the most Airbnbs and15· ·rents did go up there, correct?16· · · · A.· · I don't know that you're asking me a17· ·question.18· · · · Q.· · Okay.· Do you understand the difference19· ·between correlation and causation?20· · · · A.· · It would be helpful if you explain it.· Yes.21· · · · Q.· · If -- Okay.· If -- It's one thing to say --22· ·Let me think of a good example.23· · · · · · · · · · · · (Brief pause.)24
Page 63
·1· ·BY MR. HEUBERT:·2· · · · Q.· · So we can observe these neighborhoods have·3· ·the most Airbnb listings and these neighborhoods also·4· ·saw a bigger increase in rents than other·5· ·neighborhoods.· That's a correlation more Airbnbs and·6· ·higher rents are together in the same place but that·7· ·information by itself doesn't tell us that having more·8· ·Airbnb listings makes rents go up.·9· · · · · · · It could be a coincidence just based on that10· ·information, right?11· · · · A.· · If you were to limit the information just to12· ·those two factors then, yes, that would be correct.13· · · · Q.· · Right.14· · · · · · · And my point is you need something else to15· ·prove causation to prove that the fact that there were16· ·Airbnb listings made the rents go up.17· · · · A.· · I'm not sure how to answer because I still18· ·question the validity of the correlation based on those19· ·two facts, and the reason I'm stuck, frankly, is just20· ·when you start talking about -- one because we're only21· ·narrowing it down to a limited instance, but, two, any22· ·time you start talking about rents and increases of23· ·rents it implies a lot of other factors and so I don't24· ·know if I can actually say there's only the two
Page 64
·1· ·instances in your corollary example because rents is·2· ·kind of a loaded term.·3· · · · · · · You know, if you were to say people that eat·4· ·carrots and smoke cigarettes get lung cancer I·5· ·understand that, but neither one of those are very·6· ·loaded.·7· · · · Q.· · Right.·8· · · · · · · Well, that's the -- Right, that's whole·9· ·point of correlation and causation but --10· · · · A.· · So I struggle because reality is I11· ·understand and that's why these are great -- these12· ·reports as a whole are just great points of reference13· ·to us so we can come up with opinions because in our --14· ·in our denser areas where rents have increased it's15· ·often as a result of a number of factors of which16· ·supply may be one of them and so as you move toward17· ·short-term rentals we know supply is being affected and18· ·so you have less units available and price goes up.19· · · · Q.· · Does this author purport to have done the20· ·kind of economic study necessary to show causation that21· ·is that more Airbnb listings makes rents go up?22· · · · A.· · I believe this author did say that, but I23· ·would have to review it more recently to make that24· ·declarative statement.
Page 65
·1· · · · Q.· · So right now your answer is you don't know;·2· ·is that right?·3· · · · A.· · So I think this author makes a strong case·4· ·that the effect of Airbnb in any neighborhood affects·5· ·the city as a whole.·6· · · · Q.· · Okay.· What methodology does he use to do·7· ·that?·8· · · · A.· · I don't know.·9· · · · Q.· · Does he perform the kind of econometric10· ·analysis that an economist would perform to show that11· ·one factor causes another, the change in one thing12· ·causes a change in another?13· · · · A.· · I do not know.14· · · · · · · Thumbing through it it does not appear15· ·there's an econometric analysis, nor do I know that I16· ·would rely on it so -- because there was an econometric17· ·analysis.18· · · · Q.· · You wouldn't rely on it more if it was an19· ·econometric analysis showing causation?20· · · · A.· · No.21· · · · · · · I would let other people on our consensus22· ·team worry about that.23· · · · Q.· · Do you have economists on your team?24· · · · A.· · We have people that are policymakers that
FILE
D D
ATE:
6/2
1/20
19 6
:51
PM
2016
CH
1548
9

Page 66
·1· ·have econometric and statistical backgrounds.· Yes.·2· · · · Q.· · Who are they?·3· · · · A.· · So individuals out of the Mayor's Office.·4· ·Particularly there was one person named Cara Bader and·5· ·I don't recall the others, but we're at a point of·6· ·transition now so it's -- I don't know who's left.·7· · · · Q.· · Looking at the last full paragraph on·8· ·page 237 if you could just read that paragraph to·9· ·yourself and let me know when you're done?10· · · · A.· · Starting with the price effect?11· · · · Q.· · Yep, just that paragraph.12· · · · · · · · · · · · (Brief pause.)13· ·BY THE WITNESS:14· · · · A.· · Okay.15· · · · Q.· · So the author here is making a -- sort of a16· ·claim about the price effect on a supply shock in17· ·Los Angeles and it says in the last sentence the18· ·rent -- under the model he has here the rent on19· ·2,680-dollar, one-bedroom apartment in Venice would20· ·increase by $67 per month as a result of a 1 percent21· ·decrease in supply; is that right?22· · · · A.· · That is what he wrote.· Correct.23· · · · Q.· · Do you know if that's -- the way this is24· ·discussed here in this paragraph is how an economist
Page 67
·1· ·would analyze this issue?·2· · · · A.· · I think what he's using is very basic supply·3· ·and demand comparison, but I don't know how much deeper·4· ·that goes.·5· · · · Q.· · Okay.· But my question was do you know if·6· ·that's how an economist would analyze this issue.·7· · · · A.· · I believe an economist would come up with a·8· ·very similar response.·9· · · · Q.· · Okay.· And what do you base that on?10· · · · A.· · My experience in reading these reports and11· ·having gone through an undergraduate degree and a12· ·master's that involved a lot of economy research and13· ·understanding.14· · · · · · · · · · · · (Brief pause.)15· ·BY MR. HEUBERT:16· · · · Q.· · Do you know how strong the statistical17· ·correlation the author is discussing here on page 23718· ·is?19· · · · A.· · I'm not sure what you're referring to.20· · · · Q.· · Okay.· The author talks about -- In the last21· ·full paragraph on page 237 --22· · · · A.· · Uh-huh.23· · · · Q.· · -- the author talks about a supposed effect24· ·that changes in supply has on rents.
Page 68
·1· · · · · · · Do you know how strong the statistical·2· ·correlation in that model is?·3· · · · A.· · Statistical correlation to what?·4· · · · · · · What the author has done is said here's a·5· ·relatively simple model and so if you hold your supply·6· ·relatively flat that each decrease would change the·7· ·rents.·8· · · · · · · I don't know that you need statistics to·9· ·figure that out.10· · · · Q.· · If you look at Footnote 43 on page 237 the11· ·next to last sentence in that footnote says "However,12· ·it is likely that the whole unit STR figure cited from13· ·the Samaan report include some housing units that are14· ·in fact occupied by the owner or leaseholder for most15· ·of the year, and not listed year-round on that service.16· ·Such units are not removed from the residential housing17· ·market."18· · · · · · · Do you disagree with that statement?19· · · · A.· · This goes back to your question earlier of20· ·how you would define remove the residential housing21· ·market.22· · · · · · · So, yes, the owner if they're living there23· ·they're part of the housing market and unless it's --24· ·as long as it's serving that main purpose of housing
Page 69
·1· ·somebody for long term then that's fine.·2· · · · · · · I think it's fair to make some distinctions·3· ·between in which the time somebody lives in their unit·4· ·and the time at which that unit is available for·5· ·short-term rental, and I think part of that distinction·6· ·involves whether or not you can rent it to somebody·7· ·else on a full-time lease.·8· · · · Q.· · All right.· Going back to your report,·9· ·Exhibit 1, the third bullet point on page 3 references10· ·an article called Is Home Sharing Driving Up Rents?11· ·Evidenced from Airbnb in Boston.12· · · · · · · Do you see what I'm talking about?13· · · · A.· · I do.14· · · · Q.· · Do you know whether this report was peer15· ·reviewed before it was published?16· · · · A.· · I do not.17· · · · Q.· · Have you read the entire report?18· · · · A.· · I have.19· · · · Q.· · What methodology do the authors of that20· ·article apply?21· · · · A.· · I do not recall.22· · · · MR. HEUBERT:· Okay.· I'm going to ask the court23· ·reporter to mark this as Exhibit 6.24
FILE
D D
ATE:
6/2
1/20
19 6
:51
PM
2016
CH
1548
9

Page 70
·1· · · · · · · · · · · · (Deposition Exhibit No. 6·2· · · · · · · · · · · · ·marked as requested.)·3· ·BY MR. HEUBERT:·4· · · · Q.· · If you turn to page 19 of the report and·5· ·look under "Results" I'll have a question about that.·6· · · · · · · Okay.· So in the -- under results the third·7· ·sentence says for those census tracts in the highest·8· ·decile of Airbnb listings relative to total housing·9· ·units this -- this increase in asking rents ranges from10· ·1.3 percent to 3.1 percent.· That's the first part of11· ·the sentence.· I'll cut it off there.12· · · · · · · Now, is it your understanding when they're13· ·talking about the highest decile of Airbnb listings14· ·they mean the 10 percent of census tracts in Boston15· ·that have the most Airbnb listings; is that -- relative16· ·to total housing --17· · · · A.· · True.18· · · · Q.· · -- is that right?19· · · · A.· · True.20· · · · Q.· · And they're saying that Airbnbs have caused21· ·rents to rise in that highest decile from 1.3 percent22· ·to 3.1 percent; is that your understanding what they're23· ·saying?24· · · · A.· · That is what they're saying.
Page 71
·1· · · · Q.· · Okay.· Do you know how strong the·2· ·statistical correlation between increased Airbnb·3· ·density and increased rent is?·4· · · · A.· · I do not.·5· · · · Q.· · Does this article say whether this·6· ·1.3 to 3.1 percent increase in rents would lead to an·7· ·increase in homelessness?·8· · · · A.· · This report I do not believe says it will·9· ·specifically increase homelessness, but it does say10· ·that it will increase rents which makes affordability11· ·more difficult.12· · · · Q.· · Do you believe that a 1.3 to 3.1 percent13· ·increase in rent will increase homelessness?14· · · · A.· · So ultimately, yes, I do believe any15· ·increase in rents through reduction of supply may have16· ·an effect that increases homelessness.17· · · · Q.· · Okay.· Can you explain the process by which18· ·a 1.3 to 3.1 increase in rent would lead to an increase19· ·in homelessness?20· · · · A.· · Sure.21· · · · · · · So I think it's very easy for a lot of22· ·people to think that neighborhoods work in a silo and23· ·the reality is it doesn't.· The city is a whole and24· ·where people move is often a function of that whole,
Page 72
·1· ·and so any time you have supply issues and you have·2· ·difficulty in finding affordable rental, affordable·3· ·rental availability you're forcing people to be moving·4· ·around and displaced and so it could be as simple you·5· ·could have a situation like we do in Logan Square where·6· ·because of the high cost of rents if somebody chose to·7· ·buy an SRO and displace families and make them homeless·8· ·or you could only have an effect like this where·9· ·they're increasing rents you can just kind of have a10· ·spiraling effect and it pushes a lot of downward11· ·pressure as people are forced to move from where they12· ·could afford to where they can't afford and ultimately13· ·that works its way down the struggle.14· · · · · · · It is fairly common to understand that a15· ·number of families are on the edge of homelessness and16· ·it could be as simple as one paycheck.· It could be as17· ·simple as a couple hundreds of dollars so any minor18· ·increase in rent could tip them over the edge of their19· ·housing and security.20· · · · Q.· · Do you think -- So this is talking about a21· ·1.3 to 3.1 increase in rents in these areas with a high22· ·concentration of Airbnb listings.23· · · · · · · Do you think that this increase in those24· ·areas could lead to an increase in rents of more than
Page 73
·1· ·3.1 percent in other neighborhoods?·2· · · · A.· · I think, you know, without knowing all the·3· ·different variables that go into it, sure, why not. I·4· ·mean it's really an issue of supply and demand and so·5· ·depending on how many people are being displaced or·6· ·removed from their particular area and their movement·7· ·into other areas it could be exacerbated.·8· · · · · · · So in Boston in particular they have a·9· ·tremendous issue with housing affordability and so I10· ·think the number of available and affordable units is11· ·already readily slip and slow and so as you begin to12· ·exacerbate that problem, yeah, you could easily go13· ·above that number.14· · · · Q.· · But this study doesn't purport to show that,15· ·right?16· · · · A.· · No.17· · · · Q.· · And are you aware of any study that purports18· ·to show that?19· · · · A.· · That it's over 3.1 percent, no.20· · · · MR. HANSCOM:· I wouldn't mind a five-minute break21· ·in a minute.22· · · · MR. HEUBERT:· I'm between questions so it's as23· ·good as time as any.24· · · · MR. HANSCOM:· Okay.· Great.· Thank you.
FILE
D D
ATE:
6/2
1/20
19 6
:51
PM
2016
CH
1548
9
Page 74
·1· · · · · · · · · · · · (A recess is taken.)·2· ·BY MR. HEUBERT:·3· · · · Q.· · So in this Boston study that we've been·4· ·talking about this 1.3 to 3.1 percent increase in rents·5· ·was an average, right, not necessarily an increase in·6· ·everyone's rent in the areas they studied?·7· · · · A.· · I think they were talking specifically about·8· ·that highest decile.·9· · · · Q.· · Right.10· · · · · · · But within that highest decile it's not like11· ·everybody saw that increase; it could be some people12· ·saw more than a 3.1 percent increase and some people13· ·didn't see any increase?14· · · · A.· · I would have to review it in more detail to15· ·find out.16· · · · Q.· · Okay.· I mean does the study tell you how17· ·many renters actually saw an increase in their rents?18· · · · A.· · I would have to look to see if it said that19· ·specifically.20· · · · Q.· · You can refresh your memory.21· · · · · · · · · · · · (Brief pause.)22· ·BY THE WITNESS:23· · · · A.· · So in an attempt to refresh my memory I'm24· ·not seeing any specific cited number to say how many
Page 75
·1· ·people were affected by rent changes.·2· · · · Q.· · Do you think the author's conclusion about·3· ·Boston tell us anything about the effects of short-term·4· ·rentals and affordable housing in Chicago?·5· · · · A.· · So I think studies like this definitely·6· ·allow us to form some opinions about Chicago.·7· · · · Q.· · Why?·8· · · · A.· · So I think studies like this like we've seen·9· ·across a lot of these studies any time you reduce10· ·supply of available rental housing you have an issue or11· ·you start to see an uptick in rent prices which has an12· ·effect on affordable housing.13· · · · Q.· · Going back to Exhibit 1, turning to page 414· ·of your report, do you see the first bullet point on15· ·that page which refers an article called Do Airbnb16· ·properties affect house prices?17· · · · A.· · I do.18· · · · Q.· · Have you read that entire article?19· · · · A.· · I have.20· · · · Q.· · Did this article find a statistical21· ·correlation between increasing rents and short-term22· ·rentals?23· · · · A.· · I do not recall if they had a statistical24· ·correlation.
Page 76
·1· · · · Q.· · Do you recall what methodology the authors·2· ·of that article applied?·3· · · · A.· · I do not.·4· · · · Q.· · Did the article say anything about·5· ·short-term rentals effect on homelessness?·6· · · · A.· · I do not believe it specifically cited·7· ·homelessness.·8· · · · Q.· · And do you think the author's conclusions in·9· ·that article about New York City tell us anything about10· ·the effects of short-term rentals on affordable housing11· ·in Chicago?12· · · · A.· · I believe like all these reports it provides13· ·enough understanding about supply and demand that we14· ·should provide our own opinions for Chicago.15· · · · · · · Yes, it's been very helpful.16· · · · Q.· · Do you think the author's conclusions about17· ·New York City tell us anything about the effects of18· ·short-term rentals on homelessness in Chicago?19· · · · A.· · I think ultimately the concern about20· ·homelessness and affordability are the same.21· · · · · · · So when you lose affordability you22· ·exacerbate homelessness.23· · · · Q.· · Okay.· Now looking at the second bullet24· ·point on page 4 do you see there it says there's a
Page 77
·1· ·report called The Impact of Airbnb on NYC Rents?·2· · · · · · · Do you see what I'm talking about?·3· · · · A.· · Yes.·4· · · · Q.· · Okay.· Have you read that entire article?·5· · · · A.· · I have.·6· · · · Q.· · Did this article find a statistical·7· ·correlation between increasing rents and short-term·8· ·rentals?·9· · · · A.· · I mean the bullet point here says an10· ·empirical analysis so if you consider that to be11· ·statistical analysis I would say yes, but otherwise I12· ·am not sure.13· · · · Q.· · Do you know how strong -- Do you know how14· ·strong the statistical correlation was?15· · · · A.· · I do not.16· · · · Q.· · Do you know what methodology the authors of17· ·the article applied?18· · · · A.· · I do not.19· · · · Q.· · Did this article say anything about20· ·short-term rentals' effect on homelessness?21· · · · A.· · It did not directly cite homelessness.22· · · · Q.· · The third bullet point on page 4 of your23· ·report refers to an article The Sharing Economy and24· ·Housing Affordability:· Evidence from Airbnb.
FILE
D D
ATE:
6/2
1/20
19 6
:51
PM
2016
CH
1548
9

Page 78
·1· · · · · · · Do you see that one?·2· · · · A.· · I do.·3· · · · Q.· · Have you read that entire article?·4· · · · A.· · I have.·5· · · · Q.· · What methodology did the authors of that·6· ·article apply?·7· · · · A.· · I do not recall.·8· · · · Q.· · Did that article find a statistical·9· ·correlation between increasing rents and short-term10· ·rentals?11· · · · A.· · I do not recall if it had a statistical12· ·correlation.13· · · · Q.· · In your description of this article you say14· ·this report found a 1 percent increase in Airbnb15· ·listings leads to a 0.018 percent increase in rents.16· · · · · · · That's a really tiny increase, isn't it?17· · · · A.· · I think everything is relative.18· · · · Q.· · Well, if you're paying $1,000 in a month in19· ·rent and your rent went up by .018 percent that would20· ·be an increase of 18 cents, right?21· · · · A.· · Possibly.22· · · · Q.· · And so that would mean that if there were a23· ·100 percent increase in Airbnb listings someone paying24· ·$1,000 in rent would see an increase of $18 in their
Page 79
·1· ·rent, right?·2· · · · A.· · Correct.·3· · · · Q.· · Do you think that kind of increase in rent·4· ·could make people homeless?·5· · · · A.· · I think that type of increase in rent over·6· ·the long term could exacerbate issues of affordability·7· ·of homelessness.· Yes.·8· · · · · · · So everything is relative.· Eighteen dollars·9· ·to you is a lot of money to somebody else.10· · · · Q.· · But of course we're talking about to have --11· ·you know, to have even a strong effect under --12· ·assuming this relationship as described is correct to13· ·have much of an increase in rents at all there would14· ·have to be a lot of Airbnbs in a place, right?15· · · · A.· · I don't know if you have to have a lot of16· ·Airbnbs, but this is definitely suggesting the more17· ·Airbnbs you have the more increase in rents you'll get.18· · · · Q.· · And so even when there's a big increase in19· ·Airbnbs we're seeing a pretty small amount of money20· ·here and so we're talking about second and third order21· ·effects if we're talking about people being homeless,22· ·right, because you have to say that that small increase23· ·in this part of the market will it lead to some other24· ·increase in another part of the market that will be so
Page 80
·1· ·significant that it will render people homeless, right?·2· · · · MR. HANSCOM:· Object to the form but go ahead.·3· ·BY THE WITNESS:·4· · · · A.· · So I think what you're -- I think what·5· ·you're looking at is this a study on the entire·6· ·United States and when you look at individual·7· ·neighborhoods in individual cities this 1 percent·8· ·increase towards this .018 percent increase in rents is·9· ·something to watch for, and as we saw in prior studies10· ·that .018 percent might be 9.2 percents, it might be11· ·other percents, so we don't know specifically what's12· ·going to happen in Chicago but we do have plenty of13· ·studies to demonstrate there is an effect on the cost14· ·of rent and as you increase rent there is an effect on15· ·the individuals who are least likely to be able to16· ·afford the rents they currently pay.17· · · · Q.· · Is it your position that any increase in18· ·rents at the top of the market will tend to work its19· ·way down such that some people on the margin will be20· ·rendered homeless?21· · · · A.· · Yes.22· · · · Q.· · Whether it's caused by short-term rentals or23· ·not?24· · · · A.· · So I think short-term rentals have come in
Page 81
·1· ·and caused what we call a supply shock and so the speed·2· ·in which they're moving in, the size in which they're·3· ·moving in, and as articles to this allude to the·4· ·frequency in which existing rental investors are taking·5· ·their units offline to rent through short-term rentals·6· ·as opposed to long-term rental has exacerbated that·7· ·issue even further.·8· · · · Q.· · Okay.· But to be clear is it your position·9· ·that if rent at the top of the market increases for any10· ·reason, even if it's not short-term rentals, that is11· ·going to work its way down into the market and render12· ·some people on the margins homeless?13· · · · · · · Is that your position?14· · · · A.· · No.15· · · · · · · My position is that if rents are increased16· ·as a result of decreased supply then that will work its17· ·way down to the market.18· · · · Q.· · And result in increased homelessness?19· · · · A.· · Correct.20· · · · Q.· · Every time?21· · · · A.· · Every time.22· · · · Q.· · So if one unit in the Trump Tower in Chicago23· ·is taken off the market that's going to increase24· ·homelessness because it's a decrease in supply?
FILE
D D
ATE:
6/2
1/20
19 6
:51
PM
2016
CH
1548
9
Page 82
·1· · · · A.· · Did that increase rents throughout the·2· ·market?·3· · · · Q.· · I don't know.· I'm asking you if you said·4· ·any change in supply at the top of the market will·5· ·increase homelessness on the other side of the market.·6· · · · A.· · No.· What I said was any change in supply·7· ·that affects rents across the market will increase·8· ·homelessness at the bottom of the market.·9· · · · · · · So if your one unit didn't increase rents10· ·across the market then your one unit didn't have an11· ·effect.12· · · · Q.· · So the removal of units from the market13· ·doesn't always increase rents?14· · · · A.· · So the removal of units from the market15· ·changes the supply and demand scenario that may have an16· ·effect on rents.17· · · · Q.· · But not necessarily?18· · · · A.· · Well, it depends on demand.19· · · · · · · So what we're dealing with is relatively20· ·strong demand, basically an elastic, and so in our21· ·situation, yes, the reduction of supply has an effect22· ·on the market.23· · · · · · · Supply and demand work independently.· So if24· ·you had too much supply and you remove a unit then not
Page 83
·1· ·a problem, you don't have too much supply.·2· · · · Q.· · At the bottom of page 4 of your report·3· ·there's a bullet point referencing an article called·4· ·The High Cost of Short-Term Rentals in New York City.·5· · · · · · · Do you see what I mean?·6· · · · A.· · I do.·7· · · · Q.· · Have you read that entire article?·8· · · · A.· · I have.·9· · · · Q.· · What methodology did the authors of that10· ·article apply?11· · · · A.· · I do not recall.12· · · · Q.· · Did that article say anything about13· ·short-term rentals' effect on homelessness?14· · · · A.· · I do not believe it specifically cited15· ·homelessness.16· · · · Q.· · Your description here says that this study17· ·found that, quote, Airbnb had increased the median18· ·long-term rent in New York City by 1.4 percent over the19· ·last three years, unquote.20· · · · · · · So that means if you were paying $1,000 a21· ·month in rent and it went up by 1.4 percent you'd have22· ·an increase in your rent of $14, right?23· · · · A.· · That would be correct.24· · · · Q.· · And you think that kind of increase in rent
Page 84
·1· ·will displace some people from their homes rendering·2· ·them homeless?·3· · · · A.· · I believe that's no different than the prior·4· ·example, but more specifically in this report they also·5· ·identify that overall the average increase in rents is·6· ·about $380 and to refer back to what I said earlier on·7· ·in that families that are in housing insecurity are a·8· ·paycheck away or as little as $400 away from·9· ·homelessness that number is pretty much right on mark.10· · · · Q.· · Okay.· But that $380 that's not everybody,11· ·right, that's just --12· · · · A.· · It's an average.13· · · · Q.· · -- an average?14· · · · · · · So some people might have zero increase?15· · · · A.· · No.16· · · · Q.· · And some people might have a greater17· ·increase?18· · · · A.· · Maybe.19· · · · Q.· · And you don't know how the increases are20· ·distributed at all, right?21· · · · A.· · I mean the only way to know is to assume22· ·that rents were a fixed rent in the first place.· So23· ·since everybody's rent is below or above market or at24· ·market there's no way to answer that question.
Page 85
·1· · · · Q.· · Could you explain that a little further?·2· · · · A.· · So if everybody's rents went up by·3· ·1.3 percent but if my individual rent was already·4· ·higher then I may not be able to get that 1.3 percent.·5· ·If I was already lower then I'm able to get more than·6· ·1.3 percent.·7· · · · Q.· · Higher or lower than what?·8· · · · A.· · The rent the area established at the time.·9· · · · · · · So not everybody's rents are pegged at10· ·$1,000.11· · · · Q.· · Oh, right.· Well, no.12· · · · · · · It doesn't matter whether it's $1,000 but --13· · · · A.· · Right.14· · · · · · · So which means -- So there's an established15· ·idea of market rent.· So let's pretend it's $1,000.16· ·Somebody could be renting currently at 950.· Somebody17· ·could be renting at 1050.· If market rents go up to18· ·1,014 that person at 1050 may stay at 1050; that person19· ·at 950 may go to 1014.20· · · · Q.· · But there's no one market price for housing.21· · · · · · · I mean there's no reason to focus on the22· ·1,000, right?23· · · · A.· · Which is why everything is done on averages.24· · · · Q.· · The amount of increase we're talking about
FILE
D D
ATE:
6/2
1/20
19 6
:51
PM
2016
CH
1548
9

Page 86
·1· ·is increased over what they would otherwise pay, right?·2· · · · A.· · No.· I believe the median long-term rent so·3· ·it's an average rent --·4· · · · Q.· · Uh-huh.·5· · · · A.· · -- for multiple people.·6· · · · · · · So it's not an individual person, it's not·7· ·an individual rent, and so when you ask me if·8· ·everybody's rent is going to go up I don't know because·9· ·I just gave an example of how everyone's rent is10· ·already different.11· · · · Q.· · Right.· Right.12· · · · · · · You don't know whether everybody's rent is13· ·going to go up or whether that 380-dollar average comes14· ·from a certain subset of people within the group of15· ·New York City who are seeing much bigger increases than16· ·380 that are being -- and then they're being offset by17· ·other people who see no increase that could be, we just18· ·don't know based on what we have here, right?19· · · · A.· · We don't know.20· · · · Q.· · Did this study say whether the increase in21· ·rent supposedly caused by Airbnb had forced anyone to22· ·leave their homes because they couldn't afford it?23· · · · A.· · I do not recall.24· · · · Q.· · Your summary of the study says Airbnb
Page 87
·1· ·removed between 7,000 and 13,500 units of housing from·2· ·New York City's long-term rental market.·3· · · · · · · Do you know how the study's authors arrived·4· ·at that range?·5· · · · A.· · I do not.·6· · · · Q.· · Do you know how the study's authors·7· ·determined whether a unit used for Airbnb would·8· ·otherwise be used for long-term rentals?·9· · · · A.· · I do not know how the authors determined10· ·that.11· · · · Q.· · Did this study say anything about short-term12· ·rentals' effect homelessness?13· · · · A.· · I do not believe this study cited anything14· ·specific to homelessness.15· · · · Q.· · Turning to page 5 of your report do you see16· ·the first bullet point there refers to an item called17· ·the economic costs and benefits of Airbnb --18· · · · A.· · I do.19· · · · Q.· · -- which was attached to your report as20· ·Exhibit C?21· · · · · · · I'm going to hand this to the court reporter22· ·to be marked as an exhibit.23· · · · · · · · · · · · (Deposition Exhibit No. 724· · · · · · · · · · · · ·marked as requested.)
Page 88
·1· ·BY MR. HEUBERT:·2· · · · Q.· · Okay.· Is this the article that was attached·3· ·to your report as Exhibit C?·4· · · · A.· · I have read this report.·5· · · · · · · Yes.·6· · · · Q.· · Could you please turn to page 13, and then·7· ·do you see the heading there Potential costs one:·8· ·Long-Term renters face rising housing costs?·9· · · · A.· · Yes.10· · · · Q.· · Do you see what I'm talking about?11· · · · A.· · I do see that.12· · · · Q.· · This is the part of this report where the13· ·author discusses how in his view short-term rentals14· ·lead to higher housing costs for long-term renters; is15· ·that right?16· · · · A.· · Yes.17· · · · Q.· · Now if you turn to page 14 and look at the18· ·next to last paragraph on that page, which is the only19· ·full paragraph on that page, do you see there it says20· ·at the end of that paragraph a number of careful21· ·empirical studies looking precisely at the effect of22· ·Airbnb introduction and expansion on housing costs?23· · · · · · · It refers to a number of what it calls24· ·careful empirical studies.
Page 89
·1· · · · · · · Do you see what I'm talking about?·2· · · · A.· · No.· I'm missing that -- the last sentence.·3· · · · Q.· · So on the only full paragraph on page 14 the·4· ·last sentence talks about studies that look at the·5· ·effect on Airbnb introduction and expansion in housing·6· ·costs.·7· · · · A.· · Sure.·8· · · · Q.· · Okay.· Then in the next paragraph do you see·9· ·that it refers to a 2016 study by Merante and Horn?10· · · · A.· · I do.11· · · · Q.· · That's the same study by Merante and Horn12· ·you refer to on page 3 of your report, isn't it?13· · · · A.· · Okay.· Sure.14· · · · Q.· · And now if you turn to page 15 and look at15· ·the first full paragraph on that page after the block16· ·quote it refers there to a 2018 study by Barron, Kung,17· ·and Proserpio.18· · · · · · · That's the same study by Barron, Proserpio19· ·that you refer to on page 4 of your report, isn't it?20· · · · A.· · True.21· · · · Q.· · And then if you look at the next paragraph22· ·on page 15 do you see it refers to a 2018 study by23· ·Sheppard and Udell?24· · · · A.· · Okay.
FILE
D D
ATE:
6/2
1/20
19 6
:51
PM
2016
CH
1548
9

Page 90
·1· · · · Q.· · That's the same study by Sheppard and Udell·2· ·you refer to on page 4 of your report, isn't it?·3· · · · A.· · I believe so.·4· · · · · · · · · · · · (Brief pause.)·5· ·BY THE WITNESS:·6· · · · A.· · Sure.·7· · · · Q.· · And now if you look at the next paragraph on·8· ·page 15, this is the last full paragraph on page 15, do·9· ·you see it refers to a 2018 study by Wachsmuth et al.?10· · · · A.· · Uh-huh.11· · · · Q.· · That's the same study by Wachsmuth et al.12· ·that you referred to on page 4 of your report, isn't13· ·it?14· · · · A.· · Yes.15· · · · Q.· · And that's the end of the Economic Policy16· ·Institute report here is discussion of short-term17· ·housing effects on rents, right?18· · · · A.· · Yes.19· · · · Q.· · So that section just summarized the same20· ·report you discussed in your report?21· · · · · · · It doesn't appear that this author did any22· ·additional research on the effects of short-term23· ·housing on rents, does it?24· · · · A.· · It does not.
Page 91
·1· · · · Q.· · Looking back at page 5 of your report -- and·2· ·we can put this exhibit aside -- do you see the second·3· ·bullet point that refers to something called selling·4· ·the district short which you attached as Exhibit D to·5· ·your report?·6· · · · A.· · Where am I looking?·7· · · · Q.· · On page 5 of your report is there an item·8· ·listed there called selling the district short?·9· · · · A.· · Oh.· Yes.10· · · · Q.· · Okay.· And that was attached as Exhibit D to11· ·your report, correct?12· · · · A.· · Yep.13· · · · MR. HEUBERT:· Okay.· I'll hand an exhibit here to14· ·the court reporter.15· · · · · · · · · · · · (Deposition Exhibit No. 816· · · · · · · · · · · · ·marked as requested.)17· · · · MR. HEUBERT:· Oh, sorry.· This one is for you and18· ·this one over here (tendering).19· ·BY MR. HEUBERT:20· · · · Q.· · Do you know who authored this item?21· · · · A.· · Not off the top my head.22· · · · · · · It says D.C. Working Families.23· · · · Q.· · What is D.C. Working Families?24· · · · A.· · Off the top of my head I am not sure.
Page 92
·1· · · · Q.· · Okay.· If you could turn to Exhibit --·2· ·excuse me -- page 8 of this exhibit do you see on·3· ·page 8 it has the heading Airbnb Impact On Affordable·4· ·Housing & Gentrification?·5· · · · A.· · I do.·6· · · · Q.· · This is the part of this report where the·7· ·author discusses the relationship between short-term·8· ·rentals and affordable housing, correct?·9· · · · A.· · Correct.10· · · · Q.· · Do you see there's a subheading there that11· ·says previous studies in the middle of the page?12· · · · A.· · Oh.· Yes.13· · · · Q.· · And then under that it discusses a June 201614· ·report by Housing Conservation Coordinators Inc. and15· ·MFY Legal Services Inc.16· · · · · · · Do you see that?17· · · · A.· · I do.18· · · · Q.· · And then there's the last sentence in that19· ·column of text that says the report found that having a20· ·high concentration of Airbnb impact listings those most21· ·likely to result in the reduction of the supply of22· ·residential rental units was strongly correlated with23· ·rapidly rising rental prices.24· · · · · · · Do you see that?
Page 93
·1· · · · A.· · I do.·2· · · · Q.· · And then there's a Footnote 18.·3· · · · · · · Can you please look at Footnote 18, which is·4· ·on page 30?·5· · · · A.· · Yeah.·6· · · · Q.· · And then we see -- can you read Footnote 18·7· ·to yourself?·8· · · · A.· · Sure.·9· · · · · · · · · · · · (Brief pause.)10· ·BY MR. HEUBERT:11· · · · Q.· · Have you done that?12· · · · A.· · Yes.13· · · · Q.· · Okay.· So the last sentence of this14· ·Footnote 18 says strong correlation suggests two15· ·variables likely related but does not prove one causes16· ·the other.17· · · · · · · So this says there's a correlation between18· ·Airbnb listings and rising long-term rental rates in a19· ·neighborhood, but it doesn't prove that the Airbnb20· ·listings or short-term rentals caused the increase in21· ·rents, correct?22· · · · A.· · That's what it says.· Correct.23· · · · Q.· · So at least based on this it's possible that24· ·rents would have gone up anyway, right?
FILE
D D
ATE:
6/2
1/20
19 6
:51
PM
2016
CH
1548
9
Page 94
·1· · · · A.· · I believe it says there's a strong·2· ·correlation of .93 out of a 1.·3· · · · Q.· · Right.·4· · · · · · · But based on this -- I mean this is telling·5· ·us, right, that based on this alone we can't say that·6· ·one causes the other?·7· · · · A.· · Yeah.· This is telling us there is a strong·8· ·correlation but does not prove one causes the other.·9· · · · Q.· · Turning back to page 8 in the last paragraph10· ·on the page do you see it references a study by11· ·something called The Real Deal?12· · · · A.· · Yes.13· · · · Q.· · Do you know what The Real Deal is?14· · · · A.· · It's just an online like real estate website15· ·journal.16· · · · Q.· · Is it an academic journal?17· · · · A.· · I do not believe so.18· · · · Q.· · Do you know who authored that item that was19· ·published in The Real Deal?20· · · · A.· · I do not.21· · · · Q.· · Have you reviewed that study by The Real22· ·Deal?23· · · · A.· · I do not recall.24· · · · Q.· · Do you know whether that study by The Real
Page 95
·1· ·Deal applied reliable econometric or statistical·2· ·methods?·3· · · · A.· · I do not.·4· · · · Q.· · Do you have any basis for determining·5· ·whether the findings of The Real Deal article are·6· ·correct?·7· · · · A.· · I do not.·8· · · · Q.· · Now turning to page 9 of Exhibit 8 at the·9· ·top of the second column do you see a reference to an10· ·item by Dayne Lee?11· · · · A.· · Yes.12· · · · Q.· · That's the same article you referenced on13· ·page 3 of your report, correct?14· · · · A.· · Correct.15· · · · Q.· · Looking further down the middle of the16· ·column 9 of Exhibit 8 do you see a reference to a study17· ·performed by Thomas Davidoff for Airbnb?18· · · · A.· · I do.19· · · · Q.· · Have you reviewed Davidoff's study?20· · · · A.· · I have not.21· · · · Q.· · Do you know whether it applied reliable22· ·econometric or statistical methods?23· · · · A.· · I do not.24· · · · Q.· · Do you see at the top of the third column
Page 96
·1· ·there's a Footnote 22?·2· · · · A.· · Uh-huh.·3· · · · Q.· · All right.· Let's look at Footnote 22 on·4· ·page 30.·5· · · · · · · Do you see that's a citation to a Wall·6· ·Street Journal blog post?·7· · · · A.· · I do.·8· · · · Q.· · So that's the only citation this publication·9· ·here provides for Davidoff's study, isn't it?10· · · · A.· · It appears so.11· · · · Q.· · Do you know whether the blog post and12· ·Footnote 22 reported Davidoff's findings accurately?13· · · · A.· · I do not.14· · · · Q.· · Do you rely on secondhand information in15· ·blog posts when you give policy advice?16· · · · A.· · So we use a lot of different mediums to17· ·provide us information, but I don't know that we rely18· ·on blog posts.19· · · · Q.· · Turning back to page 9 in the middle column20· ·do you see that it says that the study found that21· ·Airbnb increased the price of all one-bedroom units in22· ·New York by an average of $6 a month?23· · · · A.· · I do.24· · · · Q.· · Assuming that's true do you think that
Page 97
·1· ·six-dollar per month increase in rent would increase·2· ·homelessness in New York City?·3· · · · A.· · Can you say that one more time?·4· · · · Q.· · Assuming that that finding is correct do you·5· ·this that six-dollar per month increase in rent would·6· ·increase homelessness in New York City?·7· · · · A.· · I think it has to do with supply, but in·8· ·this context I think also the issue is this is not·9· ·based on long-term or impact rentals.· It is all based10· ·on shared rentals.11· · · · · · · But here nor there, yeah, I think when you12· ·reduce supply and it has an effect of increasing prices13· ·it could be an indication of the increase in14· ·homelessness.15· · · · Q.· · Okay.· But to be clear do you think that a16· ·six-dollar per month increase in rent would increase17· ·homelessness in New York City?18· · · · A.· · I believe anything that reduces supply that19· ·has an impact on rent eventually is going to have an20· ·impact on the overall affordability of units and that21· ·overall affordability then exacerbates the issue of22· ·homelessness.23· · · · Q.· · Okay.· Well, when we're talking about24· ·overall affordability we're talking about a six-dollar
FILE
D D
ATE:
6/2
1/20
19 6
:51
PM
2016
CH
1548
9

Page 98
·1· ·per month increase in rent.·2· · · · · · · Is that something you believe will render·3· ·people homeless?·4· · · · A.· · It's $6 is more than a dollar -- what did·5· ·you say before, 14 or 1.4 percent -- yes.· I think any·6· ·time you reduce the supply it has an effect on pricing,·7· ·it increases rents, you're ultimately going to have an·8· ·issue where there's going to be concerns around housing·9· ·affordability and that housing affordability results in10· ·homelessness.11· · · · Q.· · So is your answer to my question which is12· ·whether you think a six-dollar per month increase in13· ·rent would increase homelessness in New York City your14· ·answer is yes?15· · · · A.· · If that increase in rent was driven by a16· ·reduction in supply then my answer is yes.17· · · · Q.· · But not if it's not driven by a reduction in18· ·supply?19· · · · A.· · Then we're talking a ton of different20· ·variables that I don't understand how to answer your21· ·question appropriately.22· · · · Q.· · And as with other examples that six-dollar23· ·increase is an average so that could mean that some24· ·people's rent might go up by more than $6 and some
Page 99
·1· ·might go up by less or not go up at all, correct?·2· · · · A.· · Correct.·3· · · · Q.· · Let's turn to page 19 of this exhibit.·4· · · · · · · As you can see this says that the median·5· ·rent increase across Airbnbs topped 20 neighborhoods in·6· ·Washington D.C. was 14.9 percent compared to an average·7· ·rate increase of 11 percent across the District of·8· ·Columbia as a whole, correct?·9· · · · A.· · Correct.10· · · · Q.· · Now, if you could please read aloud the11· ·second paragraph -- full paragraph under the box on12· ·this page.13· · · · A.· · While the table below demonstrates that many14· ·of the top neighborhoods for Airbnb were also some of15· ·most rapidly gentrified neighborhoods in the district16· ·it does not prove Airbnb caused the increase.· For17· ·example, it is possible that commercial short-term18· ·rental operations are most viable in gentrifying19· ·neighborhoods and that they locate in such20· ·neighborhoods for that reason.21· · · · Q.· · Do you disagree with that paragraph?22· · · · A.· · I think anything is possible.· It's23· ·definitely possible that they may locate in gentrifying24· ·neighborhoods.
Page 100
·1· · · · Q.· · Okay.· We can put this aside and turn back·2· ·to your report.·3· · · · · · · On page 5 under the heading Responses to·4· ·Dr. Moore in the first bullet point there you address·5· ·Dr. Moore's statement that New York City is always an·6· ·outlier.· And you say there at his deposition Dr. Moore·7· ·could cite no academic literature supporting these·8· ·opinions.·9· · · · · · · Can you cite any academic literature10· ·refuting the idea that there is a rule of thumb in11· ·economics that New York City is always an outlier?12· · · · A.· · Yes.· Anything that talks about the laws of13· ·supply and demand does not -- puts asterisk that says14· ·New York is an outlier.15· · · · Q.· · Okay.· But for empirical analyses are you16· ·aware of any -- anything that says that the empirical17· ·data from New York City may be an outlier?18· · · · A.· · I have never heard that.19· · · · Q.· · Okay.· You've never heard it.20· · · · · · · Have you ever seen anything saying that it's21· ·not true?22· · · · A.· · I've never heard any or read anything that23· ·has ever said New York is an outlier for any sort of24· ·analysis.
Page 101
·1· · · · Q.· · Okay.· Have you surveyed the academic·2· ·literature looking for anything on that point?·3· · · · A.· · I have not looked for anything on that·4· ·point, but I have definitely come across many instances·5· ·of articles written about New York or indications of·6· ·housing concerns in New York and none of them had said·7· ·this is an outlier.·8· · · · Q.· · You also say on page 5 it is true that·9· ·New York City is more dense than Chicago, but I see no10· ·reason to believe that the effects of Airbnb found in11· ·New York City would not be expected to occur in Chicago12· ·as well.13· · · · · · · When you say New York City is more dense do14· ·you mean there's more population density?15· · · · A.· · I believe I'm responding to Dr. Moore saying16· ·that New York is more dense, but when I think about17· ·density I think about the density of living in a18· ·particular area and so how many units are clustered on19· ·one piece of land.20· · · · Q.· · And could it be that New York City given its21· ·existing density has less room to increase its housing22· ·stock than a less dense city such as Chicago?23· · · · A.· · Can you repeat that?24· · · · Q.· · Could it be that New York City has less room
FILE
D D
ATE:
6/2
1/20
19 6
:51
PM
2016
CH
1548
9
Page 102
·1· ·to increase its housing stock than a less dense city·2· ·such as Chicago?·3· · · · A.· · So New York is very good about building up·4· ·so I don't know that I would answer that question as·5· ·true or false.· I think both cities respond to their·6· ·density needs and availability but Chicago does have·7· ·more available land and so we are not forced to build·8· ·as tall as maybe New York would be.·9· · · · Q.· · Is it easy to build up if you own a property10· ·in New York that isn't already built up?11· · · · A.· · I don't have the expertise of New York to be12· ·able to answer that question, but they do build a lot.13· · · · Q.· · How do you know?14· · · · A.· · Because I've work with New York City in the15· ·high cost housing forum and they're often -- they're16· ·always spending more resources and building more units17· ·than we are.18· · · · Q.· · More units of affordable housing?19· · · · A.· · Housing in general but also affordable.20· ·Yes.21· · · · Q.· · Do you have any sense of the magnitude of22· ·that?23· · · · A.· · I have a sense of the magnitude but nothing24· ·that I could quote specifically.
Page 103
·1· · · · Q.· · Do you have anything more specific you can·2· ·say about it?·3· · · · A.· · So my budget is $100 million and I know that·4· ·New York's budget is at least a billion dollars.·5· · · · Q.· · But that doesn't necessarily reflect how·6· ·much more building they do, right?·7· · · · · · · There could be other things affecting --·8· · · · A.· · It does.· They have tremendously more·9· ·production than we do.10· · · · Q.· · But it's not necessarily whatever a ten to11· ·one or whatever that was, right, because --12· · · · A.· · Oh, I don't know.13· · · · · · · Yeah.· I don't know.14· · · · Q.· · It could be more -- a lot more expensive to15· ·build something in New York than in Chicago, right?16· · · · A.· · They could also leverage their money17· ·differently.18· · · · Q.· · Okay.· But the answer to my question is yes19· ·or no?20· · · · A.· · I don't know.21· · · · Q.· · Okay.· Looking at the top of page 6 of your22· ·report you say that you and your staff, quote, found23· ·that there are many Airbnb listings in almost every24· ·neighborhood of Chicago, unquote.
Page 104
·1· · · · · · · Did your review consider how often the·2· ·places listed on Airbnb are rented out?·3· · · · A.· · So my review is from AirDNA and I believe·4· ·the review specifically was cited around the total·5· ·amount of active listings, those that were full home·6· ·listings and those that were shared rooms and I believe·7· ·there was another category amongst that.· I do not·8· ·believe if the time was a factor.·9· · · · Q.· · Okay.· So is the answer to my question no?10· · · · A.· · The answer is I do not recall if time is a11· ·factor.12· · · · Q.· · Did your study take into account whether a13· ·property listed on Airb [sic] is ever actually rented14· ·out?15· · · · A.· · So my study is a reflection of the active16· ·listings.17· · · · Q.· · So the fact that something is listed?18· · · · A.· · Correct.19· · · · Q.· · You don't know whether a given property was20· ·ever actually rented out; you just know it was listed?21· · · · A.· · Correct.22· · · · Q.· · And it's possible a place could be listed on23· ·Airbnb but never rented out at all, right?24· · · · A.· · It could be, which is also the same effect
Page 105
·1· ·of removing it from the market.·2· · · · Q.· · Only if a person is choosing not to live·3· ·there also?·4· · · · A.· · Right.·5· · · · Q.· · If it's vacant essentially?·6· · · · A.· · Right.·7· · · · Q.· · But a person could list a place, not rent it·8· ·out, and the place wouldn't be vacant, right?·9· · · · A.· · If a person was living in a place and they10· ·listed it and they -- then, yes, it would not be vacant11· ·because they live there.12· · · · MR. HEUBERT:· Next exhibit here.13· · · · · · · · · · · · (Deposition Exhibit No. 914· · · · · · · · · · · · ·marked as requested.)15· ·BY MR. HEUBERT:16· · · · Q.· · Is this Exhibit E that you attached to your17· ·report?18· · · · A.· · It is but mine was much more legible.19· · · · Q.· · Okay.· Can I see yours to make sure that20· ·there is not some special legibility problem?21· · · · A.· · No.· I'm having a hard time reading that22· ·gray box under rental type.· I think it was just a23· ·matter of clarity on the printout.24· · · · Q.· · Can you explain what this shows?
FILE
D D
ATE:
6/2
1/20
19 6
:51
PM
2016
CH
1548
9
Page 106
·1· · · · A.· · So this shows a point in time all the active·2· ·rentals that are listed on a multiple number of·3· ·short-term rental networks of which the concentration·4· ·is on the north and northwest sides there is more or·5· ·less citywide and then predominately they're entire·6· ·home rentals.·7· · · · Q.· · It appears to me there are vast areas of the·8· ·south side with no Airbnb listings at all, right?·9· · · · A.· · It does appear that way.10· · · · Q.· · In fact, once you get south of I-55 and west11· ·of I-90 they're really sparse, aren't they?12· · · · A.· · I would not say they're really sparse.13· ·They're still heavily concentrated east of the Dan Ryan14· ·along the lake shore.15· · · · Q.· · Okay.· But I said west of I-90.16· · · · A.· · Okay.17· · · · Q.· · They're sparse west of I-90 --18· · · · A.· · Sure.19· · · · Q.· · -- right?20· · · · A.· · So is our population.· Yes.21· · · · · · · The density of housing in Chicago is22· ·predominately where the graph reflects.23· · · · Q.· · Okay.· But there are people living in all24· ·this gray area on this map, right?
Page 107
·1· · · · A.· · There are people living in those areas but·2· ·not at all to the same density or level of the rest of·3· ·the city.·4· · · · Q.· · Sure.·5· · · · · · · But this isn't all just industrial area or·6· ·something?·7· · · · A.· · No.· Some of it.· Some of it but not all of·8· ·it.·9· · · · Q.· · And some of this gray area would include10· ·some of Chicago's poorest neighborhoods, wouldn't it?11· · · · A.· · It would.12· · · · Q.· · It also looks relatively sparse on the west13· ·side north of I-290, doesn't it?14· · · · A.· · I mean it's all relative, but there are15· ·units along Austin along the northwest side, sure, but16· ·I think the graph accurately reflects kind of the17· ·density of housing in the city.18· · · · Q.· · Would you also say it tends to correlate19· ·with higher incomes in the city?20· · · · A.· · No.· I don't know that you can make that21· ·assessment.22· · · · · · · I mean our neighborhoods in general are --23· ·are often economically diverse more so than people24· ·would like to believe.
Page 108
·1· · · · Q.· · You mean within neighborhoods --·2· · · · A.· · Within neighborhoods.·3· · · · Q.· · -- there's more economic diversity?·4· · · · A.· · Absolutely.·5· · · · Q.· · But yet some neighborhoods in Chicago that·6· ·are simply poor and don't have economic diversity; is·7· ·that fair to say?·8· · · · A.· · No.· You definitely have some neighborhoods·9· ·with very low income residents but it doesn't mean10· ·everybody is poor.11· · · · Q.· · And wouldn't those neighborhoods with the12· ·higher concentrations of people with lower incomes many13· ·of them be located in this gray area where we don't see14· ·much home sharing activity?15· · · · A.· · Oh, I don't know about that.· We have16· ·affordable residences throughout the city.17· · · · Q.· · I'm not sure I understand your answer to my18· ·question.19· · · · A.· · What was your question again?20· · · · Q.· · So there are some neighborhoods in this city21· ·with much higher percentages of low incomes than some22· ·other neighborhoods?23· · · · · · · There are some neighborhoods we would24· ·describe as predominately low income, is that fair?
Page 109
·1· · · · A.· · So there are.· Yes, you could say that.·2· · · · Q.· · And many of those neighborhoods would be·3· ·included within the gray areas as we see on this map·4· ·where there is little or no home sharing activity; is·5· ·that fair to say?·6· · · · A.· · I think it is fair to say that some areas of·7· ·the southwest sides represent lower income·8· ·neighborhoods but not all areas of the gray are·9· ·residential.· Some of them are industrial.10· · · · Q.· · Are you familiar with the Wharton Index?11· · · · A.· · Not off the top of my head, no.12· · · · MR. HEUBERT:· I have one last exhibit.13· · · · · · · · · · · · (Deposition Exhibit No. 1014· · · · · · · · · · · · ·marked as requested.)15· ·BY MR. HEUBERT:16· · · · Q.· · Okay.· Would you agree with me this appears17· ·to be excerpts from the deposition of Dr. Adrian Moore18· ·in this case?19· · · · A.· · It appears to be.· Yes.20· · · · Q.· · If you look at page 23 the first full21· ·paragraph it says the amount of available developable22· ·space is extremely limited in New York in a way that it23· ·isn't in other major U.S. cities.24· · · · · · · Do you agree with that statement?
FILE
D D
ATE:
6/2
1/20
19 6
:51
PM
2016
CH
1548
9

Page 110
·1· · · · A.· · No.·2· · · · Q.· · Why do you disagree?·3· · · · A.· · I think there are a lot of landlocked cities·4· ·in the country.· So I think San Francisco is a great·5· ·corollary.·6· · · · Q.· · Okay.· Are there others you can think of·7· ·that are comparable in that respect?·8· · · · A.· · I think Boston is very similar.·9· · · · Q.· · Is Chicago similar?10· · · · A.· · So parts of Chicago are similar but not all11· ·of Chicago is similar.12· · · · · · · I mean I would argue Seattle is also up13· ·there in that same sense.· Portland.14· · · · Q.· · If you could look at Dr. Moore's answer that15· ·begins on the page at the bottom of page 23 and16· ·continues on to the top of page 24.17· · · · · · · · · · · · (Brief pause.)18· ·BY MR. HEUBERT:19· · · · Q.· · Do you agree with what Dr. Moore says there?20· · · · · · · · · · · · (Brief pause.)21· ·BY THE WITNESS:22· · · · A.· · So I believe Dr. Moore is correct when he23· ·says that less flexible markets are going to have24· ·different shapes to their elasticity curves than other
Page 111
·1· ·markets that are less constrained.· Yes.·2· · · · Q.· · Okay.· Then further down the page can you·3· ·see where it says in Dr. Moore's answer two main·4· ·reasons and he says under the Wharton Index Chicago·5· ·scores as more flexible than New York City?·6· · · · · · · Do you know whether that's correct?·7· · · · A.· · I am not familiar with the Wharton Index.·8· · · · Q.· · And then if you could read the rest of that·9· ·paragraph and tell me when you're done I'll ask you a10· ·question about that.11· · · · · · · · · · · · (Brief pause.)12· ·BY THE WITNESS:13· · · · A.· · Sure.14· · · · Q.· · Do you know whether Dr. Moore's correct in15· ·his discussion of differences between New York and16· ·Chicago suburbs?17· · · · A.· · So I believe he's making the distinction18· ·that the suburbs in New York are also very dense19· ·compared to the suburbs here, and I would agree that20· ·that is true.21· · · · · · · But I would also agree with his statement22· ·earlier that the elasticity is dependent on a number of23· ·factors including supply and demand and adjustments and24· ·essentially laws and policies.
Page 112
·1· · · · · · · So density is not the only factor and·2· ·buildable land is not the only factor.·3· · · · Q.· · First full paragraph on page 25 says Chicago·4· ·has a lot more opportunity for things to shift in·5· ·appreciable ways than the much denser and·6· ·over-developed New York profile does.·7· · · · · · · Do you know whether that's correct?·8· · · · A.· · I don't think that's correct.·9· · · · Q.· · Why not?10· · · · A.· · Because elasticity both on supply and demand11· ·have to do with a lot of a number of things beyond just12· ·density.13· · · · · · · I mean if -- if, for example, New York has14· ·liberal zoning laws that allow you to develop really15· ·tall then their density is easily achieved so it's a16· ·lot more elastic; whereas, compare it to a north shore17· ·suburb where they're restricted to single-family zoning18· ·they're not going to allow you to have any density so19· ·it is extremely inelastic.20· · · · Q.· · Do you know whether New York has liberal21· ·zoning laws as you described?22· · · · A.· · I do not.· I am not an expert on New York.23· · · · Q.· · If you could read Dr. Moore's answer on24· ·page 26 and let me know when you're done I'll ask you
Page 113
·1· ·about that.·2· · · · · · · · · · · · (Brief pause.)·3· ·BY THE WITNESS:·4· · · · A.· · Okay.·5· · · · Q.· · Do you think Dr. Moore's statement about·6· ·data from a single city is correct?·7· · · · A.· · So I think what he's saying is that there is·8· ·no definitive indication that New York will affect·9· ·Chicago, but I think he is also -- so I think he is10· ·somewhat correct that you do have an inference that may11· ·affect policymaking so I somewhat do disagree that12· ·his -- that it's -- that it's just a remote conclusion,13· ·and I do disagree that any economist would have any14· ·engagement in the policy conclusions.15· · · · Q.· · You disagree with his statement at the end I16· ·don't think any economist would say based on a result17· ·from New York we can draw policy conclusions?18· · · · A.· · So I think -- Well, actually I take that19· ·back.· You're absolutely correct.20· · · · · · · We can begin to create policy conclusions.21· ·So I think he and I are both dancing around two heads22· ·of the same coin.23· · · · Q.· · I'm not sure I understand.24· · · · · · · Do -- The last sentence of his answer there
FILE
D D
ATE:
6/2
1/20
19 6
:51
PM
2016
CH
1548
9
Page 114
·1· ·do you agree with it or disagree with it?·2· · · · A.· · So I'm not sure what an economist would say·3· ·about their policy conclusions, but I think instances·4· ·from New York provide indications that we should be·5· ·concerned with in Chicago and that we would need to·6· ·consider what happens in New York and other cities·7· ·before we make policy conclusions.·8· · · · Q.· · All right.· Before our last thing to look at·9· ·in this deposition do you see the question and answer10· ·it begins on page 48 and continues on to page 49 and 5011· ·and could you read that to yourself, please, and then12· ·let me know when you're done?13· · · · · · · · · · · · (Brief pause.)14· ·BY THE WITNESS:15· · · · A.· · Okay.16· · · · Q.· · Do you see on the -- now on page 49 the last17· ·full paragraph Dr. Moore says so in each of the steps18· ·of that causal chain, there are many other influences,19· ·orders of magnitude stronger.20· · · · · · · Do you disagree with that statement?21· · · · MR. HANSCOM:· Just object to the form but go22· ·ahead.23· ·BY THE WITNESS:24· · · · A.· · So I'm not sure if I agree or disagree.
Page 115
·1· · · · · · · There are a number of -- There are a number·2· ·of instances that are not specific to just the·3· ·availability of a unit or the cost of a unit and so·4· ·yes.·5· · · · · · · How I weight those I'm not necessarily sure.·6· · · · Q.· · Do you recall in Dr. Moore's report he noted·7· ·that the city government may have policies that·8· ·restrict the supply of housing in the city?·9· · · · A.· · I don't know -- I don't recall him saying10· ·the city may, but I do recall him saying the City has11· ·the tools to change the supply of housing.· Yes.12· · · · Q.· · Do you agree with that?13· · · · A.· · Yeah, absolutely.14· · · · Q.· · And do you think the City of Chicago has15· ·certain policies in place now that restrict the supply16· ·of housing compared to what it could be?17· · · · A.· · I think every city has instances where they18· ·can improve their supply through policy change,19· ·absolutely.20· · · · Q.· · And are some of those restrictions on what21· ·residential buildings can be placed on certain22· ·properties?23· · · · A.· · What residential buildings can be placed on24· ·certain properties that's not what I was specifically
Page 116
·1· ·thinking of now.· No.· But that is generally something·2· ·that at least in Chicago you can get a zoning change.·3· · · · · · · So if you were looking to change it from·4· ·commercial to residential you could likely do that.·5· · · · · · · So it depends on -- That's really less of a·6· ·policy issue but that can occur.·7· · · · Q.· · Anybody can get a zoning change?·8· · · · A.· · It's fairly easy.· We are fairly liberal in·9· ·our willingness to provide zoning changes to homeowners10· ·and residents.11· · · · · · · We are residentially friendly.12· · · · Q.· · Don't you need your alderman's blessing for13· ·that?14· · · · A.· · No.15· · · · Q.· · No?16· · · · A.· · No.17· · · · Q.· · Doesn't it help?18· · · · A.· · I don't know.19· · · · Q.· · Aren't there some properties in Chicago say20· ·where there might currently be a three-flat but if you21· ·were to tear it down you could only build a22· ·single-family residence based on the current zoning?23· · · · A.· · I don't -- If there was it would be24· ·grandfathered in.· It would be kind of an outside --
Page 117
·1· ·That would be an outlier.·2· · · · · · · If you have the existing density then you're·3· ·generally granted the existing density.· It is rare to·4· ·see an area in which multifamily buildings exist and it·5· ·is downsized to single family, but I am by no means a·6· ·zoning expert.·7· · · · MR. HEUBERT:· Okay.· Well, why don't we take·8· ·another short break and we'll just see if we have·9· ·anything else we need to cover, and we're probably10· ·getting close to the end.11· · · · MR. HANSCOM:· Sounds good.12· · · · · · · · · · · · (A recess is taken.)13· · · · MR. HEUBERT:· I think we're done.14· · · · MR. HANSCOM:· Oh, great.· Okay.15· · · · MR. HEUBERT:· Sorry to make you sit down.16· · · · · · · Do you have anything?17· · · · MR. HANSCOM:· No.18· · · · THE COURT REPORTER:· Signature?19· · · · MR. HANSCOM:· We'll reserve signature.20· · · · THE COURT REPORTER:· Did you need this21· ·transcribed?22· · · · MR. HEUBERT:· Yes, please.23· · · · THE COURT REPORTER:· Did you want a copy?24
FILE
D D
ATE:
6/2
1/20
19 6
:51
PM
2016
CH
1548
9
Page 118
·1· ·MR. HANSCOM:· Yeah, please.·2· · · · · · · · · ·(Witness excused.)·3·4·5·6·7·8·9101112131415161718192021222324
Page 119·1· ·STATE OF ILLINOIS· )· · · · · · · · · · · · )· SS.·2· ·COUNTY OF COOK· · ·)·3· · · · · IN THE CIRCUIT COURT OF COOK COUNTY, ILLINOIS·4· · · · · · COUNTY DEPARTMENT, CHANCERY DIVISION·5· ·LEILA MENDEZ and ALONSO ZARAGOZA,· )· · · · · · · · · · · · · · · · · · · · )·6· · · · · · · · · · Plaintiffs,· · · ·)· · · · · · · · · · · · · · · · · · · · )·7· · · · · vs.· · · · · · · · · · · · ·)· No. 16 CH 15489· · · · · · · · · · · · · · · · · · · · )·8· ·CITY OF CHICAGO, et al.,· · · · · ·)· · · · · · · · · · · · · · · · · · · · )·9· · · · · · · · · · Defendants.· · · ·)10· · · · · · · I, BRYAN ESENBERG, state that I have read· · ·the foregoing transcript of the testimony given by me11· ·at my deposition on the 30th day of April, A.D., 2019,· · ·and that said transcript constitutes a true and correct12· ·record of the testimony given by me at the said· · ·deposition except as I have so indicated on the errata13· ·sheets provided herein.14· · · · · · · · · · · · ·____________________________· · · · · · · · · · · · · · · · BRYAN ESENBERG151617· ·No corrections (Please initial)__________________· · ·Number of errata sheets submitted__________(pgs.)18· · ·SUBSCRIBED AND SWORN to19· ·before me this _____ day· · ·of ______________, 2019.20· · ·______________________________21· · · · · NOTARY PUBLIC222324
Page 120·1· ·STATE OF ILLINOIS· )
· · · · · · · · · · · · )· SS.
·2· ·COUNTY OF COOK· · ·)
·3
·4· · · · · · · I, Jennifer Vravis, Registered Professional
·5· ·Reporter and Notary Public, do hereby certify that on
·6· ·the 30th day of April, A.D., 2019, the deposition of
·7· ·the witness, BRYAN ESENBERG, called by the Plaintiffs,
·8· ·was taken before me, reported stenographically, and was
·9· ·thereafter reduced to typewriting under my direction.
10· · · · · · · The said deposition was taken at the offices
11· ·of City of Chicago - Department of Law Revenue
12· ·Litigation Division, 30 North LaSalle Street,
13· ·Suite 1020, Chicago, Illinois, and there were present
14· ·counsel as previously set forth.
15· · · · · · · The said witness, BRYAN ESENBERG, was first
16· ·duly sworn to tell the truth, the whole truth, and
17· ·nothing but the truth, and was then examined upon oral
18· ·interrogatories.
19· · · · · · · I further certify that the foregoing is a
20· ·true, accurate, and complete record of the questions
21· ·asked of and answers made by the said witness, BRYAN
22· ·ESENBERG, at the time and place hereinabove referred
23· ·to.
24
Page 121·1· · · · · · · The signature of the witness, BRYAN
·2· ·ESENBERG, was reserved by agreement of counsel.
·3· · · · · · · The undersigned is not interested in the
·4· ·within case, nor of kin or counsel to any of the
·5· ·parties.
·6· · · · · · · Witness my official signature and seal as
·7· ·Notary Public in and for Cook County, Illinois, on this
·8· ·8th day of May, A.D., 2019.
·9
10
11· · · · · · · · · · · · _____________________________
· · · · · · · · · · · · · ·JENNIFER VRAVIS, RPR
12· · · · · · · · · · · · ·180 North LaSalle Street
· · · · · · · · · · · · · ·Suite 2800
13· · · · · · · · · · · · ·Chicago, Illinois 60601
· · · · · · · · · · · · · ·Phone:· (312) 236-6936
14
15· ·CSR No. 084-004556
16
17
18
19
20
21
22
23
24
FILE
D D
ATE:
6/2
1/20
19 6
:51
PM
2016
CH
1548
9
Page 122·1· ·Errata Sheet
·2
·3· ·NAME OF CASE: Mendez vs City of Chicago
·4· ·DATE OF DEPOSITION: 04/30/2019
·5· ·NAME OF WITNESS: Bryan Esenberg
·6
·7· ·Page _____ Line ______ Reason _________________________
·8· ·From _______________________ to _______________________
·9· ·Page _____ Line ______ Reason _________________________
10· ·From _______________________ to _______________________
11· ·Page _____ Line ______ Reason _________________________
12· ·From _______________________ to _______________________
13· ·Page _____ Line ______ Reason _________________________
14· ·From _______________________ to _______________________
15· ·Page _____ Line ______ Reason _________________________
16· ·From _______________________ to _______________________
17· ·Page _____ Line ______ Reason _________________________
18· ·From _______________________ to _______________________
19· ·Page _____ Line ______ Reason _________________________
20· ·From _______________________ to _______________________
21· ·Page _____ Line ______ Reason _________________________
22· ·From _______________________ to _______________________
23
24· ·______________________
· · ·SIGNATURE OF DEPONENT
FILE
D D
ATE:
6/2
1/20
19 6
:51
PM
2016
CH
1548
9
FILE
D D
ATE:
6/2
1/20
19 6
:51
PM
2016
CH
1548
9
FILE
D D
ATE:
6/2
1/20
19 6
:51
PM
2016
CH
1548
9

FILE
D D
ATE:
6/2
1/20
19 6
:51
PM
2016
CH
1548
9
FILE
D D
ATE:
6/2
1/20
19 6
:51
PM
2016
CH
1548
9
FILE
D D
ATE:
6/2
1/20
19 6
:51
PM
2016
CH
1548
9
FILE
D D
ATE:
6/2
1/20
19 6
:51
PM
2016
CH
1548
9

FILE
D D
ATE:
6/2
1/20
19 6
:51
PM
2016
CH
1548
9
FILE
D D
ATE:
6/2
1/20
19 6
:51
PM
2016
CH
1548
9

FILE
D D
ATE:
6/2
1/20
19 6
:51
PM
2016
CH
1548
9
FILE
D D
ATE:
6/2
1/20
19 6
:51
PM
2016
CH
1548
9
FILE
D D
ATE:
6/2
1/20
19 6
:51
PM
2016
CH
1548
9

FILE
D D
ATE:
6/2
1/20
19 6
:51
PM
2016
CH
1548
9

FILE
D D
ATE:
6/2
1/20
19 6
:51
PM
2016
CH
1548
9
FILE
D D
ATE:
6/2
1/20
19 6
:51
PM
2016
CH
1548
9

Exhibit O
FILE
D D
ATE:
6/2
1/20
19 6
:51
PM
2016
CH
1548
9

D000015
FILE
D D
ATE:
6/2
1/20
19 6
:51
PM
2016
CH
1548
9

D000016
FILE
D D
ATE:
6/2
1/20
19 6
:51
PM
2016
CH
1548
9

D000017
FILE
D D
ATE:
6/2
1/20
19 6
:51
PM
2016
CH
1548
9

D000018
FILE
D D
ATE:
6/2
1/20
19 6
:51
PM
2016
CH
1548
9
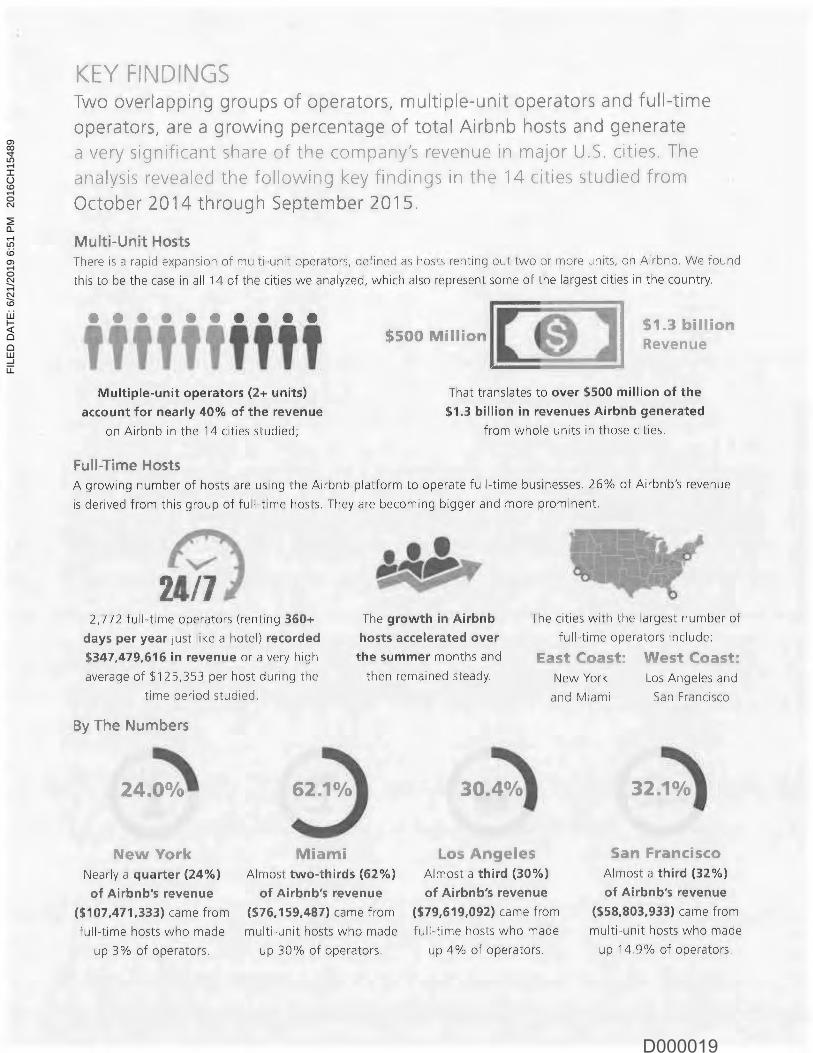
D000019
FILE
D D
ATE:
6/2
1/20
19 6
:51
PM
2016
CH
1548
9
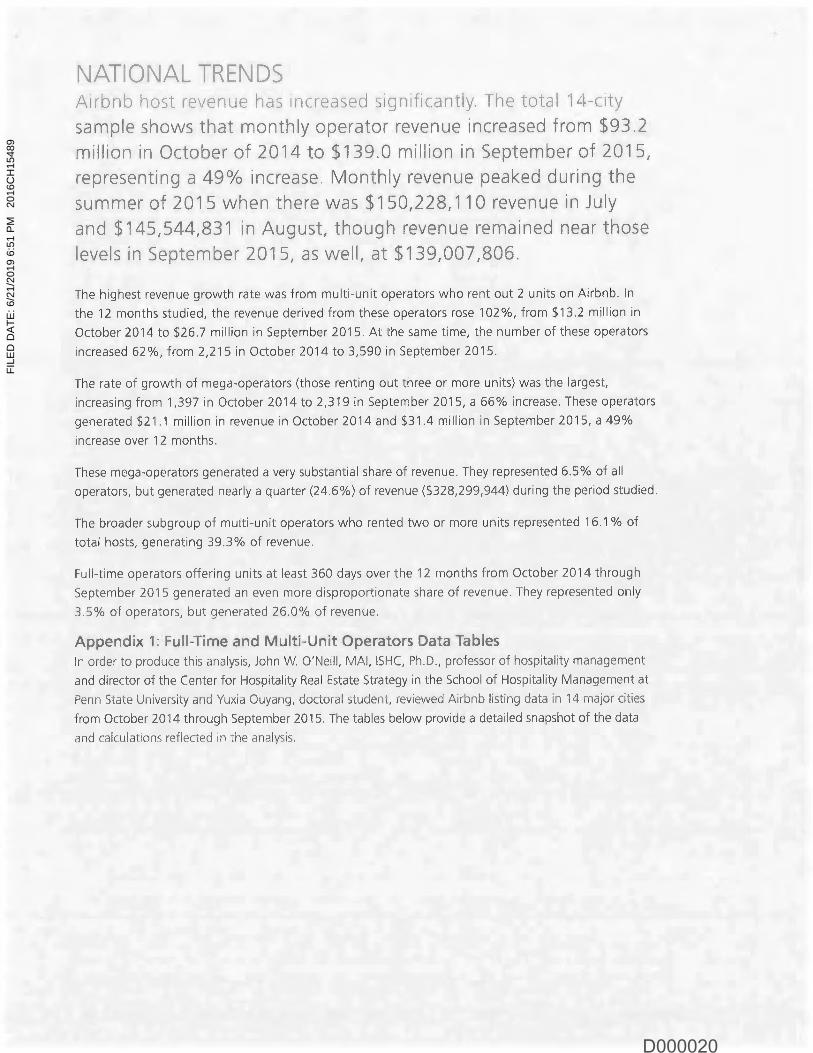
D000020
FILE
D D
ATE:
6/2
1/20
19 6
:51
PM
2016
CH
1548
9
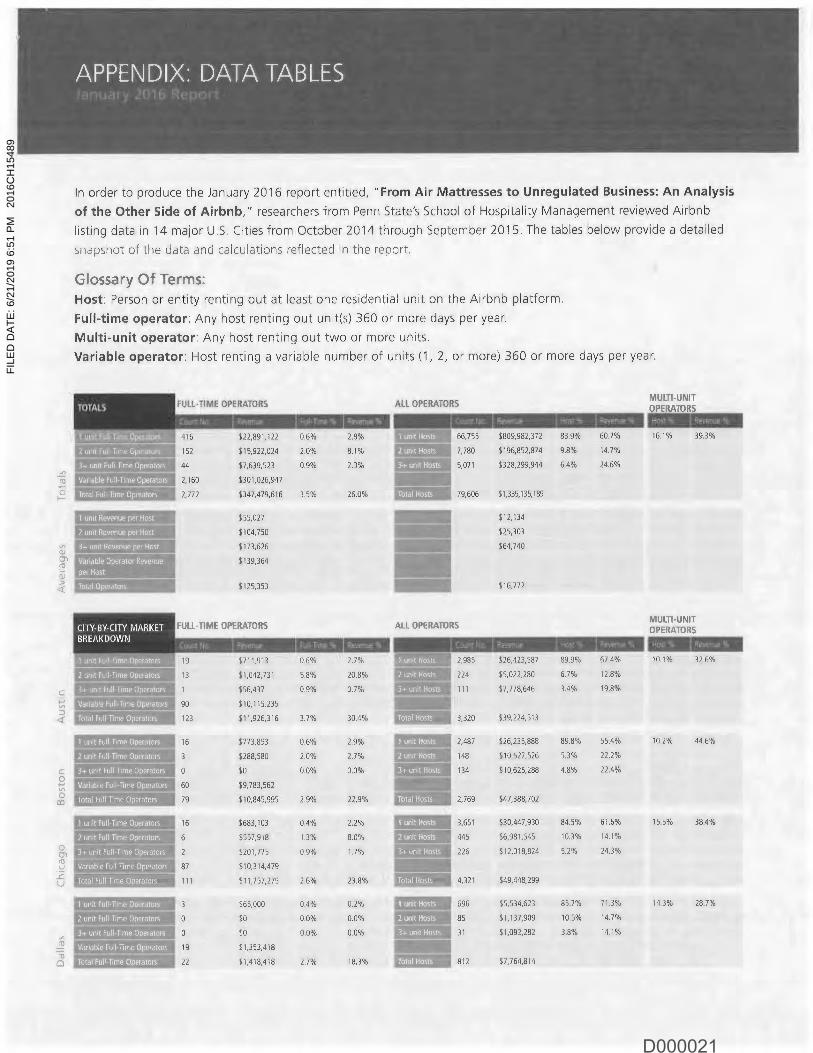
D000021
FILE
D D
ATE:
6/2
1/20
19 6
:51
PM
2016
CH
1548
9
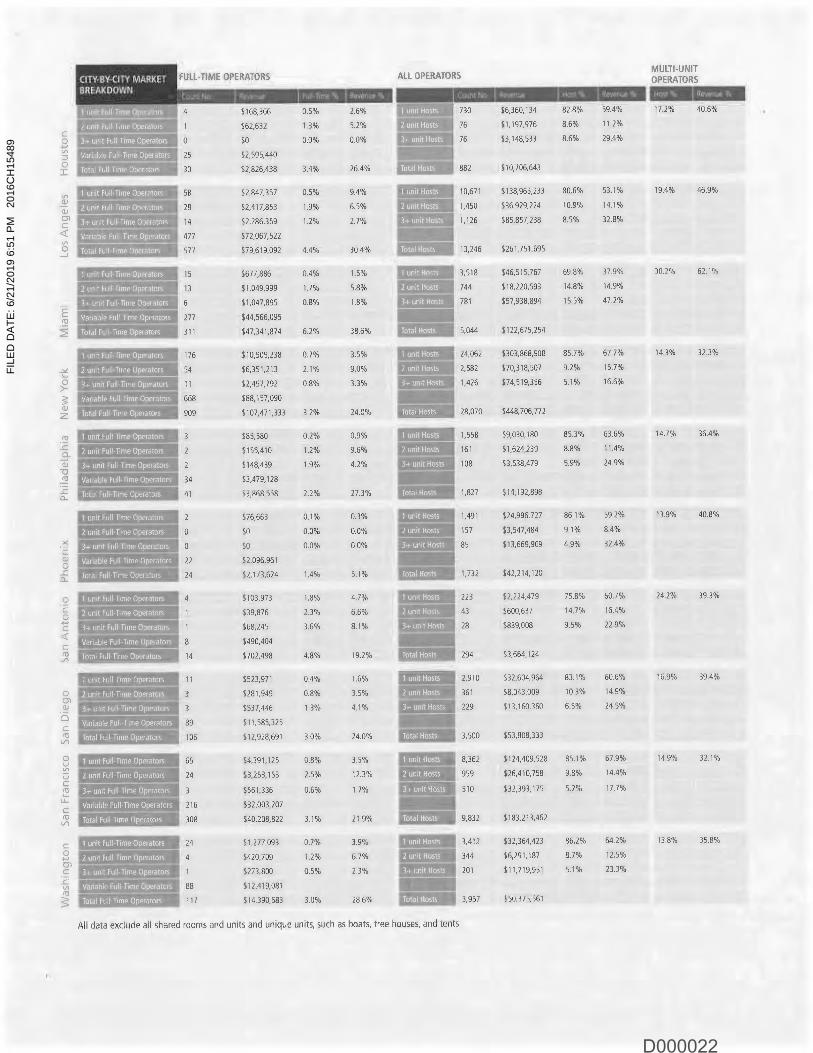
D000022
FILE
D D
ATE:
6/2
1/20
19 6
:51
PM
2016
CH
1548
9

D000023
FILE
D D
ATE:
6/2
1/20
19 6
:51
PM
2016
CH
1548
9
D000024
FILE
D D
ATE:
6/2
1/20
19 6
:51
PM
2016
CH
1548
9
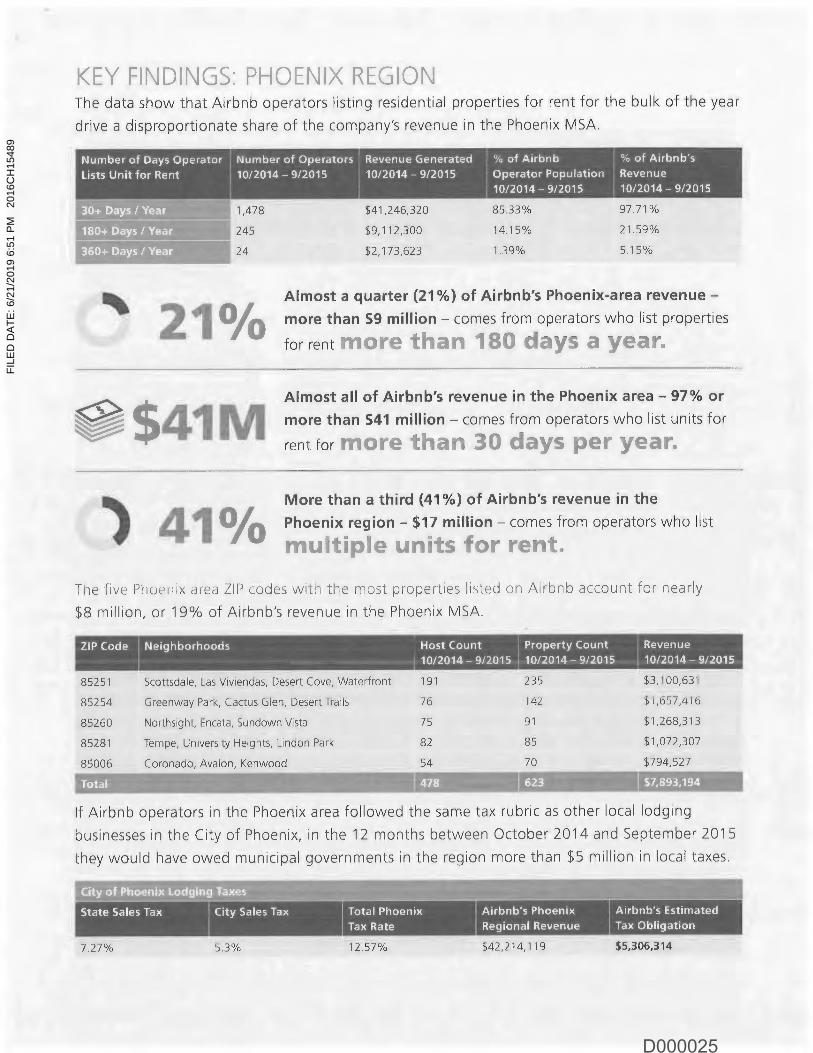
D000025
FILE
D D
ATE:
6/2
1/20
19 6
:51
PM
2016
CH
1548
9

D000026
FILE
D D
ATE:
6/2
1/20
19 6
:51
PM
2016
CH
1548
9

D000027
FILE
D D
ATE:
6/2
1/20
19 6
:51
PM
2016
CH
1548
9
D000028
FILE
D D
ATE:
6/2
1/20
19 6
:51
PM
2016
CH
1548
9

D000029
FILE
D D
ATE:
6/2
1/20
19 6
:51
PM
2016
CH
1548
9

D000030
FILE
D D
ATE:
6/2
1/20
19 6
:51
PM
2016
CH
1548
9

D000031
FILE
D D
ATE:
6/2
1/20
19 6
:51
PM
2016
CH
1548
9

D000032
FILE
D D
ATE:
6/2
1/20
19 6
:51
PM
2016
CH
1548
9

D000033
FILE
D D
ATE:
6/2
1/20
19 6
:51
PM
2016
CH
1548
9

D000034
FILE
D D
ATE:
6/2
1/20
19 6
:51
PM
2016
CH
1548
9

D000035
FILE
D D
ATE:
6/2
1/20
19 6
:51
PM
2016
CH
1548
9
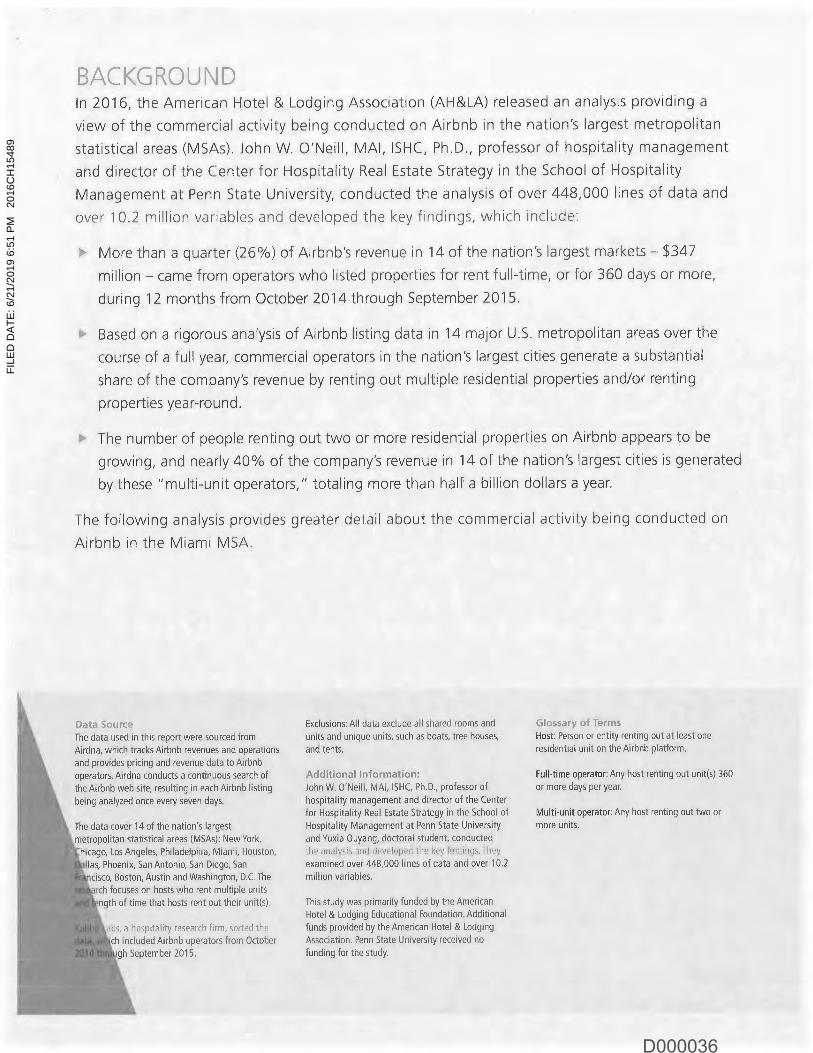
D000036
FILE
D D
ATE:
6/2
1/20
19 6
:51
PM
2016
CH
1548
9
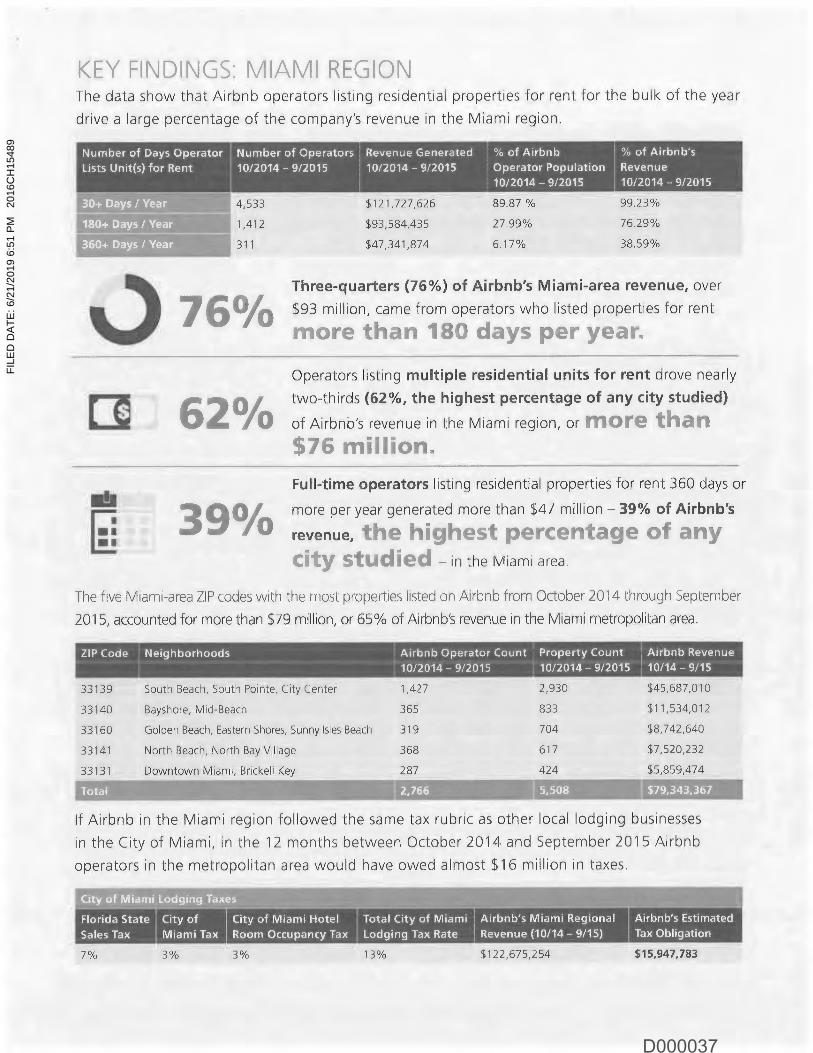
D000037
FILE
D D
ATE:
6/2
1/20
19 6
:51
PM
2016
CH
1548
9

D000038
FILE
D D
ATE:
6/2
1/20
19 6
:51
PM
2016
CH
1548
9

D000039
FILE
D D
ATE:
6/2
1/20
19 6
:51
PM
2016
CH
1548
9
D000040
FILE
D D
ATE:
6/2
1/20
19 6
:51
PM
2016
CH
1548
9

D000041
FILE
D D
ATE:
6/2
1/20
19 6
:51
PM
2016
CH
1548
9
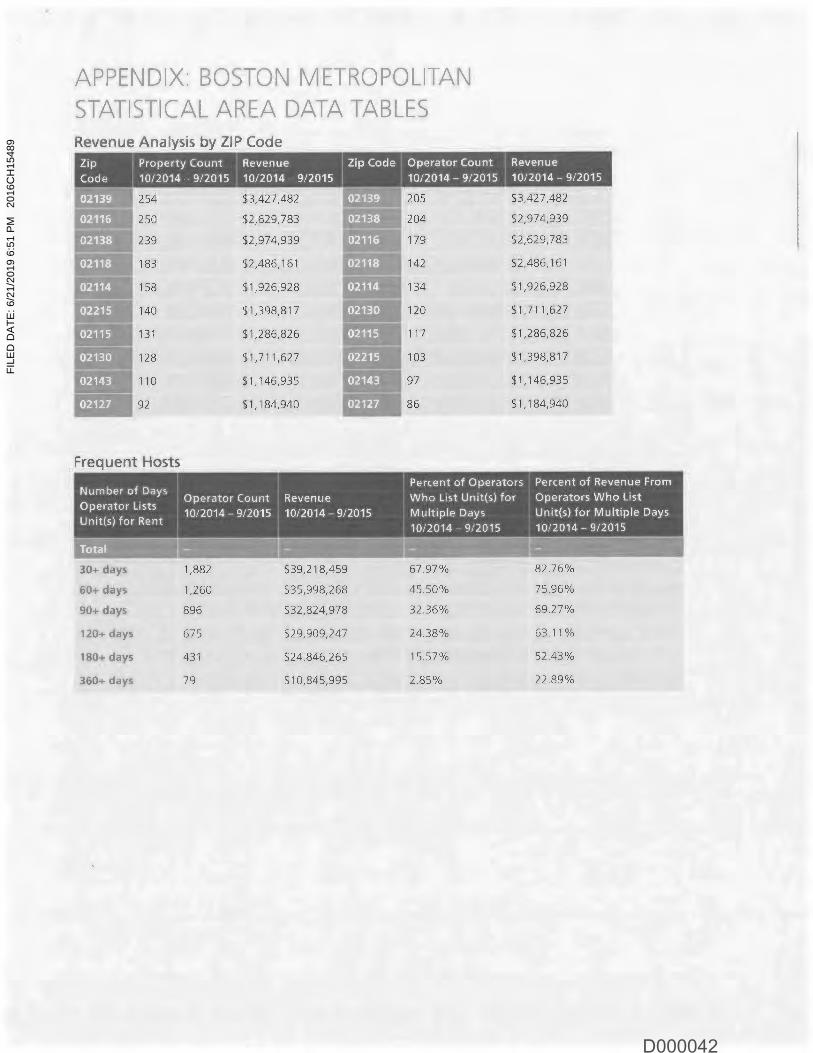
D000042
FILE
D D
ATE:
6/2
1/20
19 6
:51
PM
2016
CH
1548
9
D000043
FILE
D D
ATE:
6/2
1/20
19 6
:51
PM
2016
CH
1548
9

D000044
FILE
D D
ATE:
6/2
1/20
19 6
:51
PM
2016
CH
1548
9

D000045
FILE
D D
ATE:
6/2
1/20
19 6
:51
PM
2016
CH
1548
9

D000046
FILE
D D
ATE:
6/2
1/20
19 6
:51
PM
2016
CH
1548
9

D000047
FILE
D D
ATE:
6/2
1/20
19 6
:51
PM
2016
CH
1548
9
D000048
FILE
D D
ATE:
6/2
1/20
19 6
:51
PM
2016
CH
1548
9
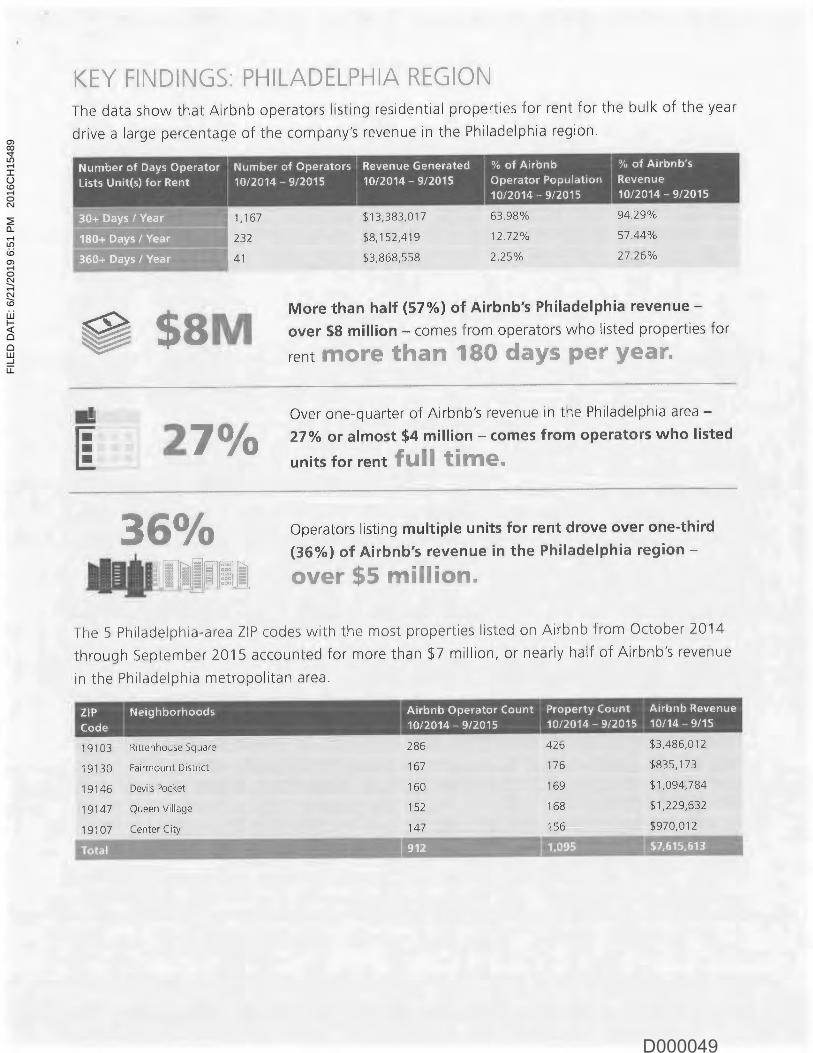
D000049
FILE
D D
ATE:
6/2
1/20
19 6
:51
PM
2016
CH
1548
9
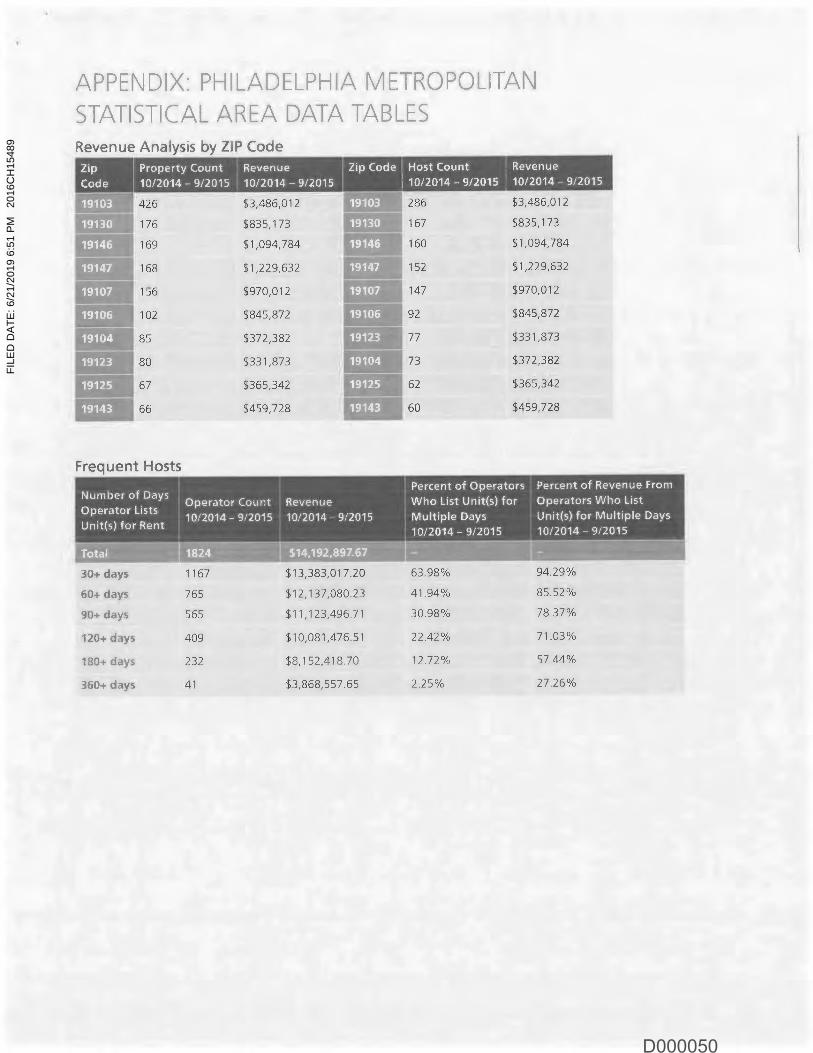
D000050
FILE
D D
ATE:
6/2
1/20
19 6
:51
PM
2016
CH
1548
9

D000051
FILE
D D
ATE:
6/2
1/20
19 6
:51
PM
2016
CH
1548
9

D000052
FILE
D D
ATE:
6/2
1/20
19 6
:51
PM
2016
CH
1548
9

D000053
FILE
D D
ATE:
6/2
1/20
19 6
:51
PM
2016
CH
1548
9

D000054
FILE
D D
ATE:
6/2
1/20
19 6
:51
PM
2016
CH
1548
9

D000055
FILE
D D
ATE:
6/2
1/20
19 6
:51
PM
2016
CH
1548
9