March 15, 2016 - Cook County Clerk
116
-
Upload
khangminh22 -
Category
Documents
-
view
1 -
download
0
Transcript of March 15, 2016 - Cook County Clerk


COOK COUNTY CLERK DAVID ORR69 W. Washington, Suite 500, Chicago, Illinois 60602
tel (312) 603-0996 fax (312) 603-9788 web cookcountyclerk.com
Dear Friends:
The March 15, 2016 Presidential Primary shattered modern-day records going back more than 25 years. The popularity of initiatives such as Online Voter Registration and Election Day Registration, as well as registration and voting for 17-year-olds, proved there is a great desire by voters to take part in the electoral process. This was the first presidential election to include Election Day Registration and voting by 17-year-olds who will be 18-years-old by the General Election – offerings we found to be very popular with suburban Cook County voters.
This 2016 Presidential Primary Post-Election Report takes a comprehensive look at the voting totals, trends and statistics during the March primary throughout suburban Cook County. Below is a sample size of the standout primary numbers:
• Voting before Election Day – by mail, or during early voting and grace period voting – accounted for 22 percent of all ballots cast in this election.
• Early Voting set a new primary record with 113,641 ballots cast in a Presidential Primary.• More than 23,000 suburban Cook County voters took advantage of Election Day Registration.• Nearly 4,400 17-year-olds voted, accounting for 62 percent of the 7,085 who registered to vote.• Donald Trump won 25 of the 30 Suburban Cook County Townships, garnering his best total in
Stickney Township, with 62.1 percent of the vote.• Hillary Clinton and Bernie Sanders were separated by just nine votes in Norwood Park Township
(Clinton: 1,859; Sanders: 1,850). • Roughly 80 percent of Election Day registrants hold an Illinois driver’s license or state ID that shows
the address at which they registered. Automatic Voter Registration, which I support, would have registered all of these people, speeding up polling place voter check-ins.
The election broke numerous other records for a suburban Cook County Presidential Primary election, including: overall turnout, number of mail ballots returned, and number of registered voters.
As always, this report is available at cookcountyclerk.com.
Sincerely,
David OrrCook County Clerk


Suburban Cook County PoSt-eleCtion rePort
March 15, 2016 Presidential Primary Election
Table of Contents
Record Turnout in Presidential Primary 1
Map: Turnout of Registered Voters by Precinct
2
Modern-Day Record Number of Registered Voters in a Presidential Primary
3
Historical Turnout by Party 4
Party Turnout by Township 5
Map: Party Ballots Cast for President 6
Republican Turnout by Township vs. 2012
7
Map: Votes for Republican Presidential Candidate by Precinct
8
Trump Wins 25 of 30 Suburban Cook Townships
9
Map: Votes for Democratic Presidential Candidate
10
High Margins of Victory Key For Clinton in Suburban Cook
11
Map: Votes for State’s Attorney by Precinct
12
Foxx Wins 52.2% of Suburban Cook Votes
13
Top 25 Precincts by Voter Turnout 14
Pre-Election Day Voting Sets Modern-Day Record, Mail Ballot Voting Increased Over 200%
15
Map: Early Voting Turnout 16
Charts: Voting by Age, Gender and Party
17
Map: Election Day Registrations 18
Election Day Registration Overwhelmingly Popular with Younger Voters
19
An Online Presence in the Presidential Primary
20-21
Election Day Photos 22-23
(continued on next page)

Suburban Cook County PoSt-eleCtion rePort
March 15, 2016 Presidential Primary Election
Table of Contents
Summary Report• Ballots Cast 25
• DEM - President 25
• DEM - U.S. Senator 25
• DEM - Illinois Comptroller 25
• DEM - Rep. in Congress 25-27
• DEM - Delegate, National Convention
27-33
• DEM - State Senator 33-36
• DEM - State Representative 36-43
• DEM - Water Reclamation Commissioner
43
• DEM - State’s Attorney 44
• DEM - Clerk of the Circuit Court 44
• DEM - Recorder of Deeds 44
• DEM - County Board of Review 44
• DEM - Appellate Court Judges 44
• DEM - Circuit Court Judges 45-46
• DEM - Subcircuit Court Judges 46-50
• DEM - Ward Committeemen 50-56
• REP - President 56
• REP - U.S. Senator 56
• REP - Illinois Comptroller 56
• REP - Rep. in Congress 57-58
• REP - Delegate, National Convention
58-79
• REP - State Senator 79-82
• REP - State Representative 82-89
• REP - Water Reclamation Commissioner
89
• REP - State’s Attorney 89
• REP - Clerk of the Circuit Court 90
• REP - Recorder of Deeds 90
• REP - County Board of Review 90
• REP - Appellate Court Judges 90
• REP - Circuit Court Judges 90-92
• REP - Subcircuit Court Judges 92-94
• REP - Ward Committeemen 94-101
• GRN - Rep. in Congress 101
• GRN - Ward Committeemen 101-102
• Winnetka Village Trustee 102
• Referenda 102-107
• Write-In Votes 108

1
reCord turnout in PreSidential Primary
Suburban Cook County voter turnout climbed to an all-time high for a presidential primary election at nearly 49 percent. Aside from the presidential races, numerous hotly contested races — including the race for Cook County State’s Attorney — contributed to increased participation.
The record-setting turnout can also be attributed to recent popular programs such as Election Day Registration and voting by 17-year-olds who will be 18-years-old by the General Election. Cook County and Illinois have made access to the ballot easier than ever — resulting in a surge in voter registration and participation.
Presidential Primary Election Turnout: 1992-2016
Year Registered Voters Ballots Cast Turnout1992 1,185,460 476,517 40.2%1996 1,216,588 309,772 25.5%2000 1,219,409 282,041 23.1%2004 1,295,632 406,115 31.3%2008 1,350,580 585,449 43.3%2012 1,394,649 329,537 23.6%2016 1,443,261 701,525 48.6%
Suburban Cook County Turnout in Presidential Primary and General Elections
75.9%65.7%
72.9% 74.3% 73.5% 70.7%
40.2%
25.5% 23.1%31.3%
43.3%
23.6%
48.6%
0%10%20%30%40%50%60%70%80%90%
100%
1992 1996 2000 2004 2008 2012 2016
Perce
nt T
urno
ut
General Primary

2
10
41
9
2
8
19
6
3
7
36
23
5
18
11
34
4
21
13
45
14
39
27
38
1
28
12
20
32
24
25
17
29
16
47
40
50
37
22
31
15
42
26
43
33 46
44
49
48
3035
.
David OrrCook County Clerk
Chicago
Indicates Forest Preserve Area
Barrington Palatine Wheeling Northfield NewTrier
Hanover Schaumburg Elk Grove Maine Niles
Evanston
Leyden
Proviso
NorwoodPark
OakPark
Ber
wyn Cicero
RiverForest
Riverside
Lyons
Stickney
Lemont
PalosWorth
Orland Bremen Thornton
Rich Bloom
Calumet
March 15, 2016 Presidential Primary ElectionCook County, Illinois
Turnout of Registered Voters by Precinct
% Turnout
Stickney
41
For further election results, please visit www.cookcountyclerk.com for suburban Cook County, and www.chicagoelections.com for the City of Chicago.
The numbers on the Chicago portion of the map indicate each Chicago ward.
City of Chicago precinct data provided by the Chicago Board of Elections Commissioners.
<35%
35 - 39%
40 - 44%
45 - 49%
>50%
SUMMARYRegistered
Voters TurnoutPercent Turnout
Suburban Cook County 1,443,261 701,525 48.6City of Chicago 1,514,912 810,823 53.5Cook County Total 2,958,173 1,512,348 51.1

3
modern-day reCord number of regiStered VoterS in a PreSidential Primary
The 2016 Presidential Primary had a record number of registered voters. There were 48,000 more registered voters in this year’s primary than the 2012 primary record of 1,394,649.
Various outreach efforts and programs helped add eligible voters to the rolls, two of which were implemented for the first time in a presidential primary: Election Day Registration and 17-year-old voting. Together, the two programs added over 30,000 eligible voters.
Over 7,000 new 17-year-old voters who will turn 18 by the November election were added to the rolls through dozens of events held at suburban Cook County high schools.
Registered Voters in Suburban Cook County
Election Registered Voters Ballots Cast Turnout2016 Presidential Primary 1,443,261 701,525 48.6%2014 Gubernatorial General 1,398,724 696,403 49.8%2014 Gubernatorial Primary 1,452,593 232,088 16.0%2012 Presidential General 1,416,811 1,001,693 70.7%2012 Presidential Primary 1,394,649 329,537 23.6%2010 Gubernatorial General 1,370,186 719,090 52.5%2010 Gubernatorial Primary 1,439,415 367,688 25.5%2008 Presidential General 1,436,210 1,056,242 73.5%2008 Presidential Primary 1,350,580 585,449 43.3%2006 Gubernatorial General 1,370,230 680,696 49.7%2006 Gubernatorial Primary 1,383,846 345,970 25.0%2004 Presidential General 1,378,159 1,024,867 74.3%2004 Presidential Primary 1,295,632 406,115 31.3%2002 Gubernatorial General 1,365,947 697,872 51.1%2002 Gubernatorial Primary 1,313,943 438,844 33.4%2000 Presidential General 1,308,940 954,769 72.9%2000 Presidential Primary 1,219,409 282,041 23.1%1998 Gubernatorial General 1,262,137 680,917 53.9%1998 Gubernatorial Primary 1,348,524 322,970 23.9%1996 Presidential General 1,328,808 872,447 65.7%1996 Presidential Primary 1,216,588 309,772 25.5%1994 Gubernatorial General 1,272,630 632,598 49.7%1994 Gubernatorial Primary 1,270,171 355,620 28.0%1992 Presidential General 1,399,886 1,062,229 75.9%1992 Presidential Primary 1,185,460 476,517 40.2%

4
HiStoriCal turnout by Party
Democratic vs. Republican Ballots in Suburban Cook County1992-2016
63%60%
47%
56%53%
64%69%
66%
76%
65%
53%
46%
68%
35% 37%
51%
42% 44%
35%
29%33%
23%
35%
46%
55%
32%
10%
20%
30%
40%
50%
60%
70%
80%
90%
DEM
REP
The majority of ballots cast in suburban Cook County have been Democratic in every election since 1992 except March of 1996 and 2014.
During this year’s primary, 68 percent of suburban Cook County voters took Democratic ballots. The share of Republican voters fell to 32 percent, a 23 percent drop from the party’s record high seen in the 2014 primary.
Primary Total Ballots Cast Democratic RepublicanMarch 1992* 476,517 63% 35%March 1994 355,620 60% 37%March 1996 * 309,772 47% 51%March 1998 322,970 56% 42%March 2000* 282,041 53% 44%March 2002 438,844 64% 35%March 2004* 406,115 69% 29%March 2006 345,970 66% 33%February 2008* 585,449 76% 23%February 2010 367,688 65% 35%March 2012* 329,537 53% 46%March 2014 232,088 46% 55%March 2016* 701,525 68% 32%
* Presidential Election Years - Percentages do not include third-party or nonpartisan ballots

5
Party turnout by townSHiP
A majority of voters overall – 67.9 percent – took Democratic ballots, as well as a majority of voters in 26 townships. The highest percentage of Democratic ballots were cast in Calumet Township (95.4 percent). The greatest turnout by Republican voters was in Barrington Township, where 64.5 percent cast ballots in the Presidential Primary. Oak Park Township had the highest turnout of suburban Cook County’s 30 townships – 64.3 percent – followed by Evanston Township (63.1 percent).
Township Total Ballots Cast DEM Ballots DEM % REP Ballots REP % Turnout
Barrington 5,128 1,822 35.5% 3,306 64.5% 46.9%Berwyn 12,930 10,826 83.7% 2,104 16.3% 49.7%Bloom 24,411 20,113 82.4% 4,298 17.6% 46.4%Bremen 30,257 22,251 73.5% 8,006 26.5% 45.5%Calumet 5,428 5,180 95.4% 248 4.6% 49.3%Cicero 13,926 12,013 86.3% 1,913 13.7% 48.0%Elk Grove 21,280 11,747 55.2% 9,533 44.8% 45.9%Evanston 28,356 24,804 87.5% 3,552 12.5% 63.1%Hanover 19,349 11,535 59.6% 7,814 40.4% 40.9%Lemont 6,626 2,648 40.0% 3,978 60.0% 46.0%Leyden 19,717 12,236 62.1% 7,481 37.9% 43.7%Lyons 32,224 19,004 59.0% 13,220 41.0% 50.1%Maine 35,281 20,846 59.1% 14,435 40.9% 45.5%New Trier 23,077 13,092 56.7% 9,985 43.3% 57.4%Niles 29,694 21,336 71.9% 8,358 28.1% 45.8%Northfield 29,382 16,433 55.9% 12,949 44.1% 50.2%Norwood Park 6,423 3,801 59.2% 2,622 40.8% 41.6%Oak Park 22,739 19,585 86.1% 3,154 13.9% 64.3%Orland 29,745 14,784 49.7% 14,961 50.3% 44.5%Palatine 30,439 14,713 48.3% 15,726 51.7% 47.8%Palos 15,012 7,833 52.2% 7,179 47.8% 45.1%Proviso 45,695 37,322 81.7% 8,373 18.3% 52.1%Rich 28,131 25,245 89.7% 2,886 10.3% 55.3%River Forest 4,338 2,953 68.1% 1,385 31.9% 57.3%Riverside 5,890 3,610 61.3% 2,280 38.7% 55.3%Schaumburg 32,323 19,026 58.9% 13,297 41.1% 44.7%Stickney 9,329 6,756 72.4% 2,573 27.6% 46.7%Thornton 48,934 44,609 91.2% 4,325 8.8% 47.8%Wheeling 42,982 22,592 52.6% 20,390 47.4% 48.4%Worth 42,192 27,546 65.3% 14,646 34.7% 47.6%Suburban Cook 701,238 476,261 67.9% 224,977 32.1% 48.6%
- Ballots cast does not include Green Party or Nonpartisan ballots.

6
10
41
9
2
8
19
6
3
7
36
23
5
18
11
34
4
21
13
45
14
39
27
38
1
28
12
20
32
2425
17
29
16
47
40
50
37
22
31
15
42
2643
33 46
44
49
48
3035
Cic
ero
Harlem
Tri-S
tate
95th
87th
Golf
Archer
Sauk
1st
Kedzie
159th
Wolf
167th
Rand
Touhy
I 290
Northwest
Oakton
Ede
ns
Ogden
Milwaukee
Higgins
Torr
ence
La Grange
Palatine
111th
127th
Wes
tern
Kennedy
Euclid
Devon
Dix
ie
Roosevelt
103rd
135th
Lake Cook
147th
Ela
Cermak
Irving Park
Ash
land
47th
Leg D
an R
yan
25th
5th
Eisenhower
Lake Shore
Elston
Ros
elle
143rd
Willow
31st
Mannheim
Lake
175th
Grand
Dan
Rya
n
River
104t
h
Adlai Stevenson
Bar
tlett
Dempster
Joliet
Cen
tral
183rd
Bar
ringt
on
Hal
sted
She
ridan
Moline
Foster
80th
115th
Wau
kega
n
Vollmer
Chicago
14th
Sta
te
Mic
higa
n
55th
123rd
Bishop Ford
Lee
231st
Cal
umet
Hintz
Sibley
108t
h
Joe Orr
107th
Woo
d
Main
Schaumburg
Bel
l
Rid
gela
nd
East
Bode
Penny
Roberts88th
Sko
kie
Pul
aski
Otis
Que
ntin
84th
26th
94th
Cal
iforn
ia
Glenview
Oak
Par
k
Sout
hwes
t
Arli
ngto
n H
eigh
ts
Mea
cham
Talcott
170th
Church
63rd
17th
138th
Washington
130th
119th
Lincoln
179th
Addison
Sanders
Mor
gan
Techny
Busse
Pfin
gste
n
Wise
76th
Flossmoor
Will
Coo
k
Caldwell
Sut
ton
186th
162nd
86th
Steger
Elm
hurs
t
Gov
erno
rs
Peterson
Garfield
Nerge
Hib
bard
Mc Carthy
Wen
twor
th
Shermer
Cot
tage
Gro
ve
Cum
berla
nd
Tower
Doc
tor M
artin
Lut
her K
ing
Jr
Wilk
e
Ston
y Isla
nd
Hill
Diversey
82nd
Nag
le
Brin
ker
That
cher
Bat
eman
Ridge
Kingery
Kensington East Lake
Augusta
Mc
Cor
mic
k
Lawrence
Belmont
College
Shoe Factory
Dundee
Edens Expy
Montrose
Land
weh
r
New
Wes
t
Ballard
153rd
Walters
79th
Pershing
Vermont
Willow
Springs
Franklin
Col
fax
Howard
Lehigh
Asb
ury
Elgin-O'Hare
Jackson
Il 171C
raw
ford
Calumet Sag
100th
106th
Rose
Plainfield
North
Midlothian
Des P
laines River
Villa
Madison
Wag
ner
Green Bay
Glenwood-Dyer
Hic
ks
Summit
La S
alle
Kirchoff
Sun
set R
idge
Brainard
Taft
Canal
Hawtho
rne
Sch
oenb
eck
139th
Bradwell
Giff
ord
Columbu
s
Forestway
Greenwood
Har
ms
Butterfield
Winnetka
142nd
Mundhank
River Oaks
Plu
m G
rove
Voltz
Hea
ly
Landmeier
171st
65th
Glenwood-Lansing
Old
Sut
ton
Vincennes
Cen
ter
Saint Charles
Hap
p
Michigan City
51st
Des
Pla
ines
Bur
nham
Dolton
Can
field
Holbrook
I 57
Thacker
151st
Cor
k
Donlea
South Shore
131stE
win
g
Cor
nell
Freeman
Sm
ith
Hou
gh
West Lake
Pot
ter
Kem
man
Mou
nt P
rosp
ect
GunnisonBu
ffalo
Gro
ve
91st
Beckwith
Loomis
Avondale
MargaretThornton Lansing
Biesterfield
Hyde P
ark
Baldwin
Har
woo
d
Park
Congdon
Kea
n
Clark
County Line
Algonquin
Fullerton
Whe
elin
g
Old Glenview
Thornton
German Church
Hun
tingt
on
Web
er
Burlington
East-West
Riegel
Eas
t Riv
er
Maple
Elgin
39th
Cal-Sag
Nob
le
Indi
ana
Nolton
43rd
Mac
kina
w
Rub
y
Spr
ingi
nsgu
th
New
Wilke
Memorial
Wat
erm
an
Hoh
lfeld
er
177th
Nar
raga
nset
t
South
State
Ash
land
Lee
Fullerton
76th
Elm
hurs
t
127th
Wol
f
Golf
Cen
tral
Lawrence
Sut
ton
Ashland
Higgins
Cra
wfo
rd
31st
103rd
Brainard
104t
h
Wol
f
79th
Ela
26th
North
Chicago
County Line
Chicago
CentralCentral
Ked
zie
North
119th
Rid
gela
nd
183rd Riegel Main
Ash
land
Higgins
Ked
zie
87th
Northwest
Ridge
Vinc
enne
s
Central
Hic
ks
Cen
tral
103rd
Algonquin
Foster
Rid
ge
Cen
tral
Pul
aski
123rd
Lake
Bus
se
Lincoln
25th
Lincoln
31st
Devon
Plainfi
eld
North
175th
State
Lehigh
Wol
f
Ridgeland 111th
Northwest
Healy
47th
Lake
Ash
land
Addison
Pul
aski
Bur
nham
Gov
erno
rs
Cou
nty
Line
131st
Archer
Mai
n
Cermak
Sheridan
231st
Tri-State
Sta
te
Cen
tral
Oak
Par
k
Augusta
Bartlett
County Line
Dundee
Main
26th
131st
Wes
tern
Steger
Plu
m G
rove
Riv
er
Ked
zie
151st 151st
Wolf
Irving Park
Chi
cago
Pershing
80th
State171st
Wes
tern
Hal
sted
Southw
est
Skokie
135th
Kean
Palatine
Schaumburg
Glenview
Skokie
Hoffman Estates
Des Plaines
Alsip
Niles
Matteson
Wheeling
Cicero
Oak Lawn
Evanston
Lemont
Dolton
Elk Grove Village
Streamwood
Lynwood
Bartlett
Markham
Burbank
Bedford Park
Justice
Worth
Orland Park
Barrington Hills
Northbrook
Tinley Park
Elgin
Arlington Heights
Lansing
Harvey
Mount Prospect
Inverness
Park Ridge
Chicago Heights
Wilmette
Calumet CityOak Forest
South Holland
Berwyn
Oak Park
South Barrington
Homewood
Glencoe
Palos Hills
Winnetka
Franklin Park
Riverdale
Morton Grove
Bridgeview
Blue Island
Rolling Meadows
Flossmoor
Lyons
Park Forest
Northlake
Melrose Park
Sauk Village
Brookfield
StegerRichton Park
Mc Cook
Crestwood
Hazel Crest
Summit
Hillside
Palos Heights
Maywood
Midlothian
Hodgkins
Country Club Hills
Westchester
Willow Springs
Thornton
Barrington
Prospect Heights
Burr Ridge
CountrysideLa Grange
Hickory Hills
Stickney
Palos Park
Schiller Park
Burnham
Forest Park
Evergreen Park
River Forest
Norridge
River Grove
Hanover Park
Rosemont
Glenwood
Posen
Western Springs
Broadview
Robbins
Buffalo Grove
Chicago Ridge
Berkeley
La Grange Park
Ford Heights
Hinsdale
Roselle
Golf
Forest View
Orland Hills
Kenilworth
Deerfield
Phoenix
Hometown
Frankfort
University Park
Deer Park
Oak Brook
David OrrCook County Clerk
For further election results, please visit www.cookcountyclerk.com for suburban Cook County, and www.chicagoelections.com for the City of Chicago.
The numbers on the Chicago portion of the map indicate each Chicago ward.
City of Chicago precinct data provided by the Chicago Board of Elections Commissioners.
.BarringtonPalatine
Wheeling NorthfieldNewTrier
Hanover Schaumburg Elk Grove Maine Niles
Evanston
Leyden
NorwoodPark
Proviso
RiverForest
Riverside
OakPark
Ber
wyn Cicero
Chicago
Lyons
Stickney
LemontPalos Worth
Calumet
OrlandPalos Thornton
Rich Bloom
March 15, 2016 Presidential Primary ElectionCook County, Illinois
Party Ballots Cast for President
41
Stickney
Indicates Forest Preserve Area
% Ballots CastRepublicanDemocratic
65 - 79%
50 - 64%
35 - 49%20 - 34%
<20%
>95%
80 - 94%>5%
6 - 20%
21 - 35%
36 - 50%
51 - 65%
66 - 80%
>80%
SUMMARYRegistered
VotersBallots Cast
Democratic Ballots Cast
Republican Ballots Cast
Suburban Cook County 1,443,261 701,525 476,261 224,977City of Chicago 1,514,912 810,823 720,812 89,540Cook County Total 2,958,173 1,512,348 1,197,073 314,517

7
rePubliCan turnout by townSHiP VS. 2012
In 29 of suburban Cook County’s 30 townships, more ballots were cast in the Republican Presidential Primary than in 2012. The township that saw the highest increase in Republican ballots cast was Stickney, where the number of Republican ballots nearly doubled from 2012. Overall, the number of Republican ballots cast in suburban Cook County increased by 46.2 percent compared to the 2012 Presidential Primary.
Township 2012 REP Ballots Cast
% of Total Turnout
2016 REP Ballots cast
% of Total Turnout
% Change in Ballots Cast
Barrington 2,232 80.2% 3,306 64.6% 48.1%Berwyn 1,267 29.1% 2,087 16.3% 64.7%Bloom 3,017 25.3% 4,279 17.6% 41.8%Bremen 5,323 39.6% 7,901 26.4% 48.4%Calumet 275 12.7% 248 4.6% -9.8%Cicero 1,314 25.1% 1,893 13.7% 44.1%Elk Grove 6,389 65.5% 9,489 44.9% 48.5%Evanston 2,862 20.8% 3,521 12.5% 23.0%Hanover 4,681 60.0% 7,763 40.4% 65.8%Lemont 2,525 77.1% 3,962 60.1% 56.9%Leyden 4,956 61.9% 7,442 38.0% 50.2%Lyons 8,540 52.0% 13,146 41.0% 53.9%Maine 9,941 63.6% 14,354 41.0% 44.4%New Trier 7,191 58.2% 9,890 43.3% 37.5%Niles 6,059 44.7% 8,297 28.2% 36.9%Northfield 9,206 57.6% 12,873 44.2% 39.8%Norwood Park 1,656 55.7% 2,603 41.0% 57.2%Oak Park 2,206 22.4% 3,139 13.9% 42.3%Orland 9,685 66.9% 14,863 50.3% 53.5%Palatine 10,535 74.2% 15,621 51.7% 48.3%Palos 5,485 64.5% 7,126 48.0% 29.9%Proviso 5,614 28.7% 8,333 18.3% 48.4%Rich 2,299 16.5% 2,865 10.3% 24.6%River Forest 971 45.5% 1,374 32.0% 41.5%Riverside 1,617 58.7% 2,261 38.8% 39.8%Schaumburg 8,074 55.7% 13,247 41.2% 64.1%Stickney 1,338 37.4% 2,560 27.6% 91.3%Thornton 3,052 13.1% 4,309 8.9% 41.2%Wheeling 14,629 66.7% 20,253 47.5% 38.4%Worth 9,915 53.8% 14,516 34.7% 46.4%Suburban Cook 152,854 46.8% 223,495 32.1% 46.2%

8
10
41
9
2
8
19
6
3
7
36
23
5
18
11
34
4
21
13
45
14
39
27
38
1
28
12
20
32
2425
17
29
16
47
40
50
37
22
31
15
42
2643
33 46
44
49
48
3035
David OrrCook County Clerk
.BarringtonPalatine
Wheeling NorthfieldNewTrier
Hanover Schaumburg Elk Grove Maine Niles
Evanston
Leyden
NorwoodPark
Proviso
RiverForest
Riverside
OakPark
Ber
wyn Cicero
Chicago
Lyons
Stickney
LemontPalos Worth
Calumet
OrlandPalos Thornton
Rich Bloom
March 15, 2016 Presidential Primary ElectionCook County, Illinois
Votes for Republican Presidential Candidate by Precinct
41
Stickney
Indicates Forest Preserve Area
Highest % of Votes by Precinct
TRUMP
KASICHCRUZ
OTHER
TIE - TRUMP & KASICHTIE - TRUMP & CRUZ
TIE - KASICH & CRUZTIE - TRUMP, KASICH, & CRUZ
NO VOTES CAST
* In suburban Cook County, 1,366 ballots were cast for Jeb Bush, 511 ballots were cast for Chris Christie,21,468 ballots were cast for Marco Rubio, 639 ballots were cast for Rand Paul,197 ballots were cast for Carly Fiorina, 221 ballots were cast for Mike Huckabee,152 ballots were cast for Rick Santorum, and 1,014 ballots were cast for Ben Carson.In the City of Chicago, 761 ballots were cast for Jeb Bush, 239 ballots were cast for Chris Christie,11,034 ballots were cast for Marco Rubio, 380 ballots were cast for Rand Paul,138 ballots were cast for Carly Fiorina, 116 ballots were cast for Mike Huckabee,85 ballots were cast for Rick Santorum, and 664 ballots were cast for Ben Carson.
For further election results, please visit www.cookcountyclerk.com for suburban Cook County, and www.chicagoelections.com for the City of Chicago.
The numbers on the Chicago portion of the map indicate each Chicago ward.
City of Chicago precinct data provided by the Chicago Board of Elections Commissioners.
SUMMARY Registered Voters
*BallotsCast
DonaldTrump
Ballots Cast
JohnKasich
Ballots Cast
TedCruz
Ballots CastOthers
Ballots CastSuburban Cook County 1,443,261 224,977 92,603 54,204 51,333 25,568City of Chicago 1,514,912 88,487 34,038 22,629 18,403 13,417Cook County Total 2,958,173 313,464 126,641 76,833 69,736 38,985

9
trumP winS 25 of 30 Suburban Cook townSHiPS
In the Republican Presidential Primary, Donald Trump and Ohio Gov. John Kasich were the top two vote-getters in suburban Cook County’s 30 townships. Trump beat out all challengers in 25 townships, while Kasich garnered the most votes in five townships. Meanwhile, Sen. Ted Cruz came in a close third place by winning more Suburban Cook townships than Kasich but captured 2,871 fewer overall votes than the Ohio governor.
Township Trump Kasich Cruz Other Total Votes
Barrington 1,290 - 39.2% 965 - 29.3% 655 - 19.9% 381 - 11.6% 3,291 Berwyn 988 - 47.5% 265 - 12.7% 543 - 26.1% 284 - 13.7% 2,080 Bloom 1,994 - 46.8% 663 - 15.6% 1,094 - 25.7% 507 - 11.9% 4,258 Bremen 4,123 - 51.8% 1,061 - 13.3% 2,003 - 25.2% 768 - 9.7% 7,955 Calumet 115 - 46.7% 26 - 10.6% 69 - 28.0% 36 - 14.6% 246 Cicero 831 - 44.6% 144 - 7.7% 462 - 24.8% 427 - 22.9% 1,864 Elk Grove 3,872 - 40.8% 2,429 - 25.6% 2,192 - 23.1% 1,002 - 10.6% 9,495 Evanston 670 - 19.0% 1,592 - 45.1% 670 - 19.0% 599 - 17.0% 3,531 Hanover 3,579 - 46.0% 1,342 - 17.2% 1,928 - 24.8% 934 - 12.0% 7,783 Lemont 1,938 - 48.9% 765 - 19.3% 897 - 22.6% 365 - 9.2% 3,965 Leyden 4,065 - 54.9% 1,028 - 13.9% 1,532 - 20.7% 784 - 10.6% 7,409 Lyons 5,286 - 40.2% 3,635 - 27.6% 2,750 - 20.9% 1,477 - 11.2% 13,148 Maine 6,236 - 43.5% 3,259 - 22.7% 3,281 - 22.9% 1,574 - 11.0% 14,350 New Trier 2,073 - 20.9% 4,896 - 49.3% 1,534 - 15.4% 1,427 - 14.4% 9,930 Niles 3,349 - 40.3% 1,785 - 21.5% 2,064 - 24.8% 1,116 - 13.4% 8,314 Northfield 3,923 - 30.5% 4,749 - 36.9% 2,536 - 19.7% 1,660 - 12.9% 12,868 Norwood Park 1,488 - 57.2% 418 - 16.1% 475 - 18.3% 221 - 8.5% 2,602 Oak Park 724 - 23.1% 1,177 - 37.6% 747 - 23.8% 486 - 15.5% 3,134 Orland 7,502 - 50.3% 2,516 - 16.9% 3,453 - 23.2% 1,443 - 9.7% 14,914 Palatine 5,239 - 33.4% 4,843 - 30.9% 3,820 - 24.4% 1,767 - 11.3% 15,669 Palos 3,864 - 54.0% 1,194 - 16.7% 1,522 - 21.3% 571 - 8.0% 7,151 Proviso 3,383 - 40.8% 1,781 - 21.5% 2,019 - 24.3% 1,113 - 13.4% 8,296 Rich 1,179 - 41.0% 559 - 19.5% 781 - 27.2% 354 - 12.3% 2,873 River Forest 353 - 25.6% 563 - 40.8% 280 - 20.3% 183 - 13.3% 1,379 Riverside 856 - 37.7% 618 - 27.2% 535 - 23.6% 259 - 11.4% 2,268 Schaumburg 5,603 - 42.3% 2,846 - 21.5% 3,324 - 25.1% 1,463 - 11.1% 13,236 Stickney 1,584 - 62.1% 206 - 8.1% 528 - 20.7% 233 - 9.1% 2,551 Thornton 1,800 - 42.1% 597 - 13.9% 1,340 - 31.3% 543 - 12.7% 4,280 Wheeling 7,039 - 34.7% 6,208 - 30.6% 4,880 - 24.0% 2,180 - 10.7% 20,307 Worth 7,657 - 52.6% 2,074 - 14.2% 3,419 - 23.5% 1,411 - 9.7% 14,561 Suburban Cook 92,603 41.4% 54,204 24.2% 51,333 22.9% 25,568 11.4% 223,708

10
10
41
9
2
8
19
6
3
7
36
23
5
18
11
34
4
21
13
45
14
39
27
38
1
28
12
20
32
2425
17
29
16
47
40
50
37
22
31
15
42
2643
33 46
44
49
48
3035
Cic
ero
Harlem
Tri-S
tate
95th
87th
Golf
Archer
Sauk
1st
Kedzie
159th
Wolf
167th
Rand
Touhy
I 290
Northwest
Oakton
Ede
ns
Ogden
Milwaukee
Higgins
Torr
ence
La Grange
Palatine
111th
127th
Wes
tern
Kennedy
Euclid
Devon
Dix
ie
Roosevelt
103rd
135th
Lake Cook
147th
Ela
Cermak
Irving Park
Ash
land
47th
Leg D
an R
yan
25th
5th
Eisenhower
Lake Shore
Elston
Ros
elle
143rd
Willow
31st
Mannheim
Lake
175th
Grand
Dan
Rya
n
River
104t
h
Adlai Stevenson
Bar
tlett
Dempster
Joliet
Cen
tral
183rd
Bar
ringt
on
Hal
sted
She
ridan
Moline
Foster
80th
115th
Wau
kega
n
Vollmer
Chicago
14th
Sta
te
Mic
higa
n
55th
123rd
Bishop Ford
Lee
231st
Cal
umet
Hintz
Sibley
108t
h
Joe Orr
107th
Woo
d
Main
Schaumburg
Bel
l
Rid
gela
nd
East
Bode
Penny
Roberts88th
Sko
kie
Pul
aski
Otis
Que
ntin
84th
26th
94th
Cal
iforn
ia
Glenview
Oak
Par
k
Sout
hwes
t
Arli
ngto
n H
eigh
ts
Mea
cham
Talcott
170th
Church
63rd
17th
138th
Washington
130th
119th
Lincoln
179th
Addison
Sanders
Mor
gan
Techny
Busse
Pfin
gste
n
Wise
76th
Flossmoor
Will
Coo
k
Caldwell
Sut
ton
186th
162nd
86th
Steger
Elm
hurs
t
Gov
erno
rs
Peterson
Garfield
Nerge
Hib
bard
Mc Carthy
Wen
twor
th
Shermer
Cot
tage
Gro
ve
Cum
berla
nd
Tower
Doc
tor M
artin
Lut
her K
ing
Jr
Wilk
e
Ston
y Isla
nd
Hill
Diversey
82nd
Nag
le
Brin
ker
That
cher
Bat
eman
Ridge
Kingery
Kensington East Lake
Augusta
Mc
Cor
mic
k
Lawrence
Belmont
College
Shoe Factory
Dundee
Edens Expy
Montrose
Land
weh
r
New
Wes
t
Ballard
153rd
Walters
79th
Pershing
Vermont
Willow
Springs
Franklin
Col
fax
Howard
Lehigh
Asb
ury
Elgin-O'Hare
Jackson
Il 171C
raw
ford
Calumet Sag
100th
106th
Rose
Plainfield
North
Midlothian
Des Plaines R
iver
Villa
Madison
Wag
ner
Green Bay
Glenwood-Dyer
Hic
ks
Summit
La S
alle
Kirchoff
Sun
set R
idge
Brainard
Taft
Canal
Hawtho
rne
Sch
oenb
eck
139th
Bradwell
Giff
ord
Columbu
s
Forestway
Greenwood
Har
ms
Butterfield
Winnetka
142nd
Mundhank
River Oaks
Plu
m G
rove
Voltz
Hea
ly
Landmeier
171st
65th
Glenwood-Lansing
Old
Sut
ton
Vincennes
Cen
ter
Saint Charles
Hap
p
Michigan City
51st
Des
Pla
ines
Bur
nham
Dolton
Can
field
Holbrook
I 57
Thacker
151st
Cor
k
DonleaSouth Shore
131stE
win
g
Cor
nell
Freeman
Sm
ith
Hou
gh
West Lake
Pot
ter
Kem
man
Mou
nt P
rosp
ect
GunnisonBu
ffalo
Gro
ve
91st
Beckwith
Loomis
Avondale
MargaretThornton Lansing
Biesterfield
Hyde P
ark
Baldwin
Har
woo
d
Park
Congdon
Kea
n
Clark
County Line
Algonquin
Fullerton
Whe
elin
g
Old Glenview
Thornton
German Church
Hun
tingt
on
Web
er
Burlington
East-West
Riegel
Eas
t Riv
er
Maple
Elgin
39th
Cal-Sag
Nob
le
Indi
ana
Nolton
43rd
Mac
kina
w
Rub
y
Spr
ingi
nsgu
th
New
Wilke
Memorial
Wat
erm
an
Hoh
lfeld
er
177th
Nar
raga
nset
t
South
State
Ash
land
Lee
Fullerton
76th
Elm
hurs
t
127th
Wol
f
Golf
Cen
tral
Lawrence
Sut
ton
Ashland
Higgins
Cra
wfo
rd
31st
103rd
Brainard
104t
h
Wol
f
79th
Ela
26th
North
Chicago
County Line
Chicago
CentralCentral
Ked
zie
North
119th
Rid
gela
nd
183rd Riegel Main
Ash
land
Higgins
Ked
zie
87th
Northwest
Ridge
Vinc
enne
s
Central
Hic
ks
Cen
tral
103rd
Algonquin
Foster
Rid
ge
Cen
tral
Pul
aski
123rd
Lake
Bus
se
Lincoln
25th
Lincoln
31st
Devon
Plainfi
eld
North
175th
State
Lehigh
Wol
f
Ridgeland 111th
Northwest
Healy
47th
Lake
Ash
land
Addison
Pul
aski
Bur
nham
Gov
erno
rs
Cou
nty
Line
131st
Archer
Mai
n
Cermak
Sheridan
231st
Tri-State
Sta
te
Cen
tral
Oak
Par
k
Augusta
Bartlett
County Line
Dundee
Main
26th
131st
Wes
tern
Steger
Plu
m G
rove
Riv
er
Ked
zie
151st 151st
Wolf
Irving Park
Chi
cago
Pershing
80th
State171st
Wes
tern
Hal
sted
Southw
est
Skokie
135th
Kean
Palatine
Schaumburg
Glenview
Skokie
Hoffman Estates
Des Plaines
Alsip
Niles
Matteson
Wheeling
Cicero
Oak Lawn
Evanston
Lemont
Dolton
Elk Grove Village
Streamwood
Lynwood
Bartlett
Markham
Burbank
Bedford Park
Justice
Worth
Orland Park
Barrington Hills
Northbrook
Tinley Park
Elgin
Arlington Heights
Lansing
Harvey
Mount Prospect
Inverness
Park Ridge
Chicago Heights
Wilmette
Calumet CityOak Forest
South Holland
Berwyn
Oak Park
South Barrington
Homewood
Glencoe
Palos Hills
Winnetka
Franklin Park
Riverdale
Morton Grove
Bridgeview
Blue Island
Rolling Meadows
Flossmoor
Lyons
Park Forest
Northlake
Melrose Park
Sauk Village
Brookfield
StegerRichton Park
Mc Cook
Crestwood
Hazel Crest
Summit
Hillside
Palos Heights
Maywood
Midlothian
Hodgkins
Country Club Hills
Westchester
Willow Springs
Thornton
Barrington
Prospect Heights
Burr Ridge
CountrysideLa Grange
Hickory Hills
Stickney
Palos Park
Schiller Park
Burnham
Forest Park
Evergreen Park
River Forest
Norridge
River Grove
Hanover Park
Rosemont
Glenwood
Posen
Western Springs
Broadview
Robbins
Buffalo Grove
Chicago Ridge
Berkeley
La Grange Park
Ford Heights
Hinsdale
Roselle
Golf
Forest View
Orland Hills
Kenilworth
Deerfield
Phoenix
Hometown
Frankfort
University Park
Deer Park
Oak Brook
David OrrCook County Clerk
For further election results, please visit www.cookcountyclerk.com for suburban Cook County, and www.chicagoelections.com for the City of Chicago.
The numbers on the Chicago portion of the map indicate each Chicago ward.
City of Chicago precinct data provided by the Chicago Board of Elections Commissioners.
.BarringtonPalatine
Wheeling NorthfieldNewTrier
Hanover Schaumburg Elk Grove Maine Niles
Evanston
Leyden
NorwoodPark
Proviso
RiverForest
Riverside
OakPark
Ber
wyn Cicero
Chicago
Lyons
Stickney
LemontPalos Worth
Calumet
OrlandPalos Thornton
Rich Bloom
March 15, 2016 Presidential Primary ElectionCook County, Illinois
Votes for Democratic Presidential Candidate
41
Stickney
Indicates Forest Preserve Area
% VotesSandersClinton
60 - 69%
50 - 59%
40 - 49%30 - 39%
<30%
>70% <30%
31 - 40%
41 - 50%
51 - 60%
61 - 70%
>70%
* In suburban Cook County, 1,186 ballots were cast for Martin O'Malley, 1,130 ballots were cast for Willie Wilson, 356 ballots were cast for Larry Cohen, and 320 ballots were cast for Roque De La Fuente. In the City of Chicago, 2,280 ballots were cast for Martin O'Malley, 3,557 ballots were cast for Willie Wilson, 614 ballots were cast for Larry Cohen,and 572 ballots were cast for Roque De La Fuente.
SUMMARYRegistered
Voters*Ballots
Cast
HillaryClinton
Ballots Cast
BernieSanders
Ballots CastSuburban Cook County 1,443,261 476,261 253,092 215,911City of Chicago 1,514,912 708,125 380,208 320,894Cook County Total 2,958,173 1,184,386 633,300 536,805

11
HigH marginS of ViCtory key for Clinton in Suburban Cook
Democratic presidential candidate Hillary Clinton received more votes than Sen. Bernie Sanders in 16 of suburban Cook County’s 30 townships. The difference were her margins of victory, which generally were much larger than Sanders’. Clinton’s highest margin of victory, 13,175 votes, was in Thornton Township. Sanders had his highest margin, 2,040 votes, in Worth Township.
In Norwood Park Township the two were separated by just nine votes (Clinton: 1,859; Sanders: 1,850).
Township Clinton Sanders Other Total Votes
Barrington 1,007 - 55.8% 789 - 43.7% 9 - 0.5% 1,805Berwyn 4,609 - 42.9% 6,065 - 56.5% 64 - 0.6% 10,738Bloom 11,936 - 59.9% 7,861 - 39.4% 136 - 0.7% 19,933Bremen 12,095 - 54.9% 9,768 - 44.3% 181 - 0.8% 22,044Calumet 3,202 - 62.4% 1,889 - 36.8% 43 - 0.8% 5,134Cicero 5,239 - 44.2% 6,538 - 55.2% 73 - 0.6% 11,850Elk Grove 5,703 - 48.9% 5,903 - 50.6% 57 - 0.5% 11,663Evanston 13,415 - 54.4% 11,207 - 45.4% 51 - 0.2% 24,673Hanover 5,584 - 48.8% 5,811 - 50.7% 57 - 0.5% 11,452Lemont 1,114 - 42.7% 1,459 - 55.9% 35 - 1.3% 2,608Leyden 5,846 - 48.3% 6,188 - 51.1% 78 - 0.6% 12,112Lyons 9,009 - 48.0% 9,604 - 51.2% 159 - 0.8% 18,772Maine 10,737 - 52.0% 9,784 - 47.4% 133 - 0.6% 20,654New Trier 8,405 - 64.7% 4,531 - 34.9% 53 - 0.4% 12,989Niles 11,086 - 52.3% 9,991 - 47.2% 101 - 0.5% 21,178Northfield 9,901 - 60.9% 6,266 - 38.6% 86 - 0.5% 16,253Norwood Park 1,859 - 49.6% 1,850 - 49.4% 38 - 1.0% 3,747Oak Park 10,320 - 53.0% 9,091 - 46.7% 73 - 0.4% 19,484Orland 6,691 - 45.9% 7,758 - 53.2% 139 - 1.0% 14,588Palatine 6,984 - 47.7% 7,620 - 52.0% 45 - 0.3% 14,649Palos 3,441 - 44.4% 4,218 - 54.4% 89 - 1.1% 7,748Proviso 21,362 - 58.0% 15,225 - 41.3% 260 - 0.7% 36,847Rich 15,839 - 63.1% 9,119 - 36.3% 150 - 0.6% 25,108River Forest 1,655 - 56.6% 1,247 - 42.7% 21 - 0.7% 2,923Riverside 1,524 - 42.6% 2,034 - 56.8% 22 - 0.6% 3,580Schaumburg 9,240 - 48.9% 9,597 - 50.8% 68 - 0.4% 18,905Stickney 2,809 - 42.3% 3,741 - 56.4% 83 - 1.3% 6,633Thornton 28,577 - 64.5% 15,402 - 34.8% 313 - 0.7% 44,292Wheeling 11,500 - 51.1% 10,912 - 48.5% 72 - 0.3% 22,484Worth 12,403 - 45.7% 14,443 - 53.2% 303 - 1.1% 27,149Suburban Cook 253,092 - 53.6% 215,911 - 45.7% 2,992 - 0.6% 471,995

12
10
41
9
2
8
19
6
3
7
36
23
5
18
11
34
4
21
13
45
14
39
27
38
1
28
12
20
32
2425
17
29
16
47
40
50
37
22
31
15
42
2643
33 46
44
49
48
3035
David OrrCook County Clerk
.BarringtonPalatine
Wheeling NorthfieldNewTrier
Hanover Schaumburg Elk Grove Maine Niles
Evanston
Leyden
NorwoodPark
Proviso
RiverForest
Riverside
OakPark
Ber
wyn Cicero
Chicago
Lyons
Stickney
LemontPalos Worth
Calumet
OrlandPalos Thornton
Rich Bloom
March 15, 2016 Presidential Primary ElectionCook County, Illinois
Votes for State's Attorney by Precinct
41
StickneyIndicates Forest Preserve Area
Highest % of Votes by Precinct
Alvarez
Foxx
Tie - Foxx and Alvarez
SUMMARYRegistered
VotersBallots Cast
KimFoxx
Ballots Cast
AnitaAlvarez
Ballots Cast
*Donna More
Ballots CastSuburban Cook County 1,443,261 476,211 230,111 145,712 64,990City of Chicago 1,514,912 666,582 415,627 171,882 79,073Cook County Total 2,958,173 1,142,793 645,738 317,594 144,063
For further election results, please visit www.cookcountyclerk.com for suburban Cook County, and www.chicagoelections.com for the City of Chicago.
The numbers on the Chicago portion of the map indicate each Chicago ward.
City of Chicago precinct data provided by the Chicago Board of Elections Commissioners.
* Donna More did not win any precincts in suburban Cook or City of Chicago.

13
foxx winS 52.2% of Suburban Cook VoteS
Suburban Cook County voters largely favored challenger Kim Foxx in the race for State’s Attorney. Foxx garnered 52.2 percent of the vote and won 15 of suburban Cook’s 30 townships, often by substantial margins.
Foxx defeated both incumbent Anita Alvarez and Donna More by over 84,000 and 165,000 votes, respectively. While she fell short in total votes, Alvarez received the most votes in 15 townships. Alvarez and More combined for more votes than Foxx in six townships.
Township Foxx Alvarez More Total Votes
Barrington 674 - 42.4% 631 - 39.7% 285 - 17.9% 1,590Berwyn 3,666 - 35.9% 5,074 - 49.7% 1,474 - 14.4% 10,214Bloom 13,297 - 69.1% 3,929 - 20.4% 2,013 - 10.5% 19,239Bremen 12,720 - 60.1% 5,773 - 27.3% 2,688 - 12.7% 21,181Calumet 3,520 - 71.1% 996 - 20.1% 438 - 8.8% 4,954Cicero 3,104 - 27.7% 6,674 - 59.5% 1,447 - 12.9% 11,225Elk Grove 4,103 - 38.9% 4,382 - 41.6% 2,058 - 19.5% 10,543Evanston 15,785 - 69.8% 3,815 - 16.9% 3,012 - 13.3% 22,612Hanover 4,056 - 39.0% 4,615 - 44.4% 1,720 - 16.6% 10,391Lemont 687 - 29.4% 1,252 - 53.5% 400 - 17.1% 2,339Leyden 3,778 - 33.7% 5,473 - 48.9% 1,944 - 17.4% 11,195Lyons 6,835 - 38.9% 7,789 - 44.3% 2,968 - 16.9% 17,592Maine 7,257 - 38.8% 7,599 - 40.6% 3,839 - 20.5% 18,695New Trier 6,252 - 54.2% 3,375 - 29.3% 1,898 - 16.5% 11,525Niles 9,419 - 48.9% 6,317 - 32.8% 3,539 - 18.4% 19,275Northfield 6,516 - 45.1% 5,053 - 35.0% 2,873 - 19.9% 14,442Norwood Park 1,121 - 33.0% 1,543 - 45.4% 731 - 21.5% 3,395Oak Park 11,561 - 64.0% 4,022 - 22.3% 2,471 - 13.7% 18,054Orland 4,073 - 30.1% 7,077 - 52.4% 2,364 - 17.5% 13,514Palatine 5,729 - 43.9% 4,980 - 38.2% 2,339 - 17.9% 13,048Palos 2,545 - 35.2% 3,537 - 49.0% 1,142 - 15.8% 7,224Proviso 21,562 - 61.0% 9,593 - 27.1% 4,216 - 11.9% 35,371Rich 19,038 - 77.4% 3,298 - 13.4% 2,248 - 9.1% 24,584River Forest 1,209 - 44.1% 1,153 - 42.0% 380 - 13.9% 2,742Riverside 1,291 - 39.2% 1,396 - 42.4% 609 - 18.5% 3,296Schaumburg 6,888 - 40.7% 7,026 - 41.5% 3,000 - 17.7% 16,914Stickney 1,972 - 31.0% 3,331 - 52.4% 1,056 - 16.6% 6,359Thornton 33,326 - 77.1% 6,132 - 14.2% 3,762 - 8.7% 43,220Wheeling 8,266 - 41.1% 7,955 - 39.5% 3,914 - 19.4% 20,135Worth 9,861 - 38.0% 11,922 - 46.0% 4,162 - 16.0% 25,945Suburban Cook 230,111 - 52.2% 145,712 - 33.1% 64,990 - 14.7% 440,813

14
Top 25 precincTs by VoTer TurnouT
Turnout in suburban Cook County was high with 701,525 ballots cast, or 48.6 percent of registered voters. However, turnout was 53.5 percent greater in the top turnout precinct—Evanston Ward 7 Precinct 4 with 74.6 percent.
Evanston Township was not only home to the top turnout of all townships but accounted for 18 of the top 25 precincts.
Oak Park and Lyons townships were home to the remaining seven precincts. Every precinct to make the list overwhelmingly cast Democratic ballots—the highest Republican percentage accounted for 38 percent of that precinct’s total turnout.
Precinct Registered Voters
DEM Ballots
Cast
% DEM
REP Ballots
Cast
% REP
Total Ballots
Cast
Total % Turnout
Evanston Ward 7 Precinct 4 602 410 91.3% 39 8.7% 449 74.6%Evanston Ward 5 Precinct 2 977 636 87.4% 92 12.6% 728 74.5%Oak Park 26 802 516 89.4% 61 10.6% 577 71.9%Oak Park 29 858 500 82.1% 109 17.9% 609 71.0%Evanston Ward 3 Precinct 3 903 555 87.1% 82 12.9% 637 70.5%Evanston Ward 9 Precinct 3 1,108 688 88.3% 91 11.7% 779 70.3%Oak Park 16 1,319 782 84.8% 140 15.2% 922 69.9%Evanston Ward 4 Precinct 2 783 494 90.5% 52 9.5% 546 69.7%Evanston Ward 4 Precinct 4 1,250 769 88.3% 102 11.7% 871 69.7%Evanston Ward 6 Precinct 2 654 388 85.5% 66 14.5% 454 69.4%Evanston Ward 7 Precinct 5 1,158 662 83.1% 135 16.9% 797 68.8%Lyons 1 89 38 62.3% 23 37.7% 61 68.5%Oak Park 7 711 413 84.8% 74 15.2% 487 68.5%Evanston Ward 3 Precinct 7 724 427 86.8% 65 13.2% 492 68.0%Evanston Ward 3 Precinct 1 915 526 84.7% 95 15.3% 621 67.9%Evanston Ward 6 Precinct 7 1,088 598 81.0% 140 19.0% 738 67.8%Evanston Ward 3 Precinct 2 1,042 596 84.7% 108 15.3% 704 67.6%Evanston Ward 7 Precinct 1 1,275 737 85.7% 123 14.3% 860 67.5%Evanston Ward 6 Precinct 1 1,323 707 79.3% 185 20.7% 892 67.4%Evanston Ward 9 Precinct 5 626 378 89.6% 44 10.4% 422 67.4%Oak Park 32 687 424 91.8% 38 8.2% 462 67.2%Evanston Ward 1 Precinct 3 810 468 86.0% 76 14.0% 544 67.2%Oak Park 27 310 172 82.7% 36 17.3% 208 67.1%Evanston Ward 1 Precinct 4 1,203 653 80.9% 154 19.1% 807 67.1%Evanston Ward 4 Precinct 1 498 304 91.0% 30 9.0% 334 67.1%
- Third-Party and Nonpartisan ballots not included.
Early Voting, 36,941
Grace Period/In-Person Absentee, 626Mail Voting,
9,667
Election Day, 282,303

15
Early Voting, 113,641
Grace Period/In-Person Absentee, 7,020
Mail Voting, 31,409
Election Day, 549,455
Pre-eleCtion day Voting SetS modern-day reCord, mail ballot Voting inCreaSed oVer 200%
Pre-Election Day voting in all its forms – early voting, mail voting, and grace period registration and voting – accounted for 21.7 percent of all ballots cast, an increase of 51.2 percent from the March 2012 Presidential Primary. Early voting, with 113,641 ballots, increased more than 200 percent from 2012. Grace Period voting – offered for the first time in a Presidential Primary at every Early Voting site, increased from 626 ballots in March 2012 to 7,020 ballots this election.
Mail voting set records this election with more ballots cast than any primary election in suburban Cook County history. This election more than tripled the total number of mail ballots cast four years ago. Nearly 80 percent of all mail ballot requests came from people who used our online request tool.
Suburban Cook: Pre-Election Ballots Cast
2008Total
2012Total
2016 Total
% Change2012-2016
Registered Voters 1,350,580 1,394,649 1,443,261 3.5%Early Voting 50,655 36,941 113,641 207.6%Grace Period Voting 561 626 7,020 1021.4%Mail Voting 8,835 9,667 31,409 224.9%Pre-Election Ballots Cast 60,051 47,234 152,070 222.0%Election Day Ballots Cast* 525,398 282,303 549,455 94.6%Total Ballots Cast 585,449 329,537 701,525 112.9%% Pre-Election Ballots 6.5% 14.3% 21.7%
*Includes 23,123 Election Day Registration voters in 2016
Voting By Type: 2012 vs 2016
2016
Early Voting, 36,941
Grace Period/In-Person Absentee, 626Mail Voting,
9,667
Election Day, 282,303
2012

16
Barrington Palatine WheelingNorthfield
NewTrier
Hanover Schaumburg Elk Grove Maine Niles
Evanston
Leyden
NorwoodPark
Proviso
RiverForest
Riverside
Oak Park
Ber
wyn
Cicero
Lyons
Stickney
Stickney
LemontPalos Worth
Orland BremenThornton
Calumet
RichBloom
Chicago
Early Voting Turnout Suburban Cook County
March 15, 2016 Presidential Primary Election
.
Percent of Early Votersby Precinct
<5%
5 - 5.9%
6 - 6.9%
7 - 7.9%
8 - 8.9%
9 - 9.9%
>10%
There were 43 Early Voting sites in suburban Cook County between February 29 - March 14. The data shown in this map is as of end of day on March 14, 2016.
The data does not include the 7,020 Grace Period voters.

17
66.9% 32.9%
0.3%
Total Election Day Voting Ballots by Party
Democratic Republican Other
70.2% 29.7%
0.0%
Total Pre-Election Day Voting Ballots by Party
Democratic Republican Other
55.3%
44.7%
Total Election Day Voting by Gender
Female Male
56.3%
43.7%
Total Pre-Election Day Voting by Gender
Female Male
0%
5%
10%
15%
20%
25%
30%
35%
17-19 20-29 30-39 40-49 50-59 60-69 70+
Voting Type by Age
Early Voting + Grace Period Mail Ballot Election Day Registration Election Day

18
Barrington Palatine WheelingNorthfield
NewTrier
Hanover Schaumburg Elk Grove Maine Niles
Evanston
Leyden
NorwoodPark
Proviso
RiverForest
Riverside
Oak Park
Ber
wyn
Cicero
Lyons
Stickney
Stickney
LemontPalos Worth
Orland BremenThornton
Calumet
RichBloom
Chicago
Election Day Registrations Suburban Cook County
March 15, 2016 Presidential Primary Election
.
Percent of Election Day Registrationsby Precinct
<1%
1 - 1.9%
2 - 2.9%
3 - 3.9%
4 - 4.9%
>5%
Election Day Registration was offered in all precincts as well as the Clerk's downtown office on Election Day.
There were 23,123 Election Day Registration ballots cast on March 15, 2016.

19
eleCtion day regiStration oVerwHelmingly PoPular witH younger VoterS
The March 15 Presidential Primary was the first election in which Election Day Registration was available in every precinct. It proved to be very popular with voters, especially younger ones. Of the 23,123 voters who registered and voted on March 15, 49 percent were between 17 and 29 years old. The overwhelming majority of Election Day Registration voters took Democratic ballots (81.3 percent) over Republican ballots (18.5 percent). More women (54.4 percent) than men (45.6 percent) were Election Day Registration voters.
81.3%
18.5%
0.2%
Total Election Day Registration by Party
Democratic Republican Other
0.0%
5.0%
10.0%
15.0%
20.0%
25.0%
30.0%
35.0%
17-19 20-29 30-39 40-49 50-59 60-69 70+
20.3%
29.1%
18.4%
13.2%10.2%
5.5%3.3%
Total Election Day Registration by Age
4,704 6,725 4,263 3,042 2,369 1,268 752
18,807 ballots
4,281 ballots
35ballots

20
an online PreSenCe in tHe PreSidential Primary
For the first time in a presidential primary, voters were able to register to vote and apply for a mail ballot online. The implementation of these new initiatives resulted in record-breaking numbers in almost every category.
Aside from a surge in numbers, the Clerk’s online presence also helped Election Day run more efficiently. Online registration, mail ballot applications and the Clerk’s Voter Information Tool increased voter registration and turnout while decreasing lines by allowing eligible residents to register to vote and find their polling place from the comfort of their own home.
The Clerk’s social media pages also contributed to the successful presidential primary. Knowing that voters and media alike would need quick access to information and an open dialogue, the Clerk’s office utilized Twitter and Facebook to address questions and monitor voters’ experiences, as well as provide useful updates and information.
Election Day Online Usage
Online Voter Registration • Over 21,000 eligible suburban Cook County residents registered to vote online in the 90 days leading
up to the March 2016 Presidential Primary.
Online vs. Paper Mail Ballots• 79 percent of the nearly 40,000 Mail Ballot Applications were requested online.
Election Day Social Media vs. Average Social Media• 22,800 people viewed the Clerk’s Twitter page — a 1,400% increase from the average 1,500 daily views. • 14,700 people viewed the Clerk’s Facebook page — a 105% increase from the average 7,150 weekly views.
Voter Information Tool • Over 76,000 suburban Cook County residents used the Voter Information Tool from March 13-15.
2,182 3,260 3,426 3,969 3,817 5,250
25,809
45,518
1,223 436 2920
10,000
20,000
30,000
40,000
50,000
Mar. 7 Mar. 9 Mar. 11 Mar. 13 Mar. 15 Mar. 17 Mar. 19
Voter Information Tool Pageviews

21
Instagramcookcountyclerk
Facebookclerkorr
Twitter@cookcountyclerk

22
Our Election Day Call Center is a hub of activity. Some 70 hotline workers answer more than 5,000 calls from pollworkers to ensure that polling places are open on-time, that pollworkers have the supplies they need throughout the day, and to dispatch staff who address technical issues.
It takes a dedicated team of Election Judges to make sure our 1,036 polling places run smoothly on Election Day. About 8,500 Election Judges, many of them veterans of multiple elections, worked the polls this Election Day.
In addition to visiting polling places throughout suburban Cook County beginning in the morning on Election Day, Clerk David Orr also monitored election operations from his Chicago office, giving frequent updates to media who were covering the Presidential Primary election.

23
With his Elections Department staff, Director of Elections Noah Praetz monitored and directed election operations from dawn to midnight from the Clerk’s downtown Chicago office.
Young people are enthusiastic about being part of the electoral process. The Clerk’s Office held many high school voter registration events this election season, leading to more than 7,000 17-year-olds who registered to vote. Our student judge program also connects civically-engaged high school and college students to work at polling places.
The Cook County Clerk’s “I Voted!” stickers, re-designed in 2015, were a hit with Presidential Primary voters. Even after Election Day, voters adorned cell phone cases, laptop computers, and winter coats with the popular stickers.

24

25 Page 1 of 83
Primary Election
Cook County and The City of Chicago
Tuesday, March 15, 2016
Combined Summary
Ballots Cast 701,525 810,823 1,512,348
Cook County City of Chicago Combined Total
Napoleon Harris 63,505 76,633 140,138 12.81%
Andrea Zopp 94,930 200,055 294,985 26.96%
Tammy Duckworth 284,298 374,911 659,209 60.24%
442,733 651,599 1,094,332
Senator, U.S. - DEM Cook County City of Chicago Combined Total Percentage
Larry (Lawrence) Cohen 356 614 970 0.08%
Bernie Sanders 215,911 320,894 536,805 45.35%
Write-In 982 2,529 3,511 0.30%
Martin J. O'Malley 1,186 2,280 3,466 0.29%
Hillary Clinton 253,092 380,208 633,300 53.50%
Roque ''Rocky'' De La Fuente 320 572 892 0.08%
Willie L. Wilson 1,130 3,557 4,687 0.40%
472,977 710,654 1,183,631
President, U.S. - DEM Cook County City of Chicago Combined Total Percentage
O. Patrick Brutus 6,980 6,159 13,139 7.73%
Write-In 130 397 527 0.31%
Howard B. Brookins, Jr. 5,864 26,886 32,750 19.27%
Bobby L. Rush 22,089 101,460 123,549 72.69%
35,063 134,902 169,965
U.S. Representative, 1st District - DEM Cook County City of Chicago Combined Total Percentage
Susana Mendoza 372,584 542,112 914,696 100.00%
372,584 542,112 914,696
Comptroller, State of Illinois - DEM Cook County City of Chicago Combined Total Percentage

26 Page 2 of 83
Deborah M. Bullwinkel 4,874 4,874 11.74%
Michael Noland 11,297 11,297 27.22%
Raja Krishnamoorthi 25,330 25,330 61.03%
41,501 41,501
U.S. Representative, 8th District - DEM Cook County City of Chicago Combined Total Percentage
Write-In 139 670 809 0.47%
Danny K. Davis 34,927 104,451 139,378 80.82%
Thomas Day 9,545 22,716 32,261 18.71%
44,611 127,837 172,448
U.S. Representative, 7th District - DEM Cook County City of Chicago Combined Total Percentage
Robert Marshall 3,415 3,415 34.65%
Amanda Howland 6,440 6,440 65.35%
9,855 9,855
U.S. Representative, 6th District - DEM Cook County City of Chicago Combined Total Percentage
Daniel William Lipinski 49,541 48,273 97,814 100.00%
49,541 48,273 97,814
U.S. Representative, 3rd District - DEM Cook County City of Chicago Combined Total Percentage
Robin Kelly 69,279 34,296 103,575 74.28%
Charles Rayburn 5,018 2,892 7,910 5.67%
Dorian C.L. Myrickes 2,776 2,372 5,148 3.69%
Marcus Lewis 13,159 9,641 22,800 16.35%
90,232 49,201 139,433
U.S. Representative, 2nd District - DEM Cook County City of Chicago Combined Total Percentage
Mike Quigley 13,869 106,605 120,474 100.00%
13,869 106,605 120,474
U.S. Representative, 5th District - DEM Cook County City of Chicago Combined Total Percentage
Luis V. Gutierrez 21,266 71,513 92,779 75.17%
Javier Salas 6,709 23,931 30,640 24.83%
27,975 95,444 123,419
U.S. Representative, 4th District - DEM Cook County City of Chicago Combined Total Percentage

27 Page 3 of 83
Brad Schneider 12,339 12,339 54.09%
Nancy Rotering 10,474 10,474 45.91%
22,813 22,813
U.S. Representative, 10th District - DEM Cook County City of Chicago Combined Total Percentage
Janice D. Schakowsky 79,537 55,424 134,961 100.00%
79,537 55,424 134,961
U.S. Representative, 9th District - DEM Cook County City of Chicago Combined Total Percentage
Adriana Sanchez (Sanders) 15,624 33,846 49,470 4.20%
William K. Crosby (Sanders) 14,463 34,081 48,544 4.13%
Tyler Kissinger (Sanders) 12,090 26,425 38,515 3.27%
Kenzo Emiliano Esquivel (Sanders) 6,262 12,048 18,310 1.56%
Joseph Wheeler (O'Malley) 2,102 4,858 6,960 0.59%
Brendan Houlihan (Sanders) 14,646 27,969 42,615 3.62%
Brenda J. Malone (Sanders) 14,861 33,413 48,274 4.10%
Theresa McCulley (Sanders) 13,764 27,752 41,516 3.53%
Vernita Farmer (Sanders) 13,782 31,659 45,441 3.86%
Tim Gaffney (Sanders) 14,205 28,408 42,613 3.62%
Patricia Guinn (Sanders) 15,140 32,827 47,967 4.08%
Rochelle Y. O'Neal (O'Malley) 2,309 5,730 8,039 0.68%
Barbara Flynn Currie (Clinton) 15,908 61,557 77,465 6.58%
Kwame Raoul (Clinton) 14,733 65,402 80,135 6.81%
David Moore (Clinton) 15,490 64,186 79,676 6.77%
Hedy Gist-Ellison (O'Malley) 1,478 3,369 4,847 0.41%
Jacqueline Collins (Clinton) 16,791 72,404 89,195 7.58%
Kurt Summers (Clinton) 14,248 58,873 73,121 6.21%
Carolyn Rush (Clinton) 15,039 64,689 79,728 6.78%
Toni Preckwinkle (Clinton) 16,451 77,287 93,738 7.97%
Mary E. Flowers (Clinton) 15,888 67,822 83,710 7.11%
Roderick T. Sawyer (Clinton) 14,378 62,434 76,812 6.53%
279,652 897,039 1,176,691
(vote for 9)
Delegate, National Convention 1st DEM - DEM Cook County City of Chicago Combined Total Percentage
Bill Foster 432 432 100.00%
432 432
U.S. Representative, 11th District - DEM Cook County City of Chicago Combined Total Percentage

28 Page 4 of 83
Kenneth Franklin (Sanders) 28,509 14,410 42,919 4.65%
Linda Jennings (Sanders) 28,841 15,020 43,861 4.75%
Gregory Washington (O'Malley) 4,179 2,191 6,370 0.69%
Michael Holmes (O'Malley) 4,782 2,840 7,622 0.83%
Susan Sadlowski Garza (Sanders) 22,656 14,022 36,678 3.97%
Carl Camacho (Sanders) 24,196 12,766 36,962 4.00%
Laura M. Ortega (Sanders) 25,934 13,467 39,401 4.27%
Ndidi A. Okakpu (Sanders) 24,843 12,340 37,183 4.03%
Tanya Watkins (Sanders) 30,977 16,202 47,179 5.11%
John A. Willard (Sanders) 25,319 12,941 38,260 4.15%
Lisa Dugan (Clinton) 51,474 24,567 76,041 8.24%
Jaylin Davon McClinton (Clinton) 46,602 20,642 67,244 7.29%
James Patton (O'Malley) 4,512 2,240 6,752 0.73%
Timothy ''Tim'' Bradford (Clinton) 51,277 23,532 74,809 8.11%
Leslie Hairston (Clinton) 49,840 25,002 74,842 8.11%
Frank M. Zuccarelli (Clinton) 50,550 20,178 70,728 7.66%
Donna Miller (Clinton) 48,591 23,861 72,452 7.85%
Al Riley (Clinton) 49,746 21,533 71,279 7.72%
Toi W. Hutchinson (Clinton) 50,249 22,156 72,405 7.84%
623,077 299,910 922,987
(vote for 8)
Delegate, National Convention 2nd DEM - DEM Cook County City of Chicago Combined Total Percentage
David B. Maher (O'Malley) 2,330 3,135 5,465 1.18%
Matthew Lafond (O'Malley) 1,488 2,271 3,759 0.81%
Nancy Heskin Jados (O'Malley) 2,021 2,555 4,576 0.99%
Maureen Sullivan (Sanders) 26,144 21,813 47,957 10.33%
Daniel Buys (Sanders) 24,521 19,593 44,114 9.51%
Myriam Calvache (Sanders) 24,360 20,099 44,459 9.58%
Nathaniel Harris (Sanders) 25,460 20,630 46,090 9.93%
Rebecca Davies (Sanders) 26,642 21,875 48,517 10.45%
Michael E. Hastings (Clinton) 22,425 17,465 39,890 8.59%
Colleen Patricia Burns (Clinton) 23,656 19,752 43,408 9.35%
Edward D. Maloney (O'Malley) 3,237 4,238 7,475 1.61%
Clarisol Duque (Clinton) 20,180 17,535 37,715 8.13%
Josephine Singler (O'Malley) 1,985 2,807 4,792 1.03%
Shirley Madigan (Clinton) 21,634 19,870 41,504 8.94%
Jorge Ramirez (Clinton) 22,398 21,992 44,390 9.56%
248,481 215,630 464,111
(vote for 5)
Delegate, National Convention 3rd DEM - DEM Cook County City of Chicago Combined Total Percentage

29 Page 5 of 83
Will Guzzardi (Sanders) 8,862 32,915 41,777 8.80%
Melissa Rubio (Sanders) 10,319 37,354 47,673 10.05%
Barbara P. Guttmann (O'Malley) 1,545 3,738 5,283 1.11%
Andrea Perkins (Sanders) 12,106 39,873 51,979 10.95%
Álvaro R. Obregón (Sanders) 10,170 31,840 42,010 8.85%
Shana East (Sanders) 10,026 32,969 42,995 9.06%
Carlos Ramirez-Rosa (Sanders) 12,916 41,706 54,622 11.51%
Raymond A. Lopez (Clinton) 10,430 27,130 37,560 7.91%
Soraida Gutierrez (Clinton) 11,845 31,218 43,063 9.07%
Richard Gutierrez (O'Malley) 1,969 5,561 7,530 1.59%
Emanuel ''Chris'' Welch (Clinton) 9,454 18,570 28,024 5.91%
Vicente ''Vince'' Sanchez, Jr. (Clinton) 9,250 21,553 30,803 6.49%
Milly Santiago (Clinton) 10,544 30,717 41,261 8.69%
119,436 355,144 474,580
(vote for 5)
Delegate, National Convention 4th DEM - DEM Cook County City of Chicago Combined Total Percentage
Vittorio Gomez (O'Malley) 950 4,142 5,092 0.71%
John S. Arena (Sanders) 7,086 55,505 62,591 8.70%
William J. Perry (Sanders) 6,924 52,777 59,701 8.29%
Noel Chambers (O'Malley) 621 3,393 4,014 0.56%
Troy A. LaRaviere (Sanders) 6,709 52,267 58,976 8.19%
Laura Sabransky (Sanders) 7,192 56,067 63,259 8.79%
Rebecca Abraham (Sanders) 7,592 59,443 67,035 9.31%
Simone Rowen (Sanders) 6,914 54,982 61,896 8.60%
Angelique Hardy Heinz (O'Malley) 732 3,939 4,671 0.65%
Rocco J. Claps (Clinton) 6,428 46,503 52,931 7.35%
Sara Feigenholtz (Clinton) 7,300 55,374 62,674 8.71%
Joseph Enright (O'Malley) 679 3,680 4,359 0.61%
Bridget Gainer (Clinton) 6,985 52,474 59,459 8.26%
Proco Joseph Moreno (Clinton) 6,321 39,563 45,884 6.37%
Jan Kallish (Clinton) 6,496 47,667 54,163 7.52%
Patrick Croke (Clinton) 6,487 46,594 53,081 7.37%
85,416 634,370 719,786
(vote for 6)
Delegate, National Convention 5th DEM - DEM Cook County City of Chicago Combined Total Percentage

30 Page 6 of 83
Alex Franklin (Sanders) 4,141 4,141 7.93%
Dan Bailey (Sanders) 2,564 2,564 4.91%
Nicole Gooden (O'Malley) 505 505 0.97%
Ian Sorenson (Sanders) 4,554 4,554 8.73%
Janet (Jan) Wolff (Sanders) 4,640 4,640 8.89%
Nadia Blanc Daley (Sanders) 4,514 4,514 8.65%
Georgina McDonald (Sanders) 4,792 4,792 9.18%
Melissa Rae Byrne (Clinton) 5,560 5,560 10.65%
Priyal Amin (Clinton) 5,319 5,319 10.19%
Olumide Idowu (O'Malley) 230 230 0.44%
Nancy Shepherdson (Clinton) 5,255 5,255 10.07%
Markus Pitchford (Clinton) 4,920 4,920 9.43%
Jack Harrington (Clinton) 5,193 5,193 9.95%
52,187 52,187
(vote for 5)
Delegate, National Convention 6th DEM - DEM Cook County City of Chicago Combined Total Percentage

31 Page 7 of 83
Joshua Sam Lapidus (O'Malley) 734 2,125 2,859 0.23%
Hugh R. McCombs (O'Malley) 774 2,139 2,913 0.23%
La Shawn K. Ford (Sanders) 19,157 48,710 67,867 5.41%
Brianna Tong (Sanders) 16,342 34,713 51,055 4.07%
Anne Conderacci (O'Malley) 1,042 2,889 3,931 0.31%
Michael K. Forde (O'Malley) 1,130 3,722 4,852 0.39%
Robert J. Peters (Sanders) 16,626 35,579 52,205 4.16%
Jan Rodolfo (Sanders) 16,372 33,771 50,143 4.00%
Willie Mack (Sanders) 16,809 37,162 53,971 4.30%
Tara S. Stamps (Sanders) 17,320 39,985 57,305 4.57%
Melissa Parks (Sanders) 18,344 40,337 58,681 4.68%
Robert Angert George (Sanders) 15,909 31,456 47,365 3.78%
Martin Ritter (Sanders) 16,274 34,648 50,922 4.06%
Peggy A. Roth (O'Malley) 1,424 3,910 5,334 0.43%
James F. Coyne (Clinton) 21,683 54,963 76,646 6.11%
Emma M. Mitts (Clinton) 23,755 65,400 89,155 7.11%
Larry Rogers, Jr. (Clinton) 22,578 58,620 81,198 6.47%
Katrina Veerhusen (O'Malley) 1,236 3,231 4,467 0.36%
Ira Acree (Clinton) 23,145 61,291 84,436 6.73%
Mattie Hunter (Clinton) 23,033 60,463 83,496 6.66%
John A. West (Clinton) 20,569 53,073 73,642 5.87%
Tumia Romero (O'Malley) 1,324 4,198 5,522 0.44%
Tierra S. Jackson (O'Malley) 1,676 6,163 7,839 0.63%
Eileen Kay Rhodes (Clinton) 21,931 54,765 76,696 6.12%
Michael Scott Jr. (Clinton) 22,318 61,115 83,433 6.65%
Anna Valencia (Clinton) 22,084 56,060 78,144 6.23%
363,589 890,488 1,254,077
(vote for 9)
Delegate, National Convention 7th DEM - DEM Cook County City of Chicago Combined Total Percentage
Frank F. Imhoff (O'Malley) 1,287 1,287 0.87%
Gary Kleppe (Sanders) 17,161 17,161 11.57%
José Afonso Villalobos (Sanders) 19,215 19,215 12.96%
Rhodelyn Bedford (Sanders) 17,585 17,585 11.86%
Veronica Noland (Sanders) 20,510 20,510 13.83%
Herb Porter (Clinton) 16,017 16,017 10.80%
Micaela Brown (Clinton) 19,368 19,368 13.06%
Terrell Barnes (O'Malley) 1,574 1,574 1.06%
Deborah H. Erbach (Clinton) 18,384 18,384 12.40%
Theodore J. Mason (Clinton) 17,179 17,179 11.59%
148,280 148,280
(vote for 4)
Delegate, National Convention 8th DEM - DEM Cook County City of Chicago Combined Total Percentage

32 Page 8 of 83
Sharon Sanders (Sanders) 36,957 28,632 65,589 7.18%
Ed Mullen (Sanders) 33,276 24,974 58,250 6.37%
Dan Johnson (Sanders) 18,780 15,110 33,890 3.71%
David Hatch (Sanders) 29,531 22,680 52,211 5.71%
Mary Rita Luecke (Sanders) 34,059 25,481 59,540 6.51%
Ayo Maat (Sanders) 27,388 22,421 49,809 5.45%
Kathleen Hogan (Sanders) 36,015 27,617 63,632 6.96%
Michael J. Harrington (Sanders) 32,883 23,243 56,126 6.14%
Heather A. Steans (Clinton) 42,217 25,606 67,823 7.42%
Michael Cabonargi (Clinton) 42,274 23,664 65,938 7.21%
Voda Ebeling (Clinton) 42,403 23,906 66,309 7.26%
Devlin Kane (O'Malley) 4,377 2,895 7,272 0.80%
Lakshmi Lakshmanan (Clinton) 42,783 23,418 66,201 7.24%
Lou Lang (Clinton) 42,287 23,664 65,951 7.22%
Josina Morita (Clinton) 42,603 24,525 67,128 7.34%
Rick Garcia (Clinton) 43,092 25,198 68,290 7.47%
550,925 363,034 913,959
(vote for 7)
Delegate, National Convention 9th DEM - DEM Cook County City of Chicago Combined Total Percentage
David Borris (Sanders) 7,490 7,490 7.14%
Sarah Minoo Shadnia (Sanders) 4,397 4,397 4.19%
Kerry Martin (O'Malley) 989 989 0.94%
Brian Dupuis (Sanders) 7,827 7,827 7.46%
Olivia Love-Hatlestad (Sanders) 7,731 7,731 7.37%
Talisa Hardin (Sanders) 7,744 7,744 7.38%
Paul Law (Sanders) 7,772 7,772 7.41%
Lauren Beth Gash (Clinton) 12,743 12,743 12.14%
Andrew Evan Boron (Clinton) 12,211 12,211 11.64%
John Cadwell (O'Malley) 712 712 0.68%
Steven Sheffey (Clinton) 11,359 11,359 10.83%
Audrey Nixon (Clinton) 12,029 12,029 11.46%
Terry Link (Clinton) 11,929 11,929 11.37%
104,933 104,933
(vote for 5)
Delegate, National Convention 10th DEM - DEM Cook County City of Chicago Combined Total Percentage

33 Page 9 of 83
Patricia Van Pelt 33,123 33,123 67.85%
Robert ''Bob'' Fioretti 15,696 15,696 32.15%
48,819 48,819
State Senator, 5th District 2yr - DEM Cook County City of Chicago Combined Total Percentage
Heather A. Steans 745 48,946 49,691 100.00%
745 48,946 49,691
State Senator, 7th District 4yr - DEM Cook County City of Chicago Combined Total Percentage
Kimberly A. Lightford 33,884 13,921 47,805 100.00%
33,884 13,921 47,805
State Senator, 4th District 4yr - DEM Cook County City of Chicago Combined Total Percentage
John Laesch (Sanders) 170 170 7.38%
Ben Mullenbach (Sanders) 106 106 4.60%
Barbara I. Hernandez (O'Malley) 23 23 1.00%
Jesus (Jesse) Medina (Sanders) 174 174 7.55%
Elizabeth Wilke (Sanders) 195 195 8.46%
Jacqueline L. Traynere (Sanders) 174 174 7.55%
Hillary Colby (Sanders) 174 174 7.55%
Alex Arroyo (Clinton) 266 266 11.54%
Aesook Byon (Clinton) 246 246 10.67%
Timothy M. Brophy (O'Malley) 19 19 0.82%
Linda Chapa Lavia (Clinton) 260 260 11.28%
Herbert Brooks, Jr. (Clinton) 250 250 10.85%
Gay E. Bruhn (Clinton) 248 248 10.76%
2,305 2,305
(vote for 5)
Delegate, National Convention 11th DEM - DEM Cook County City of Chicago Combined Total Percentage
Antonio ''Tony'' Munoz 362 30,412 30,774 100.00%
362 30,412 30,774
State Senator, 1st District 4yr - DEM Cook County City of Chicago Combined Total Percentage
Angelica Alfaro 125 19,068 19,193 47.10%
Omar Aquino 98 21,459 21,557 52.90%
223 40,527 40,750
State Senator, 2nd District 2yr - DEM Cook County City of Chicago Combined Total Percentage

34 Page 10 of 83
Donne E. Trotter 14,768 32,480 47,248 100.00%
14,768 32,480 47,248
State Senator, 17th District 2yr - DEM Cook County City of Chicago Combined Total Percentage
Jacqueline ''Jacqui'' Collins 9,310 31,090 40,400 100.00%
9,310 31,090 40,400
State Senator, 16th District 4yr - DEM Cook County City of Chicago Combined Total Percentage
McStephen O.A. ''Max'' Solomon 5,877 5,877 19.96%
Michael E. Hastings 23,574 23,574 80.04%
29,451 29,451
State Senator, 19th District 4yr - DEM Cook County City of Chicago Combined Total Percentage
Emil Jones III 15,946 33,411 49,357 100.00%
15,946 33,411 49,357
State Senator, 14th District 2yr - DEM Cook County City of Chicago Combined Total Percentage
John G. Mulroe 7,622 23,917 31,539 100.00%
7,622 23,917 31,539
State Senator, 10th District 4yr - DEM Cook County City of Chicago Combined Total Percentage
Ira I. Silverstein 13,754 16,576 30,330 100.00%
13,754 16,576 30,330
State Senator, 8th District 2yr - DEM Cook County City of Chicago Combined Total Percentage
Kwame Raoul 47,391 47,391 100.00%
47,391 47,391
State Senator, 13th District 4yr - DEM Cook County City of Chicago Combined Total Percentage
Martin A. Sandoval 5,755 26,873 32,628 100.00%
5,755 26,873 32,628
State Senator, 11th District 2yr - DEM Cook County City of Chicago Combined Total Percentage

35 Page 11 of 83
Julie A. Morrison 12,223 12,223 100.00%
12,223 12,223
State Senator, 29th District 2yr - DEM Cook County City of Chicago Combined Total Percentage
Laura Murphy 21,616 329 21,945 100.00%
21,616 329 21,945
State Senator, 28th District 4yr - DEM Cook County City of Chicago Combined Total Percentage
Toi W. Hutchinson 12,833 12,833 100.00%
12,833 12,833
State Senator, 40th District 4yr - DEM Cook County City of Chicago Combined Total Percentage
No Candidate 0 0 0.00%
0 0
State Senator, 26th District 2yr - DEM Cook County City of Chicago Combined Total Percentage
Cristina Castro 8,732 8,732 62.08%
Steve Caramelli 5,334 5,334 37.92%
14,066 14,066
State Senator, 22nd District 4yr - DEM Cook County City of Chicago Combined Total Percentage
Iris Y. Martinez 37,221 37,221 100.00%
37,221 37,221
State Senator, 20th District 2yr - DEM Cook County City of Chicago Combined Total Percentage
Corinne M. Pierog 604 604 100.00%
604 604
State Senator, 25th District 4yr - DEM Cook County City of Chicago Combined Total Percentage
Thomas E. Cullerton 783 783 100.00%
783 783
State Senator, 23rd District 2yr - DEM Cook County City of Chicago Combined Total Percentage

36 Page 12 of 83
Sonya Marie Harper 7,348 7,348 32.48%
Write-In 143 143 0.63%
Kenyatta Nicole Vaughn 4,530 4,530 20.02%
Genita C. Robinson 5,019 5,019 22.18%
Darryl D. Smith 5,585 5,585 24.69%
22,625 22,625
State Representative, 6th District - DEM Cook County City of Chicago Combined Total Percentage
Write-In 120 120 0.41%
Kenneth ''Ken'' Dunkin 9,300 9,300 31.84%
Juliana Stratton 19,790 19,790 67.75%
29,210 29,210
State Representative, 5th District - DEM Cook County City of Chicago Combined Total Percentage
Cynthia Soto 18,326 18,326 79.57%
Robert Zwolinski (Bob Z) 4,705 4,705 20.43%
23,031 23,031
State Representative, 4th District - DEM Cook County City of Chicago Combined Total Percentage
Daniel J. Burke 345 14,093 14,438 100.00%
345 14,093 14,438
State Representative, 1st District - DEM Cook County City of Chicago Combined Total Percentage
No Candidate 0 0 0.00%
0 0
State Senator, 41st District 2yr - DEM Cook County City of Chicago Combined Total Percentage
Luis Arroyo 198 15,590 15,788 98.31%
Write-In 1 271 272 1.69%
199 15,861 16,060
State Representative, 3rd District - DEM Cook County City of Chicago Combined Total Percentage
Write-In 78 78 0.37%
Theresa Mah 10,732 10,732 51.04%
Alexander ''Alex'' Acevedo 10,217 10,217 48.59%
21,027 21,027
State Representative, 2nd District - DEM Cook County City of Chicago Combined Total Percentage

37 Page 13 of 83
Gregory Harris 24,718 24,718 100.00%
24,718 24,718
State Representative, 13th District - DEM Cook County City of Chicago Combined Total Percentage
Sara Feigenholtz 23,428 23,428 100.00%
23,428 23,428
State Representative, 12th District - DEM Cook County City of Chicago Combined Total Percentage
Kelly M. Cassidy 734 23,753 24,487 100.00%
734 23,753 24,487
State Representative, 14th District - DEM Cook County City of Chicago Combined Total Percentage
Ann M. Williams 21,458 21,458 100.00%
21,458 21,458
State Representative, 11th District - DEM Cook County City of Chicago Combined Total Percentage
La Shawn K. Ford 8,828 15,303 24,131 100.00%
8,828 15,303 24,131
State Representative, 8th District - DEM Cook County City of Chicago Combined Total Percentage
Emanuel ''Chris'' Welch 18,117 18,117 65.55%
Chris Harris 9,521 9,521 34.45%
27,638 27,638
State Representative, 7th District - DEM Cook County City of Chicago Combined Total Percentage
Melissa Conyears 19,769 19,769 100.00%
19,769 19,769
State Representative, 10th District - DEM Cook County City of Chicago Combined Total Percentage
Arthur Turner 20,273 20,273 100.00%
20,273 20,273
State Representative, 9th District - DEM Cook County City of Chicago Combined Total Percentage

38 Page 14 of 83
Silvana Tabares 5,038 7,606 12,644 100.00%
5,038 7,606 12,644
State Representative, 21st District - DEM Cook County City of Chicago Combined Total Percentage
Merry Marwig 5,961 7,266 13,227 100.00%
5,961 7,266 13,227
State Representative, 20th District - DEM Cook County City of Chicago Combined Total Percentage
Jason Gonzales 273 6,851 7,124 27.07%
Grasiela Rodriguez 72 1,451 1,523 5.79%
Joe G. Barboza 31 487 518 1.97%
Michael J. Madigan 439 16,716 17,155 65.18%
815 25,505 26,320
State Representative, 22nd District - DEM Cook County City of Chicago Combined Total Percentage
Robert Martwick 1,502 15,455 16,957 100.00%
1,502 15,455 16,957
State Representative, 19th District - DEM Cook County City of Chicago Combined Total Percentage
Lou Lang 7,669 7,040 14,709 100.00%
7,669 7,040 14,709
State Representative, 16th District - DEM Cook County City of Chicago Combined Total Percentage
John C. D'Amico 4,905 6,532 11,437 59.88%
Jac Charlier 2,282 5,381 7,663 40.12%
7,187 11,913 19,100
State Representative, 15th District - DEM Cook County City of Chicago Combined Total Percentage
Robyn Gabel 22,807 22,807 100.00%
22,807 22,807
State Representative, 18th District - DEM Cook County City of Chicago Combined Total Percentage
Laura Fine 19,893 19,893 100.00%
19,893 19,893
State Representative, 17th District - DEM Cook County City of Chicago Combined Total Percentage

39 Page 15 of 83
Kenneth ''Kenny'' Williams 4,572 706 5,278 21.70%
Wilbur ''Will'' Tillman 2,286 687 2,973 12.22%
Thaddeus Jones 14,175 1,900 16,075 66.08%
21,033 3,293 24,326
State Representative, 29th District - DEM Cook County City of Chicago Combined Total Percentage
Robert ''Bob'' Rita 10,081 11,315 21,396 100.00%
10,081 11,315 21,396
State Representative, 28th District - DEM Cook County City of Chicago Combined Total Percentage
William ''Will'' Davis 18,698 18,698 100.00%
18,698 18,698
State Representative, 30th District - DEM Cook County City of Chicago Combined Total Percentage
Monique D. Davis 6,104 21,622 27,726 100.00%
6,104 21,622 27,726
State Representative, 27th District - DEM Cook County City of Chicago Combined Total Percentage
Elizabeth ''Lisa'' Hernandez 11,367 2,997 14,364 100.00%
11,367 2,997 14,364
State Representative, 24th District - DEM Cook County City of Chicago Combined Total Percentage
Michael J. Zalewski 12,655 14 12,669 100.00%
12,655 14 12,669
State Representative, 23rd District - DEM Cook County City of Chicago Combined Total Percentage
Jhatayn 'Jay' Travis 11,489 11,489 43.81%
Christian L. Mitchell 14,735 14,735 56.19%
26,224 26,224
State Representative, 26th District - DEM Cook County City of Chicago Combined Total Percentage
Barbara Flynn Currie 25,165 25,165 100.00%
25,165 25,165
State Representative, 25th District - DEM Cook County City of Chicago Combined Total Percentage

40 Page 16 of 83
No Candidate 0 0 0.00%
0 0
State Representative, 37th District - DEM Cook County City of Chicago Combined Total Percentage
Kelly M. Burke 14,318 3,441 17,759 100.00%
14,318 3,441 17,759
State Representative, 36th District - DEM Cook County City of Chicago Combined Total Percentage
Al Riley 23,476 23,476 100.00%
23,476 23,476
State Representative, 38th District - DEM Cook County City of Chicago Combined Total Percentage
Frances Ann Hurley 7,134 12,628 19,762 100.00%
7,134 12,628 19,762
State Representative, 35th District - DEM Cook County City of Chicago Combined Total Percentage
André Thapedi 3,665 13,876 17,541 100.00%
3,665 13,876 17,541
State Representative, 32nd District - DEM Cook County City of Chicago Combined Total Percentage
Mary E. Flowers 5,353 17,532 22,885 100.00%
5,353 17,532 22,885
State Representative, 31st District - DEM Cook County City of Chicago Combined Total Percentage
Elgie R. Sims, Jr. 5,988 14,204 20,192 100.00%
5,988 14,204 20,192
State Representative, 34th District - DEM Cook County City of Chicago Combined Total Percentage
Marcus C. Evans, Jr. 8,257 17,038 25,295 100.00%
8,257 17,038 25,295
State Representative, 33rd District - DEM Cook County City of Chicago Combined Total Percentage

41 Page 17 of 83
No Candidate 0 0 0.00%
0 0
State Representative, 49th District - DEM Cook County City of Chicago Combined Total Percentage
No Candidate 0 0 0.00%
0 0
State Representative, 47th District - DEM Cook County City of Chicago Combined Total Percentage
No Candidate 0 0 0.00%
0 0
State Representative, 51st District - DEM Cook County City of Chicago Combined Total Percentage
Cynthia Borbas 758 758 100.00%
758 758
State Representative, 45th District - DEM Cook County City of Chicago Combined Total Percentage
Harish I. Patel 8,812 8,812 40.61%
Jaime M. Andrade, Jr. 12,886 12,886 59.39%
21,698 21,698
State Representative, 40th District - DEM Cook County City of Chicago Combined Total Percentage
Will Guzzardi 18,601 18,601 100.00%
18,601 18,601
State Representative, 39th District - DEM Cook County City of Chicago Combined Total Percentage
Fred Crespo 11,008 11,008 100.00%
11,008 11,008
State Representative, 44th District - DEM Cook County City of Chicago Combined Total Percentage
Anna Moeller 2,083 2,083 100.00%
2,083 2,083
State Representative, 43rd District - DEM Cook County City of Chicago Combined Total Percentage

42 Page 18 of 83
Scott Drury 1,457 1,457 100.00%
1,457 1,457
State Representative, 58th District - DEM Cook County City of Chicago Combined Total Percentage
Elaine Nekritz 11,037 11,037 100.00%
11,037 11,037
State Representative, 57th District - DEM Cook County City of Chicago Combined Total Percentage
Carol Sente 1,503 1,503 100.00%
1,503 1,503
State Representative, 59th District - DEM Cook County City of Chicago Combined Total Percentage
Michelle Mussman 10,471 10,471 100.00%
10,471 10,471
State Representative, 56th District - DEM Cook County City of Chicago Combined Total Percentage
No Candidate 0 0 0.00%
0 0
State Representative, 53rd District - DEM Cook County City of Chicago Combined Total Percentage
No Candidate 0 0 0.00%
0 0
State Representative, 52nd District - DEM Cook County City of Chicago Combined Total Percentage
Martin J. Moylan 12,475 326 12,801 100.00%
12,475 326 12,801
State Representative, 55th District - DEM Cook County City of Chicago Combined Total Percentage
No Candidate 0 0 0.00%
0 0
State Representative, 54th District - DEM Cook County City of Chicago Combined Total Percentage

43 Page 19 of 83
Tom Greenhaw 124,280 171,982 296,262 33.90%
Write-In 1,444 4,832 6,276 0.72%
Martin J. Durkan 124,415 210,001 334,416 38.27%
Andrew Seo 94,331 142,619 236,950 27.11%
344,470 529,434 873,904
Commissioner, Water Reclamation Dist 2yr - DEM
Cook County City of Chicago Combined Total Percentage
Joseph Daniel Cook 131,599 190,215 321,814 15.20%
Josina Morita 154,304 234,462 388,766 18.36%
R. Cary Capparelli 79,275 84,207 163,482 7.72%
Barbara McGowan 210,203 307,036 517,239 24.42%
Mariyana T. Spyropoulos 178,797 244,516 423,313 19.99%
Kevin McDevitt 133,168 170,002 303,170 14.32%
887,346 1,230,438 2,117,784
(vote for 3)
Commissioner, Water Reclamation Dist - DEM Cook County City of Chicago Combined Total Percentage
Camille Lilly 15,334 7,302 22,636 100.00%
15,334 7,302 22,636
State Representative, 78th District - DEM Cook County City of Chicago Combined Total Percentage
Kathleen Willis 6,695 6,695 100.00%
6,695 6,695
State Representative, 77th District - DEM Cook County City of Chicago Combined Total Percentage
No Candidate 0 0 0.00%
0 0
State Representative, 82nd District - DEM Cook County City of Chicago Combined Total Percentage
Anthony DeLuca 12,388 12,388 100.00%
12,388 12,388
State Representative, 80th District - DEM Cook County City of Chicago Combined Total Percentage

44 Page 20 of 83
Bertina E. Lampkin 332,306 460,335 792,641 100.00%
332,306 460,335 792,641
Appellate Court Judge (Vacancy of Quinn) - DEM
Cook County City of Chicago Combined Total Percentage
Eileen O'Neill Burke 339,100 466,090 805,190 100.00%
339,100 466,090 805,190
Appellate Court Judge (Vacancy of Epstein) - DEM
Cook County City of Chicago Combined Total Percentage
Michael Cabonargi 36,404 239,002 275,406 100.00%
36,404 239,002 275,406
Board of Review, 2nd District - DEM Cook County City of Chicago Combined Total Percentage
Dorothy A. Brown 181,416 296,087 477,503 47.27%
Write-In 842 2,409 3,251 0.32%
Michelle A. Harris 123,594 183,798 307,392 30.43%
Jacob Meister 95,983 125,938 221,921 21.97%
401,835 608,232 1,010,067
Clerk of the Circuit Court, Cook County - DEM Cook County City of Chicago Combined Total Percentage
Donna More 64,990 79,073 144,063 13.01%
Kim Foxx 230,111 415,627 645,738 58.31%
Anita Alvarez 145,712 171,882 317,594 28.68%
440,813 666,582 1,107,395
State's Attorney, Cook County - DEM Cook County City of Chicago Combined Total Percentage
No Candidate 0 0 0 0.00%
0 0 0
Board of Review, 1st District - DEM Cook County City of Chicago Combined Total Percentage
Karen A. Yarbrough 359,679 528,563 888,242 99.19%
Write-In 1,904 5,346 7,250 0.81%
361,583 533,909 895,492
Recorder of Deeds, Cook County - DEM Cook County City of Chicago Combined Total Percentage

45 Page 21 of 83
Brian J O'Hara 68,898 88,333 157,231 18.62%
Mary Kathleen McHugh 177,046 233,858 410,904 48.66%
Devlin J. Schoop 108,447 167,904 276,351 32.72%
354,391 490,095 844,486
Circuit Court Judge (Vacancy of Karnezis) - DEM
Cook County City of Chicago Combined Total Percentage
Mark A. Lyon 69,324 102,693 172,017 20.17%
Bonnie Carol McGrath 62,965 85,950 148,915 17.46%
Write-In 692 1,988 2,680 0.31%
Gregory Raymond LaPapa 46,136 65,809 111,945 13.13%
Carolyn J. Gallagher 123,793 169,129 292,922 34.34%
Sean S. Chaudhuri 54,751 69,676 124,427 14.59%
357,661 495,245 852,906
Circuit Court Judge (Vacancy of Johnson) - DEM
Cook County City of Chicago Combined Total Percentage
Write-In 774 2,499 3,273 0.38%
Scott Edward Lipinski 136,161 149,118 285,279 32.99%
Rossana Patricia Fernandez 225,644 350,568 576,212 66.63%
362,579 502,185 864,764
Circuit Court Judge (Vacancy of Elrod) - DEM Cook County City of Chicago Combined Total Percentage
John Fitzgerald Lyke, Jr. 327,196 450,467 777,663 100.00%
327,196 450,467 777,663
Circuit Court Judge (Vacancy of Biebel, Jr.) - DEM
Cook County City of Chicago Combined Total Percentage
Aleksandra ''Alex'' Gillespie 223,655 316,581 540,236 64.40%
Thomas Maloney Cushing 128,231 170,469 298,700 35.60%
351,886 487,050 838,936
Circuit Court Judge (Vacancy of Howlett, Jr.) - DEM
Cook County City of Chicago Combined Total Percentage
Michael I. O'Malley 173,140 222,533 395,673 45.76%
Alison C. Conlon 190,206 278,803 469,009 54.24%
363,346 501,336 864,682
Circuit Court Judge (Vacancy of Hogan) - DEM Cook County City of Chicago Combined Total Percentage
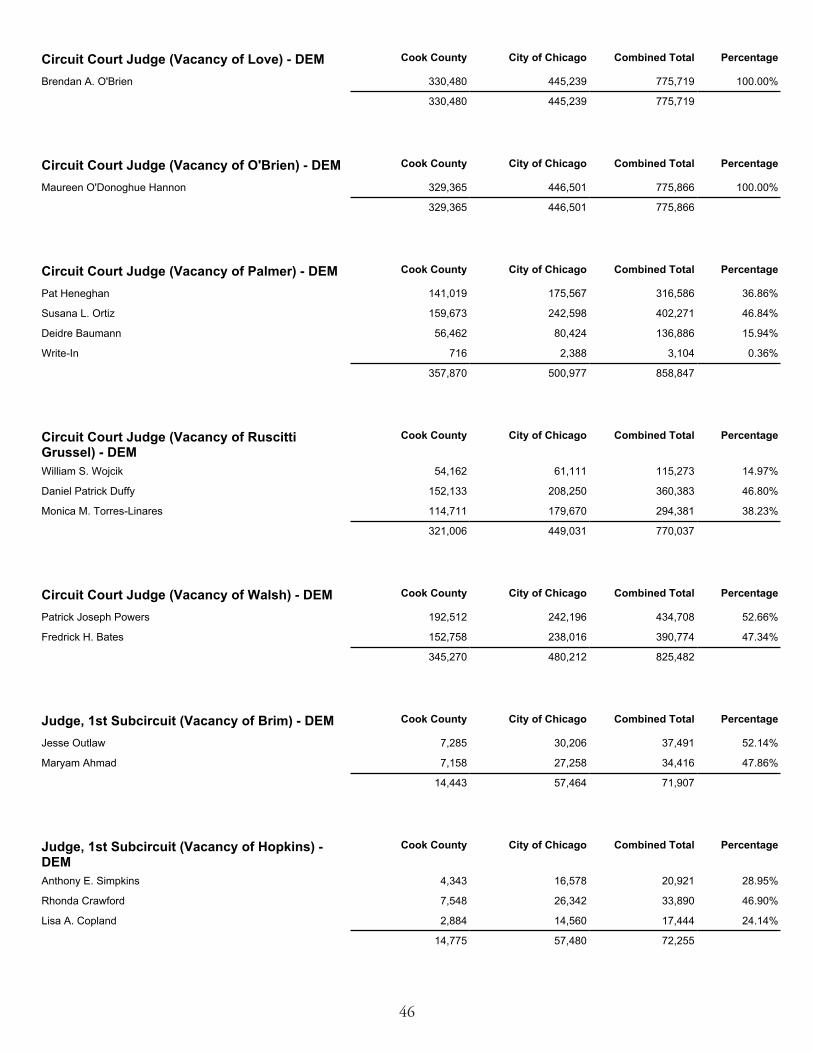
46 Page 22 of 83
Lisa A. Copland 2,884 14,560 17,444 24.14%
Anthony E. Simpkins 4,343 16,578 20,921 28.95%
Rhonda Crawford 7,548 26,342 33,890 46.90%
14,775 57,480 72,255
Judge, 1st Subcircuit (Vacancy of Hopkins) - DEM
Cook County City of Chicago Combined Total Percentage
Jesse Outlaw 7,285 30,206 37,491 52.14%
Maryam Ahmad 7,158 27,258 34,416 47.86%
14,443 57,464 71,907
Judge, 1st Subcircuit (Vacancy of Brim) - DEM Cook County City of Chicago Combined Total Percentage
Patrick Joseph Powers 192,512 242,196 434,708 52.66%
Fredrick H. Bates 152,758 238,016 390,774 47.34%
345,270 480,212 825,482
Circuit Court Judge (Vacancy of Walsh) - DEM Cook County City of Chicago Combined Total Percentage
Maureen O'Donoghue Hannon 329,365 446,501 775,866 100.00%
329,365 446,501 775,866
Circuit Court Judge (Vacancy of O'Brien) - DEM Cook County City of Chicago Combined Total Percentage
Brendan A. O'Brien 330,480 445,239 775,719 100.00%
330,480 445,239 775,719
Circuit Court Judge (Vacancy of Love) - DEM Cook County City of Chicago Combined Total Percentage
Monica M. Torres-Linares 114,711 179,670 294,381 38.23%
William S. Wojcik 54,162 61,111 115,273 14.97%
Daniel Patrick Duffy 152,133 208,250 360,383 46.80%
321,006 449,031 770,037
Circuit Court Judge (Vacancy of Ruscitti Grussel) - DEM
Cook County City of Chicago Combined Total Percentage
Susana L. Ortiz 159,673 242,598 402,271 46.84%
Write-In 716 2,388 3,104 0.36%
Deidre Baumann 56,462 80,424 136,886 15.94%
Pat Heneghan 141,019 175,567 316,586 36.86%
357,870 500,977 858,847
Circuit Court Judge (Vacancy of Palmer) - DEM Cook County City of Chicago Combined Total Percentage

47 Page 23 of 83
Richard C. Cooke 48,950 48,950 100.00%
48,950 48,950
Judge, 6th Subcircuit (Vac of Gonzalez Santiago) - DEM
Cook County City of Chicago Combined Total Percentage
Eulalia ''Evie'' De La Rosa 51,070 51,070 100.00%
51,070 51,070
Judge, 6th Subcircuit (Vacancy of Ponce de Leon) - DEM
Cook County City of Chicago Combined Total Percentage
Daryl Jones 31,030 31,030 58.09%
Robin Denise Shoffner 22,389 22,389 41.91%
53,419 53,419
Judge, 5th Subcircuit (Vacancy of Williams) - DEM
Cook County City of Chicago Combined Total Percentage
Edward J. King 44,238 44,238 100.00%
44,238 44,238
Judge, 4th Subcircuit (Vac of Kunkle) - DEM Cook County City of Chicago Combined Total Percentage
Travis Richardson 6,060 6,776 12,836 17.51%
Write-In 95 159 254 0.35%
Chelsey R. Robinson 8,899 8,298 17,197 23.46%
D. Renee Jackson 13,949 12,648 26,597 36.29%
Celeste K. Jones 7,905 8,503 16,408 22.39%
36,908 36,384 73,292
Judge, 2nd Subcircuit (Vacancy of Savage) - DEM
Cook County City of Chicago Combined Total Percentage
Freddrenna M. Lyle 48,367 48,367 100.00%
48,367 48,367
Judge, 5th Subcircuit (Vacancy of Stuart) - DEM Cook County City of Chicago Combined Total Percentage
Write-In 391 391 0.73%
Jameika Mangum 23,973 23,973 45.02%
Leonard Murray 28,881 28,881 54.24%
53,245 53,245
Judge, 5th Subcircuit (Vacancy of Eadie-Daniels) - DEM
Cook County City of Chicago Combined Total Percentage

48 Page 24 of 83
Eve Marie Reilly 3,569 20,515 24,084 40.36%
Richard ''Rick'' Cenar 1,325 8,589 9,914 16.62%
Michael John Malatesta 1,764 5,949 7,713 12.93%
Colleen Reardon Daly 2,502 15,454 17,956 30.09%
9,160 50,507 59,667
Judge, 10th Subcircuit (Vacancy of Howard) - DEM
Cook County City of Chicago Combined Total Percentage
Marianne Jackson 12,883 39,233 52,116 100.00%
12,883 39,233 52,116
Judge, 7th Subcircuit (Vacancy of Burrell) - DEM
Cook County City of Chicago Combined Total Percentage
Carlos Claudio 20,745 20,745 36.26%
Anna Loftus 25,964 25,964 45.39%
Edward J. Underhill 10,495 10,495 18.35%
57,204 57,204
Judge, 6th Subcircuit (Additional Judgeship A) - DEM
Cook County City of Chicago Combined Total Percentage
Thomas Peter Kougias 13,415 7,941 21,356 36.03%
Jerry Esrig 26,181 11,731 37,912 63.97%
39,596 19,672 59,268
Judge, 9th Subcircuit (Vacancy of Berman) - DEM
Cook County City of Chicago Combined Total Percentage
Patrick D. John 700 3,141 3,841 6.35%
Rosa Silva 5,677 7,216 12,893 21.32%
Write-In 41 265 306 0.51%
Jennifer Ballard 2,520 12,113 14,633 24.20%
Patricia ''Pat'' S. Spratt 3,604 12,746 16,350 27.04%
Mable Taylor 974 7,400 8,374 13.85%
Christopher J. Stuart 1,096 2,967 4,063 6.72%
14,612 45,848 60,460
Judge, 7th Subcircuit (Vac of Rivkin-Carothers) - DEM
Cook County City of Chicago Combined Total Percentage

49 Page 25 of 83
Ketki ''Kay'' Steffen 35,855 35,855 100.00%
35,855 35,855
Judge, 13th Subcircuit (Vac of Fecarotta, Jr.) - DEM
Cook County City of Chicago Combined Total Percentage
James Edward Hanlon, Jr. 24,235 24,235 65.01%
Allan W. Masters 13,042 13,042 34.99%
37,277 37,277
Judge, 12th Subcircuit (Additional Judgeship A) - DEM
Cook County City of Chicago Combined Total Percentage
Carrie Hamilton 37,138 37,138 100.00%
37,138 37,138
Judge, 12th Subcircuit (Vac of Tristano) - DEM Cook County City of Chicago Combined Total Percentage
William B. Sullivan 28,574 23,326 51,900 100.00%
28,574 23,326 51,900
Judge, 11th Subcircuit (Vacancy of Zwick) - DEM
Cook County City of Chicago Combined Total Percentage
Catherine Ann Schneider 14,176 9,465 23,641 40.32%
Marc Martin 12,227 10,447 22,674 38.67%
James DiChristofano 5,759 6,555 12,314 21.00%
32,162 26,467 58,629
Judge, 11th Subcircuit (Vacancy of Kelly) - DEM Cook County City of Chicago Combined Total Percentage
Janet Cronin Mahoney 29,778 29,778 78.83%
Adam Scott Mathein 7,997 7,997 21.17%
37,775 37,775
Judge, 12th Subcircuit (Vac of Mathein) - DEM Cook County City of Chicago Combined Total Percentage
Marguerite Anne Quinn 18,067 18,067 44.89%
Frank J. Andreou 5,012 5,012 12.45%
Jennifer E. Bae 12,360 12,360 30.71%
Louis George Apostol 4,807 4,807 11.94%
40,246 40,246
Judge, 12th Subcircuit (Vac of Kazmierski, Jr.) - DEM
Cook County City of Chicago Combined Total Percentage

50 Page 26 of 83
Roderick T. Sawyer 12,533 12,533 100.00%
12,533 12,533
Ward Committeeman, Dem 6th - DEM Cook County City of Chicago Combined Total Percentage
Leslie A. Hairston 12,385 12,385 100.00%
12,385 12,385
Ward Committeeman, Dem 5th - DEM Cook County City of Chicago Combined Total Percentage
Gregory I. Mitchell 12,226 12,226 96.81%
Write-In 403 403 3.19%
12,629 12,629
Ward Committeeman, Dem 7th - DEM Cook County City of Chicago Combined Total Percentage
Toni Reed Preckwinkle 14,170 14,170 100.00%
14,170 14,170
Ward Committeeman, Dem 4th - DEM Cook County City of Chicago Combined Total Percentage
Proco ''Joe'' Moreno 6,604 6,604 50.76%
Maria Teresa Gonzalez 6,405 6,405 49.24%
13,009 13,009
Ward Committeeman, Dem 1st - DEM Cook County City of Chicago Combined Total Percentage
Matthew Link 8,254 31,111 39,365 100.00%
8,254 31,111 39,365
Judge, 14th Subcircuit (Vacancy of Ruble Murphy) - DEM
Cook County City of Chicago Combined Total Percentage
Pat Dowell 12,672 12,672 100.00%
12,672 12,672
Ward Committeeman, Dem 3rd - DEM Cook County City of Chicago Combined Total Percentage
Tim Egan 8,144 8,144 100.00%
8,144 8,144
Ward Committeeman, Dem 2nd - DEM Cook County City of Chicago Combined Total Percentage

51 Page 27 of 83
Edward M. Burke 7,588 7,588 100.00%
7,588 7,588
Ward Committeeman, Dem 14th - DEM Cook County City of Chicago Combined Total Percentage
Michael J. Madigan 12,179 12,179 100.00%
12,179 12,179
Ward Committeeman, Dem 13th - DEM Cook County City of Chicago Combined Total Percentage
Raymond A. Lopez 5,880 5,880 100.00%
5,880 5,880
Ward Committeeman, Dem 15th - DEM Cook County City of Chicago Combined Total Percentage
George Cardenas 3,669 3,669 46.88%
Antonio ''Tony'' Munoz 4,158 4,158 53.12%
7,827 7,827
Ward Committeeman, Dem 12th - DEM Cook County City of Chicago Combined Total Percentage
Anthony A. Beale 13,738 13,738 100.00%
13,738 13,738
Ward Committeeman, Dem 9th - DEM Cook County City of Chicago Combined Total Percentage
Michelle A. Harris 15,946 15,946 100.00%
15,946 15,946
Ward Committeeman, Dem 8th - DEM Cook County City of Chicago Combined Total Percentage
John P. Daley 8,870 8,870 100.00%
8,870 8,870
Ward Committeeman, Dem 11th - DEM Cook County City of Chicago Combined Total Percentage
Fred Carrizales 2,334 2,334 25.77%
Susan Sadlowski Garza 6,723 6,723 74.23%
9,057 9,057
Ward Committeeman, Dem 10th - DEM Cook County City of Chicago Combined Total Percentage

52 Page 28 of 83
Michael D. Rodriguez 6,682 6,682 100.00%
6,682 6,682
Ward Committeeman, Dem 22nd - DEM Cook County City of Chicago Combined Total Percentage
Howard B. Brookins, Jr. 13,852 13,852 93.65%
Write-In 940 940 6.35%
14,792 14,792
Ward Committeeman, Dem 21st - DEM Cook County City of Chicago Combined Total Percentage
Michael R. Zalewski 7,303 7,303 73.54%
Charles M. Hughes 2,628 2,628 26.46%
9,931 9,931
Ward Committeeman, Dem 23rd - DEM Cook County City of Chicago Combined Total Percentage
Kevin Bailey 8,289 8,289 100.00%
8,289 8,289
Ward Committeeman, Dem 20th - DEM Cook County City of Chicago Combined Total Percentage
David Moore 10,658 10,658 100.00%
10,658 10,658
Ward Committeeman, Dem 17th - DEM Cook County City of Chicago Combined Total Percentage
Stephanie D. Coleman 3,942 3,942 43.64%
Toni L. Foulkes 3,464 3,464 38.35%
Nathan Wilson 1,626 1,626 18.00%
9,032 9,032
Ward Committeeman, Dem 16th - DEM Cook County City of Chicago Combined Total Percentage
Matthew J. O'Shea 15,298 15,298 100.00%
15,298 15,298
Ward Committeeman, Dem 19th - DEM Cook County City of Chicago Combined Total Percentage
Derrick G. Curtis 13,687 13,687 100.00%
13,687 13,687
Ward Committeeman, Dem 18th - DEM Cook County City of Chicago Combined Total Percentage

53 Page 29 of 83
Ariel E. Reboyras 5,673 5,673 70.25%
Noe Favela 2,402 2,402 29.75%
8,075 8,075
Ward Committeeman, Dem 30th - DEM Cook County City of Chicago Combined Total Percentage
Christopher Taliaferro 11,946 11,946 90.12%
Write-In 1,309 1,309 9.88%
13,255 13,255
Ward Committeeman, Dem 29th - DEM Cook County City of Chicago Combined Total Percentage
Joseph Berrios 6,670 6,670 100.00%
6,670 6,670
Ward Committeeman, Dem 31st - DEM Cook County City of Chicago Combined Total Percentage
Jason C. Ervin 10,222 10,222 100.00%
10,222 10,222
Ward Committeeman, Dem 28th - DEM Cook County City of Chicago Combined Total Percentage
Daniel ''Danny'' Solis 7,922 7,922 100.00%
7,922 7,922
Ward Committeeman, Dem 25th - DEM Cook County City of Chicago Combined Total Percentage
Michael Scott, Jr. 9,054 9,054 100.00%
9,054 9,054
Ward Committeeman, Dem 24th - DEM Cook County City of Chicago Combined Total Percentage
Walter Burnett, Jr. 10,474 10,474 100.00%
10,474 10,474
Ward Committeeman, Dem 27th - DEM Cook County City of Chicago Combined Total Percentage
Roberto Maldonado 8,469 8,469 100.00%
8,469 8,469
Ward Committeeman, Dem 26th - DEM Cook County City of Chicago Combined Total Percentage

54 Page 30 of 83
Nicholas Sposato 8,497 8,497 97.87%
Write-In 185 185 2.13%
8,682 8,682
Ward Committeeman, Dem 38th - DEM Cook County City of Chicago Combined Total Percentage
Emma M. Mitts 10,193 10,193 100.00%
10,193 10,193
Ward Committeeman, Dem 37th - DEM Cook County City of Chicago Combined Total Percentage
Robert Murphy 6,075 6,075 54.69%
Patrick Molloy 5,034 5,034 45.31%
11,109 11,109
Ward Committeeman, Dem 39th - DEM Cook County City of Chicago Combined Total Percentage
Luis Arroyo 6,811 6,811 100.00%
6,811 6,811
Ward Committeeman, Dem 36th - DEM Cook County City of Chicago Combined Total Percentage
Richard F. Mell 5,407 5,407 49.77%
Aaron Goldstein 5,457 5,457 50.23%
10,864 10,864
Ward Committeeman, Dem 33rd - DEM Cook County City of Chicago Combined Total Percentage
Scott Waguespack 10,623 10,623 100.00%
10,623 10,623
Ward Committeeman, Dem 32nd - DEM Cook County City of Chicago Combined Total Percentage
Carlos Ramirez-Rosa 8,389 8,389 98.61%
Write-In 118 118 1.39%
8,507 8,507
Ward Committeeman, Dem 35th - DEM Cook County City of Chicago Combined Total Percentage
Carrie M. Austin 14,690 14,690 100.00%
14,690 14,690
Ward Committeeman, Dem 34th - DEM Cook County City of Chicago Combined Total Percentage

55 Page 31 of 83
James Cappleman 10,208 10,208 100.00%
10,208 10,208
Ward Committeeman, Dem 46th - DEM Cook County City of Chicago Combined Total Percentage
John S. Arena 10,481 10,481 100.00%
10,481 10,481
Ward Committeeman, Dem 45th - DEM Cook County City of Chicago Combined Total Percentage
Paul Rosenfeld 13,032 13,032 100.00%
13,032 13,032
Ward Committeeman, Dem 47th - DEM Cook County City of Chicago Combined Total Percentage
Tom Tunney 10,562 10,562 100.00%
10,562 10,562
Ward Committeeman, Dem 44th - DEM Cook County City of Chicago Combined Total Percentage
Goran Davidovac 865 865 7.47%
Andrew Devito 3,921 3,921 33.88%
Tim Heneghan 6,787 6,787 58.65%
11,573 11,573
Ward Committeeman, Dem 41st - DEM Cook County City of Chicago Combined Total Percentage
Patrick J. O'Connor 6,532 6,532 54.60%
Dianne Daleiden 5,431 5,431 45.40%
11,963 11,963
Ward Committeeman, Dem 40th - DEM Cook County City of Chicago Combined Total Percentage
Lucy Moog 7,818 7,818 100.00%
7,818 7,818
Ward Committeeman, Dem 43rd - DEM Cook County City of Chicago Combined Total Percentage
Brendan Reilly 8,158 8,158 100.00%
8,158 8,158
Ward Committeeman, Dem 42nd - DEM Cook County City of Chicago Combined Total Percentage

56 Page 32 of 83
Leslie Geissler Munger 164,384 58,076 222,460 100.00%
164,384 58,076 222,460
Comptroller, State of Illinois - REP Cook County City of Chicago Combined Total Percentage
James T. Marter 57,858 21,534 79,392 28.29%
Mark Steven Kirk 146,863 54,357 201,220 71.71%
204,721 75,891 280,612
Senator, U.S. - REP Cook County City of Chicago Combined Total Percentage
Joe Moore 10,631 10,631 100.00%
10,631 10,631
Ward Committeeman, Dem 49th - DEM Cook County City of Chicago Combined Total Percentage
Carol Ronen 12,039 12,039 100.00%
12,039 12,039
Ward Committeeman, Dem 48th - DEM Cook County City of Chicago Combined Total Percentage
Rick Santorum 152 85 237 0.08%
Mike Huckabee 221 116 337 0.11%
Rand Paul 639 380 1,019 0.33%
Write-In 437 384 821 0.26%
Ben Carson 1,014 664 1,678 0.54%
John R. Kasich 54,204 22,629 76,833 24.55%
Chris Christie 511 239 750 0.24%
Jeb Bush 1,366 761 2,127 0.68%
Carly Fiorina 197 138 335 0.11%
Donald J. Trump 92,603 34,038 126,641 40.46%
Marco Rubio 21,468 11,034 32,502 10.38%
Ted Cruz 51,333 18,403 69,736 22.28%
224,145 88,871 313,016
President, U.S. - REP Cook County City of Chicago Combined Total Percentage
Ira I. Silverstein 6,599 6,599 100.00%
6,599 6,599
Ward Committeeman, Dem 50th - DEM Cook County City of Chicago Combined Total Percentage

57 Page 33 of 83
No Candidate 0 0 0 0.00%
0 0 0
U.S. Representative, 7th District - REP Cook County City of Chicago Combined Total Percentage
Peter J. Roskam 10,490 10,490 72.60%
Gordon (Jay) Kinzler 3,959 3,959 27.40%
14,449 14,449
U.S. Representative, 6th District - REP Cook County City of Chicago Combined Total Percentage
Peter ''Pete'' DiCianni 24,287 24,287 98.84%
Write-In 286 286 1.16%
24,573 24,573
U.S. Representative, 8th District - REP Cook County City of Chicago Combined Total Percentage
No Candidate 0 0 0 0.00%
0 0 0
U.S. Representative, 5th District - REP Cook County City of Chicago Combined Total Percentage
John F Morrow 8,425 1,392 9,817 100.00%
8,425 1,392 9,817
U.S. Representative, 2nd District - REP Cook County City of Chicago Combined Total Percentage
August (O'Neill) Deuser 12,997 1,265 14,262 74.58%
Jimmy Lee Tillman, II 3,955 907 4,862 25.42%
16,952 2,172 19,124
U.S. Representative, 1st District - REP Cook County City of Chicago Combined Total Percentage
No Candidate 0 0 0 0.00%
0 0 0
U.S. Representative, 4th District - REP Cook County City of Chicago Combined Total Percentage
No Candidate 0 0 0 0.00%
Write-In 1,838 955 2,793 100.00%
1,838 955 2,793
U.S. Representative, 3rd District - REP Cook County City of Chicago Combined Total Percentage
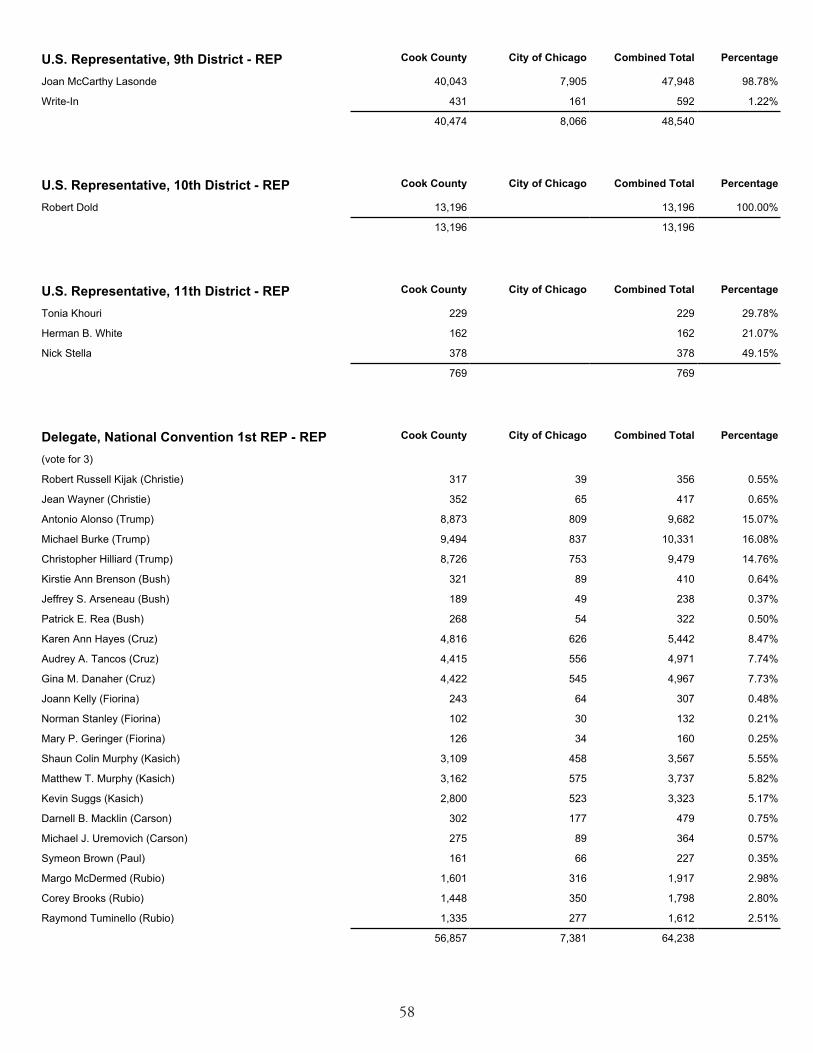
58 Page 34 of 83
Robert Dold 13,196 13,196 100.00%
13,196 13,196
U.S. Representative, 10th District - REP Cook County City of Chicago Combined Total Percentage
Joan McCarthy Lasonde 40,043 7,905 47,948 98.78%
Write-In 431 161 592 1.22%
40,474 8,066 48,540
U.S. Representative, 9th District - REP Cook County City of Chicago Combined Total Percentage
Mary P. Geringer (Fiorina) 126 34 160 0.25%
Shaun Colin Murphy (Kasich) 3,109 458 3,567 5.55%
Matthew T. Murphy (Kasich) 3,162 575 3,737 5.82%
Gina M. Danaher (Cruz) 4,422 545 4,967 7.73%
Raymond Tuminello (Rubio) 1,335 277 1,612 2.51%
Norman Stanley (Fiorina) 102 30 132 0.21%
Symeon Brown (Paul) 161 66 227 0.35%
Margo McDermed (Rubio) 1,601 316 1,917 2.98%
Corey Brooks (Rubio) 1,448 350 1,798 2.80%
Kevin Suggs (Kasich) 2,800 523 3,323 5.17%
Darnell B. Macklin (Carson) 302 177 479 0.75%
Michael J. Uremovich (Carson) 275 89 364 0.57%
Antonio Alonso (Trump) 8,873 809 9,682 15.07%
Michael Burke (Trump) 9,494 837 10,331 16.08%
Jean Wayner (Christie) 352 65 417 0.65%
Joann Kelly (Fiorina) 243 64 307 0.48%
Robert Russell Kijak (Christie) 317 39 356 0.55%
Christopher Hilliard (Trump) 8,726 753 9,479 14.76%
Karen Ann Hayes (Cruz) 4,816 626 5,442 8.47%
Audrey A. Tancos (Cruz) 4,415 556 4,971 7.74%
Patrick E. Rea (Bush) 268 54 322 0.50%
Kirstie Ann Brenson (Bush) 321 89 410 0.64%
Jeffrey S. Arseneau (Bush) 189 49 238 0.37%
56,857 7,381 64,238
(vote for 3)
Delegate, National Convention 1st REP - REP Cook County City of Chicago Combined Total Percentage
Nick Stella 378 378 49.15%
Tonia Khouri 229 229 29.78%
Herman B. White 162 162 21.07%
769 769
U.S. Representative, 11th District - REP Cook County City of Chicago Combined Total Percentage

59 Page 35 of 83
Danielle Marzano (Fiorina) 150 49 199 0.32%
James ''Jim'' Talbot (Fiorina) 191 36 227 0.37%
Dean A. Casper Jr. (Kasich) 3,018 544 3,562 5.77%
William S. Senf (Christie) 132 35 167 0.27%
Kathy Hilton (Rubio) 1,619 339 1,958 3.17%
Daniel Marzano (Fiorina) 138 29 167 0.27%
Diane E. Wilczak (Carson) 277 110 387 0.63%
Matthew Foldi (Rubio) 1,694 358 2,052 3.33%
David Smith (Rubio) 1,565 314 1,879 3.05%
Jeannie Young Evans (Kasich) 3,017 474 3,491 5.66%
Kevin Truitt (Carson) 405 139 544 0.88%
Katherine L. Mays (Carson) 357 147 504 0.82%
Renard Harvey (Trump) 8,801 787 9,588 15.54%
Alexandra Dumezich (Bush) 297 101 398 0.65%
Gregg Fletcher (Trump) 9,472 856 10,328 16.74%
Kelly A. Senf (Christie) 141 32 173 0.28%
Dale Charletta (Trump) 9,159 823 9,982 16.18%
Kathleen R. Rudis (Bush) 334 88 422 0.68%
Cynthia L. Gilles (Cruz) 4,358 578 4,936 8.00%
Kristen McChesney (Christie) 283 44 327 0.53%
Megan T. Jurewicz (Cruz) 4,375 533 4,908 7.96%
Timothy J. Rudis (Bush) 278 90 368 0.60%
Laura Elsner (Cruz) 4,529 596 5,125 8.31%
54,590 7,102 61,692
(vote for 3)
Alternate Delegate, Natl Conv 1st REP - REP Cook County City of Chicago Combined Total Percentage

60 Page 36 of 83
Judy A. Diekelman (Kasich) 1,789 195 1,984 5.62%
Jayne L. Raef (Kasich) 1,624 162 1,786 5.06%
Joseph W. Burgess (Kasich) 1,702 172 1,874 5.31%
Pedro Solis (Paul) 95 60 155 0.44%
Charon Bryson (Fiorina) 60 24 84 0.24%
Quintin Barton (Fiorina) 53 30 83 0.24%
George L. Pearson (Carson) 288 49 337 0.96%
Judy Ogalla (Rubio) 931 203 1,134 3.21%
Kurt Diekelman (Rubio) 919 162 1,081 3.06%
Anthony Raczek (Paul) 115 30 145 0.41%
Dezaree Oliver-Pearson (Carson) 188 28 216 0.61%
Ceasar I. Leflore (Carson) 191 50 241 0.68%
Jay Farquhar (Rubio) 890 176 1,066 3.02%
James Devors (Trump) 3,964 732 4,696 13.31%
Jeff Keast (Bush) 197 63 260 0.74%
Pleas Honeywood (Christie) 81 25 106 0.30%
Jeffrey Schimke (Christie) 143 26 169 0.48%
Douglas Hoekstra (Fiorina) 225 36 261 0.74%
Jamie Boyd (Bush) 275 76 351 0.99%
Michael Bossert (Bush) 207 46 253 0.72%
Lance L. Davis (Cruz) 2,720 393 3,113 8.82%
Taneequa Tolbert (Trump) 3,790 704 4,494 12.74%
Rita Gaus (Trump) 3,971 745 4,716 13.36%
Karen W. Sommerfield (Christie) 169 37 206 0.58%
David E. Smith (Cruz) 2,879 421 3,300 9.35%
Michael P. Hildebrand (Cruz) 2,797 379 3,176 9.00%
30,263 5,024 35,287
(vote for 3)
Delegate, National Convention 2nd REP - REP Cook County City of Chicago Combined Total Percentage
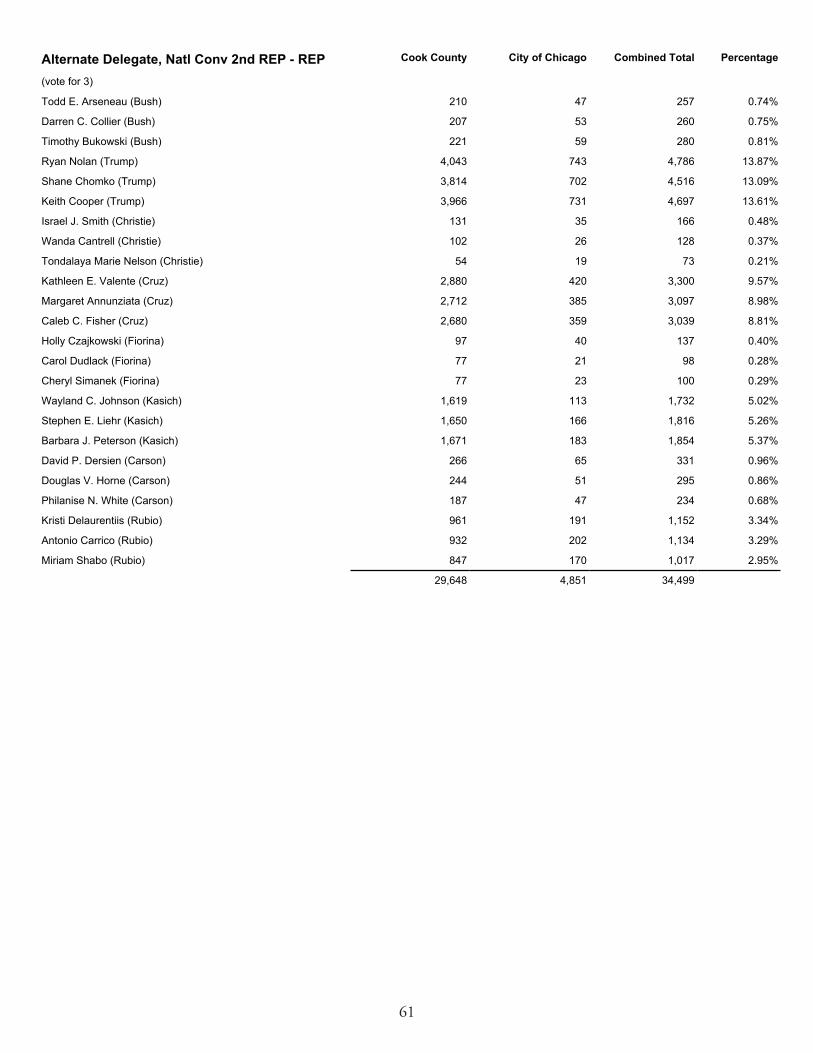
61 Page 37 of 83
Cheryl Simanek (Fiorina) 77 23 100 0.29%
Wayland C. Johnson (Kasich) 1,619 113 1,732 5.02%
Stephen E. Liehr (Kasich) 1,650 166 1,816 5.26%
Miriam Shabo (Rubio) 847 170 1,017 2.95%
Holly Czajkowski (Fiorina) 97 40 137 0.40%
Carol Dudlack (Fiorina) 77 21 98 0.28%
Philanise N. White (Carson) 187 47 234 0.68%
Kristi Delaurentiis (Rubio) 961 191 1,152 3.34%
Antonio Carrico (Rubio) 932 202 1,134 3.29%
Barbara J. Peterson (Kasich) 1,671 183 1,854 5.37%
David P. Dersien (Carson) 266 65 331 0.96%
Douglas V. Horne (Carson) 244 51 295 0.86%
Margaret Annunziata (Cruz) 2,712 385 3,097 8.98%
Timothy Bukowski (Bush) 221 59 280 0.81%
Ryan Nolan (Trump) 4,043 743 4,786 13.87%
Darren C. Collier (Bush) 207 53 260 0.75%
Caleb C. Fisher (Cruz) 2,680 359 3,039 8.81%
Todd E. Arseneau (Bush) 210 47 257 0.74%
Shane Chomko (Trump) 3,814 702 4,516 13.09%
Tondalaya Marie Nelson (Christie) 54 19 73 0.21%
Kathleen E. Valente (Cruz) 2,880 420 3,300 9.57%
Wanda Cantrell (Christie) 102 26 128 0.37%
Keith Cooper (Trump) 3,966 731 4,697 13.61%
Israel J. Smith (Christie) 131 35 166 0.48%
29,648 4,851 34,499
(vote for 3)
Alternate Delegate, Natl Conv 2nd REP - REP Cook County City of Chicago Combined Total Percentage

62 Page 38 of 83
Christine Radogno (Kasich) 7,862 1,077 8,939 6.42%
Sean M. Morrison (Kasich) 7,193 1,041 8,234 5.91%
Elizabeth Ann Gorman (Kasich) 7,336 823 8,159 5.86%
George Yukich (Rubio) 2,776 715 3,491 2.51%
Sharon Kubasak (Fiorina) 351 115 466 0.33%
Deborah ''Debbie'' Burzinski (Fiorina) 446 152 598 0.43%
John Pappas (Paul) 625 317 942 0.68%
Barbara F. Hoffman (Carson) 485 160 645 0.46%
Herb Schumann (Rubio) 3,068 772 3,840 2.76%
Michael Lapidus (Rubio) 2,977 755 3,732 2.68%
Dan Mitchell (Paul) 285 129 414 0.30%
Harry W. Oryhon (Carson) 328 129 457 0.33%
Mark S. Zajac (Carson) 598 227 825 0.59%
Ian Brenson (Bush) 311 99 410 0.29%
Nancy Ann Powell-Hayes (Cruz) 7,860 1,493 9,353 6.71%
Thomas Beller (Christie) 316 96 412 0.30%
Patrick Hackett (Christie) 364 124 488 0.35%
Salvador ''Tony'' Godinez (Fiorina) 245 150 395 0.28%
Stephen J. Balich (Cruz) 8,254 1,973 10,227 7.34%
Jerry Randick (Cruz) 8,080 1,862 9,942 7.14%
Bob Anderson (Trump) 16,696 4,405 21,101 15.15%
Colleen Grant Schumann (Bush) 539 124 663 0.48%
Scott McPherson (Bush) 478 186 664 0.48%
Kathryn Meyer (Christie) 493 149 642 0.46%
John Lynch (Trump) 17,685 4,726 22,411 16.09%
Cynthia Schaffer (Trump) 17,314 4,562 21,876 15.70%
112,965 26,361 139,326
(vote for 3)
Delegate, National Convention 3rd REP - REP Cook County City of Chicago Combined Total Percentage

63 Page 39 of 83
Jeffrey ''Jeff'' Baker (Fiorina) 217 78 295 0.22%
James J. Parrilli (Kasich) 7,006 994 8,000 5.94%
Andrew J. Kirchoff (Kasich) 7,249 1,016 8,265 6.13%
Gael Heppner (Carson) 354 118 472 0.35%
Ronald Armstrong (Fiorina) 231 72 303 0.22%
Richard ''Dick'' Halm (Fiorina) 203 45 248 0.18%
Tyler Mikan (Rubio) 2,783 681 3,464 2.57%
John D. Brannen (Carson) 560 182 742 0.55%
John D'Alessandro (Carson) 479 162 641 0.48%
William J. Corley (Kasich) 6,901 927 7,828 5.81%
Steven Daglas (Rubio) 2,954 759 3,713 2.75%
Katie Justak (Rubio) 3,235 850 4,085 3.03%
Madelyn D. Flaherty (Cruz) 7,867 1,870 9,737 7.22%
Ben Noble (Bush) 539 192 731 0.54%
Kimberly Blackburn (Christie) 496 119 615 0.46%
George Offord (Bush) 532 168 700 0.52%
Alaa N. Sweis (Cruz) 7,032 1,585 8,617 6.39%
G. Joel Baise (Bush) 466 150 616 0.46%
Louis G. Rexing (Christie) 229 88 317 0.24%
Nena Mihailovic (Trump) 16,753 4,490 21,243 15.76%
Vivienne Porter (Cruz) 7,731 1,817 9,548 7.08%
Geraldine Brady (Trump) 17,579 4,668 22,247 16.51%
Matthew Moustakas (Christie) 409 91 500 0.37%
Vince Matonis (Trump) 17,267 4,583 21,850 16.21%
109,072 25,705 134,777
(vote for 3)
Alternate Delegate, Natl Conv 3rd REP - REP Cook County City of Chicago Combined Total Percentage

64 Page 40 of 83
Michael C. Dropka (Kasich) 1,540 1,147 2,687 5.81%
Jesus Reyes Jr. (Kasich) 1,482 1,183 2,665 5.77%
Thomas A. Volini (Kasich) 1,441 1,071 2,512 5.44%
Carlos Estrada (Paul) 87 210 297 0.64%
Michael Houlihan (Fiorina) 95 92 187 0.40%
James Kales (Fiorina) 49 55 104 0.23%
Maria C. Moreno (Rubio) 985 1,176 2,161 4.68%
Dieter O. Bardy (Carson) 97 93 190 0.41%
Citlally Mancilla (Carson) 88 103 191 0.41%
Todd Peterson (Paul) 115 176 291 0.63%
Lionel Garcia (Rubio) 853 981 1,834 3.97%
Danielle Vlcek (Rubio) 791 850 1,641 3.55%
Jennifer E. Bardy (Carson) 163 182 345 0.75%
Ramiro Gonzalez (Bush) 189 346 535 1.16%
Allison Ashby (Cruz) 1,947 1,822 3,769 8.16%
Amy Hopcian (Christie) 124 112 236 0.51%
Matthew Hickey (Christie) 132 131 263 0.57%
Anna Igoe (Fiorina) 119 90 209 0.45%
Robert V. Boharic (Cruz) 2,022 1,789 3,811 8.25%
Ebelio Paul Fuentes (Cruz) 1,915 1,915 3,830 8.29%
Rolando Arellano (Trump) 3,118 2,501 5,619 12.16%
Maureen Lydon (Bush) 181 203 384 0.83%
Walter Zarnecki (Bush) 159 325 484 1.05%
Randy Kantner (Christie) 128 77 205 0.44%
Kevin Jayne (Trump) 3,335 2,663 5,998 12.98%
Eric Sawchuk (Trump) 3,256 2,508 5,764 12.47%
24,411 21,801 46,212
(vote for 3)
Delegate, National Convention 4th REP - REP Cook County City of Chicago Combined Total Percentage

65 Page 41 of 83
Helen Manson (Fiorina) 88 116 204 0.46%
Susan Chmelik (Fiorina) 92 116 208 0.47%
Timothy W. Heilenbach (Kasich) 1,394 733 2,127 4.77%
Louis J. Rodriguez (Bush) 180 340 520 1.17%
Welson Cesar (Carson) 121 143 264 0.59%
Richard Beierwaltes (Fiorina) 72 61 133 0.30%
Tom Tomschin (Rubio) 902 915 1,817 4.08%
Daniela Garcia (Rubio) 844 1,098 1,942 4.36%
Alejandrino Diaz Jr. (Carson) 161 192 353 0.79%
Vera A. Wilt (Kasich) 1,456 1,143 2,599 5.83%
Ann Melichar (Kasich) 1,440 1,164 2,604 5.84%
Karen Pulia (Rubio) 865 1,059 1,924 4.32%
Michael S. Toleman (Cruz) 1,852 1,706 3,558 7.98%
Justin Krope (Trump) 3,208 2,553 5,761 12.93%
Steven J. Jedd (Cruz) 1,917 1,816 3,733 8.38%
Joseph Urani (Bush) 112 185 297 0.67%
Guadalupe Jose Flores (Cruz) 1,935 1,838 3,773 8.47%
Diana Jayne (Trump) 3,286 2,673 5,959 13.37%
Gerard M. Kraus (Christie) 95 102 197 0.44%
Jesus E. Solorio (Bush) 171 301 472 1.06%
Carol Kissane (Christie) 123 108 231 0.52%
Richard Sawchuk (Trump) 3,179 2,522 5,701 12.79%
Glen Samson (Christie) 91 96 187 0.42%
23,584 20,980 44,564
(vote for 3)
Alternate Delegate, Natl Conv 4th REP - REP Cook County City of Chicago Combined Total Percentage

66 Page 42 of 83
Dale E. Kleber (Kasich) 1,599 9,190 10,789 9.21%
Kayleen M. Carlson (Kasich) 1,644 9,416 11,060 9.45%
Christopher Grozev (Rubio) 805 3,543 4,348 3.71%
Daniel J. Cronin (Kasich) 1,772 9,899 11,671 9.97%
Allen Carter (Fiorina) 99 238 337 0.29%
Robert J. Mowry (Carson) 87 274 361 0.31%
Michael Golde (Fiorina) 75 169 244 0.21%
Ruben Chaljub (Paul) 81 258 339 0.29%
Christian C. Schultz (Carson) 119 248 367 0.31%
Walter L. Crowley (Carson) 96 390 486 0.42%
James Babiarz (Paul) 177 495 672 0.57%
A. Christine Svenson (Rubio) 812 2,849 3,661 3.13%
Mark Cavers (Rubio) 770 3,570 4,340 3.71%
Scott Davis (Paul) 118 495 613 0.52%
Robert O'Malley (Christie) 346 1,014 1,360 1.16%
Chris Cleveland (Cruz) 1,912 5,324 7,236 6.18%
Sean O'Leary (Cruz) 2,055 5,777 7,832 6.69%
Mary Carter (Fiorina) 137 361 498 0.43%
Lauren Baker (Christie) 251 557 808 0.69%
Christopher M. Adams (Christie) 165 282 447 0.38%
James Strzalka (Cruz) 1,960 5,276 7,236 6.18%
Kathleen Goro (Trump) 4,384 9,180 13,564 11.58%
Lori Gayne (Trump) 4,210 8,934 13,144 11.23%
Mark Fratella (Trump) 4,389 9,220 13,609 11.62%
John M. Dorgan (Bush) 273 611 884 0.75%
Chris Nybo (Bush) 182 422 604 0.52%
R. Stratford Shields (Bush) 156 429 585 0.50%
28,674 88,421 117,095
(vote for 3)
Delegate, National Convention 5th REP - REP Cook County City of Chicago Combined Total Percentage

67 Page 43 of 83
Ryan P. McNicholas (Kasich) 1,653 7,377 9,030 8.07%
Paul A. Laliberte (Kasich) 1,573 9,260 10,833 9.68%
Richard J. Veenstra (Kasich) 1,509 8,864 10,373 9.27%
William C. Beck (Rubio) 713 3,287 4,000 3.58%
Lucinda ''Cindy'' Burke (Fiorina) 106 310 416 0.37%
Robert Bedell (Fiorina) 60 190 250 0.22%
Jonathon H. Luers (Carson) 112 467 579 0.52%
Earon Shaw Rein (Paul) 88 384 472 0.42%
Sean T. Noonan (Rubio) 809 3,925 4,734 4.23%
Laura Mary Kotelman (Rubio) 774 2,989 3,763 3.36%
Evan Jane Ellman (Carson) 108 298 406 0.36%
Laura M. Urbik Kern (Carson) 124 249 373 0.33%
Sophia Babiarz (Paul) 175 652 827 0.74%
Alexander Doberstein (Christie) 93 187 280 0.25%
Brad Messervey (Cruz) 1,805 5,134 6,939 6.20%
James Ignatowski (Trump) 4,338 9,154 13,492 12.06%
Steve Bayne (Trump) 4,255 9,240 13,495 12.06%
Scott Newhall (Fiorina) 68 216 284 0.25%
Phyllis Demarco (Cruz) 1,907 5,315 7,222 6.46%
Sara Marie Lamantia (Cruz) 1,895 5,397 7,292 6.52%
Ron Gidwitz (Bush) 183 542 725 0.65%
Heather E. Way Kitzes (Christie) 104 228 332 0.30%
Ashvin Lad (Christie) 84 281 365 0.33%
Cathryn Biga (Trump) 4,132 8,901 13,033 11.65%
Angelo ''Skip'' Saviano (Bush) 791 593 1,384 1.24%
Amy S. Findlay (Bush) 204 756 960 0.86%
27,663 84,196 111,859
(vote for 3)
Alternate Delegate, Natl Conv 5th REP - REP Cook County City of Chicago Combined Total Percentage

68 Page 44 of 83
Thomas Kurt Jaros (Paul) 77 77 0.18%
Robert McNeily (Paul) 96 96 0.22%
Aaron B. Del Mar (Kasich) 4,660 4,660 10.75%
Adam Schuster (Paul) 107 107 0.25%
Robert N. Tiballi (Carson) 108 108 0.25%
Harry ''Randy'' Ramey (Fiorina) 74 74 0.17%
Gary Saake (Fiorina) 59 59 0.14%
Dan Duffy (Rubio) 1,432 1,432 3.30%
Donna R. Johnson (Carson) 174 174 0.40%
Evelyn C. Stamoolis (Carson) 124 124 0.29%
Bob Grogan (Rubio) 1,314 1,314 3.03%
Ronald L. Sandack (Kasich) 4,603 4,603 10.62%
Patrick M. Brady (Kasich) 4,700 4,700 10.85%
Michael G. Connelly (Rubio) 1,448 1,448 3.34%
Tom Koppie (Santorum) 44 44 0.10%
Stephen L. Davis (Bush) 168 168 0.39%
Michael J. Miller (Cruz) 3,273 3,273 7.55%
Doug Scheflow (Cruz) 3,073 3,073 7.09%
Daniel Brinkman (Fiorina) 88 88 0.20%
Karen S. McConnaughay (Bush) 263 263 0.61%
Kirk W. Dillard (Bush) 419 419 0.97%
Jeanne Yeagley (Cruz) 3,068 3,068 7.08%
Gregory Olson (Christie) 121 121 0.28%
David Nash (Christie) 102 102 0.24%
Eileen Dishong (Christie) 85 85 0.20%
Paul Minch (Trump) 4,732 4,732 10.92%
Barbara Kois (Trump) 4,665 4,665 10.77%
Nabi Fakroddin (Trump) 4,252 4,252 9.81%
43,329 43,329
(vote for 3)
Delegate, National Convention 6th REP - REP Cook County City of Chicago Combined Total Percentage
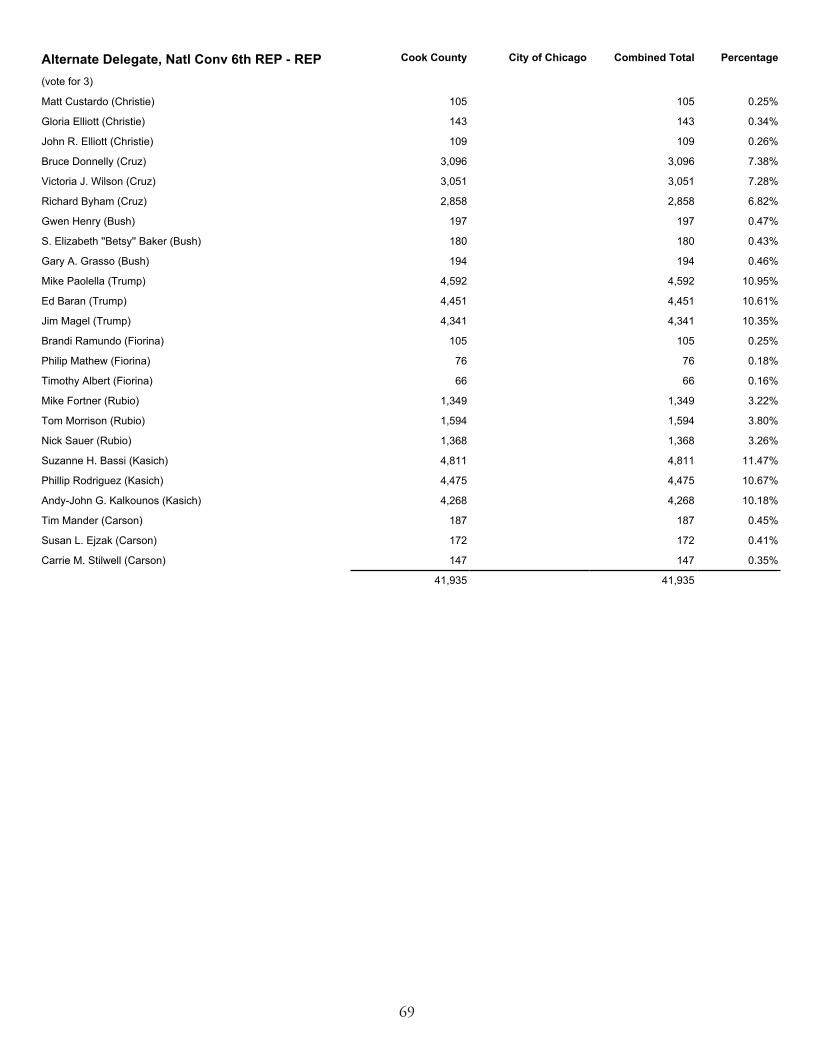
69 Page 45 of 83
Timothy Albert (Fiorina) 66 66 0.16%
Mike Fortner (Rubio) 1,349 1,349 3.22%
Tom Morrison (Rubio) 1,594 1,594 3.80%
Carrie M. Stilwell (Carson) 147 147 0.35%
Brandi Ramundo (Fiorina) 105 105 0.25%
Philip Mathew (Fiorina) 76 76 0.18%
Andy-John G. Kalkounos (Kasich) 4,268 4,268 10.18%
Tim Mander (Carson) 187 187 0.45%
Susan L. Ejzak (Carson) 172 172 0.41%
Nick Sauer (Rubio) 1,368 1,368 3.26%
Suzanne H. Bassi (Kasich) 4,811 4,811 11.47%
Phillip Rodriguez (Kasich) 4,475 4,475 10.67%
Ed Baran (Trump) 4,451 4,451 10.61%
John R. Elliott (Christie) 109 109 0.26%
Bruce Donnelly (Cruz) 3,096 3,096 7.38%
Gloria Elliott (Christie) 143 143 0.34%
Jim Magel (Trump) 4,341 4,341 10.35%
Matt Custardo (Christie) 105 105 0.25%
Victoria J. Wilson (Cruz) 3,051 3,051 7.28%
Gary A. Grasso (Bush) 194 194 0.46%
Mike Paolella (Trump) 4,592 4,592 10.95%
S. Elizabeth ''Betsy'' Baker (Bush) 180 180 0.43%
Richard Byham (Cruz) 2,858 2,858 6.82%
Gwen Henry (Bush) 197 197 0.47%
41,935 41,935
(vote for 3)
Alternate Delegate, Natl Conv 6th REP - REP Cook County City of Chicago Combined Total Percentage

70 Page 46 of 83
Nancy J. Kimme (Kasich) 1,973 5,147 7,120 11.94%
William Dean Smithburg (Kasich) 1,943 4,195 6,138 10.29%
Kreg T. Allison (Kasich) 1,863 4,793 6,656 11.16%
Kathryn ''Kayte'' Malik (Fiorina) 77 141 218 0.37%
Carl Segvich (Santorum) 49 108 157 0.26%
Brendan Seyring (Rubio) 688 1,694 2,382 3.99%
Jeff Halm (Fiorina) 42 104 146 0.24%
Alberta Grossi-Antweiler (Paul) 69 99 168 0.28%
Eloise Gerson (Rubio) 810 2,073 2,883 4.83%
Michael Rolfes (Rubio) 773 1,880 2,653 4.45%
Grace Austin (Paul) 86 203 289 0.48%
Amanda B. Dechavez (Carson) 112 163 275 0.46%
Thomas Edward McDonough (Carson) 74 185 259 0.43%
Bruce John Schulte (Carson) 92 131 223 0.37%
Kathleen A. Thomas (Bush) 139 344 483 0.81%
Lora Drobetsky (Trump) 1,793 3,965 5,758 9.66%
Steve Trimble (Trump) 1,808 3,994 5,802 9.73%
Corinne Williams (Fiorina) 69 212 281 0.47%
Carol Smith Donovan (Bush) 136 370 506 0.85%
Brian Timpone (Bush) 123 277 400 0.67%
John Simpson (Trump) 1,733 3,820 5,553 9.31%
James Francis Zangrilli (Cruz) 1,465 1,543 3,008 5.04%
Kerrie Reed (Cruz) 1,559 2,361 3,920 6.57%
Joshua Hammer (Cruz) 1,455 2,221 3,676 6.16%
Laura Lewandowski (Christie) 104 200 304 0.51%
Stephanie Guyett (Christie) 51 171 222 0.37%
Douglas Guyett (Christie) 45 112 157 0.26%
19,131 40,506 59,637
(vote for 3)
Delegate, National Convention 7th REP - REP Cook County City of Chicago Combined Total Percentage

71 Page 47 of 83
Joseph ''Joe'' Dusek (Fiorina) 50 105 155 0.27%
Darlene Brown (Carson) 109 228 337 0.58%
Adrian J. Wright (Carson) 112 211 323 0.56%
Ellen Wesley (Kasich) 1,878 4,693 6,571 11.33%
Jeffrey ''Jeff'' Durkes (Fiorina) 46 96 142 0.24%
Jennifer Koerner (Fiorina) 65 209 274 0.47%
Eric Pulia (Rubio) 719 1,715 2,434 4.20%
Helene Marie Cissell (Kasich) 1,960 4,046 6,006 10.35%
Bruno H. Behrend (Kasich) 1,897 4,739 6,636 11.44%
Yvonne Franklin (Carson) 95 193 288 0.50%
Erin Broderick (Rubio) 811 1,980 2,791 4.81%
Thomas C. Cronin (Rubio) 777 1,829 2,606 4.49%
Matthew Limbert (Cruz) 1,452 2,212 3,664 6.32%
Daniel Conidi (Trump) 1,812 3,841 5,653 9.75%
Evan Andrew Feigenbaum (Bush) 68 156 224 0.39%
Janet Tavakoli (Trump) 1,837 3,950 5,787 9.98%
Wayne Heusel (Cruz) 1,341 1,964 3,305 5.70%
Aaron Brager (Trump) 1,800 3,899 5,699 9.83%
Gregory J. Hart (Bush) 116 365 481 0.83%
William J. Zeiler (Christie) 51 111 162 0.28%
Michael Provenzano (Cruz) 1,478 2,223 3,701 6.38%
William S. Zeiler (Christie) 59 151 210 0.36%
Mark S. Hosty (Bush) 126 265 391 0.67%
Suneet Lad (Christie) 45 116 161 0.28%
18,704 39,297 58,001
(vote for 3)
Alternate Delegate, Natl Conv 7th REP - REP Cook County City of Chicago Combined Total Percentage

72 Page 48 of 83
Darlene J. Ruscitti (Rubio) 2,687 2,687 3.13%
Michael Adelizzi (Rubio) 2,611 2,611 3.05%
Lee A. Trejo (Rubio) 2,418 2,418 2.82%
Mark Hoyert (Fiorina) 128 128 0.15%
Daniel J. Bronson (Santorum) 77 77 0.09%
Sharon L. Langlotz-Johnson (Kasich) 5,145 5,145 6.00%
Sandy Wegman (Fiorina) 229 229 0.27%
Margaret Miller (Paul) 306 306 0.36%
Michael J. Lundgren (Carson) 370 370 0.43%
James F. Moynihan (Kasich) 6,348 6,348 7.41%
Kollin C. Kozlowski (Kasich) 6,133 6,133 7.16%
Jonathon F. Dagen (Carson) 278 278 0.32%
Leonard Mason (Paul) 191 191 0.22%
Alvina Fatima (Paul) 172 172 0.20%
William F. Christian (Carson) 423 423 0.49%
Anthony Iosco (Trump) 11,443 11,443 13.35%
George Kas (Trump) 11,401 11,401 13.30%
Julie Donovan (Trump) 11,712 11,712 13.66%
Laura Fitzpatrick (Bush) 738 738 0.86%
Jillian Bernas (Fiorina) 293 293 0.34%
Paul B. Hinds (Bush) 423 423 0.49%
Rodney S. Craig (Bush) 527 527 0.61%
Robert Tulo (Christie) 174 174 0.20%
Dennis M. Reboletti (Christie) 159 159 0.19%
David J. Rickert (Santorum) 124 124 0.14%
Matthew Voss (Christie) 261 261 0.30%
C. Steven Tucker (Cruz) 7,229 7,229 8.43%
Brian Medley (Cruz) 7,063 7,063 8.24%
Jason W. Dusenberry (Cruz) 6,653 6,653 7.76%
85,716 85,716
(vote for 3)
Delegate, National Convention 8th REP - REP Cook County City of Chicago Combined Total Percentage

73 Page 49 of 83
William ''Bill'' Rogala (Fiorina) 168 168 0.20%
Laura S. Santowski (Carson) 513 513 0.62%
Lorretta D. Lucia (Carson) 399 399 0.48%
Mark Cramer (Kasich) 5,850 5,850 7.02%
Meghan Gray (Fiorina) 276 276 0.33%
Ronnie Cruz (Fiorina) 179 179 0.21%
Michael Hovde, Jr. (Rubio) 2,364 2,364 2.84%
John W. Valle (Kasich) 5,954 5,954 7.14%
Thomas James Kaider (Kasich) 5,933 5,933 7.12%
Maureen A. Cairns (Carson) 383 383 0.46%
Thomas Rooney (Rubio) 2,669 2,669 3.20%
Theresa ''Terry'' Seyring (Rubio) 2,584 2,584 3.10%
Jacqueline Menconi (Trump) 11,221 11,221 13.46%
Mary Bonatz (Cruz) 6,867 6,867 8.24%
Konstantinos Leventis (Christie) 198 198 0.24%
James Economos (Cruz) 6,935 6,935 8.32%
Suzanne Amato (Trump) 10,967 10,967 13.16%
Shelley Grafmyre (Cruz) 6,855 6,855 8.23%
Wayne Kolweier (Christie) 239 239 0.29%
Lori Solyom (Bush) 355 355 0.43%
Brad Schonder (Trump) 11,376 11,376 13.65%
Lauren Shiliga (Bush) 390 390 0.47%
Anastasios Triantafillos (Christie) 192 192 0.23%
Matthew Pike (Bush) 473 473 0.57%
83,340 83,340
(vote for 3)
Alternate Delegate, Natl Conv 8th REP - REP Cook County City of Chicago Combined Total Percentage

74 Page 50 of 83
John A. Tsarpalas (Carson) 502 140 642 0.36%
James D. Skyles (Carson) 460 151 611 0.34%
Jetta H. Boschen (Carson) 348 107 455 0.26%
Judy Ortega (Fiorina) 240 110 350 0.20%
Kevin O'Connell (Rubio) 5,013 1,259 6,272 3.53%
Stephen Cowen (Fiorina) 216 78 294 0.17%
Jennifer Cowen (Fiorina) 289 105 394 0.22%
Justin Eugene Kuehlthau (Paul) 288 64 352 0.20%
Pamela Kinsey Lungmus (Kasich) 15,989 1,664 17,653 9.93%
Marc Levine (Rubio) 5,394 1,511 6,905 3.88%
Susan Kelly Sweeney (Rubio) 5,344 1,105 6,449 3.63%
Brian Moran (Kasich) 16,836 2,191 19,027 10.70%
Michael Hager (Paul) 389 169 558 0.31%
Jim O'Donnell (Paul) 553 230 783 0.44%
David C. Harris (Kasich) 17,134 2,305 19,439 10.93%
Jeannine M. Como (Santorum) 222 80 302 0.17%
J. Blair Garber (Cruz) 9,811 2,267 12,078 6.79%
Jeffrey Stewart Shapiro (Cruz) 9,881 2,072 11,953 6.72%
Jill Dolan (Cruz) 9,916 2,314 12,230 6.88%
Katherine Dold White (Bush) 1,224 312 1,536 0.86%
Mark R. Albers (Santorum) 171 65 236 0.13%
Tyrone Fahner (Bush) 875 280 1,155 0.65%
Muneer Ahmad Satter (Bush) 602 149 751 0.42%
Laura Vandenbroucke (Christie) 321 89 410 0.23%
James R. Selegean (Christie) 256 71 327 0.18%
Penny Pullen (Santorum) 305 76 381 0.21%
Gary Vandenbroucke (Christie) 304 82 386 0.22%
Nickolas Neubauer (Trump) 14,978 3,786 18,764 10.55%
Linda Lucchese (Trump) 15,084 3,783 18,867 10.61%
Ryan McElrath (Trump) 14,632 3,666 18,298 10.29%
147,577 30,281 177,858
(vote for 3)
Delegate, National Convention 9th REP - REP Cook County City of Chicago Combined Total Percentage

75 Page 51 of 83
Diane Shapiro (Fiorina) 396 168 564 0.33%
Thomas Schild (Carson) 430 130 560 0.33%
Vivian L. Davros (Carson) 503 153 656 0.38%
Suzanne Devane (Fiorina) 322 96 418 0.24%
Angela M. Como (Santorum) 229 84 313 0.18%
Christopher Provenzano (Rubio) 4,859 1,152 6,011 3.51%
Carlos Ortega (Fiorina) 214 105 319 0.19%
Jeffrey J. Ross (Carson) 545 141 686 0.40%
Josh Gasbarra (Paul) 382 142 524 0.31%
Char Foss-Eggemann (Rubio) 5,041 1,032 6,073 3.55%
Douglas Gessner (Rubio) 5,156 1,382 6,538 3.82%
Alexander Paul Bisenius (Paul) 495 125 620 0.36%
John C. Demler (Kasich) 16,027 2,132 18,159 10.61%
Carol A. Teschky (Kasich) 16,519 2,178 18,697 10.93%
Gregory J. Lungmus (Kasich) 15,703 1,593 17,296 10.11%
Sandra Hodel-Runtz (Christie) 355 119 474 0.28%
Mark Crane (Christie) 455 178 633 0.37%
Joseph Tamraz (Christie) 375 154 529 0.31%
Shprintza Spak (Cruz) 9,107 2,211 11,318 6.62%
Steven Polit (Santorum) 101 50 151 0.09%
Jasmine Velasco Hauser (Cruz) 9,578 2,049 11,627 6.80%
Joel B. Streightiff, Jr. (Cruz) 9,626 2,252 11,878 6.94%
Adam M. Robinson (Bush) 548 195 743 0.43%
Mary Childers (Bush) 804 213 1,017 0.59%
Joseph R. Hedrick (Santorum) 161 46 207 0.12%
Daniel B. Peterson (Bush) 743 248 991 0.58%
Nester Komolafe (Trump) 14,233 3,627 17,860 10.44%
Gerald DeNotto (Trump) 14,778 3,807 18,585 10.86%
Frank Bigga III (Trump) 14,085 3,539 17,624 10.30%
141,770 29,301 171,071
(vote for 3)
Alternate Delegate, Natl Conv 9th REP - REP Cook County City of Chicago Combined Total Percentage

76 Page 52 of 83
Mark W. Peterson (Kasich) 4,291 4,291 10.40%
Peter T. Amerantos (Kasich) 4,067 4,067 9.86%
Daniel J. Donahue (Carson) 215 215 0.52%
Edwin O. Sullivan (Kasich) 4,340 4,340 10.52%
David Ross (Fiorina) 238 238 0.58%
Sheri Jesiel (Rubio) 1,426 1,426 3.46%
Dale Miller (Fiorina) 109 109 0.26%
Jim Moran (Paul) 110 110 0.27%
Sanford E. Perl (Rubio) 1,680 1,680 4.07%
Mark C. Curran, Jr. (Rubio) 1,678 1,678 4.07%
Adam Sachs (Paul) 113 113 0.27%
Linda J. Murbach (Carson) 158 158 0.38%
Lisa M. Roti (Carson) 129 129 0.31%
Carl Arriaza (Paul) 106 106 0.26%
Eugene Cummings (Trump) 5,036 5,036 12.20%
Mari Carlson (Trump) 5,038 5,038 12.21%
Bob Bednar (Trump) 4,926 4,926 11.94%
Linda Chi-Ross (Fiorina) 185 185 0.45%
Gary Stittgen (Cruz) 3,188 3,188 7.73%
Dan Sugrue (Cruz) 3,099 3,099 7.51%
Aaron L. Lawlor (Bush) 252 252 0.61%
James R. Curtis (Christie) 127 127 0.31%
Jane V. Curtis (Christie) 92 92 0.22%
Phil Collins (Gilmore) 71 71 0.17%
Alexander D. Stuart (Bush) 237 237 0.57%
Reeve B. Waud (Bush) 132 132 0.32%
Joseph Mislinski (Christie) 221 221 0.54%
41,264 41,264
(vote for 3)
Delegate, National Convention 10th REP - REP Cook County City of Chicago Combined Total Percentage

77 Page 53 of 83
Edward Wormser (Fiorina) 86 86 0.21%
Antonietta Simonian (Rubio) 1,400 1,400 3.41%
Jonathan L. Greenberg (Rubio) 1,483 1,483 3.61%
John F. Bickmore, Jr. (Kasich) 3,842 3,842 9.36%
Paul Keeler (Fiorina) 100 100 0.24%
Linda Dahl (Fiorina) 145 145 0.35%
Paul Snyder (Carson) 162 162 0.39%
Joseph J. Wilson (Kasich) 4,121 4,121 10.04%
Earl Bruce Hansen (Kasich) 3,978 3,978 9.70%
Joseph V. ''Joe'' Vito (Rubio) 1,397 1,397 3.40%
Michelle N. Parnell (Carson) 179 179 0.44%
Jeremiah D. O'Connor (Carson) 146 146 0.36%
Bradley Wulfsohn (Cruz) 2,798 2,798 6.82%
Bob Crawford (Bush) 293 293 0.71%
Bryan Brim (Trump) 4,985 4,985 12.15%
Lawrence W. Falbe (Bush) 203 203 0.49%
John J. Anderson (Cruz) 2,840 2,840 6.92%
Louis G. Atsaves (Bush) 236 236 0.58%
Terry Good (Trump) 4,999 4,999 12.18%
Catherine McBreen (Christie) 135 135 0.33%
Hilary F. Till (Cruz) 2,666 2,666 6.50%
Charles E. Cruise Jr. (Christie) 98 98 0.24%
Sean Gay (Trump) 4,640 4,640 11.31%
Flint Grinnell III (Christie) 98 98 0.24%
41,030 41,030
(vote for 3)
Alternate Delegate, Natl Conv 10th REP - REP Cook County City of Chicago Combined Total Percentage

78 Page 54 of 83
William M. Mayer (Kasich) 216 216 8.28%
John D. Noak (Kasich) 210 210 8.05%
Matthew Charles Starr (Kasich) 206 206 7.90%
Karen J. Pritchard (Carson) 15 15 0.57%
Jeff Clark (Fiorina) 2 2 0.08%
Paul Santucci (Fiorina) 7 7 0.27%
Thomas Hummel (Paul) 4 4 0.15%
Eduardo Fernandez (Rubio) 72 72 2.76%
Mark Johnson (Carson) 8 8 0.31%
Dragan Jovanovic (Carson) 10 10 0.38%
Jeffrey Moore (Paul) 8 8 0.31%
Kevin Michael Coyne (Rubio) 84 84 3.22%
Kathleen A. Abbate (Rubio) 81 81 3.10%
Roger C. Claar (Bush) 10 10 0.38%
James Norris (Cruz) 192 192 7.36%
Annette Kallevik (Christie) 8 8 0.31%
Marlene Diedrick (Christie) 9 9 0.34%
Christian Smith (Huckabee) 7 7 0.27%
Yvonne L. Bolton (Cruz) 203 203 7.78%
Steven J. Orlando (Cruz) 194 194 7.44%
Laura Kochan (Trump) 339 339 12.99%
Robert J. Schillerstrom (Bush) 16 16 0.61%
Jay Bergman (Bush) 8 8 0.31%
George Diedrick (Christie) 5 5 0.19%
Jack McInerney (Trump) 350 350 13.42%
Anthony Anderson (Trump) 345 345 13.22%
2,609 2,609
(vote for 3)
Delegate, National Convention 11th REP - REP Cook County City of Chicago Combined Total Percentage

79 Page 55 of 83
No Candidate 0 0 0 0.00%
0 0 0
State Senator, 4th District 4yr - REP Cook County City of Chicago Combined Total Percentage
Nancy Stefanski (Fiorina) 10 10 0.40%
James A. Brocato (Carson) 12 12 0.48%
Mary Ann F. Vincent (Carson) 15 15 0.59%
David M. Shiffer (Kasich) 200 200 7.93%
Charles Bolwin (Fiorina) 6 6 0.24%
John Schutzius (Fiorina) 4 4 0.16%
Rachel Ossyra (Rubio) 69 69 2.73%
Natale Garofalo (Kasich) 216 216 8.56%
John Gardner Huff (Kasich) 208 208 8.24%
Lee A. Forseth (Carson) 10 10 0.40%
Janice Marie Anderson (Rubio) 74 74 2.93%
Michael J. Loftus (Rubio) 74 74 2.93%
Jackie Kurtz (Trump) 338 338 13.40%
Sheldon L. Watts (Bush) 8 8 0.32%
Raquel Mitchell (Cruz) 185 185 7.33%
John Aguilar (Bush) 11 11 0.44%
Joshua McGinnis (Trump) 330 330 13.08%
Gregory W. Baise (Bush) 12 12 0.48%
Edward R. Theobald (Cruz) 189 189 7.49%
Grace Baldacci (Christie) 9 9 0.36%
Riley Tagtmeyer (Trump) 339 339 13.44%
Steven Kallevik (Christie) 5 5 0.20%
Willard Hemsworth (Cruz) 187 187 7.41%
Jonathan Piazza (Christie) 12 12 0.48%
2,523 2,523
(vote for 3)
Alternate Delegate, Natl Conv 11th REP - REP Cook County City of Chicago Combined Total Percentage
No Candidate 0 0 0 0.00%
0 0 0
State Senator, 1st District 4yr - REP Cook County City of Chicago Combined Total Percentage
No Candidate 0 0 0 0.00%
0 0 0
State Senator, 2nd District 2yr - REP Cook County City of Chicago Combined Total Percentage

80 Page 56 of 83
No Candidate 0 0 0 0.00%
0 0 0
State Senator, 14th District 2yr - REP Cook County City of Chicago Combined Total Percentage
No Candidate 0 0 0.00%
0 0
State Senator, 13th District 4yr - REP Cook County City of Chicago Combined Total Percentage
No Candidate 0 0 0 0.00%
0 0 0
State Senator, 16th District 4yr - REP Cook County City of Chicago Combined Total Percentage
No Candidate 0 0 0 0.00%
0 0 0
State Senator, 11th District 2yr - REP Cook County City of Chicago Combined Total Percentage
No Candidate 0 0 0 0.00%
0 0 0
State Senator, 7th District 4yr - REP Cook County City of Chicago Combined Total Percentage
No Candidate 0 0 0.00%
0 0
State Senator, 5th District 2yr - REP Cook County City of Chicago Combined Total Percentage
No Candidate 0 0 0 0.00%
0 0 0
State Senator, 10th District 4yr - REP Cook County City of Chicago Combined Total Percentage
No Candidate 0 0 0 0.00%
0 0 0
State Senator, 8th District 2yr - REP Cook County City of Chicago Combined Total Percentage

81 Page 57 of 83
Martin McLaughlin 1,382 1,382 49.91%
Dan McConchie 737 737 26.62%
Casey Urlacher 650 650 23.47%
2,769 2,769
State Senator, 26th District 2yr - REP Cook County City of Chicago Combined Total Percentage
Jim Oberweis 592 592 100.00%
592 592
State Senator, 25th District 4yr - REP Cook County City of Chicago Combined Total Percentage
Mel Thillens 15,670 115 15,785 100.00%
15,670 115 15,785
State Senator, 28th District 4yr - REP Cook County City of Chicago Combined Total Percentage
Seth Lewis 825 825 100.00%
825 825
State Senator, 23rd District 2yr - REP Cook County City of Chicago Combined Total Percentage
No Candidate 0 0 0.00%
0 0
State Senator, 19th District 4yr - REP Cook County City of Chicago Combined Total Percentage
No Candidate 0 0 0 0.00%
Write-In 152 76 228 100.00%
152 76 228
State Senator, 17th District 2yr - REP Cook County City of Chicago Combined Total Percentage
No Candidate 0 0 0.00%
Write-In 550 550 100.00%
550 550
State Senator, 22nd District 4yr - REP Cook County City of Chicago Combined Total Percentage
No Candidate 0 0 0.00%
0 0
State Senator, 20th District 2yr - REP Cook County City of Chicago Combined Total Percentage

82 Page 58 of 83
No Candidate 0 0 0.00%
0 0
State Representative, 4th District - REP Cook County City of Chicago Combined Total Percentage
No Candidate 0 0 0 0.00%
0 0 0
State Representative, 3rd District - REP Cook County City of Chicago Combined Total Percentage
No Candidate 0 0 0.00%
Write-In 252 252 100.00%
252 252
State Representative, 5th District - REP Cook County City of Chicago Combined Total Percentage
No Candidate 0 0 0.00%
0 0
State Representative, 2nd District - REP Cook County City of Chicago Combined Total Percentage
No Candidate 0 0 0.00%
0 0
State Senator, 40th District 4yr - REP Cook County City of Chicago Combined Total Percentage
Benjamin Salzberg 7,636 7,636 100.00%
7,636 7,636
State Senator, 29th District 2yr - REP Cook County City of Chicago Combined Total Percentage
No Candidate 0 0 0 0.00%
0 0 0
State Representative, 1st District - REP Cook County City of Chicago Combined Total Percentage
Christine Radogno 6,912 6,912 100.00%
6,912 6,912
State Senator, 41st District 2yr - REP Cook County City of Chicago Combined Total Percentage

83 Page 59 of 83
Gene Witt 5,209 5,209 100.00%
5,209 5,209
State Representative, 12th District - REP Cook County City of Chicago Combined Total Percentage
Gary Mandell 4,898 4,898 100.00%
4,898 4,898
State Representative, 11th District - REP Cook County City of Chicago Combined Total Percentage
No Candidate 0 0 0.00%
0 0
State Representative, 13th District - REP Cook County City of Chicago Combined Total Percentage
Mark Spognardi 1,721 1,721 100.00%
1,721 1,721
State Representative, 10th District - REP Cook County City of Chicago Combined Total Percentage
No Candidate 0 0 0.00%
0 0
State Representative, 7th District - REP Cook County City of Chicago Combined Total Percentage
No Candidate 0 0 0.00%
Write-In 183 183 100.00%
183 183
State Representative, 6th District - REP Cook County City of Chicago Combined Total Percentage
No Candidate 0 0 0.00%
0 0
State Representative, 9th District - REP Cook County City of Chicago Combined Total Percentage
No Candidate 0 0 0 0.00%
0 0 0
State Representative, 8th District - REP Cook County City of Chicago Combined Total Percentage

84 Page 60 of 83
Michael P. McAuliffe 5,162 4,007 9,169 100.00%
5,162 4,007 9,169
State Representative, 20th District - REP Cook County City of Chicago Combined Total Percentage
No Candidate 0 0 0 0.00%
0 0 0
State Representative, 19th District - REP Cook County City of Chicago Combined Total Percentage
No Candidate 0 0 0 0.00%
0 0 0
State Representative, 21st District - REP Cook County City of Chicago Combined Total Percentage
Jessica Tucker 8,705 8,705 100.00%
8,705 8,705
State Representative, 18th District - REP Cook County City of Chicago Combined Total Percentage
Jonathan Edelman 3,147 1,977 5,124 100.00%
3,147 1,977 5,124
State Representative, 15th District - REP Cook County City of Chicago Combined Total Percentage
No Candidate 0 0 0 0.00%
0 0 0
State Representative, 14th District - REP Cook County City of Chicago Combined Total Percentage
No Candidate 0 0 0.00%
0 0
State Representative, 17th District - REP Cook County City of Chicago Combined Total Percentage
No Candidate 0 0 0 0.00%
0 0 0
State Representative, 16th District - REP Cook County City of Chicago Combined Total Percentage

85 Page 61 of 83
No Candidate 0 0 0 0.00%
0 0 0
State Representative, 28th District - REP Cook County City of Chicago Combined Total Percentage
No Candidate 0 0 0 0.00%
Write-In 183 53 236 100.00%
183 53 236
State Representative, 27th District - REP Cook County City of Chicago Combined Total Percentage
No Candidate 0 0 0 0.00%
0 0 0
State Representative, 29th District - REP Cook County City of Chicago Combined Total Percentage
No Candidate 0 0 0.00%
Write-In 237 237 100.00%
237 237
State Representative, 26th District - REP Cook County City of Chicago Combined Total Percentage
No Candidate 0 0 0 0.00%
0 0 0
State Representative, 23rd District - REP Cook County City of Chicago Combined Total Percentage
No Candidate 0 0 0 0.00%
0 0 0
State Representative, 22nd District - REP Cook County City of Chicago Combined Total Percentage
No Candidate 0 0 0.00%
Write-In 128 128 100.00%
128 128
State Representative, 25th District - REP Cook County City of Chicago Combined Total Percentage
Andy Kirchoff 2,574 105 2,679 100.00%
2,574 105 2,679
State Representative, 24th District - REP Cook County City of Chicago Combined Total Percentage

86 Page 62 of 83
No Candidate 0 0 0 0.00%
0 0 0
State Representative, 36th District - REP Cook County City of Chicago Combined Total Percentage
Victor Horne 5,801 2,328 8,129 100.00%
5,801 2,328 8,129
State Representative, 35th District - REP Cook County City of Chicago Combined Total Percentage
Margo McDermed 3,261 3,261 100.00%
3,261 3,261
State Representative, 37th District - REP Cook County City of Chicago Combined Total Percentage
No Candidate 0 0 0 0.00%
Write-In 33 16 49 100.00%
33 16 49
State Representative, 34th District - REP Cook County City of Chicago Combined Total Percentage
No Candidate 0 0 0 0.00%
0 0 0
State Representative, 31st District - REP Cook County City of Chicago Combined Total Percentage
No Candidate 0 0 0.00%
0 0
State Representative, 30th District - REP Cook County City of Chicago Combined Total Percentage
No Candidate 0 0 0 0.00%
Write-In 91 54 145 100.00%
91 54 145
State Representative, 33rd District - REP Cook County City of Chicago Combined Total Percentage
No Candidate 0 0 0 0.00%
Write-In 113 76 189 100.00%
113 76 189
State Representative, 32nd District - REP Cook County City of Chicago Combined Total Percentage

87 Page 63 of 83
Patricia R. ''Patti'' Bellock 1,190 1,190 100.00%
1,190 1,190
State Representative, 47th District - REP Cook County City of Chicago Combined Total Percentage
Christine Jennifer Winger 811 811 100.00%
811 811
State Representative, 45th District - REP Cook County City of Chicago Combined Total Percentage
Mike Fortner 544 544 100.00%
544 544
State Representative, 49th District - REP Cook County City of Chicago Combined Total Percentage
No Candidate 0 0 0.00%
Write-In 805 805 100.00%
805 805
State Representative, 44th District - REP Cook County City of Chicago Combined Total Percentage
No Candidate 0 0 0.00%
0 0
State Representative, 39th District - REP Cook County City of Chicago Combined Total Percentage
No Candidate 0 0 0.00%
0 0
State Representative, 38th District - REP Cook County City of Chicago Combined Total Percentage
No Candidate 0 0 0.00%
0 0
State Representative, 43rd District - REP Cook County City of Chicago Combined Total Percentage
No Candidate 0 0 0.00%
0 0
State Representative, 40th District - REP Cook County City of Chicago Combined Total Percentage

88 Page 64 of 83
No Candidate 0 0 0.00%
0 0
State Representative, 57th District - REP Cook County City of Chicago Combined Total Percentage
Jillian Rose Bernas 7,231 7,231 100.00%
7,231 7,231
State Representative, 56th District - REP Cook County City of Chicago Combined Total Percentage
No Candidate 0 0 0.00%
Write-In 54 54 100.00%
54 54
State Representative, 58th District - REP Cook County City of Chicago Combined Total Percentage
Dan Gott 7,957 112 8,069 100.00%
7,957 112 8,069
State Representative, 55th District - REP Cook County City of Chicago Combined Total Percentage
David McSweeney 2,428 2,428 100.00%
2,428 2,428
State Representative, 52nd District - REP Cook County City of Chicago Combined Total Percentage
Nick Sauer 68 68 100.00%
68 68
State Representative, 51st District - REP Cook County City of Chicago Combined Total Percentage
Tom Morrison 13,718 13,718 100.00%
13,718 13,718
State Representative, 54th District - REP Cook County City of Chicago Combined Total Percentage
David Harris 12,897 12,897 100.00%
12,897 12,897
State Representative, 53rd District - REP Cook County City of Chicago Combined Total Percentage

89 Page 65 of 83
Herb Schumann 143,429 50,729 194,158 100.00%
143,429 50,729 194,158
Commissioner, Water Reclamation Dist 2yr - REP
Cook County City of Chicago Combined Total Percentage
No Candidate 0 0 0 0.00%
No Candidate 0 0 0 0.00%
No Candidate 0 0 0 0.00%
0 0 0
(vote for 3)
Commissioner, Water Reclamation Dist - REP Cook County City of Chicago Combined Total Percentage
Christopher E.K. Pfannkuche 150,222 50,982 201,204 100.00%
150,222 50,982 201,204
State's Attorney, Cook County - REP Cook County City of Chicago Combined Total Percentage
Jim Durkin 6,819 6,819 100.00%
6,819 6,819
State Representative, 82nd District - REP Cook County City of Chicago Combined Total Percentage
Anthony Airdo 1,820 1,820 100.00%
1,820 1,820
State Representative, 77th District - REP Cook County City of Chicago Combined Total Percentage
Dawn Abernathy 632 632 100.00%
632 632
State Representative, 59th District - REP Cook County City of Chicago Combined Total Percentage
No Candidate 0 0 0.00%
0 0
State Representative, 80th District - REP Cook County City of Chicago Combined Total Percentage
No Candidate 0 0 0 0.00%
0 0 0
State Representative, 78th District - REP Cook County City of Chicago Combined Total Percentage

90 Page 66 of 83
No Candidate 0 0 0 0.00%
0 0 0
Circuit Court Judge (Vacancy of Biebel, Jr.) - REP
Cook County City of Chicago Combined Total Percentage
No Candidate 0 0 0 0.00%
0 0 0
Appellate Court Judge (Vacancy of Quinn) - REP
Cook County City of Chicago Combined Total Percentage
No Candidate 0 0 0 0.00%
0 0 0
Circuit Court Judge (Vacancy of Elrod) - REP Cook County City of Chicago Combined Total Percentage
No Candidate 0 0 0 0.00%
0 0 0
Appellate Court Judge (Vacancy of Epstein) - REP
Cook County City of Chicago Combined Total Percentage
No Candidate 0 0 0 0.00%
0 0 0
Recorder of Deeds, Cook County - REP Cook County City of Chicago Combined Total Percentage
Diane S. Shapiro 155,150 53,190 208,340 100.00%
155,150 53,190 208,340
Clerk of the Circuit Court, Cook County - REP Cook County City of Chicago Combined Total Percentage
No Candidate 0 0 0 0.00%
0 0 0
Board of Review, 2nd District - REP Cook County City of Chicago Combined Total Percentage
Dan Patlak 128,682 4,295 132,977 100.00%
128,682 4,295 132,977
Board of Review, 1st District - REP Cook County City of Chicago Combined Total Percentage

91 Page 67 of 83
No Candidate 0 0 0 0.00%
0 0 0
Circuit Court Judge (Vacancy of Palmer) - REP Cook County City of Chicago Combined Total Percentage
No Candidate 0 0 0 0.00%
0 0 0
Circuit Court Judge (Vacancy of O'Brien) - REP Cook County City of Chicago Combined Total Percentage
No Candidate 0 0 0 0.00%
0 0 0
Circuit Court Judge (Vacancy of Ruscitti Grussel) - REP
Cook County City of Chicago Combined Total Percentage
No Candidate 0 0 0 0.00%
0 0 0
Circuit Court Judge (Vacancy of Love) - REP Cook County City of Chicago Combined Total Percentage
No Candidate 0 0 0 0.00%
0 0 0
Circuit Court Judge (Vacancy of Howlett, Jr.) - REP
Cook County City of Chicago Combined Total Percentage
No Candidate 0 0 0 0.00%
0 0 0
Circuit Court Judge (Vacancy of Hogan) - REP Cook County City of Chicago Combined Total Percentage
No Candidate 0 0 0 0.00%
0 0 0
Circuit Court Judge (Vacancy of Karnezis) - REP Cook County City of Chicago Combined Total Percentage
No Candidate 0 0 0 0.00%
0 0 0
Circuit Court Judge (Vacancy of Johnson) - REP Cook County City of Chicago Combined Total Percentage

92 Page 68 of 83
No Candidate 0 0 0.00%
0 0
Judge, 5th Subcircuit (Vacancy of Stuart) - REP Cook County City of Chicago Combined Total Percentage
No Candidate 0 0 0.00%
0 0
Judge, 5th Subcircuit (Vacancy of Eadie-Daniels) - REP
Cook County City of Chicago Combined Total Percentage
No Candidate 0 0 0.00%
0 0
Judge, 5th Subcircuit (Vacancy of Williams) - REP
Cook County City of Chicago Combined Total Percentage
No Candidate 0 0 0.00%
0 0
Judge, 4th Subcircuit (Vac of Kunkle) - REP Cook County City of Chicago Combined Total Percentage
No Candidate 0 0 0 0.00%
0 0 0
Judge, 1st Subcircuit (Vacancy of Brim) - REP Cook County City of Chicago Combined Total Percentage
No Candidate 0 0 0 0.00%
0 0 0
Circuit Court Judge (Vacancy of Walsh) - REP Cook County City of Chicago Combined Total Percentage
No Candidate 0 0 0 0.00%
0 0 0
Judge, 2nd Subcircuit (Vacancy of Savage) - REP
Cook County City of Chicago Combined Total Percentage
No Candidate 0 0 0 0.00%
0 0 0
Judge, 1st Subcircuit (Vacancy of Hopkins) - REP
Cook County City of Chicago Combined Total Percentage

93 Page 69 of 83
No Candidate 0 0 0 0.00%
0 0 0
Judge, 10th Subcircuit (Vacancy of Howard) - REP
Cook County City of Chicago Combined Total Percentage
No Candidate 0 0 0 0.00%
0 0 0
Judge, 9th Subcircuit (Vacancy of Berman) - REP
Cook County City of Chicago Combined Total Percentage
No Candidate 0 0 0 0.00%
0 0 0
Judge, 11th Subcircuit (Vacancy of Kelly) - REP Cook County City of Chicago Combined Total Percentage
No Candidate 0 0 0 0.00%
0 0 0
Judge, 7th Subcircuit (Vac of Rivkin-Carothers) - REP
Cook County City of Chicago Combined Total Percentage
No Candidate 0 0 0.00%
0 0
Judge, 6th Subcircuit (Vac of Gonzalez Santiago) - REP
Cook County City of Chicago Combined Total Percentage
No Candidate 0 0 0.00%
0 0
Judge, 6th Subcircuit (Vacancy of Ponce de Leon) - REP
Cook County City of Chicago Combined Total Percentage
No Candidate 0 0 0 0.00%
0 0 0
Judge, 7th Subcircuit (Vacancy of Burrell) - REP Cook County City of Chicago Combined Total Percentage
No Candidate 0 0 0.00%
0 0
Judge, 6th Subcircuit (Additional Judgeship A) - REP
Cook County City of Chicago Combined Total Percentage

94 Page 70 of 83
No Candidate 0 0 0 0.00%
0 0 0
Judge, 14th Subcircuit (Vacancy of Ruble Murphy) - REP
Cook County City of Chicago Combined Total Percentage
Kevin Michael O'Donnell 19,284 19,284 55.30%
Gary W. Seyring 15,589 15,589 44.70%
34,873 34,873
Judge, 13th Subcircuit (Vac of Fecarotta, Jr.) - REP
Cook County City of Chicago Combined Total Percentage
Mark Calonder 1,101 1,101 100.00%
1,101 1,101
Ward Committeeman, Rep 1st - REP Cook County City of Chicago Combined Total Percentage
Alex Kaplan 14,236 14,236 43.79%
Steven A. Kozicki 18,274 18,274 56.21%
32,510 32,510
Judge, 12th Subcircuit (Additional Judgeship A) - REP
Cook County City of Chicago Combined Total Percentage
Thomas William Flannigan 30,833 30,833 100.00%
30,833 30,833
Judge, 12th Subcircuit (Vac of Kazmierski, Jr.) - REP
Cook County City of Chicago Combined Total Percentage
No Candidate 0 0 0 0.00%
0 0 0
Judge, 11th Subcircuit (Vacancy of Zwick) - REP Cook County City of Chicago Combined Total Percentage
David Studenroth 30,288 30,288 100.00%
30,288 30,288
Judge, 12th Subcircuit (Vac of Tristano) - REP Cook County City of Chicago Combined Total Percentage
James Leonard Allegretti 31,083 31,083 100.00%
31,083 31,083
Judge, 12th Subcircuit (Vac of Mathein) - REP Cook County City of Chicago Combined Total Percentage

95 Page 71 of 83
Lynn Renee Franco 74 74 100.00%
74 74
Ward Committeeman, Rep 8th - REP Cook County City of Chicago Combined Total Percentage
Philanise White 115 115 92.74%
Write-In 9 9 7.26%
124 124
Ward Committeeman, Rep 7th - REP Cook County City of Chicago Combined Total Percentage
Wayland Johnson Jr. 120 120 100.00%
120 120
Ward Committeeman, Rep 9th - REP Cook County City of Chicago Combined Total Percentage
Darnell B. Macklin 113 113 93.39%
Write-In 8 8 6.61%
121 121
Ward Committeeman, Rep 6th - REP Cook County City of Chicago Combined Total Percentage
Adrian J Wright 885 885 97.90%
Write-In 19 19 2.10%
904 904
Ward Committeeman, Rep 3rd - REP Cook County City of Chicago Combined Total Percentage
Eloise Gerson 2,706 2,706 100.00%
2,706 2,706
Ward Committeeman, Rep 2nd - REP Cook County City of Chicago Combined Total Percentage
Matthew Foldi 397 397 100.00%
397 397
Ward Committeeman, Rep 5th - REP Cook County City of Chicago Combined Total Percentage
Lori Yokoyama 607 607 100.00%
607 607
Ward Committeeman, Rep 4th - REP Cook County City of Chicago Combined Total Percentage

96 Page 72 of 83
Richard Munnich 80 80 100.00%
80 80
Ward Committeeman, Rep 16th - REP Cook County City of Chicago Combined Total Percentage
Rosa Pritchett 181 181 93.30%
Write-In 13 13 6.70%
194 194
Ward Committeeman, Rep 15th - REP Cook County City of Chicago Combined Total Percentage
Sherri Griffith 113 113 100.00%
113 113
Ward Committeeman, Rep 17th - REP Cook County City of Chicago Combined Total Percentage
Vilma F. Garcia 247 247 33.93%
Emma Walsh 481 481 66.07%
728 728
Ward Committeeman, Rep 14th - REP Cook County City of Chicago Combined Total Percentage
Carl Segvich 767 767 50.66%
Richard A. Catezone 747 747 49.34%
1,514 1,514
Ward Committeeman, Rep 11th - REP Cook County City of Chicago Combined Total Percentage
No Candidate 0 0 0.00%
Write-In 243 243 100.00%
243 243
Ward Committeeman, Rep 10th - REP Cook County City of Chicago Combined Total Percentage
Gabriel Trejo 972 972 100.00%
972 972
Ward Committeeman, Rep 13th - REP Cook County City of Chicago Combined Total Percentage
Antonio Mannings 330 330 100.00%
330 330
Ward Committeeman, Rep 12th - REP Cook County City of Chicago Combined Total Percentage

97 Page 73 of 83
Larry G. Nelson 74 74 100.00%
74 74
Ward Committeeman, Rep 24th - REP Cook County City of Chicago Combined Total Percentage
Robert J. Handzik 1,178 1,178 96.16%
Write-In 47 47 3.84%
1,225 1,225
Ward Committeeman, Rep 23rd - REP Cook County City of Chicago Combined Total Percentage
Martin Ozinga IV 739 739 100.00%
739 739
Ward Committeeman, Rep 25th - REP Cook County City of Chicago Combined Total Percentage
No Candidate 0 0 0.00%
0 0
Ward Committeeman, Rep 22nd - REP Cook County City of Chicago Combined Total Percentage
Steven S. Graves 2,115 2,115 53.03%
Danny Carbol 1,873 1,873 46.97%
3,988 3,988
Ward Committeeman, Rep 19th - REP Cook County City of Chicago Combined Total Percentage
William Mr ''D'' Delay 385 385 57.04%
Symeon Brown 290 290 42.96%
675 675
Ward Committeeman, Rep 18th - REP Cook County City of Chicago Combined Total Percentage
No Candidate 0 0 0.00%
Write-In 22 22 100.00%
22 22
Ward Committeeman, Rep 21st - REP Cook County City of Chicago Combined Total Percentage
Maria Bailey 99 99 96.12%
Write-In 4 4 3.88%
103 103
Ward Committeeman, Rep 20th - REP Cook County City of Chicago Combined Total Percentage

98 Page 74 of 83
Stephen Rossi 1,979 1,979 100.00%
1,979 1,979
Ward Committeeman, Rep 32nd - REP Cook County City of Chicago Combined Total Percentage
Bob Howington 597 597 100.00%
597 597
Ward Committeeman, Rep 31st - REP Cook County City of Chicago Combined Total Percentage
Stan Bartkus 817 817 100.00%
817 817
Ward Committeeman, Rep 33rd - REP Cook County City of Chicago Combined Total Percentage
No Candidate 0 0 0.00%
Write-In 113 113 100.00%
113 113
Ward Committeeman, Rep 30th - REP Cook County City of Chicago Combined Total Percentage
Mark Spognardi 895 895 100.00%
895 895
Ward Committeeman, Rep 27th - REP Cook County City of Chicago Combined Total Percentage
Jason Wroble 538 538 100.00%
538 538
Ward Committeeman, Rep 26th - REP Cook County City of Chicago Combined Total Percentage
Frances ''Fran'' Sapone 505 505 100.00%
505 505
Ward Committeeman, Rep 29th - REP Cook County City of Chicago Combined Total Percentage
Eric Pulia 340 340 100.00%
340 340
Ward Committeeman, Rep 28th - REP Cook County City of Chicago Combined Total Percentage

99 Page 75 of 83
Daniel J. Kelley 1,141 1,141 100.00%
1,141 1,141
Ward Committeeman, Rep 40th - REP Cook County City of Chicago Combined Total Percentage
No Candidate 0 0 0.00%
0 0
Ward Committeeman, Rep 39th - REP Cook County City of Chicago Combined Total Percentage
Michael P. McAuliffe 4,576 4,576 100.00%
4,576 4,576
Ward Committeeman, Rep 41st - REP Cook County City of Chicago Combined Total Percentage
Peter P. Podgorski 2,248 2,248 100.00%
2,248 2,248
Ward Committeeman, Rep 38th - REP Cook County City of Chicago Combined Total Percentage
Walter Zarnecki 353 353 54.06%
Brent Mulvey 300 300 45.94%
653 653
Ward Committeeman, Rep 35th - REP Cook County City of Chicago Combined Total Percentage
Percy V. Coleman 107 107 100.00%
107 107
Ward Committeeman, Rep 34th - REP Cook County City of Chicago Combined Total Percentage
George McKinley 137 137 94.48%
Write-In 8 8 5.52%
145 145
Ward Committeeman, Rep 37th - REP Cook County City of Chicago Combined Total Percentage
Sammy Tenuta 800 800 100.00%
800 800
Ward Committeeman, Rep 36th - REP Cook County City of Chicago Combined Total Percentage

100 Page 76 of 83
Edward L. Bowe 1,281 1,281 100.00%
1,281 1,281
Ward Committeeman, Rep 48th - REP Cook County City of Chicago Combined Total Percentage
Jessica White 2,011 2,011 100.00%
2,011 2,011
Ward Committeeman, Rep 47th - REP Cook County City of Chicago Combined Total Percentage
Kurt Fujio 757 757 100.00%
757 757
Ward Committeeman, Rep 49th - REP Cook County City of Chicago Combined Total Percentage
Diane S. Shapiro 1,412 1,412 100.00%
1,412 1,412
Ward Committeeman, Rep 46th - REP Cook County City of Chicago Combined Total Percentage
Chris Cleveland 3,301 3,301 100.00%
3,301 3,301
Ward Committeeman, Rep 43rd - REP Cook County City of Chicago Combined Total Percentage
Rita Zak 3,281 3,281 100.00%
3,281 3,281
Ward Committeeman, Rep 42nd - REP Cook County City of Chicago Combined Total Percentage
Roisin M. Dohl 2,238 2,238 100.00%
2,238 2,238
Ward Committeeman, Rep 45th - REP Cook County City of Chicago Combined Total Percentage
Scott Davis 2,523 2,523 100.00%
2,523 2,523
Ward Committeeman, Rep 44th - REP Cook County City of Chicago Combined Total Percentage

101 Page 77 of 83
Antonne ''Tony'' Cox 3 3 100.00%
3 3
Ward Committeeman, Grn 24th - GRN Cook County City of Chicago Combined Total Percentage
No Candidate 0 0 0.00%
Write-In 21 21 100.00%
21 21
Ward Committeeman, Grn 23rd - GRN Cook County City of Chicago Combined Total Percentage
Christopher Anthony 33 33 100.00%
33 33
Ward Committeeman, Grn 25th - GRN Cook County City of Chicago Combined Total Percentage
John ''Jack'' Ailey 3 3 100.00%
3 3
Ward Committeeman, Grn 22nd - GRN Cook County City of Chicago Combined Total Percentage
Write-In 0 13 13 4.83%
Rob Sherman 3 145 148 55.02%
Warren ''Grizz'' Grimsley 4 104 108 40.15%
7 262 269
U.S. Representative, 5th District - GRN Cook County City of Chicago Combined Total Percentage
No Candidate 0 0 0.00%
Write-In 160 160 100.00%
160 160
Ward Committeeman, Rep 50th - REP Cook County City of Chicago Combined Total Percentage
Elvin McMillian 6 6 100.00%
6 6
Ward Committeeman, Grn 20th - GRN Cook County City of Chicago Combined Total Percentage
Michael Braboy 23 23 100.00%
23 23
Ward Committeeman, Grn 3rd - GRN Cook County City of Chicago Combined Total Percentage

102 Page 78 of 83
YES 3,772 3,772 59.36%
NO 2,582 2,582 40.64%
6,354 6,354
Village of Brookfield, Issue Bonds Cook County City of Chicago Combined Total Percentage
YES 3,832 3,832 81.26%
NO 884 884 18.74%
4,716 4,716
Village of Alsip, Term Limits Cook County City of Chicago Combined Total Percentage
Christopher Rintz 2,530 2,530 18.00%
Louise A. Holland 2,373 2,373 16.88%
Penfield S. Lanphier 2,443 2,443 17.38%
Carol Fessler 2,149 2,149 15.29%
Kristin Ziv 2,443 2,443 17.38%
Marilyn D. Prodromos 2,121 2,121 15.09%
14,059 14,059
(vote for 3)
Trustee, Village Winnetka Cook County City of Chicago Combined Total Percentage
Verne Peterson 14 14 100.00%
14 14
Ward Committeeman, Grn 33rd - GRN Cook County City of Chicago Combined Total Percentage
No Candidate 0 0 0.00%
Write-In 5 5 100.00%
5 5
Ward Committeeman, Grn 29th - GRN Cook County City of Chicago Combined Total Percentage
George Milkowski 5 5 100.00%
5 5
Ward Committeeman, Grn 50th - GRN Cook County City of Chicago Combined Total Percentage
Nancy Wade 52 52 100.00%
52 52
Ward Committeeman, Grn 47th - GRN Cook County City of Chicago Combined Total Percentage

103 Page 79 of 83
YES 3,610 3,610 73.37%
NO 1,310 1,310 26.63%
4,920 4,920
Village of La Grange Park, Issue Bonds $1,200,000
Cook County City of Chicago Combined Total Percentage
YES 3,785 3,785 77.12%
NO 1,123 1,123 22.88%
4,908 4,908
Village of La Grange Park, Issue Bonds $10,000,000
Cook County City of Chicago Combined Total Percentage
YES 1,620 1,620 34.47%
NO 3,080 3,080 65.53%
4,700 4,700
Village of Hazel Crest, Adopt Form of Government
Cook County City of Chicago Combined Total Percentage
YES 2,645 2,645 67.39%
NO 1,280 1,280 32.61%
3,925 3,925
Village of Franklin Park, Construct Underpass Cook County City of Chicago Combined Total Percentage
YES 1,453 1,453 36.92%
NO 2,483 2,483 63.08%
3,936 3,936
Village of Franklin Park, Home Rule Cook County City of Chicago Combined Total Percentage
YES 3,227 3,227 68.69%
NO 1,471 1,471 31.31%
4,698 4,698
Village of Hazel Crest, Retain Form of Government
Cook County City of Chicago Combined Total Percentage
YES 2,379 2,379 63.27%
NO 1,381 1,381 36.73%
3,760 3,760
Village of Franklin Park, Village Personnel Cook County City of Chicago Combined Total Percentage

104 Page 80 of 83
YES 2,125 2,125 67.63%
NO 1,017 1,017 32.37%
3,142 3,142
Village of Riverdale, Alcohol Sales Cook County City of Chicago Combined Total Percentage
YES 2,483 2,483 79.00%
NO 660 660 21.00%
3,143 3,143
Village of Riverdale, Curfew Hours Cook County City of Chicago Combined Total Percentage
YES 1,538 1,538 38.55%
NO 2,452 2,452 61.45%
3,990 3,990
Village of Richton Park, Sales Tax Cook County City of Chicago Combined Total Percentage
YES 2,707 2,707 41.89%
NO 3,755 3,755 58.11%
6,462 6,462
Village of Niles, Trustee Vacancies Cook County City of Chicago Combined Total Percentage
YES 5,725 5,725 88.49%
NO 745 745 11.51%
6,470 6,470
Village of Niles, Program Funding Cook County City of Chicago Combined Total Percentage
YES 1,560 1,560 74.43%
NO 536 536 25.57%
2,096 2,096
Village of Northfield, Issue Bonds Cook County City of Chicago Combined Total Percentage
YES 4,215 4,215 64.64%
NO 2,306 2,306 35.36%
6,521 6,521
Village of Niles, Property Enhancement Cook County City of Chicago Combined Total Percentage

105 Page 81 of 83
YES 1,505 1,505 67.82%
NO 714 714 32.18%
2,219 2,219
Stickney-Forest View Library District, Issue Bonds
Cook County City of Chicago Combined Total Percentage
YES 93 93 68.38%
NO 43 43 31.62%
136 136
Frankfort Square Park District, Issue Bonds Cook County City of Chicago Combined Total Percentage
YES 1,319 1,319 67.71%
NO 629 629 32.29%
1,948 1,948
Village of Willow Springs, Join Tri-State FPD Cook County City of Chicago Combined Total Percentage
YES 958 958 53.67%
NO 827 827 46.33%
1,785 1,785
Village of Summit, Home Rule Cook County City of Chicago Combined Total Percentage
YES 2,011 2,011 64.72%
NO 1,096 1,096 35.28%
3,107 3,107
Village of Riverdale, Consolidate School Districts
Cook County City of Chicago Combined Total Percentage
YES 1,226 1,226 61.67%
NO 762 762 38.33%
1,988 1,988
Village of Willow Springs, Video Gaming Cook County City of Chicago Combined Total Percentage
YES 1,401 1,401 25.41%
NO 4,113 4,113 74.59%
5,514 5,514
Village of Westchester, Home Rule Cook County City of Chicago Combined Total Percentage

106 Page 82 of 83
YES 19 19 35.85%
NO 34 34 64.15%
53 53
Northwest Homer Fire Prot. Dist., Limiting Rate Cook County City of Chicago Combined Total Percentage
YES 3,833 3,833 54.42%
NO 3,210 3,210 45.58%
7,043 7,043
High School District 220, Increase Limiting Rate Cook County City of Chicago Combined Total Percentage
Yes 10,671 10,671 77.49%
No 3,100 3,100 22.51%
13,771 13,771
W29-Voting Rights Cook County City of Chicago Combined Total Percentage
YES 3,694 3,694 57.30%
NO 2,753 2,753 42.70%
6,447 6,447
School District 111, Issue Bonds Cook County City of Chicago Combined Total Percentage
YES 849 849 43.81%
NO 1,089 1,089 56.19%
1,938 1,938
North Riverside Library Dist., Limitation Increase
Cook County City of Chicago Combined Total Percentage
YES 575 575 51.76%
NO 536 536 48.24%
1,111 1,111
School District 181, Issue Bonds Cook County City of Chicago Combined Total Percentage
YES 5,267 5,267 80.60%
NO 1,268 1,268 19.40%
6,535 6,535
School District 153, Issue Bonds Cook County City of Chicago Combined Total Percentage

107 Page 83 of 83
Yes 4,043 4,043 92.73%
No 317 317 7.27%
4,360 4,360
W32-Logan Sq. Zoning Cook County City of Chicago Combined Total Percentage

108
Cook County Summary of QualifiedPresidential Primary Election Write-Ins
CONTEST NAME CANDIDATE NAME TOTALPresident, U.S. DAVID FORMHALS (DEM) 9U.S. Representative, 7th District FREDERICK COLLINS (DEM) 10U.S. Representative, 8th District ANDREW STRAW (REP) 7State Senator, 17th District 2yr QUINTIN BARTON (REP) 0State Senator, 22nd District 4yr RICHARD EVANS (REP) 169State Representative, 27th District ZAHKAIYAH M. IMANI (REP) 1State Representative, 32nd District WILLIAM "MR D" DELAY (REP) 0State Representative, 33rd District JOSEPH A. BARTON (REP) 0State Representative, 33rd District NICHOLAS MYRICKES (REP) 1State Representative, 34th District TASHIA GRANT (REP) 0State Representative, 44th District KATY DOLAN BAUMER (REP) 546State Representative, 58th District MARTIN A. BLUMENTHAL (REP) 10President, U.S. JOANN BREIVOGEL (REP) 6U.S. Representative, 5th District RICHARD B."RIVERVIEW" MAYERS (GRN) 0
March 15, 2016

Printed internally by the Cook County Bureau of Administration Digital Graphics Unit

David OrrCook County Clerk
69 W. Washington, Fifth FloorChicago, IL 60602
312.603.0900cookcountyclerk.com