Iloprost-induced desensitization of the prostacyclin receptor in isolated rabbit lungs

doi: 10.1152/jn.00355.200798:807-820, 2007. First published 16 May 2007;J Neurophysiol
Achim KlugJoachim Hermann, Michael Pecka, Henrique von Gersdorff, Benedikt Grothe and
Like Activity Levels−Vivo Synaptic Transmission at the Calyx of Held Under In
You might find this additional info useful...
for this article can be found at: Supplementary materialhttp://jn.physiology.org/http://jn.physiology.org/content/suppl/2008/08/06/00355.2007.DC1.html
50 articles, 17 of which you can access for free at: This article citeshttp://jn.physiology.org/content/98/2/807.full#ref-list-1
36 other HighWire-hosted articles: This article has been cited by http://jn.physiology.org/content/98/2/807#cited-by
including high resolution figures, can be found at: Updated information and serviceshttp://jn.physiology.org/content/98/2/807.full
can be found at: Journal of Neurophysiology about Additional material and informationhttp://www.the-aps.org/publications/jn
This information is current as of August 7, 2016.
at http://www.the-aps.org/. Copyright © 2007 by the American Physiological Society. ISSN: 0022-3077, ESSN: 1522-1598. Visit our websitetimes a year (monthly) by the American Physiological Society, 9650 Rockville Pike, Bethesda MD 20814-3991.
publishes original articles on the function of the nervous system. It is published 12Journal of Neurophysiology
by guest on August 7, 2016
http://jn.physiology.org/D
ownloaded from
by guest on A
ugust 7, 2016http://jn.physiology.org/
Dow
nloaded from

Synaptic Transmission at the Calyx of Held Under In Vivo–LikeActivity Levels
Joachim Hermann,1 Michael Pecka,1 Henrique von Gersdorff,1,2 Benedikt Grothe,1 and Achim Klug1
1Ludwig-Maximilians-University, Munich, Germany; and 2The Vollum Institute, Oregon Health and Science University, Portland, Oregon
Submitted 29 March 2007; accepted in final form 13 May 2007
Hermann J, Pecka M, von Gersdorff H, Grothe B, Klug A.Synaptic transmission at the calyx of Held under in vivo–like activitylevels. J Neurophysiol 98: 807–820, 2007. First published May 16,2007; doi:10.1152/jn.00355.2007. One of the hallmarks of auditoryneurons in vivo is spontaneous activity that occurs even in the absenceof any sensory stimuli. Sound-evoked bursts of discharges are thusembedded within this background of random firing. The calyx of Heldsynapse in the medial nucleus of the trapezoid body (MNTB) has beencharacterized in vitro as a fast relay that reliably fires at high stimulusfrequencies (�800 Hz). However, inherently due to the preparationmethod, spontaneous activity is absent in studies using brain stemslices. Here we first determine in vivo spontaneous firing rates ofMNTB principal cells from Mongolian gerbils and then reintroducethis random firing to in vitro gerbil brain stem synapses at near-physiological temperature. After conditioning synapses with afferentfiber stimulation for 2 min at Poisson averaged rates of 20, 40, and 60Hz, we observed a number of differences in the properties of synaptictransmission between conditioned and unconditioned synapses. Fore-most, we observed reduced steady-state EPSC amplitudes that de-pressed even further during an embedded short-stimulation train of100, 300, or 600 Hz (a protocol that thus simulates in vitro whatprobably occurs at the in vivo MNTB after a short sound stimulus ina silent background). Accordingly, current-clamp, dynamic-clamp,and loose-patch recordings revealed a number of action potentialfailures at the postsynaptic cell during high-frequency–stimulationtrains, although the initial onset of evoked activity was still transmit-ted with higher fidelity. We thus propose that some in vivo auditorysynapses are in a tonic state of reduced EPSC amplitudes as aconsequence of high spontaneous spiking and this in vivo–like con-ditioning has important consequences for the encoding of signalsthroughout the auditory pathway.
I N T R O D U C T I O N
The calyx of Held is a large synaptic terminal innervatingprincipal neurons of the medial nucleus of the trapezoid body(MNTB) (Forsythe 1994; Held 1893; Kuwabara et al. 1991;Smith et al. 1991). MNTB neurons sign-invert calyceal exci-tation into glycinergic inhibition to various nuclei in the audi-tory brain stem (Banks and Smith 1992; Bledsoe et al. 1990;Moore and Caspary 1983; Spangler et al. 1985; Thompson andSchofield 2000). In vitro, the signal derived from the calyxgenerates large excitatory postsynaptic currents (EPSCs) witha short synaptic delay (Barnes-Davies and Forsythe 1995;Borst and Sakmann 1996; Sakaba and Neher 2001; Taschen-berger et al. 2002). Speed and fidelity of synaptic transmis-sion are considered very reliable up to several hundredHertz in mature animals (Futai et al. 2001; Joshi et al. 2004;Taschenberger and von Gersdorff 2000; Wu and Kelly
1993), leading to a view of the calyx of Held as a veryreliable relay synapse.
All the in vitro work mentioned earlier was performed inbrain slices. Inherently, auditory brain slice preparationsdiffer from intact brains in various parameters, includingspontaneous activity. In vivo, neurons of the auditory brainstem fire spontaneously at frequencies that vary from �1 to�100 Hz, a property that results mainly from the dynamicsof the transduction channels in the cochlear hair cells(Geisler et al. 1985; Hudspeth 1997; Kiang 1965; Liberman1978; Roberts et al. 1988), resulting in spontaneous firing ofthe auditory nerve (Geisler et al. 1985; Liberman 1978).Spontaneous firing can also be observed in many brain stemnuclei including the cochlear nucleus (Brownell 1975; Gold-berg and Brownell 1973; Joris et al. 1994; Schwarz and Puil1997; Spirou et al. 1990, 2005) and MNTB (Kadner et al.2006; Kopp-Scheinpflug et al. 2003; Smith et al. 1998;Sommer et al. 1993).
In an intact brain, MNTB neurons fire spontaneously atlevels, which might be suitable to chronically induce someforms of short-term plasticity, such as synaptic depression orfacilitation (Schneggenburger et al. 2002; von Gersdorff andBorst 2002). Sound stimuli, i.e., streams of high-frequencyactivity embedded in this spontaneous firing (Klyachko andStevens 2006), would then be processed by the synapse on thebackground of chronic depression and/or facilitation (Fig. 1A).Because of the nature of the brain slice preparation, spontane-ous activity and its potential effects on short-term plasticitymight be lost in standard in vitro recordings (Fig. 1B). If thatwere the case, properties of synaptic transmission in the calyxof Held under in vivo conditions may be different from thosecommonly observed in vitro.
This study investigates synaptic transmission in the calyx ofHeld under in vivo–like spontaneous activity levels. We firstmeasured the rates and statistical properties of spontaneousfiring in the MNTB of Mongolian gerbils (Meriones unguicu-latus) in vivo. Subsequently, we stimulated the afferent fibersthat give rise to calyceal inputs in gerbil MNTB brain slices atphysiological temperature for prolonged periods of time withstimuli that mimicked the random spontaneous activity asclosely as possible (Fig. 1C). We assessed changes in synaptictransmission resulting from this long-term stimulation, such assynaptic currents, the degree of depression, recovery fromdepression, and finally the spiking properties of “spontane-ously active” neurons.
Address for reprint requests and other correspondence: A. Klug, Neurobi-ology Group, Dept. Biology II, Grosshaderner Strasse 2, 82152 Martinsried,Germany (E-mail: [email protected]).
The costs of publication of this article were defrayed in part by the paymentof page charges. The article must therefore be hereby marked “advertisement”in accordance with 18 U.S.C. Section 1734 solely to indicate this fact.
J Neurophysiol 98: 807–820, 2007.First published May 16, 2007; doi:10.1152/jn.00355.2007.
8070022-3077/07 $8.00 Copyright © 2007 The American Physiological Societywww.jn.org
by guest on August 7, 2016
http://jn.physiology.org/D
ownloaded from

M E T H O D S
In vivo recordings
Auditory responses from 36 single neurons were recorded in 16Mongolian gerbils (Meriones unguiculatus) of both sexes, aged be-tween 21 and 60 days. We found no systematic differences in aurality,firing frequency, threshold, characteristic frequency, or other responseparameters of neurons, which depended on the age of the animal (datanot shown), and thus the data from all 36 neurons were pooled. In oursample there was also no covariation between spontaneous activityand auditory threshold or between spontaneous activity and a neuron’scharacteristic frequency (regression analyses; data not shown). Forexperimental reasons, the reported in vivo data were recorded fromMNTB postsynaptic neurons, not calyces of Held or globular bushycells in the anteroventral cochlear nucleus. The underlying assumptionis that the spontaneous activity in the MNTB is not high enough toinduce synaptic failures at the calyx of Held synapse, such that thepresynaptic spike frequency is identical to the postsynaptic activity.
Data were collected simultaneously for this study and a differentproject involving MNTB response properties (data not shown). Allexperiments complied with institutional guidelines and were approvedby the appropriate government authorities (Reg. Oberbayern AZ55.2-1-54-2531-57-05).
SURGICAL PROCEDURES. Before surgery, animals were anesthetizedby an initial intraperitoneal injection (0.5 ml/100 g body weight) ofketamine (20%) and xylazine (2%, both in physiological NaCl).During surgery and recordings, a dose of 0.05 ml of the same mixturewas applied subcutaneously in scheduled intervals that were based onthe animal’s body weight. Constant body temperature was maintainedusing a thermostatically controlled heating blanket.
Skin and tissue covering the upper part of the skull were removedand a small metal rod was mounted to the frontal part of the skullusing UV-sensitive dental-restorative material (Charisma, HeraeusKulzer, Hanau, Germany). Custom-made earphone holders were at-tached to the gerbil head, allowing for the safe insertion of earphonesor probe tube microphones into the ear canal. The animal was thentransferred to a sound-attenuated chamber and mounted in a custom-made stereotaxic instrument (Schuller et al. 1986). The animal’sposition in the recording chamber was standardized with reference tostereotaxic landmarks on the skull (Loskota et al. 1974). For electrode
penetrations to the MNTB, a small hole of approximately 1 mm2 wascut into the skull lateral to the lambdoid suture. Micromanipulatorswere used to position the recording electrode according to landmarkson the brain surface and a reference point, which was used for allpenetrations. The meninges overlying the cortex were removed andsaline was applied to the opening to prevent dehydration of the brain.
Typical recording sessions lasted 10–14 h. After successful record-ings, the animal was killed by injection of an overdose of chloralhydrate (Sigma–Aldrich Chemie, Munich, Germany). The last elec-trode position was then marked with a current-induced lesion (20 �Afor 80–120 s). The head was fixated in 4% paraformaldehyde andprepared for anatomical processing. Transverse sections were cut andNissl-stained to verify the recording sites. An example of an anatom-ical verification is shown in Supplemental Fig. 1C.1 The lesion sitecan be clearly seen in the center of the left MNTB.
RECORDINGS OF NEURAL ACTIVITY. Single-unit responses were re-corded extracellularly using 10-M� glass electrodes filled with 1 MNaCl. The recording electrode was advanced under remote control,using a piezodrive (Inchworm controller 8200, EXFO Burleigh Prod-ucts Group, Victor, NY). Extracellular action potentials were recordedby an electrometer (npi electronics, Tamm, Germany or Electro 705,WPI, Berlin, Germany), a 50/60-Hz noise eliminator (Humbug, QuestScientific Instruments, North Vancouver, BC, Canada), a band-passfilter (VBF/3, Bortolin Kemo, Porcia, Italy), and an amplifier (model7607, Toellner Electronic Instrumente, Herdecke, Germany) and sub-sequently fed into the computer by an A/D-converter [RP2-1, Tucker-Davis Technologies (TDT), Alachua, FL]. Clear isolation of actionpotentials from a single neuron (signal-to-noise ratio �5) wasachieved by visual inspection on a spike-triggered oscilloscope and byoff-line spike-cluster analysis (Brainware, TDT). Two examples ofrecorded single-cell spike waveforms are shown in Supplemental Fig.1, A and B. The unit in supplemental Fig. 1A is an example of a neuronwith a low spontaneous rate (10 Hz), whereas supplemental Fig. 1Bshows an example of a neuron with a very high spontaneous rate (107Hz). Both units were recorded from the same animal; histologicalverification of the recording site is shown in Supplemental Fig. 1C.
STIMULUS PRESENTATION AND RECORDING PROTOCOLS. Stimuliwere generated at a 50-kHz sampling rate using TDT System III.
1 The online version of this article contains supplemental data.
FIG. 1. A: illustration of in vivo activity in the medial nucleus of the trapezoid body (MNTB). In the intact brain, MNTB neurons are chronicallyspontaneously active. Responses to sound stimuli, indicated by high-frequency bursts, are embedded in the background activity. B: in a typical slice preparation,the background activity is not present, such that trains of high-frequency stimuli used to imitate responses to sound are embedded in periods of complete silence.C: our experimental approach attempted to bring the spontaneous activity back into slice preparations. Responses to simulated sound stimuli were tested to obtaina baseline of synaptic properties, then spontaneous activity was simulated for several minutes, then the same “sound stimuli” were tested again while they wereembedded in background activity. At the end of data collection, the cell was allowed to recover and the same set of simulated sound stimuli was tested againto assess the level of recovery.
808 HERMANN, PECKA, VON GERSDORFF, GROTHE, AND KLUG
J Neurophysiol • VOL 98 • AUGUST 2007 • www.jn.org
by guest on August 7, 2016
http://jn.physiology.org/D
ownloaded from

Digitally generated stimuli were converted to analog signals (DA3-2/RP2-1, TDT), attenuated (PA5, TDT), and delivered to earphones(MDR-EX70LP, Sony, Berlin, Germany).
The standard stimulus was a 200-ms toneburst with a rise/fall timeof 5 ms, presented at a repetition rate of 2 Hz. Stimulus presentationwas randomized. To search for acoustically evoked responses, noisestimuli were delivered binaurally. When an auditory neuron wasencountered, we first determined its best frequency (BF) and absolutethreshold audiovisually to set stimulus parameters subsequently con-trolled by the computer. The frequency that elicited responses at thelowest sound intensity was defined as BF, the lowest sound intensityevoking a noticeable response at BF as threshold. These propertieswere confirmed by off-line analysis of the frequency versus levelresponse areas. Monaural pure tones to each ear and binaural puretones without interaural intensity or time differences were presentedto define the aurality of the neuron. MNTB neurons responded tostimulation of the contralateral ear only, with a tonic/primary-likefiring pattern, and were not affected by stimulation of the ipsilateralear.
Spontaneous activity of a neuron was determined by recordingaction potentials in several 5-s-long intervals without sound stimula-tion and averaging the measured firing rate. All quantifications in thisstudy are based on off-line analysis with the software packagesBrainware (TDT), Matlab (The MathWorks, Natick, MA), and IGOR(WaveMetrics, Lake Oswego, OR).
In vitro recordings
Slices of brain stem were prepared from Mongolian gerbils (Meri-ones uniguiculatus) aged 14 to 19 days (posthearing animals). Datafrom these different ages were pooled because no age-dependentvariations in synaptic amplitudes, degree of depression, response toconditioning, or firing probability were observed (data not shown).
SLICE PREPARATION. Animals were briefly anesthesized by isoflu-rane inhalation (Isofluran Curamed, Curamed Pharma, Karlsruhe,Germany) and decapitated. The brain stem was dissected out underice-cold dissection ringer (125 mM NaCl, 2.5 mM KCl, 1 mM MgCl2,0.1 mM CaCl2, 25 mM glucose, 1.25 mM NaH2PO4, 25 mMNaHCO3, 0.4 mM ascorbic acid, 3 mM myoinositol, 2 mM pyruvicacid; all chemicals from Sigma–Aldrich). Sections (200–250 �m)were cut with a vibratome (VT1000S, Leica, Wetzlar, Germany).Slices were transferred to an incubation chamber containing extracel-lular solution (ECS) (125 mM NaCl, 2.5 mM KCl, 1 mM MgCl2, 2mM CaCl2, 25 mM glucose, 1.25 mM NaH2PO4, 25 mM NaHCO3,0.4 mM ascorbic acid, 3 mM myoinositol, 2 mM pyruvic acid; allchemicals from Sigma–Aldrich) and bubbled with 5% CO2-95% O2.Slices were incubated for 1 h at 37°C, after which the chamber wasbrought to room temperature. Recordings were obtained within 4–5 hof slicing.
WHOLE CELL RECORDINGS. All recordings were performed at 36–37°C. After incubation, slices were transferred to a recording chamberand continuously superfused with ECS at 3–4 ml/min through agravity-fed perfusion system. MNTB neurons were viewed through aZeiss Axioskop 2 FS microscope equipped with DIC optics and a �40water-immersion objective (Zeiss, Oberkochen, Germany). Wholecell recordings were made with an EPC 10 double amplifier (HEKAInstruments, Lambrecht/Pfalz, Germany). Signals were filtered at5–10 kHz and subsequently digitized at 20–100 kHz using Patchmas-ter Version 2.02 software (HEKA). Uncompensated series resistance,between 5.5 and 15 M�, was compensated to values between 2.1 and5.8 M� with a lag time of 10 �s. Potential changes in series resistancewere monitored throughout the recordings and data collection wasdiscontinued whenever series resistance changed by �2 M�. Allvoltages are corrected for a �12-mV junction potential.
Patch pipettes were pulled from 1.2-mm borosilicate glass (WPI) or1.5-mm borosilicate glass (Harvard Instruments, Kent, UK) using a
Sutter P-97 electrode puller (Sutter Instrument, Novato, CA) or aDMZ Universal Puller (Zeitz Instruments, Munich, Germany). Pi-pettes were filled with potassium gluconate–based internal solutionfor current-clamp recordings (120 mM K-gluconate, 4 mM MgCl2, 10mM HEPES, 5 mM EGTA, 10 mM tris-phosphocreatine, 4 mMNa2-ATP, 0.3 mM tris-GTP, 0.5 mM CaCl2; all chemicals fromSigma–Aldrich) or cesium methanesulfonate–based solution for volt-age-clamp recordings (125 mM CsMeSO3, 4.5 mM MgCl2, 9 mMHEPES, 5 mM EGTA, 14 mM tris-phosphocreatine, 4 mM Na2-ATP,0.3 mM tris-GTP, 1.5 mM CaCl2, all chemicals from Sigma–Aldrich).
During all recordings, 500 nM strychnine hydrochloride (Sigma–Aldrich) and 20 �M SR95531 were added to the bath to blockglycinergic and GABAA-ergic inhibition, respectively. During volt-age-clamp recordings, 5 mM QX-314 (Alomone Labs, Jerusalem,Israel) was added to the pipette fill to eliminate sodium currents.
STIMULATION OF SYNAPTIC INPUTS. Synaptic currents were elicitedby midline stimulation of the calyceal input fiber bundle with a 5-M�bipolar stimulation electrode (matrix electrodes with 270-�m dis-tance; FHC, Bowdoinham, ME). Stimuli were 100-�s-long squarepulses of 10 to 40 V delivered with an STG 2004 computer-controlledfour-channel stimulator (Multi Channel Systems, Reutlingen, Ger-many) and a stimulation isolation unit (Iso-flex, AMPI, Jerusalem,Israel). The stimulator permitted completely independent uploadingand operation of the four channels, allowing the seamless integrationand thus true embedding of simulated auditory signals (i.e., high-frequency bursts) in the simulated spontaneous activity. Spontaneousactivity was simulated by using 20-, 40-, and 60-Hz Poisson-distrib-uted stimulus trains (see Figs. 1 and 2, C and E). Sound-evokedactivity was simulated by short trains consisting of 20 stimuli at 100,300, or 600 Hz.
CONDUCTANCE-CLAMP EXPERIMENTS. Excitatory conductanceswere simulated with an SM-1 amplifier (Cambridge Conductance,Cambridge, UK). The 10–90% rise of the current output in responseto a voltage change for this amplifier was 290 ns. Reversal potentialswere set to 0 mV for the excitatory postsynaptic conductances(EPSGs). The conductance waveforms used were previously recordedas EPSCs in voltage-clamp mode. After extrapolating the artifacts,EPSGs were normalized. All conductance values correspond to peakconductances. In experiments in which background leak was added, aconstant step command was fed from the computer into the conduc-tance-clamp amplifier by a separate channel and the reversal potentialfor this channel was set to �60 mV. The separately calculated outputof both channels was added together and fed to the HEKA amplifier.
STATISTICAL ANALYSIS. Data were analyzed in IGOR 5 (Wave-Metrics), MS Excel 2004 (Microsoft, Redmond, WA), and Matlab 7(The MathWorks). Unless otherwise noted, all errors are reported asstandard error. Statistical significance was tested with a Student’st-test, unless otherwise noted. Significant differences are marked witha single asterisk for values of P � 0.05 and with a double asterisk forP � 0.01.
R E S U L T S
In vivo spontaneous firing rates of MNTB cells
The first goal was to determine the spontaneous firing ratesof MNTB neurons in the intact brain of Mongolian gerbils(Meriones unguiculatus). Neural activity was recorded in vivofrom single cells in the MNTB with standard extracellularrecording techniques. When a neuron was encountered andisolated, its basic response features such as aurality, auditorythreshold, and frequency tuning were assessed. Among the 36neurons from which activity was recorded, thresholds forsound stimulation ranged from 0 to 60 dB SPL (mean � 32 �
809SYNAPTIC TRANSMISSION AT THE CALYX OF HELD
J Neurophysiol • VOL 98 • AUGUST 2007 • www.jn.org
by guest on August 7, 2016
http://jn.physiology.org/D
ownloaded from

2.8 dB SPL) and characteristic frequencies were between 486Hz and 16.8 kHz. Consistent with known input patterns to theMNTB, all neurons could be excited when sound was pre-sented to the ear contralateral to the recording site. None of theneurons showed any effects of ipsilateral stimulation.
After a neuron’s basic response properties to auditory stim-ulation were assessed, its spontaneous firing rate in the absenceof sound stimulation was measured over �50 s and averagedischarge rates were calculated and defined as the neuron’sspontaneous firing rate. Among the 36 neurons, spontaneousfiring rates ranged from 0.15 to 110 Hz (Fig. 2A). The meanspontaneous rate was 24.9 � 5.5 Hz. Short clips of spike trainsare shown in Fig. 2B. The spontaneous rates of these neuronswere 16, 40, and 69 Hz, respectively. An analysis of theinterspike intervals (ISIs) revealed that the spikes are near-Poisson distributed with the exception that very short ISIs (�1ms) are underrepresented (three ISI histograms in Fig. 2C).
Introducing spontaneous rates into slice preparations ofthe MNTB
Based on these in vivo data, three representative frequenciesof spontaneous rates were chosen for stimulation of the in vitrobrain slice preparations: 20, 40, and 60 Hz (Fig. 2D). Distri-bution of the spike events in each one of these trains waschosen to be near-Poisson, to imitate the in vivo spontaneousactivity as closely as possible (Fig. 2E). MNTB calyceal inputfibers were stimulated with these spike trains for prolongedperiods of time (�2 min) and voltage-clamp recordings wereperformed from MNTB principal neurons. During the 2-min
conditioning, 7,200 Poisson-distributed stimuli were presentedin case of the 60-Hz train, 4,800 stimuli in the case of the40-Hz train, and 2,400 stimuli in the case of the 20-Hzconditioning train.
Effects of “spontaneous” firing on excitatory synapticcurrents in the calyx of Held
At the beginning of each experiment, a synapse was “rested”or completely recovered, i.e., no stimuli had been given to theinput fibers for �5 min. During the 2-min conditioning periodwith Poisson-distributed activity, EPSCs depressed substan-tially with at least two exponential components. The threegraphs in Fig. 3, A–C show EPSC amplitudes of three differentneurons in response to 2-min conditioning stimuli at 20, 40,and 60 Hz (Fig. 3, A, B, and C, respectively). Each dot in thegraphs represents the amplitude of one EPSC and the solidlines represent double-exponential fits.
The initial EPSC amplitudes in the three examples werebetween about 5 and 9 nA, fairly typical values of rested calyxof Held/MNTB recordings in animals of this age group (e.g.,Taschenberger and von Gersdorff 2000; von Gersdorff andBorst 2002). We term this value the “initial amplitude” or“A0.” The synaptic current then depressed substantially duringthe first few events of the stimulus train (insets in Fig. 3, A–C,initial steep declines of amplitudes), then declined muchslower (later shallow decline of amplitudes), and then stabi-lized during the second half of the 2-min train to valuesbetween about 2 and 3 nA.
We were interested in these steady-state values measuredduring the second half of the conditioning period because
FIG. 2. A: distribution of spontaneous firing rates measured among our sample of 36 neurons. Each dot represents the average spontaneous firing rate of oneneuron. Mean spontaneous firing rate among the 36 neurons was 24.9 � 5.5 Hz. B and C: in vivo recordings of spontaneous activity from 3 MNTB neurons;clips of original trace (B); interspike interval (ISI) distribution (C). Although the spontaneous firing rates differed between the neurons and were 16, 40, and 69Hz, the ISI distribution could be described by a single-exponential curve, and thus was near-Poisson-distributed in each case. D and E: based on the results fromB and C, 3 stimulation protocols of simulating spontaneous activity in brain slices at 20, 40, and 60 Hz were created. ISI distribution was designed to benear-Poisson.
810 HERMANN, PECKA, VON GERSDORFF, GROTHE, AND KLUG
J Neurophysiol • VOL 98 • AUGUST 2007 • www.jn.org
by guest on August 7, 2016
http://jn.physiology.org/D
ownloaded from
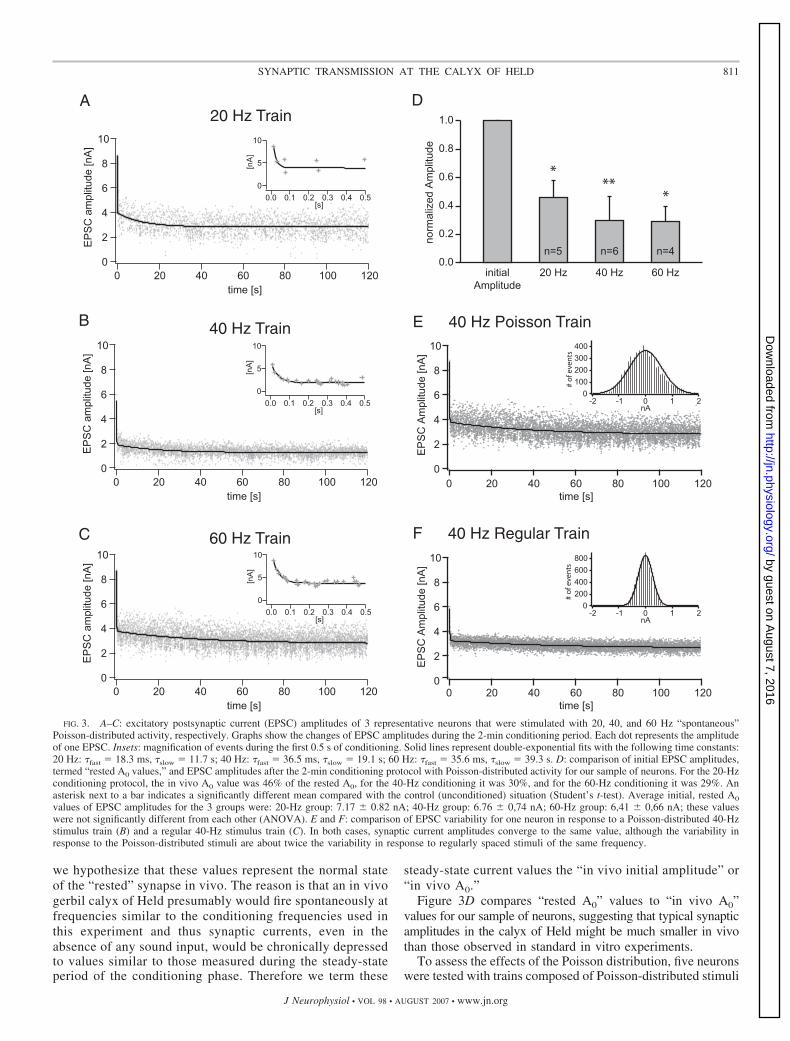
we hypothesize that these values represent the normal stateof the “rested” synapse in vivo. The reason is that an in vivogerbil calyx of Held presumably would fire spontaneously atfrequencies similar to the conditioning frequencies used inthis experiment and thus synaptic currents, even in theabsence of any sound input, would be chronically depressedto values similar to those measured during the steady-stateperiod of the conditioning phase. Therefore we term these
steady-state current values the “in vivo initial amplitude” or“in vivo A0.”
Figure 3D compares “rested A0” values to “in vivo A0”values for our sample of neurons, suggesting that typical synapticamplitudes in the calyx of Held might be much smaller in vivothan those observed in standard in vitro experiments.
To assess the effects of the Poisson distribution, five neuronswere tested with trains composed of Poisson-distributed stimuli
FIG. 3. A–C: excitatory postsynaptic current (EPSC) amplitudes of 3 representative neurons that were stimulated with 20, 40, and 60 Hz “spontaneous”Poisson-distributed activity, respectively. Graphs show the changes of EPSC amplitudes during the 2-min conditioning period. Each dot represents the amplitudeof one EPSC. Insets: magnification of events during the first 0.5 s of conditioning. Solid lines represent double-exponential fits with the following time constants:20 Hz: �fast � 18.3 ms, �slow � 11.7 s; 40 Hz: �fast � 36.5 ms, �slow � 19.1 s; 60 Hz: �fast � 35.6 ms, �slow � 39.3 s. D: comparison of initial EPSC amplitudes,termed “rested A0 values,” and EPSC amplitudes after the 2-min conditioning protocol with Poisson-distributed activity for our sample of neurons. For the 20-Hzconditioning protocol, the in vivo A0 value was 46% of the rested A0, for the 40-Hz conditioning it was 30%, and for the 60-Hz conditioning it was 29%. Anasterisk next to a bar indicates a significantly different mean compared with the control (unconditioned) situation (Student’s t-test). Average initial, rested A0
values of EPSC amplitudes for the 3 groups were: 20-Hz group: 7.17 � 0.82 nA; 40-Hz group: 6.76 � 0,74 nA; 60-Hz group: 6,41 � 0,66 nA; these valueswere not significantly different from each other (ANOVA). E and F: comparison of EPSC variability for one neuron in response to a Poisson-distributed 40-Hzstimulus train (B) and a regular 40-Hz stimulus train (C). In both cases, synaptic current amplitudes converge to the same value, although the variability inresponse to the Poisson-distributed stimuli are about twice the variability in response to regularly spaced stimuli of the same frequency.
811SYNAPTIC TRANSMISSION AT THE CALYX OF HELD
J Neurophysiol • VOL 98 • AUGUST 2007 • www.jn.org
by guest on August 7, 2016
http://jn.physiology.org/D
ownloaded from

versus trains with regularly spaced stimuli of identical frequen-cies. The type of stimulus train did not affect the time courseof synaptic depression or the value of the observed in vivo A0
(Fig. 3, E and F). The difference of A0 values within each pairwas not statistically different (t-test, P � 0.74). However, thevariability of synaptic currents was much larger in the case ofPoisson-distributed stimuli compared with evenly spaced stim-uli (Fig. 3, E and F, Gaussian curve insets). On average, thestandard deviation of synaptic currents was 0.04 when stimuliwith regularly spaced intervals were used. Presumably, onephysiological basis of this variability is the stochastic nature ofvesicle release. In contrast, the SD of current amplitudes was0.08 when stimuli were Poisson distributed. Most likely, thereason for this larger variability is the additional effect ofchanging interspike intervals, which is added to the variabilitycaused by stochastic release. However, note that the type ofstimulus train used does not appear to affect the final observedin vivo A0.
Effects of simulated tone bursts on “rested” versus“spontaneously” active synapses
Our next goal was to determine the effects of the “sponta-neous” activity on the processing of high-frequency trains bythe calyx of Held synapse. The high-frequency trains attemptto simulate simple sound-evoked activity, such as short tones.We tested trains of 20 pulses at 100, 300, and 600 Hz, whichsimulated pure tones of 200-, 67-, and 33-ms duration, respec-tively. Effects of each stimulus train were tested before theconditioning period, i.e., on the “rested” synapse, and thenafter the conditioning period while the simulated tone activitywas embedded in the “spontaneous activity,” and a third time�5 min after the “spontaneous” stimulation was stopped.Figure 4A (black trace) shows an EPSC train recorded inresponse to a 300-Hz, 20-pulse-stimulus train from a “rested”neuron. The synaptic current measured in response to the firstevent was about 6.9 nA. Subsequently, the synaptic currentdepressed during the stimulus train, such that the currentmeasured in response to stimulus number 20 was depressed to1.6 nA, i.e., the EPSC was now only 23% of the initial current.
After the synapse had been conditioned with “spontaneous”activity of 60 Hz, the synaptic current in response to the firststimulus of the same 300-Hz train was about 2.1 nA and thussubstantially lower than that in the “rested” condition (Fig. 4B,first event). More interestingly, the relative depression inducedby the 300-Hz train was substantially less than it was undercontrol conditions, such that the synaptic current at stimulusnumber 20 was still about 1.1 nA. Therefore in the precondi-tioned synapse, the current was depressed to only 54% of thevalue of the first stimulus in the train, suggesting that thedegree of relative synaptic depression under in vivo conditionsmight be substantially smaller than that measured by in vitrorecordings from “rested” synapses.
Afterward the cell was allowed to recover for 5 min (i.e., itreceived no stimulation) and the synaptic amplitudes anddepression ratios recovered to preconditioning values (Fig. 4A,gray trace), suggesting that the observed effects shown in Fig.4B are reversible and specific and cannot be attributed tosynaptic rundown or other damaging effects of the intensestimulation protocol.
Synaptic amplitudes in response to the first and last events ofthe various 20-pulse-test trains are shown in Fig. 4C. For eachgroup of bars, the amplitude of the first event (dark gray bar)is compared with the amplitude of the 20th event after a 100-,
FIG. 4. A and B: responses of one neuron to the same 300-Hz, 20-pulsestimulus train before conditioning with spontaneous activity (A, black line),whereas the 300-Hz train was embedded in 60-Hz spontaneous activity (B),and about 5 min after the “spontaneous” activity was ended (A, gray line). C:absolute EPSC amplitudes with various conditioning and test frequencies.Trains of 100, 300, and 600 Hz were tested with 20 stimuli in the trains in eachcase. Dark bars labeled “initial amplitude” refer to the EPSC amplitude of thefirst event of a train (similar for 100-, 300-, and 600-Hz stimulus trains),whereas the bars labeled “after 100/300/600 Hz” refer to the amplitude of the20th event in the train of the respective frequency. Numbers in the bars indicatesample size. D: ratios of synaptic current amplitudes in response to the laststimulus over the current of the synaptic response to the first stimulus of the20-pulse trains. Low ratios indicate substantial relative depression during the20-pulse-stimulus trains, whereas high ratios indicate low relative synapticdepression. Numbers in the bars indicate sample size. An asterisk next to a barindicates a significantly different mean compared with the respective control(� unconditioned) condition, which is shown by the same color bar in thegroup “none” (Student’s t-test).
812 HERMANN, PECKA, VON GERSDORFF, GROTHE, AND KLUG
J Neurophysiol • VOL 98 • AUGUST 2007 • www.jn.org
by guest on August 7, 2016
http://jn.physiology.org/D
ownloaded from

300-, and 600-Hz stimulus train. Note that the difference inamplitudes between event 1 and event 20 is greatest in uncon-ditioned synapses and smallest in synapses that have beenconditioned with 60 Hz of Poisson activity.
Figure 4D shows the amount of relative synaptic depressioninduced by the various 20-pulse trains. The bars represent theratio of the 20th over the first postsynaptic current amplitude ofthe train; i.e., small values indicate that at event 20 only a smallportion of the initial synaptic current was measured and there-fore synaptic depression caused by the train was substantial.High values indicate that the high-frequency trains induced amuch smaller amount of relative depression because the cur-rent measured at event 20 of the train was more similar to theinitial current.
Overall, the 100-Hz trains induced the lowest amount ofsynaptic depression (dark gray bars) and the 600-Hz trains thehighest amount (white bars). More interestingly, the samehigh-frequency train induced a much smaller amount of rela-tive depression when the synapse was previously conditionedwith spontaneous activity. In all cases the high-frequencytrains induced a significantly smaller amount of relative syn-aptic depression when the synapses were previously condi-tioned with “spontaneous activity.”
Recovery of firing is very fast under in vivo–like conditions
Our next goal was to determine the recovery from synapticdepression in “spontaneously active” synapses. Recovery fromdepression is a critical property, especially in highly activeauditory brain stem synapses, because the speed of recoverydetermines how well the neuron can respond to acoustic eventsthat occur shortly after the first event. We first measured therecovery of firing patterns of MNTB neurons in vivo (Fig. 5A).Two identical tone bursts of 200-ms duration were presented tosingle MNTB units with a variable pause between them. Thefirst tone burst elicited a certain firing rate and firing pattern inthe neuron. When the second, identical tone burst was pre-sented after only a very short pause, it elicited a lower responserate in the neuron, which was most apparent during the onsetportion of the response (Fig. 5A, top). As the pause between thetwo tones was increased, neural responses to the second tonerecovered progressively and at some point resembled the re-sponses measured to the first tone (Fig. 5A, bottom). The invivo recovery time course of six MNTB neurons is plotted inFig. 5B. Among these six neurons, the average in vivo recoverytime constant was 82 � 23 ms, suggesting that recovery ofneural responses in the MNTB to acoustic stimuli in vivo istypically very short.
This finding raises a dilemma because recovery from syn-aptic depression has been measured in the calyx of Held invitro, with very different results. In these experiments, thepresynaptic vesicle pool was depleted, either with a depletinghigh-frequency stimulus or by voltage clamping the presynap-tic terminal to a positive potential. After this pool depletion,test stimuli were given at distinct time intervals to assess thedegree of recovery. These experiments typically found recov-ery time constants at the order of several seconds, not milli-seconds (e.g., von Gersdorff et al. 1997; Wang and Kaczmarek1998).
The in vivo data and the in vitro data are not directlycomparable because of additional recoveries at the level of the
hair cells, auditory nerve (e.g., Spassova et al. 2004), andcochlear nucleus, as well as potential effects of inhibition.However, the in vivo recovery shown in Fig. 5B has to presentan upper limit for the vesicular recovery at the level of thecalyx of Held because the calyx of Held is one element of thenetwork tested with the in vivo experiment. Therefore the invivo data suggest that recovery from synaptic depression at thecalyx of Held should occur with time constants of no longerthan about 80 ms.
FIG. 5. A: poststimulus time histograms of a single MNTB neuron’s in vivoresponses to 2 identical best frequency (BF) tone bursts of 200-ms durationwith varying ISIs. As the ISI was increased, the neuron’s responses to thesecond tone recovered back to a point where the responses to the second tonewere comparable to the neuron’s firing pattern in response to the first tone.Tones were presented at 1,200 Hz and 30 dB above threshold. Firing frequen-cies in response to the first tone were about 260 Hz for the onset response only(� first 15 ms) and about 80 Hz for the sustained part of the response. For thesecond tone, the onset response varied between 90 and 260 Hz (10- and 73-ms ISI,respectively), whereas the sustained part varied between 52 and 72 Hz (10- and73-ms ISI, respectively). B: time constants of in vivo recovery of firing of 6single MNTB units. Neuron presented in A is indicated by the bold black line.
813SYNAPTIC TRANSMISSION AT THE CALYX OF HELD
J Neurophysiol • VOL 98 • AUGUST 2007 • www.jn.org
by guest on August 7, 2016
http://jn.physiology.org/D
ownloaded from

Recovery from depression is very fast in spontaneouslyactive synapses
To test this, we measured recovery from depression in vitro.Recovery time constants were determined initially in uncondi-tioned neurons by depleting the vesicle pool with a high-frequency train, then allowing the synapse to recover for aspecified amount of time, and finally measuring the relativeamplitude of a test EPSC. An example of a synapse in whichthe time course of recovery was determined with this methodis shown in Fig. 6, A and B. Figure 6A shows data points on amagnified time axis, following a recovery time course that wasbest described with an exponential that had a time constant of72 ms. The average fast time constant of our sample of neuronswas 87 � 16 ms. However, the fast time constant accounted foronly about half of the recovery. Complete recovery to therested A0 value could best be described with double-exponen-tial fits (Fig. 6B). The slow time constant of the same synapseshown in Fig. 6A was 1.84 s (Fig. 6B), whereas the averageslow time constant of our sample of neurons was 1.59 � 0.17 s.In each case tested, the two time constants together couldaccount for the complete amplitude of the rested A0 value.
Because of the nature of the experimental protocol, recoveryfrom depression could not be measured in conditioned syn-apses with the same method as used earlier because therequired time intervals (up to several seconds) would be farlonger than the amount of time that a neuron is nonactiveduring “spontaneous activity”. Therefore the time course ofrecovery in conditioned neurons was measured by fitting anexponential function to the time course of EPSC amplitude
recovery as a function of the preceding interpulse interval. Thevarious interpulse intervals, which inherently occur during aPoisson-distribution of spikes, yield a suitable range of timeperiods to measure the fast recovery time constant. When thiswas done, we found fast time constants very similar to thosefound in unconditioned synapses. Figure 6C shows an exampleof a cell in which recovery from depression was measured withthe described method. For events where the test stimulusfollowed shortly after a previous stimulus, the EPSC amplitudeof the test EPSC was small. As the time interval before the teststimulus increased, the amplitude of the EPSC progressivelyincreased, presumably as a result of recovery from depression.For this synapse, the time constant of recovery from depressionwas 74 ms. The average recovery time constant for our sampleof neurons was 90 � 15 ms. As for the unconditioned synapse,the relative contribution of the fast time constant to overallrecovery accounted for about half of the rested A0 amplitude.Therefore we assume that the (missing) slow component ofrecovery in conditioned synapses might be similar to that ofunconditioned synapses, although we were unable to measurethis parameter for the reason described earlier.
The fast recovery time constants of both unconditionedand conditioned synapses are very similar to the recoverytime constants measured in vivo shown in Fig. 5, suggestingthat recovery from activity in the calyx of Held occurs at atime course similar to that of the recovery of other compo-nents of the circuit. Although we also found a slow compo-nent of recovery that was in a range similar to that describedpreviously by other groups, our in vivo data suggest that the
FIG. 6. A and B: recovery from depression in unconditioned synapses. Data were obtained with a protocol that depletes the vesicle pool with a 300-Hz,20-pulse-stimulus train, followed by a pause of variable time to allow for pool refilling, followed by a test stimulus. Amplitudes plotted in graphs refer to theamplitudes measured in response to the test stimulus. Recovery could be best described with double-exponential fits that had fast time constants of 87 � 16 msand slow time constants of 1.59 � 0.17 s. C: recovery from depression in conditioned synapses. In contrast to A and B, recovery was assessed by analyzing thevariable ISIs inherently contained in the Poisson-distributed trains. Only the fast component was measured here and was found to be very similar to the fastcomponent of unconditioned synapses. D: illustration of recovery from depression in active synapses, which happens within milliseconds. In vivo A0 point isindicated at time � 0; the amplitude of the bar is based on data in Fig. 3D. This amplitude represents the state of a synapse after it has been conditioned witha 60-Hz Poisson train for several minutes, but has not received a high-frequency stimulation. Presumably, this situation compares to the state of a synapse inan intact brain, while the animal is not receiving sound stimulation. Typical values for synaptic currents after 100-, 300-, and 600-Hz 20-pulse stimulus trainsare presented in the graph. These amplitudes presumably compare to the state of a synapse after a short tone burst has just been played to the animal. Naturally,synaptic amplitudes are lower than those in the in vivo A0 state, as a result of the recent high-frequency activity. Position of the bars along the x-axis is chosensuch that the respective amplitudes correspond to the value of the exponential curve at the same time. Time of recovery indicates the time it would take for thesynapse to recover in vivo from one of the mentioned 20-pulse-stimulus trains back to the in vivo A0 point. Time constant of exponential � 90 ms, correspondingto the average value presented in Fig. 6C; values of bars correspond to last group of bars in Fig. 4C.
814 HERMANN, PECKA, VON GERSDORFF, GROTHE, AND KLUG
J Neurophysiol • VOL 98 • AUGUST 2007 • www.jn.org
by guest on August 7, 2016
http://jn.physiology.org/D
ownloaded from

short time constant might be the dominant one for in vivorecovery.
This point is further illustrated in Fig. 6D. The general ideaof this cartoon is that recovery in vivo does not proceed up tothe point of a completely full pool, i.e., the rested A0 seen insilenced synapses in brain slices. Rather, in vivo, recovery ofthe calyx progresses up to the in vivo A0, the value of synapticcurrent that is typically available to a spontaneously active andthus chronically depressed synapse for the processing of high-frequency sound stimuli. The graph in Fig. 6D plots a typicalexponential time course of recovery with a time constant of 90ms, as determined earlier. The typical “in vivo A0” point of asynapse, which is spontaneously active at 60 Hz withoutacoustic input, is marked at time 0 (value � 29% of the restedA0; see Fig. 3D). When the synapse now processes a tone burstof 20 pulses at 100, 300, or 600 Hz, the synaptic amplitudedepresses even further, typically to the values indicated by therespective bars (values of amplitudes based on data from Fig.4D). At the end of the tone burst, the synapse recovers back tothe in vivo A0 value, which takes longer or less long, depend-ing on the frequency of the tested stimulus and the resultingdepression. In this example, which assumes an exponentialtime course of 90 ms for vesicle pool refilling, the recovery ofthe synapse back to the in vivo A0 point would take between 25and 74 ms. In other words, a spontaneously active synapsemight need only 25–74 ms to recover from a high-frequencysound input because the synapse is chronically depressed bythe spontaneous activity and thus recovers only partially backto the steady-state level.
Reduced synaptic reliability in active calyces
The data presented so far suggest that synaptic currentsproduced by the calyx of Held under simulated in vivo condi-tions are considerably smaller than those typically measured invitro in “rested” or silent brain slices. The very large synapticcurrents produced by rested calyces in older animals are knownto bring postsynaptic neurons well above threshold for firingand thus allow for secure synaptic transmission (e.g., Taschen-berger and von Gersdorff 2000). In light of the synapticcurrents seen under the simulated in vivo conditions, presentedearlier, we next asked the question whether these reducedcurrents are still suitable for fail-safe synaptic transmission.
This question was addressed with three different techniques.First, current-clamp data were obtained from MNTB neurons,whereas the calyceal fiber bundle was stimulated, with stimu-lation protocols equivalent to those used for the voltage-clampexperiments shown earlier. Figure 7A shows the firing patternof a representative neuron in response to a 300-Hz, 20-pulse-stimulus train. Consistent with previous reports, the neuronresponded faithfully to the 300-Hz train—i.e., it fired oneaction potential in response to each synaptic event—when theslice was rested. However, after the neuron was conditionedwith 60 Hz of “spontaneous activity” as described earlier, thesame 300-Hz stimulus train elicited a substantial number ofsynaptic failures (Fig. 7B). For those events where the neuronfailed to fire an action potential, a small excitatory postsynapticpotential (EPSP) could be observed in the voltage trace, sug-gesting that the calyx of Held fired an action potential andproduced a synaptic current in response to the stimulus. How-ever, the synaptic current appears to have been subthreshold.
The probability of a failure to occur increased with the numberof the event in the 20-pulse train. Events early in the train wereless likely to fail than events in the latter part of the stimulustrain.
Among our sample of neurons tested with this method, weobserved some variability in the number of failures as well asother response characteristics. For example, some neuronsshowed fewer failures, whereas others showed a higher num-ber. Also, in some neurons stimulation of the fiber pathwaywith 300 Hz resulted in a small plateau from which actionpotentials to the stimuli were fired (Fig. 7A), whereas theplateau was absent in other neurons. Also, we observed somevariation in the height of the action potential. Differences inchannel complement or best frequency to which the neuronwas tuned might account for this variability.
For our sample of neurons, the probability of a postsynapticspike was tested as a function of the position of the event in thetrain. Firing probability was defined as the number of spikesfired in response to a given stimulus in the train over thenumber of repetitions presented. In the unconditioned synapse,the firing probability was almost 100% throughout the 300-Hzstimulus train; very few failures occurred toward the end of thestimulus train (Fig. 7H, black dotted line and open circles, n �5). However, when synapses were conditioned with 60 Hz ofspontaneous activity, the number of failures during the 300-Hztrain increased (Fig. 7H, black solid line and closed circles,n � 5). In most cases, postsynaptic neurons still answeredreliably during the initial three or four events of the train,although the reliability declined afterward.
The reliability of synaptic transmission was also tested withconductance-clamp recordings. The advantage of conductanceclamp was twofold: First, this method does not rely on thepresynaptic axons and the calyx to follow the intense stimula-tion protocol. Therefore synaptic failures arising from axonalfailures can be ruled out more reliably than with the techniquepresented earlier. Second, conductance clamp offers the pos-sibility of combining simulated synaptic currents with addedbackground leaks to reduce the neuron’s input resistance (seefollowing text). In our recordings, EPSG waveforms derivedfrom 300-Hz EPSC trains were used to simulate calycealsynaptic currents in response to a 300-Hz stimulus train. Twowaveforms were used in these experiments: a 300-Hz, 20-pulseEPSG waveform that simulated synaptic currents of a restedcalyx (Fig. 7C, bottom) and an EPSG waveform that simulatedthe response of a calyx to the same stimulus train embedded inspontaneous activity (Fig. 7D, bottom). Both waveforms werepreviously recorded as EPSC waveforms from an MNTBneuron under voltage-clamp conditions, while electricallystimulating the input fibers to the calyx. The waveforms werechosen to reflect the observation that peak EPSC currents arelarger in rested than in conditioned synapses (Fig. 3D) and thatsynaptic depression within a high-frequency train is reduced inactive synapses (Fig. 4, A and B). Conductance-clamp record-ings with these two waveforms were performed on sevenMNTB neurons. The neurons reliably fired action potentialswhen excitatory synaptic currents typical for a rested calyxwere injected (Fig. 7C, top). In the rare case that failures couldbe observed, they occurred toward the end of the train (Fig. 7H,red dotted line and open squares, n � 7). However, whencurrents typical for a spontaneously active synapse were used,failures in the neuron’s response to the 300-Hz, 20-pulse EPSG
815SYNAPTIC TRANSMISSION AT THE CALYX OF HELD
J Neurophysiol • VOL 98 • AUGUST 2007 • www.jn.org
by guest on August 7, 2016
http://jn.physiology.org/D
ownloaded from

A B
C D
E
F
G
H
FIG. 7. Reliability of synaptic transmission in spontaneously active synapses. A: current-clamp recording of MNTB neuron while the calyceal input fiberswere stimulated with a 300-Hz, 20-pulse train; the neuron responded to each stimulation with one action potential. B: after the slice was conditioned with 60Hz of spontaneous activity, a number of failures could be observed during the same 300-Hz train. For each failure, an excitatory postsynaptic potential can beobserved in the place of the missing action potential, suggesting that the failure was postsynaptic. C, top: responses of MNTB neuron when a 300-Hz conductancewaveform was used to simulate currents of a rested synapse; the neuron responded to each event with one action potential, similar to that observed when thecalyceal fibers were stimulated. Conductance waveform is shown in the bottom panel. Peak conductance was 232 nS. D, top: responses of MNTB neuron whena 300-Hz conductance waveform was used to simulate currents of a synapse that was conditioned with 60 Hz of spontaneous activity; the neuron failed to respondto a number of events. Corresponding conductance waveform is shown in the bottom panel. Peak conductance was 56 nS. E: various levels of background leakwere added to the EPSG waveforms under conductance-clamp conditions, effectively reducing the input resistance of the neurons to values that are closer to inputresistances observed in neurons under in vivo conditions. F and G: example of a loose-patch recording of a MNTB neuron while calyceal input fibers were
816 HERMANN, PECKA, VON GERSDORFF, GROTHE, AND KLUG
J Neurophysiol • VOL 98 • AUGUST 2007 • www.jn.org
by guest on August 7, 2016
http://jn.physiology.org/D
ownloaded from

train could be observed (Fig. 7D, top). These failures tended tooccur more frequently toward the end of the EPSG waveform,but could sometimes also be observed early in the train (Fig.7H, red solid line and closed squares, n � 7).
Interestingly, the firing probabilities and frequencies forconditioned synapses shown in Fig. 7E closely match thoseobserved in vivo. For both current-clamp and conductance-clamp experiments, the firing probability of the first few eventsin the train was 0.7 to 1.0, based on the calculation methoddescribed earlier. For a train frequency of 300 Hz, this corre-sponds to a firing frequency of about 200 to 300 Hz. The onsetportion of the in vivo spike trains shown in Fig. 5A had a firingfrequency of about 260 Hz (considered is the response to firsttone of the pair only). The average firing frequency of theneuron in response to the latter part of the 200-ms tone wasabout 80 Hz. This corresponds well to the in vitro data shownin Fig. 7E, where the firing probability of the neuron to thelatter portion of the train is about 1/3, i.e., about 100 Hz.
A number of studies have observed that a neuron’s inputresistance is substantially higher in brain slices than in theintact brain (e.g., Bernander et al. 1991; Pare et al. 1998). Themain reason for this observation is probably that neurons in theintact brain receive a large number and variety of synapticinputs. When these inputs are activated at different points intime, postsynaptic receptors open and thus decrease the neu-ron’s input resistance. In brain slices, many of these inputs aresilent and/or cut, with the result that the neuron’s input resis-tance increases. It is unknown whether and how much the inputresistance of an MNTB neuron differs in brain slices comparedwith the intact brain because the projection pattern to MNTBneurons is much simpler than in the case of, say, corticalneurons. However, prominent glycinergic inhibition to MNTBhas been described in vitro (Awatramani et al. 2004). Theseinputs, when activated, will decrease the input resistance ofpostsynaptic neurons. An artificially high-input resistance inneurons of MNTB brain slices would facilitate the neuron’sresponses to synaptic events. In this case, the synaptic failuresshown in Fig. 7, A–E would be an underestimate of the true invivo failure rates. We attempted to address this issue by addinga background leak to MNTB neurons during presentation of theEPSG waveforms. The background leak had a constant ampli-tude of 10–90 nS with a reversal potential of �60 mV andeffectively reduced the input resistance of the postsynapticneuron up to fivefold. Figure 7F shows the overall firingprobability of six MNTB neurons, when EPSG waveforms of300-Hz trains plus various amounts of background leak weretested. As expected, the firing probability decreased with in-creasing background leak, although the effect was minor.
The last approach to test the reliability of synaptic transmis-sion was to use “loose-patch” extracellular recordings. Forthese experiments, an MNTB neuron in a brain slice was only
loosely patched without obtaining a gigaseal and no break-ininto the neuron was performed, such that the recordings wereeffectively extracellular. In some recordings, action potentialsof both the calyx of Held (termed “prepotential”) and thepostsynaptic principal neuron could be observed. An exampleis shown in Fig. 7, F and G. In this recording, stimulation of thecalyceal input fibers produced three peaks in response to eachevent. The first one was the stimulation artifact (labeled “arti-fact”), followed by the prepotential (labeled “pre”), and thenfollowed by the postsynaptic action potential (labeled “post”).The advantage of this method is that the interior environmentof the postsynaptic cell is left undisturbed. For whole cellrecordings, a common concern is that the perfusion of theneuron with artificial intracellular fluid might change the firingproperties of the neuron, which would result in inaccuratemeasurements of failure rates. However, even when thepostsynaptic neuron was left intact, transmission failures couldbe observed in the calyx of Held synapse when the slice wasdriven at in vivo–type activity levels. Figure 7F shows aloose-patch recording of a rested brain slice. Consistent withthe data shown earlier, the synapse was appreciably fail-safewhen a 300-Hz, 20-pulse train was tested, i.e., each prepoten-tial was followed by a postsynaptic action potential (Fig. 7F).However, when the slice was conditioned with 60-Hz sponta-neous activity, a substantial amount of failures could be ob-served in response to the same 300-Hz test train (Fig. 7G;postsynaptic failures are indicated by single asterisks). In onecase, neither a prepotential nor a postpotential could be ob-served (marked by a double asterisk), suggesting that for thisevent, the failure must have occurred in the calyceal input fiber.The blue lines in Fig. 7H show the average reliability oftransmission measured with this technique (blue dotted lineand open diamonds: unconditioned synapses, n � 6; blue solidline and closed diamonds: conditioned synapses, n � 6).
Furthermore, the latency of synaptic transmission was in-creased when synapses were spontaneously active (Fig. 7, Fand G). In this cell, the synaptic latency increased by 0.19 mswhen the synapse was conditioned. For all 11 neurons fromwhich spike-latency data were available, the average latencyincrease was 0.4 � 0.13 ms. This discrepancy matches wellwith the discrepancy between published values for in vitrosynaptic latency (Taschenberger et al. 2002; von Gersdorff andBorst 2002) versus in vivo latency (Guinan and Li 1990;Kopp-Scheinpflug et al. 2003) at the calyx of Held. These datasuggest that highly active calyces have a longer synapticlatency than previously reported in vitro, but also that ourconditioning protocol might be suited to transform calyces intoa functional state that more closely resembles the functionalstate of an active in vivo calyx of Held.
In summary, the data presented in Fig. 7 suggest that thecalyx of Held synapse shows a substantial amount of synaptic
stimulated. In loose patch recordings, no gigaseal is formed and no break-in into the cell is performed. Because the recording is effectively extracellular, theinternal environment of the postsynaptic cell is undisturbed. Even under these conditions, MNTB neurons exhibited a substantial number of failures in responseto a 300-Hz train, when the slice was conditioned with 60 Hz of spontaneous activity. Artifact � stimulation artifact; pre � prepotential � presynaptic actionpotential; post � postsynaptic action potential. Postsynaptic failures are indicated by a single asterisk. For one event, neither a prepotential nor a postpotentialcould be observed (double asterisk), suggesting an axonal failure for that event. H: firing probability as a function of the number of the event in the 20-pulsetrain. Black graphs with circular symbols represent data from 5 neurons tested with current clamp as described in A and B. Red graphs with squared symbolsrepresent data from 7 neurons tested under conductance clamp conditions, as described in C and D. Blue graphs with diamond symbols represent data from 6neurons tested with extracellular, loose-patch recordings. For all experimental methods, few failures could be observed under conditions that correspond to arested synapse, and occurred toward the end of the 20-pulse train (open symbols and dotted lines). However, for situations that correspond to a spontaneouslyactive synapse, the same 300-Hz trains elicited a substantial number of failures (solid symbols and solid lines). Firing probability of a given neuron was definedas the ratio of number of action potentials per 3 stimulations. Presented in graph are average firing probabilities of 5–7 neurons per method, as described earlier.
817SYNAPTIC TRANSMISSION AT THE CALYX OF HELD
J Neurophysiol • VOL 98 • AUGUST 2007 • www.jn.org
by guest on August 7, 2016
http://jn.physiology.org/D
ownloaded from

failures, after cells were stimulated for several minutes withPoisson-distributed activity. One possible interpretation ofthese results is that in vivo, the MNTB might not be the simpleand reliable relay that is commonly observed under standard invitro conditions.
D I S C U S S I O N
The main question addressed in this study is the question ofhow synaptic transmission in the calyx of Held synapsechanges when synapses are stimulated for prolonged periods oftime with Poisson-distributed activity, which, we hypothesize,imitates naturally occurring spontaneous activity. There arefour main findings. First, the introduction of “spontaneous”activity into in vitro preparations of the calyx of Held consid-erably depresses synaptic currents, even at relatively lowspontaneous frequencies of 20 Hz. Second, in these “sponta-neously active” synapses, the degree of additional depressioninduced by high-frequency trains (i.e., simulated sound inputs)is reduced considerably. Third, recovery from synaptic depres-sion is very fast. Data from corresponding in vivo extracellularrecordings also show fast recovery of firing and are consistentwith these in vitro findings. Fourth, in chronically activesynapses with reduced synaptic currents, the reliability oftransmission is reduced during high-frequency bursts of affer-ent input.
Background firing in MNTB neurons
Spontaneous activity in the lower auditory system is awidespread phenomenon. It is assumed that this activity isexplained by the probabilistic behavior of the transductionchannels of the inner hair cells and the resulting chronictransmitter release at the hair cell synapse. The spontaneousactivity is still present at the level of the cochlear nucleus(Brownell 1975; Goldberg and Brownell 1973; Joris et al.1994; Schwarz and Puil 1997; Spirou et al. 1990, 2005) andmost auditory brain stem nuclei, such as MSO in bats (Grothe1994), MNTB in cats (Smith et al. 1998), MNTB in gerbils(Kopp-Scheinpflug et al. 2003), and MNTB in rats (Sommer etal. 1993). Consistent with our data presented here, studies ofspontaneous activity in the lower auditory system typicallyreport a large variability of rates among neurons, even withinthe same species or the same nucleus. One possible explanationfor this large variability is that different neurons receive inputsfrom different classes of auditory nerve fibers with low, me-dium, or high spontaneous rates (Liberman 1978), whichwould give rise to auditory brain stem neurons with verydiverse spontaneous firing rates.
For the experiments presented here, three frequencies ofPoisson-distributed activity were chosen for stimulation ofbrain slices: 20, 40, and 60 Hz. Although the mean spontane-ous firing rate in our sample of neurons was 24.9 Hz and thuscloser to the lowest of these frequencies, the three frequencieschosen for stimulation successfully cover the spectrum ofobserved in vivo spontaneous rates (see Fig. 2A; see alsoKopp-Scheinpflug et al. 2003). However, because of the natureof the brain slice preparation, the original in vivo spontaneousfiring rate of a given neuron is unknown. Therefore it ispossible or even likely that an originally low spontaneouslyactive neuron was stimulated with a high-frequency stimulus
train and vice versa. However, all neurons in our in vitrosample responded stereotypically and in a very similar fashionto our various stimulus protocols and no responses wereobserved that could be explained by the use of an inappropriatebackground stimulation rate.
Measurements of spontaneous activity presented in thisstudy were performed under anesthesia. As with almost everytype of anesthesia, the ketamine–xylazine mixture used in thisstudy might have depressed the neurons’ spontaneous activityto a certain degree (Destexhe et al. 2003). Therefore the actualspontaneous firing rates in MNTB neurons of behaving gerbilsmight be higher than those shown in this study. On the otherhand, the values for spontaneous activity determined herematch closely with findings of other studies using variousspecies and various types of anesthesia or, in some cases, noanesthesia at all (e.g., Irvine 1992; Kiang 1965; Ryan andMiller 1978). We therefore conclude that the values presentedhere are representative or, at worst, a conservative lower limitof the true effects induced by spontaneous activity.
We also note that double-walled sound-attenuated rooms bythemselves create the biologically unnatural situation of com-plete absence of sound. Natural auditory environments alwayscontain a certain level of background noise, which contributesto the background activity of auditory neurons. Therefore theeffects of chronic activity on synaptic transmission in behavinganimals might be even larger, but are not likely to be smallerthan presented here.
Prolonged spontaneous spiking changes properties ofsynaptic transmission
Our data show that prolonged stimulation even at a fre-quency of 20 Hz decreases synaptic currents to less than half ofthe original value, whereas stimulation with frequencies of 60Hz reduces currents to about one third. It might be surprisingto find that such low frequencies cause such a high degree ofdepression because all brain slices were prepared from animalswell past the onset of hearing and recordings were performedat physiological temperature. �-Amino-3-hydroxy-5-methyl-4-isoxazolepropionic acid (AMPA) receptor desensitization aswell as N-methyl-D-aspartate (NMDA) currents, although play-ing a substantial role in preparations from young animals(Neher and Sakaba 2001; Sakaba and Neher 2001), play onlya very minor role in animals past the age of hearing onset(Futai et al. 2001; Renden et al. 2005; Taschenberger et al.2005). Under these conditions, MNTB neurons can followstimulation frequencies of �600 Hz for at least short periods(Futai et al. 2001; Taschenberger and von Gersdorff 2000; Wuand Kelly 1993). The depression we observed in response tolong-term stimulation progressed with at least two time con-stants: an initial, fast time constant, which can be seen duringthe first few stimulus pulses, and a much slower time constant.The mechanisms for the slow time constant are unclear, but arelikely to be multiple and will be studied in the future. When theprocessing of high-frequency trains was tested in rested versusspontaneously active synapses, the observed relative degree ofsynaptic depression caused by the high-frequency train wasmuch larger in the rested than in the active synapse. This mighthave important functional implications at the calyx of Held,which sustains high levels of activity.
818 HERMANN, PECKA, VON GERSDORFF, GROTHE, AND KLUG
J Neurophysiol • VOL 98 • AUGUST 2007 • www.jn.org
by guest on August 7, 2016
http://jn.physiology.org/D
ownloaded from

Our findings also suggest that recovery from synaptic de-pression is very fast under biologically relevant activity levels.These time constants of about 90 ms are an order of magnitudeshorter than previously reported values for rested synapses,which are in the range of several seconds (e.g., von Gersdorffet al. 1997: 4.2 s; see also Ishikawa and Takahashi 2001;Schneggenburger et al. 2002; Wang and Kaczmarek 1998; Wuand Borst 1999). Age, temperature, and species differencesmight account for some of this discrepancy. However, there isstrong evidence suggesting that calcium accumulation in thepresynaptic terminal through high-frequency firing may play arole in speeding up the recovery from depression (Wang andKaczmarek 1998). It appears that this faster recovery plays adominant role in active synapses.
Reliability of synaptic transmission
In vitro studies of the calyx of Held in animals past hearingonset have reported very reliable synaptic transmission and anumber of cellular specializations to increase synaptic reliabil-ity. Our data are consistent with the view that “rested” calycesproduce large synaptic currents and have a high transmissionreliability. However, we show that in chronically active syn-apses, the synaptic currents are much smaller. Our current-clamp, conductance-clamp, and extracellular action potentialrecordings all suggest that spontaneously active synapses mayshow synaptic failures during periods of high-frequency activ-ity. Therefore the calyx of Held may not always show thereliable 1:1 transmission postulated from in vitro experimentsin rested synapses. This finding is consistent with previous invivo results from the MNTB. Among the in vivo studiesperformed in the MNTB only those where both presynaptic andpostsynaptic activity have been recorded simultaneously canaddress the question of transmission failures at the calyx ofHeld synapse. To our knowledge, two studies report simulta-neous pre- and postsynaptic recordings at the MNTB and bothagree on the occurrence of postsynaptic failures (Guinan and Li1990; Kopp-Scheinpflug et al. 2003) in vivo. However, the twostudies differ in the number of failures observed. Guinan andLi (1990) found failures mainly with prolonged high-frequencystimulation of the afferent fiber bundle and only occasionallywith sound stimulation, whereas Kopp-Scheinpflug et al.(2003) found a substantial number of failures with soundstimulation. Species differences might account for some of thisdiscrepancy, but note that these recordings were performedwith intact synaptic inhibition and under anesthesia. BecauseMNTB neurons are known to receive a substantial amount ofglycinergic inhibition (Awatramani et al. 2004), it is possiblethat some of these failures are the result of spike suppressionby inhibition and that some of the difference observed in thetwo studies arises from differential recruitment of synapticinhibition. Nevertheless, the presence of synaptic inhibitionalone also questions the interpretation of the calyx of Held asa fail-safe “relay” synapse. This view has been formed byprevious in vitro studies performed in slices from animals pasthearing onset, where EPSCs well above action potential thresh-old have been measured even in response to stimulus frequen-cies of several hundred Hertz. However, these stimulus trainstypically consisted of no more than 20–50 stimuli, with con-siderable recovery time of several seconds between trials. Ourexperimental setup avoided these periods of silence because
they do not occur under in vivo conditions. Presumably thelack of prolonged periods of recovery keeps calyces in achronic state of synaptic depression and causes transmission tofail during periods of embedded high-frequency activity.
In conclusion, the aim of this study was to perform a firstdescription of the effects of prolonged “spontaneous activity”on synaptic transmission at the calyx of Held synapse. Weconclude from our data that synaptic transmission in the calyxof Held differs in a number of significant ways when synapsesare stimulated with a Poisson-distributed stimulus train forprolonged periods of time. Future studies will determine thespecific contribution of multiple modulators, receptors, orchannel types in the calyx of Held synapse to the “rested” orthe “spontaneously active” synaptic state.
A C K N O W L E D G M E N T S
We thank F. Felmy, G. Pollak, L. Trussell, and J. Gittelman for criticalcomments on the manuscript.
G R A N T S
H. von Gersdorff was funded by a “Mercator Professor” award fromDeutsche Forschungsgemeinschaft (DFG) and National Institute on Deafnessand Other Communication Disorders Grant R01 DC-04274. The research wasfunded by DFG Grant KL-1842 to A. Klug.
R E F E R E N C E S
Awatramani GB, Turecek R, Trussell LO. Inhibitory control at a synapticrelay. J Neurosci 24: 2643–2647, 2004.
Banks MI, Smith PH. Intracellular recordings from neurobiotin-labeled cellsin brain slices of the rat medial nucleus of the trapezoid body. J Neurosci 12:2819–2837, 1992.
Barnes-Davies M, Forsythe ID. Pre- and postsynaptic glutamate receptors ata giant excitatory synapse in rat auditory brainstem slices. J Physiol 488:387–406, 1995.
Bernander O, Douglas RJ, Martin KA, Koch C. Synaptic backgroundactivity influences spatiotemporal integration in single pyramidal cells. ProcNatl Acad Sci USA 88: 11569–11573, 1991.
Bledsoe SC Jr, Snead CR, Helfert RH, Prasad V, Wenthold RJ, AltschulerRA. Immunocytochemical and lesion studies support the hypothesis that theprojection from the medial nucleus of the trapezoid body to the lateralsuperior olive is glycinergic. Brain Res 517: 189–194, 1990.
Borst JG, Sakmann B. Calcium influx and transmitter release in a fast CNSsynapse. Nature 383: 431–434, 1996.
Brownell WE. Organization of the cat trapezoid body and the dischargecharacteristics of its fibers. Brain Res 94: 413–433, 1975.
Destexhe A, Rudolph M, Pare D. The high-conductance state of neocorticalneurons in vivo. Nat Rev Neurosci 4: 739–751, 2003.
Forsythe ID. Direct patch recording from identified presynaptic terminalsmediating glutamatergic EPSCs in the rat CNS, in vitro. J Physiol 479:381–387, 1994.
Futai K, Okada M, Matsuyama K, Takahashi T. High-fidelity transmissionacquired via a developmental decrease in NMDA receptor expression at anauditory synapse. J Neurosci 21: 3342–3349, 2001.
Geisler CD, Deng L, Greenberg SR. Thresholds for primary auditory fibersusing statistically defined criteria. J Acoust Soc Am 77: 1102–1109, 1985.
Goldberg JM, Brownell WE. Discharge characteristics of neurons in antero-ventral and dorsal cochlear nuclei of cat. Brain Res 64: 35–54, 1973.
Grothe B. Interaction of excitation and inhibition in processing of pure toneand amplitude-modulated stimuli in the medial superior olive of the mus-tached bat. J Neurophysiol 71: 706–721, 1994.
Guinan JJ Jr, Li RY. Signal processing in brainstem auditory neurons whichreceive giant endings (calyces of Held) in the medial nucleus of thetrapezoid body of the cat. Hear Res 49: 321–334, 1990.
Held H. Die centrale Gehorleitung. Archiv Anat Physiol Anat Abteil 1893:201–247, 1893.
Hudspeth AJ. How hearing happens. Neuron 19: 947–950, 1997.Irvine DRF. Physiology of the auditory brainstem. In: The Mammalian
Auditory Pathway: Neurophysiology, edited by Popper AN, Fay RR. NewYork: Springer-Verlag, 1992, p. 153–231.
819SYNAPTIC TRANSMISSION AT THE CALYX OF HELD
J Neurophysiol • VOL 98 • AUGUST 2007 • www.jn.org
by guest on August 7, 2016
http://jn.physiology.org/D
ownloaded from

Ishikawa T, Takahashi T. Mechanisms underlying presynaptic facilitatoryeffect of cyclothiazide at the calyx of Held of juvenile rats. J Physiol 533:423–431, 2001.
Joris PX, Carney LH, Smith PH, Yin TC. Enhancement of neural synchro-nization in the anteroventral cochlear nucleus. I. Responses to tones at thecharacteristic frequency. J Neurophysiol 71: 1022–1036, 1994.
Joshi I, Shokralla S, Titis P, Wang LY. The role of AMPA receptor gatingin the development of high-fidelity neurotransmission at the calyx of Heldsynapse. J Neurosci 24: 183–196, 2004.
Kadner A, Kulesza RJ Jr, Berrebi AS. Neurons in the medial nucleus of thetrapezoid body and superior paraolivary nucleus of the rat may play a rolein sound duration coding. J Neurophysiol 95: 1499–1508, 2006.
Kiang NY-S. Discharge Patterns of Single Fibers in the Cat’s Auditory Nerve.Cambridge, MA: MIT Press, 1965.
Klyachko VA, Stevens CF. Excitatory and feed-forward inhibitory hippocam-pal synapses work synergistically as an adaptive filter of natural spike trains.PLoS Biol 4: e207, 2006.
Kopp-Scheinpflug C, Lippe WR, Dorrscheidt GJ, Rubsamen R. Themedial nucleus of the trapezoid body in the gerbil is more than a relay:comparison of pre- and postsynaptic activity. J Assoc Res Otolaryngol 4:1–23, 2003.
Kuwabara N, DiCaprio RA, Zook JM. Afferents to the medial nucleus of thetrapezoid body and their collateral projections. J Comp Neurol 314: 684–706, 1991.
Liberman MC. Auditory-nerve response from cats raised in a low-noisechamber. J Acoust Soc Am 63: 442–455, 1978.
Loskota W, Lomax P, Verity M. A Stereotaxic Atlas of the Mongolian GerbilBrain. Ann Arbor, MI: Ann Arbor Science, 1974.
Moore MJ, Caspary DM. Strychnine blocks binaural inhibition in lateralsuperior olivary neurons. J Neurosci 3: 237–242, 1983.
Neher E, Sakaba T. Combining deconvolution and noise analysis for theestimation of transmitter release rates at the calyx of Held. J Neurosci 21:444–461, 2001.
Pare D, Shink E, Gaudreau H, Destexhe A, Lang EJ. Impact of spontaneoussynaptic activity on the resting properties of cat neocortical pyramidalneurons in vivo. J Neurophysiol 79: 1450–1460, 1998.
Renden R, Taschenberger H, Puente N, Rusakov DA, Duvoisin R, WangLY, Lehre KP, von Gersdorff H. Glutamate transporter studies reveal thepruning of metabotropic glutamate receptors and absence of AMPA receptordesensitization at mature calyx of held synapses. J Neurosci 25: 8482–8497,2005.
Roberts WM, Howard J, Hudspeth AJ. Hair cells: transduction, tuning, andtransmission in the inner ear. Annu Rev Cell Biol 4: 63–92, 1988.
Ryan A, Miller J. Single unit responses in the inferior colliculus of the awakeand performing rhesus monkey. Exp Brain Res 32: 389–407, 1978.
Sakaba T, Neher E. Quantitative relationship between transmitter release andcalcium current at the calyx of Held synapse. J Neurosci 21: 462–476, 2001.
Schneggenburger R, Sakaba T, Neher E. Vesicle pools and short-termsynaptic depression: lessons from a large synapse. Trends Neurosci 25:206–212, 2002.
Schuller G, Radtke-Schuller S, Betz M. A stereotaxic method for smallanimals using experimentally determined reference profiles. J NeurosciMethods 18: 339–350, 1986.
Schwarz DW, Puil E. Firing properties of spherical bushy cells in theanteroventral cochlear nucleus of the gerbil. Hear Res 114: 127–138, 1997.
Smith PH, Joris PX, Carney LH, Yin TC. Projections of physiologicallycharacterized globular bushy cell axons from the cochlear nucleus of the cat.J Comp Neurol 304: 387–407, 1991.
Smith PH, Joris PX, Yin TC. Anatomy and physiology of principal cells ofthe medial nucleus of the trapezoid body (MNTB) of the cat. J Neurophysiol79: 3127–3142, 1998.
Sommer I, Lingenhohl K, Friauf E. Principal cells of the rat medial nucleusof the trapezoid body: an intracellular in vivo study of their physiology andmorphology. Exp Brain Res 95: 223–239, 1993.
Spangler KM, Warr WB, Henkel CK. The projections of principal cells ofthe medial nucleus of the trapezoid body in the cat. J Comp Neurol 238:249–262, 1985.
Spassova MA, Avissar M, Furman AC, Crumling MA, Saunders JC,Parsons TD. Evidence that rapid vesicle replenishment of the synapticribbon mediates recovery from short-term adaptation at the hair cell afferentsynapse. J Assoc Res Otolaryngol 5: 376–390, 2004.
Spirou GA, Brownell WE, Zidanic M. Recordings from cat trapezoid bodyand HRP labeling of globular bushy cell axons. J Neurophysiol 63: 1169–1190, 1990.
Spirou GA, Rager J, Manis PB. Convergence of auditory-nerve fiber pro-jections onto globular bushy cells. Neuroscience 136: 843–863, 2005.
Taschenberger H, Leao RM, Rowland KC, Spirou GA, von Gersdorff H.Optimizing synaptic architecture and efficiency for high-frequency trans-mission. Neuron 36: 1127–1143, 2002.
Taschenberger H, Scheuss V, Neher E. Release kinetics, quantal parametersand their modulation during short-term depression at a developing synapsein the rat CNS. J Physiol 568: 513–537, 2005.
Taschenberger H, von Gersdorff H. Fine-tuning an auditory synapse forspeed and fidelity: developmental changes in presynaptic waveform, EPSCkinetics, and synaptic plasticity. J Neurosci 20: 9162–9173, 2000.
Thompson AM, Schofield BR. Afferent projections of the superior olivarycomplex. Microsc Res Tech 51: 330–354, 2000.
von Gersdorff H, Borst JG. Short-term plasticity at the calyx of Held. NatRev Neurosci 3: 53–64, 2002.
von Gersdorff H, Schneggenburger R, Weis S, Neher E. Presynapticdepression at a calyx synapse: the small contribution of metabotropicglutamate receptors. J Neurosci 17: 8137–8146, 1997.
Wang LY, Kaczmarek LK. High-frequency firing helps replenish the readilyreleasable pool of synaptic vesicles. Nature 394: 384–388, 1998.
Wu LG, Borst JG. The reduced release probability of releasable vesiclesduring recovery from short-term synaptic depression. Neuron 23: 821–832,1999.
Wu SH, Kelly JB. Response of neurons in the lateral superior olive and medialnucleus of the trapezoid body to repetitive stimulation: intracellular andextracellular recordings from mouse brain slice. Hear Res 68: 189–201,1993.
820 HERMANN, PECKA, VON GERSDORFF, GROTHE, AND KLUG
J Neurophysiol • VOL 98 • AUGUST 2007 • www.jn.org
by guest on August 7, 2016
http://jn.physiology.org/D
ownloaded from
Copyright © 2022 FDOKUMEN