Compatibility of toluidine blue with laser microdissection and saturation labeling DIGE
6
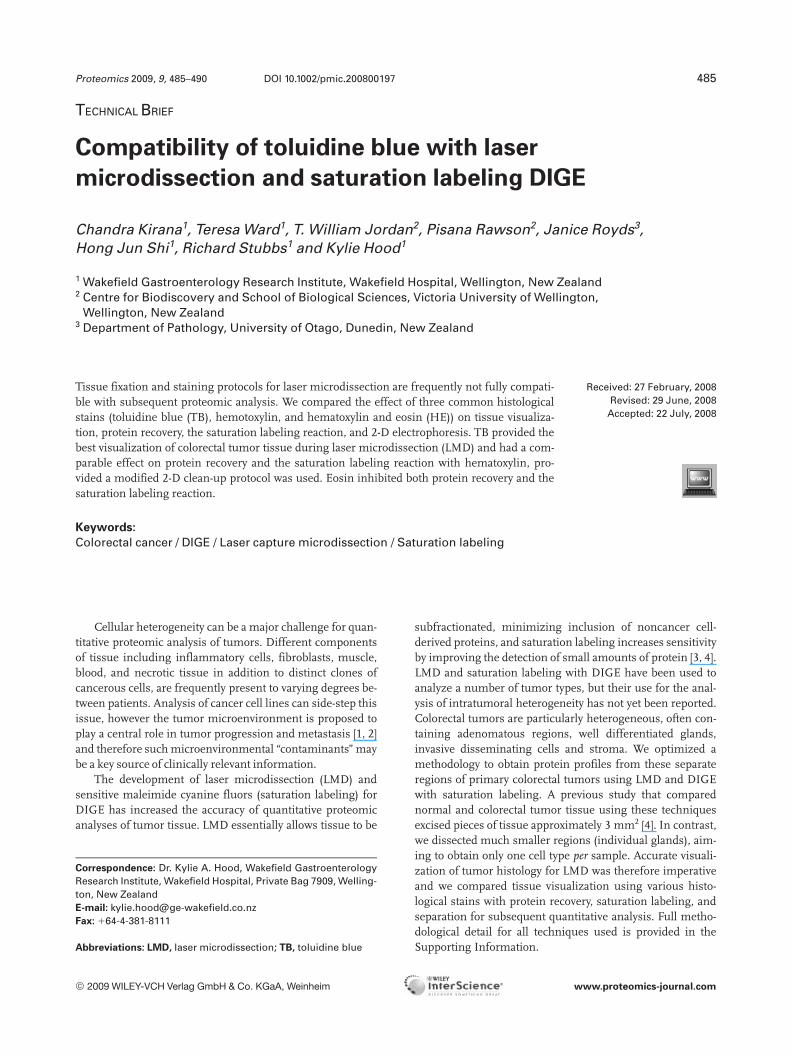
TECHNICAL BRIEF Compatibility of toluidine blue with laser microdissection and saturation labeling DIGE Chandra Kirana 1 , Teresa Ward 1 , T. William Jordan 2 , Pisana Rawson 2 , Janice Royds 3 , Hong Jun Shi 1 , Richard Stubbs 1 and Kylie Hood 1 1 Wakefield Gastroenterology Research Institute, Wakefield Hospital, Wellington, New Zealand 2 Centre for Biodiscovery and School of Biological Sciences, Victoria University of Wellington, Wellington, New Zealand 3 Department of Pathology, University of Otago, Dunedin, New Zealand Tissue fixation and staining protocols for laser microdissection are frequently not fully compati- ble with subsequent proteomic analysis. We compared the effect of three common histological stains (toluidine blue (TB), hemotoxylin, and hematoxylin and eosin (HE)) on tissue visualiza- tion, protein recovery, the saturation labeling reaction, and 2-D electrophoresis. TB provided the best visualization of colorectal tumor tissue during laser microdissection (LMD) and had a com- parable effect on protein recovery and the saturation labeling reaction with hematoxylin, pro- vided a modified 2-D clean-up protocol was used. Eosin inhibited both protein recovery and the saturation labeling reaction. Received: 27 February, 2008 Revised: 29 June, 2008 Accepted: 22 July, 2008 Keywords: Colorectal cancer / DIGE / Laser capture microdissection / Saturation labeling Proteomics 2009, 9, 485–490 485 Cellular heterogeneity can be a major challenge for quan- titative proteomic analysis of tumors. Different components of tissue including inflammatory cells, fibroblasts, muscle, blood, and necrotic tissue in addition to distinct clones of cancerous cells, are frequently present to varying degrees be- tween patients. Analysis of cancer cell lines can side-step this issue, however the tumor microenvironment is proposed to play a central role in tumor progression and metastasis [1, 2] and therefore such microenvironmental “contaminants” may be a key source of clinically relevant information. The development of laser microdissection (LMD) and sensitive maleimide cyanine fluors (saturation labeling) for DIGE has increased the accuracy of quantitative proteomic analyses of tumor tissue. LMD essentially allows tissue to be subfractionated, minimizing inclusion of noncancer cell- derived proteins, and saturation labeling increases sensitivity by improving the detection of small amounts of protein [3, 4]. LMD and saturation labeling with DIGE have been used to analyze a number of tumor types, but their use for the anal- ysis of intratumoral heterogeneity has not yet been reported. Colorectal tumors are particularly heterogeneous, often con- taining adenomatous regions, well differentiated glands, invasive disseminating cells and stroma. We optimized a methodology to obtain protein profiles from these separate regions of primary colorectal tumors using LMD and DIGE with saturation labeling. A previous study that compared normal and colorectal tumor tissue using these techniques excised pieces of tissue approximately 3 mm 2 [4]. In contrast, we dissected much smaller regions (individual glands), aim- ing to obtain only one cell type per sample. Accurate visuali- zation of tumor histology for LMD was therefore imperative and we compared tissue visualization using various histo- logical stains with protein recovery, saturation labeling, and separation for subsequent quantitative analysis. Full metho- dological detail for all techniques used is provided in the Supporting Information. Correspondence: Dr. Kylie A. Hood, Wakefield Gastroenterology Research Institute, Wakefield Hospital, Private Bag 7909, Welling- ton, New Zealand E-mail: [email protected] Fax: 164-4-381-8111 Abbreviations: LMD, laser microdissection; TB, toluidine blue DOI 10.1002/pmic.200800197 © 2009 WILEY-VCH Verlag GmbH & Co. KGaA, Weinheim www.proteomics-journal.com
Transcript of Compatibility of toluidine blue with laser microdissection and saturation labeling DIGE
TECHNICAL BRIEF
Compatibility of toluidine blue with laser
microdissection and saturation labeling DIGE
Chandra Kirana1, Teresa Ward1, T. William Jordan2, Pisana Rawson2, Janice Royds3,Hong Jun Shi1, Richard Stubbs1 and Kylie Hood1
1 Wakefield Gastroenterology Research Institute, Wakefield Hospital, Wellington, New Zealand2 Centre for Biodiscovery and School of Biological Sciences, Victoria University of Wellington,
Wellington, New Zealand3 Department of Pathology, University of Otago, Dunedin, New Zealand
Tissue fixation and staining protocols for laser microdissection are frequently not fully compati-ble with subsequent proteomic analysis. We compared the effect of three common histologicalstains (toluidine blue (TB), hemotoxylin, and hematoxylin and eosin (HE)) on tissue visualiza-tion, protein recovery, the saturation labeling reaction, and 2-D electrophoresis. TB provided thebest visualization of colorectal tumor tissue during laser microdissection (LMD) and had a com-parable effect on protein recovery and the saturation labeling reaction with hematoxylin, pro-vided a modified 2-D clean-up protocol was used. Eosin inhibited both protein recovery and thesaturation labeling reaction.
Received: 27 February, 2008Revised: 29 June, 2008
Accepted: 22 July, 2008
Keywords:
Colorectal cancer / DIGE / Laser capture microdissection / Saturation labeling
Proteomics 2009, 9, 485–490 485
Cellular heterogeneity can be a major challenge for quan-titative proteomic analysis of tumors. Different componentsof tissue including inflammatory cells, fibroblasts, muscle,blood, and necrotic tissue in addition to distinct clones ofcancerous cells, are frequently present to varying degrees be-tween patients. Analysis of cancer cell lines can side-step thisissue, however the tumor microenvironment is proposed toplay a central role in tumor progression and metastasis [1, 2]and therefore such microenvironmental “contaminants” maybe a key source of clinically relevant information.
The development of laser microdissection (LMD) andsensitive maleimide cyanine fluors (saturation labeling) forDIGE has increased the accuracy of quantitative proteomicanalyses of tumor tissue. LMD essentially allows tissue to be
subfractionated, minimizing inclusion of noncancer cell-derived proteins, and saturation labeling increases sensitivityby improving the detection of small amounts of protein [3, 4].LMD and saturation labeling with DIGE have been used toanalyze a number of tumor types, but their use for the anal-ysis of intratumoral heterogeneity has not yet been reported.Colorectal tumors are particularly heterogeneous, often con-taining adenomatous regions, well differentiated glands,invasive disseminating cells and stroma. We optimized amethodology to obtain protein profiles from these separateregions of primary colorectal tumors using LMD and DIGEwith saturation labeling. A previous study that comparednormal and colorectal tumor tissue using these techniquesexcised pieces of tissue approximately 3 mm2 [4]. In contrast,we dissected much smaller regions (individual glands), aim-ing to obtain only one cell type per sample. Accurate visuali-zation of tumor histology for LMD was therefore imperativeand we compared tissue visualization using various histo-logical stains with protein recovery, saturation labeling, andseparation for subsequent quantitative analysis. Full metho-dological detail for all techniques used is provided in theSupporting Information.
Correspondence: Dr. Kylie A. Hood, Wakefield GastroenterologyResearch Institute, Wakefield Hospital, Private Bag 7909, Welling-ton, New ZealandE-mail: [email protected]: 164-4-381-8111
Abbreviations: LMD, laser microdissection; TB, toluidine blue
DOI 10.1002/pmic.200800197
© 2009 WILEY-VCH Verlag GmbH & Co. KGaA, Weinheim www.proteomics-journal.com
486 C. Kirana et al. Proteomics 2009, 9, 485–490
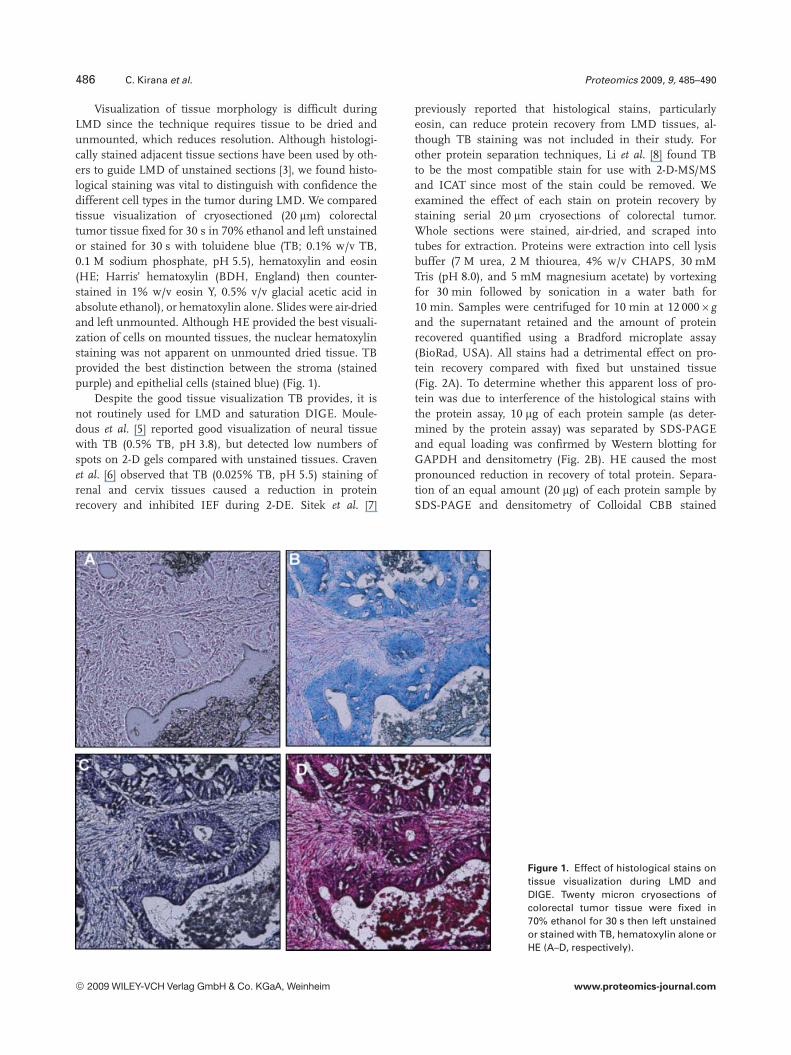
Visualization of tissue morphology is difficult duringLMD since the technique requires tissue to be dried andunmounted, which reduces resolution. Although histologi-cally stained adjacent tissue sections have been used by oth-ers to guide LMD of unstained sections [3], we found histo-logical staining was vital to distinguish with confidence thedifferent cell types in the tumor during LMD. We comparedtissue visualization of cryosectioned (20 mm) colorectaltumor tissue fixed for 30 s in 70% ethanol and left unstainedor stained for 30 s with toluidene blue (TB; 0.1% w/v TB,0.1 M sodium phosphate, pH 5.5), hematoxylin and eosin(HE; Harris’ hematoxylin (BDH, England) then counter-stained in 1% w/v eosin Y, 0.5% v/v glacial acetic acid inabsolute ethanol), or hematoxylin alone. Slides were air-driedand left unmounted. Although HE provided the best visuali-zation of cells on mounted tissues, the nuclear hematoxylinstaining was not apparent on unmounted dried tissue. TBprovided the best distinction between the stroma (stainedpurple) and epithelial cells (stained blue) (Fig. 1).
Despite the good tissue visualization TB provides, it isnot routinely used for LMD and saturation DIGE. Moule-dous et al. [5] reported good visualization of neural tissuewith TB (0.5% TB, pH 3.8), but detected low numbers ofspots on 2-D gels compared with unstained tissues. Cravenet al. [6] observed that TB (0.025% TB, pH 5.5) staining ofrenal and cervix tissues caused a reduction in proteinrecovery and inhibited IEF during 2-DE. Sitek et al. [7]
previously reported that histological stains, particularlyeosin, can reduce protein recovery from LMD tissues, al-though TB staining was not included in their study. Forother protein separation techniques, Li et al. [8] found TBto be the most compatible stain for use with 2-D-MS/MSand ICAT since most of the stain could be removed. Weexamined the effect of each stain on protein recovery bystaining serial 20 mm cryosections of colorectal tumor.Whole sections were stained, air-dried, and scraped intotubes for extraction. Proteins were extraction into cell lysisbuffer (7 M urea, 2 M thiourea, 4% w/v CHAPS, 30 mMTris (pH 8.0), and 5 mM magnesium acetate) by vortexingfor 30 min followed by sonication in a water bath for10 min. Samples were centrifuged for 10 min at 12 0006gand the supernatant retained and the amount of proteinrecovered quantified using a Bradford microplate assay(BioRad, USA). All stains had a detrimental effect on pro-tein recovery compared with fixed but unstained tissue(Fig. 2A). To determine whether this apparent loss of pro-tein was due to interference of the histological stains withthe protein assay, 10 mg of each protein sample (as deter-mined by the protein assay) was separated by SDS-PAGEand equal loading was confirmed by Western blotting forGAPDH and densitometry (Fig. 2B). HE caused the mostpronounced reduction in recovery of total protein. Separa-tion of an equal amount (20 mg) of each protein sample bySDS-PAGE and densitometry of Colloidal CBB stained
Figure 1. Effect of histological stains ontissue visualization during LMD andDIGE. Twenty micron cryosections ofcolorectal tumor tissue were fixed in70% ethanol for 30 s then left unstainedor stained with TB, hematoxylin alone orHE (A–D, respectively).
© 2009 WILEY-VCH Verlag GmbH & Co. KGaA, Weinheim www.proteomics-journal.com

Proteomics 2009, 9, 485–490 487
Figure 2. Effect of histological stains on protein recovery, saturation labeling, and 2-DE. Twenty micrograms cryosections of colorectaltumor tissue were mounted onto four glass slides. Four cryosections were mounted per slide. Each slide was fixed in 70% ethanol and leftunstained (NS), or stained with either TB, hemotoxylin (H), or HE. The tissue was manually microdissected from the slides and the proteinextracted and quantified using the Bradford assay. Data were combined from four independent experiments and expressed as a percent-age of unstained tissue sample yield (A). Ten micrograms of each protein sample was separated by SDS-PAGE and Western blotted forGAPDH. Densitometry was undertaken to measure protein load and expressed as a percentage of the unstained sample (B). Twentymicrograms of each sample was separated by SDS-PAGE and stained with Colloidal Coomasie Blue. Densitometry of five protein bands (1–5) was undertaken using Quantity One™ (BioRad) and abundances tabulated (C). Representative gel images of 5 mg of protein from histo-logically stained colorectal tumor tissue 2-D cleaned and labeled with Cy5 (D).
bands revealed that HE caused a selective loss of highmolecular weight proteins compared with unstained sam-ples (Fig. 2C, and Fig. 2 of Supporting Information).
The effect of the histological stains on the saturationCyDye labeling reaction and protein separation by 2-DE wasexamined by coseparating Cy5-saturation-labeled stained orunstained colorectal tumor tissue (prepared from wholecryosections of tumor tissue, stained, extracted, and quanti-fied as described above) with an identical Cy3-saturation-labeled sample from adjacent sections of unstained tissue asa standard control for each gel. Five micrograms of each ofthe samples was saturation-labeled with Cy5 and theunstained control samples were saturation-labeled with Cy3.Five micrograms of each Cy3 and Cy5 labeled sample werecombined and separated on 7 cm pH 4–7 Immobiline™ Dry-strips (GE Healthcare, Sweden) according to the manu-facturer’s instructions. Following IEF, strips were equili-brated in 6 M urea, 30% v/v glycerol, 2% (w/v) SDS, 50 mMTris-HCl (pH 6.8), and 0.5% w/v DTT for 10 min followed byseparation on Novex 4–12% Bis-Tris gels (Invitrogen) at200 V for 1 h. Gels were scanned in the Cy3 or Cy5 channel
Table 1. Effect of histological stain and 2-D clean-up on thesaturation-CyDye labeling reaction
Unstained TB Hematoxylin HE
No 2-D clean-up CY3 control 1503 1669 1460 1630Cy5 sample 1495 1091 1394 179***
2-D clean-up CY3 control 1517 1827 1558 1745Cy5 sample 1520 1695 1527 635*
Twenty micron cryosections of colorectal tumor tissue weremounted onto four glass slides. Four cryosections were mountedper slide. Each slide was fixed in 70% ethanol and left unstained(NS), or stained with either toluidine blue (TB), hemotoxylin (H),or HE. The tissue was manually dissected from the slides and theprotein extracted and quantified. Five micrograms of each sam-ple was labeled with Cy5 and coseparated with an additional 5 mgof Cy3-labeled unstained colorectal tissue by DIGE and proteinspots. Gels containing unstained tissue labeled with Cy3 and Cy5(5 mg each) were used to normalize intensity differences betweenCy3 and Cy5. The number of protein spots for each sample wasdetected using Delta2D v 3.6 (DECODON) (* p,0.05, *** p,0.001,ANOVA, with Bonferroni’s test, Graphpad Prism v 4.01).
© 2009 WILEY-VCH Verlag GmbH & Co. KGaA, Weinheim www.proteomics-journal.com

488 C. Kirana et al. Proteomics 2009, 9, 485–490
Figure 3. Isolation and separation of distinct tumor cell types using LMD and DIGE. LMD of toluidine blue-stained colorectal tumor tissuewas used to isolate invading glands at the invasive front of the tumor, excluding purple-stained stromal cells (A), and well-differentiatedglands from the central region of the tumor (B) from the same patient. Cy5 saturation-labeled proteins were extracted, and separated over4–7 and 6–11 pH range.
of a Fujifilm FLA-5100. The number of protein spots resolvedfor each sample was detected using Delta2D v 3.6 (DECO-DON, Germany) using identical spot detection parametersfor each sample. Comparisons of spot data were analyzed byone-way ANOVA with Bonferroni post-test to identify be-tween-group differences (p,0.05) using Graphpad Prism(Version 4.01). Histological staining reduced the number ofprotein spots compared with the co-separated unstainedsamples (Table 1). This was especially apparent in tissuesstained with TB or HE which, despite having an equalamount of protein in the initial saturation labeling reaction,had a 35 and 89% reduction respectively in the number ofCy5-labeled protein spots detected compared to theunstained co-separated sample (after normalization for dif-ferences between CyDyes) (Table 1). The co-separatedunstained Cy3-labeled control samples were not significantlyinfluenced by the histological stains (mean spot num-ber 6 SD: 1613 6 127, n = 8), indicating that the histological
stains inhibit the saturation CyDye labeling reaction ratherthan IEF. No additional protein spots were observed in theprotein spot maps of the histologically stained protein sam-ples when matched with unstained samples, indicating thatthe stains do not appear to detrimentally modify the proteins.
We attempted to improve the saturation labeling reactionby removing excess histological dye by purifying the proteinsamples using 2-D-clean-up (GE Healthcare). We observedthat the standard 2-D clean-up protocol recovered only 70%of total protein (Fig. 1A of Supporting Information). Thiscould be overcome using a slightly modified protocolwhereby 0.6 mL of precipitant and co-precipitant (instead of0.3 mL) were added to the protein sample, and the firstsupernatant (instead of being discarded) was incubated onice for 10 min, centrifuged for 5 min at 12 0006g and theresulting pellet combined with the first pellet at the washstep. 2-D clean-up prior to saturation labeling increased thenumber of protein spots resolved from all samples, includ-
© 2009 WILEY-VCH Verlag GmbH & Co. KGaA, Weinheim www.proteomics-journal.com
Proteomics 2009, 9, 485–490 489
ing unstained tissue (p = 0.025). A representative gel imagefor each 2-D cleaned sample is shown in Fig. 2D. Theimprovement was most dramatic for TB, and 2-D cleaned TBstained samples had an equivalent number of protein spotsas unstained tissue. 2-D clean-up also increased the numberof protein spots resolved from HE stained tissues, althoughthe number of spots detected remained low, representingonly 40% of the spots detected from unstained tissue (Table 1and Fig. 2D). Thus, of the three stains examined, TB pro-vided the best visualization of tissues, and equivalent proteinrecovery and number of spots detected to hematoxylin, pro-vided the samples were 2-D cleaned prior to saturationlabeling.
Although a number of groups have reported saturation-labeled protein separated over acidic (pH 4–7) [3, 7, 9–11], orwide pH ranges (3–10) [4, 12, 13], there are currently fewreports of separation of basic proteins stained with saturationdyes. IEF of basic IPG strips was performed on 7 cm pH 6–11Immobiline Drystrips rehydrated overnight in basic rehydra-tion buffer (7 M urea, 2 M thiourea, 2% w/v CHAPS, 1% v/vIPG buffer pH 6–11, 5% glycerol, 10% isopropanol, 2.5% w/vDTT) and samples were loaded using a sample cup. The ca-thodic wick was soaked in 150mL basic rehydration buffercontainer 3% DTT (w/v) instead of 2.5%. The anodic wickwas soaked in 150 mL H2O. Separation in the second dimen-sion was performed as described for acidic proteins. Basicproteins are notoriously difficult to separate reproducibly byIEF. We observed that saturation-labeled proteins did notresolve as well as unlabeled samples during IEF. We hypo-thesized that this may be due to residual unconjugated dyeremaining and inhibiting IEF and furthermore, that an addi-tional round of 2-D clean-up following the saturation labelingmay remove this. The additional 2-D clean-up resulted inimproved resolution of 5 mg of Cy5 saturation-labeled TBstained colorectal tumor tissue on pH 6–11 IPG strips, sig-nificantly increasing the number of protein spots detected byDelta2D v 3.6 (DECODON) from 415 to 536 (mean of threeindependent experiments, p = 0.033, paired Student’s t-test)(Fig. 1B of Supporting Information). This improvementappeared to be specific to pH 6–11 separations, as postsaturation labeling 2-D clean-up of proteins separated onpH 4–7 IPG strips did not significantly alter the number ofprotein spots resolved (preliminary data).
Based on these preliminary results we used TB histolog-ical staining to identify and isolate regions of stroma, invad-ing glands, and well-differentiated glands from primarycolorectal tumors using a Leica AS LMD System (Leica,Microsystems) (Fig. 3). The method recovered 15 mg protein/h and 1 mg of protein/1000 cells. This equated to approxi-mately 1800 protein spots detected by Delta2D v 3.6 (DECO-DON) from minigels (Hood et al. manuscript in prepara-tion).
In summary, LMD and DIGE using saturation labelingcan be successfully used to analyze protein profiles fromprecise populations of tumor tissue from different regionswithin tumors. Histological stains affected both protein
recovery and the saturation labeling reaction but had aminimal effect on IEF. For LMD of colorectal cancer tumortissue, TB provided the optimal balance of tissue visualiza-tion, protein recovery, and number of protein spots resolvedby DIGE, although protein sample 2-D clean-up (using amodification to the manufacturer’s protocol) was essential.Post-saturation labeling 2-D clean-up removed excess CyDyeand increased the number of saturation-labeled basic pro-teins resolved. LMD and DIGE using saturation labelingpermits very sensitive analyses of distinct cell populationsfrom tissue sections, providing possibilities for a variety ofinnovative proteomic investigations to be undertaken.
The authors wish to thank the New Zealand Cancer Society,New Zealand Lotteries Health Research, the Wakefield Clinic,and the Wakefield Gastroenterology Research Trust for Funding.
The authors have declared no conflict of interest.
References
[1] Bierie, B., Moses, H. L., Tumour microenvironment: TGFb:The molecular Jekyll and Hyde of cancer. Nat. Rev. Cancer2006, 6, 506–520.
[2] Kopfstein, L., Christofori, G., Metastasis: Cell-autonomousmechanisms versus contributions by the tumor micro-environment. Cell. Mol. Life Sci. 2006, 63, 449–468.
[3] Wilson, K. E., Marouga, R., Prime, J. E., Pashby, D. P. et al.,Comparative proteomic analysis using samples obtainedwith laser microdissection and saturation dye labelling. Pro-teomics 2005, 5, 3851–3858.
[4] Kondo, T., Seike, M., Mori, Y., Fujii, K. et al., Application ofsensitive fluorescent dyes in linkage of laser microdissectionand two-dimensional gel electrophoresis as a cancer prote-omic study tool. Proteomics 2003, 3, 1758–1766.
[5] Mouledous, L., Hunt, S., Harcourt, R., Harry, J. et al., Lack ofcompatibility of histological staining methods with proteom-ic analysis of laser-capture-microdissected brain samples.J. Biomol. Tech. 2002, 13, 258–264.
[6] Craven, R. A., Totty, N., Harnden, P., Selby, P. J., Banks, R. E.,Laser capture microdissection and two-dimensional poly-acrylamide gel electrophoresis: Evaluation of tissue prepara-tion and sample limitations. Am. J. Pathol. 2002, 160, 815–822.
[7] Sitek, B., Luttges, J., Marcus, K., Kloppel, G. et al., Applicationof fluorescence difference gel electrophoresis saturationlabelling for the analysis of microdissected precursor lesionsof pancreatic ductal adenocarcinoma. Proteomics 2005, 5,2665–2679.
[8] Li, C., Hong, Y., Tang, Y. X., Zhou, H. et al., Accurate qualitativeand quantitative proteomic analysis of clinical hepatocellularcarcinoma using laser capture microdissection coupled withisotope-coded affinity tag and two-dimensional liquid chro-matography mass spectrometry. Mol. Cell. Proteomics 2004,3, 399–409.
[9] Fujii, K., Kondo, T., Yokoo, H., Okano, T. et al., Database oftwo-dimensional polyacrylamide gel electrophoresis of pro-
© 2009 WILEY-VCH Verlag GmbH & Co. KGaA, Weinheim www.proteomics-journal.com

490 C. Kirana et al. Proteomics 2009, 9, 485–490
teins labeled with CyDye DIGE Fluor saturation dye. Prote-omics 2006, 6, 1640–1653.
[10] Fujii, K., Kondo, T., Yokoo, H., Yamada, T. et al., Proteomicstudy of human hepatocellular carcinoma using two-dimensional difference gel electrophoresis with saturationcysteine dye. Proteomics 2005, 5, 1411–1422.
[11] Sitek, B., Potthoff, S., Schulenborg, T., Stegbauer, J. et al.,Novel approaches to analyse glomerular proteins fromsmallest scale murine and human samples using DIGEsaturation labelling. Proteomics 2006, 6, 4337–4345.
[12] Evans, C. A., Tonge, R., Blinco, D., Pierce, A. et al., Com-parative proteomics of primitive hematopoietic cell popula-tions reveals differences in expression of proteins regulat-ing motility. Blood 2004, 103, 3751–3759.
[13] Greengauz-Roberts, O., Stoppler, H., Nomura, S., Yama-guchi, H. et al., Saturation labeling with cysteine-reactivecyanine fluorescent dyes provides increased sensitivity forprotein expression profiling of laser-microdissected clinicalspecimens. Proteomics 2005, 5, 1746–1757.
© 2009 WILEY-VCH Verlag GmbH & Co. KGaA, Weinheim www.proteomics-journal.com