In situ X-ray diffraction study of the electrochemical reaction on lead electrodes in sulphate...
7
Materials Chemistry and Physics 114 (2009) 983–989 Contents lists available at ScienceDirect Materials Chemistry and Physics journal homepage: www.elsevier.com/locate/matchemphys In situ X-ray diffraction study of the electrochemical reaction on lead electrodes in sulphate electrolytes P. Angerer a , R. Mann a , A. Gavrilovic a , G.E. Nauer a,b,∗ a ECHEM Kompetenzzentrum für angewandte Elektrochemie GmbH, Viktor-Kaplan-Straße 2, A-2700 Wiener Neustadt, Austria b University of Vienna, Faculty of Chemistry, Währinger Straße 42, A-1090 Wien, Austria article info Article history: Received 1 July 2008 Received in revised form 16 October 2008 Accepted 2 November 2008 Keywords: Surfaces Grazing incidence X-ray diffraction Electrochemical techniques Microstructure abstract The anodic oxidation of pure lead in two acidic sulphate electrolytes with identical ionic strength (pH ∼ 0 and pH ∼−0.1) was studied by in situ grazing incidence X-ray diffraction method (GIXD). Crys- talline products such as lead sulphate (anglesite, PbSO 4 , orthorhombic), - and -lead dioxide (-PbO 2 , orthorhombic, and -PbO 2 , tetragonal), and tribasic lead sulphate hydrate with the stoichiometric compo- sition 3PbO·PbSO 4 ·H 2 O (triclinic) were detected at defined potentials. A method for the semi-quantitative determination of the thickness of the deposited layer from diffraction data is described. After the in situ measurement, the washed and dried working electrodes were additionally characterized ex situ by GIXD measurements at different angles of incidence. The phase litharge (lead oxide, t-PbO, tetragonal) and lead sulphate were observed at the surface of the lead substrate. The quantitative evaluation of the diffraction intensity of this measurement series enables the modelling of a qualitative depth profile of the layer gen- erated during the electrochemical treatment. The anglesite phase is located in the uppermost layer, while the litharge phase was detected closer to the lead substrate. © 2008 Elsevier B.V. All rights reserved. 1. Introduction This paper describes an interdisciplinary approach in the in situ characterization of electrode surfaces combining a fast X-ray diffraction (XRD) technique with established electrochemical pro- cedures using a specifically adapted diffractometer device. The in situ monitoring of the phase formation during the anodic oxida- tion of lead electrodes in various sulphate containing electrolytes is described. This system is of eminent importance for the lead- acid battery and has been a topic of intense research for many years. Many ex situ XRD investigations of this system have been conducted in the past by Pavlov et al. [1,2], and several articles con- cerning this electrochemical system have been recently published in this journal, e.g. [3–5]. During the last years, efficient and highly sensitive image-plate detectors were developed for X-ray diffraction applications. These devices enable the fast and instantaneous recording of the diffrac- tion pattern over the whole range of diffraction angles up to 140 ◦ in 2 and therefore the in situ study of comparatively rapid elec- trochemical processes on electrode surfaces by grazing incidence ∗ Corresponding author at: ECHEM Kompetenzzentrum für angewandte Elektro- chemie GmbH, Viktor-Kaplan-Straße 2, A-2700 Wiener Neustadt, Austria. Tel.: +43 2622 222 66 13; fax: +43 2622 222 66 50. E-mail address: [email protected] (G.E. Nauer). angle diffraction (GIXD) methods. Another approach is based on the usage of a linear position sensitive detection system (Linear-PSD) for the fast detection of the diffraction intensity in a restricted 2 diffraction range. Such an equipment can be used in the investi- gation of systems, where changes of the electrode surface can be monitored in a relatively small range of diffraction angles or via consecutive measurements in the appropriate 2 ranges. In the textbook of Krawitz [6] a general description of the XRD method including the fundamental problems relevant for the present work such as the role of absorption and influence of the diffraction geometry on the intensity of the diffracted X-ray beam is given. The quantitative determination of the phase composition was carried out by the Rietveld method [7]. A useful paper con- cerning the refinement strategy using this method was presented by McCusker and coworkers [8]. In the work of Nauer et al. [9] the procedure of semi-quantitative depth profiling of a layered sam- ple by variation of the incidence angle is described in detail. This technique was applied for the investigation of electrochemically prepared multi-layered structures. A deeper analytical treatise of this topic is presented in the papers of Kötschau and Schock [10] and of Colombi and coworkers [11]. An in situ GIXD investigation of lead electrodes in 5M sulphuric acid was presented by Nauer in 1996 [12], using a classical – goniometer and an improved elec- trochemical cell. The author reports the formation of lead sulphate and -PbO 2 as the main products on the lead electrode surface dur- ing the oxidation. An in situ study of electrochemical processes on 0254-0584/$ – see front matter © 2008 Elsevier B.V. All rights reserved. doi:10.1016/j.matchemphys.2008.11.006
Transcript of In situ X-ray diffraction study of the electrochemical reaction on lead electrodes in sulphate...
Ie
Pa
b
a
ARRA
KSGEM
1
sdcstiaycci
ddtit
cT
0d
Materials Chemistry and Physics 114 (2009) 983–989
Contents lists available at ScienceDirect
Materials Chemistry and Physics
journa l homepage: www.e lsev ier .com/ locate /matchemphys
n situ X-ray diffraction study of the electrochemical reaction on leadlectrodes in sulphate electrolytes
. Angerera, R. Manna, A. Gavrilovica, G.E. Nauera,b,∗
ECHEM Kompetenzzentrum für angewandte Elektrochemie GmbH, Viktor-Kaplan-Straße 2, A-2700 Wiener Neustadt, AustriaUniversity of Vienna, Faculty of Chemistry, Währinger Straße 42, A-1090 Wien, Austria
r t i c l e i n f o
rticle history:eceived 1 July 2008eceived in revised form 16 October 2008ccepted 2 November 2008
eywords:
a b s t r a c t
The anodic oxidation of pure lead in two acidic sulphate electrolytes with identical ionic strength(pH ∼ 0 and pH ∼ −0.1) was studied by in situ grazing incidence X-ray diffraction method (GIXD). Crys-talline products such as lead sulphate (anglesite, PbSO4, orthorhombic), �- and �-lead dioxide (�-PbO2,orthorhombic, and �-PbO2, tetragonal), and tribasic lead sulphate hydrate with the stoichiometric compo-sition 3PbO·PbSO4·H2O (triclinic) were detected at defined potentials. A method for the semi-quantitative
urfacesrazing incidence X-ray diffractionlectrochemical techniquesicrostructure
determination of the thickness of the deposited layer from diffraction data is described. After the in situmeasurement, the washed and dried working electrodes were additionally characterized ex situ by GIXDmeasurements at different angles of incidence. The phase litharge (lead oxide, t-PbO, tetragonal) and leadsulphate were observed at the surface of the lead substrate. The quantitative evaluation of the diffractionintensity of this measurement series enables the modelling of a qualitative depth profile of the layer gen-erated during the electrochemical treatment. The anglesite phase is located in the uppermost layer, while
ected
aufdgmc
Xpdiwcbp
the litharge phase was det
. Introduction
This paper describes an interdisciplinary approach in the initu characterization of electrode surfaces combining a fast X-rayiffraction (XRD) technique with established electrochemical pro-edures using a specifically adapted diffractometer device. The initu monitoring of the phase formation during the anodic oxida-ion of lead electrodes in various sulphate containing electrolytess described. This system is of eminent importance for the lead-cid battery and has been a topic of intense research for manyears. Many ex situ XRD investigations of this system have beenonducted in the past by Pavlov et al. [1,2], and several articles con-erning this electrochemical system have been recently publishedn this journal, e.g. [3–5].
During the last years, efficient and highly sensitive image-plateetectors were developed for X-ray diffraction applications. These
evices enable the fast and instantaneous recording of the diffrac-ion pattern over the whole range of diffraction angles up to 140◦n 2� and therefore the in situ study of comparatively rapid elec-rochemical processes on electrode surfaces by grazing incidence
∗ Corresponding author at: ECHEM Kompetenzzentrum für angewandte Elektro-hemie GmbH, Viktor-Kaplan-Straße 2, A-2700 Wiener Neustadt, Austria.el.: +43 2622 222 66 13; fax: +43 2622 222 66 50.
E-mail address: [email protected] (G.E. Nauer).
ptptao1tai
254-0584/$ – see front matter © 2008 Elsevier B.V. All rights reserved.oi:10.1016/j.matchemphys.2008.11.006
closer to the lead substrate.© 2008 Elsevier B.V. All rights reserved.
ngle diffraction (GIXD) methods. Another approach is based on thesage of a linear position sensitive detection system (Linear-PSD)or the fast detection of the diffraction intensity in a restricted 2�iffraction range. Such an equipment can be used in the investi-ation of systems, where changes of the electrode surface can beonitored in a relatively small range of diffraction angles or via
onsecutive measurements in the appropriate 2� ranges.In the textbook of Krawitz [6] a general description of the
RD method including the fundamental problems relevant for theresent work such as the role of absorption and influence of theiffraction geometry on the intensity of the diffracted X-ray beam
s given. The quantitative determination of the phase compositionas carried out by the Rietveld method [7]. A useful paper con-
erning the refinement strategy using this method was presentedy McCusker and coworkers [8]. In the work of Nauer et al. [9] therocedure of semi-quantitative depth profiling of a layered sam-le by variation of the incidence angle is described in detail. Thisechnique was applied for the investigation of electrochemicallyrepared multi-layered structures. A deeper analytical treatise ofhis topic is presented in the papers of Kötschau and Schock [10]nd of Colombi and coworkers [11]. An in situ GIXD investigation
f lead electrodes in 5 M sulphuric acid was presented by Nauer in996 [12], using a classical �–� goniometer and an improved elec-rochemical cell. The author reports the formation of lead sulphatend �-PbO2 as the main products on the lead electrode surface dur-ng the oxidation. An in situ study of electrochemical processes on
9 istry a
sG[ae
lutwacsopHvot�twvostpta
et
→
dvsgucv
2
2
fRplgdbt5pshcaettenfX
sw0tWv12g
2
tcaGdosa
a20 kV acceleration voltage. An ESEM-FEG (environmental scanning electron micro-scope with field emission gun, XL30, FEI, Netherlands) device was used for thatpurpose. A careful ex situ characterization of the electrode surfaces with respect tophase composition, crystallite size, depth profile was carried out. In addition thephase depth profile was qualitatively determined.
Table 1Ion concentrations and pH values in the two investigated electrolyte solutionsaccording to [20].
1 M H2SO4 Electrolyte 2
84 P. Angerer et al. / Materials Chem
ilver electrodes in aqueous solutions of halogenides by means ofIXD methods was presented by Sathiyanarayanan and coworkers
13]. The results of similar investigations on copper electrodes inlkaline chloride and sulphate electrolytes were reported by Kautekt al. [14].
In another publication the oxidation and reduction reactions ofead electrodes were studied by a complementary in situ methodsing external reflection absorption infrared spectroscopy [15]. Inhat paper the amount of lead sulphate on the electrode surfaceas determined by measuring the intensity of specific vibrational
bsorption bands. The group of D. Pavlov presented several papersoncerning the electrochemical processes of lead electrodes inulphuric acid (e.g. [16,17]). They propose a mechanism of leadxidation in sulphuric acid where initially a layer of lead sul-hate is produced, then the pH at the electrode rises because of+-migration and t-PbO (tetragonal) is formed. This t-PbO is con-erted to �-PbO2 (orthorhombic) in the course of the further anodicxidation; �-PbO2 (tetragonal) is subsequently produced by elec-rochemical reaction from the solution [18]. The phases �-PbO2,-PbO2, and t-PbO were detected ex situ. Furthermore, the varia-
ion of the crystallite size and a depth profile of the oxidized surfaceere determined. In particular, the size of the �-PbO2 crystals
aries strongly with the pH of the electrolyte. An increased amountf �-PbO2 and �-PbO2 in the region close to the lead electrodeurface was reported. Further papers were presented concerninghe technological relevance of the ratio of the various lead dioxidehases in the active mass, its variation with the H2SO4 concentra-ion in the electrolyte and its influence on lead-acid battery capacitynd cycle life performance [19].
Lead in contact with sulphuric acid exhibits various anodiclectrochemical processes depending on the potential (anodic reac-ions, i.e., oxidation processes):
Dissolution of metallic lead according to the reaction scheme
Pbmetal
Pb2++ 2e−(E0= −0.1263 V vs. normal hydrogen electrode, NHE)
The precipitation/dissolution process of lead sulphate accordingto
Pb2+ + SO42− ↔ PbSO4 ↓ (Solubility product : 1.06 × 10⁻⁶)
is not a chemical reaction sensu stricto but is very important forthe kinetic of the lead electrode processes. Since lead sulphate isonly sparingly soluble, the combined reaction can be written as:
Pbmetal + SO42− ↔ PbSO4 ↓ + 2e− (E0 = −0.356 V vs. NHE)
If the transport of sulphate to the electrode surface is slower thanthe dissolution of lead, hydrolysis occurs:
Pb2+ + 2H2O ↔ Pb(OH)2 ↓ + 2H+
In the presence of residual amounts of sulphate the formation ofbasic lead sulphates is also possible according to the equations:
4Pb2+ + 4H2O + SO42− → 3PbO·PbSO4·H2O + 6H+
5Pb2+ + 4H2O + SO42− → 4PbO·PbSO4 + 8H+
The anodic oxidation of lead sulphate to lead dioxide occurs at amore anodic potential:
PbSO4+ 2H2O → PbO2+ SO42−+ 4H++ 2e−(E0= 1.685 V vs. NHE)
p[[[[
nd Physics 114 (2009) 983–989
Establishing a method for the observation of the formation ofifferent lead dioxide phases which cannot be distinguished by con-entional chemical methods was one of the topics of the presenttudy. Furthermore, the possibility of depth profiling of the in situenerated electrode surfaces combined with improved data eval-ation techniques should be demonstrated. In addition, the phaseompositions, crystallite sizes and depth profiles were measuredia XRD-measurements.
. Experimental
.1. Electrochemical measurements
The structural parts of the electrochemical cell used for this study are maderom acrylic glass (“Plexiglas”, manufactured by Röhm Degussa-Group, Germany).ectangular counter electrodes (2 mm × 24 mm) were inserted both left and rightarallel to the working electrode (11 mm × 24 mm) made of lead (battery grade soft
ead, provided by Banner, Austria) and fixed with epoxy resin. The electrodes wereround flush with the acrylic glass using grinding SiC-paper of decreasing grain sizeown to 4000 mesh, using water as fluid medium. The electrodes were contactedy copper wires passing through the bottom of the cell. The cell was connected viawo boreholes, tube connectors and tubes to the reference electrode (Hg/Hg2SO4 inM H2SO4) and the electrolyte reservoir. The cell was subsequently covered with aolymer film of 4 �m thickness (Prolene, Chemplex Industries Inc., USA). Test mea-urements at low incidence angles in the range of 0.5–2◦ showed that this materialas no relevant X-ray reflections at diffraction angles >20◦ in 2�. During the electro-hemical reaction the electrolyte was continuously flowing through the cell underhydrostatic pressure of about 1 kPa; the flow and the hydrostatic pressure in the
lectrochemical cell were adjusted by varying the height of the reservoirs relativeo the cell. For the XRD measurements the reservoir flasks were lowered belowhe cell level; the resulting suction effect caused the Prolene foil to cover the leadlectrode smoothly with an electrolyte film less than 150 �m in between. This isecessary because even a small positive hydrostatic pressure raises the Prolene film
rom the electrode surface and the resulting thicker electrolyte film attenuates the-ray beam considerably.
During the experiments the electrochemical cell was controlled by a potentio-tat/galvanostat IMP83 (Jaissle Elektronik GmbH, Germany). The anodic oxidationas performed galvanostatically with a current of 100 �A (current density of.38 �A cm−2); every 15 min the system was set to potentiostatic control, the elec-rolyte pressure was lowered and the in situ XRD measurement was carried out.
hen the X-ray beam has been switched off the cell was flooded again and the gal-anostatic oxidation was resumed. The electrolytes used for the investigations wereM H2SO4 with no further additives, and sulphuric acid with 0.25 M Na+ (electrolyte). The ion concentrations and the pH in these two electrolytes according to [20] areiven in Table 1. The ionic strength of both electrolytes is 3.17 M.
.2. Characterization
The in situ GIXD experiments were performed using a thin film diffractome-er device assembled at ECHEM (Cu K� radiation 40 kV, 30 mA) equipped with aurved image-plate position sensitive detector (IP-PSD) with a radius of 140 mm,resolution of better than 0.1◦ FWHM and a 2� range of 140◦ (Stoe & Cie GmbH,ermany). The exposure time was 200 s. The angle of incidence ˛ was fixed to 2◦
uring the in situ measurement series. For the investigation of the initial phasesf the electrochemical process a flat position sensitive detector (Linear-PSD) of theame manufacturer with a resolution <0.06◦ FWHM and a 2� range of 5–7◦ wasttached at the same device (2◦ angle of incidence and 50 s exposure time).
After the in situ measurements, the electrochemical cell was washed and driednd subsequently investigated ex situ by scanning electron microscopy (SEM) using
H −0.1 0.0H+] (mol l−1) 1.29 1.01HSO4
−] (mol l−1) 0.71 0.61SO4
2−] (mol l−1) 0.29 0.33Na+] (mol l−1) 0.00 0.25
P. Angerer et al. / Materials Chemistry a
Fd2
e(mmFwtaicsp
t
wttp
Vpp
Faa(o(a
ptctaiRmwlt
3
fr(rflftspeot
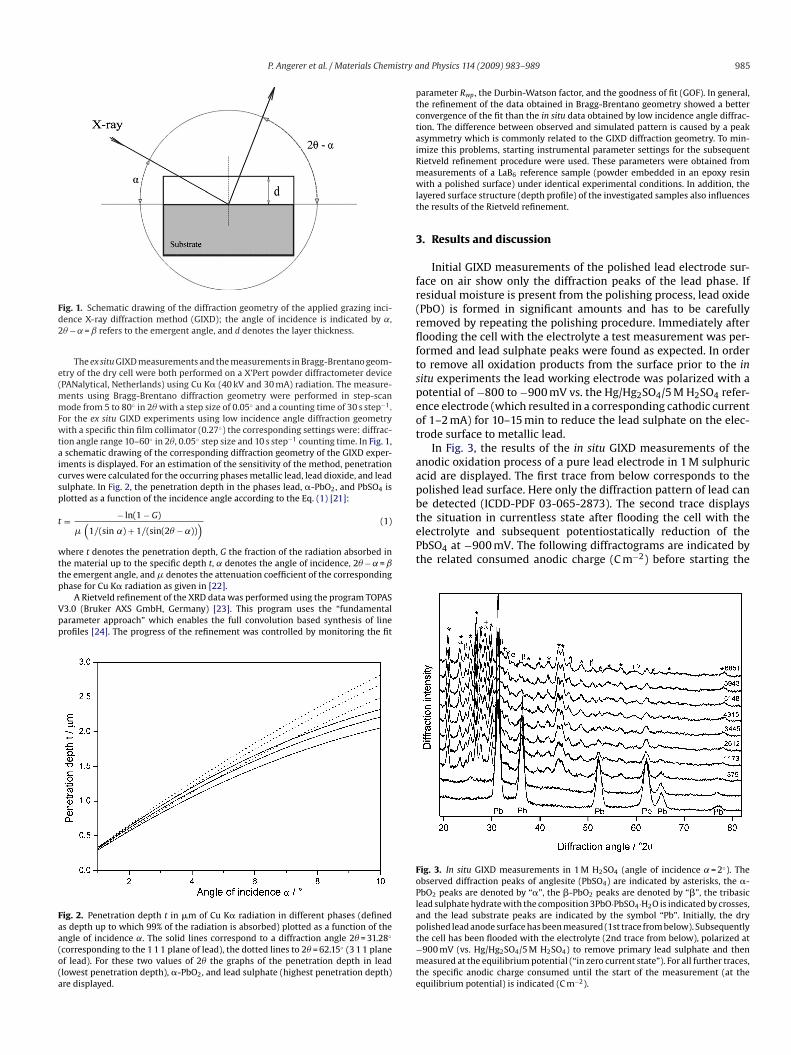
aapbthe situation in currentless state after flooding the cell with theelectrolyte and subsequent potentiostatically reduction of thePbSO4 at −900 mV. The following diffractograms are indicated bythe related consumed anodic charge (C m−2) before starting the
ig. 1. Schematic drawing of the diffraction geometry of the applied grazing inci-ence X-ray diffraction method (GIXD); the angle of incidence is indicated by ˛,� − ˛ = ˇ refers to the emergent angle, and d denotes the layer thickness.
The ex situ GIXD measurements and the measurements in Bragg-Brentano geom-try of the dry cell were both performed on a X’Pert powder diffractometer devicePANalytical, Netherlands) using Cu K� (40 kV and 30 mA) radiation. The measure-
ents using Bragg-Brentano diffraction geometry were performed in step-scanode from 5 to 80◦ in 2� with a step size of 0.05◦ and a counting time of 30 s step−1.
or the ex situ GIXD experiments using low incidence angle diffraction geometryith a specific thin film collimator (0.27◦) the corresponding settings were: diffrac-
ion angle range 10–60◦ in 2�, 0.05◦ step size and 10 s step−1 counting time. In Fig. 1,schematic drawing of the corresponding diffraction geometry of the GIXD exper-
ments is displayed. For an estimation of the sensitivity of the method, penetrationurves were calculated for the occurring phases metallic lead, lead dioxide, and leadulphate. In Fig. 2, the penetration depth in the phases lead, �-PbO2, and PbSO4 islotted as a function of the incidence angle according to the Eq. (1) [21]:
= − ln(1 − G)
�(
1/(sin ˛) + 1/(sin(2� − ˛))) (1)
here t denotes the penetration depth, G the fraction of the radiation absorbed inhe material up to the specific depth t, ˛ denotes the angle of incidence, 2� − ˛ = ˇ
he emergent angle, and � denotes the attenuation coefficient of the correspondinghase for Cu K� radiation as given in [22].A Rietveld refinement of the XRD data was performed using the program TOPAS3.0 (Bruker AXS GmbH, Germany) [23]. This program uses the “fundamentalarameter approach” which enables the full convolution based synthesis of linerofiles [24]. The progress of the refinement was controlled by monitoring the fit
ig. 2. Penetration depth t in �m of Cu K� radiation in different phases (defineds depth up to which 99% of the radiation is absorbed) plotted as a function of thengle of incidence ˛. The solid lines correspond to a diffraction angle 2� = 31.28◦
corresponding to the 1 1 1 plane of lead), the dotted lines to 2� = 62.15◦ (3 1 1 planef lead). For these two values of 2� the graphs of the penetration depth in leadlowest penetration depth), �-PbO2, and lead sulphate (highest penetration depth)re displayed.
FoPlapt−mte
nd Physics 114 (2009) 983–989 985
arameter Rwp , the Durbin-Watson factor, and the goodness of fit (GOF). In general,he refinement of the data obtained in Bragg-Brentano geometry showed a betteronvergence of the fit than the in situ data obtained by low incidence angle diffrac-ion. The difference between observed and simulated pattern is caused by a peaksymmetry which is commonly related to the GIXD diffraction geometry. To min-mize this problems, starting instrumental parameter settings for the subsequentietveld refinement procedure were used. These parameters were obtained fromeasurements of a LaB6 reference sample (powder embedded in an epoxy resinith a polished surface) under identical experimental conditions. In addition, the
ayered surface structure (depth profile) of the investigated samples also influenceshe results of the Rietveld refinement.
. Results and discussion
Initial GIXD measurements of the polished lead electrode sur-ace on air show only the diffraction peaks of the lead phase. Ifesidual moisture is present from the polishing process, lead oxidePbO) is formed in significant amounts and has to be carefullyemoved by repeating the polishing procedure. Immediately afterooding the cell with the electrolyte a test measurement was per-
ormed and lead sulphate peaks were found as expected. In ordero remove all oxidation products from the surface prior to the initu experiments the lead working electrode was polarized with aotential of −800 to −900 mV vs. the Hg/Hg2SO4/5 M H2SO4 refer-nce electrode (which resulted in a corresponding cathodic currentf 1–2 mA) for 10–15 min to reduce the lead sulphate on the elec-rode surface to metallic lead.
In Fig. 3, the results of the in situ GIXD measurements of thenodic oxidation process of a pure lead electrode in 1 M sulphuriccid are displayed. The first trace from below corresponds to theolished lead surface. Here only the diffraction pattern of lead cane detected (ICDD-PDF 03-065-2873). The second trace displays
ig. 3. In situ GIXD measurements in 1 M H2SO4 (angle of incidence ˛ = 2◦). Thebserved diffraction peaks of anglesite (PbSO4) are indicated by asterisks, the �-bO2 peaks are denoted by “�”, the �-PbO2 peaks are denoted by “�”, the tribasicead sulphate hydrate with the composition 3PbO·PbSO4·H2O is indicated by crosses,nd the lead substrate peaks are indicated by the symbol “Pb”. Initially, the dryolished lead anode surface has been measured (1st trace from below). Subsequentlyhe cell has been flooded with the electrolyte (2nd trace from below), polarized at900 mV (vs. Hg/Hg2SO4/5 M H2SO4) to remove primary lead sulphate and theneasured at the equilibrium potential (“in zero current state”). For all further traces,
he specific anodic charge consumed until the start of the measurement (at thequilibrium potential) is indicated (C m−2).
9 istry and Physics 114 (2009) 983–989
ccsswc1aat0
isdpnpieaotiwrt
mpipsifct(o
FmmadlH
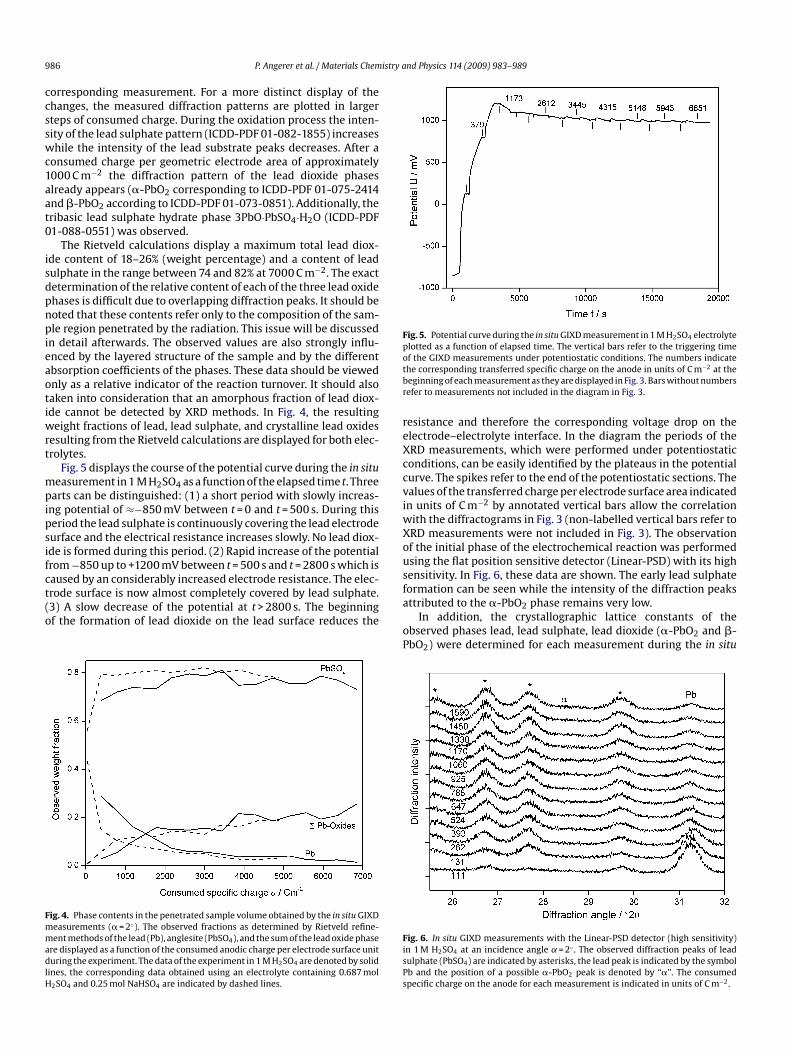
Fig. 5. Potential curve during the in situ GIXD measurement in 1 M H2SO4 electrolyteplotted as a function of elapsed time. The vertical bars refer to the triggering timeotbr
reXccviwXou
86 P. Angerer et al. / Materials Chem
orresponding measurement. For a more distinct display of thehanges, the measured diffraction patterns are plotted in largerteps of consumed charge. During the oxidation process the inten-ity of the lead sulphate pattern (ICDD-PDF 01-082-1855) increaseshile the intensity of the lead substrate peaks decreases. After a
onsumed charge per geometric electrode area of approximately000 C m−2 the diffraction pattern of the lead dioxide phaseslready appears (�-PbO2 corresponding to ICDD-PDF 01-075-2414nd �-PbO2 according to ICDD-PDF 01-073-0851). Additionally, theribasic lead sulphate hydrate phase 3PbO·PbSO4·H2O (ICDD-PDF1-088-0551) was observed.
The Rietveld calculations display a maximum total lead diox-de content of 18–26% (weight percentage) and a content of leadulphate in the range between 74 and 82% at 7000 C m−2. The exactetermination of the relative content of each of the three lead oxidehases is difficult due to overlapping diffraction peaks. It should beoted that these contents refer only to the composition of the sam-le region penetrated by the radiation. This issue will be discussed
n detail afterwards. The observed values are also strongly influ-nced by the layered structure of the sample and by the differentbsorption coefficients of the phases. These data should be viewednly as a relative indicator of the reaction turnover. It should alsoaken into consideration that an amorphous fraction of lead diox-de cannot be detected by XRD methods. In Fig. 4, the resulting
eight fractions of lead, lead sulphate, and crystalline lead oxidesesulting from the Rietveld calculations are displayed for both elec-rolytes.
Fig. 5 displays the course of the potential curve during the in situeasurement in 1 M H2SO4 as a function of the elapsed time t. Three
arts can be distinguished: (1) a short period with slowly increas-ng potential of ≈−850 mV between t = 0 and t = 500 s. During thiseriod the lead sulphate is continuously covering the lead electrodeurface and the electrical resistance increases slowly. No lead diox-de is formed during this period. (2) Rapid increase of the potentialrom −850 up to +1200 mV between t = 500 s and t = 2800 s which is
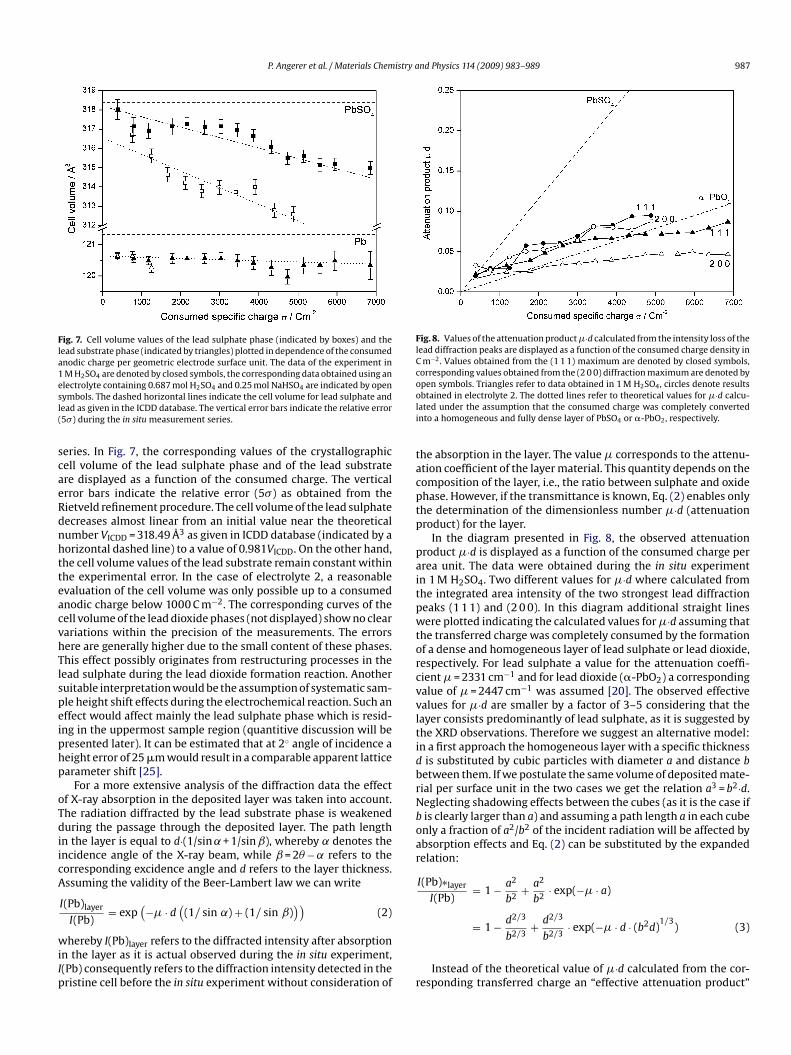
aused by an considerably increased electrode resistance. The elec-rode surface is now almost completely covered by lead sulphate.3) A slow decrease of the potential at t > 2800 s. The beginningf the formation of lead dioxide on the lead surface reduces theig. 4. Phase contents in the penetrated sample volume obtained by the in situ GIXDeasurements (� = 2◦). The observed fractions as determined by Rietveld refine-ent methods of the lead (Pb), anglesite (PbSO4), and the sum of the lead oxide phase
re displayed as a function of the consumed anodic charge per electrode surface unituring the experiment. The data of the experiment in 1 M H2SO4 are denoted by solid
ines, the corresponding data obtained using an electrolyte containing 0.687 mol2SO4 and 0.25 mol NaHSO4 are indicated by dashed lines.
sfa
oP
FisPs
f the GIXD measurements under potentiostatic conditions. The numbers indicatehe corresponding transferred specific charge on the anode in units of C m−2 at theeginning of each measurement as they are displayed in Fig. 3. Bars without numbersefer to measurements not included in the diagram in Fig. 3.
esistance and therefore the corresponding voltage drop on thelectrode–electrolyte interface. In the diagram the periods of theRD measurements, which were performed under potentiostaticonditions, can be easily identified by the plateaus in the potentialurve. The spikes refer to the end of the potentiostatic sections. Thealues of the transferred charge per electrode surface area indicatedn units of C m−2 by annotated vertical bars allow the correlation
ith the diffractograms in Fig. 3 (non-labelled vertical bars refer toRD measurements were not included in Fig. 3). The observationf the initial phase of the electrochemical reaction was performedsing the flat position sensitive detector (Linear-PSD) with its highensitivity. In Fig. 6, these data are shown. The early lead sulphate
ormation can be seen while the intensity of the diffraction peaksttributed to the �-PbO2 phase remains very low.In addition, the crystallographic lattice constants of thebserved phases lead, lead sulphate, lead dioxide (�-PbO2 and �-bO2) were determined for each measurement during the in situ
ig. 6. In situ GIXD measurements with the Linear-PSD detector (high sensitivity)n 1 M H2SO4 at an incidence angle ˛ = 2◦ . The observed diffraction peaks of leadulphate (PbSO4) are indicated by asterisks, the lead peak is indicated by the symbolb and the position of a possible �-PbO2 peak is denoted by “�”. The consumedpecific charge on the anode for each measurement is indicated in units of C m−2.
P. Angerer et al. / Materials Chemistry and Physics 114 (2009) 983–989 987
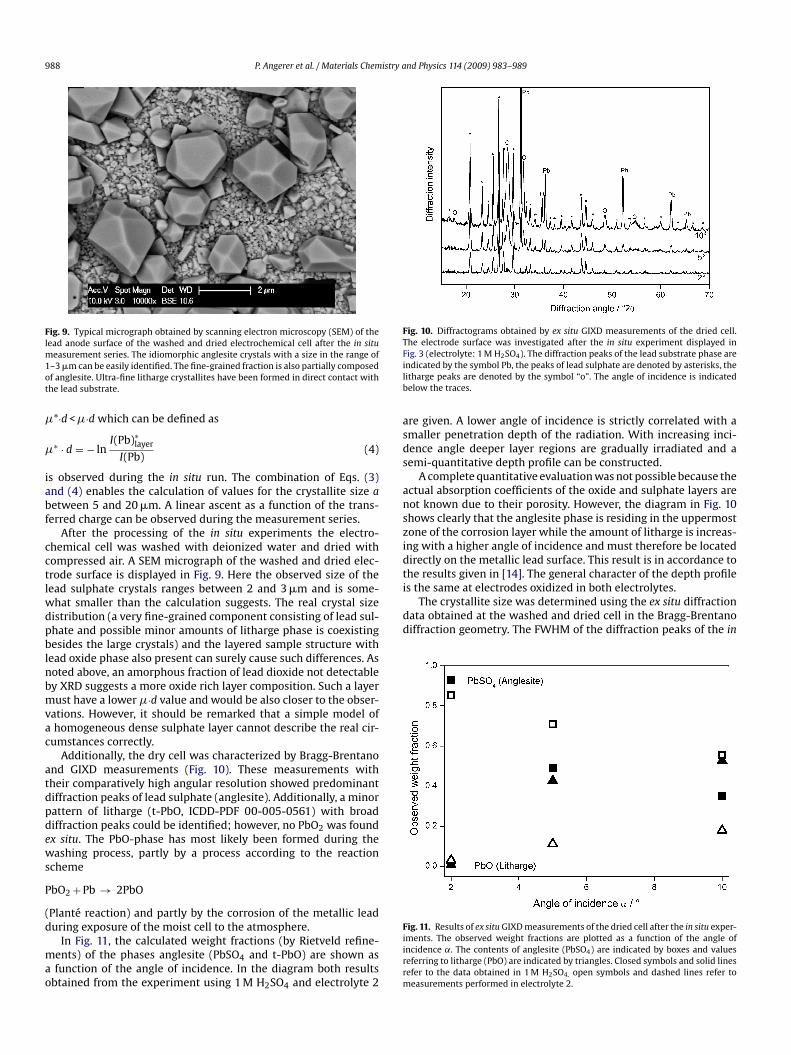
Fig. 7. Cell volume values of the lead sulphate phase (indicated by boxes) and thelead substrate phase (indicated by triangles) plotted in dependence of the consumedanodic charge per geometric electrode surface unit. The data of the experiment in1 M H2SO4 are denoted by closed symbols, the corresponding data obtained using anesl(
scaeRdnhtteacvhTlspeiphp
oTdiicA
wiIp
Fig. 8. Values of the attenuation product �·d calculated from the intensity loss of thelead diffraction peaks are displayed as a function of the consumed charge density inC m−2. Values obtained from the (1 1 1) maximum are denoted by closed symbols,corresponding values obtained from the (2 0 0) diffraction maximum are denoted byopen symbols. Triangles refer to data obtained in 1 M H SO , circles denote resultsoli
tacptp
paitpwtorcvvltidbrNboar
lectrolyte containing 0.687 mol H2SO4 and 0.25 mol NaHSO4 are indicated by openymbols. The dashed horizontal lines indicate the cell volume for lead sulphate andead as given in the ICDD database. The vertical error bars indicate the relative error5�) during the in situ measurement series.
eries. In Fig. 7, the corresponding values of the crystallographicell volume of the lead sulphate phase and of the lead substratere displayed as a function of the consumed charge. The verticalrror bars indicate the relative error (5�) as obtained from theietveld refinement procedure. The cell volume of the lead sulphateecreases almost linear from an initial value near the theoreticalumber VICDD = 318.49 Å3 as given in ICDD database (indicated by aorizontal dashed line) to a value of 0.981VICDD. On the other hand,he cell volume values of the lead substrate remain constant withinhe experimental error. In the case of electrolyte 2, a reasonablevaluation of the cell volume was only possible up to a consumednodic charge below 1000 C m−2. The corresponding curves of theell volume of the lead dioxide phases (not displayed) show no clearariations within the precision of the measurements. The errorsere are generally higher due to the small content of these phases.his effect possibly originates from restructuring processes in theead sulphate during the lead dioxide formation reaction. Anotheruitable interpretation would be the assumption of systematic sam-le height shift effects during the electrochemical reaction. Such anffect would affect mainly the lead sulphate phase which is resid-ng in the uppermost sample region (quantitive discussion will beresented later). It can be estimated that at 2◦ angle of incidence aeight error of 25 �m would result in a comparable apparent latticearameter shift [25].
For a more extensive analysis of the diffraction data the effectf X-ray absorption in the deposited layer was taken into account.he radiation diffracted by the lead substrate phase is weakeneduring the passage through the deposited layer. The path length
n the layer is equal to d·(1/sin ˛ + 1/sin ˇ), whereby ˛ denotes thencidence angle of the X-ray beam, while ˇ = 2� − ˛ refers to theorresponding excidence angle and d refers to the layer thickness.ssuming the validity of the Beer-Lambert law we can write
I(Pb)layer
I(Pb)= exp
(−� · d
((1/ sin ˛) + (1/ sin ˇ)
))(2)
hereby I(Pb)layer refers to the diffracted intensity after absorptionn the layer as it is actual observed during the in situ experiment,(Pb) consequently refers to the diffraction intensity detected in theristine cell before the in situ experiment without consideration of r
2 4
btained in electrolyte 2. The dotted lines refer to theoretical values for �·d calcu-ated under the assumption that the consumed charge was completely convertednto a homogeneous and fully dense layer of PbSO4 or �-PbO2, respectively.
he absorption in the layer. The value � corresponds to the attenu-tion coefficient of the layer material. This quantity depends on theomposition of the layer, i.e., the ratio between sulphate and oxidehase. However, if the transmittance is known, Eq. (2) enables onlyhe determination of the dimensionless number �·d (attenuationroduct) for the layer.
In the diagram presented in Fig. 8, the observed attenuationroduct �·d is displayed as a function of the consumed charge perrea unit. The data were obtained during the in situ experimentn 1 M H2SO4. Two different values for �·d where calculated fromhe integrated area intensity of the two strongest lead diffractioneaks (1 1 1) and (2 0 0). In this diagram additional straight linesere plotted indicating the calculated values for �·d assuming that
he transferred charge was completely consumed by the formationf a dense and homogeneous layer of lead sulphate or lead dioxide,espectively. For lead sulphate a value for the attenuation coeffi-ient � = 2331 cm−1 and for lead dioxide (�-PbO2) a correspondingalue of � = 2447 cm−1 was assumed [20]. The observed effectivealues for �·d are smaller by a factor of 3–5 considering that theayer consists predominantly of lead sulphate, as it is suggested byhe XRD observations. Therefore we suggest an alternative model:n a first approach the homogeneous layer with a specific thickness
is substituted by cubic particles with diameter a and distance between them. If we postulate the same volume of deposited mate-ial per surface unit in the two cases we get the relation a3 = b2·d.eglecting shadowing effects between the cubes (as it is the case ifis clearly larger than a) and assuming a path length a in each cubenly a fraction of a2/b2 of the incident radiation will be affected bybsorption effects and Eq. (2) can be substituted by the expandedelation:
I(Pb)∗layer
I(Pb)= 1 − a2
b2+ a2
b2· exp(−� · a)
= 1 − d2/3+ d2/3
· exp(−� · d · (b2d)1/3
) (3)
b2/3 b2/3Instead of the theoretical value of �·d calculated from the cor-esponding transferred charge an “effective attenuation product”
988 P. Angerer et al. / Materials Chemistry and Physics 114 (2009) 983–989
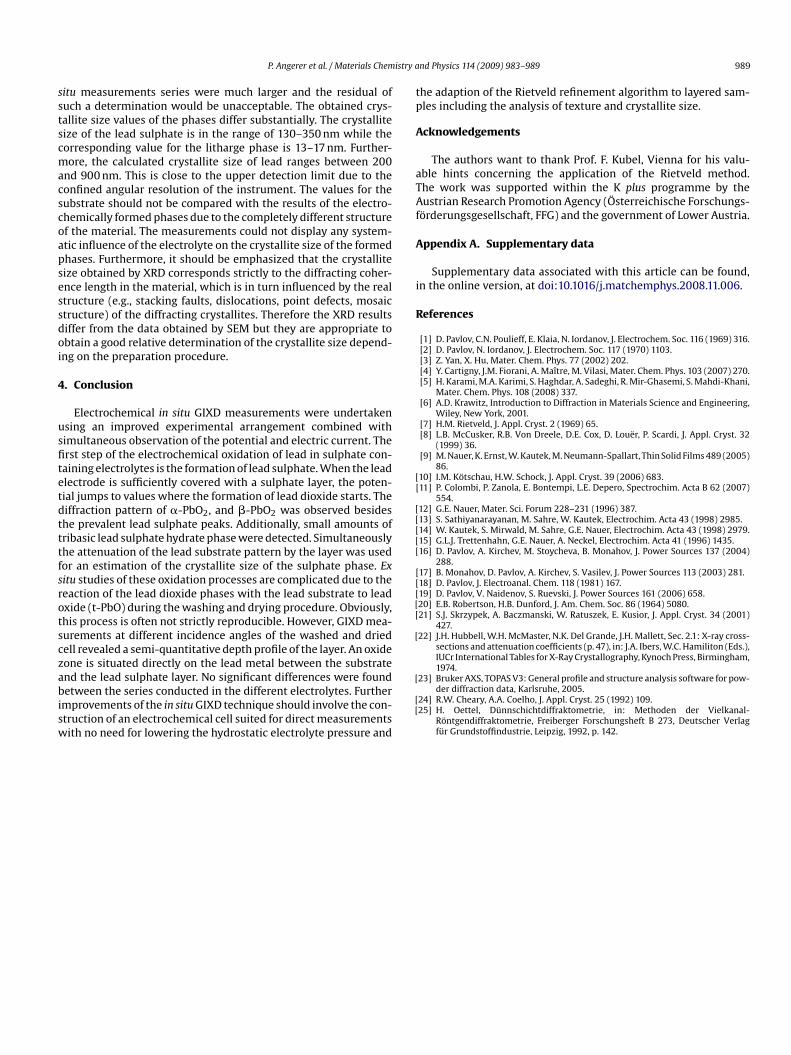
Fig. 9. Typical micrograph obtained by scanning electron microscopy (SEM) of thelead anode surface of the washed and dried electrochemical cell after the in situm1ot
�
�
iabf
cctlwdpblnbmvac
atdpdews
P
(d
mao
Fig. 10. Diffractograms obtained by ex situ GIXD measurements of the dried cell.The electrode surface was investigated after the in situ experiment displayed inFilb
asds
anszidtis the same at electrodes oxidized in both electrolytes.
The crystallite size was determined using the ex situ diffractiondata obtained at the washed and dried cell in the Bragg-Brentanodiffraction geometry. The FWHM of the diffraction peaks of the in
easurement series. The idiomorphic anglesite crystals with a size in the range of–3 �m can be easily identified. The fine-grained fraction is also partially composedf anglesite. Ultra-fine litharge crystallites have been formed in direct contact withhe lead substrate.
*·d < �·d which can be defined as
∗ · d = − lnI(Pb)∗
layer
I(Pb)(4)
s observed during the in situ run. The combination of Eqs. (3)nd (4) enables the calculation of values for the crystallite size aetween 5 and 20 �m. A linear ascent as a function of the trans-erred charge can be observed during the measurement series.
After the processing of the in situ experiments the electro-hemical cell was washed with deionized water and dried withompressed air. A SEM micrograph of the washed and dried elec-rode surface is displayed in Fig. 9. Here the observed size of theead sulphate crystals ranges between 2 and 3 �m and is some-
hat smaller than the calculation suggests. The real crystal sizeistribution (a very fine-grained component consisting of lead sul-hate and possible minor amounts of litharge phase is coexistingesides the large crystals) and the layered sample structure with
ead oxide phase also present can surely cause such differences. Asoted above, an amorphous fraction of lead dioxide not detectabley XRD suggests a more oxide rich layer composition. Such a layerust have a lower �·d value and would be also closer to the obser-
ations. However, it should be remarked that a simple model ofhomogeneous dense sulphate layer cannot describe the real cir-
umstances correctly.Additionally, the dry cell was characterized by Bragg-Brentano
nd GIXD measurements (Fig. 10). These measurements withheir comparatively high angular resolution showed predominantiffraction peaks of lead sulphate (anglesite). Additionally, a minorattern of litharge (t-PbO, ICDD-PDF 00-005-0561) with broadiffraction peaks could be identified; however, no PbO2 was foundx situ. The PbO-phase has most likely been formed during theashing process, partly by a process according to the reaction
cheme
bO2 + Pb → 2PbO
Planté reaction) and partly by the corrosion of the metallic lead
uring exposure of the moist cell to the atmosphere.In Fig. 11, the calculated weight fractions (by Rietveld refine-ents) of the phases anglesite (PbSO4 and t-PbO) are shown asfunction of the angle of incidence. In the diagram both results
btained from the experiment using 1 M H2SO4 and electrolyte 2
Fiirrm
ig. 3 (electrolyte: 1 M H2SO4). The diffraction peaks of the lead substrate phase arendicated by the symbol Pb, the peaks of lead sulphate are denoted by asterisks, theitharge peaks are denoted by the symbol “o”. The angle of incidence is indicatedelow the traces.
re given. A lower angle of incidence is strictly correlated with amaller penetration depth of the radiation. With increasing inci-ence angle deeper layer regions are gradually irradiated and aemi-quantitative depth profile can be constructed.
A complete quantitative evaluation was not possible because thectual absorption coefficients of the oxide and sulphate layers areot known due to their porosity. However, the diagram in Fig. 10hows clearly that the anglesite phase is residing in the uppermostone of the corrosion layer while the amount of litharge is increas-ng with a higher angle of incidence and must therefore be locatedirectly on the metallic lead surface. This result is in accordance tohe results given in [14]. The general character of the depth profile
ig. 11. Results of ex situ GIXD measurements of the dried cell after the in situ exper-ments. The observed weight fractions are plotted as a function of the angle ofncidence ˛. The contents of anglesite (PbSO4) are indicated by boxes and valueseferring to litharge (PbO) are indicated by triangles. Closed symbols and solid linesefer to the data obtained in 1 M H2SO4, open symbols and dashed lines refer toeasurements performed in electrolyte 2.
istry a
sstscmacscoapsessdoi
4
usfitetdtttfsrotsczabisw
tp
A
aTAf
A
i
R
[[
[[[[[
[[[[[
[
P. Angerer et al. / Materials Chem
itu measurements series were much larger and the residual ofuch a determination would be unacceptable. The obtained crys-allite size values of the phases differ substantially. The crystalliteize of the lead sulphate is in the range of 130–350 nm while theorresponding value for the litharge phase is 13–17 nm. Further-ore, the calculated crystallite size of lead ranges between 200
nd 900 nm. This is close to the upper detection limit due to theonfined angular resolution of the instrument. The values for theubstrate should not be compared with the results of the electro-hemically formed phases due to the completely different structuref the material. The measurements could not display any system-tic influence of the electrolyte on the crystallite size of the formedhases. Furthermore, it should be emphasized that the crystalliteize obtained by XRD corresponds strictly to the diffracting coher-nce length in the material, which is in turn influenced by the realtructure (e.g., stacking faults, dislocations, point defects, mosaictructure) of the diffracting crystallites. Therefore the XRD resultsiffer from the data obtained by SEM but they are appropriate tobtain a good relative determination of the crystallite size depend-ng on the preparation procedure.
. Conclusion
Electrochemical in situ GIXD measurements were undertakensing an improved experimental arrangement combined withimultaneous observation of the potential and electric current. Therst step of the electrochemical oxidation of lead in sulphate con-aining electrolytes is the formation of lead sulphate. When the leadlectrode is sufficiently covered with a sulphate layer, the poten-ial jumps to values where the formation of lead dioxide starts. Theiffraction pattern of �-PbO2, and �-PbO2 was observed besideshe prevalent lead sulphate peaks. Additionally, small amounts ofribasic lead sulphate hydrate phase were detected. Simultaneouslyhe attenuation of the lead substrate pattern by the layer was usedor an estimation of the crystallite size of the sulphate phase. Exitu studies of these oxidation processes are complicated due to theeaction of the lead dioxide phases with the lead substrate to leadxide (t-PbO) during the washing and drying procedure. Obviously,his process is often not strictly reproducible. However, GIXD mea-urements at different incidence angles of the washed and driedell revealed a semi-quantitative depth profile of the layer. An oxideone is situated directly on the lead metal between the substrate
nd the lead sulphate layer. No significant differences were foundetween the series conducted in the different electrolytes. Furthermprovements of the in situ GIXD technique should involve the con-truction of an electrochemical cell suited for direct measurementsith no need for lowering the hydrostatic electrolyte pressure and
[
[[
nd Physics 114 (2009) 983–989 989
he adaption of the Rietveld refinement algorithm to layered sam-les including the analysis of texture and crystallite size.
cknowledgements
The authors want to thank Prof. F. Kubel, Vienna for his valu-ble hints concerning the application of the Rietveld method.he work was supported within the K plus programme by theustrian Research Promotion Agency (Österreichische Forschungs-
örderungsgesellschaft, FFG) and the government of Lower Austria.
ppendix A. Supplementary data
Supplementary data associated with this article can be found,n the online version, at doi:10.1016/j.matchemphys.2008.11.006.
eferences
[1] D. Pavlov, C.N. Poulieff, E. Klaia, N. Iordanov, J. Electrochem. Soc. 116 (1969) 316.[2] D. Pavlov, N. Iordanov, J. Electrochem. Soc. 117 (1970) 1103.[3] Z. Yan, X. Hu, Mater. Chem. Phys. 77 (2002) 202.[4] Y. Cartigny, J.M. Fiorani, A. Maître, M. Vilasi, Mater. Chem. Phys. 103 (2007) 270.[5] H. Karami, M.A. Karimi, S. Haghdar, A. Sadeghi, R. Mir-Ghasemi, S. Mahdi-Khani,
Mater. Chem. Phys. 108 (2008) 337.[6] A.D. Krawitz, Introduction to Diffraction in Materials Science and Engineering,
Wiley, New York, 2001.[7] H.M. Rietveld, J. Appl. Cryst. 2 (1969) 65.[8] L.B. McCusker, R.B. Von Dreele, D.E. Cox, D. Louër, P. Scardi, J. Appl. Cryst. 32
(1999) 36.[9] M. Nauer, K. Ernst, W. Kautek, M. Neumann-Spallart, Thin Solid Films 489 (2005)
86.10] I.M. Kötschau, H.W. Schock, J. Appl. Cryst. 39 (2006) 683.11] P. Colombi, P. Zanola, E. Bontempi, L.E. Depero, Spectrochim. Acta B 62 (2007)
554.12] G.E. Nauer, Mater. Sci. Forum 228–231 (1996) 387.13] S. Sathiyanarayanan, M. Sahre, W. Kautek, Electrochim. Acta 43 (1998) 2985.14] W. Kautek, S. Mirwald, M. Sahre, G.E. Nauer, Electrochim. Acta 43 (1998) 2979.15] G.L.J. Trettenhahn, G.E. Nauer, A. Neckel, Electrochim. Acta 41 (1996) 1435.16] D. Pavlov, A. Kirchev, M. Stoycheva, B. Monahov, J. Power Sources 137 (2004)
288.17] B. Monahov, D. Pavlov, A. Kirchev, S. Vasilev, J. Power Sources 113 (2003) 281.18] D. Pavlov, J. Electroanal. Chem. 118 (1981) 167.19] D. Pavlov, V. Naidenov, S. Ruevski, J. Power Sources 161 (2006) 658.20] E.B. Robertson, H.B. Dunford, J. Am. Chem. Soc. 86 (1964) 5080.21] S.J. Skrzypek, A. Baczmanski, W. Ratuszek, E. Kusior, J. Appl. Cryst. 34 (2001)
427.22] J.H. Hubbell, W.H. McMaster, N.K. Del Grande, J.H. Mallett, Sec. 2.1: X-ray cross-
sections and attenuation coefficients (p. 47), in: J.A. Ibers, W.C. Hamiliton (Eds.),IUCr International Tables for X-Ray Crystallography, Kynoch Press, Birmingham,1974.
23] Bruker AXS, TOPAS V3: General profile and structure analysis software for pow-der diffraction data, Karlsruhe, 2005.
24] R.W. Cheary, A.A. Coelho, J. Appl. Cryst. 25 (1992) 109.25] H. Oettel, Dünnschichtdiffraktometrie, in: Methoden der Vielkanal-
Röntgendiffraktometrie, Freiberger Forschungsheft B 273, Deutscher Verlagfür Grundstoffindustrie, Leipzig, 1992, p. 142.