Analysis of equilibrium shift in isothermal reactors with a permselective wall

Acta Materialia 51 (2003) 3927–3938www.actamat-journals.com
In-situ study of pearlite nucleation and growth duringisothermal austenite decomposition in nearly eutectoid steel
S.E. Offermana,b,∗, L.J.G.W. van Wilderena,b, N.H. van Dijka, J. Sietsmab,M.Th. Rekveldta, S. van der Zwaagb, 1
a Interfaculty Reactor Institute, Delft University of Technology, Mekelweg 15, 2629 JB Delft, The Netherlandsb Laboratory of Materials Science, Delft University of Technology, Rotterdamseweg 137, 2628 AL Delft, The Netherlands
Received 23 January 2003; received in revised form 10 April 2003; accepted 14 April 2003
Abstract
The evolution of the microstructure during the isothermal austenite/pearlite transformation in a nearly eutectoid steelwas studied by the three-dimensional neutron depolarization technique, which simultaneously provides informationabout the pearlite fraction, the average pearlite colony size, and the spatial distribution of the pearlite colonies duringthe transformation. The in-situ measurements show that the pearlite nucleation rate increases linearly with time witha temperature-dependent slope. The in-situ measured average pearlite growth rate is accurately described by the Zener-Hillert theory, which assumes that volume diffusion of carbon is the rate-controlling mechanism. The measured overalltransformation rate deviates from the predictions of the theory developed by Kolmogorov, Johnson, Mehl, and Avrami. 2003 Acta Materialia Inc. Published by Elsevier Science Ltd. All rights reserved.
Keywords:Pearlitic steels; Phase transformation kinetics; Neutron depolarization
1. Introduction
Pearlite is a common constituent of a wide var-iety of steels and provides a substantial contri-bution to the strength. A pearlite colony consistsof two interpenetrating single crystals of ferrite andcementite (Fe3C), which are primarily ordered as
∗ Corresponding author. Tel.:+31-15-278-5630; fax:+31-15-278-8303.
E-mail address: [email protected] (S.E.Offerman).
1 Present address: Faculty of Aerospace Engineering, DelftUniversity of Technology, Kluyverweg 1, 2629 HS Delft,The Netherlands
1359-6454/03/$30.00 2003 Acta Materialia Inc. Published by Elsevier Science Ltd. All rights reserved.doi:10.1016/S1359-6454(03)00217-9
alternating plates. Pearlite that consists of fineplates is harder and stronger than pearlite that con-sists of coarse plates. This morphology of pearliteis largely determined by the evolution of theaustenite/pearlite phase transformation during theproduction process. Control of the pearlite phasetransformation kinetics is thus of vital importancefor the production of tailor-made steels.
Despite the large variety of austenite/pearlitephase transformation models that have been pro-posed and the experiments that have been perfor-med to test them in the past 60 years, the kineticsof this transformation is still not completely under-stood. The reason why the pearlite nucleationmechanism is still not fully understood, lies in the
3928 S.E. Offerman et al. / Acta Materialia 51 (2003) 3927–3938
experimental difficulty to measure nucleationphenomena and in particular the nucleation ofpearlite. The nucleation mechanism of pearliteinvolves the formation of two crystallographicphases. In hypo-eutectoid steels the pro-eutectoidferrite nucleates first and continues to grow withthe same crystallographic orientation during thepearlite formation as part of a pearlite colony [1,2].In this case the cementite nucleation is the rate-limiting step in the formation of pearlite. In hyper-eutectoid steels the roles of ferrite and cementiteare reversed and in perfectly eutectoid steel thepearlite nucleation is assumed to take place at theaustenite grain corners, edges, and boundaries.However, the exact nature of the pearlitenucleation mechanism is still under debate.
Another important and continuing subject ofdebate is the rate-controlling mechanism for thegrowth of pearlite. There are two different theoriesproposed for the growth of pearlite. The Zener-Hil-lert theory assumes that the volume diffusion ofcarbon in the austenite, ahead of the advancingpearlite, is the rate-controlling mechanism [3,4].The Hillert theory on the other hand assumes thatgrain boundary diffusion of the carbon atoms is therate-controlling mechanism [5]. Several experi-mental studies were performed over the last dec-ades in order to measure the pearlite growth rateand determine the rate-controlling mechanism.Both volume [6–9] and grain boundary diffusion[10] were claimed to be the rate-controlling mech-anism, as well as more complex mechanisms [11].
The theory developed by Kolmogorov, Johnson,Mehl, and Avrami [12–16], also known as theKJMA theory, predicts the overall transformationrate on the basis of nucleation and growth rates.The KJMA-theory is one of the oldest and mostwidely used models to describe the pearlite phasetransformation kinetics. This concept still formsthe basis of many of the current phase transform-ation models.
The pearlite nucleation and growth rates have sofar been determined from ex-situ optical and elec-tron microscopy measurements, in which a seriesof steel specimens is annealed for increasing timesat a particular transformation temperature. Thehigh-temperature microstructure is frozen in at sev-eral stages of the transformation by quenching the
specimen to room temperature. At each stage thelargest pearlite colony size is determined, which isa measure for the pearlite growth rate. This methodhas two drawbacks. The first drawback is that itonly gives an estimate of the pearlite growth rateif the largest pearlite colony can be related to thefirst pearlite colony that nucleated. The seconddrawback is that the method only reflects the high-est observed growth rate.
These drawbacks can be avoided by using thethree-dimensional Neutron Depolarization (3DND)technique [17,18], which has created the opport-unity to study phase transformations in-situ in thebulk of steel. The 3DND technique provides aunique insight into the formation of the microstruc-ture as it probes the volume fraction of the mag-netic phase, the mean magnetic particle size, andthe spatial distribution of the forming ferromag-netic phase in the paramagnetic (austenite) matrix[19]. The technique is capable of determining thesethree parameters in-situ and simultaneously, whichmakes it a powerful tool for the study of phasetransformations in the bulk of ferromagneticmaterials.
The aim of this research is to measure in-situthe pearlite fraction, the average pearlite colonysize, and the spatial distribution as a function ofthe isothermal transformation time. This givesinformation about the nucleation rate, the rate-con-trolling mechanism for the growth of pearlite, andthe validity of the KJMA theory for the predictionof the overall austenite/pearlite transformation rate.The present paper is related to two previous paperson the austenite/pearlite transformation in the samesteel [20,21], which reported on the relationbetween the magnetic domain structure and themicrostructure, and gave a comparison with theresults of additional dilatometry experiments.
2. Pearlite transformation kinetics
2.1. Nucleation
The nucleation rate of the newly formed phaseduring a phase transformation is described by theclassical nucleation theory [22], in which the timedependent nucleation rate N is expressed as
3929S.E. Offerman et al. / Acta Materialia 51 (2003) 3927–3938
N � Nnb∗Zexp���G∗
kBT �exp��τt�, (1)
where Nn is the number of potential nucleationsites, Z is the Zeldovich non-equilibrium factor,kB = 1.38 × 10�23 J /K is the Boltzmann constant,and T the absolute temperature. The rate at whichthe iron atoms are added onto the critical nucleusis taken into account by the frequency factor b∗.The time t represents the incubation time and t isthe isothermal transformation time. The time-inde-pendent part of this equation is the steady statenucleation rate. The energy barrier that has to beovercome in order to form a critical nucleus isreferred to as the activation energy for nucleation�G∗, which can in general be written as
�G∗ � � /�g2V. (2)
The driving force for nucleation is the decrease inGibbs free energy per unit volume of the system�gV during the phase transformation, whichdepends on the chemical composition and the tem-perature. The creation of a new nucleus requiresenergy due to the formation of an interfacebetween the nucleus and the original phase. How-ever, in the case that the nucleus is formed at agrain boundary the removal of incoherentaustenite/austenite grain boundaries releasesenergy that can be used for the creation of a newinterface. The balance between the energy that isrequired for the formation of a new interface andthe energy that is released due to the removal ofthe old interface is represented by the factor �. Itis the uncertainty in � which makes predictions ofthe nucleation rate very difficult.
2.2. Growth
Nucleation is followed by the growth of pearlitecolonies. In the Zener-Hillert model [3,4], whichassumes that volume diffusion of carbon is therate-controlling mechanism for the growth ofpearlite, the growth rate GV is given by
GV �DgC,V
kV
l2
lalqCgaeq�Cgqeq
Cqeq�Caeq
1l�1�
lc
l �, (3)
where kV is a geometrical constant related to the
volume diffusion mechanism, DgC,V is the volumediffusion coefficient of carbon in austenite, and la
and lq are the lamella thickness of the ferrite andcementite, respectively. The pearlite lamellar spac-ing amounts to l = la + lq. Cgaeq and Cgqeq are theequilibrium carbon concentrations in the austenitein contact with ferrite and cementite, respectively.Caeq and Cqeq are the equilibrium carbon concen-trations in ferrite and cementite, respectively. Thecritical (theoretical minimum) spacing lc is givenby
lc �2gaqTA1
�TVm
�Hm, (4)
where gaq = 0.94 J /m2 [23] is the interfacial freeenergy of the ferrite/cementite interface in thepearlite, TA1 (= 995 K for the studied steel) is theaustenite/pearlite equilibrium transition tempera-ture, �T = TA1�T is the undercooling, �Hm =4.3 kJ /mol [23] is the change in molar enthalpy,and Vm = 7.1 × 10�6 m3 /mol the molar volume.The volume diffusion coefficient of carbon in aus-tenite DgC,V depends on the temperature and thenominal carbon concentration and can be describedby [24]
DgC,V � 4.53 � 10�7�1 � YC(1�YC)8339.9
T � (5)
� exp���1T
� 2.221 � 10�4�(17767�26436YC)�,
where DgC,V is in m2/s and the temperature T in K.The site fraction YC of carbon on the interstitialsub-lattice is given by
YC �xC
1�xC, (6)
where xC (= 0.0323 for the studied steel) is theoverall atom fraction of carbon in the alloy.
In the Hillert model [5], which assumes thatgrain boundary diffusion of carbon is the rate-con-trolling mechanism for the growth of pearlite, thegrowth rate GGB is given by:
GGB � 12kGBDgC,GBdl2
lalqCgaeq�Cgqeq
Cqeq�Caeq
1l2 (7)
�1�lc
l �,

3930 S.E. Offerman et al. / Acta Materialia 51 (2003) 3927–3938
where kGB is the ratio of carbon concentration inthe bulk of the austenite and the grain boundaryand d is the thickness of the boundary. The grainboundary diffusion coefficient of the carbon atomsDgC,GB can be estimated by assuming that the acti-vation energy is half that of the activation energyfor volume diffusion [25]. In the present case theargument of the exponential factor in Eq. (5) ismultiplied by 0.5.
For the eutectoid composition Cqeq = 6.67 wt.%,
Caeq�0.02 wt.%,lα
lθ�7, and kV = 0.72 [4]. Further,
we can assume that Cgqeq�Cgaeq��T, and l��T�1
[26]. As a consequence the two different theories,represented by Eqs. (3) and (7), can be rewrittenin the following form:
GX � cXDgC,X(�T)b, (8)
where the subscript X equals V or GB, which rep-resents the volume or grain boundary diffusiontheory, respectively. cX is a constant, which is dif-ferent for volume or grain boundary diffusion ofcarbon. The exponent b expresses the main differ-ence between the two theories. For volume dif-fusion b = 2 and for grain boundary diffusion b= 3. Hence, the rate determining mechanism forthe growth of pearlite can be determined from theexponent b.
2.3. Overall transformation
The overall pearlite transformation rate can bedescribed by the KJMA theory, which predicts thefraction f of the formed phase as a function of theisothermal transformation time t as
f(t) � 1�exp��kgGd�t
0
Nu(t�)(t�t�)ddt��, (9)
where G is a constant growth rate, d the dimen-sionality of the growth and kg a constant, whichdepends on the geometry of the particle, e.g. kg
= 4p /3 for spherical particles (d = 3). Thenucleation rate Nu is defined as the number ofnuclei per unit untransformed volume per unittime. It is assumed that the nuclei are randomlydistributed. The integration parameter t� can beinterpreted as the time at which nucleation ofgrains took place.
Within the KJMA theory it is usually assumedthat the nucleation rate is constant or that there isa fixed number of pre-existing nuclei throughoutthe transformation. However, Cahn [27] showedthat when the nucleation rate, per unit untransfor-med volume, increases with time according to
Nu(t) � kutm, (10)
where ku and m are constants, the KJMA equ-ation becomes
f(t) � 1�exp��8pm!
(d � m � 1)!kuG3tm+4�, (11)
for spherical particles that grow at a constant rate.
3. Three-dimensional neutron depolarization
The transmission of a monochromatic polarizedneutron beam through the sample is characterizedby the depolarization matrix D according to P� =D·P, where P and P� are the polarization vectorsbefore and after transmission, respectively. Therotation of the polarization vector is a measure forthe magnetic volume fraction and the degree ofdepolarization is a measure for the average mag-netic domain size.
The rotation j of the polarization vector is, inan eutectoid steel, related to the volume pearlitefraction fp via
j � hLc1/2 B , (12)
where L is the thickness of the sample, c = 2.15× 1029 λ2 T�2m�4, and l = 0.124(1) nm the neutronwavelength. The shape factor which accounts forthe effect of stray fields
h � (1�fp)hP � fphM (13)
is determined by a microscopic shape factor hP
= 0.5 for microscopic spherically shaped particlesand a macroscopic shape factor hM = 0.905 for ourplate-like sample [28]. The average magneticinduction inside the sample is given by
B � fp mz m0Mps, (14)
where mz is the average reduced magnetizationin the direction of the applied magnetic field (5.16
3931S.E. Offerman et al. / Acta Materialia 51 (2003) 3927–3938
mT) along the long axis of the sample. The satu-ration magnetization of pearlite Mp
s can be calcu-lated from the saturation magnetization of ferriteMas [29] multiplied by the equilibrium volume frac-tion of ferrite fa inside a pearlite colony. For thestudied steel fa is evaluated with the thermodyn-amic database MTDATA and determined to be0.90. During the experiment the temperature washigher than the Curie temperature of cementite, butwas lower than the Curie Temperature of ferrite.
The depolarization of the polarized neutronbeam, described by det(D), is caused by local vari-ations in the magnetic induction (�B)2 insidethe sample, and can be characterized for sphericalparticles by
det(D) � exp{�2cLd (�B)2 }. (15)
The average magnetic particle radius d can beevaluated from the experimentally determineddepolarization matrix D and model equations for(�B)2, which depends on fp [18,19]. The meas-ured depolarization can be written as det(D) =D 2
�D / / , where D� and D// are the elements of thedepolarization matrix D perpendicular and parallelto the applied magnetic field, respectively.
The polarized neutron beam probes the magneticcorrelation length over which the local magneticinduction is oriented in the same direction, whichmeans that d represents the average distance overwhich the ferrite plates within a pearlite colony aremore or less parallel [21]. In this paper it isassumed that the volume of a pearlite colony canbe approximated by the volume in which the ferriteand cementite plates are more or less parallel. Toa first approximation this assumption is valid, how-ever from a crystallographic point of view a pearl-ite colony can be larger.
In the case that the magnetic particles are notrandomly distributed over the sample, an extradepolarization of the polarized neutron beam willarise, which is not related to the magnetic domainsize. This extra depolarization will affect all theelements of the depolarization matrix that are per-pendicular to the applied magnetic field, while thecomponent that is parallel to the magnetic fieldremains unaffected. In order to separate the contri-bution of the average magnetic domain size andthe clustering (non-random spatial distribution) of
particles to the depolarization, a cluster factor Dc
is introduced:
Dc � ��
0
f(N)cos[(N��N�)jp]dN, (16)
where f(N) is the normalized spatial distributionfunction of the number of particles N along a neu-tron path, N is the average number of particlesalong the neutron path, and jp is the averagerotation per domain [30]. The cluster factor is ameasure for the degree of cluster formation in thespecimen. It was shown [21] that the cluster factorcan be deduced under certain conditions from theexperiment according to
Dc � D�exp�ln(D//)af
(17)
where, af represents the ratio ln(D//)/ln(D�) at theend of the transformation. In order to calculate theaverage magnetic domain size, the measured per-pendicular component D� is multiplied by a factor1/Dc [21]. The rotation j of the polarization vectoris not influenced by the manner in which the mag-netic domains are distributed.
4. Experiment
The composition of the studied nearly eutectoidsteel (in wt.%) is 0.715 C, 0.611 Mn, 0.266 Cr,0.347 Si, 0.012 P, 0.03 S, 0.094 Ni, 0.235 Cu,0.021 Mo, 0.025 Sn, and the rest is Fe. Theaustenite/pearlite phase transformation kineticswas studied by neutron depolarization and opticalmicroscopy. The sample for the 3DND-experi-ments with dimensions 100 × 15 × 0.4 mm3 iscoated with a nickel layer of approximately 15 µmthickness to avoid decarburization. The sample wasannealed at 1173 K for 0.5 h in a nitrogen atmos-phere, subsequently cooled with 20 K/s to 943 K,and held until the transformation was finished. Thistemperature cycle was repeated with the same sam-ple for transformation temperatures of 948 and 953K in order to study the influence of the degree ofundercooling on the transformation kinetics. The3DND measurements have been performed at thePANDA instrument at the nuclear reactor of theInterfaculty Reactor Institute.
3932 S.E. Offerman et al. / Acta Materialia 51 (2003) 3927–3938
Four cylindrical samples were prepared with adiameter of 5 mm and a length of 10 mm for exam-ination with the optical microscope. The sampleswere annealed at 1173 K for 0.5 h under a vacuumof 10�4 mbar, cooled with 20 K/s to 953 K, heldfor either 50, 100, 150, or 200 s, and subsequentlyquenched to room temperature to freeze in thehigh-temperature microstructure.
5. Results
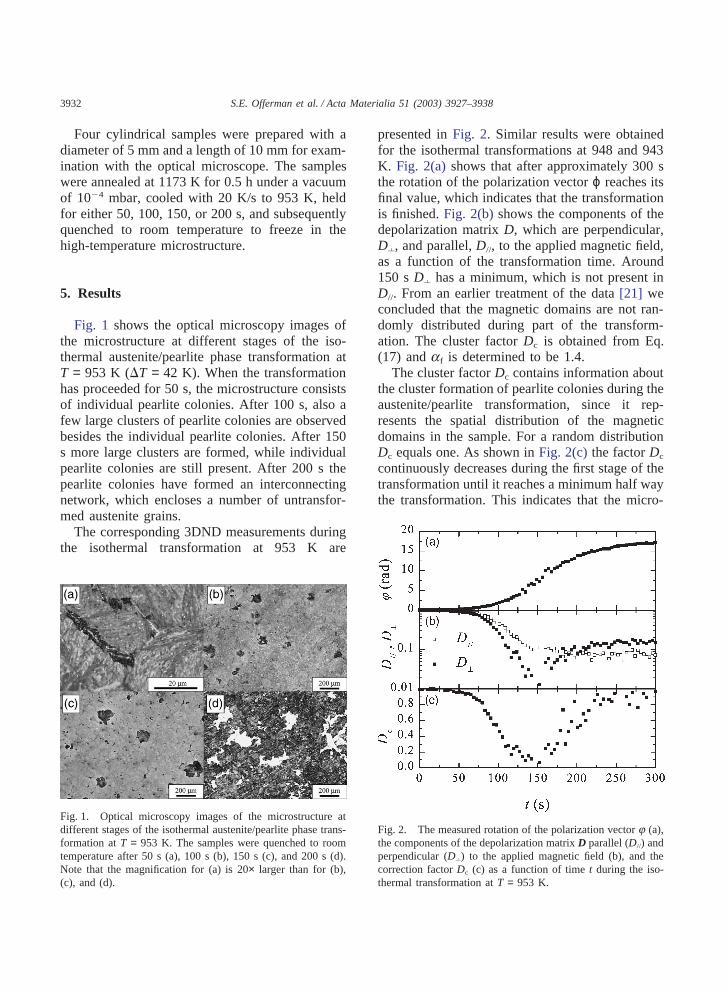
Fig. 1 shows the optical microscopy images ofthe microstructure at different stages of the iso-thermal austenite/pearlite phase transformation atT = 953 K (�T = 42 K). When the transformationhas proceeded for 50 s, the microstructure consistsof individual pearlite colonies. After 100 s, also afew large clusters of pearlite colonies are observedbesides the individual pearlite colonies. After 150s more large clusters are formed, while individualpearlite colonies are still present. After 200 s thepearlite colonies have formed an interconnectingnetwork, which encloses a number of untransfor-med austenite grains.
The corresponding 3DND measurements duringthe isothermal transformation at 953 K are
Fig. 1. Optical microscopy images of the microstructure atdifferent stages of the isothermal austenite/pearlite phase trans-formation at T = 953 K. The samples were quenched to roomtemperature after 50 s (a), 100 s (b), 150 s (c), and 200 s (d).Note that the magnification for (a) is 20× larger than for (b),(c), and (d).
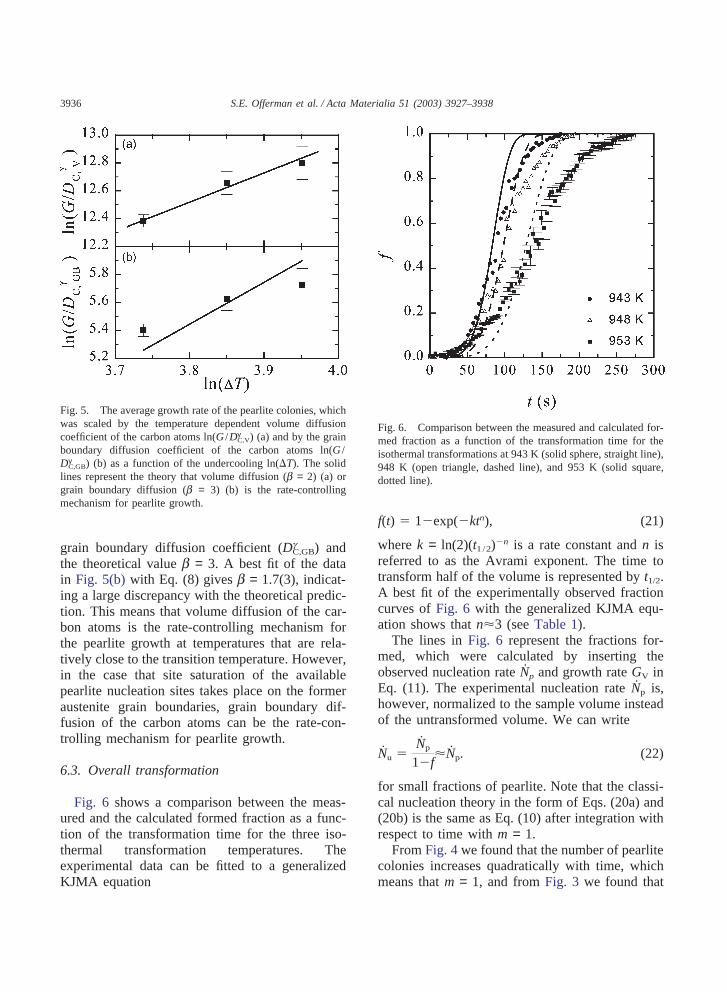
presented in Fig. 2. Similar results were obtainedfor the isothermal transformations at 948 and 943K. Fig. 2(a) shows that after approximately 300 sthe rotation of the polarization vector ϕ reaches itsfinal value, which indicates that the transformationis finished. Fig. 2(b) shows the components of thedepolarization matrix D, which are perpendicular,D�, and parallel, D//, to the applied magnetic field,as a function of the transformation time. Around150 s D� has a minimum, which is not present inD//. From an earlier treatment of the data [21] weconcluded that the magnetic domains are not ran-domly distributed during part of the transform-ation. The cluster factor Dc is obtained from Eq.(17) and af is determined to be 1.4.
The cluster factor Dc contains information aboutthe cluster formation of pearlite colonies during theaustenite/pearlite transformation, since it rep-resents the spatial distribution of the magneticdomains in the sample. For a random distributionDc equals one. As shown in Fig. 2(c) the factor Dc
continuously decreases during the first stage of thetransformation until it reaches a minimum half waythe transformation. This indicates that the micro-
Fig. 2. The measured rotation of the polarization vector j (a),the components of the depolarization matrix D parallel (D//) andperpendicular (D�) to the applied magnetic field (b), and thecorrection factor Dc (c) as a function of time t during the iso-thermal transformation at T = 953 K.

3933S.E. Offerman et al. / Acta Materialia 51 (2003) 3927–3938
structure evolves from a random to a non-randomdistribution of pearlite colonies. For higher frac-tions Dc increases and finally reaches unity at theend of the transformation. This indicates that thepearlite clusters start to form an interconnected net-work resulting in a more homogeneous structure.This behavior corresponds to the evolution of themicrostructure as shown in Fig. 1.
Fig. 3 shows the formed fraction f and averagemagnetic particle radius d which were determinedfrom 3DND measurements as a function of timefor the three isothermal transformations. Thededuced average magnetic domain size is correctedfor the extra depolarization, which is caused by anon-random distribution of magnetic domains. Alargely depolarized neutron beam (see Fig. 2(b))causes the large error bars, which appear in theregion half way the transformation. The increasein average particle size between f = 0.1 and 0.5 inFig. 3(b) represents to the average pearlite growthrate G, which is given in Table 1.
Fig. 3. The fraction pearlite f (a) and average magnetic par-ticle radius d (b) as a function of time for isothermal transform-ations at 943 K (solid sphere), 948 K (open triangle), and 953K (solid square). For clarity reasons only the error bars at 953K are shown. Comparable errors are observed for the other twotemperatures. The solid line represents the Zener theory for theformation of pro-eutectoid ferrite.
6. Discussion
At a moderate undercooling theaustenite/pearlite transformation in eutectoid steelis characterized by a non-random distribution ofpearlite colonies during the transformation. Theoptical microscopy and 3DND measurements showthat a first small amount of pro-eutectoid ferrite isformed. The pearlite colonies randomly nucleate atthe formed pro-eutectoid ferrite grains and austen-ite grain corners just after the steel started to trans-form. Shortly thereafter, new pearlite coloniesnucleate next to the existing pearlite colonies. Atthis stage large clusters of pearlite colonies are for-med. However, new pearlite colonies also nucleateat austenite grain boundaries, which results in amixture of individual pearlite colonies and clustersof pearlite colonies. At this stage there are a fewclusters of pearlite colonies, which are very large(�160 µm) and many relatively small individualpearlite colonies (�15 µm), as indicated in Fig. 1.Towards the end of the transformation, the clustersstart to impinge until all pearlite colonies are con-nected and a homogeneous structure is formed atthe end of the transformation.
The increase in average particle size during thefirst 75 s of the transformation at T = 953 K (seeFig. 3(b)) corresponds to the growth of pro-eutec-toid ferrite, of which the radius Ra increases as afunction of time according to the Zener-theory(solid line in Fig. 3(b)) [31]. The analytical resultscan be approximated by the following relation:
Ra � 2.102�Cg��Cgeq
Caeq�Cg��0.5871
�Dgct, (18)
where Cgeq(�0.77 wt.%) and Caeq(�0.02 wt.%) arethe equilibrium carbon concentrations in the aus-tenite and ferrite, respectively. Cg� is the carbonconcentration in the austenite matrix away from theinterface. In the present case Cg� is assumed to beequal to the average carbon concentration (0.715wt.%). The average carbon concentration in theremaining austenite will hardly change throughoutthe transformation, because this is a nearly eutec-toid steel. With increasing undercooling the pro-eutectoid ferrite has less time to grow and less pro-eutectoid ferrite will form.

3934 S.E. Offerman et al. / Acta Materialia 51 (2003) 3927–3938
Table 1Thermodynamic and kinetic parameters of the studied nearly eutectoid steel for the three isothermal transformation temperatures. �Tis the undercooling. �gqV is the driving force for cementile nucleation, kn is a temperature dependent prefactor that is related to thetime dependent nucleation rate. G is the measured pearlite growth rate. t1/2 is the time to transform half of the volume. n is theAvrami exponent
T (K) �T (K) �gθV (J/mol) kn (mm�3s�2) G (µm/s) t1/2 (s) n
943 52 �1613 61(3) 0.15(2) 88(1) 3.31(7)948 47 �1486 31(2) 0.14(1) 101(1) 3.14(8)953 42 �1359 16(1) 0.119(5) 135(1) 2.77(4)
6.1. Nucleation
The fraction f of the phases formed can beexpressed as
f �43pd3
αNα �43pd3
pNp (19)
where δa and δp are the average pro-eutectoid fer-rite grain and pearlite colony radius, respectively.Na and Np represent the number of pro-eutectoidferrite grains and pearlite colonies, respectively.From Eq. (19) the number of pearlite nuclei Np canbe estimated as a function of transformation timet, which is shown in Fig. 4 for the three isothermaltransformations. The number of pearlite nuclei isfound to increase quadratically with time. In litera-ture it is reported that the number of pearlite nucleiscales with the third power of time [32–34].
The measured number of pearlite colonies Np
can be compared to the classical nucleation theory,after integration of Eq. (1) with respect to time.The integrated equation that gives the number ofpearlite colonies as a function of time can beapproximated by
Np � knt2 (20a)
for times between t = 0 and 2t, with
kn�exp���
�g2VkBT�. (20b)
The fact that the number of pearlite nucleiincreases quadratically with time, as we haveobserved, means that the pearlite transformation isfinished before the steady state nucleation rate isreached. The lines in Fig. 4 represent the fits to
Fig. 4. The number of pearlite colonies Np as a function ofthe transformation time t for the isothermal transformations at943 K (solid sphere, straight line), 948 K (open triangle, dashedline), and 953 K (solid square, dotted line).
Eqs. (20a) and (20b), which resulted in the valuesfor kn that are given in Table 1.
The rate controlling mechanism for thenucleation of pearlite in hypo-eutectoid steels is thenucleation of cementite, since the pro-eutectoidferrite continues to grow into the pearlite [6]. Thedriving force for cementite nucleation �gqV is cal-

3935S.E. Offerman et al. / Acta Materialia 51 (2003) 3927–3938
culated for the binary Fe-C system from the ther-modynamic database MTDATA . The commontangent along the ferrite and austenite Gibbs freeenergy curves was constructed to calculate �gqV,which means that it is assumed that the ferrite andaustenite are in equilibrium before the cementitenucleates. The values for �gqV are given in Table1. A best fit of ln(kn) to �[(�gqV)2kBT]�1 gives avalue of �q = 2.2(2) × 10�3 J3 /m6 for cementitenucleation during the pearlite formation.
The activation energy for nucleation is directlyproportional to the factor �, as can be seen fromEq. (2). If for example the energy that is requiredfor the formation of a new interface is almost bal-anced by the energy that is released by transform-ation, nucleation can take place relatively easily,because the activation energy is then relativelysmall. From in-situ synchrotron measurements itwas recently determined that for theaustenite/ferrite phase transformation in mediumcarbon steel �a = 5×10�8 J3 /m6 for the nucleationof ferrite [1]. A comparison between �a and �qshows that the effect of interfacial energies on theactivation energy for the cementite nucleation dur-ing the pearlite formation is approximately 105
times higher than for the ferrite nucleation. This isprobably related to the fact that during thenucleation of pro-eutectoid ferrite high-energyaustenite/austenite grain boundaries are replacedby mainly low-energy or almost coherentaustenite/ferrite interfaces. The pro-eutectoid fer-rite continues to grow with the same crystallo-graphic orientation during the pearlite formation aspart of a pearlite colony [1]. This means thatcementite nucleation forms the rate-limiting stepduring pearlite nucleation. During the cementitenucleation, all the energy that is released by theremoval of the low-energy austenite/ferrite inter-face is probably used for the formation of the low-energy ferrite/cementite interface. There is notenough energy left to compensate the energy thatis necessary for the formation of theaustenite/cementite interface. The main differencebetween the nucleation of pro-eutectoid ferrite andpearlitic cementite is that the former takes place athigh-energy grain boundaries, while the latter takesplace at low-energy interfaces. This differenceresults in a relatively high value for �q compared
to �a, which means that the nucleation of pro-eutectoid ferrite is relatively easy compared to thenucleation of pearlitic cementite.
The relatively high value for �q may explainthe general observation (see e.g. [1]) that duringcontinuous cooling the formation of ferrite maytake place at exactly the equilibrium transition tem-perature, while the subsequent formation of pearl-ite takes place below its equilibrium transition tem-perature. In order to form a cementite nucleusduring the pearlite formation, �g2
V needs toincrease to compensate for the large value of �q.As �g2
V increases with increasing undercooling, thetemperature at which pearlitic cementite forms isdistinctly below the equilibrium transition tem-perature.
6.2. Pearlite growth
The average growth rate of the pearlite colonieswas only measured during the first half of thetransformation. The measured average growth rateat 953 K is G = 0.12 µm/s, which is approximatelya factor 8 smaller than the value found from a ser-ies of quenched specimens of an Fe-0.8C–0.6Mnalloy at 963 K [33]. This difference is possiblycaused by the fact that the quench-method givesan estimate of the highest measured pearlite growthrate rather than the average growth rate, given bythe 3DND method.
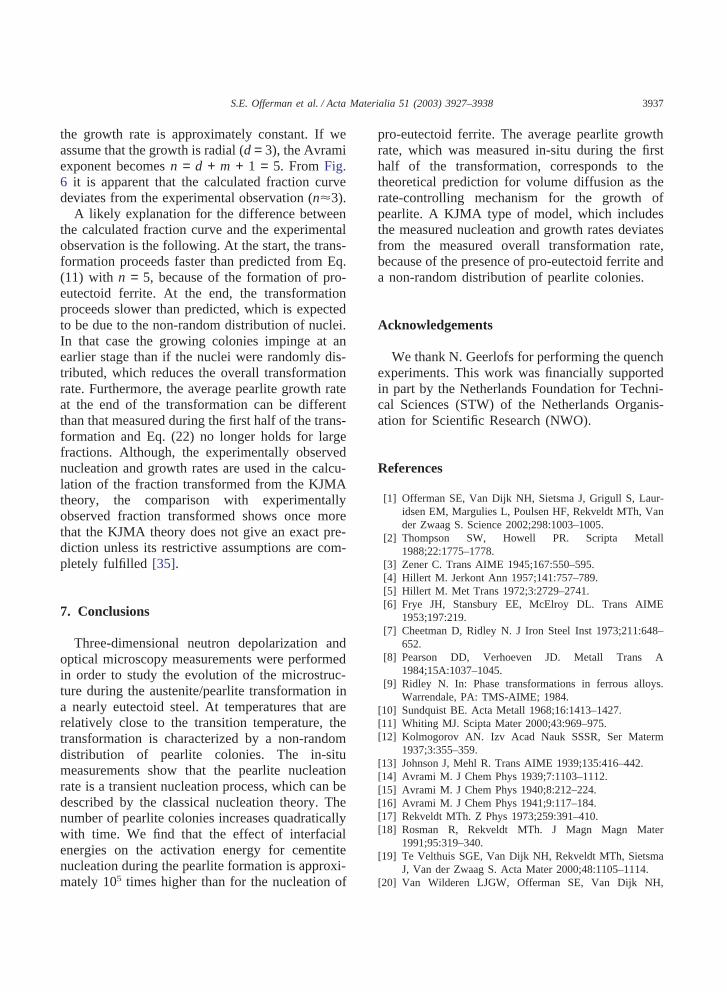
In order to determine the rate-controlling mech-anism for the growth of pearlite, ln(G /DgC,V) andln(G /DgC,GB) are plotted as a function of theundercooling �T in Fig. 5. The measured averagepearlite growth rate G is either scaled by the vol-ume or grain boundary diffusion coefficient of thecarbon atoms. The transition temperature was esti-mated from MTDATA to be TA1 = 995 K. Thesolid line in Fig. 5(a) represents a fit of the datato Eq. (8) with the volume diffusion coefficient ofcarbon (Dγ
C,V) and b = 2. A best fit of the data inFig. 5(a) to Eq. (8) gives a slope of b = 2.1(3),which is consistent with the theoretical predictionof b = 2 for volume diffusion of carbon.
Fig. 5(b) shows the same data points as in Fig.5(a), but scaled by the grain boundary diffusioncoefficient of the carbon atoms Dγ
C,GB. The solidline in Fig. 5(b) represents a fit to Eq. (8) with the
3936 S.E. Offerman et al. / Acta Materialia 51 (2003) 3927–3938
Fig. 5. The average growth rate of the pearlite colonies, whichwas scaled by the temperature dependent volume diffusioncoefficient of the carbon atoms ln(G /Dγ
C,V) (a) and by the grainboundary diffusion coefficient of the carbon atoms ln(G /Dγ
C,GB) (b) as a function of the undercooling ln(�T). The solidlines represent the theory that volume diffusion (b = 2) (a) orgrain boundary diffusion (b = 3) (b) is the rate-controllingmechanism for pearlite growth.
grain boundary diffusion coefficient (DgC,GB) andthe theoretical value b = 3. A best fit of the datain Fig. 5(b) with Eq. (8) gives b = 1.7(3), indicat-ing a large discrepancy with the theoretical predic-tion. This means that volume diffusion of the car-bon atoms is the rate-controlling mechanism forthe pearlite growth at temperatures that are rela-tively close to the transition temperature. However,in the case that site saturation of the availablepearlite nucleation sites takes place on the formeraustenite grain boundaries, grain boundary dif-fusion of the carbon atoms can be the rate-con-trolling mechanism for pearlite growth.
6.3. Overall transformation
Fig. 6 shows a comparison between the meas-ured and the calculated formed fraction as a func-tion of the transformation time for the three iso-thermal transformation temperatures. Theexperimental data can be fitted to a generalizedKJMA equation
Fig. 6. Comparison between the measured and calculated for-med fraction as a function of the transformation time for theisothermal transformations at 943 K (solid sphere, straight line),948 K (open triangle, dashed line), and 953 K (solid square,dotted line).
f(t) � 1�exp(�ktn), (21)
where k = ln(2)(t1 /2)�n is a rate constant and n isreferred to as the Avrami exponent. The time totransform half of the volume is represented by t1/2.A best fit of the experimentally observed fractioncurves of Fig. 6 with the generalized KJMA equ-ation shows that n�3 (see Table 1).
The lines in Fig. 6 represent the fractions for-med, which were calculated by inserting theobserved nucleation rate Np and growth rate GV inEq. (11). The experimental nucleation rate Np is,however, normalized to the sample volume insteadof the untransformed volume. We can write
Nu �Np
1�f�Np. (22)
for small fractions of pearlite. Note that the classi-cal nucleation theory in the form of Eqs. (20a) and(20b) is the same as Eq. (10) after integration withrespect to time with m = 1.
From Fig. 4 we found that the number of pearlitecolonies increases quadratically with time, whichmeans that m = 1, and from Fig. 3 we found that
3937S.E. Offerman et al. / Acta Materialia 51 (2003) 3927–3938
the growth rate is approximately constant. If weassume that the growth is radial (d = 3), the Avramiexponent becomes n = d + m + 1 = 5. From Fig.6 it is apparent that the calculated fraction curvedeviates from the experimental observation (n�3).
A likely explanation for the difference betweenthe calculated fraction curve and the experimentalobservation is the following. At the start, the trans-formation proceeds faster than predicted from Eq.(11) with n = 5, because of the formation of pro-eutectoid ferrite. At the end, the transformationproceeds slower than predicted, which is expectedto be due to the non-random distribution of nuclei.In that case the growing colonies impinge at anearlier stage than if the nuclei were randomly dis-tributed, which reduces the overall transformationrate. Furthermore, the average pearlite growth rateat the end of the transformation can be differentthan that measured during the first half of the trans-formation and Eq. (22) no longer holds for largefractions. Although, the experimentally observednucleation and growth rates are used in the calcu-lation of the fraction transformed from the KJMAtheory, the comparison with experimentallyobserved fraction transformed shows once morethat the KJMA theory does not give an exact pre-diction unless its restrictive assumptions are com-pletely fulfilled [35].
7. Conclusions
Three-dimensional neutron depolarization andoptical microscopy measurements were performedin order to study the evolution of the microstruc-ture during the austenite/pearlite transformation ina nearly eutectoid steel. At temperatures that arerelatively close to the transition temperature, thetransformation is characterized by a non-randomdistribution of pearlite colonies. The in-situmeasurements show that the pearlite nucleationrate is a transient nucleation process, which can bedescribed by the classical nucleation theory. Thenumber of pearlite colonies increases quadraticallywith time. We find that the effect of interfacialenergies on the activation energy for cementitenucleation during the pearlite formation is approxi-mately 105 times higher than for the nucleation of
pro-eutectoid ferrite. The average pearlite growthrate, which was measured in-situ during the firsthalf of the transformation, corresponds to thetheoretical prediction for volume diffusion as therate-controlling mechanism for the growth ofpearlite. A KJMA type of model, which includesthe measured nucleation and growth rates deviatesfrom the measured overall transformation rate,because of the presence of pro-eutectoid ferrite anda non-random distribution of pearlite colonies.
Acknowledgements
We thank N. Geerlofs for performing the quenchexperiments. This work was financially supportedin part by the Netherlands Foundation for Techni-cal Sciences (STW) of the Netherlands Organis-ation for Scientific Research (NWO).
References
[1] Offerman SE, Van Dijk NH, Sietsma J, Grigull S, Laur-idsen EM, Margulies L, Poulsen HF, Rekveldt MTh, Vander Zwaag S. Science 2002;298:1003–1005.
[2] Thompson SW, Howell PR. Scripta Metall1988;22:1775–1778.
[3] Zener C. Trans AIME 1945;167:550–595.[4] Hillert M. Jerkont Ann 1957;141:757–789.[5] Hillert M. Met Trans 1972;3:2729–2741.[6] Frye JH, Stansbury EE, McElroy DL. Trans AIME
1953;197:219.[7] Cheetman D, Ridley N. J Iron Steel Inst 1973;211:648–
652.[8] Pearson DD, Verhoeven JD. Metall Trans A
1984;15A:1037–1045.[9] Ridley N. In: Phase transformations in ferrous alloys.
Warrendale, PA: TMS-AIME; 1984.[10] Sundquist BE. Acta Metall 1968;16:1413–1427.[11] Whiting MJ. Scipta Mater 2000;43:969–975.[12] Kolmogorov AN. Izv Acad Nauk SSSR, Ser Materm
1937;3:355–359.[13] Johnson J, Mehl R. Trans AIME 1939;135:416–442.[14] Avrami M. J Chem Phys 1939;7:1103–1112.[15] Avrami M. J Chem Phys 1940;8:212–224.[16] Avrami M. J Chem Phys 1941;9:117–184.[17] Rekveldt MTh. Z Phys 1973;259:391–410.[18] Rosman R, Rekveldt MTh. J Magn Magn Mater
1991;95:319–340.[19] Te Velthuis SGE, Van Dijk NH, Rekveldt MTh, Sietsma
J, Van der Zwaag S. Acta Mater 2000;48:1105–1114.[20] Van Wilderen LJGW, Offerman SE, Van Dijk NH,
3938 S.E. Offerman et al. / Acta Materialia 51 (2003) 3927–3938
Rekveldt MTh, Sietsma J, Van der Zwaag S. Appl PhysA 2002;74;1052–1054.
[21] Offerman, SE, Van Wilderen LJGW, Van Dijk NH,Rekveldt MTh, Sietsma J, Van der Zwaag S. Physica B,(in press)
[22] Aaronson HI, Lee JK. In: Lectures on the theory of trans-formations. Warrendale, PA: TMS-AIME; 1975.
[23] Jena AK, Chaturvedi MC. Phase transformations inmaterials. London: Prentice-Hall, 1992.
[24] Agren J. Scripta Metall 1986;20:1507–1510.[25] Porter DA, Easterling KE. Phase transformations in metals
and alloys. London: Chapman & Hall, 1993.[26] Howell PR. Mat Char 1998;40: 227–260.[27] Cahn JW. Trans AIME 1957;209:140–144.
[28] Van Dijk, NH, Te Velthuis SGE, Rekveldt MTh, SietsmaJ, Van der Zwaag S. Physica B 1999;267–268:88–91.
[29] Arrott AS, Heinrich B. J Appl Phys 1981;52:2113–2115.[30] Rosman R, Rekveldt MTh. Phys Rev B 1991;43:8437–
8449.[31] Zener C. J Appl Phys 1949;20:950–953.[32] Scheil E, Langeweise A. Arch Eisenhttenw 1937;11:93.[33] Hull FC, Colton RA, Mehl RF. Trans AIME
1942;150:185–207.[34] Cahn JW, Hagel WC. In: Zackay VF, Aaronson HI, edi-
tors. Decomposition of austenite by Diffusional processes.New York: Interscience; 1962.
[35] Cahn JW. Mat Res Soc Proc 1996;398:425–437.
Copyright © 2022 FDOKUMEN