Resolved spectral variations of the centimetre-wavelength ...
In situ nanoparticle size measurements of gas-borne siliconnanoparticles by time-resolved laser-induced incandescence
T. A. Sipkens • R. Mansmann • K. J. Daun •
N. Petermann • J. T. Titantah • M. Karttunen •
H. Wiggers • T. Dreier • C. Schulz
Received: 13 September 2013 / Accepted: 8 December 2013 / Published online: 19 December 2013
� Springer-Verlag Berlin Heidelberg 2013
Abstract This paper describes the application of time-
resolved laser-induced incandescence (TiRe-LII), a com-
bustion diagnostic used mainly for measuring soot primary
particles, to size silicon nanoparticles formed within a
plasma reactor. Inferring nanoparticle sizes from TiRe-LII
data requires knowledge of the heat transfer through which
the laser-heated nanoparticles equilibrate with their sur-
roundings. Models of the free molecular conduction and
evaporation are derived, including a thermal accommoda-
tion coefficient found through molecular dynamics. The
model is used to analyze TiRe-LII measurements made on
silicon nanoparticles synthesized in a low-pressure plasma
reactor containing argon and hydrogen. Nanoparticle sizes
inferred from the TiRe-LII data agree with the results of a
Brunauer–Emmett–Teller analysis.
List of symbols
cg,t Thermal molecular speed of the gas at equilibrium
(m s-1)
co Speed of light in a vacuum (2.998 9 108 m s-1)
cp Specific heat of the nanoparticle (J kg-1 K-1)
cv,t Thermal speed of evaporating atoms (m s-1)
dp Nanoparticle diameter (nm)
E(mk) Complex absorption function
h Planck’s constant (6.626 9 10-34 J s)
DHv Heat of vaporization (J mol-1)
Ib,k Spectral blackbody intensity (W)
Jevap Evaporating mass flux (kg s-1)
Jk Spectral incandescence (a.u.)
kB Boltzmann constant
(1.38 9 10-23 J molecule-1 K-1)
mv Mass of vaporized atoms (kg)
mg Molecular mass of the gas (kg)
mk Complex index of refraction
Ng00 Incident number flux of gas molecules
Nv00 Number flux of vaporized atoms
ng Number density of gas molecules
nv Number density of evaporated vapor
P(dp) Probability density of particle diameters
pg Gas partial pressure (Pa)
pv Vapor pressure (Pa)
Qabs,k Spectral absorption efficiency
qcond Conduction heat transfer (W)
qevap Evaporation heat transfer (W)
qrad Radiation heat transfer (W)
R Universal gas constant (8.314 J mol-1 K-1)
Rs Specific gas constant (J kg-1 K-1)
Tcr Critical temperature of liquid silicon (K)
Teff Pyrometrically defined effective temperature (K)
Tg Gas temperature (K)
T. A. Sipkens � K. J. Daun (&)
Department of Mechanical and Mechatronics Engineering,
University of Waterloo, 200 University Ave West, Waterloo,
ON N2L 3G1, Canada
e-mail: [email protected]
R. Mansmann � N. Petermann � H. Wiggers � T. Dreier �C. Schulz
Institute for Combustion and Gas Dynamics – Reactive Fluids
(IVG), University of Duisburg-Essen, Duisburg, Germany
R. Mansmann � N. Petermann � H. Wiggers � T. Dreier �C. Schulz
Center for Nanointegration Duisburg-Essen (CENIDE),
University of Duisburg-Essen, Duisburg, Germany
J. T. Titantah � M. Karttunen
Department of Applied Mathematics, Western University,
London, ON, Canada
M. Karttunen
Department of Chemistry, University of Waterloo, Waterloo,
ON, Canada
123
Appl. Phys. B (2014) 116:623–636
DOI 10.1007/s00340-013-5745-2
ti Discrete time (ns)
Ti Initial temperature (K)
Tm Melting temperature of silicon (K)
Tp Nanoparticle temperature (K)
Ts Surface temperature (K)
Uij Interatomic potential between atoms i and j (eV)
v1 Incident gas velocity (m s-1)
v2 Scattering gas velocity (m s-1)
vxy Gas atom velocity parallel to surface (m s-1)
vz Gas atom velocity perpendicular to surface
(m s-1)
x Particle size parameter
X Uniformly distributed random number
a Thermal accommodation coefficient
d Tolman length (nm)
c Specific heat ratio
cs Surface tension of silicon (N m-1)
k Wavelength (nm)
l Ratio of gas atom mass to surface atom mass
q Nanoparticle density (kg m-3)
n Sticking coefficient
1 Introduction
The unique electromagnetic properties of silicon nanopar-
ticles have led to a multitude of existing and emerging
roles in diverse areas of science and engineering. In med-
icine, for example, silicon nanoparticles may be used for
biomedical diagnostics, targeted drug delivery, cancer
therapy, cell tracking and labeling, and tissue engineering
[1]. Photovoltaic device performance has undergone a
paradigm shift with the introduction of nanoscale films
containing silicon quantum dots, which can greatly
increase photoelectric conversion efficiency [2]. Silicon
nanoparticles also enhance the performance of other elec-
tronic equipment, including lithium-ion batteries [3], solid-
state devices, LEDs, and printable electronics [4]. Gas-
phase synthesis is the most economical route for mass
production of silicon nanoparticles, but since the electro-
magnetic properties of silicon nanoparticles depend
strongly on their size, these reactors must be designed and
operated to produce nanoparticles having a highly con-
trolled size distribution. Accordingly, there is a pressing
need for an instrument that can make temporally and spa-
tially resolved size measurements within the reactor to
elucidate nanoparticle formation and growth mechanisms,
pinpoint production problems, and eventually provide
feedback for closed-loop control.
Time-resolved laser-induced incandescence (TiRe-LII),
a combustion diagnostic normally used to measure the
volume fraction and size of soot primary particles, is a
promising candidate to fulfill this need. In this technique, a
laser pulse heats the nanoparticles within a sample volume
of aerosol to incandescent temperatures. Following the
laser pulse, the spectral incandescence is measured as the
nanoparticles equilibrate with their surroundings. Since
larger nanoparticles cool more slowly than smaller nano-
particles, in principle the average size, and to some extent
the size distribution, can be inferred from the observed
spectral incandescence decay.
While TiRe-LII was initially conceived to measure the
size and concentration of primary soot particles (e.g. [5–
8]), several studies have investigated the feasibility of
using this technique to size synthetic nanoparticles. Vander
Wal et al. [9] first showed this approach could be viable for
sizing metallic nanoparticles based on observed incandes-
cence decay data, but they did not use the technique to
recover particle sizes. Subsequent studies assessed the
ability to extend TiRe-LII to size metal aerosols containing
Ag [10], Fe [11–15], Mo [16, 17], and Ni [18] nanoparti-
cles and oxide aerosols containing MgO [19], TiO2 [20,
21], Fe2O3 [22], and SiO2 [23] with varying success. The
unique challenges associated with TiRe-LII measurements
on synthetic nanoaerosols are due to the following: lower
vaporization temperatures compared to carbonaceous
nanoparticles, resulting in comparably weak signals [15];
high-temperature chemistry that may change the chemical
composition of the nanoparticles [22]; and non-incandes-
cent laser-induced emission from excited fragments and
potential plasmas [9]. In this context, silicon is a promising
material due to its high boiling point and because elemental
silicon is chemically stable at high temperatures.
Despite the growing interest in gas-phase-synthesized
silicon nanoparticles with well-defined properties, there
have only been two prior attempts to size silicon nano-
particles using TiRe-LII [24, 25]. While strong TiRe-LII
signals were obtained from the laser-heated Si nanoparti-
cles in low-pressure plasmas, the subsequent analysis
neglected the 1/k dependence of emission and absorption
efficiency in the Rayleigh regime [26], as well as the
contribution of evaporation to nanoparticle cooling, which
has been shown to be very important in low-pressure
aerosols [27].
This paper presents pioneering experimental and theo-
retical work aimed at extending the capabilities of TiRe-LII
to silicon nanoparticles. The paper describes the procedure
and instrumentation used to collect the TiRe-LII data and
briefly introduces the gas-phase synthesis process. The
following section presents the heat transfer model required
to analyze the TiRe-LII data, including the thermal
accommodation coefficient, a, which is obtained by
molecular dynamics for Si/Ar and Si/He, starting from first
principles by using a combination of ab initio calculations
and atomistic MD simulations to realistically model the
624 T. A. Sipkens et al.
123

gas/surface scattering that underlies a. Nanoparticle sizes
inferred from the TiRe-LII data are found to be generally
consistent with those found using Brunauer–Emmett–
Teller (BET) analysis [28] and transmission electron
microscopy (TEM) [29] on material from the same syn-
thesis process.
2 Experimental procedure
Gas-borne non-agglomerated silicon nanoparticles are
produced from silane (SiH4) in a low-pressure microwave
plasma flow reactor shown schematically in Fig. 1. The
chamber is first evacuated and then purged with argon to
remove potential contaminants (e.g., O2) that could react
with the nanoparticles. Silane is premixed with dilution
gases H2 and Ar at a pressure of 12 kPa so that the volume
ratio of the constituents is approximately 1:12:60 for SiH4,
H2, and Ar, respectively. The SiH4:H2:Ar core flow of
3.7 slm is surrounded by a Ar/H2 coflow that stabilizes the
plasma. The microwave radiation of a 1,200-W magnetron
is focused in the center of a 7.7-cm diameter quartz tube,
producing a visible purple plasma in the lower region of the
reactor shown in Fig. 2. Due to unipolar particle charging,
plasma reactors form non-aggregated, electrostatically
confined nanoparticles with a narrow nanoparticle size
distribution; the microwave plasma reactor used here is
known to produce single crystalline silicon nanoparticles
with a geometric standard deviation of approximately
rg = 1.2 and nanoparticle sizes in the 5–50 nm range,
depending on pressure and precursor concentration [30].
Time-resolved laser-induced incandescence measure-
ments are carried out 20 cm downstream from the plasma
zone using the Artium 200M TiRe-LII system shown in
Fig. 2. The instrument consists of a transmitter module
containing a 1,064-nm Nd:YAG laser and optics, a receiver
module containing collection optics and two photomulti-
plier tubes, and a computer for instrument control and data
acquisition. Optical access to the aerosol is obtained
through three quartz windows in the reactor walls. Inert gas
flushing prevents particle deposition on the windows and
allows continuous operation of the reactor for several hours.
A laser pulse is shone across the reactor chamber through
two opposite windows. The laser was operated with a rep-
etition rate of 10 Hz. A nearly uniform ‘‘top-hat’’ beam
profile with a square 2.8 mm 9 2.8 mm cross section was
generated by relay imaging an aperture into the measure-
ment location where fluences were in the 0.12–0.16 J cm-2
range. The resulting incandescence signal of the laser-
heated nanoparticles is detected through the third quartz
window, perpendicular to the laser pulse; the probe volume
is defined by intersection of the laser beam and the detector
solid angle. The incandescence signal is split by a dichroic
mirror, passed through two band-pass filters centered at
442 and 716 nm (full width at half maximum of 50 nm),
and imaged onto the photomultiplier tubes. Further details
of this procedure are provided in Ref. [6].
Fig. 1 Schematic showing the experimental procedure: (1) mixing of
inlet gases; (2) electrical discharge dissociation of silane; (3)
nanoparticle formation; (4) in situ TiRe-LII nanoparticle sizing; and
(5) ex situ BET nanoparticle sizing
Fig. 2 The stream of glowing silicon nanoparticles within the low-
pressure plasma reactor (left), and the Artium 200M LII transmitter
and receiver units arranged around the plasma reactor (right)
Time-resolved laser-induced incandescence 625
123
The spectral incandescence from the laser-heated
nanoparticles can be modeled by integrating the incan-
descence emitted by all nanoparticle sizes
JkðtiÞ ¼ Ck
Z1
0
pd2p
4Qabs;kðdpÞPðdpÞIb;k½Tpðti; dpÞ�dðdpÞ ð1Þ
where Ib,k is the blackbody spectral intensity, Ck is a
constant that depends on the optical collection efficiency,
laser fluence, and nanoparticle volume fraction, Qabs,k is
the absorption efficiency of the nanoparticles, and P(dp) is
the probability density of nanoparticle diameters. The
nanoparticle diameters are expected to be much smaller
than the laser wavelength and the principal wavelengths of
emitted radiation, and consequently, the nanoparticles emit
and absorb in the Rayleigh limit:
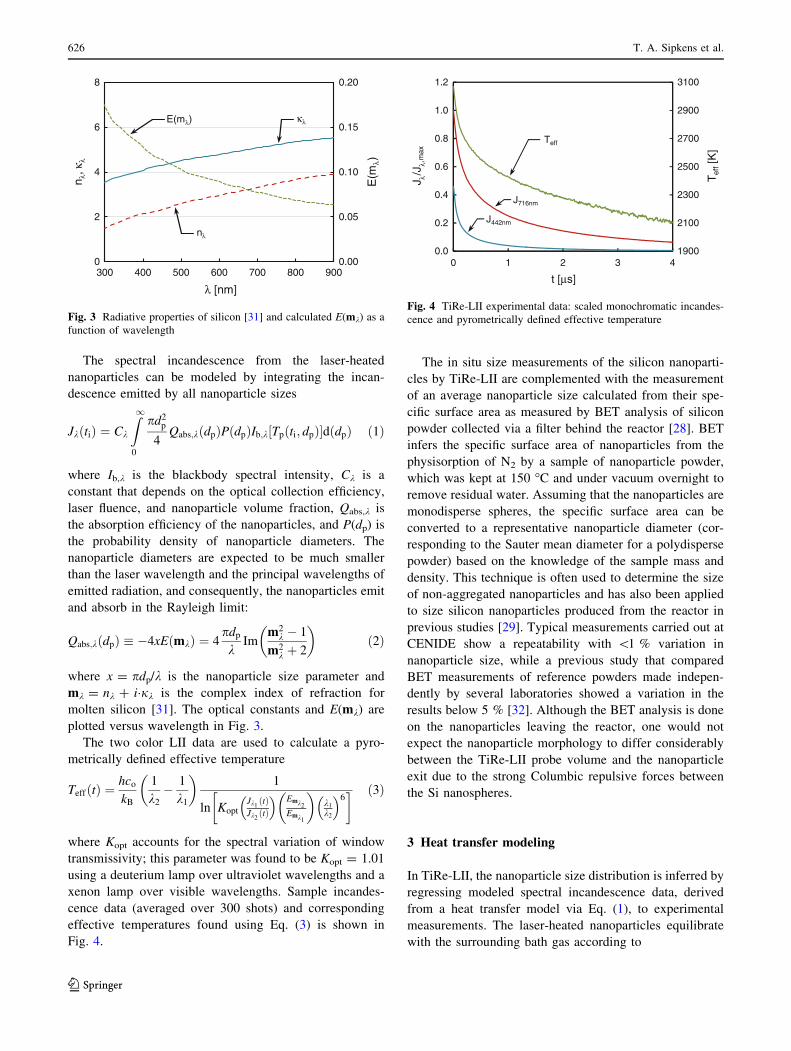
Qabs;kðdpÞ � �4xEðmkÞ ¼ 4pdp
kIm
m2k � 1
m2k þ 2
� �ð2Þ
where x = pdp/k is the nanoparticle size parameter and
mk = nk ? i�jk is the complex index of refraction for
molten silicon [31]. The optical constants and E(mk) are
plotted versus wavelength in Fig. 3.
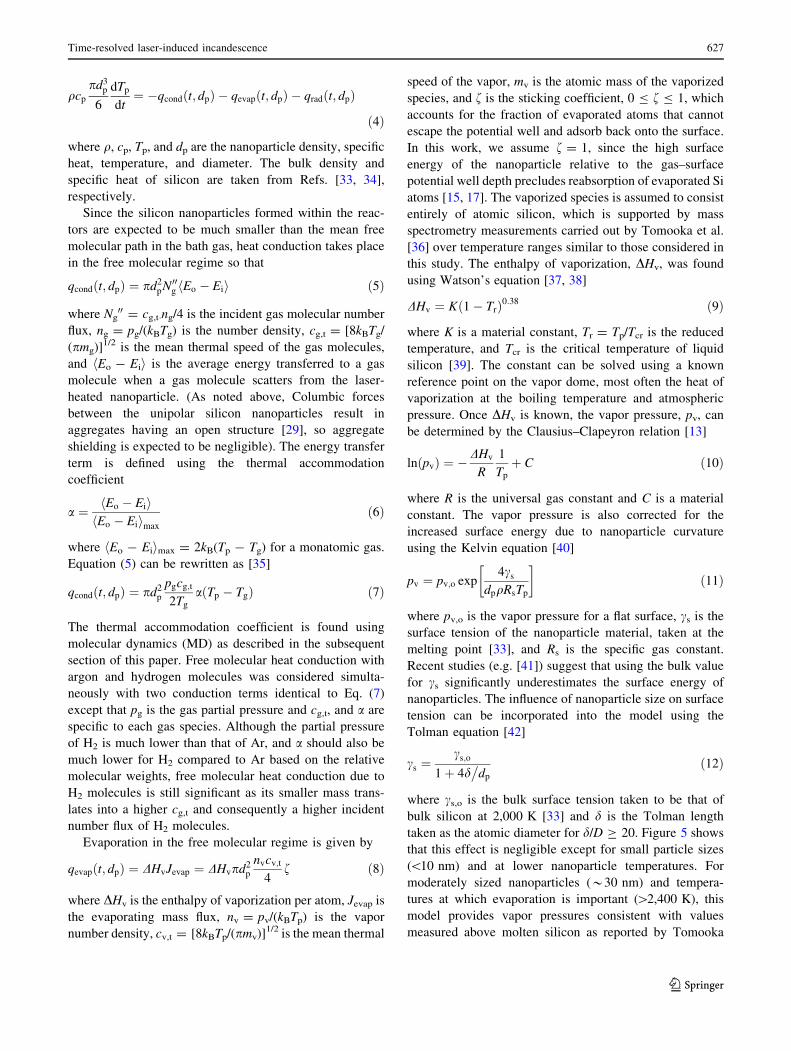
The two color LII data are used to calculate a pyro-
metrically defined effective temperature
TeffðtÞ ¼hco
kB
1
k2
� 1
k1
� �1
ln KoptJk1ðtÞ
Jk2ðtÞ
� �Emk2
Emk1
� �k1
k2
� �6� � ð3Þ
where Kopt accounts for the spectral variation of window
transmissivity; this parameter was found to be Kopt = 1.01
using a deuterium lamp over ultraviolet wavelengths and a
xenon lamp over visible wavelengths. Sample incandes-
cence data (averaged over 300 shots) and corresponding
effective temperatures found using Eq. (3) is shown in
Fig. 4.
The in situ size measurements of the silicon nanoparti-
cles by TiRe-LII are complemented with the measurement
of an average nanoparticle size calculated from their spe-
cific surface area as measured by BET analysis of silicon
powder collected via a filter behind the reactor [28]. BET
infers the specific surface area of nanoparticles from the
physisorption of N2 by a sample of nanoparticle powder,
which was kept at 150 �C and under vacuum overnight to
remove residual water. Assuming that the nanoparticles are
monodisperse spheres, the specific surface area can be
converted to a representative nanoparticle diameter (cor-
responding to the Sauter mean diameter for a polydisperse
powder) based on the knowledge of the sample mass and
density. This technique is often used to determine the size
of non-aggregated nanoparticles and has also been applied
to size silicon nanoparticles produced from the reactor in
previous studies [29]. Typical measurements carried out at
CENIDE show a repeatability with \1 % variation in
nanoparticle size, while a previous study that compared
BET measurements of reference powders made indepen-
dently by several laboratories showed a variation in the
results below 5 % [32]. Although the BET analysis is done
on the nanoparticles leaving the reactor, one would not
expect the nanoparticle morphology to differ considerably
between the TiRe-LII probe volume and the nanoparticle
exit due to the strong Columbic repulsive forces between
the Si nanospheres.
3 Heat transfer modeling
In TiRe-LII, the nanoparticle size distribution is inferred by
regressing modeled spectral incandescence data, derived
from a heat transfer model via Eq. (1), to experimental
measurements. The laser-heated nanoparticles equilibrate
with the surrounding bath gas according to
0.00
0.05
0.10
0.15
0.20
0
2
4
6
8
300 400 500 600 700 800 900
E(m
λ)
n λ, κ
λ
λ [nm]
nλ
E(mλ) κλ
Fig. 3 Radiative properties of silicon [31] and calculated E(mk) as a
function of wavelength
1900
2100
2300
2500
2700
2900
3100
0.0
0.2
0.4
0.6
0.8
1.0
1.2
0 1 2 3 4
Tef
f[K
]
J λλ
/J,m
ax
t [μs]
Teff
J442nm
J716nm
Fig. 4 TiRe-LII experimental data: scaled monochromatic incandes-
cence and pyrometrically defined effective temperature
626 T. A. Sipkens et al.
123
qcp
pd3p
6
dTp
dt¼ �qcondðt; dpÞ � qevapðt; dpÞ � qradðt; dpÞ
ð4Þ
where q, cp, Tp, and dp are the nanoparticle density, specific
heat, temperature, and diameter. The bulk density and
specific heat of silicon are taken from Refs. [33, 34],
respectively.
Since the silicon nanoparticles formed within the reac-
tors are expected to be much smaller than the mean free
molecular path in the bath gas, heat conduction takes place
in the free molecular regime so that
qcondðt; dpÞ ¼ pd2pN 00g Eo � Eih i ð5Þ
where Ng00 = cg,t�ng/4 is the incident gas molecular number
flux, ng = pg/(kBTg) is the number density, cg,t = [8kBTg/
(pmg)]1/2 is the mean thermal speed of the gas molecules,
and hEo - Eii is the average energy transferred to a gas
molecule when a gas molecule scatters from the laser-
heated nanoparticle. (As noted above, Columbic forces
between the unipolar silicon nanoparticles result in
aggregates having an open structure [29], so aggregate
shielding is expected to be negligible). The energy transfer
term is defined using the thermal accommodation
coefficient
a ¼ Eo � Eih iEo � Eih imax
ð6Þ
where hEo - Eiimax = 2kB(Tp - Tg) for a monatomic gas.
Equation (5) can be rewritten as [35]
qcondðt; dpÞ ¼ pd2p
pgcg;t
2Tg
aðTp � TgÞ ð7Þ
The thermal accommodation coefficient is found using
molecular dynamics (MD) as described in the subsequent
section of this paper. Free molecular heat conduction with
argon and hydrogen molecules was considered simulta-
neously with two conduction terms identical to Eq. (7)
except that pg is the gas partial pressure and cg,t, and a are
specific to each gas species. Although the partial pressure
of H2 is much lower than that of Ar, and a should also be
much lower for H2 compared to Ar based on the relative
molecular weights, free molecular heat conduction due to
H2 molecules is still significant as its smaller mass trans-
lates into a higher cg,t and consequently a higher incident
number flux of H2 molecules.
Evaporation in the free molecular regime is given by
qevapðt; dpÞ ¼ DHvJevap ¼ DHvpd2p
nvcv;t
4f ð8Þ
where DHv is the enthalpy of vaporization per atom, Jevap is
the evaporating mass flux, nv = pv/(kBTp) is the vapor
number density, cv,t = [8kBTp/(pmv)]1/2 is the mean thermal
speed of the vapor, mv is the atomic mass of the vaporized
species, and f is the sticking coefficient, 0 B f B 1, which
accounts for the fraction of evaporated atoms that cannot
escape the potential well and adsorb back onto the surface.
In this work, we assume f = 1, since the high surface
energy of the nanoparticle relative to the gas–surface
potential well depth precludes reabsorption of evaporated Si
atoms [15, 17]. The vaporized species is assumed to consist
entirely of atomic silicon, which is supported by mass
spectrometry measurements carried out by Tomooka et al.
[36] over temperature ranges similar to those considered in
this study. The enthalpy of vaporization, DHv, was found
using Watson’s equation [37, 38]
DHv ¼ Kð1� TrÞ0:38 ð9Þ
where K is a material constant, Tr = Tp/Tcr is the reduced
temperature, and Tcr is the critical temperature of liquid
silicon [39]. The constant can be solved using a known
reference point on the vapor dome, most often the heat of
vaporization at the boiling temperature and atmospheric
pressure. Once DHv is known, the vapor pressure, pv, can
be determined by the Clausius–Clapeyron relation [13]
lnðpvÞ ¼ �DHv
R
1
Tp
þ C ð10Þ
where R is the universal gas constant and C is a material
constant. The vapor pressure is also corrected for the
increased surface energy due to nanoparticle curvature
using the Kelvin equation [40]
pv ¼ pv;o exp4cs
dpqRsTp
� �ð11Þ
where pv,o is the vapor pressure for a flat surface, cs is the
surface tension of the nanoparticle material, taken at the
melting point [33], and Rs is the specific gas constant.
Recent studies (e.g. [41]) suggest that using the bulk value
for cs significantly underestimates the surface energy of
nanoparticles. The influence of nanoparticle size on surface
tension can be incorporated into the model using the
Tolman equation [42]
cs ¼cs;o
1þ 4d�
dp
ð12Þ
where cs,o is the bulk surface tension taken to be that of
bulk silicon at 2,000 K [33] and d is the Tolman length
taken as the atomic diameter for d/D C 20. Figure 5 shows
that this effect is negligible except for small particle sizes
(\10 nm) and at lower nanoparticle temperatures. For
moderately sized nanoparticles (*30 nm) and tempera-
tures at which evaporation is important ([2,400 K), this
model provides vapor pressures consistent with values
measured above molten silicon as reported by Tomooka
Time-resolved laser-induced incandescence 627
123
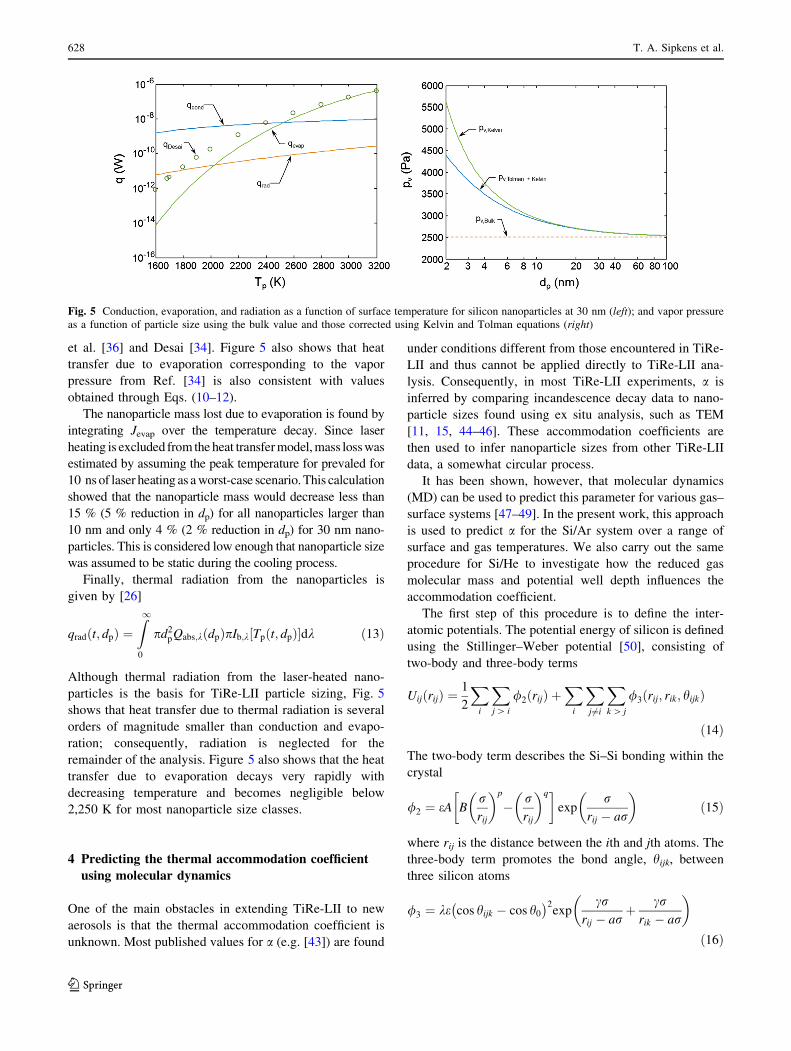
et al. [36] and Desai [34]. Figure 5 also shows that heat
transfer due to evaporation corresponding to the vapor
pressure from Ref. [34] is also consistent with values
obtained through Eqs. (10–12).
The nanoparticle mass lost due to evaporation is found by
integrating Jevap over the temperature decay. Since laser
heating is excluded from the heat transfer model, mass loss was
estimated by assuming the peak temperature for prevaled for
10 ns of laser heating as a worst-case scenario. This calculation
showed that the nanoparticle mass would decrease less than
15 % (5 % reduction in dp) for all nanoparticles larger than
10 nm and only 4 % (2 % reduction in dp) for 30 nm nano-
particles. This is considered low enough that nanoparticle size
was assumed to be static during the cooling process.
Finally, thermal radiation from the nanoparticles is
given by [26]
qradðt; dpÞ ¼Z1
0
pd2pQabs;kðdpÞpIb;k½Tpðt; dpÞ�dk ð13Þ
Although thermal radiation from the laser-heated nano-
particles is the basis for TiRe-LII particle sizing, Fig. 5
shows that heat transfer due to thermal radiation is several
orders of magnitude smaller than conduction and evapo-
ration; consequently, radiation is neglected for the
remainder of the analysis. Figure 5 also shows that the heat
transfer due to evaporation decays very rapidly with
decreasing temperature and becomes negligible below
2,250 K for most nanoparticle size classes.
4 Predicting the thermal accommodation coefficient
using molecular dynamics
One of the main obstacles in extending TiRe-LII to new
aerosols is that the thermal accommodation coefficient is
unknown. Most published values for a (e.g. [43]) are found
under conditions different from those encountered in TiRe-
LII and thus cannot be applied directly to TiRe-LII ana-
lysis. Consequently, in most TiRe-LII experiments, a is
inferred by comparing incandescence decay data to nano-
particle sizes found using ex situ analysis, such as TEM
[11, 15, 44–46]. These accommodation coefficients are
then used to infer nanoparticle sizes from other TiRe-LII
data, a somewhat circular process.
It has been shown, however, that molecular dynamics
(MD) can be used to predict this parameter for various gas–
surface systems [47–49]. In the present work, this approach
is used to predict a for the Si/Ar system over a range of
surface and gas temperatures. We also carry out the same
procedure for Si/He to investigate how the reduced gas
molecular mass and potential well depth influences the
accommodation coefficient.
The first step of this procedure is to define the inter-
atomic potentials. The potential energy of silicon is defined
using the Stillinger–Weber potential [50], consisting of
two-body and three-body terms
UijðrijÞ ¼1
2
Xi
Xj [ i
/2ðrijÞ þX
i
Xj 6¼i
Xk [ j
/3ðrij; rik; hijkÞ
ð14Þ
The two-body term describes the Si–Si bonding within the
crystal
/2 ¼ eA Brrij
� �p
� rrij
� �q� �exp
rrij � ar
� �ð15Þ
where rij is the distance between the ith and jth atoms. The
three-body term promotes the bond angle, hijk, between
three silicon atoms
/3 ¼ ke cos hijk � cos h0
2exp
crrij � ar
þ crrik � ar
� �
ð16Þ
Fig. 5 Conduction, evaporation, and radiation as a function of surface temperature for silicon nanoparticles at 30 nm (left); and vapor pressure
as a function of particle size using the bulk value and those corrected using Kelvin and Tolman equations (right)
628 T. A. Sipkens et al.
123
which keeps the silicon crystal in its diamond structure
below its melting temperature. The parameterization for
the Stillinger–Weber potential [50], summarized in
Table 1, has been shown to replicate the empirically
observed melting temperature and molten density of silicon
[51]. To verify the physicality of the Stillinger–Weber
potential for this application, the simulation density was
compared to the experimental density used in the heat
transfer model over a range of temperatures important to
TiRe-LII analysis [33]. Figure 6 confirms that the density
predicted by MD is within 10 % of the experimentally
derived value.
The gas atoms interact with the surface atoms through a
pairwise Morse potential
UijðrijÞ ¼ D e�2kðrij�reÞ � 2e�kðrij�reÞh i
ð17Þ
where D, k, and re are specific to the gas–surface molecular
pair. These parameters are found by fitting superimposed
pairwise potentials to the ground state energies derived
from density functional theory (DFT) for gas atoms at
various heights above a silicon surface. The silicon surface
is represented by a 2 9 2 9 2 supercell of 64 atoms with a
lattice parameter of 0.543 nm. The present work used the
WIEN2k code [52] with the generalized gradient approxi-
mation (GGA) parameterization of the exchange and cor-
relation functionals with RKM value of 5.0- and 12-k
points in the irreducible Brillouin zone. RKM is the
product of the largest plane-wave vector and the smallest
muffin-tin radius in the system. Muffin-tin radii of
0.117 nm (for Si) and 0.106 nm (for Ar and He) were used.
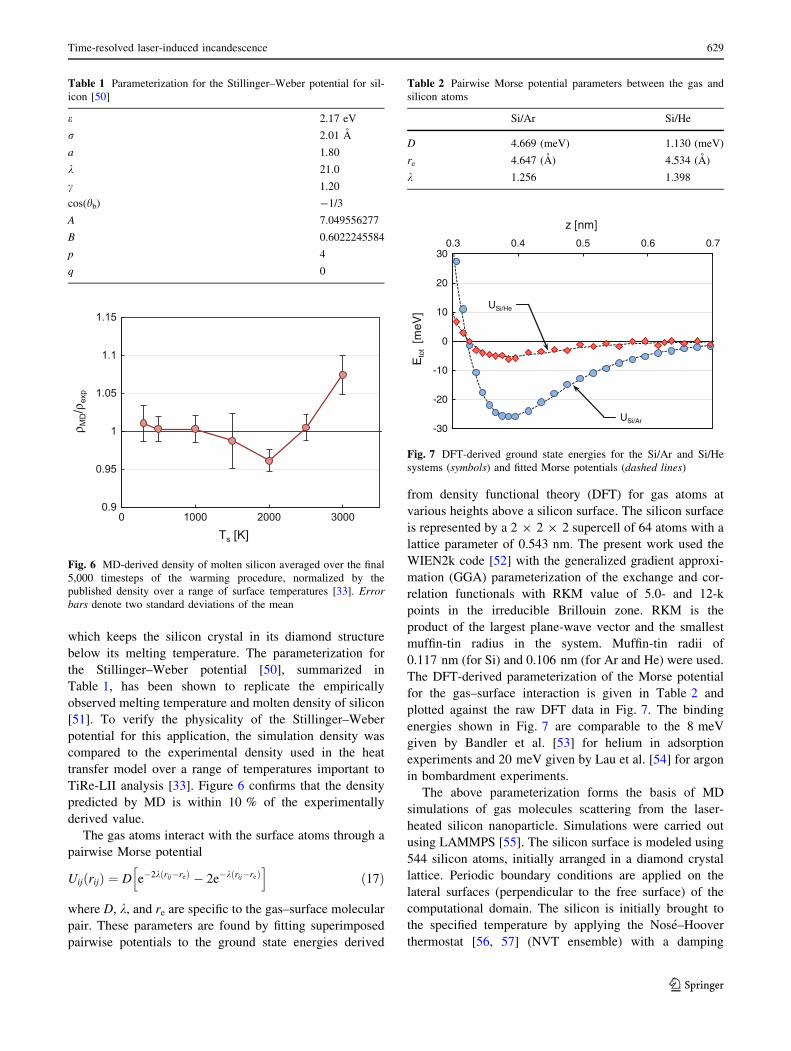
The DFT-derived parameterization of the Morse potential
for the gas–surface interaction is given in Table 2 and
plotted against the raw DFT data in Fig. 7. The binding
energies shown in Fig. 7 are comparable to the 8 meV
given by Bandler et al. [53] for helium in adsorption
experiments and 20 meV given by Lau et al. [54] for argon
in bombardment experiments.
The above parameterization forms the basis of MD
simulations of gas molecules scattering from the laser-
heated silicon nanoparticle. Simulations were carried out
using LAMMPS [55]. The silicon surface is modeled using
544 silicon atoms, initially arranged in a diamond crystal
lattice. Periodic boundary conditions are applied on the
lateral surfaces (perpendicular to the free surface) of the
computational domain. The silicon is initially brought to
the specified temperature by applying the Nose–Hoover
thermostat [56, 57] (NVT ensemble) with a damping
Table 1 Parameterization for the Stillinger–Weber potential for sil-
icon [50]
e 2.17 eV
r 2.01 A
a 1.80
k 21.0
c 1.20
cos(hb) -1/3
A 7.049556277
B 0.6022245584
p 4
q 0
0.9
0.95
1
1.05
1.1
1.15
0 1000 2000 3000
ρ MD/ρexp
Ts [K]
Fig. 6 MD-derived density of molten silicon averaged over the final
5,000 timesteps of the warming procedure, normalized by the
published density over a range of surface temperatures [33]. Error
bars denote two standard deviations of the mean
Table 2 Pairwise Morse potential parameters between the gas and
silicon atoms
Si/Ar Si/He
D 4.669 (meV) 1.130 (meV)
re 4.647 (A) 4.534 (A)
k 1.256 1.398
-30
-20
-10
0
10
20
300.3 0.4 0.5 0.6 0.7
Eto
t [m
eV]
z [nm]
USi/He
USi/Ar
Fig. 7 DFT-derived ground state energies for the Si/Ar and Si/He
systems (symbols) and fitted Morse potentials (dashed lines)
Time-resolved laser-induced incandescence 629
123
constant of 0.1 ps for 30 ps. The simulation is continued
for 5 ps under the NVE ensemble to ensure that the system
has reached equilibrium conditions at the desired temper-
ature, during which time the surface density is also tracked.
At the conclusion of this simulation, the silicon atom
positions and velocities are stored in a restart file.
The MD simulation forms the kernel of a Monte Carlo
integration over 1,500 incident gas molecular trajectories.
Incident gas velocities are sampled from a Maxwell–
Boltzmann distribution at the prescribed gas temperature
following [47], and the silicon atomic trajectories are ini-
tialized from the restart file. The atomic trajectories are then
traced until the gas atom exceeds its initial height above the
surface. The accommodation coefficient is then found by
a ¼mg
�2 v2
2 � v21
� �2kBðTp � TgÞ
ð18Þ
where mg is the gas molecular mass, and v1 and v2 are the
incident and scattered gas molecular velocities, respec-
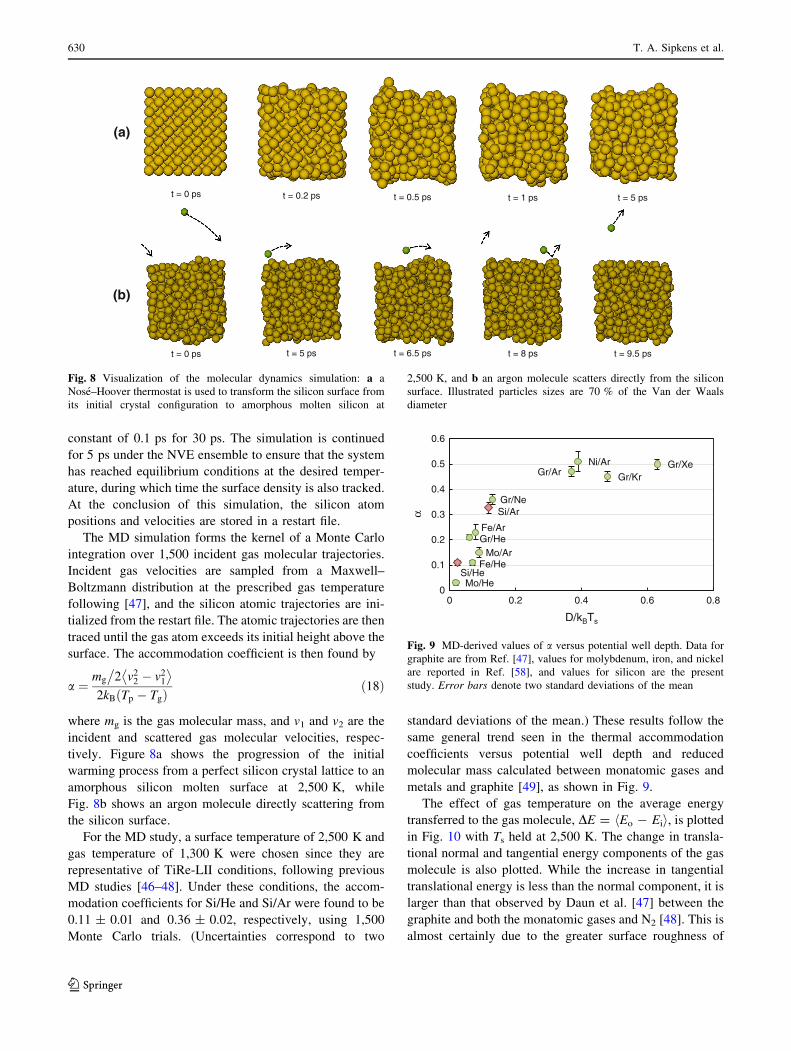
tively. Figure 8a shows the progression of the initial
warming process from a perfect silicon crystal lattice to an
amorphous silicon molten surface at 2,500 K, while
Fig. 8b shows an argon molecule directly scattering from
the silicon surface.
For the MD study, a surface temperature of 2,500 K and
gas temperature of 1,300 K were chosen since they are
representative of TiRe-LII conditions, following previous
MD studies [46–48]. Under these conditions, the accom-
modation coefficients for Si/He and Si/Ar were found to be
0.11 ± 0.01 and 0.36 ± 0.02, respectively, using 1,500
Monte Carlo trials. (Uncertainties correspond to two
standard deviations of the mean.) These results follow the
same general trend seen in the thermal accommodation
coefficients versus potential well depth and reduced
molecular mass calculated between monatomic gases and
metals and graphite [49], as shown in Fig. 9.
The effect of gas temperature on the average energy
transferred to the gas molecule, DE = hEo - Eii, is plotted
in Fig. 10 with Ts held at 2,500 K. The change in transla-
tional normal and tangential energy components of the gas
molecule is also plotted. While the increase in tangential
translational energy is less than the normal component, it is
larger than that observed by Daun et al. [47] between the
graphite and both the monatomic gases and N2 [48]. This is
almost certainly due to the greater surface roughness of
(a)
t = 0 ps t = 0.2 ps t = 0.5 ps t = 1 ps t = 5 ps
(b)
t = 0 ps t = 5 ps t = 6.5 ps t = 8 ps t = 9.5 ps
Fig. 8 Visualization of the molecular dynamics simulation: a a
Nose–Hoover thermostat is used to transform the silicon surface from
its initial crystal configuration to amorphous molten silicon at
2,500 K, and b an argon molecule scatters directly from the silicon
surface. Illustrated particles sizes are 70 % of the Van der Waals
diameter
Fe/Ar
Fe/HeMo/Ar
Mo/He
Ni/Ar
Gr/He
Gr/Ne
Gr/Ar Gr/KrGr/Xe
Si/Ar
Si/He
0
0.1
0.2
0.3
0.4
0.5
0.6
0 0.2 0.4 0.6 0.8
α
D/kBTs
Fig. 9 MD-derived values of a versus potential well depth. Data for
graphite are from Ref. [47], values for molybdenum, iron, and nickel
are reported in Ref. [58], and values for silicon are the present
study. Error bars denote two standard deviations of the mean
630 T. A. Sipkens et al.
123

liquid silicon compared to solid graphite; in the latter case,
the thermal motion of carbon atoms is primarily normal to
the exposed surface, so surface energy is transferred pref-
erentially into the normal translational mode of the gas
molecule. In contrast, the motion of atoms in molten Si is
comparatively unconstrained, so energy is transferred into
the normal and tangential modes. Similar trends were
observed when comparing the MD-derived normal and
tangential modes of the accommodation coefficients for
molten Fe and Ni nanoparticles with those for Mo nano-
particles, which remain solid in TiRe-LII experiments [58].
Figure 10 also shows that the average energy increase is
zero when Ts = Tg, in accordance with the 2nd Law of
Thermodynamics. The individual normal and tangential
components of translational energy also appear to follow
the same rule, suggesting that the normal and tangential
modes of the gas molecule are uncoupled.
Figure 11 shows accommodation coefficients corre-
sponding to change in gas molecular energies shown in
Fig. 10. Because the denominator of Eq. (18) becomes very
small when Ts & Tg, a quadratic curve is fit to the points in
Fig. 10 and is forced to cross zero when Ts = Tg in
accordance with the 2nd Law. Substituting this expression
into Eq. (18) gives a linear relationship between a and Tg
that is plotted in Fig. 11. The fitted curves generally lie
within the error bounds (two standard deviations of the
mean of the Monte Carlo trials) in the entire range of
considered gas temperatures.
Figure 12 shows the simulated change in energy transfer
considering surface temperatures from 200 to 3,000 K for
Tg = 300 K. This plot reveals an inflection in the normal
and tangential components of the gas molecular energies
occurring when Ts & Tmelt, represented by the vertical
dashed line in Fig. 12c. This is expected, particularly for
the tangential component, due to increased mobility of the
surface atoms in the liquid state as described above. Fig-
ure 12 shows that the thermal accommodation coefficients
can be approximated by constant values above and below
the melting temperature
aSi=Ar ¼0:100; Ts\Tm
0:347; Ts [ Tm
aSi=He ¼0:078; Ts\Tm
0:107; Ts [ Tm
: ð19Þ
5 Analysis of TiRe-LII data
The MD-derived accommodation coefficients are then used
to interpret the experimental TiRe-LII data. Silicon nano-
particle diameters are initially found by nonlinear regres-
sion of the experimental pyrometrically defined effective
temperature, Teff, to the same effective temperature derived
-2000
-1500
-1000
-500
0
500
1000
15000 1000 2000 3000 4000
Δ
Δ ΔEn
[K]
Tg [K](a)
Si/He
Si/Ar
-2000
-1500
-1000
-500
0
500
1000
15000 1000 2000 3000 4000
Et[K
]
Tg [K]
Si/ArSi/He
(b)
-2000
-1500
-1000
-500
0
500
1000
15000 1000 2000 3000 4000
E [K
]
Tg [K]
Si/Ar
Si/He
(c)
Fig. 10 Variation of DE = hEo - Eii of Si/Ar and Si/He with Tg at Ts = 2,500 K decomposed into: a the normal component; b the tangential
component; and c the sum of both components. Error bars denote two standard deviations of the mean
0
0.1
0.2
0.3
0.4
0.5
0.6
0.7
0 1000 2000 3000 4000
α
Tg [K]
Si/Ar
Si/He
Fig. 11 Variation of a for Si/Ar and Si/He with Tg at
Ts = 2,500 K. Error bars denote two standard deviations of the mean
Time-resolved laser-induced incandescence 631
123
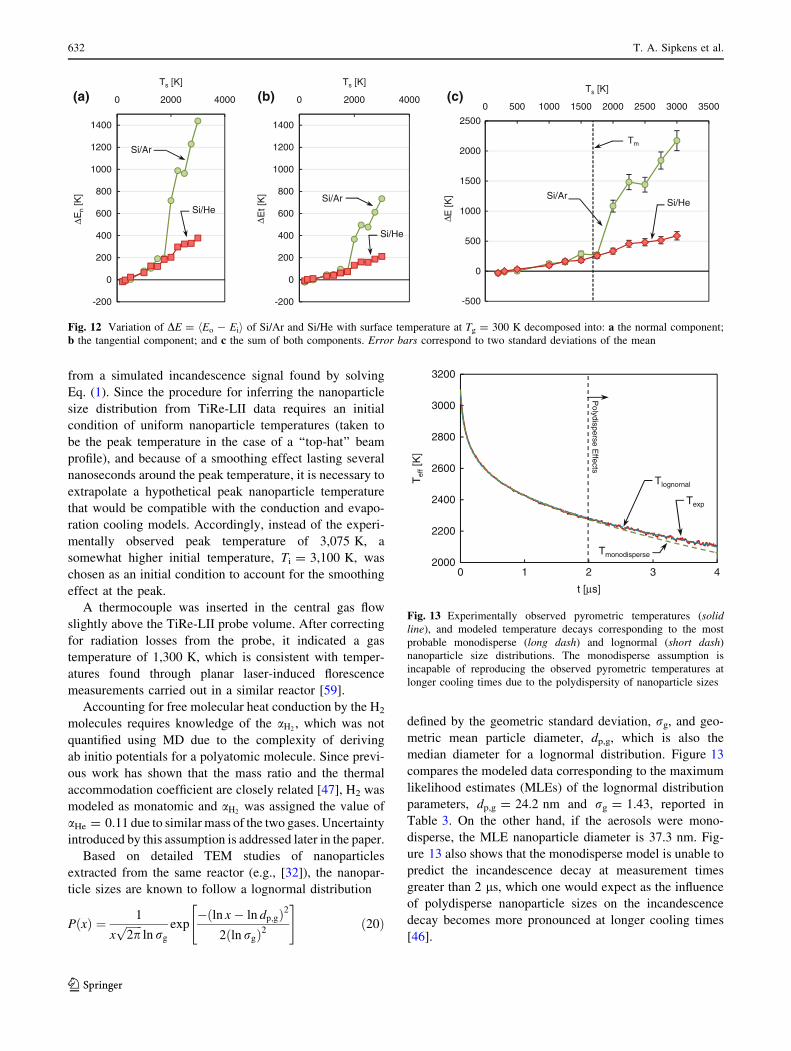
from a simulated incandescence signal found by solving
Eq. (1). Since the procedure for inferring the nanoparticle
size distribution from TiRe-LII data requires an initial
condition of uniform nanoparticle temperatures (taken to
be the peak temperature in the case of a ‘‘top-hat’’ beam
profile), and because of a smoothing effect lasting several
nanoseconds around the peak temperature, it is necessary to
extrapolate a hypothetical peak nanoparticle temperature
that would be compatible with the conduction and evapo-
ration cooling models. Accordingly, instead of the experi-
mentally observed peak temperature of 3,075 K, a
somewhat higher initial temperature, Ti = 3,100 K, was
chosen as an initial condition to account for the smoothing
effect at the peak.
A thermocouple was inserted in the central gas flow
slightly above the TiRe-LII probe volume. After correcting
for radiation losses from the probe, it indicated a gas
temperature of 1,300 K, which is consistent with temper-
atures found through planar laser-induced florescence
measurements carried out in a similar reactor [59].
Accounting for free molecular heat conduction by the H2
molecules requires knowledge of the aH2, which was not
quantified using MD due to the complexity of deriving
ab initio potentials for a polyatomic molecule. Since previ-
ous work has shown that the mass ratio and the thermal
accommodation coefficient are closely related [47], H2 was
modeled as monatomic and aH2was assigned the value of
aHe = 0.11 due to similar mass of the two gases. Uncertainty
introduced by this assumption is addressed later in the paper.
Based on detailed TEM studies of nanoparticles
extracted from the same reactor (e.g., [32]), the nanopar-
ticle sizes are known to follow a lognormal distribution
PðxÞ ¼ 1
xffiffiffiffiffiffi2pp
ln rg
exp�ðln x� ln dp;gÞ2
2ðln rgÞ2
" #ð20Þ
defined by the geometric standard deviation, rg, and geo-
metric mean particle diameter, dp,g, which is also the
median diameter for a lognormal distribution. Figure 13
compares the modeled data corresponding to the maximum
likelihood estimates (MLEs) of the lognormal distribution
parameters, dp,g = 24.2 nm and rg = 1.43, reported in
Table 3. On the other hand, if the aerosols were mono-
disperse, the MLE nanoparticle diameter is 37.3 nm. Fig-
ure 13 also shows that the monodisperse model is unable to
predict the incandescence decay at measurement times
greater than 2 ls, which one would expect as the influence
of polydisperse nanoparticle sizes on the incandescence
decay becomes more pronounced at longer cooling times
[46].
-200
0
200
400
600
800
1000
1200
1400
0 2000 4000
Δ Δ ΔEn
[K]
Ts [K]
Si/He
(a)
Si/Ar
-200
0
200
400
600
800
1000
1200
1400
0 2000 4000
Et [
K]
Ts [K]
Si/Ar
Si/He
(b)
-500
0
500
1000
1500
2000
2500
0 500 1000 1500 2000 2500 3000 3500
E [K
]
Ts [K]
Si/ArSi/He
(c)
Tm
Fig. 12 Variation of DE = hEo - Eii of Si/Ar and Si/He with surface temperature at Tg = 300 K decomposed into: a the normal component;
b the tangential component; and c the sum of both components. Error bars correspond to two standard deviations of the mean
2000
2200
2400
2600
2800
3000
3200
0 1 2 3 4
Tef
f[K
]
t [μs]
Polydisperse E
ffects
Texp
Tlognornal
Tmonodisperse
Fig. 13 Experimentally observed pyrometric temperatures (solid
line), and modeled temperature decays corresponding to the most
probable monodisperse (long dash) and lognormal (short dash)
nanoparticle size distributions. The monodisperse assumption is
incapable of reproducing the observed pyrometric temperatures at
longer cooling times due to the polydispersity of nanoparticle sizes
632 T. A. Sipkens et al.
123
Uncertainty in the distribution parameters caused by
noise in the monochromatic incandescence measurements
(due mainly to photomultiplier shot noise) was quantified
using robust Bayesian analysis similar to the procedure
described in Ref. [60]. In this approach, the posterior
probability, P(x|b), of the hypothesized set of distribution
parameters in x = [dp,g, rg]T is defined by
P xjbð Þ ¼ P bjxð ÞPprðxÞP bð Þ ð21Þ
where P(b|x) is the likelihood of the observed data in b
occurring for a hypothetical x, Ppr(x) is the probability of x
being correct based on prior knowledge of the distribution
parameters, and P(b) scales the posterior probability so that
the Law of Total Probability is satisfied. If the spectral
incandescence data are contaminated with independent,
normally distributed error, the likelihood is given by
P bjxð Þ ¼Y
j
1ffiffiffiffiffiffiffiffiffiffi2pr2
j
q exp �Texp;j � Tmod;j
2
2r2j
( )ð22Þ
where rj is the expected standard deviation of the measured
incandescence at the jth measurement time. The standard
deviation increases at longer cooling times, as the signal-
to-noise ratio in the incandescence traces drops with
decreasing signal intensity [61]. In order to account for this
fact, rj is modeled by a quadratic function fitted to the
standard deviations of the mean of 300 independent sets of
incandescence data evaluated at every measurement time.
The prior probability is defined as
PprðxÞ ¼1; if dp;g� 0 and rg� 1
0; otherwise
ð23Þ
since neither dp,g nor r = ln(rg) can hold non-positive
values. While Eq. (19) defines a two-dimensional plot of
the probability density of x, it is more convenient to
quantify the uncertainty of a distribution parameter of
interest with a credible interval over the marginalized
probability densities of each variable. Since the marginal-
ized posterior probabilities may be asymmetric, it is useful
to define the credible interval using the highest density
region (HDR) or highest density probability [62], which
can be quantified using the density quantile approach [63].
In this case, a set of 10,000 samples, X = {x1, x2, …, xn},
is generated using a Markov Chain Monte Carlo (MCMC)
algorithm [64]; these samples are then used to form
marginalized posterior distributions for dp,g and rg through
kernel density estimation [65].
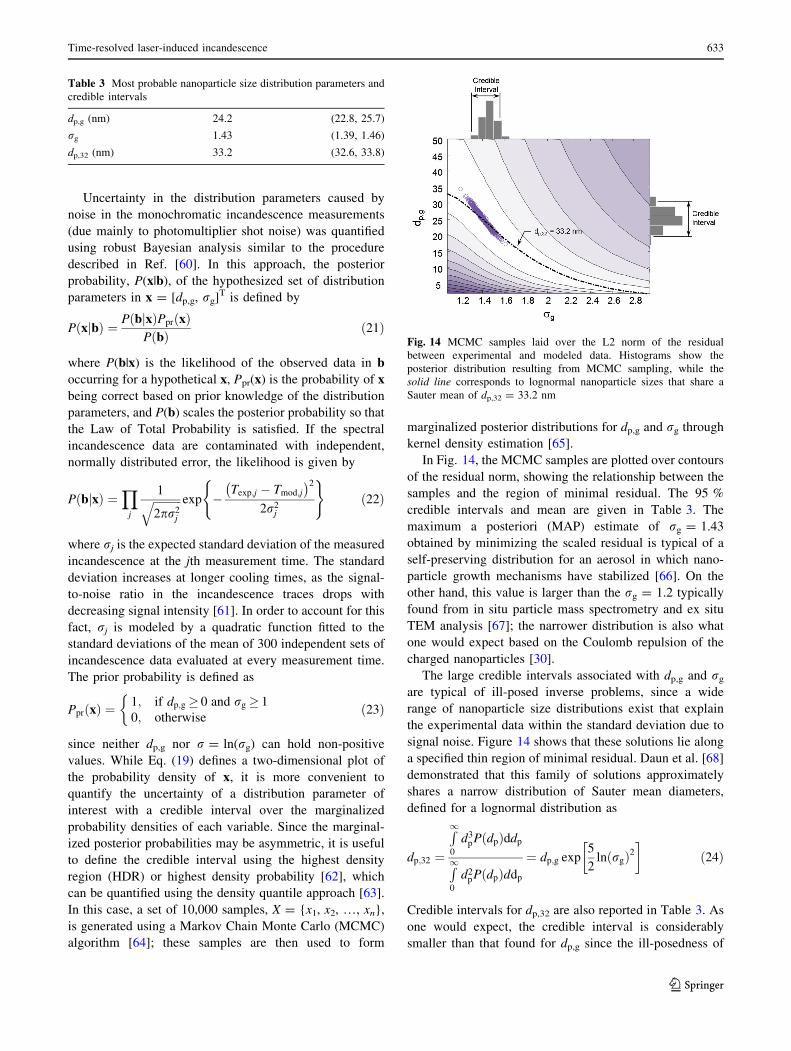
In Fig. 14, the MCMC samples are plotted over contours
of the residual norm, showing the relationship between the
samples and the region of minimal residual. The 95 %
credible intervals and mean are given in Table 3. The
maximum a posteriori (MAP) estimate of rg = 1.43
obtained by minimizing the scaled residual is typical of a
self-preserving distribution for an aerosol in which nano-
particle growth mechanisms have stabilized [66]. On the
other hand, this value is larger than the rg = 1.2 typically
found from in situ particle mass spectrometry and ex situ
TEM analysis [67]; the narrower distribution is also what
one would expect based on the Coulomb repulsion of the
charged nanoparticles [30].
The large credible intervals associated with dp,g and rg
are typical of ill-posed inverse problems, since a wide
range of nanoparticle size distributions exist that explain
the experimental data within the standard deviation due to
signal noise. Figure 14 shows that these solutions lie along
a specified thin region of minimal residual. Daun et al. [68]
demonstrated that this family of solutions approximately
shares a narrow distribution of Sauter mean diameters,
defined for a lognormal distribution as
dp;32 ¼
R10
d3pPðdpÞddp
R10
d2pPðdpÞddp
¼ dp;g exp5
2lnðrgÞ2
� �ð24Þ
Credible intervals for dp,32 are also reported in Table 3. As
one would expect, the credible interval is considerably
smaller than that found for dp,g since the ill-posedness of
Table 3 Most probable nanoparticle size distribution parameters and
credible intervals
dp,g (nm) 24.2 (22.8, 25.7)
rg 1.43 (1.39, 1.46)
dp,32 (nm) 33.2 (32.6, 33.8)
Fig. 14 MCMC samples laid over the L2 norm of the residual
between experimental and modeled data. Histograms show the
posterior distribution resulting from MCMC sampling, while the
solid line corresponds to lognormal nanoparticle sizes that share a
Sauter mean of dp,32 = 33.2 nm
Time-resolved laser-induced incandescence 633
123
the problem is due to the narrow curvature of the residual
function along the locus of distributions that share a
common Sauter mean diameter.
We must also consider, separately, how model param-
eter uncertainty affects the recovered nanoparticle size
distribution parameters. As noted above, the gas tempera-
ture within the probe volume is difficult to measure pre-
cisely due to the limited access afforded by the reactor
geometry, but is approximately 1,300 K based on a ther-
mocouple measurement in near the probe volume. An
uncertainty of ±200 K is assigned as a conservative esti-
mate of this uncertainty, primarily due to uncertainty in
laser position with respect to the thermocouple location.
The extrapolated initial nanoparticle temperature used in
the sizing analysis is assigned an uncertainty of ±25 K,
based on the difference between the experimentally
observed peak temperature (3,075 K) and the assumed
value (3,100 K). The thermal accommodation coefficient
for H2 is assigned a conservative uncertainty of ±50 %.
Uncertainties in q, cp, pg, cs, Tcr, and the MD-derived
thermal accommodation coefficients are taken to be 10 %
of their nominal values.
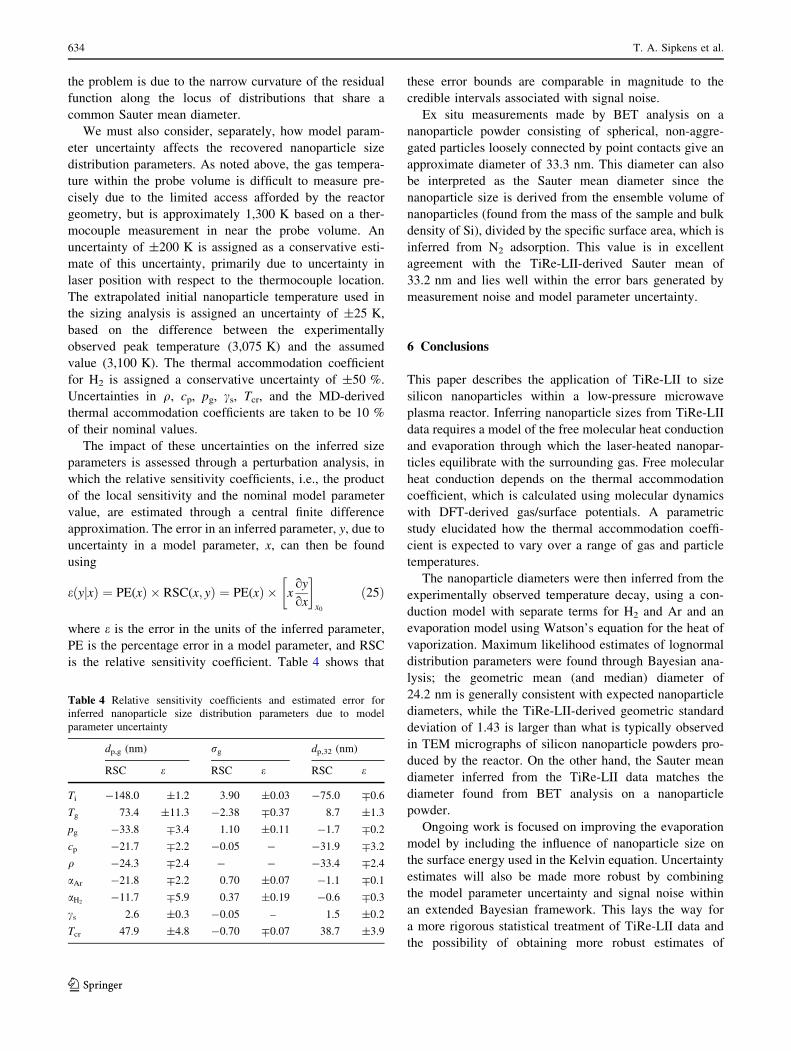
The impact of these uncertainties on the inferred size
parameters is assessed through a perturbation analysis, in
which the relative sensitivity coefficients, i.e., the product
of the local sensitivity and the nominal model parameter
value, are estimated through a central finite difference
approximation. The error in an inferred parameter, y, due to
uncertainty in a model parameter, x, can then be found
using
e yjxð Þ ¼ PE(xÞ � RSC(x; yÞ ¼ PE(xÞ � xoy
ox
� �x0
ð25Þ
where e is the error in the units of the inferred parameter,
PE is the percentage error in a model parameter, and RSC
is the relative sensitivity coefficient. Table 4 shows that
these error bounds are comparable in magnitude to the
credible intervals associated with signal noise.
Ex situ measurements made by BET analysis on a
nanoparticle powder consisting of spherical, non-aggre-
gated particles loosely connected by point contacts give an
approximate diameter of 33.3 nm. This diameter can also
be interpreted as the Sauter mean diameter since the
nanoparticle size is derived from the ensemble volume of
nanoparticles (found from the mass of the sample and bulk
density of Si), divided by the specific surface area, which is
inferred from N2 adsorption. This value is in excellent
agreement with the TiRe-LII-derived Sauter mean of
33.2 nm and lies well within the error bars generated by
measurement noise and model parameter uncertainty.
6 Conclusions
This paper describes the application of TiRe-LII to size
silicon nanoparticles within a low-pressure microwave
plasma reactor. Inferring nanoparticle sizes from TiRe-LII
data requires a model of the free molecular heat conduction
and evaporation through which the laser-heated nanopar-
ticles equilibrate with the surrounding gas. Free molecular
heat conduction depends on the thermal accommodation
coefficient, which is calculated using molecular dynamics
with DFT-derived gas/surface potentials. A parametric
study elucidated how the thermal accommodation coeffi-
cient is expected to vary over a range of gas and particle
temperatures.
The nanoparticle diameters were then inferred from the
experimentally observed temperature decay, using a con-
duction model with separate terms for H2 and Ar and an
evaporation model using Watson’s equation for the heat of
vaporization. Maximum likelihood estimates of lognormal
distribution parameters were found through Bayesian ana-
lysis; the geometric mean (and median) diameter of
24.2 nm is generally consistent with expected nanoparticle
diameters, while the TiRe-LII-derived geometric standard
deviation of 1.43 is larger than what is typically observed
in TEM micrographs of silicon nanoparticle powders pro-
duced by the reactor. On the other hand, the Sauter mean
diameter inferred from the TiRe-LII data matches the
diameter found from BET analysis on a nanoparticle
powder.
Ongoing work is focused on improving the evaporation
model by including the influence of nanoparticle size on
the surface energy used in the Kelvin equation. Uncertainty
estimates will also be made more robust by combining
the model parameter uncertainty and signal noise within
an extended Bayesian framework. This lays the way for
a more rigorous statistical treatment of TiRe-LII data and
the possibility of obtaining more robust estimates of
Table 4 Relative sensitivity coefficients and estimated error for
inferred nanoparticle size distribution parameters due to model
parameter uncertainty
dp,g (nm) rg dp,32 (nm)
RSC e RSC e RSC e
Ti -148.0 ±1.2 3.90 ±0.03 -75.0 ;0.6
Tg 73.4 ±11.3 -2.38 ;0.37 8.7 ±1.3
pg -33.8 ;3.4 1.10 ±0.11 -1.7 ;0.2
cp -21.7 ;2.2 -0.05 - -31.9 ;3.2
q -24.3 ;2.4 - - -33.4 ;2.4
aAr -21.8 ;2.2 0.70 ±0.07 -1.1 ;0.1
aH2-11.7 ;5.9 0.37 ±0.19 -0.6 ;0.3
cs 2.6 ±0.3 -0.05 – 1.5 ±0.2
Tcr 47.9 ±4.8 -0.70 ;0.07 38.7 ±3.9
634 T. A. Sipkens et al.
123
nanoparticle morphology by combining TiRe-LII data with
other techniques that provide complementary information.
Acknowledgments This research was supported by grants from the
Natural Science and Engineering Council of Canada (NSERC) and
the Deutsche Forschungsgemeinschaft (DFG). One of the authors (TA
Sipkens) was also supported by a scholarship from the Government of
Ontario. Compute Canada and SharcNet (www.sharcnet.ca) provided
the computational resources.
References
1. N. O’Farrell, A. Houlton, B.R. Horrocks, Int. J. Nanomed. 1, 451
(2006)
2. G. Konstantanos, E.H. Sargent, Nat. Nanotechnol. 5, 391 (2010)
3. M. Kummer, J.P. Badillo, A. Schmitz, H.-G. Bremes, M. Winter,
C. Schulz, H. Wiggers, J. Electrochem. Soc. 161, A40 (2014)
4. L. Pavesi, R. Turan, Silicon Nanocrystals: Fundamentals, Syn-
thesis, and Applications (Wiley, New York, 2010)
5. L.A. Melton, Appl. Opt. 23, 2201 (1984)
6. D.R. Snelling, G.J. Smallwood, F. Liu, O.L. Gulder, W.D. Bac-
halo, Appl. Opt. 44, 6773 (2005)
7. B.F. Kock, T. Eckhardt, P. Roth, Proc. Comb. Inst. 29, 2775
(2002)
8. S. Schraml, S. Will, A. Leipertz, SAE Technical Paper Series
1999-01-0146 (1999)
9. R.L. Vander Wal, T.M. Ticich, J.R. West, Appl. Opt. 38, 5867
(1999)
10. A.V. Filippov, M.W. Markus, P. Roth, J. Aerosol Sci. 30, 71
(1999)
11. R. Starke, B. Kock, P. Roth, Shock Waves 12, 351 (2003)
12. A.V. Eremin, E.V. Gurentsov, C. Schulz, J. Phys. D Appl. Phys.
41, 055203 (2008)
13. A.V. Eremin, E.V. Gurentsov, E. Popova, K. Priemchenko, Appl.
Phys. B 104, 289 (2011)
14. E.V. Gurentsov, A.V. Eremin, High Temp. 49, 667 (2011)
15. B.F. Kock, C. Kayan, J. Knipping, H.R. Orthner, P. Roth, Proc.
Comb. Inst. 30, 1689 (2005)
16. Y. Murakami, T. Sugatani, Y. Nosaka, J. Phys. Chem. A 109,
8994 (2005)
17. T.A. Sipkens, G. Joshi, K.J. Daun, Y. Murakami, J. Heat Transf.
135, 052401 (2013)
18. J. Reimann, H. Oltmann, S. Will, E.L. Bassano Carotenuto, S.
Losch, S. Gunther, in Laser Sintering of Nickel Aggregates
Produced from Inert Gas Condensation. Proceedings of the
World Congress on Particle Technology (Nuremburg, Germany,
2010)
19. T. Lehre, R. Suntz, H. Bockhorn, Proc. Combust. Inst. 30, 2585
(2005)
20. F. Cignoli, C. Bellomunno, S. Maffi, G. Zizak, Appl. Phys. B 96,
599 (2009)
21. S. Maffi, F. Cignoli, C. Bellomunno, S. De luliis, G. Zizak,
Spectrochim. Acta B 63, 202 (2008)
22. B. Tribalet, A. Faccinetto, T. Dreier, C. Schulz, in Evaluation of
Particle Sizes of Iron-Oxide Nano-Particles in a Low-Pressure
Flame-Synthesis Reactor by Simultaneous Application of TiRe-
LII and PMS. 5th International Workshop on Laser-Induced
Incandescence (Le Touquet, France, 2012)
23. I. Altman, D. Lee, J. Song, M. Choi, Phys. Rev. E 64, 052202
(2001)
24. G.S. Eom, S. Park, C.W. Park, Y.H. Shin, K.H. Chung, S. Park,
W. Choe, J.W. Hahn, Appl. Phys. Lett. 83, 1261 (2003)
25. G.S. Eom, S. Park, C.W. Park, W. Choe, Y. Shin, K.H. Chung,
J.W. Hahn, Jpn. J. Appl. Phys. 43, 6494 (2004)
26. M.F. Modest, Radiative Heat Transfer (Academic Press, San
Diego, 2013)
27. F. Liu, K.J. Daun, V. Beyer, G.J. Smallwood, D.A. Greenhalgh,
Appl. Phys. B 87, 179 (2007)
28. S. Brunauer, P.H. Emmett, E. Teller, JACS 60, 309 (1938)
29. N. Petermann, N. Stein, G. Schierning, R. Theissmann, B. Stoib,
C. Hecht, C. Schulz, H. Wiggers, J. Phys. D Appl. Phys. 44,
174034 (2011)
30. U. Kortshagen, L. Mangolini, A. Baost, J. Nanopart. Res. 9, 39
(2007)
31. M.S.K. Fuchs, J. Phys. Condens. Matter 12, 4341 (2000)
32. V.A. Hackley, A.B. Stefaniak, J. Nanopart. Res. 15, 1742 (2013)
33. W.K. Rhim, K. Ohsaka, J. Cryst. Growth 208, 313 (2000)
34. P.D. Desai, J. Phys. Chem. Ref. Data 15, 967 (1986)
35. F. Liu, K.J. Daun, D.R. Snelling, G.J. Smallwood, Appl. Phys. B
83, 355 (2006)
36. T. Tamooka, T. Shoji, T. Matsui, J. Mass Spectrom. Soc. Jpn. 47,
49 (1999)
37. K.M. Watson, Ind. Eng. Chem. 35, 398 (1943)
38. S. Velasco, F.L. Roman, J.A. White, A. Mulero, Fluid Phase
Equlib. 244, 11 (2006)
39. V. Svrcek, T. Sasaki, Y. Shimizu, N. Koshizaki, J. Appl. Phys.
103, 023101 (2008)
40. S.J. Gregg, K.S.W. Sing, Adsorption, Surface Area and Porosity
(Academic Press, London, 1982)
41. K.K. Nanda, A. Maisels, F.E. Kruis, H. Fissan, S. Stappert, Phys.
Rev. Lett. 91, 106102 (2003)
42. H.H. Lu, Q. Jiang, Langmuir 21, 779 (2005)
43. S.C. Saxena, R.K. Joshi, Thermal Accommodation Coefficients of
Gases (McGraw-Hill, New York, 1981)
44. A.V. Eremin, E.V. Gurentsov, M. Hofmann, B.F. Kock, C.
Schulz, Appl. Phys. B 83, 449 (2006)
45. E.V. Gurentsov, A.V. Eremin, C. Schulz, Kinet. Catal. 48, 194
(2007)
46. K.J. Daun, G.J. Smallwood, F. Liu, J. Heat Transf. 130, 121201
(2008)
47. K.J. Daun, G.J. Smallwood, F. Liu, Appl. Phys. B 94, 39 (2009)
48. K.J. Daun, Int. J. Heat Mass Transf. 52, 5081 (2009)
49. K.J. Daun, J.T. Titantah, M. Karttunen, Appl. Phys. B 107, 221
(2012)
50. F.H. Stillinger, T.A. Weber, Phys. Rev. B: Condens. Matter 31,
5263 (1985)
51. V.S. Dozhidikov, A.Y. Basharin, P.R. Levashov, J. Chem. Phys.
137, 054502 (2012)
52. P. Blaha, K. Schwarz, G. Madsen, D. Kvasnicka, J. Luitz,
WIEN2k, An Augmented Plane Wave Plus Local Orbitals Pro-
gram for Calculating Crystal Properties (Vienna University of
Technology, Vienna, 2001)
53. S.R. Bandler, J.S. Adams, S.M.E.C. Brouer, R.E. Lanou, H.J.
Maris, T. More, F.S. Porter, G.M. Seidel, Nucl. Instrum. Methods
Phys. Res. A 370, 138 (1996)
54. W.M. Lau, I. Bello, L.J. Huang, M. Vos, I.V. Mitchell, J. Appl.
Phys. 74, 7101 (1993)
55. S. Plimpton, J. Comput. Phys. 117, 1 (1995)
56. S. Nose, Mol. Phys. 52, 255 (1984)
57. W.G. Hoover, Phys. Rev. A 31, 1695 (1985)
58. K.J. Daun, T.A. Sipkens, J.T. Titantah, M. Karttunen, Appl. Phys.
B. doi:10.1007/s00340-013-5508-0
59. C. Heicht, A. Abdali, T. Dreier, C. Schulz, Z. Phys. Chem. 225,
1225 (2011)
60. R. Charnigo, M. Francoeur, P. Kenkel, M.P. Menguc, B. Hall, C.
Srinivasan, JQSRT 113, 182 (2012)
61. A. Yariv, Introduction to Optical Electronics (Holt, Rinehart, and
Winston, Inc., New York, 1971)
62. M. Chen, Q. Shao, J. Comput. Graph. Stat. 8, 69 (2012)
63. R.J. Hyndman, Am. Stat. 50, 120 (1996)
Time-resolved laser-induced incandescence 635
123
64. W.H. Press, S.A. Teukolsky, W.T. Vetterling, B.P. Flannery,
Numerical Recipes: The Art of Scientific Computing (Cambridge
University Press, Cambridge, 2007)
65. A.W. Bowman, A. Azzalini, Applied Smoothing Techniques for
Data Analysis (Oxford University Press, Oxford, 1997)
66. W.C. Hinds, Aerosol Technology: Properties, Behaviour, and
Measurement of Airborne Nanoparticles (John Wiley and Sons,
New York, 1982)
67. J. Knipping, H. Wiggers, B. Rellinghaus, P. Konjhodzic, C.
Meier, J. Nanosci. Nanotech. 4, 1039 (2004)
68. K.J. Daun, B.J. Stagg, F. Liu, G.J. Smallwood, D.R. Snelling,
Appl. Phys. B 87, 363 (2007)
636 T. A. Sipkens et al.
123
Copyright © 2022 FDOKUMEN