Simulation and Analysis of High-Pressure Condensate Field ...
Physics of the Earth and Planetary Interiors 147 (2004) 27–44
In situ measurements of sound velocities and densities across theorthopyroxene→ high-pressure clinopyroxene transition in
MgSiO3 at high pressure
Jennifer Kunga,∗, Baosheng Lia, Takeyuki Uchidab, Yanbin Wangb,Daniel Neuvillec, Robert C. Liebermanna
a Mineral Physics Institute and Department of Geosciences, Stony Brook University, Stony Brook, NY 11794, USAb GSECARS, Argonne National Laboratory, Center for Advanced Radiation Sources, The University of Chicago, Chicago, IL 60439, USA
c Laboratoire de Physique des Geomateriaux, Institut de Physique du Globe, Paris 75252, France
Received 16 January 2004; received in revised form 6 May 2004; accepted 12 May 2004
Abstract
Using acoustic measurement interfaced with a large volume multi-anvil apparatus in conjunction with in situ X-radiationtechniques, we are able to measure the density and elastic wave velocities (VP andVS) for both ortho- and high-pressureclino-MgSiO3 polymorphs in the same experimental run. The elastic bulk and shear moduli of the unquenchable high-pressureclinoenstatite phase were measured within its stability field for the first time. The measured density contrast associated withthe phase transition OEN→ HP-CEN is 2.6–2.9% in the pressure of 7–9 GPa, and the corresponding velocity jumps are3–4% for P waves and 5–6% for S waves. The elastic moduli of the HP-CEN phase areKS=156.7(8) GPa,G = 98.5(4) GPaand their pressure derivatives areK′
S = 5.5(3) andG′ = 1.5(1) at a pressure of 6.5 GPa, room temperature. In addition,we observed anomalous elastic behavior in orthoenstatite at pressure above 9 GPa at room temperature. Both elastic wavevelocities exhibited softening between 9 and 13–14 GPa, which we suggest is associated with a transition to a metastablephase intermediate between OEN and HP-CEN.© 2004 Elsevier B.V. All rights reserved.
Keywords: Pyroxene; Elasticity; High pressure; Elastic softening; Unquenchable; Phase transformation
1. Introduction
Orthopyroxene is an important mineralogical con-stituent of petrological models of the Earth’s uppermantle. The reconstructive (or the first-order) phasetransformation in MgSiO3 enstatite at high pressurefrom orthorhombic (OEN, space groupPbca) to amonoclinic phase (HP-CEN, space groupC2/c) wouldoccur in the deeper portions of the upper mantle (e.g.,
∗ Corresponding author. Fax:+1-631-632-8140.E-mail address: [email protected] (J. Kung).
Pacalo and Gasparik, 1990; Kanzaki, 1991). The den-sity increase associated with this phase transition isestimated to be∼3% (Angel et al., 1992); those au-thors used Birch’s law relating velocities to densitiesto estimate an associated change in P wave velocityof ∼3% across this transition. Furthermore, the pres-sure range for this transition at the mantle tempera-ture coincides with the depths at which seismic studieshave revealed discontinuities, such as the Lehmann orX-discontinuities (see cross-hatched region ofFig. 1;and discussion inAngel et al., 1992; Woodland andAngel, 1997; Woodland, 1998).
0031-9201/$ – see front matter © 2004 Elsevier B.V. All rights reserved.doi:10.1016/j.pepi.2004.05.008
28 J. Kung et al. / Physics of the Earth and Planetary Interiors 147 (2004) 27–44
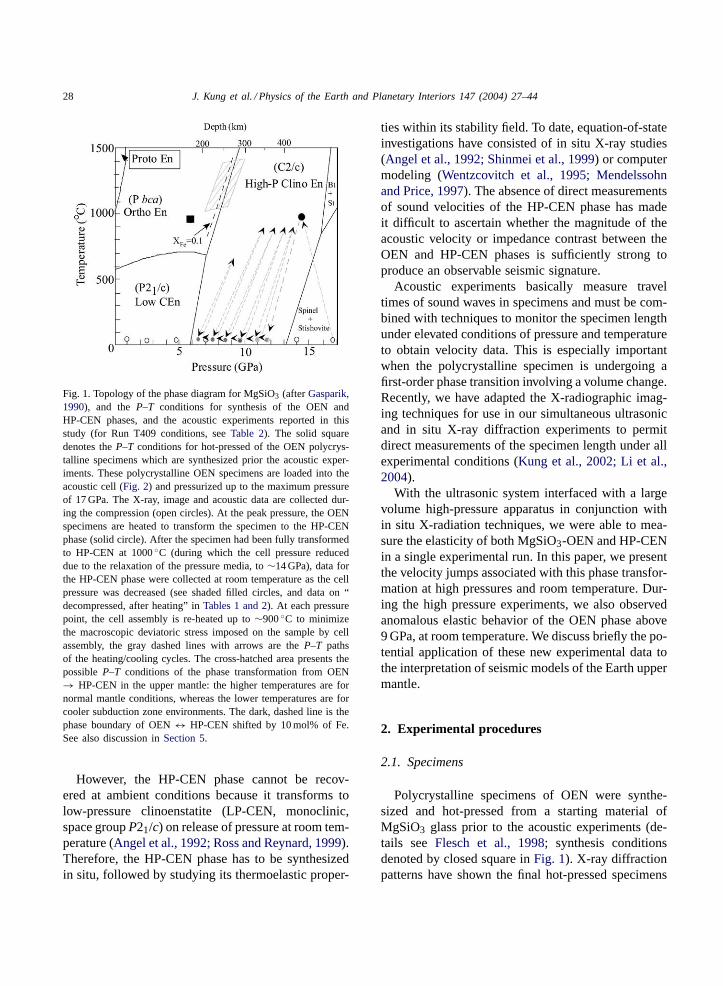
Fig. 1. Topology of the phase diagram for MgSiO3 (afterGasparik,1990), and the P–T conditions for synthesis of the OEN andHP-CEN phases, and the acoustic experiments reported in thisstudy (for Run T409 conditions, seeTable 2). The solid squaredenotes theP–T conditions for hot-pressed of the OEN polycrys-talline specimens which are synthesized prior the acoustic exper-iments. These polycrystalline OEN specimens are loaded into theacoustic cell (Fig. 2) and pressurized up to the maximum pressureof 17 GPa. The X-ray, image and acoustic data are collected dur-ing the compression (open circles). At the peak pressure, the OENspecimens are heated to transform the specimen to the HP-CENphase (solid circle). After the specimen had been fully transformedto HP-CEN at 1000◦C (during which the cell pressure reduceddue to the relaxation of the pressure media, to∼14 GPa), data forthe HP-CEN phase were collected at room temperature as the cellpressure was decreased (see shaded filled circles, and data on “decompressed, after heating” inTables 1 and 2). At each pressurepoint, the cell assembly is re-heated up to∼900◦C to minimizethe macroscopic deviatoric stress imposed on the sample by cellassembly, the gray dashed lines with arrows are theP–T pathsof the heating/cooling cycles. The cross-hatched area presents thepossibleP–T conditions of the phase transformation from OEN→ HP-CEN in the upper mantle: the higher temperatures are fornormal mantle conditions, whereas the lower temperatures are forcooler subduction zone environments. The dark, dashed line is thephase boundary of OEN↔ HP-CEN shifted by 10 mol% of Fe.See also discussion inSection 5.
However, the HP-CEN phase cannot be recov-ered at ambient conditions because it transforms tolow-pressure clinoenstatite (LP-CEN, monoclinic,space groupP21/c) on release of pressure at room tem-perature (Angel et al., 1992; Ross and Reynard, 1999).Therefore, the HP-CEN phase has to be synthesizedin situ, followed by studying its thermoelastic proper-
ties within its stability field. To date, equation-of-stateinvestigations have consisted of in situ X-ray studies(Angel et al., 1992; Shinmei et al., 1999) or computermodeling (Wentzcovitch et al., 1995; Mendelssohnand Price, 1997). The absence of direct measurementsof sound velocities of the HP-CEN phase has madeit difficult to ascertain whether the magnitude of theacoustic velocity or impedance contrast between theOEN and HP-CEN phases is sufficiently strong toproduce an observable seismic signature.
Acoustic experiments basically measure traveltimes of sound waves in specimens and must be com-bined with techniques to monitor the specimen lengthunder elevated conditions of pressure and temperatureto obtain velocity data. This is especially importantwhen the polycrystalline specimen is undergoing afirst-order phase transition involving a volume change.Recently, we have adapted the X-radiographic imag-ing techniques for use in our simultaneous ultrasonicand in situ X-ray diffraction experiments to permitdirect measurements of the specimen length under allexperimental conditions (Kung et al., 2002; Li et al.,2004).
With the ultrasonic system interfaced with a largevolume high-pressure apparatus in conjunction within situ X-radiation techniques, we were able to mea-sure the elasticity of both MgSiO3-OEN and HP-CENin a single experimental run. In this paper, we presentthe velocity jumps associated with this phase transfor-mation at high pressures and room temperature. Dur-ing the high pressure experiments, we also observedanomalous elastic behavior of the OEN phase above9 GPa, at room temperature. We discuss briefly the po-tential application of these new experimental data tothe interpretation of seismic models of the Earth uppermantle.
2. Experimental procedures
2.1. Specimens
Polycrystalline specimens of OEN were synthe-sized and hot-pressed from a starting material ofMgSiO3 glass prior to the acoustic experiments (de-tails seeFlesch et al., 1998; synthesis conditionsdenoted by closed square inFig. 1). X-ray diffractionpatterns have shown the final hot-pressed specimens
J. Kung et al. / Physics of the Earth and Planetary Interiors 147 (2004) 27–44 29
to be orthoenstatite (Fig. 6a). The density of poly-crystalline specimens was∼3.18 g cm−3 (99.3% ofthe single-crystal X-ray density of 3.20 g cm−3). Thesound velocities of specimens at ambient conditionswere determined to be 8.00(5) km s−1 for P wavesand 4.83(1) km s−1 for S waves; these values arewithin 1% of the isotropic velocities derived fromthe single-crystal data ofWeidner et al. (1978)andJackson et al. (1999).
Due to its unquenchable nature, HP-CEN wassynthesized in situ at high pressure and tempera-ture during the acoustic measurements. We used thewell-sintered OEN specimen from the prior experi-ment (described above) as the starting material. TheOEN specimen was loaded in the acoustic cell as-sembly (Fig. 2); after compression to 17 GPa at roomtemperature (Fig. 1, open circles), the cell was heatedup to ∼1000◦C at 13 GPa for 2 h to transform intoHP-CEN phase (Fig. 1, closed circle).
2.2. Ultrasonics
Two-way travel times of ultrasonic waves throughthe specimens were determined using a transfer func-tion (TF) method that has recently been developed inour laboratory (see details inLi et al., 2002, 2004).With this new system, the travel times can be mea-sured using either the pulse echo overlap (PEO) orphase comparison method.Li et al. (2002, 2004)have demonstrated that the travel times deduced fromboth methods are comparable; in this study the PEOmethod was employed. In our experiments, dual-modeLiNbO3 transducers (10◦ rotated Y-cut) were usedto generate and receive the ultrasonic signals; thesetransducers generate both longitudinal and transverseacoustic signals with unspecified polarization of thetransverse signal (see details inKung et al., 2002;Sinelnikov et al., 2004).
The ultrasonic measurements at high pressure wereperformed using a 1000-ton, Kawai type multi-anvilapparatus with a T-cup module (now named the T-25apparatus; for details, seeUchida et al., 2002)in con-junction with in situ X-radiation techniques at the13ID beamline at the Advanced Photon Source of theArgonne National Laboratory. The octahedral ultra-sonic cell assembly (Fig. 2) was modified from thatused byLi et al. (1998); a cylindrical graphite fur-nace with end disk was inserted into an octahedron
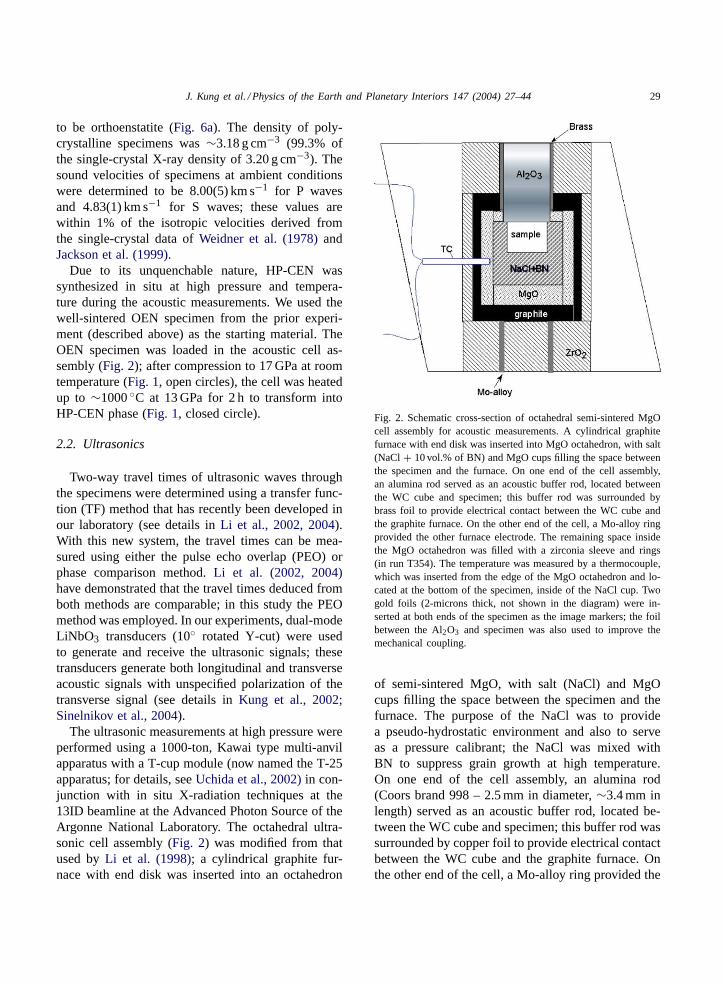
Fig. 2. Schematic cross-section of octahedral semi-sintered MgOcell assembly for acoustic measurements. A cylindrical graphitefurnace with end disk was inserted into MgO octahedron, with salt(NaCl + 10 vol.% of BN) and MgO cups filling the space betweenthe specimen and the furnace. On one end of the cell assembly,an alumina rod served as an acoustic buffer rod, located betweenthe WC cube and specimen; this buffer rod was surrounded bybrass foil to provide electrical contact between the WC cube andthe graphite furnace. On the other end of the cell, a Mo-alloy ringprovided the other furnace electrode. The remaining space insidethe MgO octahedron was filled with a zirconia sleeve and rings(in run T354). The temperature was measured by a thermocouple,which was inserted from the edge of the MgO octahedron and lo-cated at the bottom of the specimen, inside of the NaCl cup. Twogold foils (2-microns thick, not shown in the diagram) were in-serted at both ends of the specimen as the image markers; the foilbetween the Al2O3 and specimen was also used to improve themechanical coupling.
of semi-sintered MgO, with salt (NaCl) and MgOcups filling the space between the specimen and thefurnace. The purpose of the NaCl was to providea pseudo-hydrostatic environment and also to serveas a pressure calibrant; the NaCl was mixed withBN to suppress grain growth at high temperature.On one end of the cell assembly, an alumina rod(Coors brand 998 – 2.5 mm in diameter,∼3.4 mm inlength) served as an acoustic buffer rod, located be-tween the WC cube and specimen; this buffer rod wassurrounded by copper foil to provide electrical contactbetween the WC cube and the graphite furnace. Onthe other end of the cell, a Mo-alloy ring provided the
30 J. Kung et al. / Physics of the Earth and Planetary Interiors 147 (2004) 27–44
other furnace electrode. The remaining space insidethe MgO octahedron was filled with zirconia sleeveand rings. The temperature was measured by a thermo-couple (W3%Re/W25%Re), which was inserted fromthe edge of the MgO octahedron and located at thebottom of the specimen, inside of the NaCl cup. Thespecimen lengths used in this study were∼1 mm.
2.3. X-ray diffraction
The energy-dispersive X-ray method was employedusing white radiation to collect diffraction spectra forboth the NaCl as the pressure marker (collecting atthe position behind the specimen) and the MgSiO3specimen (including OEN, HP-CEN and LP-CENphases). The determination of unit cell parameters ofthe specimen was refined using the program packageGSAS (general structure analysis system,Larson andVon Dreele, 1988). The entire diffraction pattern wasused to refine simultaneously for both specimen andNaCl (contributed from the surrounding sleeve, seeFig. 2). As starting models for refinements in theRietveld mode at different pressure conditions, weused the structural data ofGhose et al. (1986)forthe OEN phase (Fig. 6a, ambient conditions before
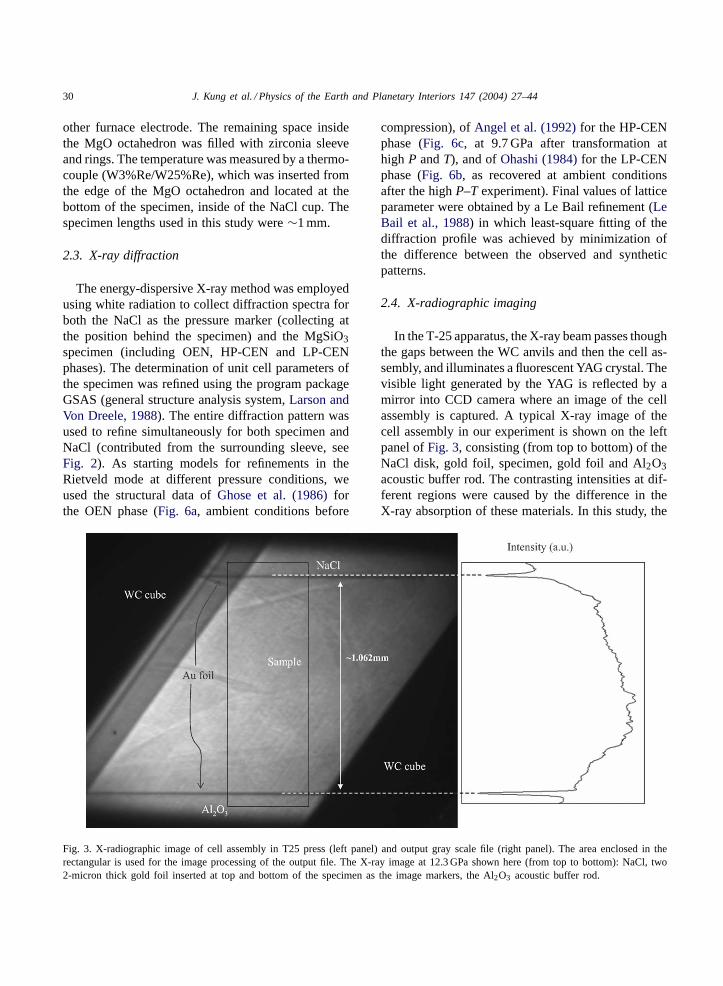
Fig. 3. X-radiographic image of cell assembly in T25 press (left panel) and output gray scale file (right panel). The area enclosed in therectangular is used for the image processing of the output file. The X-ray image at 12.3 GPa shown here (from top to bottom): NaCl, two2-micron thick gold foil inserted at top and bottom of the specimen as the image markers, the Al2O3 acoustic buffer rod.
compression), ofAngel et al. (1992)for the HP-CENphase (Fig. 6c, at 9.7 GPa after transformation athigh P andT), and ofOhashi (1984)for the LP-CENphase (Fig. 6b, as recovered at ambient conditionsafter the highP–T experiment). Final values of latticeparameter were obtained by a Le Bail refinement (LeBail et al., 1988) in which least-square fitting of thediffraction profile was achieved by minimization ofthe difference between the observed and syntheticpatterns.
2.4. X-radiographic imaging
In the T-25 apparatus, the X-ray beam passes thoughthe gaps between the WC anvils and then the cell as-sembly, and illuminates a fluorescent YAG crystal. Thevisible light generated by the YAG is reflected by amirror into CCD camera where an image of the cellassembly is captured. A typical X-ray image of thecell assembly in our experiment is shown on the leftpanel ofFig. 3, consisting (from top to bottom) of theNaCl disk, gold foil, specimen, gold foil and Al2O3acoustic buffer rod. The contrasting intensities at dif-ferent regions were caused by the difference in theX-ray absorption of these materials. In this study, the
J. Kung et al. / Physics of the Earth and Planetary Interiors 147 (2004) 27–44 31
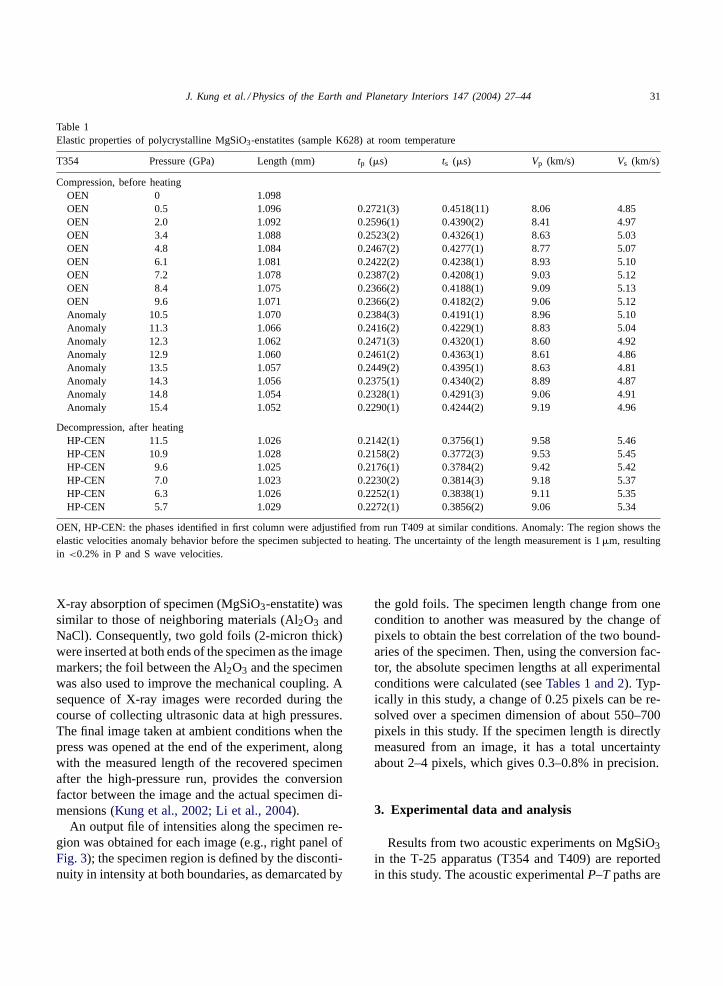
Table 1Elastic properties of polycrystalline MgSiO3-enstatites (sample K628) at room temperature
T354 Pressure (GPa) Length (mm) tp (�s) ts (�s) Vp (km/s) Vs (km/s)
Compression, before heatingOEN 0 1.098OEN 0.5 1.096 0.2721(3) 0.4518(11) 8.06 4.85OEN 2.0 1.092 0.2596(1) 0.4390(2) 8.41 4.97OEN 3.4 1.088 0.2523(2) 0.4326(1) 8.63 5.03OEN 4.8 1.084 0.2467(2) 0.4277(1) 8.77 5.07OEN 6.1 1.081 0.2422(2) 0.4238(1) 8.93 5.10OEN 7.2 1.078 0.2387(2) 0.4208(1) 9.03 5.12OEN 8.4 1.075 0.2366(2) 0.4188(1) 9.09 5.13OEN 9.6 1.071 0.2366(2) 0.4182(2) 9.06 5.12Anomaly 10.5 1.070 0.2384(3) 0.4191(1) 8.96 5.10Anomaly 11.3 1.066 0.2416(2) 0.4229(1) 8.83 5.04Anomaly 12.3 1.062 0.2471(3) 0.4320(1) 8.60 4.92Anomaly 12.9 1.060 0.2461(2) 0.4363(1) 8.61 4.86Anomaly 13.5 1.057 0.2449(2) 0.4395(1) 8.63 4.81Anomaly 14.3 1.056 0.2375(1) 0.4340(2) 8.89 4.87Anomaly 14.8 1.054 0.2328(1) 0.4291(3) 9.06 4.91Anomaly 15.4 1.052 0.2290(1) 0.4244(2) 9.19 4.96
Decompression, after heatingHP-CEN 11.5 1.026 0.2142(1) 0.3756(1) 9.58 5.46HP-CEN 10.9 1.028 0.2158(2) 0.3772(3) 9.53 5.45HP-CEN 9.6 1.025 0.2176(1) 0.3784(2) 9.42 5.42HP-CEN 7.0 1.023 0.2230(2) 0.3814(3) 9.18 5.37HP-CEN 6.3 1.026 0.2252(1) 0.3838(1) 9.11 5.35HP-CEN 5.7 1.029 0.2272(1) 0.3856(2) 9.06 5.34
OEN, HP-CEN: the phases identified in first column were adjustified from run T409 at similar conditions. Anomaly: The region shows theelastic velocities anomaly behavior before the specimen subjected to heating. The uncertainty of the length measurement is 1�m, resultingin <0.2% in P and S wave velocities.
X-ray absorption of specimen (MgSiO3-enstatite) wassimilar to those of neighboring materials (Al2O3 andNaCl). Consequently, two gold foils (2-micron thick)were inserted at both ends of the specimen as the imagemarkers; the foil between the Al2O3 and the specimenwas also used to improve the mechanical coupling. Asequence of X-ray images were recorded during thecourse of collecting ultrasonic data at high pressures.The final image taken at ambient conditions when thepress was opened at the end of the experiment, alongwith the measured length of the recovered specimenafter the high-pressure run, provides the conversionfactor between the image and the actual specimen di-mensions (Kung et al., 2002; Li et al., 2004).
An output file of intensities along the specimen re-gion was obtained for each image (e.g., right panel ofFig. 3); the specimen region is defined by the disconti-nuity in intensity at both boundaries, as demarcated by
the gold foils. The specimen length change from onecondition to another was measured by the change ofpixels to obtain the best correlation of the two bound-aries of the specimen. Then, using the conversion fac-tor, the absolute specimen lengths at all experimentalconditions were calculated (seeTables 1 and 2). Typ-ically in this study, a change of 0.25 pixels can be re-solved over a specimen dimension of about 550–700pixels in this study. If the specimen length is directlymeasured from an image, it has a total uncertaintyabout 2–4 pixels, which gives 0.3–0.8% in precision.
3. Experimental data and analysis
Results from two acoustic experiments on MgSiO3in the T-25 apparatus (T354 and T409) are reportedin this study. The acoustic experimentalP–T paths are

32 J. Kung et al. / Physics of the Earth and Planetary Interiors 147 (2004) 27–44
Table 2Elasticity properties of polycrystalline MgSiO3-enstatites (K682) at room temperature
T409 Pressure(GPa)
Length(mm)
tp (�s) ts (�s) Vp (km/s) Vs (km/s) KS (GPa) G (GPa) Volume (Å3)
Compression, before heatingOEN 0 1.093 832.918(114)OEN 1.0 1.091 0.2663(3) 0.4448(9) 8.19 4.91 114 77 824.404(99)OEN 2.7 1.084 0.2560(3) 0.4369(5) 8.47 4.96 129 80 812.239(90)OEN 4.7 1.077 0.2471(3) 0.4291(6) 8.72 5.02 142 83 802.680(100)OEN 7.0 1.071 0.2398(3) 0.4225(4) 8.93 5.07 156 85 788.469(107)OEN 9.6 1.064 0.2341(3) 0.4171(3) 9.09 5.10 167 88 774.543(93)Anomaly 11.8 1.057 0.2365(3) 0.4191(4) 8.94 5.04 – – Not extractedAnomaly 14.0 1.049 0.2341(5) 0.4254(3) 8.96 4.93 – – Not extractedAnomaly 16.8 1.041 0.2239(3) 0.4165(3) 9.30 5.00 – – Not extracted
Decompression, after heatingHP-CEN 11.7 1.039 0.2176(1) 0.3820(5) 9.55 5.44 186 106 373.032(50)HP-CEN 11.0 1.042 0.2198(4) 0.3840(1) 9.48 5.43 180 105 374.896(75)HP-CEN 9.7 1.045 0.2218(2) 0.3864(1) 9.42 5.41 176 103 377.346(52)HP-CEN 8.5 1.039 0.2238(4) 0.3858(10) 9.29 5.39 168 102 380.114(103)HP-CEN 7.6 1.030 0.2234(8) 0.3852(5) 9.22 5.35 163 100 382.317(57)HP-CEN 6.5 1.021 0.2242(2) 0.3832(5) 9.11 5.33 156 98 385.626(62)LP-CEN 0 1.098 – – – – – – 416.719(65)
OEN, HP-CE, LP-CEN: The first column shows the phase identified from X-ray diffraction patterns at different pressure condition. Due topoor-mechanical contact in the cell assembly at open press after high pressure run, there was no acoustic data available for LP-CEN phase.Anomaly: The region shows the elastic velocities anomaly behavior before the specimen subjected the heating, where the cell volumesof specimen were not extracted.�V is the fitting uncertainty obtained from the GSAS, not the experimental uncertainty. The estimateduncertainties in length and velocities are the same as those inTable 1. The uncertainties ofK and G are ∼1 and 0.5%, assuming 0.1%uncertainty in density.
shown inFig. 1. X-ray diffraction patterns of NaCland specimen, and the travel times and length imagesof specimen were collected at high pressures, bothbefore and after the OEN specimen transformed tothe HP-CEN phase. The data were collected for thestarting OEN phase while the pressure was increasingat room temperature to the maximum pressure of∼17 GPa (see open circles inFig. 1, data on “Com-pression, before heating” inTables 1 and 2). Atthe peak pressures, the cell assembly was heated totransform the specimen to HP-CEN phase. After thespecimen had been fully transformed to HP-CEN at1000◦C (during which the cell pressure reduced dueto the relaxation of the pressure media, to∼14 GPa inFig. 1), data for the HP-CEN phase were collected atroom temperature as the cell pressure was decreased(see shaded filled circles inFig. 1, data on “ Decom-pression, after heating” inTables 1 and 2). Followingeach reduction of pressure during the decompressioncycle, the cell assembly was re-heated to∼900◦Cto minimize the deviatoric stress imposed on the
specimen by the cell assembly. Data collection forthe HP-CEN phase was terminated at∼6 GPa, belowwhich pressure the HP-CEN is known to transformto the LP-CEN phase (Angel et al., 1992; Ross andReynard, 1999).
3.1. Travel time data
Before the OEN specimen was heated up and trans-formed to the HP-CEN phase, the travel times in OENfrom both runs (T354 and T409) systematically de-creased as a function of increasing pressure up to∼9 GPa (see solid circles inFig. 4, alsoTables 1 and 2,travel times denoted as “OEN”). Above this pressure,however, both the P and S wave travel times began toincrease as pressure was increased to∼13 GPa, afterwhich they decreased again (e.g., the P wave traveltime data from run T354 shown by the gray circles inFig. 4, travel times collected in this pressure range aredenoted as “anomaly” inTables 1 and 2). After thespecimen was transformed to the HP-CEN phase, the
J. Kung et al. / Physics of the Earth and Planetary Interiors 147 (2004) 27–44 33
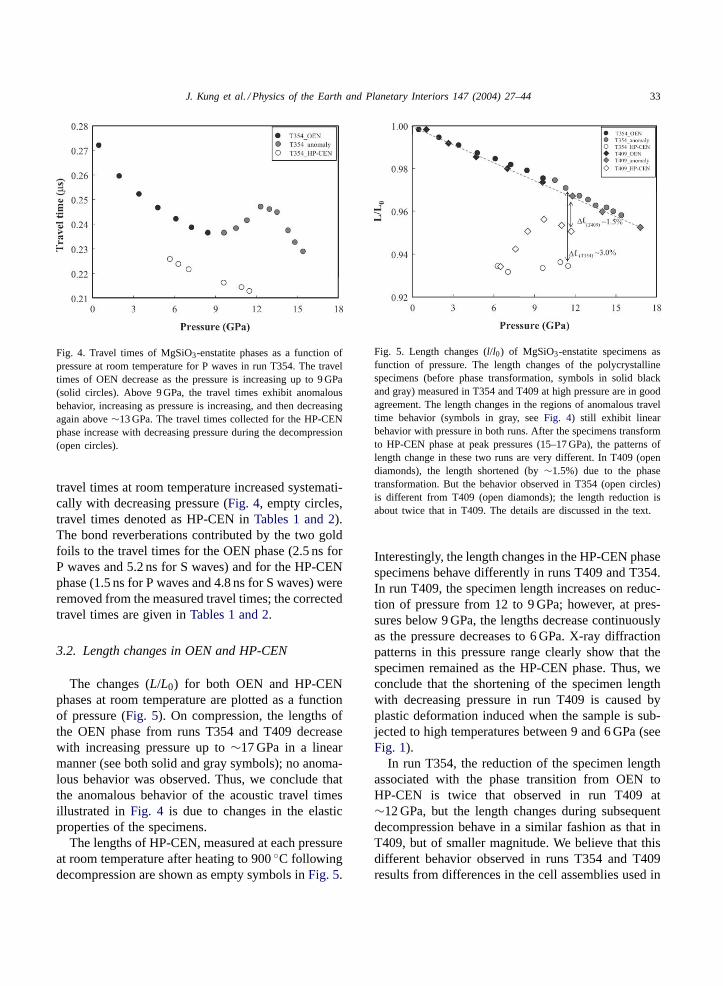
Fig. 4. Travel times of MgSiO3-enstatite phases as a function ofpressure at room temperature for P waves in run T354. The traveltimes of OEN decrease as the pressure is increasing up to 9 GPa(solid circles). Above 9 GPa, the travel times exhibit anomalousbehavior, increasing as pressure is increasing, and then decreasingagain above∼13 GPa. The travel times collected for the HP-CENphase increase with decreasing pressure during the decompression(open circles).
travel times at room temperature increased systemati-cally with decreasing pressure (Fig. 4, empty circles,travel times denoted as HP-CEN inTables 1 and 2).The bond reverberations contributed by the two goldfoils to the travel times for the OEN phase (2.5 ns forP waves and 5.2 ns for S waves) and for the HP-CENphase (1.5 ns for P waves and 4.8 ns for S waves) wereremoved from the measured travel times; the correctedtravel times are given inTables 1 and 2.
3.2. Length changes in OEN and HP-CEN
The changes (L/L0) for both OEN and HP-CENphases at room temperature are plotted as a functionof pressure (Fig. 5). On compression, the lengths ofthe OEN phase from runs T354 and T409 decreasewith increasing pressure up to∼17 GPa in a linearmanner (see both solid and gray symbols); no anoma-lous behavior was observed. Thus, we conclude thatthe anomalous behavior of the acoustic travel timesillustrated inFig. 4 is due to changes in the elasticproperties of the specimens.
The lengths of HP-CEN, measured at each pressureat room temperature after heating to 900◦C followingdecompression are shown as empty symbols inFig. 5.
Fig. 5. Length changes (l/l0) of MgSiO3-enstatite specimens asfunction of pressure. The length changes of the polycrystallinespecimens (before phase transformation, symbols in solid blackand gray) measured in T354 and T409 at high pressure are in goodagreement. The length changes in the regions of anomalous traveltime behavior (symbols in gray, seeFig. 4) still exhibit linearbehavior with pressure in both runs. After the specimens transformto HP-CEN phase at peak pressures (15–17 GPa), the patterns oflength change in these two runs are very different. In T409 (opendiamonds), the length shortened (by∼1.5%) due to the phasetransformation. But the behavior observed in T354 (open circles)is different from T409 (open diamonds); the length reduction isabout twice that in T409. The details are discussed in the text.
Interestingly, the length changes in the HP-CEN phasespecimens behave differently in runs T409 and T354.In run T409, the specimen length increases on reduc-tion of pressure from 12 to 9 GPa; however, at pres-sures below 9 GPa, the lengths decrease continuouslyas the pressure decreases to 6 GPa. X-ray diffractionpatterns in this pressure range clearly show that thespecimen remained as the HP-CEN phase. Thus, weconclude that the shortening of the specimen lengthwith decreasing pressure in run T409 is caused byplastic deformation induced when the sample is sub-jected to high temperatures between 9 and 6 GPa (seeFig. 1).
In run T354, the reduction of the specimen lengthassociated with the phase transition from OEN toHP-CEN is twice that observed in run T409 at∼12 GPa, but the length changes during subsequentdecompression behave in a similar fashion as that inT409, but of smaller magnitude. We believe that thisdifferent behavior observed in runs T354 and T409results from differences in the cell assemblies used in

34 J. Kung et al. / Physics of the Earth and Planetary Interiors 147 (2004) 27–44
these two runs. The ZrO2 sleeve, inserted as a ther-mal insulator in run T354, was replaced by an MgOsleeve in run T409 in order to improve the trans-parence for X-ray. Differences in the thermoelasticand mechanical properties of these sleeves result inchanges of the stress state on the sample at high pres-sure and temperature, which produces the differentlength change behavior observed above. However, thediffering behavior observed in specimen lengths forthe HP-CEN phases in runs T354 and T409 does notaffect the measured wave velocities (seeFig. 8 anddiscussion below).
3.3. X-ray diffraction data
In both runs, the measured cell parameters ofNaCl were used to determine the cell pressures usingDecker’s (1971)equation of state; we estimate theprecision of these cell pressures given inTables 1and 2to be∼0.1 GPa. X-ray diffraction patterns werealso recorded for the MgSiO3 specimens in runs T354and T409 at all experimental conditions. For runT354, the intensity of X-ray diffraction patterns forthe specimen was too weak to analyze because of thesmall entry slit size used and the contamination andstrong absorption from the ZrO2 thermal insulatorsurrounding the specimen.
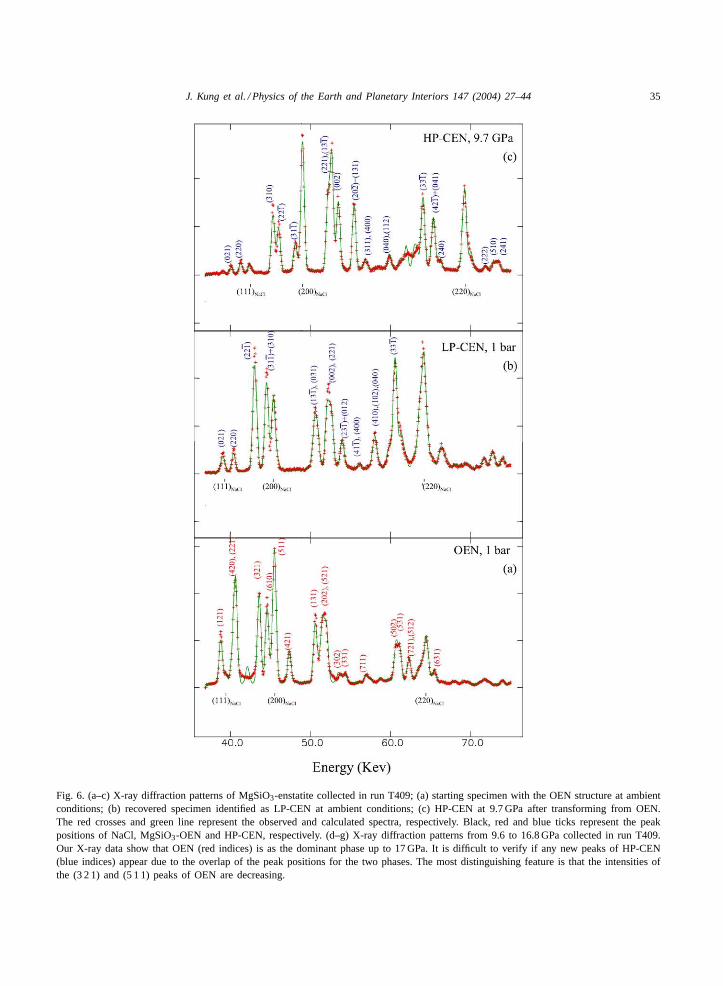
For run T409, the X-ray patterns were collected oncompression to 16.7 GPa, and after the phase trans-formation (i.e. on heating, specimens transformaed toHP-CEN) on decompression from 11.7 to 6.5 GPa, aswell as at ambient conditions before and after exper-iment (Fig. 6a–g). For both OEN (the starting phase,Fig. 6a) and low clinoenstatite (the final recoveredphase,Fig. 6b) phases, data collected at ambient con-ditions yielded cell volumes of 832.9 Å3 and 416.2 Å3,respectively; in excellent agreement with publishedsingle-crystal data (832.76 Å3 for OEN, Ghose et al.,1986, and 415.5 Å3 for LP-CEN,Ohashi, 1984). Fromthis comparison, we are confident that the energy dis-persive diffraction patterns obtained using the cell as-sembly in T409 provide reliable equations of state datafor both the OEN and HP-CEN phases at our exper-imental conditions. The cell volumes of OEN (below10 GPa) and HP-CEN from run T409 are tabulatedin Table 2, and were used to calculate the densitiesof OEN and HP-CEN at high pressures (Fig. 7). InFig. 6d–g, we show the X-ray diffraction patterns of
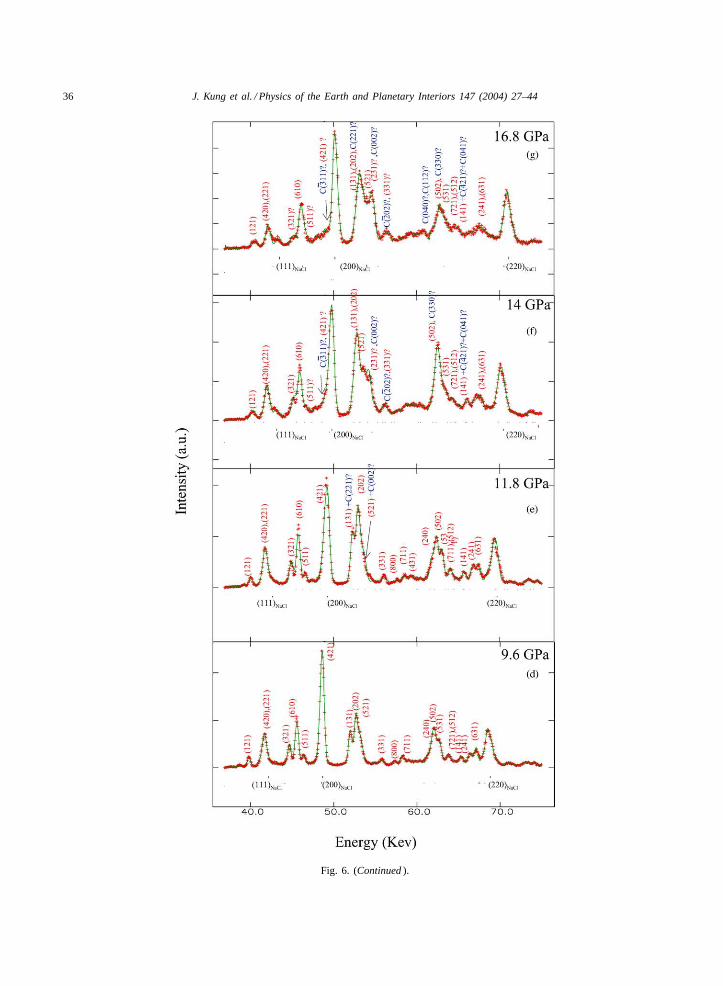
the OEN phase from run T409 in the pressure rangefrom 9.6 to 16.8 GPa, the region in which the traveltime data exhibited anomalous behavior (as shown inFig. 4). Due to the complexity of X-ray diffractionpatterns and observation of anomalous elastic behav-ior above 10 GPa to peak pressure before heating andtransforming to HP-CEN (i.e. symbols in solid andgray in Fig. 8 and denoted as “anomaly” inTables 1and 2), we did not attempt to extract cell volumes forthe polycrystalline specimen in this pressure range.
In previous experiments (e.g.,Hugh-Jones andAngel, 1994; Angel and Jackson, 2002)single-crystalsof the OEN phases were compressed to∼8.5 GPa atroom temperature with no indication of phase transi-tion. The high pressure Raman studies (above 20 GPa,Chopelas, 1999; Serghiou et al., 2000; Lin, 2003)suggested a new phase appearing in a similar pres-sure range where we observed the anomalous elasticbehavior; these authors suggested that the new phasemight be HP-CEN. We have tried to evaluate whetherthe HP-CEN phase has begun to appear above 10 GPaat room temperature. However, many of the peak po-sitions of HP-CEN overlap with those of OEN; it istherefore difficult to ascertain whether any new peaksof HP-CEN are appearing. On the other hand, theX-ray patterns collected at 9.6 and 11.8 GPa (Fig. 6dand e) indicated that the specimen retains a strong sig-nature of OEN, at pressures where the travel time datastarted exhibiting the anomalous behavior. The mostdistinguishing feature in the X-ray diffraction patternsis the diminishing intensities of the OEN (3 2 1) and(5 1 1) peaks collected above 14 GPa; neither peak isobserved in the diffraction pattern at the peak pressureof ∼17 GPa (Fig. 6f and g). On the basis of the crystalstructure relationships, these peaks (3 2 1) and (5 1 1)of OEN should vanish if the specimen transformed tomonoclinic symmetry (eitherC2/c or P21/c, for exam-ple, Fig. 6b and c). By contrast, the neighboring peak(6 1 0) of OEN, which corresponds to the (3 1 0) ofthe HP-CEN, should persist as shown inFig. 6g. Theexisting X-ray diffraction data cannot give a definitiveindication if the OEN phase began to transform to theHP-CEN phase at∼17 GPa, room temperature.
Previous studies have shown that the HP-CEN phase(C2/c) would be transformed to LP-CEN (P21/c) onreleased of pressure at room temperature condition(Angel et al., 1992; Ross and Reynard, 1999); this re-version was also observed in our experiment (Fig. 6b
J. Kung et al. / Physics of the Earth and Planetary Interiors 147 (2004) 27–44 35
Fig. 6. (a–c) X-ray diffraction patterns of MgSiO3-enstatite collected in run T409; (a) starting specimen with the OEN structure at ambientconditions; (b) recovered specimen identified as LP-CEN at ambient conditions; (c) HP-CEN at 9.7 GPa after transforming from OEN.The red crosses and green line represent the observed and calculated spectra, respectively. Black, red and blue ticks represent the peakpositions of NaCl, MgSiO3-OEN and HP-CEN, respectively. (d–g) X-ray diffraction patterns from 9.6 to 16.8 GPa collected in run T409.Our X-ray data show that OEN (red indices) is as the dominant phase up to 17 GPa. It is difficult to verify if any new peaks of HP-CEN(blue indices) appear due to the overlap of the peak positions for the two phases. The most distinguishing feature is that the intensities ofthe (3 2 1) and (5 1 1) peaks of OEN are decreasing.
36 J. Kung et al. / Physics of the Earth and Planetary Interiors 147 (2004) 27–44
Fig. 6. (Continued ).
J. Kung et al. / Physics of the Earth and Planetary Interiors 147 (2004) 27–44 37
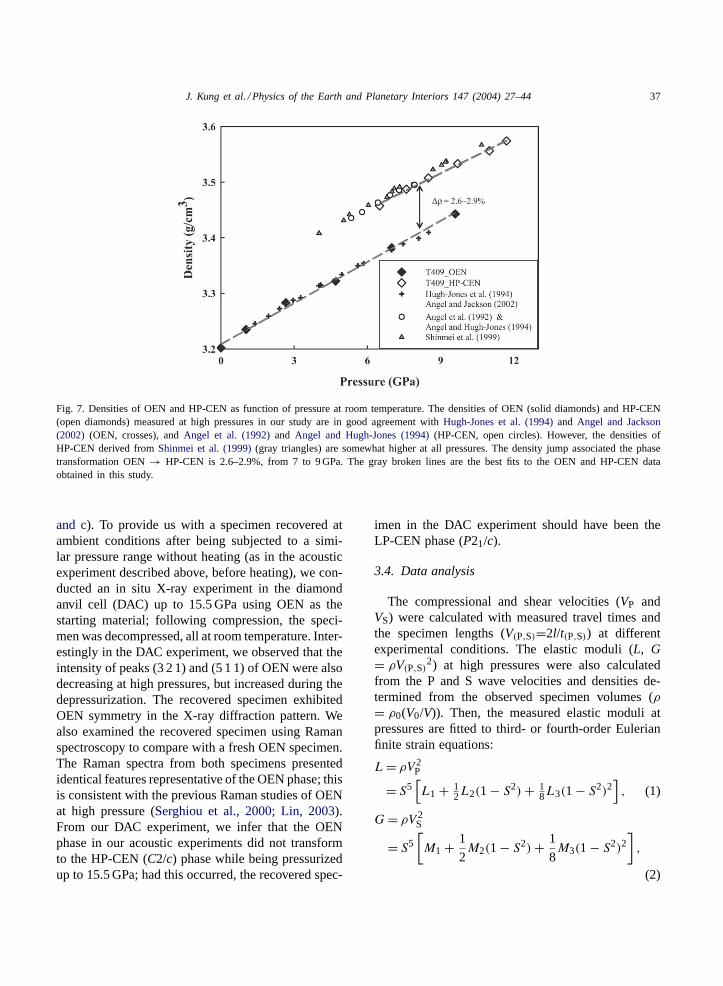
Fig. 7. Densities of OEN and HP-CEN as function of pressure at room temperature. The densities of OEN (solid diamonds) and HP-CEN(open diamonds) measured at high pressures in our study are in good agreement withHugh-Jones et al. (1994)and Angel and Jackson(2002) (OEN, crosses), andAngel et al. (1992)and Angel and Hugh-Jones (1994)(HP-CEN, open circles). However, the densities ofHP-CEN derived fromShinmei et al. (1999)(gray triangles) are somewhat higher at all pressures. The density jump associated the phasetransformation OEN→ HP-CEN is 2.6–2.9%, from 7 to 9 GPa. The gray broken lines are the best fits to the OEN and HP-CEN dataobtained in this study.
and c). To provide us with a specimen recovered atambient conditions after being subjected to a simi-lar pressure range without heating (as in the acousticexperiment described above, before heating), we con-ducted an in situ X-ray experiment in the diamondanvil cell (DAC) up to 15.5 GPa using OEN as thestarting material; following compression, the speci-men was decompressed, all at room temperature. Inter-estingly in the DAC experiment, we observed that theintensity of peaks (3 2 1) and (5 1 1) of OEN were alsodecreasing at high pressures, but increased during thedepressurization. The recovered specimen exhibitedOEN symmetry in the X-ray diffraction pattern. Wealso examined the recovered specimen using Ramanspectroscopy to compare with a fresh OEN specimen.The Raman spectra from both specimens presentedidentical features representative of the OEN phase; thisis consistent with the previous Raman studies of OENat high pressure (Serghiou et al., 2000; Lin, 2003).From our DAC experiment, we infer that the OENphase in our acoustic experiments did not transformto the HP-CEN (C2/c) phase while being pressurizedup to 15.5 GPa; had this occurred, the recovered spec-
imen in the DAC experiment should have been theLP-CEN phase (P21/c).
3.4. Data analysis
The compressional and shear velocities (VP andVS) were calculated with measured travel times andthe specimen lengths (V(P,S)=2l/t(P,S)) at differentexperimental conditions. The elastic moduli (L, G= ρV(P,S)
2) at high pressures were also calculatedfrom the P and S wave velocities and densities de-termined from the observed specimen volumes (ρ
= ρ0(V0/V)). Then, the measured elastic moduli atpressures are fitted to third- or fourth-order Eulerianfinite strain equations:
L = ρV 2P
= S5[L1 + 1
2L2(1 − S2) + 18L3(1 − S2)2
], (1)
G = ρV 2S
= S5[M1 + 1
2M2(1 − S2) + 1
8M3(1 − S2)2
],
(2)
38 J. Kung et al. / Physics of the Earth and Planetary Interiors 147 (2004) 27–44
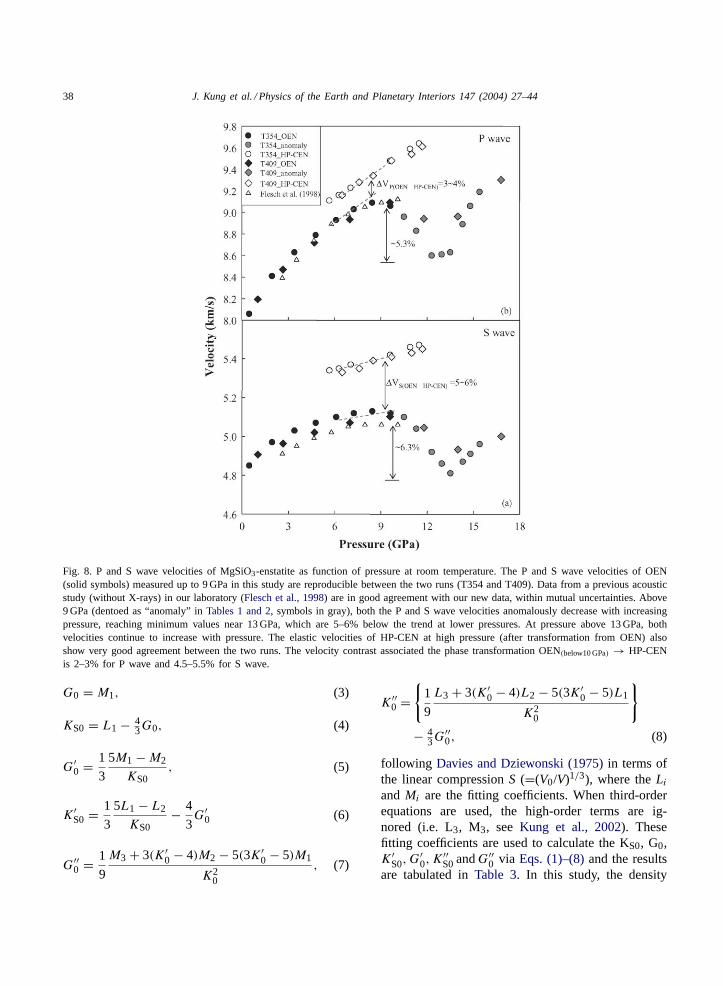
Fig. 8. P and S wave velocities of MgSiO3-enstatite as function of pressure at room temperature. The P and S wave velocities of OEN(solid symbols) measured up to 9 GPa in this study are reproducible between the two runs (T354 and T409). Data from a previous acousticstudy (without X-rays) in our laboratory (Flesch et al., 1998) are in good agreement with our new data, within mutual uncertainties. Above9 GPa (dentoed as “anomaly” inTables 1 and 2, symbols in gray), both the P and S wave velocities anomalously decrease with increasingpressure, reaching minimum values near 13 GPa, which are 5–6% below the trend at lower pressures. At pressure above 13 GPa, bothvelocities continue to increase with pressure. The elastic velocities of HP-CEN at high pressure (after transformation from OEN) alsoshow very good agreement between the two runs. The velocity contrast associated the phase transformation OEN(below10 GPa) → HP-CENis 2–3% for P wave and 4.5–5.5% for S wave.
G0 = M1, (3)
KS0 = L1 − 43G0, (4)
G′0 = 1
3
5M1 − M2
KS0, (5)
K′S0 = 1
3
5L1 − L2
KS0− 4
3G′
0 (6)
G′′0 = 1
9
M3 + 3(K′0 − 4)M2 − 5(3K′
0 − 5)M1
K20
, (7)
K′′0 =
{1
9
L3 + 3(K′0 − 4)L2 − 5(3K′
0 − 5)L1
K20
}
− 43G′′
0, (8)
following Davies and Dziewonski (1975)in terms ofthe linear compressionS (=(V0/V)1/3), where theLi
and Mi are the fitting coefficients. When third-orderequations are used, the high-order terms are ig-nored (i.e. L3, M3, seeKung et al., 2002). Thesefitting coefficients are used to calculate the KS0, G0,K′
S0, G′0, K
′′S0andG′′
0 via Eqs. (1)–(8)and the resultsare tabulated inTable 3. In this study, the density
J. Kung et al. / Physics of the Earth and Planetary Interiors 147 (2004) 27–44 39
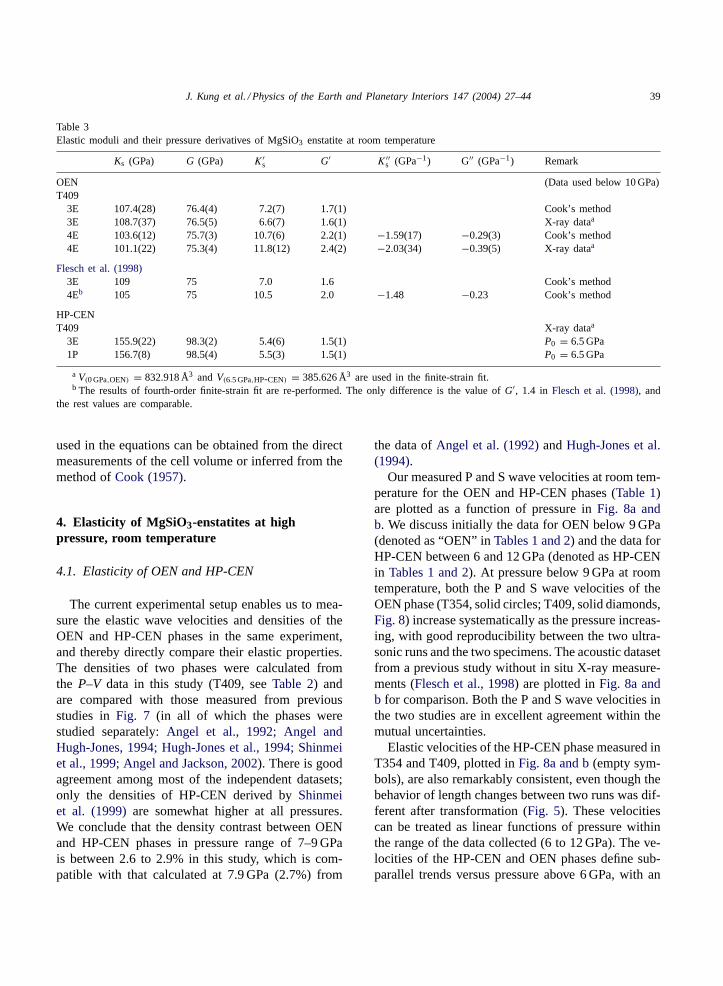
Table 3Elastic moduli and their pressure derivatives of MgSiO3 enstatite at room temperature
Ks (GPa) G (GPa) K′s G′ K′′
s (GPa−1) G′′ (GPa−1) Remark
OEN (Data used below 10 GPa)T409
3E 107.4(28) 76.4(4) 7.2(7) 1.7(1) Cook’s method3E 108.7(37) 76.5(5) 6.6(7) 1.6(1) X-ray dataa
4E 103.6(12) 75.7(3) 10.7(6) 2.2(1) −1.59(17) −0.29(3) Cook’s method4E 101.1(22) 75.3(4) 11.8(12) 2.4(2) −2.03(34) −0.39(5) X-ray dataa
Flesch et al. (1998)3E 109 75 7.0 1.6 Cook’s method4Eb 105 75 10.5 2.0 −1.48 −0.23 Cook’s method
HP-CENT409 X-ray dataa
3E 155.9(22) 98.3(2) 5.4(6) 1.5(1) P0 = 6.5 GPa1P 156.7(8) 98.5(4) 5.5(3) 1.5(1) P0 = 6.5 GPa
a V(0 GPa,OEN) = 832.918 Å3 and V(6.5 GPa,HP-CEN) = 385.626 Å3 are used in the finite-strain fit.b The results of fourth-order finite-strain fit are re-performed. The only difference is the value ofG′, 1.4 in Flesch et al. (1998), and
the rest values are comparable.
used in the equations can be obtained from the directmeasurements of the cell volume or inferred from themethod ofCook (1957).
4. Elasticity of MgSiO3-enstatites at highpressure, room temperature
4.1. Elasticity of OEN and HP-CEN
The current experimental setup enables us to mea-sure the elastic wave velocities and densities of theOEN and HP-CEN phases in the same experiment,and thereby directly compare their elastic properties.The densities of two phases were calculated fromthe P–V data in this study (T409, seeTable 2) andare compared with those measured from previousstudies inFig. 7 (in all of which the phases werestudied separately:Angel et al., 1992; Angel andHugh-Jones, 1994; Hugh-Jones et al., 1994; Shinmeiet al., 1999; Angel and Jackson, 2002). There is goodagreement among most of the independent datasets;only the densities of HP-CEN derived byShinmeiet al. (1999)are somewhat higher at all pressures.We conclude that the density contrast between OENand HP-CEN phases in pressure range of 7–9 GPais between 2.6 to 2.9% in this study, which is com-patible with that calculated at 7.9 GPa (2.7%) from
the data ofAngel et al. (1992)andHugh-Jones et al.(1994).
Our measured P and S wave velocities at room tem-perature for the OEN and HP-CEN phases (Table 1)are plotted as a function of pressure inFig. 8a andb. We discuss initially the data for OEN below 9 GPa(denoted as “OEN” inTables 1 and 2) and the data forHP-CEN between 6 and 12 GPa (denoted as HP-CENin Tables 1 and 2). At pressure below 9 GPa at roomtemperature, both the P and S wave velocities of theOEN phase (T354, solid circles; T409, solid diamonds,Fig. 8) increase systematically as the pressure increas-ing, with good reproducibility between the two ultra-sonic runs and the two specimens. The acoustic datasetfrom a previous study without in situ X-ray measure-ments (Flesch et al., 1998) are plotted inFig. 8a andb for comparison. Both the P and S wave velocities inthe two studies are in excellent agreement within themutual uncertainties.
Elastic velocities of the HP-CEN phase measured inT354 and T409, plotted inFig. 8a and b(empty sym-bols), are also remarkably consistent, even though thebehavior of length changes between two runs was dif-ferent after transformation (Fig. 5). These velocitiescan be treated as linear functions of pressure withinthe range of the data collected (6 to 12 GPa). The ve-locities of the HP-CEN and OEN phases define sub-parallel trends versus pressure above 6 GPa, with an
40 J. Kung et al. / Physics of the Earth and Planetary Interiors 147 (2004) 27–44
observed contrast of 3–4% for P waves and 5–6% forS waves.
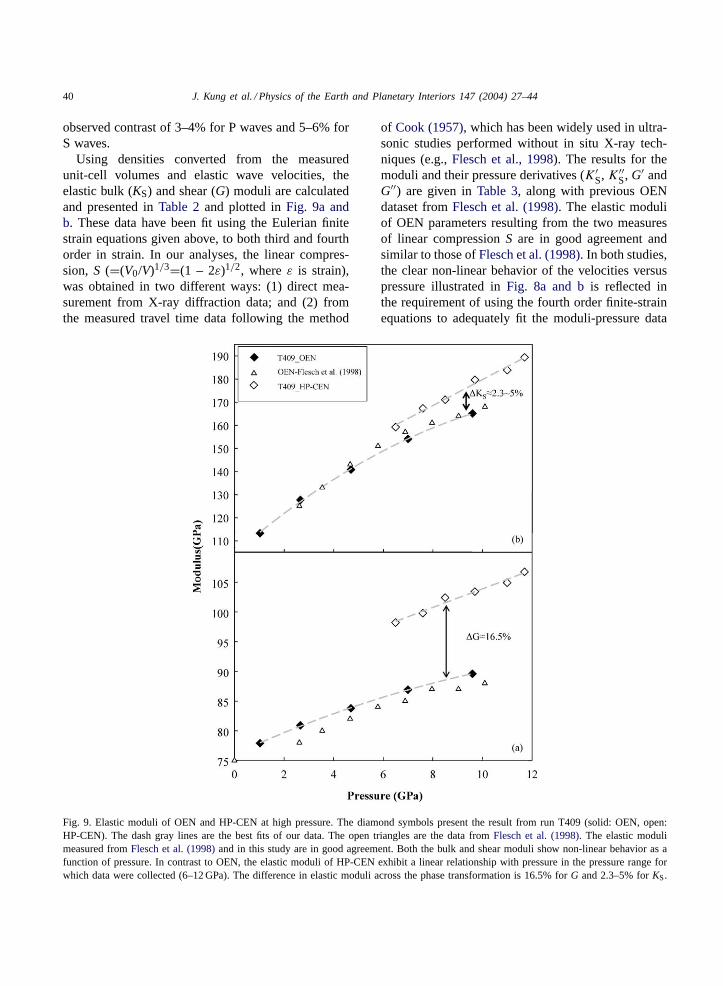
Using densities converted from the measuredunit-cell volumes and elastic wave velocities, theelastic bulk (KS) and shear (G) moduli are calculatedand presented inTable 2and plotted inFig. 9a andb. These data have been fit using the Eulerian finitestrain equations given above, to both third and fourthorder in strain. In our analyses, the linear compres-sion, S (=(V0/V)1/3=(1 – 2ε)1/2, whereε is strain),was obtained in two different ways: (1) direct mea-surement from X-ray diffraction data; and (2) fromthe measured travel time data following the method
Fig. 9. Elastic moduli of OEN and HP-CEN at high pressure. The diamond symbols present the result from run T409 (solid: OEN, open:HP-CEN). The dash gray lines are the best fits of our data. The open triangles are the data fromFlesch et al. (1998). The elastic modulimeasured fromFlesch et al. (1998)and in this study are in good agreement. Both the bulk and shear moduli show non-linear behavior as afunction of pressure. In contrast to OEN, the elastic moduli of HP-CEN exhibit a linear relationship with pressure in the pressure range forwhich data were collected (6–12 GPa). The difference in elastic moduli across the phase transformation is 16.5% forG and 2.3–5% forKS.
of Cook (1957), which has been widely used in ultra-sonic studies performed without in situ X-ray tech-niques (e.g.,Flesch et al., 1998). The results for themoduli and their pressure derivatives (K′
S, K′′S, G′ and
G′′) are given inTable 3, along with previous OENdataset fromFlesch et al. (1998). The elastic moduliof OEN parameters resulting from the two measuresof linear compressionS are in good agreement andsimilar to those ofFlesch et al. (1998). In both studies,the clear non-linear behavior of the velocities versuspressure illustrated inFig. 8a and bis reflected inthe requirement of using the fourth order finite-strainequations to adequately fit the moduli-pressure data
J. Kung et al. / Physics of the Earth and Planetary Interiors 147 (2004) 27–44 41
(Fig. 9, solid diamonds – this study, open triangles –Flesch et al., 1998).
The elastic moduli of the HP-CEN phase, on theother hand, exhibit linear relationships with pressure(Fig. 9, open diamonds) in the pressure range of6.5–11.7 GPa, which can be fit to obtain 156.7(8) GPafor KS(6.5 GPa), 98.5(4) GPa for G(6.5 GPa), K′
S(6.5 GPa)= 5.5(3) and G′
(6.5 GPa) = 1.5(1) at a pressure of6.5 GPa and ambient temperature. If we fit these datawith third-order finite-strain equations, we obtainvirtually identical values (Table 3). The increasesin elastic moduli due to the phase transition inOEN→HP-CEN are 2.3–5% for bulk modulus and∼16.5% for shear modulus from the pressure rangeof 6–9 GPa.
4.2. “Anomalous” behavior observed in the OENphase above 9 GPa, before transformation to theHP-CEN phase
As shown inFig. 8, at pressures above 9 GPa, bothVP andVS (symbols in gray, denoted as “anomaly” inTables 1 and 2) decrease dramatically with increas-ing pressure, reaching minimum values between 12and 14 GPa, and then begin to increase again. Thisanomalous velocity behavior was observed in bothruns T354 and T409; the degree of velocity reductionvaries between the two acoustic runs, with the slowerrate of pressurization in T354 producing more pro-nounced velocity minima. In the pressure range from9 to ∼13 GPa, the P and S wave velocities decreaseby as much as 5.3% and6.3%, respectively, i.e. in runT354; this reduction is larger in magnitude than thevelocity increases associated with the transformationto the HP-CEN phase. Without further experiments,we cannot be certain that the velocity reduction ob-served in this study has reached the maximum value.
The cause of such anomalous elastic behavior(elastic softening) could be induced by a phase trans-formation (seeCarpenter and Salje, 1998; Carpenteret al., 1998for general review, references therein)or pressure-induced solid-state amorphization (SSA)due to structural or lattice instability (e.g. H2O,Gromitskaya et al., 2001). After carefully examiningthe X-ray diffraction patterns above 10 GPa, we didnot observe any increase in the intensity of the back-ground due to amorphization of OEN (Fig. 6f andg). In addition, none of the previous Raman studies
(Chopelas, 1999; Serghiou et al., 2000; Lin, 2003)suggests amorphization in the pressure range studiedhere. Thus, the possibility of OEN amorphization canbe ruled out. The elastic softening of OEN is mostlikely caused by a phase transition. Although theproxy experiment in orthoferrosilite (FeSiO3, spacegroup Pbca) to C2/c clinoferrosilite (Hugh-Joneset al., 1996) would suggest a phase transition fromOEN to HP-CEN, such a transition can be ruled outin the case of our experiments for reasons cited above(Section 3.3). Neither does our X-ray evidence sup-port the possible phase transition,Pbca → Cmca,suggested byJackson et al. (2004), for their high tem-perature experiments in MgSiO3 at room pressure. Inthe Pbca → Cmca phase transformation, the OEN(3 2 1) and (6 1 0) peaks should disappear, and theOEN (5 1 1) peak remain after the transition. This isdifferent from the observation in our X-ray diffractionpatterns; we observed that the OEN (3 2 1) and (5 1 1)peaks disappeared at high pressures (Fig. 6d–g). Fromour existing data, although it is difficult to determinethe symmetry of the new phase, clearly this transitionis reversible.
The anomalous velocity behavior observed here, ifassociated with a phase transition, would be a sen-sitive tool to locate the transition point. In the casesof our acoustic experiments, the minima of the ve-locity anomalies can be interpreted as the transitionpoint between 13 and 14 GPa (Fig. 8). In this pres-sure range, we also observed distinctive changes inthe X-ray diffraction patterns, and the characteristic ofthe “new” phase was enhanced as pressure increases(seeSection 3.3). The specimen remained in this newphase until being heated to 900◦C at peak pressure andtransforming to HP-CEN. No reversion to this phasewas observed during the experimental conditions inrun T409 (seeFig. 1 for experimentalP–T path). Thissuggests that the new phase may be a metastable phaserelated to the kinetic process of the phase transitionfrom OEN to HP-CEN at room temperature.
5. Geophysical applications
Many seismic models of the Earth’s upper mantleshow velocity discontinuities or unusual gradients inthe depth range of 200–350 km (seeGaherty et al.,1999; Gu et al., 2001; Deuss and Woodhouse, 2002
42 J. Kung et al. / Physics of the Earth and Planetary Interiors 147 (2004) 27–44
and references therein); these include the Lehmanndiscontinuity at depths of about 220 km and the260 km or X-discontinuity.
The OEN to HP-CEN transition involves a sig-nificant density increase of∼3%, which has beensuggested to be the cause of the seismic reflectorsat depths between 200 and 300 km; such reflectorsmight be expected to be observed in an Earth of“depleted” mantle composition model (Angel et al.,1992; Woodland and Angel, 1997; Woodland, 1998).In the absence of velocity data for the HP-CENphase,Angel et al. (1992)used Birch’s law to esti-mate the velocity changes associated with the OENto HP-CEN phase transition (see alsoWoodland andAngel, 1997). In this study, we were able to measurethe elasticity of both the OEN and HP-CEN in thesame experiment and thus to evaluate the contrast ofseismic properties between these two phases directly.The density jump across the phase transformation is2.6–2.9% at a pressure range corresponding to thedepth of 200–300 km in the upper mantle. The corre-sponding velocity jump is 3–4% for P wave and 5–6%for S wave. Thus, the seismic impedance contrast(2(ZHP-CEN − ZOEN)/(ZHP-CEN + ZOEN), where Z= densityx velocity) is 5–8% for P wave and 8–11%for S wave. For a depleted mantle composition modelwith ∼20 modal% OEN (i.e. Ca-poor orthopyroxene,Jordan, 1978; Woodland, 1998) the expected seismicimpedance contrast should be between 1 and 2%for P and S waves in the depth range 200–300 km.Based on unpublished data from our laboratory (Kunget al., 2002), we expect that the magnitude of thesevelocity and impedance increases would be reducedsomewhat at high temperature. Such small velocityand impedance contrasts could be masked by theother geophysical processes or structures (Woodland,1998) and thus not produce strong seismic reflections.Therefore, the OEN to HP-CEN phase transforma-tion may not be a satisfactory explanation for seismicdiscontinuities observed at the depth range of 200–300 km.
In this study, we also observed, for the first time andunexpectedly, anomalous elastic behavior prior to thephase transition from the orthoenstatite→ HP-CENat room temperature: both the P and S wave veloc-ities reach a maximum value near 9 GPa and there-after decrease on increase of pressure. Interestingly, anelastic softening behavior has also been observed in
OEN at high temperatures and room pressure (Jacksonet al., 2004). If anomalous elastic behavior were to beobserved also at high pressure and high temperature,such a “softening” of the elasticity of the pyroxenecomponent of mantle compositions may contribute tolow-velocity zones or enhanced seismic discontinuity,which occurs at depths of∼220 km continental re-gions (Gaherty et al., 1999; Gu et al., 2001; Deuss andWoodhouse, 2002).
Acknowledgements
We thank for the support of beamline 13-ID, GSE-CARS, and, especially, M. Rivers and S. Sutton fortheir role in developing large-volume high-pressure fa-cility. We also thank J. Hu, H. Liu and Z. Liu for assis-tance in conducting in situ X-ray DAC experiment onbeamline X17C and Raman study on beamline U2Aat National Synchrotron Light Source (NSLS). We aregrateful to J. Jackson for providing the preprint of pa-per. We also would like to thank R. Angel, D. Mao andJ. Parise for useful discussions. This study is supportedby the National Science Foundation under the GrantsEAR0229704 to R.C.L. and EAR0003340 to B.L..Use of the Advanced Photon Source was supportedby the U.S. Department of Energy, Office of Science,Office of Basic Energy Sciences, under Contract No.W-31-109-ENG-38. GSECARS is supported by theNational Science Foundation – Earth Sciences, De-partment of Energy – Geosciences, W.M. Keck Foun-dation, and the U.S. Department of Agriculture. MPIpublication no. 348.
References
Angel, R.J., Hugh-Jones, D.A., 1994. Equations of state andthermodynamic properties of enstatite pyroxenes. J. Geophys.Res. 99, 19777–19783.
Angel, R.J., Jackson, J.M., 2002. Elasticity and equation of stateof orthoenstatite, MgSiO3. Am. Miner. 87, 558–561.
Angel, R.J., Chopelas, A., Ross, N.L., 1992. Stability ofhigh-density clinoenstatite at upper-mantle pressures. Nature358, 322–324.
Carpenter, M.A., Salje, K.H., 1998. Elastic anomalies in mineralsdue to structural phase transitions. E. J. Miner. 10, 693–812.
Carpenter, M.A., Salje, K.H., Graeme-Barber, A., 1998.Spontaneous strain as a determinant of thermodynamicproperties for phase transitions in minerals. E. J. Miner. 10,621–691.
J. Kung et al. / Physics of the Earth and Planetary Interiors 147 (2004) 27–44 43
Chopelas, A., 1999. Estimates of mantle relevant Clapeyron slopesin the MgSiO3 system from high-pressure spectroscopic data.Am. Miner. 84, 233–244.
Cook, R.K., 1957. Variation of elastic constants and staticstrains with hydrostatic pressure – a method for calculationfrom ultrasonic measurements. J. Acoust. Soc. Am. 29, 445–449.
Davies, G.F., Dziewonski, A.M., 1975. Homogeneity andconstitution of Earth’s lower mantle and outer core. Phys. EarthPlanet. Inter. 10, 336–343.
Decker, D.L., 1971. High-pressure equation of state for NaCl, KCl,and CsCl. J. App. Phys. 42, 3239–3244.
Deuss, A., Woodhouse, J.H., 2002. A systematic search for mantlediscontinuities using SS-precursors. Geophys. Res. Lett. 29, art.no. 1249.
Flesch, L.M., Li, B.S., Liebermann, R.C., 1998. Sound velocitiesof polycrystalline MgSiO3-orthopyroxene to 10 GPa at roomtemperature. Am. Miner. 83, 444–450.
Gaherty, J.B., Kato, M., Jordan, T.H., 1999. Seismological structureof the upper mantle: a regional comparison of seismic layering.Phys. Earth Planet. Inter. 110, 21–41.
Gasparik, T.A., 1990. Thermodynamic model for theenstatite-diopside join. Am. Miner. 75, 1080–1091.
Ghose, S., Schomaker, V., McMullan, R.K., 1986. Enstatite,Mg2Si2O6: a neutron diffraction refinement of the crystalstructure and a rigid body analysis of the thermal vibration. Z.Krist. 176, 159–175.
Gromitskaya, E.L., Stal’gorova, O.V., Brazhkin, V.V., Lyapin,A.G., 2001. Ultrasonic study of the nonequilibriumpressure-temperature diagram of H2O ice. Phys. Rev. B 64, art.no. 094205.
Gu, Y.J., Dziewonski, A.M., Ekstrom, G., 2001. Preferentialdetection of the Lehmann discontinuity beneath continents.Geophys. Res. Lett. 28, 4655–4658.
Hugh-Jones, D.A., Angel, R.J., 1994. A Compressional Study ofMgSiO3 Orthoenstatite up to 8.5 GPa. Am. Miner. 79, 405–410.
Hugh-Jones, D.A., Woodland, A.B., Angel, R.J., 1994. Thestructure of high-pressureC2/c ferrosilite and crystal- chemistryof high-pressureC2/c pyroxenes. Am. Miner. 79, 1032–1041.
Hugh-Jones, D., Sharp, T., Angel, R., Woodland, A., 1996.The transition of orthoferrosilite to high-pressureC2/cclinoferrosilite at ambient temperature. E. J. Mineral. 8, 1337–1345.
Jackson, J.M., Sinogeikin, S.V., Bass, J.D., 1999. Elasticity ofMgSiO3 orthoenstatite. Am. Miner. 84, 677–680.
Jackson, J.M., Sinogeikin, S.V., Carpenter, M.A., Bass, J.D., 2004.Novel phase transition in orthoenstatite. Am. Miner. 89, 239–245.
Jordan, T.H., 1978. Composition and development of continentaltectosphere. Nature 274, 544–548.
Kanzaki, M., 1991. Ortho/clinoenstatite transition. Phys. Chem.Miner. 17, 726–730.
Kung, J., Li, B., Uchida, T., Wang, Y., 2002. Elasticitymeasurements of phase transition in pyroxenes and the uppermantle reflectors. Eos. Trans. AGU 83 (47), F976.
Kung, J., Li, B., Weidner, D.J., Zhang, J.Z., Liebermann, R.C.,2002. Elasticity of (Mg0.83,Fe0.17)O ferropericlase at highpressure: ultrasonic measurements in conjunction with X-radiation techniques. Earth Planet. Sci. Lett. 203, 557–566.
Larson, A.C., Von Dreele, R.B., 1988. GSAS manual. Los AlamosNational Laboratory, Report LAUR: 86-748.
Le Bail, A., Duroy, H., Fourquet, J.L., 1988. Abinitio structuredetermination of LiSbWO6 by X-ray-powder diffraction. Mater.Res. Bull. 23, 447–452.
Li, B., Chen, G., Gwanmesia, G., Liebermann, R.C., 1998. Soundvelocity measurements at mantle transition zone conditions ofpressure and temperature using ultrasonic interferometry in amultianvil apparatus. In: Manghnani, M.H., Yagi T. (Eds.),Properties of Earth and Planetary Materials at High Pressureand Temperature. Am. Geophys. Union, Geophys. Monogr. Ser.,101, pp. 41–61.
Li, B., Chen, K., Kung, J., Liebermann, R.C., Weidner, D.J., 2002.Sound velocity measurement using transfer function method. J.Phys.: Condens. Matter 14, 11337–11342.
Li, B., Kung, J., Liebermann, R.C., 2004. Modern techniques inmeasuring elasticity of Earth materials at high pressure andhigh temperature using ultrasonic interferometry in conjunctionwith synchrotron X-radiation in multi-anvil apparatus. Phys.Earth Planet. Inter. 143–144, 559–574.
Lin, C.C., 2003. Pressure-induced metastable phase transitionin orthoenstatite (MgSiO3) at room temperature: a Ramanspectroscopic study. J. Solid State Chem. 174, 403–411.
Mendelssohn, M.J., Price, G.D., 1997. Computer modelling ofa pressure induced phase change in clinoenstatite pyroxenes.Phys. Chem. Miner. 25, 55–62.
Ohashi, Y., 1984. Polysynthetically-twinned structures of enstatiteand wollastonite. Phys. Chem. Miner. 10, 217–229.
Pacalo, R.E.G., Gasparik, T., 1990. Reversals of theorthoenstatite-clinoenstatite transition at high-pressures andhigh-temperatures. J. Geophys. Res. 95, 15853–15858.
Ross, N.L., Reynard, B., 1999. The effect of iron on the P2(1)/cto C2/c transition in (Mg,Fe)SiO3 clinopyroxenes. E. J. Miner.11, 585–589.
Serghiou, G., Boehler, R., Chopelas, A., 2000. Reversiblecoordination changes in crystalline silicates at high pressure andambient temperature. J. Phys-Condens. Matter 12, 849–857.
Shinmei, T., Tomioka, N., Fujino, K., Kuroda, K., Irifune, T., 1999.In situ X-ray diffraction study of enstatite up to 12 GPa and1473 K and equations of state. Amer. Miner. 84, 1588–1594.
Sinelnikov, Y.D., Chen, G.L., Liebermann, R.C., 2004. Dual modeultrasonic interferometry in multi-anvil high-pressure apparatususing single crystal olivine as pressure standard. Int. J. HighPressure Res. 24, 183–191.
Uchida, T., Wang, Y., Rivers, M.L., Sutton, S.R., Weidner, D.J.,Vaughan, M.T., Chen, J., Li, B., Secco, R.A., Rutter, M.D., Liu,H., 2002. A large-volume press facility at the advanced photonsource: diffraction and imaging studies on materials relevantto the cores of planetary bodies. J. Phys.: Condens. Matter 14,11517–11523.
Weidner, D.J., Wang, H., Ito, J., 1978. Elasticity of orthoenstatite.Phys. Earth Planet. Inter. 17, 7–13.

44 J. Kung et al. / Physics of the Earth and Planetary Interiors 147 (2004) 27–44
Wentzcovitch, R.M., Hugh-Jones, D.A., Angel, R.J., Price, G.D.,1995. Ab-initio study of MgSiO3 C2/c enstatite. Phys. Chem.Miner. 22, 453–460.
Woodland, A.B., 1998. The orthorhombic to high-P monoclinicphase transition in Mg-Fe pyroxenes. Can it produce a seismicdiscontinuity? Geophys. Res. Lett. 25, 1241–1244.
Woodland, A.B., Angel, R.J., 1997. Reversal of theorthoferrosilite-high-P clinoferrosilite transition, a phasediagram for FeSiO3 and implications for the mineralogyof the Earth’s upper mantle. E. J. Miner. 9, 245–254.
Copyright © 2022 FDOKUMEN