Te Tokaroa Meola Reef intertidal reef ecological monitoring ...
Upload
washingtonCategory
view
1download
0
Limnol. Oceanogr., 36(S), 1991, 936-948 0 1991, by the American Society of Limnology and Oceanography, Inc.
In situ measurements of flow effects on primary production and dark respiration in reef corals
Mark R. Patterson Division of Environmental Studies, University of California, Davis 956 16
Kenneth P. Sebens Marine Science Center, Northeastern University, Nahant, Massachusetts 0 1908
R. Randolph Olson Department of Zoology, University of New Hampshire, Durham 03824
Abstract The effects of flow on the physiological ecology of Montustrea annuluris, an important frame-
building species of Caribbean coral reefs, were investigated in situ with a recirculating flow res- pirometry system deployed from an underwater habitat. For this species, primary production and respiration rates increase with increasing water motion. The slope of a nondimensional Sherwood (Sh)-Reynolds(Re) number plot indicates that forced convection increases dark respiration in a manner consistent with oxygen transfer through a turbulent boundary layer (Sh = 0.01Re’.30). A similar analysis for maximal photosynthetic rate yields a lower but significant slope (Sh = 0.7 1 Reo.63). A simple conceptual model of diffusional depletion in the boundary layer over the coral fits the data and accounts for the distribution of zooxanthellae. Calculations of phototrophic capacity for this species indicate that water motion can enhance the local productivity of the reef.
Effects of water motion on the ecology of corals have been described for coral growth (Jokiel 1978), distribution (Vosburgh 1977) recruitment (Sammarco and Andrews 1988), and whole-reef metabolism (Marsh and Smith 1978). Although the physiological ecology of corals has been the subject of numerous studies (cf. Muscatine et al. 198 l), the interaction between water motion and diffusion of dissolved molecules and ions important to the symbioses between inver- tebrates and algae has not received much attention.
Acknowledgments We thank the staff of the NOAA NURP saturation
habitat Hydrolab, the University of New Hampshire Hyperbaric Facility; S. Hix and D. Kramer for loan of an electroluminescent screen and technical assistance; R. Patterson for design drafting; J. Porter for chamber design advice; R. Allmon, R. Aronson, S. Briscoe, M. Olson, and S.L. Sanderson for field assistance; and P. Basser, C. Declerck, M. Denny, P. Edmunds, T. Giv- nish, R. Grosberg, S. Kleinhaus, M. Koehl, R.. Merz, T. Powell. W.S. Price. L. Sanderson, S. Wing, and J. Witman f& discussion.
This work was supported by NSF OCE 83-08958, and NOAA Hydrolab missions 84-7 and 85-7 to K.P.S., NSF OCE 87-16427 and a University of California Commitee on Research grant to M.R.P., and an in- strumentation grant from Planar Systems to M.R.P.
Effects of water motion on the metabo- lism of other aquatic organisms have been the subjects of numerous studies. Experi- ments with marine algae (Koehl and Alberte 1988) freshwater algae (Riber and Wetzel 1987), and angiosperms (Westlake 1967) have shown that current speed can have profound effects on photosynthesis, respi- ration, and nutrient uptake. In contrast, the importance of water motion is rarely dis- cussed, if at all, with respect to respiration in invertebrates. Examination of the effects of flow on respiration in aquatic inverte- brates has been confined largely to the tor- rential insect fauna (Knight and Gaufin 1963). Although much work has been done on the gas exchange physiology of cnidari- ans, including in situ measurement of rates of primary production and respiration for symbiotic species (see Sebens 1987) the ef- fects of flow on gas exchange have not been quantitatively investigated.
What might the diffusive path length be for scleractinian corals? The diffusional pathway into the respiring tissue properly includes part of the layer of water over the surface of the coral- the momentum boundary layer. Momentum boundary lay- ers arise through the action of fluid viscos-
936

Coral metabolism and flow 937
ity. For a steady flow over a coral, the fluid speed will be almost zero at the colony sur- face. (The speed of the mucus on the coral surface will not be exactly zero, because shear stress exerted on the mucus by the fluid moving overhead causes mucus to slip and slough off.) The flow speed will then &e to a “free-stream” value some distance above the coral. The distance over which the ve- locity changes from 0 to 99% of the free- stream value is often chosen to define the momentum boundary-layer thickness (White 1988). If a dissolved substance, e.g. oxygen, is added to the water in the mo- mentum boundary layer at a rate faster than diffusion can carry the dissolved substance away, a concentration gradient will form.
This concentration gradient is termed the. diffusional boundary layer. The ratio of dif- fusional to momentum boundary-layer thickness can be calculated with an expres- sion involving a dimensionless parameter, the Schmidt number, SC (White 1988). SC = v/D, where v is the kinematic viscosity of fluid (the ability of a fluid to react to changes in mechanical stress), and D is the molecular diffusion coefficient, both expressed in length2 time-‘. The ratio of the diffusional (d) and momentum (6) boundary-layer thickness is quantified by the Schmidt num- ber: d/6 = SC-O.~~. When D = v, both types of boundary layers will have identical thick- nesses. For most small molecules and ions of biological interest (e.g. 0,) dissolved in seawater, SC e 5 X 10², so the diffusional boundary layer will be about ‘/sth the thick- ness of the momentum boundary layer.
A decrease in the length of the diffusional path from the aquatic environment into the tissues of the coral will have two important consequences. It will increase the dissolved gas or nutrient flux by linearly increasing the concentration gradient, by Fick’s first law,
F=-DdC z az (1)
where F, is the flux rate, C the concentra- tion, and z the distance coordinate perpen- dicular to the coral surface. Second, it will parabolically decrease the time needed to equilibrate changes in dissolved species concentration, by Fick’s second law,
ac -= at
-Da2C dZ2’ (2)
resulting from changes in the aquatic en- vironment or within the coral (Berg 1983).
The scaling of the diffusional boundary- layer thickness with flow speed depends on whether the flow over the colony surface and nearby substrate is hydraulically smooth, rough, or transitional in nature (Ju- mars and Nowell 1984). More specifically, the presence or absence of an organized laminar sublayer-a zone where fluid ve- 1oc:ity varies as a linear function of height above the surface-can markedly affect the diffusional path length. Farther away from the surface, a nonlinear logarithmic profile of velocity is obtained (Denny 1988).
Difisional boundary-layer thickness over coral colonies can be on the order of coral tissue thickness (Patterson 1991). Gas ex- change in other cnidarians (sea anemones, soft corals) is flow sensitive (Patterson and Sebens 1989). Hence the potential for mod- ulat.ion of gas exchange (dissolved oxygen, CO12 in the form of HC03-) by flow exists for corals. We tested this hypothesis through experiments with in situ metabolic cham- bers on a coral reef in the Caribbean Sea. In s#itu work in gas exchange studies with photosynthetic marine organisms avoids the problems of duplicating in the laboratory the spectral quality, intensity, and diurnal light flux found at depth and of duplicating tem:perature and water chemistry of the nat- ural environment.
Materials and methods How chambers -Recirculating flow
-chambers were designated for both in situ and laboratory use to study the effect of flow speed on gas exchange in cnidarians or other sessile invertebrates and algae. The cham- bers were fabricated from 6.4-mm-thick Plexiglas (Fig. 1). In a chamber, flow entered through the upstream diffusing cone; the an- gle of the cone was chosen to prevent ap- preciable separation of the incurrent jet from the walls of the cone at the highest flow speed. The flow then passed through plastic flow straighteners (i.d., 5 mm; length, 8 cm); they ,disrupted flow structures oflength scales larger than the diameter of the straws and

Patterson et al.
outflow during flushing
plankton netting
over intake
to computer-controlled to computer A/D
specimen holder
wing-nut
turbulence red”cti:n
4-way PVC valve IO cm
PVC pipe
Fig. 1. Diagram of the unidirectional recirculating metabolism chamber used to vary flow past scleractinian coral heads. The volume of the system is - 7 liters and can be modified for use with other macroinvertebrates and macroalgae. The DC pump speed and the acquisition of flow speed, oxygen concentration, irradiance, and temperature signals from chamber sensors are under computer control.
suppressed secondary flow generated by the chamber pump. The flow passed over a sin- gle coral head affixed to a Plexiglas plate that fit flush with the floor of the chamber. The plate permitted movement and mount- ing of the coral head without physically con- tacting it at the time of the experiment.
A port for the insertion of an oxygen sen- sor was located upstream of the flow straighteners in the turbulent flow of the diffuser. Another port in the test section per- mitted the introduction of a heated therm- istor probe for flow characterization.
A 12-V DC, ducted-impeller, submersi- ble bilge pump (Rule Co.) was mounted over the exit hole; water leaving the pump was sent via PVC tubing (o.d., 3.5 cm; i.d., 2.8 cm) to the inlet orifice. The specimen plate and pump contact surfaces were gasketed with hard rubber. Pumps delivered volu- metric flow rates of 1,894, 3,028, and 5,677
liters h-l. How measurements across the width of the chambers with a thermistor flowmeter gave mean (maximal) flow speeds of2.3(4.1),3.7(8.1),and7.0(16.7)cms-*, respectively. Electricity to run the pumps was supplied via waterproof cables by a DC power supply (Astron RS-20M) operated manually or with a microcomputer (Apple He).
Normalized flow-speed profiles (Fig. 2) are about the same in all three chambers, and maximal flow speed in the chambers is about twice the mean flow speed. The rms of the turbulent fluctuations (u’) is a mea- sure of the average fluctuation of flow speed away from the mean; it can be viewed as a standard deviation of the flow. The fluctu- ations of a turbulent flow increase as the mean flow speed is increased, so it is ap- propriate to normalize the rms fluctuation to the wall shear velocity, itself a measure

Coral metabolism and flow 939
0.8
0.6
0.4
0.2
0.0 0.0 0.2 0.4 0.6 0.8 1.0
0.6
0.0 01234567
u/u max
0.8-
-&- Chamber2 I________ _ -___. ___---. + Chambsr3
::LI 0.0 0.2 0.4 0.6 0.8 1.0
Y/Y ma.x Fig. 2. Profiles of flow (u) and rms turbulent fluctuations (U ‘,I”) in the chambers normalized to maximum
flow speed (u,“,,) and shear velocity (u*) at the wall, respectively, in the cross-stream (v-axis) direction for empty chambers with pumps rated nominally at 526, 841, and 1,577 ml s-l, respectively. Distance across the chambers along both axes is normalized to width oi,.,, 16 cm) and height (z,.,, 16 cm) of the working section at the thermistor flow probe port, Lower box shows cross-section of chamber and coordinate system used, dotted line indicates location of measurements. u,,.-4.1, 8.1, 16.7 cm s-l; u*-0.8, 0.6, 1.7 cm s-l in chambers l-3 respectively. Similar data obtained for flow profiles along the .z-axis at J/V,,,., = 0.5.
of the correlation and magnitude of the tur- bulent fluctuations in the flow (Denny 1988). Normalized turbulent kinetic energy was not radically different among chambers, al- though the highest flow chamber did have the greatest turbulence intensity. Shear ve- locities were calculated through linear re- gression by means of a boundary-layer model that assumes flow speed varies as the logarithm of distance from a wall (Denny 1988).
Field flow measurements (e.g. Fig. 3) were obtained with a portable thermistor flow- meter that recorded data as a tone on mag- netic tape. The data were later recovered by playing the output of the data tape recorder into a custom-built frequency to voltage converter, the output of which was sampled at 20 Hz via the A/D converter described below. Flow speeds over corals under con-
ditions of average wave height were within the range used in these chamber experi- ments.
W’ater was flushed from a chamber by opening an Asahi PVC (4-way drilling) valve (Fig. 1). The valve inlet was covered with plankton netting. The volume of each chamber was - 7.5 liters. The chambers were motmted on a PVC rack on the sea floor.
Clzamber instrumentation-Each cham- ber was fitted with a pressure-compensated, submersible, polarographic, Clark-type ox- ygen probe (YSI 57 10) equipped with 30 m of underwater cable connected to YSI 54ARC oxygen meters or a maintenance- free, non-O,-consuming Nester oxygen sen- sor connected to a Nester 7932 meter. Cal- ibration of the probes was done in water- satu:rated air. Each chamber was also fitted with a temperature-compensated thermis-

940 Patterson et al.
0
Flow $$eed (b s -lJ3’ Fig. 3. Typical histogram of flow speed measured
with a thermistor flowmeter at height of 1 .O cm over a colony of Montastrea annularis at a depth of 15 m, Salt River Canyon. Flow readings were acquired at 20 Hz (n = 15,000, 25 min).
tor flow probe connected via 20 m of shield- ed waterproof cable to a feedback logarith- mic amplifier circuit. An underwater spherical h-radiance probe (LiCor LI- 193SB) was mounted external to the chambers on the PVC rack and a 30-m waterproof cable connected the sensor to a LiCor LI-188B integrating quantum irradiance meter. The meter was set to an integration time of 1 min. Attenuation of light by Plexiglas is wavelength-dependent, and irradiance measurements were corrected accordingly [transmissivities for 6.4-m thickness (nm, %): 425-700, 92; 400, 87; 375, 10; ~360, 0; C. Dota pers. comm.].
The analog outputs of the three flowme- ters and oxygen meters, and light meter were fed into a signal conditioner before sam- pling (20 Hz) by an &bit successive ap- proximation A/D : D/A converter (Moun- tain Computer) connected to an Apple IIe microcomputer that controlled data acqui- sition and analysis through software written for these experiments.
Study site and experimental organism- Studies of respiration and primary produc- tion of small heads of Montastrea annularis were made in situ at 14-m depth in Salt River Canyon, St. Croix, U.S. Virgin Is- lands. The study site (east slope) was a sand bottom adjacent to the coral reef. The mi- crocomputer and other intrumentation were housed inside the Hydrolab facility, and sat-
uration diving techniques were used to in- stall, troubleshoot, and operate the experi- mental setup during missions 84-7 and 85 7. The habitat was open to the ocean and had an internal pressure of -2.5 atm. To eliminate the risk of CRT implosion, we used an electroluminescent video display (Planar Systems) to monitor the output of the computer. The PVC experiment rack was placed 10 m in front of the Hydrolab main window for observation and ease of communication with support divers.
About 4 d before use, small heads (- 10 cm greatest dimension) of M. annularis (n = 23) were collected with chisel and ham- mer from the adjacent reef at the same depth to reduce possible variance in photoadap- tive changes in metabolism reported for other scleractinians (Muscatine et al. 1984). All specimens were checked for signs of bor- ing organisms that would confound metab- olism measurements (McCloskey et al. 1978); if clean, they were immediately mounted on Plexiglas plates and brought to the vicinity of the habitat for adjustment to the ambient light regime and tissue healing. Corals were acclimated for 3-5 d before use in the metabolism chambers.
Corals were generally introduced to the chambers in the late morning, and a gas exchange run initiated simultaneously in all chambers. Divers flushed the chambers at regular intervals to prevent changes in am- bient gas concentration beyond 15% from ambient. Runs were -24 h long. After a run, corals were transferred by divers to a boat and transported in covered buckets of seawater to the West Indies Laboratory, Fairleigh Dickinson University.
Biomass calculations-Biomass must be quantified to calculate specific respiration and photosynthetic rates for the various flow-speed treatments. Animal and plant biomass in the coral colonies was measured as follows. All tissue was cleaned from the surface of the colonies with a fine jet of wa- ter. The volume of the collected tissue and water was measured. Three 40-ml subsam- ples were withdrawn from the tissuekwater mixture, fixed with Formalin, refrigerated at 4°C and the chlorophyll was then ex- tracted overnight in the dark with acetone buffered with MgCO+ The next day, the
Coral metabolism and jlow 941
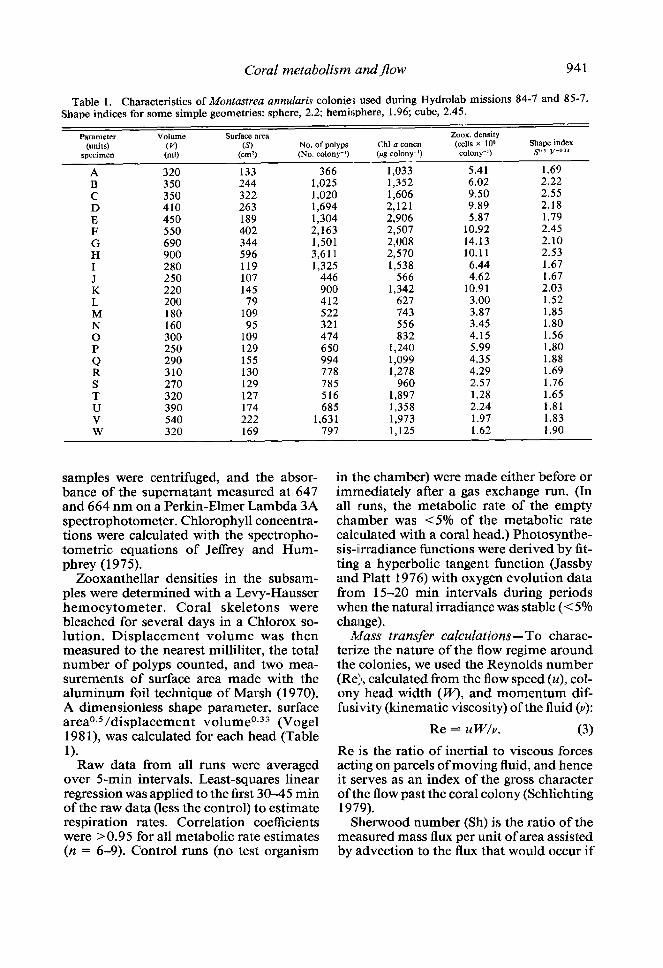
Table 1. Characteristics of Montastrea annularis colonieis used during Hydrolab missions 84-7 and 85-7. Shape indices for some simple geometries: sphere, 2.2; hemisphere, 1.96; cube, 2.45.
Parameter (units)
specimen
A B C D E F G H
: K L M N 0
Fi S T U V W
Volume
(2)
320 350 350 410 450 550 690 900
280 250 220 200 180 160 300
250 290 310 270 320 390 540 320
Surface area (9
(cm9
133 244 322 263 189 402 344 596
119 107 145 79
109 95
109
129 155 130 129 127 174 222 169
No. of polyps Chl a concn (No. colony-‘) (pg colony-‘)
366 1,033 1,025 1,352 1,020 1,606 1,694 2,121 1,304 2,906 2,163 2,507 1,501 2,008 3,611 2,570
1,325 446 1,538 566 900 1,342 412 627 522 743 321 556 474 832
650 994 778 1,240 1,099 1,278 785 960 516 1,897 685 1,358
1,631 1,973 797 1,125
Zmx. density (cells x IO’
colony-‘)
5.41 6.02 9.50 9.89 5.87
10.92 14.13 10.11
6.44 4.62 10.91
3.00 3.87 3.45 4.15
4.35 4.29 5.99 2.57 1.28 2.24 1.97 1.62
Shape index so5 y”,’
1.69 2.22 2.55 2.18 1.79 2.45 2.10 2.53
1.67 1.67 2.03 1.52 1.85 1.80 1.56
1.80 1.88 1.69 1.76 1.65 1.81 1.83 1.90
samples were centrifuged, and the absor- bance of the supernatant measured at 647 and 664 nm on a Pet-kin-Elmer Lambda 3A spectrophotometer. Chlorophyll concentra- tions were calculated with the spectropho- tometric equations of Jeffrey and Hum- phrey (1975).
Zooxanthellar densities in the subsam- ples were determined with a Levy-Hausser hemocytometer. Coral skeletons were bleached for several days in a Chlorox so- lution. Displacement volume was then measured to the nearest milliliter, the total number of polyps counted, and two mea- surements of surface area made with the aluminum foil technique of Marsh (1970). A dimensionless shape parameter, surface area0,5 /displacement volume0.33 (Vogel 198 l), was calculated for each head (Table 1).
Raw data from all runs were averaged over 5-min intervals. Least-squares linear regression was applied to the first 30-45 min of the raw data (less the control) to estimate respiration rates. Correlation coefficients were >0.95 for all metabolic rate estimates (n = 6-9). Control runs (no test organism
in the chamber) were made either before or imrnediately after a gas exchange run. (In all runs, the metabolic rate of the empty chamber was ~5% of the metabolic rate calculated with a coral head.) Photosynthe- sis-h-radiance functions were derived by fit- ting a hyperbolic tangent function (Jassby and Platt 1976) with oxygen evolution data from 15-20 min intervals during periods when the natural irradiance was stable (< 5% change).
Mass transfer calculations-To charac- terize the nature of the flow regime around the colonies, we used the Reynolds number (Rej, calculated from the flow speed (u), col- ony head width (IF’), and momentum dif- fusivity (kinematic viscosity) of the fluid (u):
Re = u W/v. (3) Re is the ratio of inertial to viscous forces acting on parcels of moving fluid, and hence it serves as an index of the gross character of th(e flow past the coral colony (Schlichting 1979).
Sherwood number (Sh) is the ratio of the measured mass flux per unit of area assisted by advection to the flux that would occur if

942 Patterson et al.
molecular diffusion was the sole mechanism for mass transport (White 1988). Sh is sometimes called the mass transfer Nusselt number, after the equivalent dimensionless index used in heat transfer studies. It is in- corporated into the Stanton number (St), a dimensionless group created by combining Re and SC with Sh: St = Sh/ReSc.
This study measured mass transfer to and from whole colonies in well-mixed metab- olism chambers, so we calculated average - values of Sherwood number (Sh) for the - whole colony at a particular Re. Sh was cal- culated from the average mass transfer co- efficient (h,) which was determined empir- ically from the ratio of the average mass flux of oxygen per unit of area (F,) to the oxygen concentration difference between the cham- ber (C,) and the site of aerobic respiration and photosynthesis (Ci), the characteristic dimension of the organism (coral head di- ameter, W), and the diffusion coefficient for oxygen (D):
- Sh=f@ D ’
Mass transfer coefficients are related to the sizes of objects by an inverse power func- tion, because larger objects will have ab- solutely thicker boundary layers for the same flow speed relative to smaller objects (White 1988).
Sherwood number can be calculated lo- cally as a function of position downstream (x) over a coral colony (Sh,), but doing so would require calculations with oxygen mi- croelectrodes of the local fluxes within patches of the colony. In effect, Sh, is in- tegrated over the entire surface of the colony - to produce Sh.
For respiration calculations, Ci was as- sumed to be very close to zero internally in respiring cell layers of ectoderm and gas- troderm. This assumption was made for ease of calculations inasmuch as internal oxygen concentrations were not measured. During periods of maximal primary production, Ci was assumed to be at saturation; recent studies indicate that this assumption may need to be modified as supersaturation of
oxygen can occur under some conditions in cnidarians (Shick 1990; N. Shashar pers. comm.). In practice IV, the coral head di- ameter, rather than the average boundary layer thickness is used as the relevant length - scale in calculating Sh. Average boundary- layer thickness increases with increasing coral head size. The practice of using the same characteristic dimension in calculat- ing Sh and Re for a mass transfer problem is well established in the engineering liter- ature (White 1988). -
Mass transfer studies use Sh-Re plots to investigate how changes in flow speed, ex- change surface geometry, and fluid viscosity affect the degree to which convective loss or gain of material augments diffusive fluxes (White 1988). Empirical data from mass transfer studies are often described by pow- er functions of the form
Sh - = b(Re)’ + d(Re)’ + f: SC” (6)
The allometric exponent, c in Eq. 6, is usually the most important coefficient in de- termining the degree to which flow aug- ments mass transfer relative to diffusion, and its numerical value can give an indi- cation of whether the transport is occurring through a laminar (c = 0.5) or turbulent (c 1 0.6) boundary layer around the exchange surface. Many expressions found in the en- gineering literature set d = 0 and use only one allometric term, bRe’. Expressions hav- ing two terms in powers of Re more closely fit the empirical data over a wider range of Re for some geometries, inasmuch as con- tributions to mass transfer occurring in the boundary layer prior to the separation point on the exchange surface and in the wake can each be modeled (Whitaker 1983).
Boundary-layer thickness and degree of turbulence change with spatial location around a colony, so our calculation of an - Sh-Re relationship indicates the average be- havior of all sites involved in mass transfer. - Sh is a more informative expression than respiration rate because it accounts for the fact that the driving pressure for diffusion can change during an experiment. For ex- ample, the amount of dissolved oxygen available in the water during dark respira-

Coral metabolism and jlow 943
tion can strongly affect gas exchange in in- vertebrates (cf. Sebens 1987) and algae (cf. Lobban et al. 1985). Unfortunately, exper- iments on gas exchange in aquatic organ- isms often do not account for changes in the ambient gas concentration when reporting metabolic rates nor is it common practice to quantify the degree of fluid mixing in the vicinity of the organism in the metabolism chamber.
Photatrophic capacity calculations-We calculated the ratio of total oxygen pro- duced during the hours of daylight to that consumed during a 24-h period for the two groups of corals shown in Fig. 4 (upper pan- el) using recommendations of McCloskey et al. (1978) and the following assumptions: respiration rate, R, during periods of illu- mination is equal to the constant value ob- served at night. There is no circadian rhythm in respiration rates of the coral and algae, R, or in the P vs. I (photosynthetic rate vs. irradiance) relationship of the algae. The P(Z) curves are well-represented by a hyperbolic tangent function. The irradiance function, Z(t), is a half-sine wave, with a maximal irradiance of 800 prnol quanta mm2 s-’ and a wave period of 12 h. The calculations were normalized to coral surface area. Gross total production (P,) during daylight hours is thus
+ s
sunset R(t) dt. (7) sunrise
Total respiration, R,, during a 24-h period is thus
s
24 h
R, = R(t) dt. (8) 0
P, and R, were calculated by numerical in- tegration with a program written in Math- ematica. The ratio P, : R, is a measure of the degree to which the coral colony can satisfy its daily energy requirements through au- totrophy.
Results Flow e@cts on gas exchange-Re for flow
around coral colonies shows variation at the
CL
-30Y
[I: lrradiance (kmol quanta mw2s
Re =fl V
Fig. 4. Upper panel: Photosynthesis-irradiance (P vs. I) functions for two subsets ofMontastreaannu/aris colonies tested at two ranges of Reynolds number. Col- onies exposed to intermediate ranges of Re are not shown for clarity. Regressions were fitted with the hy- perbolic tangent function of Jassby and Platt (1976). Lower flow (Re 5 5 x 10³), n = 8 P/I curves; higher flow (Re > 103; n = 8 P/I curves. Lower panel: Di- mensionless analysis of mass transfer assisted by flow in M. annulariscolonies; n = 23. The ordinate, average Sherwood @ii) number, is the ratio of mass transfer assisted by advcction in the chamber to the flux that would occur by molecular diffusion alone. The abscis- sa, Reynolds (Re) number, is the ratio of inertial forces to viz;cous forces governing the flow around the coral heads, and can be viewed as a dimensionless coral size or Row-speed parameter. Least-squares regression lines are?% = 0.01 Re’,30 (I’ < 0.05) for nighttime respiration (0) and ?% = 0.71Re”,63 (P < 0.05) for maximal rate of phl>tosynthesis m. z-average mass transfer co- efficient (cm s-l); W-characteristic dimension cereal- -- est width) of the colony (cm); D-diffusion coefficient for oxygen in seawater (2 x 1O-5 cm2 s-l); u-flow speed (cm s-l); u-kinematic viscosity of seawater (10 2 cm2 s I).
field site at 15-m depth (Fig. 3). Increasing Re :increases respiration rate (Student’s t-test; P < 0.05) and maximal photosyn- thetic rate (P < 0.05), both calculated per square centimeter of coral surface area (Fig.

4, upper panel). Respiration rate also in- creased significantly (P < 0.03) with flow when calculated per polyp, as did maximal photosynthetic rate calculated per 1 OS zoo- xanthellae (P < 0.05). Rates normalized by the other biomass units were not signifi- cantly affected by flow. The best-fit equa- tions for the P/I curves are P,,,, = - 17.1 + 36.7 tanh (l/314) for the lower flow colo- nies, and P,,,, = -29.2 + 79.6 tanh (I/370) for the higher flow colonies, where P,,, is net rate of oxygen evolution @g O2 cm-2 s-l) and I is h-radiance (pm01 quanta m-2 s-r) (r2 = 0.9 for both). Most colonies were of similar sizes (Table 1), so most of the changes in Re between the two subsets of corals result from differences in the flow in the chambers. The compensation it-radiance level (no net evolution of oxygen) was not significantly different (P > 0.05) for the high- and low-flow treatments.
Si;-Re data were fitted to an expression - of the form: Sh = bRec (Fig. 4, lower panel); inasmuch as SC was constant for these ex- periments, it was not incorporated into the expression relating Sh to Re. The slope, c, of the log-log least-squares linear regression _- performed on the Sh-Re data for respiration is significantly > 0.5 (Sh = 0.01Re’.30; P -C 0.05), indicating that mass transfer is gov- erned by a turbulent boundary layer, with the size of the wake and the location of the separation point important in determining mass transfer in the coral (White 1988). The slope is lower for the maximal rate of pho- tosynthesis (Sh = 0.71Re0.63; P < 0.05).
Gross daytime production : nighttime res- piration ratios-Calculations of P, : R, val- ues for corals exposed to higher and lower Bow and an idealized ii-radiance history (half sine wave of 12-h period, 800 gmol quanta me2 s-l maximal it-radiance) show a weak dependence of phototrophic capacity on flow. The calculated average gross produc- tion (P,) over a die1 cycle is 743 pg O2 cmd2 in the higher flow corals, and 3 58 pg 0, cmP2 For the lower flow group. The die1 colony respiration (R,) is 701 and 412 pg 0, cm-’ for higher and lower flow groups, respec- tively. The idealized P, : R, ratio for the higher flow group is 1.06; for the lower flow group this ratio is 0.87. Corals ofthis species _ appear able to meet then energy reqmre-
944 Patterson et al.
ments through autotrophy under the stron- ger flow conditions likely to be encountered on the reef if light delivery is adequate.
Discussion %Re relationships-The results of this
study are in qualitative agreement with work investigating the effects of flow on metabolic rates in other aquatic invertebrates and al- gae. In most cases, increases in flow mark- edly increase the rate of mass transfer be- tween the organism and the environment. In studies where the flow was increased to values in the upper range of those encoun- tered in nature, the enhancement effect di- minished greatly (e.g. kelp, Wheeler 1980). Mass transport of any substance to an object in a moving fluid is related to the geometry of the object around which fluid moves be- cause the precise pattern of fluid motion determines the boundary-layer thickness (Table 2). The coral heads used in this study were hemispherical to almost spherical (Ta- ble 1).
If the primary allometric exponent, c, re- lating changes in Re with Sh is equal to -0.5, then mass transfer is probably gov- erned on average by a laminar boundary layer surrounding the exchange surface of the coral. In other words, increases in flow speed or colony size lead to an increase in the reIative importance of advective mixing in controlling the metabolic rate. Values for c ~0.6-0.8 indicate that the scaling of trans- port processes is controlled by a turbulent boundary layer (White 1988).
___-- =~~.~~--~
The empirically derived relationship be- - tween Sh and Re given in Eq. 6 and Table 2 is one of several forms that can be taken by a relationship describing the effects of flow on mass transfer (White 1988). On the- oretical grounds, for flow past an immersed object such as a flat plate, sphere, or cyl- - inder, one might expect Sh 0: Re0.5 where the boundary layer is locally laminar and - Sh 0: Re(0.67 - O.@ where turbulent transfer is occurring, e.g. in a separated wake on the downstream side of an object (White 1988). We feel that the simple allometric curve fit (Sh = bRe”) is the most appropriate for stud- ies utilizing our approach, where the spatial extent and Re dependence of flow separa- tion nhenomena were not characterized.

Coral metabolism andJow
Table 2. Summary of some previous studies of mass transfer using the dimensionless indices, Reynolds number (Re), Sherwood number (Sh), and Schmidt number (SC). The relationship between these is assumed to be of the form: %/SC~ = &Rep + d(Re)’ + $ Because heat transfer obeys the same diffusion equations as mass transfer, the results taken from the engineering literature are in some cases converted from heat transfer exper- iments. Re calculations use downstream length for the plate, diameter for the cylinder and sphere, and greatest linear dimension for the cnidarians.
Object (boundary layer flow regime) Re range SC range
Allometric coefficients
a b Q: d e f RdWXKe
Flat plate (laminar) Re<5 x lo5 SC > 0.6
Flat plate (turbulent) 5 x 10s i Re i 10’ SC > 0.5
Cylinder (laminar) 40 < Re < lo3 Scr 1
Cylinder (laminar to transitional) 10” i Re < 2 x lo5 SC? 1
Cylinder (laminar to transitional) 10 < Re < lo5 0.7 < SC -=c 300
Cylinder (turbulent) ReZ2x lo5 SC 2 1
Sphere (laminar to transitional) 3.5 < Re i 7.6 x lo4 0.7 < SC < 380
Octocoral colony respiration Alcyonium siderium (laminar to transitional)
4 x 10” < Re < lo4 SC = 500
Sea anemone respiration, Metridium senile (turbulent)
7 x 10’ < Re i 2 x 10“ SC = 500
Reef coral dark respiration, Montastrea annularis (turbulent)
2 x lo3 < Re i 2 x lo4 SC = 500
Reef coral max photosynthesis, M. annularis (turbulent)
2 x lo3 < Re < 2 x 10⁴ SC = 500
0.33
0.33
0.37
0.37
0.4
0.37
0.4
0
0
0
0
0.664
0.037
0.52
0.26
0.4
0.023
0.4
0.04
0.28
0.01
0.71
0.5 0 n/a
O.;B 0 n/a
a..5 0 n/a
0.6 0 n/a
0.5 0.06 0.67
0.8 0 n/a
0.5 0.06 0.67
0.92 0 n/a
1.04 0 n/a
1.30 0 n/a 0 This study
0.63 0 n/a 0 This study
0
-850
0
0
0
0
2
0
0
Pohlhausen cited by Brodkey and Hershey 1988
Holman 1986
Zukauskas and Ziugzda 1985
Zukauskas and Ziugzda 1985
Whitaker 1972
Zukauskas and Ziugzda 1985
Whitaker 1972
Patterson and Sebens1989
Patterson and Sebens 1989
Respiration scaled with a larger exponent than those seen in engineering studies on
(W. S. Price pers. comm.). Another strong
inanimate objects, but was similar to ex- possibility is that the complex geometry of the coral surface combined with the mor-
ponents found for other cnidarians without symbionts (Table 2). Why these organisms
phology of the entire colony may result in the Large value for c. Studies of the effects
do better than predicted by available theory of non-circular geometries on heat transfer is unknown. The role of cilia in disrupting in cylinders showed large variation in c with the laminar sublayer in cnidarians is a dis- shape; ellipsoidal cross-sections showed the tinct possibility that is under investigation highest value with c = 0.804 (Jakob 1949).

946 Patterson et al.
The zooxanthellae are found only in the gastrodermal layer and are surrounded by coral tissue that is producing CO,. The CO, equilibrates in favor of HC03- very quickly. We expected less sensitivity to flow during maximal rates of photosynthesis, because some C needed for photosynthesis is locally produced by the coral. This prediction is supported by our a-Re data. Muscatine et al. (1989) used a stable isotope technique and found that C produced internally is con- sumed as quickly as it is produced in the corals during maximal rates of photosyn- thesis. Their findings imply that a diffu- sional boundary layer for HCO,- would arise in the vicinity of the colony. Paradoxically, in studies with well-stirred (but not unidi- rectional) chambers, Burris et al. (1983) found that the corals Seriatopora hystrix and Stylophorapistillata generally were not lim- ited by C availability during light satura- tion. But another laboratory study that used corals kept in stirred and unstirred beakers demonstrated that calcification rate, maxi- mal photosynthetic rate, and respiration rate were sensitive to flow (Dennison and Barnes 1988). We suggest that experiments altering both flow and C availability should be per- formed with corals to resolve these discrep- ancies. We predict that increased C avail- ability above the saturation irradiance should result in increased production for a coral exposed to a unidirectional flow of the Re range used in this study.
Oxygen microelectrode measurements of the oxygen diffusional boundary layers around respiring corals indicate thickness on the order of 1 03-1 O4 pm (Patterson 199 1) and give direct evidence for diffusion lim- itation by boundary-layer depletion. The whole-organism experiments reported in this study support the notions that the thick- ness of these depleted layers is flow sensitive and that the diffusional boundary layer is an appreciable component of the total dif- fusion path into coral tissue.
Caveats for convective respirometry- How different is flow experienced by corals in the experimental chambers compared to that in the field? The turbulence length scales in the flume are smaller than those encountered near corals on the reef, by virtue of the small size of the chambers and presence of flow
straighteners. Flow in the chambers is uni- directional; flow on the shallower parts of the reef is frequently bidirectional from the influence of passing waves, Given the con- straints of measuring changes in gas con- centration in a respirometry chamber over a reasonable period of time, it is not possible to match the scaling of coral head height to flow that occurs in a fully developed, uni- form, steady flow or wave-current flow found on a coral reef. Design of the chamber de- mands a tradeoff between realistic flow and small volume relative to the coral colony. Our design allows unidirectional flow over sessile marine invertebrates at Re compa- rable to field conditions.
We concur with D’Elia (1978) that field and lab respirometry work with aquatic in- vertebrates should characterize the flow re- gime of the respirometry chamber. Some previous flow respirometers were either not closed circuits (Boynton et al. 198 1) or used flow adequate for chamber and probe mix- ing but not for realistic simulation of the unidirectional environmental currents found in marine environments (e.g. Scharf et al. 198 1; Newrkla 1983). Entomologists work- ing with aquatic insects have addressed the design of flow respirometers (Eriksen and Feldmeth 1967), but the impeller magnet they advocated would not provide strong enough flow to properly scale the Reynolds number for flows around small coral heads.
A drawback to all recirculating flow res- pirometers is that they cannot mimic the fully rough-turbulent, wave-driven flow seen in the heterogeneous benthic boundary lay- er found on a coral reef. Steadier flows (from tidal currents or broken waves on the la- goonal side of a reef crest) are sometimes found over corals, and for~these conditions our experiments are directly applicable in quantifying metabolic response of corals to moving water. Another potential source of error is that organisms of different sizes may alter flow patterns experienced in a given chamber, with attendant effects on gas ex- change. In our design there is some flow blockage by the coral heads. Blockage in a closed-flow system results in altered pat- terns of flow, specifically local acceleration of the flow over the coral specimen in ac- cordance with the principle of continuity.

Coral metabolism and jlow 947
Blockage can lead to changes in the pressure distribution around the colony, which in turn can affect the velocity distribution in the boundary layer of the coral head. Blockage effects have been investigated in transfer studies with cylinders in water flows by Zu- kauskas and Ziugzda ( 19 8 5); their blockage factor was defined as the ratio of object height to channel height. Re, blockage fac- tor, and freestream turbulence intensity have all been found to influence the magnitude - of Sh. In general, blockage factors compa- rable to those used in this study (-0.5) can increase the absolute transfer relative to un- blocked flows by up to 25% (Zukauskas and Ziugzda 1985). The form of the allometric relationship between Sh and Re is not in- fluenced to any appreciable degree, how- ever, by the blockage.
Importance of jlow-modulated metabo- lism to productivity calculations -Because of the inverse relationship between bound- ary-layer thickness and flow speed, flow- modulated gas exchange will be especially important for corals living in semicryptic habitats where the flow regime is relatively stagnant. This phenomenon may also be important to corals living in higher energy flow regimes where part of the gas-exchange structure is protected from flow, e.g. many branching reef corals often experience great- ly reduced flow toward the center of the colony (Chamberlain and Graus 1975).
Corals that are light adapted are capable of translocating C in excess of that required by the colony for maintenance respiration (Edmunds and Davies 1986). This contri- bution of translocated C to animal main- tenance respiration (CZAR) can be as large as 143% in light-adapted corals (S. pistil- lata, Red Sea-Muscatine et al. 1984). Shade-adapted members ofthis species don’t meet their energy requirements (CZAR = 58%). Presumably the deficit is made up by feeding on zooplankton at night. Since water motion is now known to increase both res- piration and rates of net primary produc- tion, what effect might exposure to different flow regimes have for calculations of ratios of photosynthesis to respiration and hence the local productivity of the reef!
Increased flow does not appear to strongly affect the net production in this coral species
over a die1 cycle. The P, : R, ratio is 19% lower in corals exposed to lower flow. In- creased water motion enhances respiration and primary production differentially; the benefits of increased water motion in allow- ing higher rates of photosynthesis (and hence greater gross production) under conditions of maximal irradiance are offset to a degree by the increased costs of animal mainte- nance metabolism; the overall effect is to increase production on an area1 basis on the reef We conclude that water motion should be critically examined in future studies of coral physiology because apparently it can mocljfy the metabolic rates of corals to a degree previously associated only with changes in light intensity.
Refirences BERG, H. C. 1983. Random walks in biology. Prince-
1 on. BOYPJTON, W. R., W. M. KEMP, V. G. OSBORNE, K. R.
KAUMEYER, AND M. C. JENKINS. 198 1. Influence of water circulation rate on in situ measurements of bentbic community respiration. Mar. Biol. 65: 185-190.
BROIXEY, R. S., AND H. C. HERSEY. 1988. Transport phenomena. McGraw-Hill.
BURILIS, J. E., J. W. PORTER, AND W. A. LAING. 1983. Effects of carbon dioxide concentration on coral photosynthesis. Mar. Biol. 75: 113-l 16.
CHAIABERLAIN, J. A., JR., AND R. R. GRAUS. 1975. Water flow and hydromechanical adaptations of branched reef corals. Bull. Mar. Sci. 25: 112-125.
DELIA, C. F. 1978. Dissolved nitrogen, phosphorus, and organic carbon, p. 495-497. Zn D. R. Stoddart and R. E. Johannes [eds.], Coral reefs: Research methods. UNESCO.
DENNISON, W. C., AND D. J. BARNES. 1988. Effect of water motion on coral photosynthesis and calci- lication. J. Exp. Mar. Biol. Ecol. 115: 67-77.
DENNY, M. W. 1988. Biology and the mechanics of the wave-swept environment. Princeton.
EDMIJNDS, P. J., AND P. S. DAVIES. 1986. An energy budget for Poritesporites (Scleractinia). Mar. Biol. !)2: 339-347.
ERIEJEN, C. H., AND C. R. FELDMETH. 1967. A water- current rcspirometer. Hydrobiologia 29: 495-504.
HOLMAN, J. P. 1986. Heat transfer, 6th ed. McGraw- Hill.
JAKOB, M. 1949. Heat transfer. V. 1. Wiley. JASSE~Y, A. D., AND T. PLATT. 1976. Mathematical
formulation of the relationship between photo- synthesis and light for phytoplankton. Limnol. Oceanogr. 21: 540-547.
JEFFXLEY, S. W., AND G. F. HUMPHREY. 1975. New spectrophotometric equations for determining chlorophylls a, b, cI and c2 in higher plants, algae, and natural phytoplankton. Biochem. Physiol. Pflanzen 167: 19 l-1 94.

948 Patterson et al.
JOKIEI~, P. L. 1978. Effects of water motion on reef modulates gas exchange in cnidarians. Proc. Natl. corals. J. Exp. Mar. Biol. Ecol. 35: 87-97. Acad. Sci. 86: 8833-8836.
JUMARS, P. A., AND A. R. M. NOWELL. 1984. Fluid RIBER. H. H.. AND R. G. WETZEL. 1987. Boundarv- and sediment dynamic effects on marine benthic layer and internal diffusion effects on phosphor& community structure. Am. Zool. 24: 45-55. fluxes in lake periphyton. Limnol. Oceanogr. 32:
KNIGHT, A. W., AND A. R. GAUF~N. 1963. The effect 1181-l 194. of water flow, temperature, and oxygen concen- SAMMARCO, P. W., AND J. C. ANDREWS. 1988. Lo- tration on the Plecoptera nymph, A%meuria pa- calized dispersal and recruitment in Great Barrier c#ica Banks. Proc. Utah Acad. Sci. 40: 175-184. Reef corals: The Helix experiment. Science 239:
KOEHL, M. A. R., AND R. ALBERTE. 1988. Flow, flap- 1422-1424. ping, and photosynthesis of Nereocystis luetkeana: SCHARF, E.-V., J.-A. VON OERTZEN, W. SCHARF, AND A functional comparison ofundulate and flat blade A. STAVE. I98 1. A microflow respirometer for morphologies. Mar. Biol. 99: 435-444.
LOBBAN, C. S., P. J. HARRISON, AND M. J. DUNCAN. 1985. The physiological ecology of seaweeds. Cambridge.
MCCLOSKEY, L. R., D. S. WETHEY, AND J. W. PORTER. 1978. Measurement and interpretation of pho- tosynthesis and respiration in reef corals, p. 379- 396. In D. R. Stoddart and R. E. Johannes [eds.], Coral reefs: Research methods. UNESCO.
MARSH, J. A., JR. 1970. Primary productivity of reef- building calcareous red algae. Ecology 51: 255- 263.
-, AND S. V. SMITH. 1978. Productivity mea-
MUSCATME, L., P. G. FALKOWSKI, J. W. PORTER, AND
surements of coral reefs in flowing water, p. 36 l-
Z. DUBINSKY.
378. In D. R. Stoddart and R. E. Johannes [eds.], Coral reefs: Research methods. UNESCO.
1984. Fate of photosynthetic fixed carbon in light- and shade-adanted colonies of the
measuring the oxygen consumption of small aquatic ;pms. Int. Rev. Gesamten Hydrobiol. 66: 895-
SCHLICHTING, H. 1979. Boundary layer theory. Mc- Graw-Hill.
Symp. (Miami)l: 477-482.
SEBENS, K. P. 1987. Coelenterate energetics, p. 55-
WESTLAKE, D. F. 1967. Some effects of low-velocity
120. In F. J. Vemberg and T. J. Pandian [eds.], Animal energetics. Academic.
currents on the metabolism of aquatic macro-
SHICK, J. M. 1990. Diffusion limitation and hyper- oxic enhancement of oxygen consumption in zooanthellate sea anemones, zoanthids, and cor- als. Biol. Bull. 179: 148-l 58.
VOGEL, S. 198 1. Life in moving fluids: The physical biology of flow. Princeton.
VOSBURGH, F. 1977. The response to drag of the reef coral Acropora reticulata. Proc. 3rd Int. Coral Reef
symbiotic c&al Stylophorapisiillata. Proc. R. Sot. phytes. J. Exp. Bot. 18: 187-205. Lond. Ser. B 222: 181-202. WHEELER, W. N. 1980. Effect ofboundary layer trans-
-. L. R. MCCLOSKEY. AND R. E. MARLAN. 1981. port on the fixation of carbon by the kelp Mac- Estimating the daily contribution of carbon from zooxanthellae to coral animal respiration. Limnol. Oceanogr. 26: 60 l-6 11.
-, J. W. PORTER, AND I. R. KAPLAN. 1989. Re- source partitioning by reef corals as determined from stable isotope composition. 1. a’C of zoo- xanthellae and animal tissue vs. depth. Mar. Biol. 100: 185-193.
NEWRKLA, P. 1983. Methods for measuring benthic community respiration rates, p. 274-284. In E. Gnaiger and H. Forstner [eds.], Polarographic ox- ygen sensors. Springer.
PA~IXRSON, M. R. 199 1. A chemical engineering view of cnidarian symbioses. Am. Zool. In press.
p, AND K. P. SEBENS. 1989. Forced convection
rocystis pyrifera. Mar. Biol. 56: 103- 110. WHITAKER, S. 1972. Forced convection heat transfer
correlations for flow in pipes, past flat plates, single cylinders, single spheres, and flow in packed beds and tube bundles. AIChE J. 18: 36 l-37 1.
-. 1983. Fundamental principles of heat trans- fer. Krieger.
WHITE, F. M. 1988. Heat and mass transfer. Addison- Wesley.
ZUKAUSKAS, A., AND J. ZIUGZDA. 1985. Heat transfer of a cylinder in crossflow. Hemisphere.
Submitted: 29 June 1989 Accepted: 11 February 1991
Revised: 20 May 1991
Copyright © 2022 FDOKUMEN