
Predicting global habitat suitability for stony corals on seamounts
18
ORIGINAL ARTICLE Predicting global habitat suitability for stony corals on seamounts Derek P. Tittensor 1,2 *, Amy R. Baco 3 , Paul E. Brewin 4 , Malcolm R. Clark 5 , Mireille Consalvey 5 , Jason Hall-Spencer 6 , Ashley A. Rowden 5 , Thomas Schlacher 7 , Karen I. Stocks 4 and Alex D. Rogers 2 1 Department of Biology, Dalhousie University, Halifax, NS, Canada, 2 Institute of Zoology, Zoological Society of London, Regent’s Park, London, UK, 3 Department of Oceanography, Florida State University, Tallahassee, FL, USA, 4 San Diego Supercomputer Center, University of California San Diego, La Jolla, CA, USA, 5 National Institute of Water and Atmospheric Research, Kilbirnie, Wellington, New Zealand, 6 Marine Institute, University of Plymouth, Plymouth, UK and 7 Faculty of Science, Health and Education, University of the Sunshine Coast, Maroochydore, Qld, Australia *Correspondence: Derek P. Tittensor, Department of Biology, Dalhousie University, Life Sciences Centre, 1355 Oxford Street, Halifax, NS B3H 4J1, Canada. E-mail: [email protected] ABSTRACT Aim Globally, species distribution patterns in the deep sea are poorly resolved, with spatial coverage being sparse for most taxa and true absence data missing. Increasing human impacts on deep-sea ecosystems mean that reaching a better understanding of such patterns is becoming more urgent. Cold-water stony corals (Order Scleractinia) form structurally complex habitats (dense thickets or reefs) that can support a diversity of other associated fauna. Despite their widely accepted ecological importance, records of scleractinian corals on seamounts are patchy and simply not available for most of the global ocean. The objective of this paper is to model the global distribution of suitable habitat for stony corals on seamounts. Location Seamounts worldwide. Methods We compiled a database containing all accessible records of scleractinian corals on seamounts. Two modelling approaches developed for presence-only data were used to predict global habitat suitability for seamount scleractinians: maximum entropy modelling (Maxent) and environmental niche factor analysis (ENFA). We generated habitat-suitability maps and used a cross- validation process with a threshold-independent metric to evaluate the performance of the models. Results Both models performed well in cross-validation, although the Maxent method consistently outperformed ENFA. Highly suitable habitat for seamount stony corals was predicted to occur at most modelled depths in the North Atlantic, and in a circumglobal strip in the Southern Hemisphere between 20° and 50° S and shallower than around 1500 m. Seamount summits in most other regions appeared much less likely to provide suitable habitat, except for small near-surface patches. The patterns of habitat suitability largely reflect current biogeographical knowledge. Environmental variables positively associated with high predicted habitat suitability included the aragonite saturation state, and oxygen saturation and concentration. By contrast, low levels of dissolved inorganic carbon, nitrate, phosphate and silicate were associated with high predicted suitability. High correlation among variables made assessing individual drivers difficult. Main conclusions Our models predict environmental conditions likely to play a role in determining large-scale scleractinian coral distributions on seamounts, and provide a baseline scenario on a global scale. These results present a first- order hypothesis that can be tested by further sampling. Given the high vulnerability of cold-water corals to human impacts, such predictions are crucial tools in developing worldwide conservation and management strategies for seamount ecosystems. Keywords Conservation biogeography, distribution, ENFA, habitat suitability, maximum entropy, modelling, niche, Scleractinia, seamount, stony coral. Journal of Biogeography (J. Biogeogr.) (2009) 36, 1111–1128 ª 2009 The Authors www.blackwellpublishing.com/jbi 1111 Journal compilation ª 2009 Blackwell Publishing Ltd doi:10.1111/j.1365-2699.2008.02062.x
Transcript of Predicting global habitat suitability for stony corals on seamounts

ORIGINALARTICLE
Predicting global habitat suitability forstony corals on seamounts
Derek P. Tittensor1,2*, Amy R. Baco3, Paul E. Brewin4, Malcolm R. Clark5,
Mireille Consalvey5, Jason Hall-Spencer6, Ashley A. Rowden5, Thomas
Schlacher7, Karen I. Stocks4 and Alex D. Rogers2
1Department of Biology, Dalhousie University,
Halifax, NS, Canada, 2Institute of Zoology,
Zoological Society of London, Regent’s Park,
London, UK, 3Department of Oceanography,
Florida State University, Tallahassee, FL, USA,4San Diego Supercomputer Center, University
of California San Diego, La Jolla, CA, USA,5National Institute of Water and Atmospheric
Research, Kilbirnie, Wellington, New Zealand,6Marine Institute, University of Plymouth,
Plymouth, UK and 7Faculty of Science, Health
and Education, University of the Sunshine
Coast, Maroochydore, Qld, Australia
*Correspondence: Derek P. Tittensor,
Department of Biology, Dalhousie University,
Life Sciences Centre, 1355 Oxford Street,
Halifax, NS B3H 4J1, Canada.
E-mail: [email protected]
ABSTRACT
Aim Globally, species distribution patterns in the deep sea are poorly resolved, with
spatial coverage being sparse for most taxa and true absence data missing. Increasing
human impacts on deep-sea ecosystems mean that reaching a better understanding
of such patterns is becoming more urgent. Cold-water stony corals (Order
Scleractinia) form structurally complex habitats (dense thickets or reefs) that can
support a diversity of other associated fauna. Despite their widely accepted
ecological importance, records of scleractinian corals on seamounts are patchy and
simply not available for most of the global ocean. The objective of this paper is to
model the global distribution of suitable habitat for stony corals on seamounts.
Location Seamounts worldwide.
Methods We compiled a database containing all accessible records of
scleractinian corals on seamounts. Two modelling approaches developed for
presence-only data were used to predict global habitat suitability for seamount
scleractinians: maximum entropy modelling (Maxent) and environmental niche
factor analysis (ENFA). We generated habitat-suitability maps and used a cross-
validation process with a threshold-independent metric to evaluate the
performance of the models.
Results Both models performed well in cross-validation, although the Maxent
method consistently outperformed ENFA. Highly suitable habitat for seamount
stony corals was predicted to occur at most modelled depths in the North Atlantic,
and in a circumglobal strip in the Southern Hemisphere between 20� and 50� S and
shallower than around 1500 m. Seamount summits in most other regions appeared
much less likely to provide suitable habitat, except for small near-surface patches.
The patterns of habitat suitability largely reflect current biogeographical knowledge.
Environmental variables positively associated with high predicted habitat suitability
included the aragonite saturation state, and oxygen saturation and concentration.
By contrast, low levels of dissolved inorganic carbon, nitrate, phosphate and silicate
were associated with high predicted suitability. High correlation among variables
made assessing individual drivers difficult.
Main conclusions Our models predict environmental conditions likely to play
a role in determining large-scale scleractinian coral distributions on seamounts,
and provide a baseline scenario on a global scale. These results present a first-
order hypothesis that can be tested by further sampling. Given the high
vulnerability of cold-water corals to human impacts, such predictions are crucial
tools in developing worldwide conservation and management strategies for
seamount ecosystems.
Keywords
Conservation biogeography, distribution, ENFA, habitat suitability, maximum
entropy, modelling, niche, Scleractinia, seamount, stony coral.
Journal of Biogeography (J. Biogeogr.) (2009) 36, 1111–1128
ª 2009 The Authors www.blackwellpublishing.com/jbi 1111Journal compilation ª 2009 Blackwell Publishing Ltd doi:10.1111/j.1365-2699.2008.02062.x

INTRODUCTION
The oceans provide more than 90% of the habitable area for
life on Earth, and 88% beyond the continental shelves are
deeper than 1000 m (Gjerde, 2006). Most of the current
knowledge concerning marine life is confined to coastal
ecosystems, the continental shelves and shallow, sunlit waters
(< 200 m depth). The deep sea remains the most poorly
sampled ecosystem on the planet (Glover & Smith, 2003), and
only an estimated 0.0001% of the deep-sea floor has been
subject to scientific investigation (Gjerde, 2006). It is therefore
not surprising that patterns of benthic diversity and distribu-
tion are not well resolved for deep-sea species (Gage, 2004),
particularly at the global scale (but see Rex et al., 2006, for
a global analysis of abundance, biomass and body-size).
Consequently, in comparison to the terrestrial realm,
biogeographical patterns for deep-sea benthic marine taxa
and the reasons for such patterns are poorly understood (but
see Harley et al., 2003), with even regional analyses of depth
and latitudinal ranges scarce and limited to a few taxonomic
groups (e.g. Macpherson & Duarte, 1994; Macpherson, 2003;
Cartes & Carrasson, 2004). A general trend appears to be that
eurybathyal species (wide vertical ranges) tend to have wide
geographic ranges (Vinogradova, 1997), whereas stenobathyal
species (narrow vertical ranges) tend to have much narrower
geographic ranges, and particularly occur in the abyssal zone
(> 3000 m depth; Vinogradova, 1997). Why these groups
differ in terms of vertical distribution and horizontal range is
not known. One reason may be the increasing large-scale
fragmentation of benthic habitat with depth that occurs
because physical barriers, such as mid-ocean ridges, isolate the
seabed into separate basins. Life histories may also play a
significant role, as some taxa with low dispersal capabilities
appear to have smaller geographic ranges and a relatively high
level of endemism on a regional scale (e.g. Brandt et al., 2007).
Although sampling has been limited, analyses of archived
(e.g. Rex et al., 2005) and recently collected (e.g. Brandt et al.,
2007) data, often gathered with great cost and effort, continue
to provide insights into biogeographical patterns for deep-sea
fauna. Given that this region is subject to increasing human
pressures with, for example, fishing now taking place to depths
of 2000 m (Sissenwine & Mace, 2007), and climate change
predicted to impact upon deep-sea communities such as cold-
water coral reefs (Guinotte et al., 2006), it is becoming
increasingly important to reach an understanding of the
distribution of deep-sea species.
Because the spatial coverage of deep-sea records is very
sparse, statistical modelling provides a useful tool with which
to synthesize available data and give generality to our
understanding of the ecology of such remote environments.
Methods to model the distribution of species through relating
occurrence data to environmental variables are increasingly
being used in terrestrial biogeographical studies (e.g. see
Araujo & Guisan, 2006) and occasionally in the marine
environment (Clark et al., 2006; Bryan & Metaxas, 2007;
Davies et al., 2008), although much less frequently. In this
paper we use predictive modelling to explore the environmen-
tal variables that may limit the distribution of stony corals
(Phylum Cnidaria; Class Anthozoa; Order Scleractinia) on
seamounts, and to locate the areas that are most likely to
provide suitable habitat.
Seamounts are widespread and prominent topographic
features of the ocean floor. These undersea mountains are
generally conical or conical with a truncated top, and of
volcanic origin (Rogers, 1994; Wessel, 2007). Because mapping
of the deep-sea floor is incomplete, the actual number of
seamounts in the oceans is unknown, but there may be on the
order of 100,000 with an elevation > 1000 m (Wessel, 2001).
Seamounts provide an environment frequently characterized
by enhanced currents (White et al., 2007) and, because of their
predominantly volcanic origin, by the presence of rocky
substrata (exceptions include the small minority of seamounts
formed by tectonic uplift and flat-topped eroded seamounts
on which extensive sedimentation has occurred) (Wessel,
2007).
These conditions favour the development of emergent
epifaunal assemblages dominated by sessile suspension feeders,
such as sponges and corals (Rogers, 1994; Koslow et al., 2001;
Rogers et al., 2007; Samadi et al., 2007), and, as with other
deep-sea communities, such assemblages often vary with depth
(O’Hara, 2007; Rogers et al., 2007). The benthos of seamounts
has been reported to be diverse, with a high proportion of
endemic species (Parin et al., 1997; Richer de Forges et al.,
2000), although this may not be the case for all taxa and
regions (Samadi et al., 2006; Hall-Spencer et al., 2007; O’Hara,
2007). In some cases, large pelagic predators form aggregations
to exploit the high availability of food resources sometimes
associated with these features (Worm et al., 2003; Tynan et al.,
2005; Holland & Grubbs, 2007). Given the lack of consistency
in patterns, and the low sampling effort in both seamount and
non-seamount habitats for many regions, the ecological
paradigms that have been associated with the fauna of
seamounts have recently been questioned and further study
has been called for (McClain, 2007).
Reefs formed by cold-water stony corals are common
features on seamounts and the slopes of continental margins
and islands (Roberts et al., 2006). These reefs may rival
shallow-water tropical reefs in the diversity of some animal
groups associated with the corals (Rogers, 1999). The number
of species associated directly with cold-water corals can be high
(e.g. Buhl-Mortensen & Mortensen, 2005; Roberts et al., 2006),
and a comparison between a reef habitat and an adjacent deep-
sea habitat revealed that reefs can support faunal assemblages
of greater diversity (Henry & Roberts, 2007). The structurally
complex habitat formed by the corals is thought to promote
such diversity (Freiwald et al., 2002), although the functional
relationships between corals and their associated invertebrate
taxa are not yet fully resolved (McClain, 2007; O’Hara et al.,
2008; Rogers et al., 2008).
Cold-water corals are slow-growing (e.g. Andrews et al.,
2005; Schroder-Ritzau et al., 2005; Roark et al., 2006) and
vulnerable to a range of human threats, including bottom
D. P. Tittensor et al.
1112 Journal of Biogeography 36, 1111–1128ª 2009 The Authors. Journal compilation ª 2009 Blackwell Publishing Ltd

trawling (e.g. Clark & O’Driscoll, 2003; Freiwald et al., 2004;
Clark & Koslow, 2007), other forms of bottom-contact fishing
(Stone, 2006; Edinger et al., 2007), hydrocarbon drilling (on
continental margins; Rogers, 1999), seabed mining (Rogers
et al., 2008) and ocean acidification (Guinotte et al., 2006).
Especially on the high seas, but also in national waters, deep-
sea bottom fisheries target fish and shellfish stocks associated
with seamounts (Clark et al., 2007; Watson et al., 2007),
resulting in intense impacts on the benthic communities of
these features, including coral ecosystems (Clark & Koslow,
2007). Impacts on cold-water corals, both documented and
predicted, are serious enough to warrant global efforts to
conserve these unique and fragile ecosystems (e.g. UN General
Assembly, 2006). However, any impact assessment and the
development of conservation measures require data on the
occurrence of corals on seamounts. Because these are available
for only a very small fraction of the world’s seamounts, our
study was specifically designed to redress this critical infor-
mation gap. We focus our efforts at a broad oceanic scale,
whilst noting that the factors responsible for distributions may
be markedly different at the scale of an individual seamount.
To predict the distribution of corals where presence data are
lacking, we parameterized two habitat-suitability models with
a recently compiled database of stony coral samples from
seamounts (Rogers et al., 2007) and with global oceanic
environmental data. Both modelling methods were developed
to work with presence-only data (Hirzel et al., 2002; Phillips
et al., 2006), that is, where true absence data are either
unavailable or unreliable, as is the case for much of the deep
sea. We then used the model output to construct maps of
predicted habitat suitability for stony corals on seamounts.
MATERIALS AND METHODS
Seamount data
We used the most widely accepted definition of a ‘large’
seamount as having a vertical height > 1000 m above the
surrounding sea-floor (Wessel, 2001). Seamount locations
were obtained from the bathymetric analysis of Kitchingman &
Lai (2004), who identified 14,287 probable large seamounts
globally. Fig. 1 shows the locations of seamounts predicted
by this analysis, derived from a global bathymetry data set
with a 2-min resolution. This analysis certainly does not
contain every large seamount (see Wessel, 2001), as evidenced
by the fact that the coral database we compiled has records
from seamounts that were not detected. Thus we needed to
make predictions for seamounts that exist but are not located
by the method of Kitchingman & Lai (2004). To resolve this,
we modelled habitat suitability for the entire global ocean up
to 2500 m in depth, but restricted coral presence data to
seamounts only (i.e. we do not include coral records from
other deep-sea habitats). In this way, we could assess global
habitat suitability for those seamounts yet to be discovered,
by predicting general habitat suitability for seamounts at each
depth layer. We then mapped these depth layers to the
summits of the c. 14,000 predicted seamounts (Kitchingman &
Lai, 2004).
Coral data
A database containing publicly accessible geo-referenced
records of stony coral samples from seamounts has recently
Figure 1 Potential large (> 1000 m height) seamount locations (c. 14,000) predicted from an analysis of global digital elevation data by
Kitchingman & Lai (2004), Behrmann projection. Colours indicate summit depth in metres.
Global stony coral habitat on seamounts
Journal of Biogeography 36, 1111–1128 1113ª 2009 The Authors. Journal compilation ª 2009 Blackwell Publishing Ltd

been compiled (Rogers et al., 2007; database available through
SeamountsOnline at http://seamounts.sdsc.edu/). Data sources
included the primary scientific literature, online databases,
museum databases, and records held by individual scientists.
The geographic distribution of available coral records from
seamounts is very uneven on a global scale (Fig. 2). Most
samples come from the Southwest Pacific and the Northeast
Atlantic, whereas only a few records are available for the Indian
Ocean. In total, we compiled 1880 scleractinian records, of
which 1651 contained latitude, longitude and depth informa-
tion. Records of fossilized corals were excluded. For corals
collected in trawls that recorded only the depth range over
which samples were collected we used the midpoint of the
reported range, and removed samples with a large depth range
uncertainty (> 500 m, 11 records). We binned the records of
Scleractinia to the equal-area grid described below. The
maximum depth of the analysis was 2500 m, as there were too
few records (< 10) at greater depth to parameterize the model
beyond this point effectively; similarly, we used 50 m as a cut-
off for the boundary between warm-water and cold-water corals
(Cairns, 2007). Duplicate records were removed, providing a
binary record of coral presence for each cell. A total of 433 grid
cells contained stony coral presence records on seamounts.
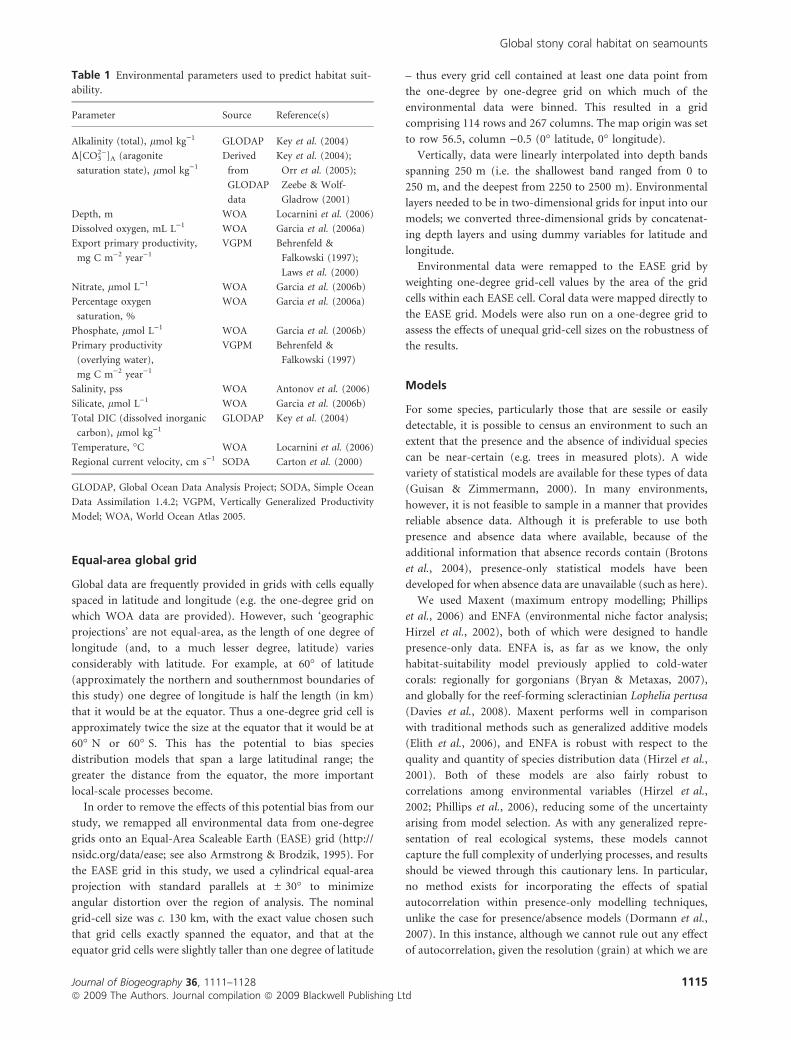
Environmental data
Selecting the environmental variables likely to be important in
determining the distribution of the taxa under study is an
important component of the species distribution modelling
process (Guisan & Zimmermann, 2000). Our modelling
procedure involved selecting environmental parameters for
their potential importance in driving seamount coral distri-
butions (determined through a literature review and expert
opinion) at the grain of our study. We combined physical,
biological and chemical oceanographic data from multiple
sources (Table 1). All variables were remapped from a one-
degree grid to the equal-area grid described below. The grid
resolution was determined largely by the resolution of the
environmental data; both World Ocean Atlas (WOA) and
Global Ocean Data Analysis Project (GLODAP) data were
available at a one-degree resolution. Where possible, data were
selected from the 1990s for maximum congruence with the
GLODAP environmental data. Physical data and primary
productivity model output were all long-term annual means.
The World Ocean Atlas 2005 data (http://www.nodc.noaa.gov/
OC5/WOA05/pr_woa05.html) used in our models were com-
posite annual objectively analysed means. GLODAP gridded
data (Key et al., 2004) were derived mostly from 1990s cruises.
VGPM (Vertically Generalized Productivity Model) outputs
(Behrenfeld & Falkowski, 1997) were depth-integrated primary
productivity values corrected for cloudiness, derived from
chlorophyll data collected between 1977 and 1982. SODA
(Simple Ocean Data Analysis) current velocities (Carton et al.,
2000) were the grand mean of the annual means for the period
1990–99, using the 1.4.2 version of the model. The aragonite
saturation state was calculated using GLODAP data and
following the D½CO2�3 �A method of Orr et al. (2005), with
equations following Zeebe & Wolf-Gladrow (2001). Positive
D½CO2�3 �A values indicate supersaturation; negative values,
undersaturation. Depth was included as a parameter not
because it is important per se, but because it may correlate with
unmeasured variables.
Figure 2 Locations of Scleractinia coral samples from seamounts, Behrmann projection. Colours indicate depth in metres.
D. P. Tittensor et al.
1114 Journal of Biogeography 36, 1111–1128ª 2009 The Authors. Journal compilation ª 2009 Blackwell Publishing Ltd
Equal-area global grid
Global data are frequently provided in grids with cells equally
spaced in latitude and longitude (e.g. the one-degree grid on
which WOA data are provided). However, such ‘geographic
projections’ are not equal-area, as the length of one degree of
longitude (and, to a much lesser degree, latitude) varies
considerably with latitude. For example, at 60� of latitude
(approximately the northern and southernmost boundaries of
this study) one degree of longitude is half the length (in km)
that it would be at the equator. Thus a one-degree grid cell is
approximately twice the size at the equator that it would be at
60� N or 60� S. This has the potential to bias species
distribution models that span a large latitudinal range; the
greater the distance from the equator, the more important
local-scale processes become.
In order to remove the effects of this potential bias from our
study, we remapped all environmental data from one-degree
grids onto an Equal-Area Scaleable Earth (EASE) grid (http://
nsidc.org/data/ease; see also Armstrong & Brodzik, 1995). For
the EASE grid in this study, we used a cylindrical equal-area
projection with standard parallels at ± 30� to minimize
angular distortion over the region of analysis. The nominal
grid-cell size was c. 130 km, with the exact value chosen such
that grid cells exactly spanned the equator, and that at the
equator grid cells were slightly taller than one degree of latitude
– thus every grid cell contained at least one data point from
the one-degree by one-degree grid on which much of the
environmental data were binned. This resulted in a grid
comprising 114 rows and 267 columns. The map origin was set
to row 56.5, column )0.5 (0� latitude, 0� longitude).
Vertically, data were linearly interpolated into depth bands
spanning 250 m (i.e. the shallowest band ranged from 0 to
250 m, and the deepest from 2250 to 2500 m). Environmental
layers needed to be in two-dimensional grids for input into our
models; we converted three-dimensional grids by concatenat-
ing depth layers and using dummy variables for latitude and
longitude.
Environmental data were remapped to the EASE grid by
weighting one-degree grid-cell values by the area of the grid
cells within each EASE cell. Coral data were mapped directly to
the EASE grid. Models were also run on a one-degree grid to
assess the effects of unequal grid-cell sizes on the robustness of
the results.
Models
For some species, particularly those that are sessile or easily
detectable, it is possible to census an environment to such an
extent that the presence and the absence of individual species
can be near-certain (e.g. trees in measured plots). A wide
variety of statistical models are available for these types of data
(Guisan & Zimmermann, 2000). In many environments,
however, it is not feasible to sample in a manner that provides
reliable absence data. Although it is preferable to use both
presence and absence data where available, because of the
additional information that absence records contain (Brotons
et al., 2004), presence-only statistical models have been
developed for when absence data are unavailable (such as here).
We used Maxent (maximum entropy modelling; Phillips
et al., 2006) and ENFA (environmental niche factor analysis;
Hirzel et al., 2002), both of which were designed to handle
presence-only data. ENFA is, as far as we know, the only
habitat-suitability model previously applied to cold-water
corals: regionally for gorgonians (Bryan & Metaxas, 2007),
and globally for the reef-forming scleractinian Lophelia pertusa
(Davies et al., 2008). Maxent performs well in comparison
with traditional methods such as generalized additive models
(Elith et al., 2006), and ENFA is robust with respect to the
quality and quantity of species distribution data (Hirzel et al.,
2001). Both of these models are also fairly robust to
correlations among environmental variables (Hirzel et al.,
2002; Phillips et al., 2006), reducing some of the uncertainty
arising from model selection. As with any generalized repre-
sentation of real ecological systems, these models cannot
capture the full complexity of underlying processes, and results
should be viewed through this cautionary lens. In particular,
no method exists for incorporating the effects of spatial
autocorrelation within presence-only modelling techniques,
unlike the case for presence/absence models (Dormann et al.,
2007). In this instance, although we cannot rule out any effect
of autocorrelation, given the resolution (grain) at which we are
Table 1 Environmental parameters used to predict habitat suit-
ability.
Parameter Source Reference(s)
Alkalinity (total), lmol kg)1 GLODAP Key et al. (2004)
D[CO32)]A (aragonite
saturation state), lmol kg)1
Derived
from
GLODAP
data
Key et al. (2004);
Orr et al. (2005);
Zeebe & Wolf-
Gladrow (2001)
Depth, m WOA Locarnini et al. (2006)
Dissolved oxygen, mL L)1 WOA Garcia et al. (2006a)
Export primary productivity,
mg C m)2 year)1
VGPM Behrenfeld &
Falkowski (1997);
Laws et al. (2000)
Nitrate, lmol L)1 WOA Garcia et al. (2006b)
Percentage oxygen
saturation, %
WOA Garcia et al. (2006a)
Phosphate, lmol L)1 WOA Garcia et al. (2006b)
Primary productivity
(overlying water),
mg C m)2 year)1
VGPM Behrenfeld &
Falkowski (1997)
Salinity, pss WOA Antonov et al. (2006)
Silicate, lmol L)1 WOA Garcia et al. (2006b)
Total DIC (dissolved inorganic
carbon), lmol kg)1
GLODAP Key et al. (2004)
Temperature, �C WOA Locarnini et al. (2006)
Regional current velocity, cm s)1 SODA Carton et al. (2000)
GLODAP, Global Ocean Data Analysis Project; SODA, Simple Ocean
Data Assimilation 1.4.2; VGPM, Vertically Generalized Productivity
Model; WOA, World Ocean Atlas 2005.
Global stony coral habitat on seamounts
Journal of Biogeography 36, 1111–1128 1115ª 2009 The Authors. Journal compilation ª 2009 Blackwell Publishing Ltd

working it is reasonable to assume spatial independence
between adjacent cells, and such effects are likely to be
minimal.
Maximum entropy modelling
Maximum entropy modelling (Phillips et al., 2006) is a
technique adopted from statistical mechanics. Given an
unknown probability distribution o (such as the distribution
of a species) over a finite set X (such as the cells of a study
area), we can approximate o with a probability distribution o.
The information-theoretic entropy (Shannon, 1948) of this
approximate distribution is defined as
HðoÞ ¼ �X
x2X
oðxÞ ln oðxÞ ð1Þ
In a general sense, the maximum entropy principle (Jaynes,
1957) suggests that the best approach to approximating an
unknown probability distribution is to maximize entropy,
subject to constraints (in this case, environmental data
associated with species presences) representing incomplete
information. A distribution with higher entropy is less
‘constrained’; the maximum entropy principle therefore
ensures that no unnecessary constraints are placed on o.
Algorithms guaranteed to converge to the maximum entropy
distribution have been developed (Dudık et al., 2004).
We used Maxent software version 3.21 (http://www.cs.
princeton.edu/~schapire/maxent) to fit the Maxent model,
using default model parameters (a convergence threshold of
10)5, a maximum iteration value of 1000 and automatic
regularization with a value of 10)4); these default settings have
been shown to achieve good performance (Phillips & Dudık,
2008). A jackknifing procedure was used to examine the
importance of each variable, by comparing the model with that
variable absent against that with it present. Habitat-suitability
maps were constructed by calculating a raw probability value
p(x) for each grid cell x, such that the total of all cell
probabilities summed to one. This value was then scaled
logistically using the equation c p(x)/(1 + c p(x)), where c is the
exponential of the entropy of the raw distribution, resulting in a
relative habitat-suitability value ranging from zero to one. The
logistic habitat-suitability values can be interpreted as an
estimate of the probability of presence under a similar level of
sampling effort as that used to obtain the known occurrence
data (Phillips & Dudık, 2008). All coral presence points were
used to construct habitat-suitability maps.
Environmental niche factor analysis
Environmental niche factor analysis (ENFA) is a niche-based
predictive habitat-suitability modelling technique for presence-
only data based on multivariate ordination (Hirzel et al.,
2002). The factors produced by the model are uncorrelated
and have biological significance. The first represents species
marginality (the absolute difference between the global mean
and the species mean in the multidimensional environmental
space) and the remainder specialization (the ratio of the
variance between the global distribution and the species
distribution). A marginality value near to or > 1 indicates
that a species requires habitat substantially different from the
background mean, and a specialization > 1 indicates tolerance
of a narrow range of environmental conditions (Hirzel et al.,
2002); however, both of these values depend on the reference
(background) environmental data used to construct the model.
The factors are ordered by decreasing amounts of variance
explained, except for the first factor, which explains all of the
marginality and some portion of the specialization. In contrast
to other ordination techniques, therefore, the first factor may
explain less of the variance than subsequent factors.
We used the geometric mean algorithm to calculate a
habitat-suitability index for each cell (Hirzel & Arlettaz, 2003).
The habitat-suitability maps were constructed using the
isopleth method following Hirzel et al. (2002) and using all
coral data. We used a broken-stick distribution to determine
the number of factors (nine) with which to construct habitat-
suitability maps. Habitat-suitability maps were indexed with a
range of 0–100, where higher values indicate more suitable
habitat. ENFA assumes that data are multinormal (but see
Hirzel et al., 2002) and that occurrence data span the
environmental range of the taxonomic group in question.
Prior to running the model, environmental data were
normalized using the Box-Cox transformation (Sokal & Rohlf,
1995). We used biomapper 4.0 (http://www.unil.ch/biomap-
per) and matlab 7.4 (http://www.mathworks.com) to run the
ENFA model.
Model evaluation
Although many methods exist to evaluate the predictive
capabilities of presence/absence models (Guisan & Zimmer-
mann, 2000), techniques to gauge the performance of
presence-only models are still being developed (Boyce et al.,
2002; Hirzel et al., 2006), because of the problems inherent in
discriminating models predicting blanket presences from those
that are more selective. Validation indices that have been
developed for such situations are often dependent on arbi-
trarily selected thresholds. Recent developments, however,
have shown considerable promise in resolving some of these
difficulties (e.g. Hirzel et al., 2006; Phillips et al., 2006). We
used a threshold-independent measure, the AUC (area under
the curve), to assess our models (Zweig & Campbell, 1993;
Fielding & Bell, 1997).
Although AUC was originally derived for presence/absence
models, it can also be used for presence-only models. AUC is
calculated by summing the area under a receiver operating
characteristic (ROC) curve, which is a plot of sensitivity
(fraction of true positives, i.e. the proportion of positive
instances that are classified positive) against 1 – specificity (the
false positive rate, i.e. the fraction of negative instances that are
classified positive) for all possible thresholds. The value of an
AUC index varies between 0 (performance worse than
random) and 1 (perfect discrimination), with 0.5 being
D. P. Tittensor et al.
1116 Journal of Biogeography 36, 1111–1128ª 2009 The Authors. Journal compilation ª 2009 Blackwell Publishing Ltd

indistinguishable from random. Defined in this manner, ROC
plots require presence/absence data. Plotting sensitivity against
a random sample of background locations (i.e. without species
presences) is equivalent to replacing absences with pseudo-
absences, and is sufficient to define an ROC curve (Wiley et al.,
2003; Phillips et al., 2006). Utilizing this method, however,
means that, in contrast to an ROC curve created using
presence/absence data for which the maximum obtainable
AUC is 1, the maximum achievable AUC is 1 – a/2, where a is
the fraction of grid cells that the species’ distribution covers.
This is typically an unknown quantity, so it is not possible to
determine how optimal an AUC value is when generated by
this procedure. It is, however, possible to determine whether
the AUC is statistically distinguishable from a random model
(AUC value of 0.5), and to compare the prediction strength of
multiple models using the same data. For the first procedure
we used a Wilcoxon rank-sum test statistic, and for the second
a nonparametric test based on the theory of generalized
U-statistics (DeLong et al., 1988).
We used a cross-validation procedure to evaluate the
performance of our models, by creating 10 random partitions
of the occurrence localities, splitting the data in each partition
between calibration (70%) and evaluation (30%) data sets. The
same 10 random partitions were used for both models. AUC
values were calculated for the evaluation data. Cross-validation
procedures and statistical comparisons were carried out in
matlab 7.4 (http://www.mathworks.com).
RESULTS
Model evaluation
Both models performed significantly better than random
(P < 0.0001; Wilcoxon rank-sum test) for each and every
partition of the data (AUC validation; Table 2). Although both
models showed largely congruent geometric and bathymetric
patterns of coral habitat, the Maxent model had a significantly
better classification rate [P < 0.0001; DeLong et al.’s (1988)
nonparametric test] than the ENFA model for all 10 cross-
validation partitions. No partitions had significantly different
AUC values when comparing EASE and one-degree grids, and
environmental variables linked with regions of high/low
habitat suitability were the same. Removing variables corre-
lated at > 0.90 and > 0.75 had no significant impact on all
cross-validations for Maxent and ENFA except one [Maxent
cross-validation number 10 with variables correlated at > 0.90
removed had a significantly lower AUC: P = 0.0054; DeLong
et al.’s (1988) nonparametric test]. Habitat-suitability maps
and environmental variable responses were similar for models
containing all variables and those with highly correlated
variables removed; we focus on the models with all variables to
allow for a fuller assessment of the factors potentially
underlying distributions.
The maximum-entropy and ENFA models scale habitat-
suitability values differently when constructing maps (see
Materials and Methods), so direct comparison of absolute
values is inappropriate. Instead we consider each habitat-
suitability model separately.
Maximum entropy modelling
Predicted habitat suitability for the maximum entropy model
is depicted in Fig. 3. Highly suitable habitat for cold-water
stony corals on seamounts was predicted to occur in the North
Atlantic at all depths down to 2500 m, particularly in the
eastern North Atlantic. In the Southern Hemisphere, highly
suitable habitat was found at < 1500 m depth in parts of a
circumglobal band located between 20� and 50� S. Some
regions of the North Pacific (e.g. north-west of Hawaii and
south-east of Japan) had suitable near-surface habitat, but only
small areas below 750 m and almost none below 1000 m. In
the Indian Ocean almost all suitable habitat was predicted only
south of the equator. Habitat suitability at depths below
1750 m (not shown) was similar to that displayed in Fig. 3(d).
Jackknifing of variables and heuristic estimates (not shown)
suggested that the aragonite saturation state (D[CO32)]A) and
total DIC were the environmental variables most influential in
determining habitat suitability; primary productivity and
oxygen levels were also important. However, as a result of
the high level of correlations among environmental variables it
is difficult to determine the effects of individual factors in
isolation.
Environmental niche factor analysis
The marginality value of the ENFA model was 1.430,
indicating that cold-water stony corals had environmental
requirements substantially offset from the background mean
(Table 3). A specialization value of > 1 (1.571) indicated that
scleractinian corals on seamounts occupy relatively narrow
environmental niches. Factors positively associated with high
Table 2 AUC values for all model runs.
Partition ENFA Maxent
1 0.777 0.880
2 0.782 0.875
3 0.803 0.873
4 0.803 0.877
5 0.787 0.882
6 0.792 0.890
7 0.810 0.886
8 0.814 0.876
9 0.771 0.878
10 0.784 0.898
Mean (SD) 0.792 (0.015) 0.882 (0.008)
Models were calibrated using training data (70% of occurrence points,
randomly selected), and AUC values were calculated from test data
(30% of occurrence points). All model runs fit significantly better than
random (P < 0.0001). Maxent (maximum entropy modelling) AUC
values were significantly higher than ENFA (environmental niche
factor analysis) values for all partitions (P < 0.0001).
Global stony coral habitat on seamounts
Journal of Biogeography 36, 1111–1128 1117ª 2009 The Authors. Journal compilation ª 2009 Blackwell Publishing Ltd

1500
−17
50 m
1000
−12
50 m
500−
750
m
0−25
0 m
180
° W
135
° W
90°
W45
° W
45°
E90
° E
135°
E18
0° E
0°
180°
W 1
35°
W90
° W
45°
W45
° E
90°
E13
5° E
180°
E0°
180
° W
135
° W
90°
W45
° W
45°
E90
° E
135°
E18
0° E
0°
180
° W
135
° W
90°
W45
° W
45°
E90
° E
135°
E18
0° E
0°
20°
S
40°
S
80°
S60
° S
20°
N
40°
N
60°
N
80°
N
20°
S
40°
S
80°
S60
° S
20°
N
40°
N
60°
N
80°
N
Habitat suitability
00.1
0.2
0.3
0.4
0.5
0.6
0.7
0.8
0.9
1
(a)
(b)
(c)
(d)
0°
20°
S
40°
S
80°
S60
° S
20°
N
40°
N
60°
N
80°
N
0°
20°
S
40°
S
80°
S60
° S
20°
N
40°
N
60°
N
80°
N
0°
Fig
ure
3P
red
icte
dh
abit
atsu
itab
ilit
yfo
rse
amo
un
tSc
lera
ctin
ia,
usi
ng
am
axim
um
entr
op
y(M
axen
t)m
od
el,
Beh
rman
np
roje
ctio
n.
Hig
her
valu
esin
dic
ate
mo
resu
itab
leh
abit
at.
Wh
ite
ind
icat
es
area
sm
issi
ng
envi
ron
men
tal
dat
a.
D. P. Tittensor et al.
1118 Journal of Biogeography 36, 1111–1128ª 2009 The Authors. Journal compilation ª 2009 Blackwell Publishing Ltd

habitat suitability included the aragonite saturation state
(D[CO32)]A), dissolved oxygen concentration, and percentage
oxygen saturation. Furthermore, low concentrations of phos-
phate, nitrate, silicate and dissolved inorganic carbon were all
associated with high habitat suitability. Suitable coral habitat
predicted using ENFA showed very similar patterns (Fig. 4) to
those derived from the Maxent model (Fig. 3), although fewer
fine-scale features were evident, and in general ENFA predicted
larger areas containing suitable habitat. The biggest discrep-
ancy between the models was the generally lower relative
habitat suitability in the Northwest and tropical Atlantic in the
Maxent model (Figs 3 & 4).
Habitat suitability for seamount summits
The two models largely corresponded in their predictions of
geographic and bathymetric patterns of cold-water stony coral
habitat on likely seamount summits (Fig. 5). Because all
depths in the North Atlantic were predicted to provide suitable
habitat, many seamounts in this basin were highly suitable for
corals irrespective of their summit depth (Fig. 5). In the
circumglobal strip in the Southern Hemisphere, seamount
summits above 1500 m depth were predicted to be suitable
coral habitats, particularly in the Southwest Pacific around
New Zealand, New Caledonia, Fiji and Tonga. ENFA predicted
higher suitability of coral habitat for seamount summits in the
tropical Atlantic; many summits identified in this region are
below 1500 m depth (Fig. 1), where relative habitat suitability
was predicted to be higher by the ENFA model (Figs 3d & 4d).
DISCUSSION
We used two presence-only modelling methods to construct
habitat-suitability predictions for stony corals on seamounts.
Both models showed similar spatial patterns of high and low
suitability consistent with current knowledge. The Maxent
approach had AUC values significantly higher than those of
ENFA, indicating that it more accurately classified test
locations as being suitable relative to background locations.
Results were robust to correlations among variables and the
model grid type (one-degree or equal-area). Mapping habitat
suitability to the summits of c. 14,000 predicted seamount
locations showed a heterogeneous pattern of habitat suitability,
with highly suitable summits in the North Atlantic and a mid-
latitude strip in the Southern Hemisphere. These patterns, and
the underlying factors responsible, have potential implications
for our understanding of the biogeography of stony corals in
the deep sea and for developing worldwide conservation and
management strategies for seamount ecosystems.
Disentangling the environmental factors responsible for
constraining the distributions of stony corals on seamounts at
the global scale is complex, and ultimately requires back-
ground knowledge of the ecosystem and of coral biology.
Factors that were strongly correlated with high habitat
suitability for these taxa may not in themselves be important,
but may rather be correlated with another important variable.
Furthermore, there was strong correlation between many of
the environmental parameters used in the analyses, and
although the models are robust to this, it further complicates
the assignation of relative importance to each individual
environmental variable. Nonetheless, the relative importance
of each factor in the ENFA model (Table 3) and jackknife and
heuristic results from the Maxent model (not shown) can be
used to provide some guidance.
Of all the variables in the study, those of least importance
were water velocity, export productivity, salinity and depth
(Table 3). High water velocity or turbulent flow is known to be
important in determining the distribution of cold-water corals
at the local scale (metres to kilometres) on seamounts and in
other geological settings (e.g. Genin et al., 1986; Frederiksen
Table 3 Variance explained by the first nine ecological factors in the ENFA (environmental niche factor analysis) model.
Factor 1 (marginality) 2 3 4 5 6 7 8 9
Alkalinity (total) )0.257 0.003 0.117 0.026 0.048 0.021 0.294 0.394 0.476
D[CO32)]A (aragonite saturation state) 0.313 0.109 0.229 0.455 0.143 0.016 0.001 0.110 0.102
Depth )0.226 0.004 0.052 0.121 0.001 0.110 0.067 0.070 0.218
Dissolved oxygen 0.251 0.397 0.538 0.517 0.622 0.637 0.399 0.159 0.086
Export productivity 0.185 0.019 0.021 0.035 0.036 0.154 0.055 0.011 0.188
Nitrate )0.320 0.425 0.109 0.022 0.098 0.044 0.425 0.361 0.328
Percentage oxygen saturation 0.296 0.558 0.739 0.464 0.618 0.446 0.197 0.263 0.253
Phosphate )0.322 0.570 0.146 0.092 0.104 0.062 0.170 0.068 0.051
Primary productivity 0.297 0.011 0.035 0.028 0.107 0.098 0.109 0.018 0.049
Salinity 0.152 0.061 0.000 0.105 0.077 0.002 0.214 0.048 0.194
Silicate )0.349 0.032 0.093 0.141 0.192 0.352 0.142 0.452 0.585
Total DIC (dissolved inorganic carbon) )0.317 0.046 0.197 0.460 0.346 0.010 0.397 0.622 0.103
Temperature 0.249 0.077 0.118 0.206 0.113 0.468 0.511 0.069 0.302
Water velocity )0.006 0.000 0.010 0.009 0.001 0.002 0.040 0.006 0.121
Explained specialization 0.096 0.198 0.186 0.111 0.085 0.066 0.062 0.049 0.041
Factor one explains the marginality; the remainder, the specialization. The cumulative explained specialization of the first nine factors is 89.5%. Factor
1 explains 100% of the marginality.
Global stony coral habitat on seamounts
Journal of Biogeography 36, 1111–1128 1119ª 2009 The Authors. Journal compilation ª 2009 Blackwell Publishing Ltd

500−
750
m0−
250
m
1500
−17
50 m
1000
−12
50 m
Habitat suitability
0102030405060708090100
(a)
(b)
(c)
(d)
180
° W
135
° W
90°
W45
° W
45°
E90
° E
135°
E18
0° E
0°
20°
S
40°
S
80°
S60
° S
20°
N
40°
N
60°
N
80°
N
0°
180
° W
135
° W
90°
W45
° W
45°
E90
° E
135°
E18
0° E
0°
20°
S
40°
S
80°
S60
° S
20°
N
40°
N
60°
N
80°
N
0° 180
° W
135
° W
90°
W45
° W
45°
E90
° E
135°
E18
0° E
0°
20°
S
40°
S
80°
S60
° S
20°
N
40°
N
60°
N
80°
N
0°
180
° W
135
° W
90°
W45
° W
45°
E90
° E
135°
E18
0° E
0°
20°
S
40°
S
80°
S60
° S
20°
N
40°
N
60°
N
80°
N
0°
Fig
ure
4E
nvi
ron
men
tal
nic
he
fact
or
anal
ysis
(EN
FA
)p
red
icte
dh
abit
atsu
itab
ilit
yfo
rse
amo
un
tSc
lera
ctin
ia,
Beh
rman
np
roje
ctio
n.
Hig
her
valu
esin
dic
ate
mo
resu
itab
leh
abit
at.
Wh
ite
ind
icat
es
area
sm
issi
ng
envi
ron
men
tal
dat
a.
D. P. Tittensor et al.
1120 Journal of Biogeography 36, 1111–1128ª 2009 The Authors. Journal compilation ª 2009 Blackwell Publishing Ltd

et al., 1992). Studies employing ENFA on deep-water octoco-
rals and on the deep-water reef-forming scleractinian Lophelia
pertusa have demonstrated that these corals favour areas of
high current velocity or steep or irregular topography (Bryan &
Metaxas, 2007; Davies et al., 2008). High current flow can
provide transport of nutrients and food to corals (e.g. Thiem
et al., 2006) as well as preventing siltation of colonies and
removing sediment from the seabed (Rogers, 1994). At the
global scale, however, the averaging of velocity over the grid
cells in the present study failed to capture the fine-resolution
detail around each individual seamount, and hence the
localized variation in flow.
Export productivity provided little information to the
models, again probably because it failed to capture small-scale
Figure 5 Predicted habitat suitability for Scleractinia on the summits of potential large seamounts, Behrmann projection. Top: results from
the Maxent (maximum entropy modelling) model. Bottom: results from the ENFA (environmental niche factor analysis) model. Only
seamounts with summit depths < 2500 m are included.
Global stony coral habitat on seamounts
Journal of Biogeography 36, 1111–1128 1121ª 2009 The Authors. Journal compilation ª 2009 Blackwell Publishing Ltd

detail. However, this may also reflect the importance of
advective processes in supplying food to seamount ecosystems,
effectively de-coupling benthic communities from the regional
level of primary production (Genin & Dower, 2007; White
et al., 2007).
In general, the relationships between cold-water coral
distribution and salinity are poorly understood (Freiwald
et al., 2004). Salinity partially determines the density of
seawater and may be expected to influence stratification of
the water column and small-scale oceanographic processes
such as internal wave formation that may affect food supply to
cold-water corals as well as other aspects of their ecology. A
lack of evidence for the influence of salinity on habitat
suitability for deep-sea stony corals may again reflect the
inability of our analyses to capture the small scale at which
such processes operate, but may also reflect the fact that other
oceanographic processes may be important in driving food
supply to cold-water corals on banks and seamounts (e.g.
White et al., 2005; Duineveld et al., 2007).
Depth is unlike the other environmental parameters in that
it is not a proximate factor potentially responsible for driving
coral distributions per se, but rather is included in order to
capture the potential effects of unmeasured variables. That it is
of relative unimportance in model predictions suggests that
there are no unmeasured factors highly correlated with depth
that play a strong role in shaping stony coral distributions on
seamounts, at least down to 2500 m.
The environmental factors most important in determining
habitat suitability appeared to be the aragonite saturation,
dissolved oxygen and percentage oxygen saturation (Table 3).
Aragonite saturation has been shown to closely regulate the
calcification rates of zooxanthellate and azooxanthellate stony
corals and other organisms (e.g. Leclercq et al., 2000; Kleypas
et al., 2006), and has been speculated to constrain the
distributions of cold-water stony corals (Guinotte et al.,
2006). The models appeared to confirm this, with low
suitability in the North Pacific, where the aragonite saturation
horizon is shallow (c. 50–600 m) in comparison to the North
Atlantic (c. 2500–3000 m) (Feely et al., 2004). For cold-water
coral reefs, accumulation of the coral framework is a balance
between coral growth and destruction of coral skeletons by
bioeroding organisms such as sponges and polychaete worms
(Rogers, 1999). Thus, conditions of low aragonite saturation
are likely to be particularly unfavourable for cold-water coral
reef formation as the balance between framework building
processes and reef destruction is altered, especially as seawater
can induce dissolution at low levels of saturation (Orr et al.,
2005; Kleypas et al., 2006; Hoegh-Guldberg et al., 2007).
The strong influence of high oxygen concentrations on the
occurrence of scleractinian corals was also found in an ENFA
of the distribution of Lophelia pertusa, where the coral was
found to occur in waters of 4.6–7.2 mL L)1 (Davies et al.,
2008). This study was consistent with previous observations
of the occurrence of L. pertusa in waters of oxygen
concentrations of c. 4–5.5 mL L)1 (Freiwald, 2002). Eco-
physiological studies on L. pertusa suggest that it cannot
maintain aerobic metabolism at oxygen concentrations below
3 mL L)1 (Dodds et al., 2007). Hypoxia has also been
demonstrated to decrease calcification rates in zooxanthellate
corals in the dark (Al-Horani et al., 2007). This effect is
negated in daylight by the production of oxygen during
photosynthesis, a mechanism not available to deep-water
corals (Al-Horani et al., 2007). Overall, it would appear that
regions of the ocean where conditions of low oxygen exist
are unsuitable as habitat for stony corals.
Low levels of nitrate, silicate and phosphate were also
determined to be important for high relative habitat suitability,
as found for L. pertusa (Davies et al., 2008). This result seems
to confirm that nutrient concentrations, or factors correlated
with nutrient concentrations, are important in determining
cold-water stony coral distributions. Nutrient effects on coral
growth have been extensively explored for warm-water corals,
where nitrogen and phosphorus may increase photosynthesis
in corals, but can inhibit calcification rates (Marubini & Thake,
1999; Renegar & Riegl, 2005; but see Langdon & Atkinson,
2005). Furthermore, the effects of nutrient enrichment may be
additive with the effects of low aragonite saturation, rendering
the environment particularly unsuitable for the occurrence of
scleractinian corals. Increased nutrients and temperature can
both also increase the occurrence and severity of coral diseases
in shallow-water stony corals (Bruno et al., 2003, 2007; Boyett
et al., 2007). Studies of the effects of nutrients on calcification
rates have not been carried out for cold-water corals, but these
azooxanthellate corals do not photosynthesize, and hence we
might speculate that only the negative effects of high nutrient
concentrations may affect them.
The components of the seawater carbonate system (dis-
solved inorganic carbon, alkalinity, and [DCO32)]A) are all
highly correlated; high levels of [DCO32)]A are negatively
correlated with dissolved inorganic carbon and alkalinity. Thus
the availability of aragonite corresponds with low alkalinity
and dissolved inorganic carbon.
Primary productivity was positively associated with habitat
suitability, and interestingly appeared to be somewhat more
influential in the Maxent model. This suggests that habitat
suitability was nonlinearly related to primary productivity
(Maxent marginal response curves, not shown), with a general
trend towards high primary productivity being linked with
high habitat suitability (Table 3, marginality).
All of the above-mentioned environmental variables are
strongly correlated (|q| > 0.5 with at least one other variable).
For example, oxygen saturation of seawater is directly related
to temperature and both show marked patterns of variation
with depth. Temperature generally decreases with increasing
depth, and oxygen concentration drops to a minimum below
the surface prior to increasing again with increasing depth.
This leaves as yet unresolved the question of which factors are
the most important in determining the suitability of seamount
habitat for stony corals. Experimental and observational
studies on calcification rates in cold-water corals and responses
to physical and biogeochemical environmental parameters are
required to resolve this question (see Kleypas et al., 2006).
D. P. Tittensor et al.
1122 Journal of Biogeography 36, 1111–1128ª 2009 The Authors. Journal compilation ª 2009 Blackwell Publishing Ltd

The patterns predicted by the models (Figs 3–5) are largely
consistent with current biogeographical knowledge for this
taxon (Guinotte et al., 2006; Rogers et al., 2007). The Atlantic
has a relatively deep aragonite saturation horizon and high
oxygen availability, thus providing suitable conditions for
corals to grow (e.g. Rogers, 1999; Hall-Spencer et al., 2007).
The circumglobal strip of suitable habitat in the Southern
Hemisphere corresponds very well with a relatively deep
aragonite saturation depth (Feely et al., 2004) and a high level
of dissolved oxygen in comparison to surrounding regions
(Garcia et al., 2006a). In contrast, the equatorial Pacific has a
much shallower aragonite saturation depth and lower levels of
dissolved oxygen. This is likely to be responsible for the low
habitat suitability at every depth except for some near-surface
patches in the ENFA model. The North Pacific Ocean also has a
much shallower aragonite saturation horizon (Feely et al.,
2004), which could be responsible for the low predicted habitat
suitability at depth. Samples from North Pacific seamounts do
appear to indicate reduced abundance of scleractinians relative
to many other regions (Baco, 2007). The northern Indian
Ocean is a well-known extreme oxygen minimum zone (e.g.
Helly & Levin, 2004; Garcia et al., 2006a), and both models
predict low habitat suitability at all depths for this region.
Although there are few presence data in the model from the
southern Indian Ocean, this entire region is predicted to be
highly suitable habitat. Thus, at a global level, the model
predicts high habitat suitability for both well-sampled (e.g.
Northeast Atlantic) and less well-sampled (e.g. South Indian
Ocean) regions. Therefore, our models largely reflect the known
biogeography of this taxon, but in addition provide predictions
of highly suitable regions that are not yet well sampled. It will
prove interesting to see whether seamounts in these regions do
indeed have cold-water scleractinians in any abundance.
The geographical distribution also reflects previously pro-
posed historical and ecological factors responsible for large-
scale coral patterns in the deep sea. For example, the abundance
of cold-water corals in the Southwest Pacific is thought to be
the result of shallow to deepwater dispersal of fauna from the
centre of coral speciation in the Indo-West Pacific (a region
that had originated by the early Miocene), and of the number
and concentration of seamounts that could facilitate effective
dispersal (Cairns, 2007). Thus, the results of the predictive
modelling of suitable habitat for stony corals on the summits of
seamounts largely confirms rather than significantly questions
the current views on dispersal and colonization by corals in the
deep sea, and what little is known about seamount biogeo-
graphy in general (Stocks & Hart, 2007).
The maps of habitat suitability on seamount summits
(Fig. 5) provide useful guidance as to areas containing
seamounts with highly suitable habitat. However, we are
limited by the constraints of the data. First, numerous
seamounts are undoubtedly not detected through this
approach, some of which are likely to be located in regions
of high habitat suitability. For example, the Kitchingman & Lai
(2004) analysis does not detect any seamounts to the north-
west of Britain and Ireland, but both the ENFA and Maxent
models suggest that this is a region of high suitability. Second,
habitat suitability on seamount summits is likely to differ from
that on seamount flanks, especially for those regions where
habitat suitability varies substantially by depth (for example,
the general decrease in habitat suitability with depth in the
circumglobal southern latitude strip; Figs 3 & 4). Finally, the
modelling of habitat suitability from environmental variables
tells us nothing about the role of biological interactions in
determining the distribution of stony corals on seamounts. We
point out, however, that past approaches to explaining deep-
sea diversity and species distributions that have concentrated
on ecologically based explanations (for example niche special-
ization, Sanders, 1969; intermediate disturbance hypotheses,
Dayton & Hessler, 1972) have largely failed to provide a
satisfactory explanation of species diversity and patterns of
species occurrence (Gage, 2004). Such interactions may
actually have a limited impact on the diversity that occurs
at a local scale (see Cornell & Lawton, 1992, for terrestrial
communities). Instead, diversity is likely to be set at the
regional level by environmental parameters and evolutionary
history. Food resources are an overwhelming limiting factor in
deep-sea communities (Rex et al., 2006), suggesting that the
competition for food and space that occurs in many shallow
water marine habitats is unlikely to have a strong impact on
species distributions in the deep sea. Therefore, we believe that
the conclusions are probably not significantly affected by
interspecies interactions, although they may be influenced by
biogeography (Cairns, 2007).
The Maxent model outperformed the ENFA model for every
cross-validation partition (Table 2). Maxent can fit more
complex functions of environmental variables, including
thresholds, quadratic functions and products. ENFA, in
contrast, is only able to fit linear dependencies of the species
niche (Hirzel et al., 2002), unless transformations or nonlinear
combinations of variables are also incorporated as layers.
However, this means that ENFA results (Table 3) regarding the
importance of each variable are more straightforward to
interpret than the heuristic and jackknifing estimates output
with Maxent. Given our results, we recommend the testing of
multiple modelling approaches on deep-sea presence-only data,
along with threshold-independent metrics of validation, as
there may be substantial differences in performance. Nonethe-
less, both models fit with AUC scores of > 0.75 for all cross-
validation partitions, which indicates good discrimination
ability appropriate for many uses (Pearce & Ferrier, 2000).
CONCLUSIONS
Stony corals are slow-growing, long-lived and vulnerable
organisms, particularly on seamounts, which are often the
target of exploitation because of the high concentrations of fish
present (Rogers, 1994). The maps derived from our statistical
models suggest that global habitat for scleractinians on
seamounts is highly heterogeneous, being concentrated in the
North Atlantic and in a circumglobal strip between 20� and
50� S. This pattern generally reflects what is known about the
Global stony coral habitat on seamounts
Journal of Biogeography 36, 1111–1128 1123ª 2009 The Authors. Journal compilation ª 2009 Blackwell Publishing Ltd

biogeography of stony corals in the deep sea, although samples
have not been taken from some regions of the ocean predicted
to be suitable habitat for this taxon (e.g. the South Indian
Ocean). The modelling that we have carried out presents a
testable hypothesis as to the distribution of stony corals on
seamounts. Further sampling could lend weight to or falsify
this hypothesis.
Our analysis also provides a comparison of two presence-
only habitat-suitability modelling methods: ENFA and Max-
ent. In this instance, Maxent consistently provided a better
classification of coral presence data using a cross-validation
procedure. This may be because Maxent is able to fit more
complex functions of environmental variables. We propose
that threshold-independent comparisons be conducted when-
ever predictive modelling of habitat suitability for deep-sea
organisms is conducted, in order to properly assess the
performance and idiosyncrasies of individual models, and
consequential effects on predictions.
Higher-resolution environmental data or additional coral
samples would allow for further refinement of these models.
Knowledge of likely differences in coral habitat between
seamount summits and seamount flanks, and for different
types of seamounts would also greatly increase our under-
standing. This understanding could come through fine-scale
predictive modelling of habitat suitability on individual
seamounts, were such data available, and would provide
enormous insight into the small-scale factors that are impor-
tant for these organisms. Local-scale models could also reveal
further regional differences, and species-specific analyses may
identify varied requirements within the Scleractinia.
Human impacts on cold-water corals can be substantial
(Davies et al., 2007). Such effects may grow in the future as a
result of climate change and increased exploitation pressure.
The likely shallowing of the aragonite saturation horizon (Orr
et al., 2005) may well have a negative effect on habitat
suitability for cold-water stony corals on seamounts (Guinotte
et al., 2006). Furthermore, exploitation pressure must be
considered in concert with coral habitat when addressing
issues of conservation and management. Our analysis suggests
that efforts to protect these fragile organisms on seamounts
must take the spatial heterogeneity of suitable habitat into
account. This suitable habitat may be mostly limited to the
North Atlantic and a circumglobal strip in the Southern
Hemisphere. The potential importance of these corals for their
associated assemblages suggests that increasing our under-
standing of their distribution is important in helping to protect
seamount biodiversity. Using predictive models to maximize
understanding gleaned from sampling efforts is one way in
which to do this.
ACKNOWLEDGEMENTS
We would like to thank R. A. Myers, B. Worm, J. McPherson,
W. Blanchard and A. Dickson for guidance and advice. We
are grateful to the anonymous referees for their constructive
criticisms and suggestions. This paper is a joint product of
the CenSeam and FMAP programs of the Census of Marine
Life, as supported by the Sloan Foundation. The ideas for
this paper were conceived at the CenSeam Data Analysis
Working Group workshop in Wellington, New Zealand,
sponsored by the Netherlands Department of Nature,
Ministry of Agriculture, Nature and Food Quality. An earlier
iteration of one habitat-suitability model (ENFA) was
included in UNEP Regional Seas Report and Studies No.
183. SeamountsOnline has received support from NSF OCE,
NSF BDI and the Sloan Foundation.
REFERENCES
Al-Horani, F.A., Tambutte, E. & Allemand, D. (2007) Dark
calcification and the daily rhythm of calcification in the
scleractinian coral, Galaxea fascicularis. Coral Reefs, 26, 531–
538.
Andrews, A.H., Cailliet, G.M., Kerr, L.A., Coale, K.H., Lund-
strom, C. & DeVogelaere, A.P. (2005) Investigations of age
and growth for three deep-sea corals from the Davidson
Seamount off central California. Cold-water corals and eco-
systems (ed. by A. Freiwald and J.M. Roberts), pp. 1021–
1038. Springer-Verlag, Berlin.
Antonov, R.A., Locarnini, R.A., Boyer, T.P., Mishonov, A.V. &
Garcia, H.E. (2006) World Ocean Atlas 2005, Vol. 2: Salinity
(ed. by S. Levitus). US Government Printing Office, Wash-
ington, DC.
Araujo, M.B. & Guisan, A. (2006) Five (or so) challenges for
species distribution modelling. Journal of Biogeography, 33,
1677–1688.
Armstrong, R.L. & Brodzik, M.J. (1995) An earth-gridded
SSM/I data set for cryospheric studies and global change
monitoring. Advances in Space Research, 16, 155–163.
Baco, A.R. (2007) Exploration for deep-sea corals on North
Pacific seamounts and islands. Oceanography, 20, 108–117.
Behrenfeld, M.J. & Falkowski, P.G. (1997) Photosynthetic rates
derived from satellite-based chlorophyll concentration.
Limnology and Oceanography, 42, 1–20.
Boyce, M.S., Vernier, P.R., Nielsen, S.E. & Schmiegelow, F.K.A.
(2002) Evaluating resource selection functions. Ecological
Modelling, 157, 281–300.
Boyett, H.V., Bourne, D.G. & Willis, B.L. (2007) Elevated
temperature and light enhance progression and spread of
black band disease on staghorn corals of the Great Barrier
Reef. Marine Biology, 151, 1711–1720.
Brandt, A., Gooday, A.J., Brandao, S.N., Brix, S., Brokeland,
W., Cedhagen, T., Choudhury, M., Cornelius, N., Danis, B.,
De Mesel, I., Diaz, R.J., Gillan, D.C., Ebbe, B., Howe, J.A.,
Janussen, D., Kaiser, S., Linse, K., Malyutina, M., Pawlowski,
J., Raupach, M. & Vanreusel, A. (2007) First insights into the
biodiversity and biogeography of the Southern Ocean deep
sea. Nature, 447, 307–311.
Brotons, L., Thuiller, W., Araujo, M.B. & Hirzel, A.H. (2004)
Presence–absence versus presence-only modelling methods
for predicting bird habitat suitability. Ecography, 27, 437–
448.
D. P. Tittensor et al.
1124 Journal of Biogeography 36, 1111–1128ª 2009 The Authors. Journal compilation ª 2009 Blackwell Publishing Ltd

Bruno, J.F., Petes, L.E., Harvell, C.D. & Hettinger, A. (2003)
Nutrient enrichment can increase the severity of coral dis-
eases. Ecology Letters, 6, 1056–1061.
Bruno, J.F., Selig, E.R., Casey, K.S., Page, C.A., Willis, B.L.,
Harvell, C.D., Sweatman, H. & Melendy, A.M. (2007)
Thermal stress and coral cover as drivers of coral disease
outbreaks. PLoS Biology, 5, 1220–1227.
Bryan, T.L. & Metaxas, A. (2007) Predicting suitable habitat
for deep-water gorgonian corals on the Atlantic and Pacific
continental margins of North America. Marine Ecology
Progress Series, 330, 113–126.
Buhl-Mortensen, L. & Mortensen, P.B. (2005) Distribution
and diversity of species associated with deep-sea gorgonian
corals off Atlantic Canada. Cold-water corals and ecosystems
(ed. by A. Freiwald and J.M. Roberts), pp. 849–879.
Springer-Verlag, Berlin.
Cairns, S.D. (2007) Deep-water corals: an overview with
special reference to diversity and distribution of deep-
water scleractinian corals. Bulletin of Marine Science, 81,
311–322.
Cartes, J.E. & Carrasson, M. (2004) Influence of trophic vari-
ables on the depth-range distributions and zonation rates of
deep-sea megafauna: the case of the Western Mediterranean
assemblages. Deep-Sea Research I, 51, 263–279.
Carton, J.A., Chepurin, G., Cao, X. & Giese, B. (2000) A simple
ocean data assimilation analysis of the global upper ocean
1950–95. Part I: methodology. Journal of Physical Oceano-
graphy, 30, 294–309.
Clark, M.R. & Koslow, J.A. (2007) Impacts of fisheries on
seamounts. Seamounts: ecology, fisheries and conservation
(ed. by T.J. Pitcher, T. Morato, P.J.B. Hart, M.R. Clark, N.
Haggan and R.S. Santos), pp. 413–441. Blackwell Publishing,
Oxford.
Clark, M. & O’Driscoll, R. (2003) Deepwater fisheries and
aspects of their impact on seamount habitat in New
Zealand. Journal of Northwest Atlantic Fishery Science, 31,
441–458.
Clark, M.R., Tittensor, D., Rogers, A.D., Brewin, P., Schlacher,
T., Rowden, A., Stocks, K. & Consalvey, M. (2006) Sea-
mounts, deep-sea corals and fisheries: vulnerability of deep-sea
corals to fishing on seamounts beyond areas of national
jurisdiction. UNEP-WCMC, Cambridge.
Clark, M.R., Vinnichenko, V.I., Gordon, J.D.M., Beck-Bulat,
G.Z., Kukharev, N.N. & Kakora, A.F. (2007) Large-scale
distant-water trawl fisheries on seamounts. Seamounts:
ecology, fisheries and conservation (ed. by T.J. Pitcher, T.
Morato, P.J.B. Hart, M.R. Clark, N. Haggan and R.S. San-
tos), pp. 361–399. Blackwell Publishing, Oxford.
Cornell, H.V. & Lawton, J.H. (1992) Species interactions, local
and regional processes, and limits to the richness of eco-
logical communities: a theoretical perspective. Journal of
Animal Ecology, 61, 1–12.
Davies, A.J., Roberts, J.M. & Hall-Spencer, J. (2007) Preserving
deep-sea natural heritage: emerging issues in offshore con-
servation and management. Biological Conservation, 138,
299–312.
Davies, A.J., Wisshak, M., Orr, J.C. & Roberts, J.M. (2008)
Predicting suitable habitat for the cold-water coral Lop-
helia pertusa (Scleractinia). Deep-Sea Research I, 55, 1048–
1062.
Dayton, P.K. & Hessler, R.R. (1972) Role of biological dis-
turbance in maintaining diversity in the deep sea. Deep-Sea
Research, 19, 199–208.
DeLong, E.R., DeLong, D.M. & Clarke-Pearson, D.L. (1988)
Comparing the areas under two or more correlated receiver
operating characteristic curves: a nonparametric approach.
Biometrics, 44, 837–845.
Dodds, L.A., Roberts, J.M., Taylor, A.C. & Marubini, F. (2007)
Metabolic tolerance of the cold-water coral Lophelia pertusa
(Scleractinia) to temperature and dissolved oxygen change.
Journal of Experimental Marine Biology and Ecology, 349,
205–214.
Dormann, C.F., McPherson, J.M., Araujo, M.B., Bivand, R.,
Bolliger, J., Gudrun, C., Davies, R.G., Hirzel, A., Jetz, W.,
Kissling, D., Kuhn, I., Ohlemuller, R., Peres-Neto, P.R.,
Reineking, B., Schroder, B., Schurr, F.M. & Wilson, R.
(2007) Methods to account for spatial autocorrelation in the
analysis of species distributional data: a review. Ecography,
30, 609–628.
Dudık, M., Phillips, S.J. & Schapire, R.E. (2004) Performance
guarantees for regularized maximum entropy density esti-
mation. Proceedings of the 17th Annual Conference on
Computational Learning Theory (ed. by J. Shawe-Taylor and
Y. Singer), pp. 472–486. Springer-Verlag, Berlin.
Duineveld, G.C.A., Lavaleye, M.S.S., Bergman, M.J.N., de
Stigter, H. & Mienis, F. (2007) Trophic structure of a cold-
water coral mound community (Rockall Bank, NE Atlantic)
in relation to the near-bottom particle supply and current
regime. Bulletin of Marine Science, 81, 449–467.
Edinger, E., Baker, K., Devillers, R. & Wareham, V. (2007)
Coldwater corals off Newfoundland and Labrador: distribution
and fisheries impacts. WWF-Canada, Toronto.
Elith, J., Graham, C.H., Anderson, R.P., Dudık, M., Ferrier, S.,
Guisan, A., Hijmans, R.J., Huettmann, F., Leathwick, J.R.,
Lehmann, A., Li, J., Lohmann, L.G., Loiselle, B.A., Manion,
G., Moritz, C., Nakamura, M., Nakazawa, Y., Overton, J.M.,
Peterson, A.T., Phillips, S.J., Richardson, K., Scachetti-
Pereira, R., Schapire, R.E., Soberon, J., Williams, S., Wisz,
M.S. & Zimmermann, N.E. (2006) Novel methods improve
prediction of species’ distributions from occurrence data.
Ecography, 29, 129–151.
Feely, R.A., Sabine, C.L., Lee, K., Berelson, W., Kleypas, J.,
Fabry, V.J. & Millero, F.J. (2004) Impact of anthropogenic
CO2 on the CaCO3 system in the oceans. Science, 305, 362–
366.
Fielding, A.H. & Bell, J.F. (1997) A review of methods for the
assessment of prediction errors in conservation presence/
absence models. Environmental Conservation, 24, 38–49.
Frederiksen, R., Jensen, A. & Westerberg, H. (1992) The dis-
tribution of the scleractinian coral Lophelia pertusa around
the Faroe Islands and the relation to internal tidal mixing.
Sarsia, 77, 157–171.
Global stony coral habitat on seamounts
Journal of Biogeography 36, 1111–1128 1125ª 2009 The Authors. Journal compilation ª 2009 Blackwell Publishing Ltd

Freiwald, A. (2002) Reef-forming cold-water corals. Ocean
margin systems (ed. by G. Wefer, D. Billett, D. Hebbeln, B.B.
Jørgensen, M. Schluter and T. van Weering), pp. 365–385.
Springer-Verlag, Berlin.
Freiwald, A., Huhnerbach, V., Lindberg, B., Wilson, J.B. &
Campbell, J. (2002) The Sula Reef Complex, Norwegian
Shelf. Facies, 47, 179–200.
Freiwald, A., Fossa, J.H., Grehan, A., Koslow, T. & Roberts,
J.M. (2004) Cold-water coral reefs. UNEP-WCMC,
Cambridge.
Gage, J.D. (2004) Diversity in deep-sea benthic macrofauna:
the importance of local ecology, the larger scale, history and
the Antarctic. Deep-Sea Research II, 51, 1689–1708.
Garcia, H.E., Locarnini, R.A., Boyer, T.P. & Antonov, J.I.
(2006a) World Ocean Atlas 2005, Vol. 3: Dissolved oxygen,
apparent oxygen utilisation, and oxygen saturation (ed. by
S. Levitus). US Government Printing Office, Washington,
DC.
Garcia, H.E., Locarnini, R.A., Boyer, T.P. & Antonov, J.I.
(2006b) World Ocean Atlas 2005, Vol. 4: Nutrients (phos-
phate, nitrate, silicate) (ed. by S. Levitus). US Government
Printing Office, Washington, DC.
Genin, A. & Dower, J.F. (2007) Seamount plankton dynamics.
Seamounts: ecology, fisheries and conservation (ed. by T.J.
Pitcher, T. Morato, P.J.B. Hart, M.R. Clark, N. Haggan and
R.S. Santos), pp. 85–100. Blackwell Publishing, Oxford.
Genin, A., Dayton, P.K., Lonsdale, P.F. & Spiess, F.N. (1986)
Corals on seamount peaks provide evidence of current
acceleration over deep-sea topography. Nature, 322, 59–61.
Gjerde, K.M. (2006) Ecosystems and biodiversity in deep waters
and high seas. UNEP Regional Seas Reports and Studies
No. 178. UNEP/IUCN, Gland, Switzerland.
Glover, A.G. & Smith, C.R. (2003) The deep-sea floor eco-
system: current status and prospects of anthropogenic
change by the year 2025. Environmental Conservation, 30,
219–241.
Guinotte, J.M., Orr, J., Cairns, S., Freiwald, A., Morgan, L. &
George, R. (2006) Will human induced changes in seawater
chemistry alter the distribution of deep-sea scleractinian
corals? Frontiers in Ecology and the Environment, 4, 141–
146.
Guisan, A. & Zimmermann, N.E. (2000) Predictive habitat
distribution models in ecology. Ecological Modelling, 135,
147–186.
Hall-Spencer, J., Rogers, A.D., Davies, J. & Foggo, A. (2007)
Deep-sea coral distribution on seamounts, oceanic islands
and continental shelf slope habitats in the Northeast
Atlantic. Bulletin of Marine Science, 81, 135–146.
Harley, C.D.G., Smith, K.F. & Moore, V.L. (2003) Environ-
mental variability and biogeography: the relationship
between bathymetric distribution and geographical range
size in marine algae and gastropods. Global Ecology and
Biogeography, 12, 499–506.
Helly, J.J. & Levin, L.A. (2004) Global distribution of naturally
occurring marine hypoxia on continental margins. Deep-Sea
Research I, 51, 1159–1168.
Henry, L.-A. & Roberts, J.M. (2007) Biodiversity and ecolog-
ical composition of macrobenthos on cold-water coral
mounds and adjacent off-mound habitat in the bathyal
Porcupine Seabight, NE Atlantic. Deep Sea Research I, 54,
654–672.
Hirzel, A.H. & Arlettaz, R. (2003) Modeling habitat suitability
for complex species distributions by environmental-distance
geometric mean. Environmental Management, 32, 614–623.
Hirzel, A.H., Helfer, V. & Metral, F. (2001) Assessing habitat-
suitability models with a virtual species. Ecological Model-
ling, 145, 111–121.
Hirzel, A.H., Hausser, J., Chessel, D. & Perrin, N. (2002)
Ecological-niche factor analysis: how to compute habitat-
suitability maps without absence data? Ecology, 83, 2027–
2036.
Hirzel, A.H., Le Lay, G., Helfer, V., Randin, C. & Guisan, A.
(2006) Evaluating the ability of habitat suitability models to
predict species presences. Ecological Modelling, 199, 142–152.
Hoegh-Guldberg, O., Mumby, P.J., Hooten, A.J., Steneck, R.S.,
Greenfield, P., Gomez, E., Harvell, C.D., Sale, P.F., Edwards,
A.J., Caldeira, K., Knowlton, N., Eakin, C.M., Iglesias-Prieto,
R., Muthiga, N., Bradbury, R.H., Dubi, A. & Hatziolos, M.E.
(2007) Coral reefs under rapid climate change and ocean
acidification. Science, 318, 1737–1742.
Holland, K.N. & Grubbs, R.D. (2007) Fish visitors to sea-
mounts: tunas and billfish at seamounts. Seamounts: ecology,
fisheries and conservation (ed. by T.J. Pitcher, T. Morato,
P.J.B. Hart, M.R. Clark, N. Haggan and R.S. Santos), pp.
189–201. Blackwell Publishing, Oxford.
Jaynes, E.T. (1957) Information theory and statistical
mechanics. Physical Review, 106, 620–630.
Key, R.M., Kozyr, A., Sabine, C.L., Lee, K., Wanninkhof, R.,
Bullister, J.L., Feely, R.A., Millero, F.J., Mordy, C. & Peng,
T.-H. (2004) A global ocean carbon climatology: results
from global data analysis project (GLODAP). Global Bio-
geochemical Cycles, 18, 1–23.
Kitchingman, A. & Lai, S. (2004) Inferences on potential
seamount locations from mid-resolution bathymetric data.
Seamounts: biodiversity and fisheries (ed. by T. Morato and
D. Pauly), pp. 7–12. UBC Fisheries Centre, Vancouver, BC.
Kleypas, J.A., Feely, R.A., Fabry, V.J., Langdon, C., Sabine, C.L.
& Robbins, L.L. (2006) Impacts of ocean acidification on coral
reefs and other marine calcifiers: a guide for future research.
Report of a Workshop held 18–20 April 2005, St Petersburg,
FL. Available at: http://www.ucar.edu/communications/
Final_acidification.pdf (last accessed 4 October 2008).
Koslow, J.A., Gowlett-Holmes, K., Lowry, J.K., O’Hara, T.,
Poore, G.C.B. & Williams, A. (2001) Seamount benthic
macrofauna off southern Tasmania: community structure
and impacts of trawling. Marine Ecology Progress Series, 213,
111–125.
Langdon, C. & Atkinson, M.J. (2005) Effect of elevated pCO2
on photosynthesis and calcification of corals and interac-
tions with seasonal change in temperature/irradiance and
nutrient enrichment. Journal of Geophysical Research, 110,
C09S07, doi:10.1029/2004JC002576.
D. P. Tittensor et al.
1126 Journal of Biogeography 36, 1111–1128ª 2009 The Authors. Journal compilation ª 2009 Blackwell Publishing Ltd

Laws, E.A., Falkowski, P.G., Smith, W.O. Jr, Ducklow, H. &
McCarthy, J.J. (2000) Temperature effects on export pro-
duction in the open ocean. Global Biogeochemical Cycles, 14,
1231–1246.
Leclercq, N., Gattuso, J.-P. & Jaubert, J. (2000) CO2 partial
pressure controls the calcification rate of a coral community.
Global Change Biology, 6, 329–334.
Locarnini, R.A., Mishonov, A.V., Antonov, J.I., Boyer, T.P. &
Garcia, H.E. (2006) World Ocean Atlas 2005, Vol. 1:
Temperature (ed. by S. Levitus). US Government Printing
Office, Washington, DC.
Macpherson, E. (2003) Species range size distributions for
some marine taxa in the Atlantic Ocean. Effect of latitude
and depth. Biological Journal of the Linnean Society, 80, 437–
455.
Macpherson, E. & Duarte, C.M. (1994) Patterns in species
richness, size, and latitudinal range of East Atlantic fishes.
Ecography, 17, 242–248.
Marubini, F. & Thake, B. (1999) Bicarbonate addition pro-
motes coral growth. Limnology and Oceanography, 44, 716–
720.
McClain, C.R. (2007) Seamounts: identity crisis or split per-
sonality? Journal of Biogeography, 34, 2001–2008.
O’Hara, T.D. (2007) Seamounts: centres of endemism or
species richness for ophiuroids? Global Ecology and Bio-
geography, 16, 720–732.
O’Hara, T.D., Rowden, A.A. & Williams, A. (2008) Cold-water
coral habitats on seamounts: do they have a specialist fauna?
Diversity and distributions, 14, 925–934.
Orr, J.C., Fabry, V.J., Aumont, O., Bopp, L., Doney, S.C., Feely,
R.A., Gnanadesikan, A., Gruber, N., Ishida, A., Joos, F., Key,
R.M., Lindsay, K., Maier-Reimer, E., Matear, R., Monfray,
P., Mouchet, A., Najjar, R.G., Plattner, G.-K., Rodgers, K.B.,
Sabine, C.L., Sarmiento, J.L., Schlitzer, R., Slater, R.D.,
Totterdell, I.J., Weirig, M.-F., Yamanaka, Y. & Yool, A.
(2005) Anthropogenic ocean acidification over the twenty-
first century and its impact on calcifying organisms. Nature,
437, 681–686.
Parin, N.V., Mironov, A.N. & Nesis, K.N. (1997) Biology of the
Nazca and Sala y Gomez submarine ridges, an outpost of the
Indo-West Pacific fauna in the Eastern Pacific Ocean:
composition and distribution of the fauna, its communities
and history. Advances in Marine Biology, 32, 145–242.
Pearce, J. & Ferrier, S. (2000) Evaluating the predictive per-
formance of habitat models developed using logistic
regression. Ecological Modelling, 133, 225–245.
Phillips, S.J. & Dudık, M. (2008) Modeling of species distri-
butions with Maxent: new extensions and a comprehensive
evaluation. Ecography, 31, 161–175.
Phillips, S.J., Anderson, R.P. & Schapire, R.E. (2006) Maxi-
mum entropy modeling of species geographic distributions.
Ecological Modelling, 190, 231–259.
Renegar, D.A. & Riegl, B.M. (2005) Effect of nutrient enrich-
ment and elevated CO2 partial pressure on growth rate of
Atlantic scleractinian coral Acropora cervicornis. Marine
Ecology Progress Series, 293, 69–76.
Rex, M.A., McClain, C.R., Johnson, N.A., Etter, R.J., Allen,
J.A., Bouchet, P. & Waren, A. (2005) A source-sink
hypothesis for abyssal biodiversity. The American Naturalist,
165, 163–178.
Rex, M.A., Etter, R.J., Morris, J.S., Crouse, J., McClain, C.R.,
Johnson, N.A., Stuart, C.T., Deming, J.W., Thies, R. &
Avery, R. (2006) Global bathymetric patterns of standing
stock and body size in the deep-sea benthos. Marine Ecology
Progress Series, 317, 1–8.
Richer de Forges, B., Koslow, J.A. & Poore, G.C.B. (2000)
Diversity and endemism of the benthic seamount fauna in
the southwest Pacific. Nature, 405, 944–947.
Roark, E.B., Guilderson, T.P., Dunbar, R.B. & Ingram, B.L.
(2006) Radiocarbon-based ages and growth rates of
Hawaiian deep-sea corals. Marine Ecology Progress Series,
327, 1–14.
Roberts, J., Wheeler, A.J. & Freiwald, A. (2006) Reefs of the
deep: the biology and geology of cold-water coral eco-
systems. Science, 312, 543–547.
Rogers, A.D. (1994) The biology of seamounts. Advances in
Marine Biology, 30, 305–350.
Rogers, A.D. (1999) The biology of Lophelia pertusa (Linnaeus
1758) and other deep-water reef-forming corals and impacts
from human activities. International Review of Hydrobiology,
84, 315–406.
Rogers, A.D., Baco, A., Griffiths, H. & Hall-Spencer, J.M.
(2007) Corals on seamounts. Seamounts: ecology, fisheries
and conservation (ed. by T.J. Pitcher, T. Morato, P.J.B. Hart,
M.R. Clark, N. Haggan and R.S. Santos), pp. 141–169.
Blackwell Publishing, Oxford.
Rogers, A.D., Clark, M.R., Hall-Spencer, J.M. & Gjerde, K.M.
(2008) The science behind the guidelines: a scientific guide to
the FAO draft international guidelines (December 2007) for
the management of deep-sea fisheries in the high seas and
examples of how the guidelines may be practically imple-
mented. IUCN, Gland, Switzerland.
Samadi, S., Bottan, L., Macpherson, E., Richer de Forges, B. &
Boisselier, M.-C. (2006) Seamount endemism questioned by
the geographic distribution and population genetic structure
of marine invertebrates. Marine Biology, 149, 1463–1475.
Samadi, S., Schlacher, T. & Richer de Forges, B. (2007)
Seamount benthos. Seamounts: ecology, fisheries and conser-
vation (ed. by T.J. Pitcher, T. Morato, P.J.B. Hart, M.R.
Clark, N. Haggan and R.S. Santos), pp. 119–140. Blackwell
Publishing, Oxford.
Sanders, H.L. (1969) Marine benthic diversity and the stability-
time hypothesis. Brookhaven Symposia on Biology, 22, 71–81.
Schroder-Ritzrau, A., Freiwald, A. & Mangini, A. (2005) U/Th-
dating of deep-water corals from the eastern North Atlantic
and the western Mediterranean Sea. Cold-water corals and
ecosystems (ed. by A. Freiwald and J.M. Roberts), pp. 157–
172. Springer-Verlag, Berlin.
Shannon, C.E. (1948) A mathematical theory of communica-
tion. Bell System Technical Journal, 27, 379–423, 623–656.
Sissenwine, M.P. & Mace, P.M. (2007) Can deep water fisheries
be managed sustainably? Report and documentation of the
Global stony coral habitat on seamounts
Journal of Biogeography 36, 1111–1128 1127ª 2009 The Authors. Journal compilation ª 2009 Blackwell Publishing Ltd

expert consultation on deep-sea fisheries in the high seas,
Bangkok, Thailand, 21–23 November 2006. FAO Fisheries
Report No. 838. FAO, Rome.
Sokal, R.R. & Rohlf, F.J. (1995) Biometry: the principles and
practice of statistics in biological research. W.H. Freeman,
New York.
Stocks, K.I. & Hart, P.J.B. (2007) Biogeography and biodi-
versity of seamounts. Seamounts: ecology, fisheries and con-
servation (ed. by T.J. Pitcher, T. Morato, P.J.B. Hart, M.R.
Clark, N. Haggan and R.S. Santos), pp. 255–281. Blackwell
Publishing, Oxford.
Stone, R.P. (2006) Coral habitat in the Aleutian Islands of
Alaska: depth distribution, fine-scale species associations,
and fisheries interactions. Coral Reefs, 25, 229–238.
Thiem, Ø., Ravagnan, E., Fossa, J.H. & Berntsen, J. (2006) Food
supply mechanisms for cold-water corals along a continental
shelf edge. Journal of Marine Systems, 60, 207–219.
Tynan, C.T., Ainley, D.G., Barth, J.A., Cowles, T.J., Pierce, S.D.
& Spear, L.B. (2005) Cetacean distributions relative to ocean
processes in the northern Californian Current System. Deep-
Sea Research II, 52, 145–167.
UN General Assembly (2006) Resolution adopted by the General
Assembly. 60/30. Oceans and the law of the sea. Available at:
http://www.unep.org/dewa/assessments/EcoSystems/water/
MarineAssessment/reports/A-RES-60-30.pdf (last accessed 4
October 2008).
Vinogradova, N.G. (1997) Zoogeography of the abyssal and
hadal zones. Advances in Marine Biology, 32, 325–387.
Watson, R., Kitchingham, A. & Cheung, W.W. (2007) Catches
from world seamount fisheries. Seamounts: ecology, fisheries
and conservation (ed. by T.J. Pitcher, T. Morato, P.J.B. Hart,
M.R. Clark, N. Haggan and R.S. Santos), pp. 400–412.
Blackwell Publishing, Oxford.
Wessel, P. (2001) Global distribution of seamounts inferred
from gridded Geosat/ERS-1 altimetry. Journal of Geophysical
Research, 106, 19,431–19,441.
Wessel, P. (2007) Seamount characteristics. Seamounts: ecology,
fisheries and conservation (ed. by T.J. Pitcher, T. Morato,
P.J.B. Hart, M.R. Clark, N. Haggan and R.S. Santos), pp.
3–25. Blackwell Publishing, Oxford.
White, M., Mohn, C., de Stigter, H. & Mottram, G. (2005)
Deep-water coral development as a function of hydro-
dynamics and surface productivity around the submarine
banks of the Rockall Trough, NE Atlantic. Cold-water corals
and ecosystems (ed. by A. Freiwald and J.M. Roberts), pp.
503–514. Springer-Verlag, Berlin.
White, M., Bachmachnikov, I., Arıstegui, J. & Martins, A.
(2007) Physical processes and seamount productivity.
Seamounts: ecology, fisheries and conservation (ed. by T.J.
Pitcher, T. Morato, P.J.B. Hart, M.R. Clark, N. Haggan
and R.S. Santos), pp. 65–84. Blackwell Publishing,
Oxford.
Wiley, E.O., McNyset, K.M., Peterson, A.T., Robins, C.R. &
Stewart, A.M. (2003) Niche modeling and geographic range
predictions in the marine environment using a machine-
learning algorithm. Oceanography, 16, 120–127.
Worm, B., Lotze, H.K. & Myers, R.A. (2003) Predator diversity
hotspots in the blue ocean. Proceedings of the National
Academy of Sciences USA, 100, 9884–9888.
Zeebe, R.E. & Wolf-Gladrow, D. (2001) CO2 in seawater:
equilibrium, kinetics, isotopes. Elsevier, New York.
Zweig, M.H. & Campbell, G. (1993) Receiver-operating char-
acteristic (ROC) plots – a fundamental evaluation tool in
clinical medicine. Clinical Chemistry, 39, 561–577.
BIOSKETCH
Derek P. Tittensor is a postdoctoral fellow specializing in
marine macroecology. He is particularly interested in the
effects of scale, sampling and anthropogenic impacts on
patterns of marine diversity and distribution.
Editor: Alistair Crame
D. P. Tittensor et al.
1128 Journal of Biogeography 36, 1111–1128ª 2009 The Authors. Journal compilation ª 2009 Blackwell Publishing Ltd


![Quaternary International ] Genesis of subtropical soils with stony horizons in NE Argentina: Autochthony and polygenesis](https://static.fdokumen.com/doc/165x107/631865e84de2f6960b040b85/quaternary-international-genesis-of-subtropical-soils-with-stony-horizons-in-ne.jpg)


![MANGROVES. SEAGRASSES AND CORALS [A simple layman-type field guide]](https://static.fdokumen.com/doc/165x107/6321610a0c12e1161503c4a8/mangroves-seagrasses-and-corals-a-simple-layman-type-field-guide.jpg)

