
In-Situ FT-IR Measurements at Industrial Combustion Facilities
8
AIR & WASTE MANAGEMENT ASSOCIATION • Since 1901 Optical Remote Sensing For Environmental And Process Monitoring
-
Upload
independent -
Category
Documents
-
view
4 -
download
0
Transcript of In-Situ FT-IR Measurements at Industrial Combustion Facilities

AIR & WASTE MANAGEMENT ASSOCIATION
• Since 1901
Optical Remote Sensing For
Environmental And Process Monitoring
- -- ---
Optical Remote Sensing for Environmental and Process Monitoring
Proceedings ofa Symposium Sponsored by the . Air&WasteManagementAssociation
San Francisco, CA September 25-27, 1995
The Proceedings of a Symposium Sponsored by
t:~ . ...:... \ : .-. 1...... .....
AIR & WASfE MANAGEMENT ASSOCIATION
• S'NC£ 1907

In-Situ FT-IR Measurements at Industrial Combustion Facilities
Anthony S. Bonanno, Chad M. Nelson, Marek A. Wojtowicz, Kim S. Knight, Michael A. Serio, and Peter R. Solomon
Advanced Fuel Research, Inc. 87 Church Street
East Hartford, CT 06108
ABSTRACT This paper describes the development and testing ofa prototype Fourier transform infrared (FT-IR)
based measurement system for continuous emission monitoring (CEM) and process control in fossil fuelfired power plants. On several occasions, prototype systems have been transported and assembled at fullscale and pilot-scale fossil fuel-fired combustors. The in-situ version of the prototype is capable of measuring NH3 and HCl concentrations, which are difficult to measure extractively, as well as CO, CO2,
NO" H20, and SOx concentrations. The results of recent tests will be presented. which involve in-situ monitoring of selective non-catalytic reduction (SNCR) of NO, based on simultaneous measurement of NO, NH), and CO.
INTRODUCTION The use ofFT-IR spectrometry as a CEM in fossil fuel-fired power plants offers several advantages.
A single instrument can be used to simultaneously monitor several pollutant species, thereby greatly reducing the cost and complexity of the CEM system. Additionally, the flexibility ofFT-IR offers different sampling strategies depending on the type of analysis required. Extractive measurements provide a low maintenance approach for simultaneously determining concentrations of several species, including CO, CO2, NO, and SOz. Alternatively, in-situ measurements can be used to determine concentrations of species that are otherwise difficult to monitor, for example, NH) and HC\. The capability to measure NH) concentrations is particularly useful for monitoring and, potentially, controlling the urea injection process used for NO, reduction. In-situ FT-IR transmission measurements can also be used to determine the temperatures of gases, and the number density, particle size, and composition of particulates in the effluent [1-5]. Recent work has also demonstrated the feasibility of in-situ FT-IR emission measurements for determining the concentration of unburned carbon in flyash [6,7]. Although FT-IR is an established multicomponent sensor technology, the use ofFT-IR for CEM and process monitoring and control systems in power plants is still in the developmental stages, particularly in the case of in-situ measurements [1-6]. In this work, we describe the development and testing of an in-situ FT-IR Spectrometer system for process monitoring and control of selective non-catalytic reduction (SNCR) of NO, using the Nalco Fuel Tech (NFT) NO,OUTn .1 process.
EXPERIMENTAL All field test measurements were performed at NFT's pilot-scale combustion facility (0.25 MBTU/hr)
in Naperville, IL during the week of February 20-24, 1995. The objective of these measurements was to demonstrate quantitative in-situ FT-IR analysis of NO, CO, and NH) at elevated temperatures. The facility consisted of a horizontally-fired combustor with an 8-inch inner-diameter combustion zone, as shown in Figure 1. This unit was equipped with conventional CEM equipment for NO" Oz, CO, and S02 analysis, and with a gas chromatograph for NzO measurement. The ammonia concentration was determined extractively using wet chemical analysis. Temperature and residence time within the unit could be adjusted, and urea or other reagents could be injected at several locations along the combustor. A nitro-containing compound was added to the fuel (oil) to provide the .desired NO, level in the combustion effluent. The NO,OUl'M reagent was injected in a temperature-controlled zone downstream from the combustor using a peristaltic pump interfaced to a personal computer.
611

l(ll .. WillllfHY
Down.trellrD ~ IT·ln MCDIurement -...
J(Or Window
Uraa Jrtiection FT.IR Meuuremenc.
Figure 1. A schematic diagram 0/ the Nalco Fuel Tech pilot-scale combustion/acility. T/ through T, are thermocouples. T;:. TJ, and T. were inter/aced to the compllter used/or FT-IR data collection.
High-temperature FT-IR measurements were made at two locations in the facility, approximately 1.6 meters downstream from the injection point (upstream zone), and approximately 5.7 meters downstream from the injection point (downstream zone), as indicated in Figure I The temperature at the upstream zone was typically in the range of700-850°C, and the temperature in the downstream zone was usually between 450~550°C. In both locations, the facility was modified to provide optical access to the emuent stream through directly opposed 2 inch i.d. ports. An 8 inch extension pipe was attached to each port in order to facilitate the installation of infrared transparent windows. An On-Line Technologies Model 2100 FT-IR spectrometer was mounted with the 1 inch diameter collimated beam directed through the port. Focusing optics and a liquid nitrogen-cooled, narrow-band MCT detector were installed at the opposed port.
On-Line Technologies' FT-IR software for LabVIEW (National Instruments) was used for collection and processing of spectra, acquisition of thermocouple data (thermocouples Tz', TJ " and T~'), and control of the reagent injection pump. This software package provides a user-friendly, graphical programming environment for the development of process monitoring and control software based on FT-IR measurements. The details of the quantitative analysis methods are described elsewhere [8].
RESULTS AND DISCUSSION Figure 2 shows time-line plots of the process parameters and the effluent gas concentrations for
measurements made in the upstream zone. The combustor was run under conditions that provided a baseline NO, level of about 800 ppm, and the urea injection rate and the injection-zone temperature were varied. Two injection-zone temperatures were selected for the experiments: 800 and 950°C, which are, respectively, below and near the optimum temperature for the process (see Figure 2, top). Two urea injection rates were chosen, corresponding to stoichiometric and above stoichiometric conditions with respect to the baseline NO.~ level (plotted as stoichiometric ratio (NSR) in Figure 2). The FT-IR data for NHj, NO, and CO are also plotted in Figure 2 (lines through points), and are overlaid with the CEM data for NO and CO (lines). As expected, the NHJ concentration increased at 17:00 and at 17:20 when the urea injection was increased at the sub-optimal injection-zone temperature. Only a minor reduction of NOx was observed at this low temperature. At about 17:40, when the temperature was increased to reach the optimal range for the NO,OUl'M process, a corresponding reduction in NH3 and NO levels was observed. Also, the CO concentration increased due to the increased thermal decomposition of urea. When the injection rate was returned to stoichiometric at 18:00, Nl-I3 and CO concentrations both decreased due the reduced excess of urea, and the nitric oxide level increased. Note that some
612

1050-r--------------------------------------------------------------------------. Injection Zone Temp (Celcius)
1000
950
900
850 800J-------------------------------~
750~----------,_----------._----------,_----------._----------,_----------~ 16:40:00 17:00:00 17:20:00 17:40:00 18:00:00 18:20:00 18:40:00
2.0 Urea Injection Rate (NSR)
1.5 1.0
/ /
\ 0.5
0.0 16:40:00 17:00:00 17:20:00 17:40:00 18:00:00 18:20:00 18:40:00
1400 Ammonia Conc. (ppm)
o-f-----..a...l
-200 .................................... , .................................... , .................................. T··································,················-·.........•...•....,...•.•..•..........•.•...•••........ 16:40:00 17:00:00 17:20:00 17:40:00 18:00:00 18:20:00 18:40:00
1000~------------------------------------------------------------------------__.
Nitric Oxide Conc. (ppm) 800-,.....,._____
1200
1000
800
600
400
200
600
400
200
o
-200-~----------,_----------_r----------~------------~----------_r----------~ 16:40:00 17:00:00 17:20:00 17:40:00 18:00:00 18:20:00 18:40:00
60~------------------------------------------------------------------------__.
Carbon Monoxide Conc. (ppm) 50
40
30
20
10
-10~~--------~------------r_----------._----------_r----------_.----------__1 16:40:00 17:00:00 17:20:00 17:40:00 18:00:00 18:20:00 18:40:00
Figure 2. Process data collected ill the ups/ream loca/ion (see Figure J) at temperatures betweell 700 and 850°C. (a) Injectioll-zoJle temperature roC); (h) urea ;,?}ection rate (N5;R); (c) ammonia Concentratioll (ppm); (d) NO cOllcentratioll (ppm); (e) CO concefJ/ratiofJ (ppm). 5;olid lines ill Figs. 2d and 2c represent independently measured NO and CO cOllcen/ratiolls.
613

discrepancy was observed between the FT-IR and CErvI values for NO and, to some extent, for CO While the trends agree well, it appears that a negative bias has been introduced to the FT-IR results. This is believed to result from a change in water vapor concentration during the reagent injection period. Although this was fairly well compensated for through spectral correction algorithms [8], some residual features due to inaccurate water correction were observed in the spectra. This type of cross-interference often results in a bias similar to that observed for nitric oxide. Fortunately, water vapor is not a significant spectral interferent for NH), therefore the validity of the NH) data is not compromised.
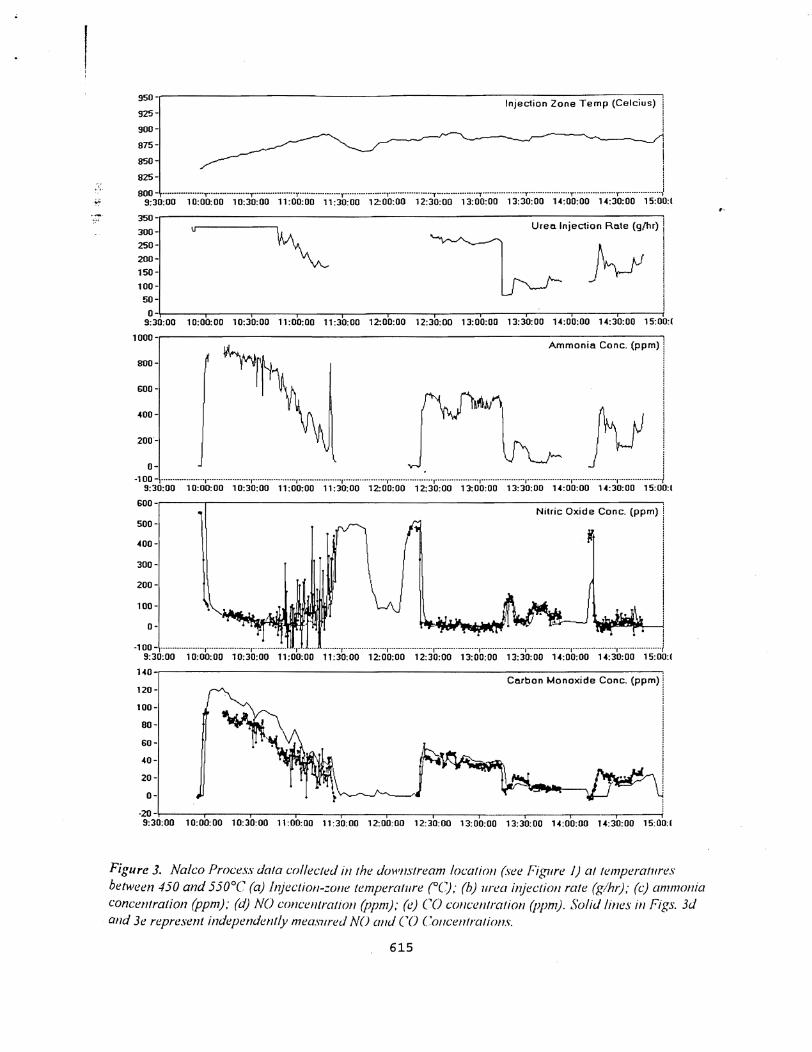
A similar anaylsis was performed in the downstream zone, with a lower effluent gas temperature and a longer optical pathlength. Figure 3 shows time-line plots of the process parameters and the effluent gas concentrations. Spectra were collected at about 20 second intervals with approximately 7 seconds of signal averaging. During the period of about 10:45 to II :30, a large increase in the noise was observed for the NO and CO analysis. This was caused by a misalignment of the spectrometer, which resulted in lower optical throughput and increased interference from water vapor. ·Since• .water vapor is not a significant spectral interferant for NHJ , no significant effect on the NHJ analysis was observed. The data collected in the period between 10:00 and 10:45 shows that as the process temperature approached the SNCR temperature window (870-1, 150°C), the efficiency of NO removal by the reaction with NH) increased. As a consequence, NO levels decreased from approximately 100 ppm down to zero, and this was accompanied by a corresponding decrease in NHJ concentration.
At II :45, the rate of urea injection was decreased, which resulted in a gradual reduction ofNHJ
levels, and an increase in NO concentration. Between approximately 11:30 and 12: IS, FT -IR measurements were temporarily discontinued in order to realign the optics. After 12: 15, the FT-IR measurements were resumed, and continued until 14:45, with a short break between 13:55-14: 15. It can be seen that all the changes in urea flow rate were closely followed by a corresponding changes in NHJ and NO levels. As expected, CO and NH1 concentration profiles are in excellent agreement with each other over the whole testing period. This is due to the fact that both CO and NHJ are products of thermal decomposition of urea. It should also be noted that the NO and CO concentrations agree well with those reported by NFT's CE~1 system. No independent continuous NHJ measurement was available at NFT, and thus the FT-IR measurements ofNHJ could not be directly validated. The magnitudes of the measured NHJ concentrations. however. were found to be in good agreement with the few data points collected using an extractive wet-chemistry analysis. j'v!oreover. the correct trends in NH1 variation discussed above, as well as the gererally good agreement of the FT-IR NO and CO data with the CEM data, provide indirect validation for the collected !,rH) data. To the best of our knowledge, this is the most reliable on-line method for the determination of j\.'1-I) concentrations in high-temperature gas streams.
CONCLUSIONS In summary, good performance of the FT-IR multi-gas monitor was demonstrated during several
hours of continuous operation under hot gas cleanup conditions. The observed trends in NH), NO, and CO concentrations were found to be as expected in relation to the reagent injection rate and injection zone temperature. In general, good agreement was found between FTIR data and independently measured CO and NO concentrations. Software corrections for water interference with NO measurement were successfully applied in the temperature range 450-550°C, and allowed for the measurement of NO levels as low as 25 ppm, with a 7-second data collection time. At higher temperatures (700-850°C), a negative bias in the NO measurement was difficult to completely eliminate.· Refinements in system software and hardware will be directed to solve this problem Under all conditions used during the field test, N20 levels were found to be b~low detection limits. In future work, NP measurements will be investigated under conditions favoring formation of this species.
614
950-·~--------------------------------------------------I-n~je-ct-i-o-n-2-o-n-e-T-e-m--p-(~C-e~le~i-us~):
925
900
875
850 I i
825- ! 800 - ...........__ .....,......._..........,.........-_ ........,.....··············,.··················,···················T·__···············T··--··············,.··················T··················,.··················~
9:30:00 10:00:00 10:30:00 11 :00:00 11 :30:00 12:00:00 12:30:00 13:00:00 13:30:00 H:OO:OO 14:30:00 15:00:(
350-,----------------------------------------------------------------------,1 Ureo.lnjection Rate (gthr) 1
~ ~~~~ ~ I 200-
Ii
150100-
I50O-~----~----_.-----.------r_----._----_.----~------._----._----_.----_,.
9:30:00 10:00:00 10:30:00 11 :00:00 11:30:00 12:00:00 12:30:00 13:00:00 13:30:00 14:00:00 14:30:00 15:00:(
1000-·r-------------------------------------------------------------------------~
Ammonia Cone. (ppm) ! 800 1
; ,600·
400 r i -]V i
,
200 ~._, II 0
·100 - ......._ .........,...................,...................,...................,...................,...............:... ,...................,...................,...................,...................,...................) 9:30:00 10:00:00 10:30:00 11:00:00 11:30:00 12:00:00 12:30:00 13:00:00 13:30:00 14:00:00 14:30:00 15:00:(
600Nilrie Oxide Cone. (ppm)
500
400
300
200
100 - J 0
I
1-100 - ...................,...................,............... T' ." ........, ..................., ...................,...................,...................,................... ,...................,...................,
100
80
60
40
20
0
! 1 i
l !
\~jP" ~
9:30:00 10:00:00 10:30:00 11:00:00 11:30:00 12:00:00 12:30:00 13:00:00 13:30:00 H:OO:OO H:30:00 15:00:(
140-.-------------------------------------------------------------------------, Carbon Monoxide Cone. (ppm) i
120
!-20- , iii I Ii; 9:30:00 10:00:00 10:30:00 11:00:00 11:30:00 12:00:00 12:30:00 13:00:00 13:30:00 14:00:00 14:30:00 15:00:(
Figure 3. Na/co Process data collected ill the downstream locatioll (~'ee Figure 1) at temperatures between 450 and 550°C (a) ltU'ection-zolle temperature (OC): (b) urea iru'ection rate (glhl); (c) ammonia concentration (ppm); (d) NO concelltration (ppm); (e) CO cOllcelltration (ppm). Solid lines in Figs. 3d
. alld 3e represent independently mea.mred NO alld CO COllcentrations.
615

ACKNOWLEDGEMENTS We would like to extend our gratitude to Dr. William Sun, Mr. Cari Chenand a and Mr John
Hofmann and the rest of the staff at Nalco Fuel Tech (Naperville, IL) for their assistance in arranging and conducting the field tests. The support of this work by the U.S. DOE under Grant Nos. DE-FG0594ER81694 and DE-FG05-94ER81695 is also gratefully acknowledged.
REFERENCES
1. Serio, M.A., Carangelo, R.M., "An FT-IR Based Monitoring Device for NO" SO" and Particulates: Froc. Eighth Ann. 111(1. !'itlshllrgh Coal ('Oil!, 1073 (199 J)
2. Morrison, P.W. Jr., Solomon, PR, Serio, !\LA, Carangelo, R.M., Markham, J.R., ..,<,'ellsors, 8(\3), 26 (1991).
3. Romanosky, R., "Analytical Instrumentation for Monitoring Process Streams," Proc. Eighth Ann. IntI. Pittsburgh Coal Conj., 133 (1991).
4. Nelson, C.M., Knight, K.S., Serio, M.A, Solomon, P.R., Halter, M.A, ACS Division ofFuel Chemistry Preprints, 38(4), 1159 (1993).
5. Nelson, C.M., Serio, M.A, Bonanno, AS., Knight, K.S., and Solomon, P.R., Froc. Eleventh Ann. Int. Coal Conj., Pittsburgh, P A, VoL I, 524-529, (1994).
6. Bonanno, AS., Nelson, C.M., Knight, K.S., Serio, M.A. and Solomon, P.R.,Froc. Ninth Inti. Fomm lm Process Analytical Chemistty, (Jan 22-25, 1995) Houston, TX.
7. Bonanno, AS., Knight, KS., Kinsella, K, Serio, M.A. and Solomon, P.R., SPIE - The IllIemaliolJ£ll Society for Optical Ellgineertng, Vol 2367, Nov. 1994
8. Bonanno, AB, Wojtowicz, M.A. Knight, K.S., Serio, MA, and Solomon, P.R., Final Report for DOE Grant No. DE-FG05-948 1694 (iv1ay, 1995).
616