In situ approaches to establish colloidal growth kinetics
6
Journal of Colloid and Interface Science 279 (2004) 458–463 www.elsevier.com/locate/jcis In situ approaches to establish colloidal growth kinetics Lawrence D’Souza, Andreas Suchopar, Ryan M. Richards ∗ School of Engineering and Science, International University Bremen, Campus Ring 8, Bremen 28759, Germany Received 18 March 2004; accepted 27 June 2004 Available online 30 July 2004 Abstract A technique based on the back scattering phenomenon of dynamic light scattering has been employed to monitor the kinetics of gold and platinum metal nanoparticle growth and silver nanoparticle oxidation as well as in the determination of particle sizes ranging from 1 to 200 nm in diameter. The systems were chosen to examine the applicability of dynamic light scattering to nanoresearch over a broad range of sizes as well as both metallic and nonmetallic systems. The advantages of this instrumentation over traditional instruments such as X-ray diffraction (XRD), transmission electron microscopy (TEM), and scanning electron microscopy (SEM) have been highlighted. 2004 Elsevier Inc. All rights reserved. Keywords: High performance particle sizer; HPPS; Back scattering; Particle size determination; Dynamic light scattering and growth kinetics 1. Introduction Nanoscale materials represent one of the most dynamic and rapidly growing fields in modern science. While the re- search into these materials and their size-dependent proper- ties is vast, there are still numerous “bottlenecks” hindering this field. One particular hindrance to the development of nanotechnology is the general lack of preparative methods that allow scientists to prepare monodisperse nanoscale ma- terials with a predetermined size, shape and composition. The inability of scientists to observe in situ particle forma- tion and follow growth kinetics has made this task particu- larly difficult. Traditional methods for characterizing nanoclusters in science and technology are very expensive and time con- suming besides having their own limitations and advan- tages [1–4]. These methods include X-ray diffraction, trans- mission electron microscopy, small-angle X-ray scattering, and scanning electron microscopy [5–9]. All of these instru- ments have various limitations, in particular with observ- ing particles in situ. X-ray diffraction analysis is suitable * Corresponding author. Fax: +49-4212003229. E-mail address: [email protected] (R.M. Richards). for crystalline metallic systems with particle sizes above ≈ 5 nm, through application of Debye–Scherrer equation to the broadening of diffraction patterns for nanoclusters. Al- though this method can be applied to materials of smaller sizes, the results are often tentative. On the other hand, SEM can probe clusters of dimensions only above 10 nm in diameter. TEM consists of laborious instrumentation and requires very high voltages (usually about 300 kV). Fur- thermore, these techniques are limited to samples in powder form. TEM is only able to provide information on samples under a high vacuum and the effects of focusing an elec- tron beam on a sample are often neglected, i.e., for many nanoscale systems the focusing of an electron beam on a small particle or group of particles can result in a rearrange- ment of atoms or melting. Moreover, in situ kinetics exper- iments are generally not possible with these instrumenta- tions. Finke et al. [10,11] have used nanoclusters catalytic ac- tivity to follow kinetics of transition-metal nanocluster for- mation. This method is useful only with gas phase reducing agents but is not particularly applicable in the case of liquid phase reducing agents. Moreover, this technique is unable to provide any information about the size distribution of nan- oclusters. Recently, Goodman [12] used in situ STM to study 0021-9797/$ – see front matter 2004 Elsevier Inc. All rights reserved. doi:10.1016/j.jcis.2004.06.086
-
Upload
independent -
Category
Documents
-
view
5 -
download
0
Transcript of In situ approaches to establish colloidal growth kinetics
oldfrom 1 tongeay
Journal of Colloid and Interface Science 279 (2004) 458–463www.elsevier.com/locate/jcis
In situ approaches to establish colloidal growth kinetics
Lawrence D’Souza, Andreas Suchopar, Ryan M. Richards∗
School of Engineering and Science, International University Bremen, Campus Ring 8, Bremen 28759, Germany
Received 18 March 2004; accepted 27 June 2004
Available online 30 July 2004
Abstract
A technique based on the back scattering phenomenon of dynamic lightscattering has been employed to monitor the kinetics of gand platinum metal nanoparticle growth and silver nanoparticle oxidation as well as in the determination of particle sizes ranging200 nm in diameter. The systems were chosen to examine the applicability of dynamic light scattering to nanoresearch over a broad raof sizes as well as both metallic and nonmetallic systems. The advantages of this instrumentation over traditional instruments such as X-rdiffraction (XRD), transmission electron microscopy (TEM), and scanning electron microscopy (SEM) have been highlighted. 2004 Elsevier Inc. All rights reserved.
Keywords: High performance particle sizer; HPPS; Back scattering; Particle sizedetermination; Dynamic light scattering and growth kinetics
amicre-operingt ofodsma
tiona-
cu-
inconan-s-
ing,
rv-le
ven toAl-ller
and,nm
andur-wdereslec-anyon age-er-nta-
ac-r-cinguidle to
an-y
1. Introduction
Nanoscale materials represent one of the most dynand rapidly growing fields in modern science. While thesearch into these materials and their size-dependent prties is vast, there are still numerous “bottlenecks” hindethis field. One particular hindrance to the developmennanotechnology is the general lack of preparative meththat allow scientists to prepare monodisperse nanoscaleterials with a predetermined size, shape and composiThe inability of scientists to observe in situ particle formtion and follow growth kinetics has made this task partilarly difficult.
Traditional methods for characterizing nanoclustersscience and technology are very expensive and timesuming besides having their own limitations and advtages[1–4]. These methods include X-ray diffraction, tranmission electron microscopy, small-angle X-ray scatterand scanning electron microscopy[5–9]. All of these instru-ments have various limitations, in particular with obseing particles in situ. X-ray diffraction analysis is suitab
* Corresponding author. Fax: +49-4212003229.E-mail address: [email protected](R.M. Richards).
0021-9797/$ – see front matter 2004 Elsevier Inc. All rights reserved.doi:10.1016/j.jcis.2004.06.086
r-
-.
-
for crystalline metallic systems with particle sizes abo≈ 5 nm, through application of Debye–Scherrer equatiothe broadening of diffraction patterns for nanoclusters.though this method can be applied to materials of smasizes, the results are often tentative. On the other hSEM can probe clusters of dimensions only above 10in diameter. TEM consists of laborious instrumentationrequires very high voltages (usually about 300 kV). Fthermore, these techniques are limited to samples in poform. TEM is only able to provide information on samplunder a high vacuum and the effects of focusing an etron beam on a sample are often neglected, i.e., for mnanoscale systems the focusing of an electron beamsmall particle or group of particles can result in a rearranment of atoms or melting. Moreover, in situ kinetics expiments are generally not possible with these instrumetions.
Finke et al.[10,11] have used nanoclusters catalytictivity to follow kinetics of transition-metal nanocluster fomation. This method is useful only with gas phase reduagents but is not particularly applicable in the case of liqphase reducing agents. Moreover, this technique is unabprovide any information about the size distribution of noclusters. Recently, Goodman[12] used in situ STM to stud

L. D’Souza et al. / Journal of Colloid and Interface Science 279 (2004) 458–463 459
ualefulr for
ese
icalap
w-r-
s-et
ca-enchn-en
wasof
ing
hepar-orlightran-
byareat-
,s,
c
hs innceithmWrpho-gle
esatab-
highs ofre-Dustdi-itiv-nsich
pro-nts,
withcat-ultyght,dav-The
iza-theam-ius,ab--herre-ofis-ksso-rt in
ngl asteri-abil-izes.ter-pec-erap-toit
des-
petheith
aleth-
the mechanism, growth and thermal evolution of individoxide-supported metal clusters. This method is quite usto study solid state reactions and needs to develop furtheother applications.
One of the techniques that can overcome many of thdrawbacks is dynamic light scattering[13,14], which hasmade significant contributions in many areas of physchemistry. There are numerous reports available on theplication of DLS in the literature. These reports are hoever limited to the applicability of DLS in polymer chaacterization and biological studies[15–19]. Recently, Je-sionowski et al.[20] used DLS to study particle size ditribution and agglomeration of zinc silicates; Fendleral. [21] used DLS to characterize clay material interlated TiO2; Frontera et al.[22] used DLS to study phasdevelopment in zeolites during its synthesis and Muet al. [23] studied the aging behavior of colloidal suspesions of Laponite using DLS. Light scattering has beused to monitor agglomeration of nanoparticles andfound to be problematic due to the nonmonodispersityparticles present and the possibility of multiple scatter[24,25].
Light scattering is a powerful method for examining tstructural and dynamic properties of colloids and nanoticles, but until recently, it was not particularly effective fparticles less than 5 nm in size. In general, the scatteredis collected at a particular angle; the signal shows thedom fluctuations or noise. From the signals computedautocorrelation functions, the properties of the particlesdetermined. The stray light equation for dynamic light sctering is given as
IS ={[(
1
M+ 2A2C
)(1+ 16π2n2
0R2g
3λ20
sin2(
θ
2
))]
×[
λ40NA
4π2n20
(dn
dC
)−2](GF
I0
)(1
C
)}−1
,
IS ={[(
1
M+ 2A2C
)P(θ)
](1
K
)(GF
I0
)(1
C
)}−1
,
whereIS is intensity of scattered light,P(θ) is shape factorM is molecular weight,C is concentration of the particleA2 is second virial coefficient,Rg is radius of gyration,q isscattering angle,n is solvent refractive index,I0 is inten-sity of incident radiation,λ0 is laser wavelength,dn/dC isrefractive index increment, andGF is instrument geometrifactor.
Recent advancement in research and development witimproved electronics and measurement techniques haspired our interest in this technique. The high performaparticle sizer (HPPS) is an improved version of DLS wmore advanced features. HPPS is equipped with a 3He–Ne laser and a tunnel photomultiplier, both have highesensitivity than the classical 3 W lasers and standardtomultipliers. The scattered light is collected at an an
-
-
of 173◦ to the incident laser radiation, which overcommultiple scattering, by the particles, which is minimized180◦. The back scattering phenomenon minimizes thesorption of the radiation and allows measurements atconcentrations and through wide ranging particle size(diameter= 0.6 to 6000 nm). The back scattering alsoduces the error in measurements due to dust particles.particles being large; scatter light mainly in the forwardrection. Furthermore, back scattering improves the sensity of the instrument nearly 50 fold over previous versioof dynamic and static light scattering instruments, in whscattered light is collected at an angle of 90◦. Weakly scat-tering systems and highly absorbing systems such asteins, micelles, microemulsions, nanosols, dyes, pigmeand toners can be easily studied, which is not possibletraditional dynamic scattering techniques. For weakly stering systems and highly absorbing systems the difficarises from the reduction in the intensity of scattered liusing a scattering angle of 90◦. This is for two reasonsthe absorption reduces the power of the incident beam anthe amount of scattered light is further reduced by hing to pass through the sample before being detected.HPPS instrument is outfitted with an automated optimtion of the cell position to change the path length ofradiation to handle lower and higher concentration sples. The information obtainable is hydrodynamic radparticle distribution and dispersity, solution composition,solute molecular weight, second virial coefficient, macromolecular conformation, and shape estimation. A furtadvantage of this instrumentation is that data collectionquires only minutes, facilitating the in situ observationparticle formation and growth. In case of multimodal dtribution, resolution of two different size distribution peabecomes difficult if they are very close to each other, relution becomes apparent if they are at least 10 nm apasize.
Here we report the application of HPPS in monitorithe kinetics of metal cluster growth and decay as welin determining particle sizes of various nanoscale maals. The systems were chosen to examine the applicity of HPPS to nanoresearch over a broad range of sA polymer sample and Pd colloid were chosen to demine the accuracy of HPPS at 200 and 100 nm, restively. Gold and platinum nanoparticle formation and silvnanoparticle oxidation were studied to determine theplicability to kinetics and provide a direct comparisonwell established literature results. Finally, the lower limof the instrument was examinedby using well-characterizepolyoxoanion samples whose size has been previouslytablished by single crystal X-ray structures. It is our hothat establishing the applicability of the HPPS system tostudy of nanoscale materials will provide researchers wa tool that will facilitate the characterization of nanoscmaterials and aid in development of the synthetic meods.
460 L. D’Souza et al. / Journal of Colloid and Interface Science 279 (2004) 458–463
m-s-ofri-Plus
calup-h.urey.
im,
Y/orm. Th
-per-and
erednts,e of
enteea-d folec-singut
ate.t fored
to
em-
1
ruced
of
]the
ad-
allyne,
rwase
toan-
ausec-ddi-ch-ec-
Thenm
lea-It isausof
eeake red
counts
2. Experimental
2.1. Chemicals
Duke Scientific Corporation supplied the polymer saple of polystyrene latex hydrosol with a previously etablished particle radius of 100 nm. Micropore waterresistance 18.2 M�cm was used throughout the expements and the apparatus was supplied by PurelabGermany. Pd(II) acetate, disodium citrate, AgNO3, H2PtCl6,HAuCl4, and acetonitrile were supplied by Fluka ChemiCorporation. Methanol and sodium borohydride were splied by AppliChem, GmbH. KBr was supplied by AldricPhosphotungstate with the well-known Keggin struct[PW11O39]7− was supplied by Prof. Kortz, IUB, GermanThe almost spherical, monolacunary [PW11O39]7− has a ra-dius of 0.52 nm based on crystallographic data[26]. Thegases H2, N2, and Ar were supplied by Messer-GriessheGermany and of 5.0 purity.
2.2. Apparatus and measurement description
UV–visible spectra were recorded using a Varian CAR100 Bio-Spectro-photometer. The samples were in the fof sol and absorbance was measured in a quartz cuvettescan rate applied was 100 nm min−1. Dynamic light scattering (DLS) measurements were carried out using a highformance particle sizer supplied by Malvern Instrumentsused for particle size measurement. ALV correlator V 3.0version software was used to correlate collected scattsignals. With the exception of the kinetic measureme5 runs each of 30 s duration were done over the full rangthe instrument and the average results have been presThere is no difference in the sampling ranges for the msurement for any sample. The resultant peak was zoomethe clarity of presenting the obtained results. Scanning etron microscopy (SEM) measurements have been done uJEOL JSM/5900 instrument. A drop of colloidal sol was pon the aluminum foil and the solvent allowed to evaporThe resulting sample was mounted on the instrumenSEM measurement. All the measurements were performat room temperature unless stated separately.
2.2.1. Preparation of gold colloidsThe procedure for colloid preparation was typically
mix 10 ml of aqueous 0.2 mM HAuCl4 with 0.5 ml of 1%sodium citrate solution under constant stirring at room tperature and an inert atmosphere.
2.2.2. Preparation of platinum colloidsPlatinum colloids were prepared as follows; typically
ml of 0.01 M H2PtCl6 solution and 1 ml of 0.1 M TMAClsolution were mixed with 25 ml of water. After stirring fo10 min under an inert atmosphere, metal ions were redusing 1 ml of a 1% freshly prepared aqueous solutionNaBH4.
,
e
d.
r
2.2.3. Preparation of silver colloidsTypically 1 ml of (aminopropyl)trimethoxysilane [APS
was dissolved in 7 ml of absolute methanol, followed byaddition of 0.25 ml of 0.01 M aqueous AgNO3 solution andsonicated for 15 min. The contents were reduced by thedition of 0.05 ml of aqueous 1% NaBH4. The reaction wascarried out under ambient conditions.
2.2.4. Preparation of palladium colloidsPd nanoclusters were prepared as follows, typic
2.2 mg of Pd(II) acetate was dissolved in 10 ml of acetothe contents were sonicated for 5 min. To the optically cleasolution, 60 µl of formic acid was added and sonicationcontinued for 30 min, at 40◦C. Thus, formed colloids werfound to be stable for more than six months.
3. Results and discussion
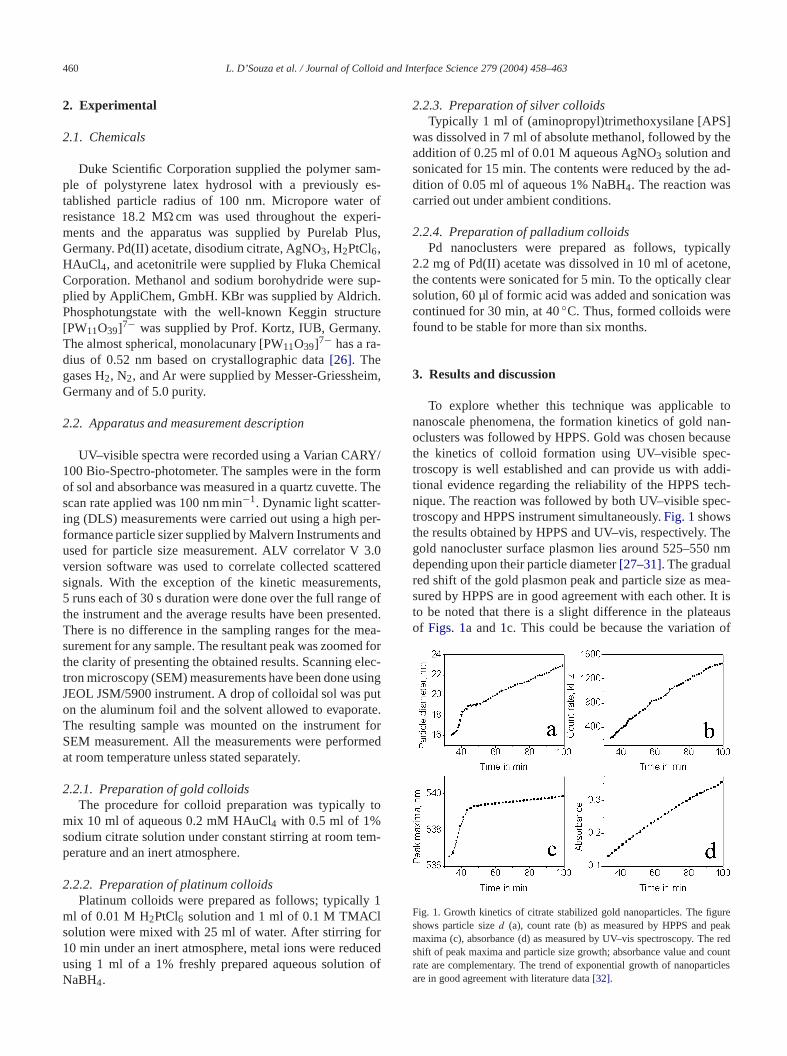
To explore whether this technique was applicablenanoscale phenomena, the formation kinetics of gold noclusters was followed by HPPS. Gold was chosen becthe kinetics of colloid formation using UV–visible spetroscopy is well established and can provide us with ational evidence regarding the reliability of the HPPS tenique. The reaction was followed by both UV–visible sptroscopy and HPPS instrument simultaneously.Fig. 1showsthe results obtained by HPPS and UV–vis, respectively.gold nanocluster surface plasmon lies around 525–550depending upon their particle diameter[27–31]. The graduared shift of the gold plasmon peak and particle size as msured by HPPS are in good agreement with each other.to be noted that there is a slight difference in the plateof Figs. 1a and1c. This could be because the variation
Fig. 1. Growth kinetics of citrate stabilized gold nanoparticles. The figurshows particle sized (a), count rate (b) as measured by HPPS and pmaxima (c), absorbance (d) as measured by UV–vis spectroscopy. Thshift of peak maxima and particle size growth; absorbance value andrate are complementary. The trend of exponential growth of nanoparticleare in good agreement with literature data[32].

L. D’Souza et al. / Journal of Colloid and Interface Science 279 (2004) 458–463 461
served. The
Fig. 2. Absorbance for platinum nanoparticles formation as measured byUV–visible spectroscopy (a) and count rate (b), particle diameterd nm (c) for platinumnanoparticles formation as obtained by HPPS. Platinum nanoparticles do not have any sharp plasmon peak. An induction period of 4 min was obparticles of diameter 23 nm were formed in approximately 35 min.abnalsel
oidsns,in-ayistic-
tionera-an-b-tch
S
pynumpar-esing
tion
r.ys-enlvere
0 snal
ti-asultsru-eac
ax-y and
ut
ds ap-ols.par-gesclesragel of
rlyhat
enron900are
iam-
ntePS0 nm
particle size and plasmon peaks is not consistent. Thesorbance value of UV–vis spectra is found to be proportioto the count rate as measured by HPPS. The results clomatch with literature reported results by Turkevich[32]. Onpage 66 he states that ‘the nucleation curve of gold collby sodium citrate reduction method contains four regioan induction period, followed by the rapid rise at the begning of the nucleation, a linear portion and finally a decportion, the general nature of the curve is the characterof autocatalytic reaction.’ Thegrowth process follows an exponential law of growth. It was also stated that the duraof the induction period decreases with increased tempture. An induction period is the time necessary to formamount of acetone dicarboxylate ions necessary for nucleation. An induction period of approximately 32 min was otained with the present experimental conditions which mawith Turkevich’s reported work.
The kinetics of Pt particle formation as followed by HPPand UV–vis spectroscopy is shown inFig. 2. The kinetics ofreduction was followed using both UV–visible spectroscoand HPPS simultaneously. The absorbance of the platicolloid was measured at 500 nm since platinum nanoticles do not have any specificcharacteristic peak in thvisible range of the spectrum but they absorb in increaamounts from the red to violet region of the spectrum[33].The platinum ions took about 35min for complete reactionand particle growth stops at 23 nm with the present reacconditions (Fig. 2c). The absorbance data (Fig. 2a) and countrate (Fig. 2b) are again in good agreement with each othe
Fig. 3shows the oxidation decay kinetics of a silver stem. Oxidation of Ag (0) nanoparticles to Ag (I) has bestudied using HPPS and UV–visible spectroscopy. Sicolloids were prepared according to the published procedurby Lev and co-workers[34]. The silver nanoparticles formalmost immediately during the reduction and within 10–2begin to oxidize back to the Ag-amine complex. The fiparticle size was 14 nm as reported by Lev (Fig. 3c) [34].During the initial stage of reduction very large Ag parcles form and then degrade very quickly within 5 minsupported by both their plasmon shift and HPPS res(Fig. 3a). The kinetics results obtained with the two instments are again in excellent agreement and correlateother (Figs. 3a–3d).
-
y
h
Fig. 3. Oxidation kinetics of Ag(0) to Ag(I). The figure shows peak mima (a), absorbance of Ag (b) as measured by UV–visible spectroscopparticle diameterd (c), count rate (d) as obtained by HPPS.The initiallyformed silver nanoparticles of size≈ 200 nm degrade to 14 nm in abo50 min. Ag nanoparticles oxidize to Ag-amine complex.
To assess the applicability tononmetallic substances anthe upper size range of nanoscale materials, HPPS waplied to a standard sample of polymer colloidal hydrosPolystyrene latex hydrosol with a previously establishedticle diameter of 200 nm was used for testing. SEM imaof polystyrene latex (not shown here) show that the partiare uniform in size with a spherical shape and the avesize of the particles is 200 nm in diameter. Typically, 20 µpolymer concentrate was diluted in 2 ml of water for HPPSstudies.Fig. 4 shows the results obtained by HPPS, cleademonstrating the particle dimension is very similar to tof SEM images, i.e., 200 nm in diameter.
The applicability of the HPPS to metal clusters was thtested by examining palladium colloids. Scanning electmicroscopy images were obtained using a JEOL/JSM 5instrument. Images of Pd clusters show that the particlesuniform in size with a spherical shape, and the average deter of the particles is≈ 90 nm as shown inFigs. 5a and5b.The prepared colloid was subjected to HPPS measuremewith five scans of 30 s duration.Fig. 6shows the particle sizdistribution of the Pd colloidal solution obtained by HPmeasurement and found that mean particle size to be 9exactly similar to that of obtained with SEM images.

462 L. D’Souza et al. / Journal of Colloid and Interface Science 279 (2004) 458–463
omsults
r toen-wn
pro-
R
pedd ahic
re-redmi-per-(not
lyons.s
ses,nit
n ofeseizeower
S isre-t ain
andmi-asol-Pt
eenis
Fig. 4. Particle size distribution of the polymer hydrosol as obtained fromSEM (as measured for 150 particles) (a) and HPPS (b). The mean diameterand standard deviation of particles sizes are 217 and 20 (for SEM) measure-ments and 212 and 10 (for HPPS), respectively.
Fig. 5. SEM image (a) and particle sizedistribution of palladium colloid (asmeasured for 150 particles) (b). The mean diameter and standard deviationof particles sizes are 91 and 8, respectively. Error bars are included.
Fig. 6. Particle size distribution of palladium colloid as obtained frHPPS. Particle size is 90 nm. Error bars are included. The HPPS reare consistent with SEM results.
HPPS was further used to study polyoxoanions in ordeestablish the lower size limit observable with this instrumtation. Two different phosphotungstates with the well-knoKeggin [PW11O39]7− and Wells–Dawson [P2W18O62]6−structures were synthesized according to publishedcedures and isolated as tetra-n-butylammonium (TBA)salts [26,35–37]. The purity of (TBA)4H3[PW11O39] and(TBA)6[P2W18O62] was established by FTIR and NMstudies. The almost spherical, monolacunary [PW11O39]7−has a diameter of 1.04 nm and the football sha[P2W18O62]6− has an equatorial diameter of 1.02 nm anlongitudinal diameter of 1.38 nm based on crystallograpdata. Typically, a 1 mM solution of polyoxianions were ppared in Analytical Reagent grade acetonitrile and filtethrough 0.4 µm filter to remove any possible dust contanation. All measurements were performed at room temature. The hydrodynamic diameter obtained by HPPSshown in the figure) for (TBA)4H3(PW11O39) is 1.02 nm andfor (TBA)6(P2W18O62) is 1.34 nm which correlate exactwith the cluster dimensions of the respective polyoxoaniIn the case of (TBA)6(P2W18O62) the peak maxima seemto be that of the diameter of the longer axis. In both cathe size obtained looks like that of only the polyanion uand contributions from the mobile counter ion Bu4N+ unitwas not observed most probably, because the detectioBu4N+ unit is beyond the range of the instrument. Thresults, by distinguishing particles having very small sdifferences demonstrate the accuracy of HPPS at the llimit.
In conclusion, it has been demonstrated that HPPan extremely valuable instrumentation for nanoscalesearch. In particular, it offers the preparative chemismeans by which to follow particle formation and growthsitu. The duration of measurements is very short (≈ 5–30 s)as compared to other techniques such as TEM, XRD,SEM (≈ 2–24 h). The instrumental approach is econocal, much more so than TEM, XRD, or SEM. HPPS hbeen proven effective for studying polyoxoanion, metal cloids and polymeric samples. The kinetics of Au andmetal cluster growth and Ag nanoparticle oxidation has beffectively followed with HPPS. The applicability of th
L. D’Souza et al. / Journal of Colloid and Interface Science 279 (2004) 458–463 463
re-toodlefea-ryult
rderTheble
t ofles,Maid.
r-
ill-
et-
nte,
ki,00)
en,
13
1)
v,
4
ur.
3)
i,
a,)
ys.
,
87)
99)
03
ys.
13.. 11
991)
instrument to samples of 1–200 nm in diameter providessearchers working in the nanoscale regime a valuablefor observing in situ phenomena. The capability to hanmultimodal and polydispersive samples is an additionalture of this technique. If the multimodal distribution is vebroad, then resolution of different particles becomes difficsince scattering intensity of particles increases with the oof 106 and hence bigger particles block the smaller one.refractive index of the solvent plays a main role and suitaprecautions should be taken to insure accurate results.
Acknowledgments
The authors thank Professor U. Kortz, DepartmenChemistry, IUB for supplying the polyoxometalate sampand Dr. T. Balster, Department of Physics, IUB for SEmeasurements. Thanks are also due to IUB for FinancialL.D. is grateful to IUB for Research Scholarship.
References
[1] H. Bönnemann, R.M. Richards, Eur. J. Inorg. Chem. 83 (2001) 1.[2] D.L. Feldheim, C.A. Foss, Metal Nanoparticles, Synthesis, Characte
ization and Application, Dekker, New York, 2002.[3] H. Bönnemann, G. Braun, W. Brijoux, R. Brinkmann, K. Schulze T
ing, K. Seevogel, K. Siepen, J. Organomet. Chem. 520 (1996) 143.[4] K.J. Klabunde, Nanostructured Materials in Chemistry, Wiley–VCH,
New York, 2001.[5] L. D’Souza, S. Sampath, Langmuir 16 (2000) 8510.[6] G. Viau, R. Brayner, L. Poul, N. Chakroune, E. Lacaze, F. Fiev
Vincent, F. Fievet, Chem. Mater. 15 (2003) 486.[7] C. Pan, K. Peler, K. Philippot, B. Chaudret, F. Dassenoy, P. Leca
M.-J. Casanove, J. Am. Chem. Soc. 123 (2001) 7584.[8] R. Richards, W. Li, S. Decker, C. Davidson, O. Koper, V. Zaikovs
A. Volodin, T. Rieker, K.J. Klabunde, J. Am. Chem. Soc. 122 (204921.
[9] H. Bönnemann, W. Brijoux, R. Brinkmann, E. Dinjus, T. JoussB. Korall, Angew. Chem. Int. Ed. 30 (1991) 1344.
[10] M. Watzky, R.G. Finke, J. Am. Chem. Soc. 119 (1997) 10382.
l[11] J.A. Widegren, J.D. Aiken, S. Özkar, R.G. Finke, Chem. Mater.
(2001) 312.[12] A. Kolmakov, D.W. Goodman, Chem. Rec. 2 (2002) 446.[13] M. Magnuson, D. Lytle, C. Frietch, C. Kelty, Anal. Chem. 73 (200
4815.[14] V. Bogatyrev, L. Dykman, Y. Krasnov, V. Plotnikov, N. Khlebtso
Colloid J. 64 (2002) 671.[15] M. Ballauff, Macromol. Chem. Phys. 204 (2003) 220.[16] S. Takata, M. Shibayama, R. Sasabe, H. Kawaguchi, Polymer 4
(2003) 495.[17] K. Kostakis, S. Mourmouris, D. Charalabidis, M. Pitsikalis, E
Phys. J. E 10 (2003) 55.[18] S. Chen, W. Chen, F. Mallamace, Science 300 (2003) 619.[19] L. Bes, S. Angot, A. Limer, D. Haddleton, Macromolecules 36 (200
2493.[20] I. Michalska, A. Krysztafkiewicz, M. Bogacki, T. Jesionowsk
J. Chem. Technol. Biotechnol. 78 (2003) 452.[21] K. Mogyorosi, I. Dekany, J. Fendler, Langmuir 19 (2003) 2938.[22] G. Artioli, R. Grizzetti, L. Carotenuto, C. Piccolo, C. Colell
B. Liguori, R. Aiello, P. Frontera, Stud. Surf. Sci. Catal. 142 (200245.
[23] M. Bellour, A. Knaebel, J. Harden, F. Lequeux, J. Munch, PhRev. E 67 (2003) 031405.
[24] J. Gregory, Nanoparticles in Solids and Solutions, Kluwer AcademicDordrecht, 1996.
[25] J.P. Wilcoxon, J.E. Marin, D.W. Schaefer, Phys. Rev. Lett. 58 (191051.
[26] J.F. Keggin, Nature 131 (1933) 908.[27] M.-C. Daniel, D. Astruc, Chem. Rev. 104 (2004) 293.[28] S. Link, Z.L. Wang, M.A. El-Sayed, J. Phys. Chem. B 103 (19
3529.[29] M.B. Mohamed, Z.L. Wang, M.A. El-Sayed, J. Phys. Chem. A 1
(1999) 10255.[30] E.C.H. Sykes, F.J. Williams, M.S. Tikhov, L.S. Richard, J. Ph
Chem. B (2001).[31] R.N. Jana, L. Gearheart, J.C. Murphy, Chem. Mater. 13 (2001) 23[32] J. Turkevich, P.C. Stevenson, J. Hillier, Discuss. Faraday Soc
(1951) 55.[33] A.J. Creighton, D.G. Eadon, J. Chem. Soc. Faraday Trans. 87 (1
3881.[34] S. Bharathi, N. Fishelson, O. Lev, Langmuir 16 (1999) 1929.[35] R. Contant, Inorg. Synth. 27 (1990) 105.[36] R. Contant, Can. J. Chem. 65 (1987) 568.[37] B. Dawson, Acta Crystallogr. 6 (1953) 113.