In-Plane Microstructure of Gas Diffusion Layers With Different Properties for PEFC
9
Mehdi Mortazavi Multiscale Transport Process Laboratory, Mechanical Engineering-Engineering Mechanics, Michigan Technological University, Houghton, MI 49931 e-mail: [email protected] Kazuya Tajiri 1 Mechanical Engineering-Engineering Mechanics, Michigan Technological University, Houghton, MI 49931 e-mail: [email protected] In-Plane Microstructure of Gas Diffusion Layers With Different Properties for PEFC The gas diffusion layer (GDL) is undoubtedly one of the most complicated components used in a polymer electrolyte fuel cell (PEFC) in terms of liquid and gas transport phe- nomena. An appropriate fuel cell design seeks a fundamental study of this tortuous po- rous component. Currently, porosity and gas permeability have been known as some of the key parameters affecting liquid and gas transport through the GDL. Although these are dominant parameters defining mass transport through porous layers, there are still many other factors affecting the transport phenomena and overall cell performance. In this work, the microstructural properties of Toray carbon papers with different thick- nesses and for polytetrafluoroethylene (PTFE) treated and untreated cases have been studied based on scanning electron microscopy (SEM) image analysis. The water droplet contact angle, as a dominant macroscale property, along with the mean pore diameter, pore diameter distribution, and pore roundness distribution, as important microscale properties, have been studied. It was observed that the mean pore diameter of Toray car- bon paper does not change with its thickness and PTFE content. Mean pore diameter for Toray carbon papers was calculated to be around 26lm, regardless of their thicknesses and PTFE content. It was also observed that the droplet contact angle on the GDL sur- face does not vary with the GDL thickness. The average contact angle for the 10 wt. % PTFE treated GDLs of different thicknesses was measured at about 150 deg. Finally, the heterogeneous in-plane PTFE distribution on the GDL surface was observed to have no effect on the mean pore diameter of GDLs. [DOI: 10.1115/1.4025930] Introduction Although the polymer electrolyte fuel cell (PEFC) has received a great amount of consideration as a clean type of energy system, there are still some technical challenges that need to be solved before this type of energy system can be commercially released. Among these challenges, one can refer to water management in the PEFC. During the operation of a PEFC, oxygen is reduced in the cathode and is accompanied by water production. Some amount of this produced water may fill the open pores of the gas diffusion layer (GDL). The GDL is a macroporous layer with mul- tifunction purposes such as providing a uniform transport of reac- tants to the catalyst layer, removing excess water from the membrane by providing pathways of water to the gas channel, mechanically protecting the membrane as a fragile thin layer, and providing electrical conductivity between the electrodes and the current collectors. An appropriate design of the GDL has been reported to have a significant contribution on proper water balance within the cell [1–4]. For a continuous transport of reactants to the catalyst layer and transport of excess water to the gas channel, the GDL pores should be free from accumulated liquid water. Excess water accu- mulated within the GDL pores and gas flow channels blocks the flow of reactants to the catalyst layer and, finally, results in oxi- dant starvation and performance loss. Liquid water accumulated within the GDL pores emerges from the GDL surface in the form of droplets. The liquid water transport mechanism on the GDL surface is a function of the superficial gas velocity, which is defined as the bulk velocity of gas flowing within the channel cross sectional area and the droplet emergence rate [5]. While for high superficial gas velocities the drag force from the shear gas flow can easily detach a water droplet from the GDL surface, a moderate or low superficial gas velocity is not capable of detaching the droplet directly from the GDL surface. Instead, the droplet grows in size until it touches the gas channel walls and spreads over them. In such cases, capillary flow drains liquid water through the corners, forming an annular film flow. For a high liquid water production rate and/or low superficial gas velocity, the water film will not be drained properly and the channel will be clogged as the liquid film grows. Water transport mechanisms within the GDL are quite different from liquid water transport on the GDL surface and can be catego- rized into diffusion, pressure driven hydraulic permeation, and evaporation [6]. The liquid water behavior on the GDL surface can be studied by simple optical visualization techniques [5,7–10] while the water behavior within the GDL cannot be easily moni- tored. Some of the techniques used for studying the water behav- ior within the GDL are X-ray and neutron radiography [11] since both the X-ray and neutron beams are capable of penetrating through the GDL. However, each of these techniques has their own drawbacks. For instance, the expensive hardware of neutron imaging requires a challenging calibration to ensure a reliable data acquisition [12]. It is a common practice to treat GDLs with some hydrophobic media such as polytetrafluoroethylene (PTFE) to enhance gas transport and liquid water transport through the pores when the cell is operating at flooding condition [13]. Park et al. [14] tested GDLs with different amounts of PTFE and obtained the I-V curves of a single cell working at different levels of relative humidities. They concluded that among different water transport mechanisms within the GDL, evaporation and shear force are more dominant than capillary force and attributed that to the relatively large pore diameters of GDLs compared to the microporous and catalyst layers. Pasaogullari and Wang [15] used a one-dimensional ana- lytical solution and concluded that liquid water transport within the GDL is controlled by capillary forces arising from the gradient in phase saturation. Nam and Kaviany [16] studied water transport within the GDL by developing a capillary pressure model and 1 Address all correspondence to this author. Contributed by the Advanced Energy Systems Division of ASME for publication in the JOURNAL OF FUEL CELL SCIENCE AND TECHNOLOGY. Manuscript received July 29, 2013; final manuscript received September 27, 2013; published online December 4, 2013. Editor: Nigel M. Sammes. Journal of Fuel Cell Science and Technology APRIL 2014, Vol. 11 / 021002-1 Copyright V C 2014 by ASME Downloaded From: http://fuelcellscience.asmedigitalcollection.asme.org/ on 12/06/2013 Terms of Use: http://asme.org/terms
Transcript of In-Plane Microstructure of Gas Diffusion Layers With Different Properties for PEFC
Mehdi MortazaviMultiscale Transport Process Laboratory,
Mechanical Engineering-Engineering Mechanics,
Michigan Technological University,
Houghton, MI 49931
e-mail: [email protected]
Kazuya Tajiri 1
Mechanical Engineering-Engineering Mechanics,
Michigan Technological University,
Houghton, MI 49931
e-mail: [email protected]
In-Plane Microstructure of GasDiffusion Layers With DifferentProperties for PEFCThe gas diffusion layer (GDL) is undoubtedly one of the most complicated componentsused in a polymer electrolyte fuel cell (PEFC) in terms of liquid and gas transport phe-nomena. An appropriate fuel cell design seeks a fundamental study of this tortuous po-rous component. Currently, porosity and gas permeability have been known as some ofthe key parameters affecting liquid and gas transport through the GDL. Although theseare dominant parameters defining mass transport through porous layers, there are stillmany other factors affecting the transport phenomena and overall cell performance. Inthis work, the microstructural properties of Toray carbon papers with different thick-nesses and for polytetrafluoroethylene (PTFE) treated and untreated cases have beenstudied based on scanning electron microscopy (SEM) image analysis. The water dropletcontact angle, as a dominant macroscale property, along with the mean pore diameter,pore diameter distribution, and pore roundness distribution, as important microscaleproperties, have been studied. It was observed that the mean pore diameter of Toray car-bon paper does not change with its thickness and PTFE content. Mean pore diameter forToray carbon papers was calculated to be around 26lm, regardless of their thicknessesand PTFE content. It was also observed that the droplet contact angle on the GDL sur-face does not vary with the GDL thickness. The average contact angle for the 10 wt. %PTFE treated GDLs of different thicknesses was measured at about 150 deg. Finally, theheterogeneous in-plane PTFE distribution on the GDL surface was observed to have noeffect on the mean pore diameter of GDLs. [DOI: 10.1115/1.4025930]
Introduction
Although the polymer electrolyte fuel cell (PEFC) has receiveda great amount of consideration as a clean type of energy system,there are still some technical challenges that need to be solvedbefore this type of energy system can be commercially released.Among these challenges, one can refer to water management inthe PEFC. During the operation of a PEFC, oxygen is reduced inthe cathode and is accompanied by water production. Someamount of this produced water may fill the open pores of the gasdiffusion layer (GDL). The GDL is a macroporous layer with mul-tifunction purposes such as providing a uniform transport of reac-tants to the catalyst layer, removing excess water from themembrane by providing pathways of water to the gas channel,mechanically protecting the membrane as a fragile thin layer, andproviding electrical conductivity between the electrodes and thecurrent collectors. An appropriate design of the GDL has beenreported to have a significant contribution on proper water balancewithin the cell [1–4].
For a continuous transport of reactants to the catalyst layer andtransport of excess water to the gas channel, the GDL poresshould be free from accumulated liquid water. Excess water accu-mulated within the GDL pores and gas flow channels blocks theflow of reactants to the catalyst layer and, finally, results in oxi-dant starvation and performance loss. Liquid water accumulatedwithin the GDL pores emerges from the GDL surface in the formof droplets.
The liquid water transport mechanism on the GDL surface is afunction of the superficial gas velocity, which is defined as thebulk velocity of gas flowing within the channel cross sectionalarea and the droplet emergence rate [5]. While for high superficialgas velocities the drag force from the shear gas flow can easily
detach a water droplet from the GDL surface, a moderate or lowsuperficial gas velocity is not capable of detaching the dropletdirectly from the GDL surface. Instead, the droplet grows in sizeuntil it touches the gas channel walls and spreads over them. Insuch cases, capillary flow drains liquid water through the corners,forming an annular film flow. For a high liquid water productionrate and/or low superficial gas velocity, the water film will not bedrained properly and the channel will be clogged as the liquid filmgrows.
Water transport mechanisms within the GDL are quite differentfrom liquid water transport on the GDL surface and can be catego-rized into diffusion, pressure driven hydraulic permeation, andevaporation [6]. The liquid water behavior on the GDL surfacecan be studied by simple optical visualization techniques [5,7–10]while the water behavior within the GDL cannot be easily moni-tored. Some of the techniques used for studying the water behav-ior within the GDL are X-ray and neutron radiography [11] sinceboth the X-ray and neutron beams are capable of penetratingthrough the GDL. However, each of these techniques has theirown drawbacks. For instance, the expensive hardware of neutronimaging requires a challenging calibration to ensure a reliabledata acquisition [12].
It is a common practice to treat GDLs with some hydrophobicmedia such as polytetrafluoroethylene (PTFE) to enhance gastransport and liquid water transport through the pores when thecell is operating at flooding condition [13]. Park et al. [14] testedGDLs with different amounts of PTFE and obtained the I-V curvesof a single cell working at different levels of relative humidities.They concluded that among different water transport mechanismswithin the GDL, evaporation and shear force are more dominantthan capillary force and attributed that to the relatively large porediameters of GDLs compared to the microporous and catalystlayers. Pasaogullari and Wang [15] used a one-dimensional ana-lytical solution and concluded that liquid water transport withinthe GDL is controlled by capillary forces arising from the gradientin phase saturation. Nam and Kaviany [16] studied water transportwithin the GDL by developing a capillary pressure model and
1Address all correspondence to this author.Contributed by the Advanced Energy Systems Division of ASME for publication
in the JOURNAL OF FUEL CELL SCIENCE AND TECHNOLOGY. Manuscript received July 29,2013; final manuscript received September 27, 2013; published online December 4,2013. Editor: Nigel M. Sammes.
Journal of Fuel Cell Science and Technology APRIL 2014, Vol. 11 / 021002-1Copyright VC 2014 by ASME
Downloaded From: http://fuelcellscience.asmedigitalcollection.asme.org/ on 12/06/2013 Terms of Use: http://asme.org/terms
hypothesized that water is distributed as an “upside-down tree”capillary network. Litster et al. [17] followed a fluorescence mi-croscopy technique and visualized liquid water transport in theGDL. They suggested that water transport within the GDL ismostly dominated by fingering and channeling in such a way thatas a breakthrough path within the GDL forms, liquid water exist-ing in other paths recedes back and finds its way through thenewly formed breakthrough path. The illustrated literature reviewherein highlights the different and sometimes opposite hypothesesmade regarding liquid water transport through the GDL.
Water transport through and on the surface of the GDL can becharacterized by two independent parameters of the GDL micro-structure and pore surface wettability [3]. The GDL pore diameter,for instance, was known to directly affect the water vapor pressure
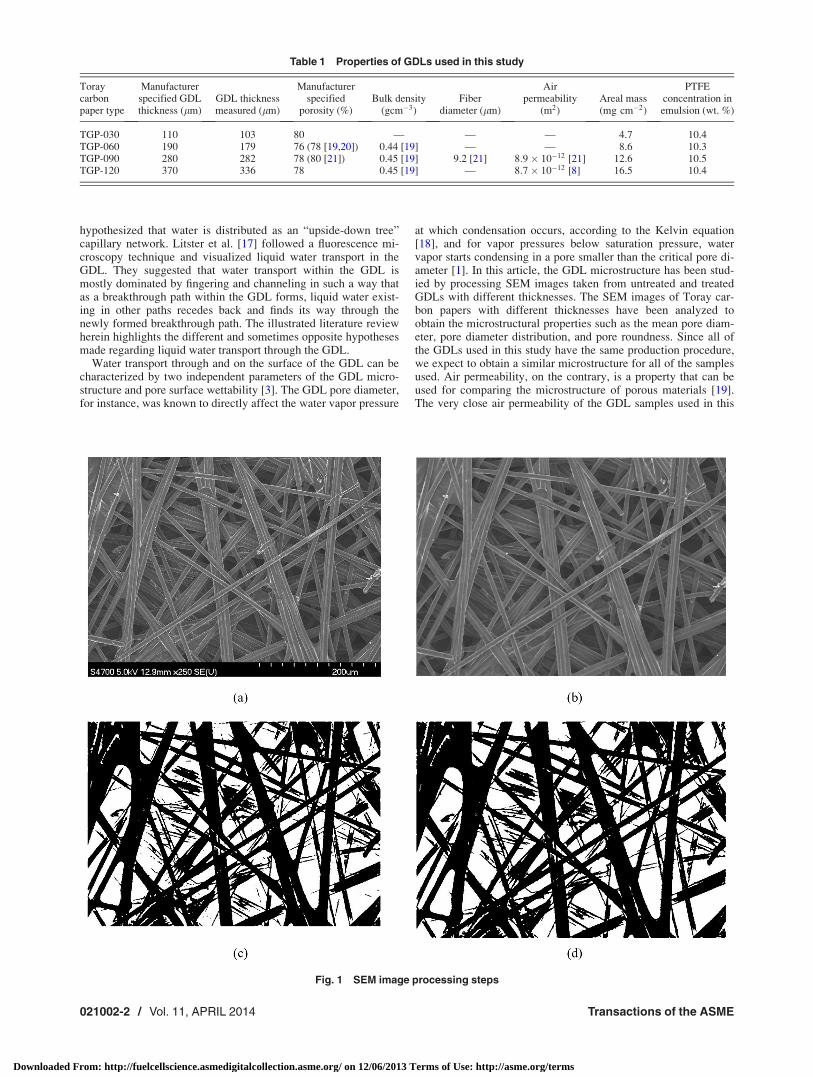
at which condensation occurs, according to the Kelvin equation[18], and for vapor pressures below saturation pressure, watervapor starts condensing in a pore smaller than the critical pore di-ameter [1]. In this article, the GDL microstructure has been stud-ied by processing SEM images taken from untreated and treatedGDLs with different thicknesses. The SEM images of Toray car-bon papers with different thicknesses have been analyzed toobtain the microstructural properties such as the mean pore diam-eter, pore diameter distribution, and pore roundness. Since all ofthe GDLs used in this study have the same production procedure,we expect to obtain a similar microstructure for all of the samplesused. Air permeability, on the contrary, is a property that can beused for comparing the microstructure of porous materials [19].The very close air permeability of the GDL samples used in this
Table 1 Properties of GDLs used in this study
Toraycarbonpaper type
Manufacturerspecified GDLthickness (lm)
GDL thicknessmeasured (lm)
Manufacturerspecified
porosity (%)Bulk density
(gcm�3)Fiber
diameter (lm)
Airpermeability
(m2)Areal mass(mg cm�2)
PTFEconcentration inemulsion (wt. %)
TGP-030 110 103 80 — — — 4.7 10.4TGP-060 190 179 76 (78 [19,20]) 0.44 [19] — — 8.6 10.3TGP-090 280 282 78 (80 [21]) 0.45 [19] 9.2 [21] 8:9� 10�12 [21] 12.6 10.5TGP-120 370 336 78 0.45 [19] — 8:7� 10�12 [8] 16.5 10.4
Fig. 1 SEM image processing steps
021002-2 / Vol. 11, APRIL 2014 Transactions of the ASME
Downloaded From: http://fuelcellscience.asmedigitalcollection.asme.org/ on 12/06/2013 Terms of Use: http://asme.org/terms
study, as listed in Table 1, can be an indication of the similarmicrostructures of Toray carbon papers of different thicknesses[19].
Experimental
Toray carbon papers with different thicknesses were used as theGDL in this study. The GDLs with manufacturer specified thick-nesses of 110 lm, 190 lm, 280 lm, and 370 lm have been used.For each thickness, untreated and 10 wt. % PTFE treated paperswere tested for microstructural analysis. For the PTFE treating ofthe GDL samples, Toray carbon papers were loaded with PTFEbased on the procedure given in Ref. [22]. This procedure isdescribed as follows. The substrates were first dipped in the PTFEemulsion (60 wt. % dispersion in H2O, Aldrich) for 10 h and thenthey were put in a furnace at 120 �C for 1 h to dry them. In orderto make a uniform distribution of the PTFE within the GDL sub-strates, they were sintered at 360 �C for 1 h. The static contactangles of the liquid water droplets on the GDL samples with dif-ferent PTFE contents were measured using a homemade setupdesigned and made specifically for this purpose [23] with the pro-cedures and theory given in Ref. [24]. Ten droplets with diameterswithin the range of 1�3 mm were dropped on the GDL surfacesand the mean contact angles were considered. Table 1 lists themeasured and calculated physical properties of the samples usedin this study. The GDL thicknesses were measured using an elec-tronic micrometer (Mitsutoyo, Japan). The measured thicknesseswere slightly different from the thicknesses specified by the manu-facturer. However, the manufacturer-specified thicknesses areused for the remainder of the paper.
The surface morphology of the GDL samples were scannedusing a JEOL JSM-6400LV scanning electron microscope (SEM)at 20 keV and 250� magnification. For each sample, three randomlocations were chosen and images were obtained. The SEMimages were analyzed for the mean pore diameter, pore diameterdistribution, and pore roundness distribution based on the
procedure introduced in Ref. [25]. A MATLAB code was used foranalyzing the SEM raw images, first applying median filtering[26] to smoothen out the high frequency noise. The filtered imageswere then segmented and processed [27] by thresholding, basedon the Otsu method [28] in order to convert the gray level imagesinto binary black and white images. Thus, all of the carbon fibersbecame black and the empty pores of the GDL became white.Finally, the black and white images were gap-filled to removesmall gaps in the fibers and the pores. In order to make the gap-filling step more accurate, pore diameters of less than 5 lm werefiltered out in our analysis. Figure 1 shows the four steps of theimage processing used in this study.
Results and Discussion
The SEM images were processed for microstructural analysis.The analysis includes the mean pore diameter, pore diameter dis-tribution, and pore roundness distribution for the different GDLsamples used. Other than conducting a case by case comparisonfor GDLs of different thicknesses and for treated and untreatedsample, the pore diameter distribution for one untreated GDLsample (TGP_120) and at three different locations was alsoobtained, as will be discussed in the In-Plane Pore Distributionsection. These distribution plots may be used to define the orderof anisotropicity of GDLs in future studies but no quantitativeanalyses were done on them in this study. Finally, as mentioned inthe Experimental section, the SEM images were processed basedon the Otsu method for threshold setting. In order to examine thevalidity of the results obtained based on this approach, the effectof threshold setting on the mean pore diameter was also studied.Before all of these microstructural analyses, the liquid water drop-let contact angles on the GDLs were measured. The contact angleis a macroscale property that represents the wetting ability of asolid surface by a liquid. It is a function of the interfacial energyalong the three phase boundary. The measured contact angles canhelp illuminate the variation of the GDL surface energy for differ-ent PTFE contents within the GDL.
Contact Angle. The droplet contact angle describes the solidsurface interfacial tensions based on Young’s mechanical equilib-rium relation. The liquid droplet contact angle on a solid surfacesuch as the GDL introduces the mechanical equilibrium of thedroplet under the influence of three phase interfacial tensions [29].Furthermore, the droplet contact angle on the GDL surface is oneof the most important parameters in water management withapplications in the PEFC since it directly affects some major prop-erties with dominant effects on liquid water transport within andupon the GDL surface. The surface adhesion force (given in Eq.(1)), drag force from shear gas flow in the gas channel (given inEq. (2)), the capillary pressure, and even the droplet shape on theGDL surface are some properties that the contact angle directlyaffects. The surface adhesion force keeps the droplet on the GDLsurface
Fs¼2rlvdd sin2 h sinðDhÞ (1)
where rlv is the surface tension between the liquid and vapor, dd
is the diameter of a droplet upon detachment, h is the contact
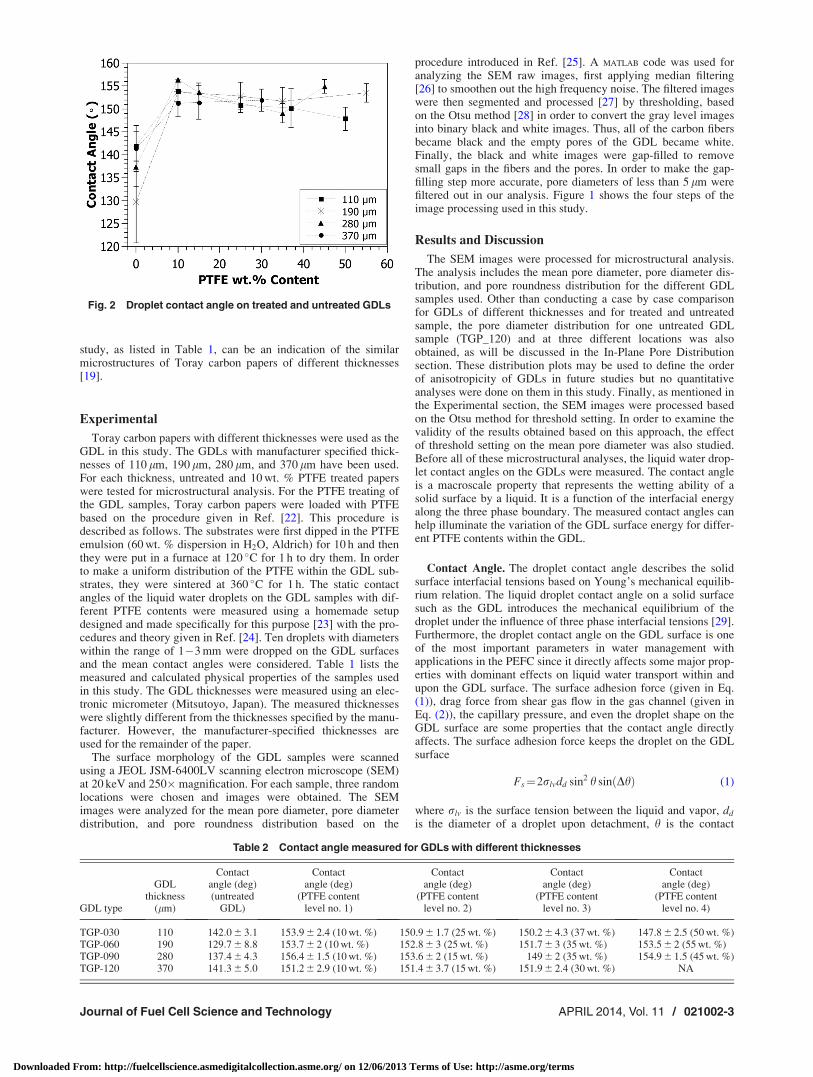
Fig. 2 Droplet contact angle on treated and untreated GDLs
Table 2 Contact angle measured for GDLs with different thicknesses
GDL type
GDLthickness
(lm)
Contactangle (deg)(untreated
GDL)
Contactangle (deg)
(PTFE contentlevel no. 1)
Contactangle (deg)
(PTFE contentlevel no. 2)
Contactangle (deg)
(PTFE contentlevel no. 3)
Contactangle (deg)
(PTFE contentlevel no. 4)
TGP-030 110 142:0 6 3:1 153.9 6 2.4 (10 wt. %) 150.9 6 1.7 (25 wt. %) 150.2 6 4.3 (37 wt. %) 147.8 6 2.5 (50 wt. %)TGP-060 190 129:7 6 8:8 153.7 6 2 (10 wt. %) 152.8 6 3 (25 wt. %) 151.7 6 3 (35 wt. %) 153.5 6 2 (55 wt. %)TGP-090 280 137:4 6 4:3 156.4 6 1.5 (10 wt. %) 153.6 6 2 (15 wt. %) 149 6 2 (35 wt. %) 154.9 6 1.5 (45 wt. %)TGP-120 370 141:3 6 5:0 151.2 6 2.9 (10 wt. %) 151.4 6 3.7 (15 wt. %) 151.9 6 2.4 (30 wt. %) NA
Journal of Fuel Cell Science and Technology APRIL 2014, Vol. 11 / 021002-3
Downloaded From: http://fuelcellscience.asmedigitalcollection.asme.org/ on 12/06/2013 Terms of Use: http://asme.org/terms
angle, and Dh is the difference between the advancing and reced-ing contact angles [5]. The drag force tries to detach the dropletfrom the GDL surface
FD ¼1
2qCDAPV2 (2)
where q is the density of the gas flowing in the gas channel, CD isthe drag coefficient, AP is the droplet projected area perpendicularto the gas flow, and V is the superficial gas velocity.
The static contact angles measured in this study for each GDLsample are shown in Fig. 2. The error bars represent the standarddeviation calculated for each contact angle data point. It can beobserved that the droplet contact angle significantly changes froman untreated to a treated GDL surface, while adding largeramounts of PTFE does not make any change on the contact angle.Furthermore, it seems that the GDL thickness does not affect thedroplet contact angle. As Whitesides and Laibinis [30] reported,the droplet behavior on the GDL surface is mostly controlled bythe wetting characteristics of the top few monolayers of the sur-face. That is why the thickness of the GDL shows no contributionto the droplet contact angle. Table 2 lists the mean contact anglemeasured for ten droplets being dropped on the GDLs and the cal-culated standard deviation. For each GDL thickness, the dropletcontact angles on the untreated GDL and treated GDLs with dif-ferent amounts of PTFE are shown. It can be concluded fromTable 2 and Fig. 2 that the average contact angle that the dropletsmake is about 150 deg on treated GDLs, regardless of the PTFEcontent and, as mentioned earlier, the GDL thickness has no effecton this contact angle. Similar contact angles on GDLs with differ-ent PTFE contents have been observed and reported by other
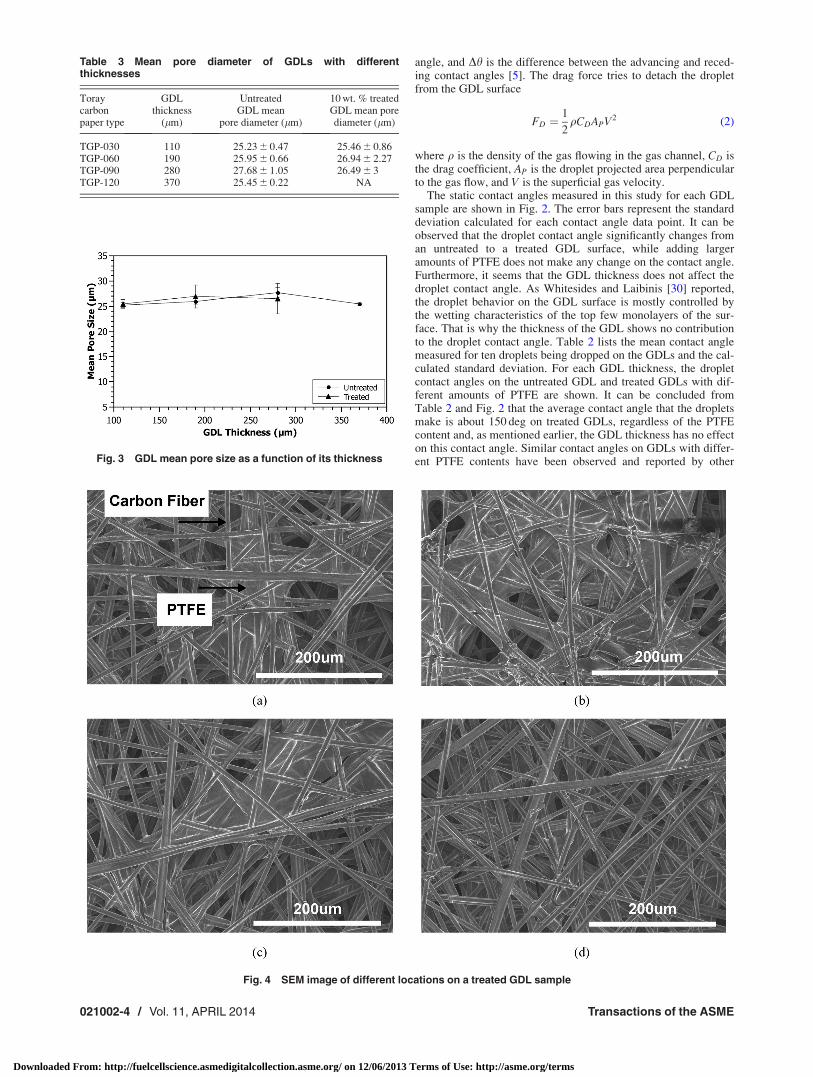
Table 3 Mean pore diameter of GDLs with differentthicknesses
Toraycarbonpaper type
GDLthickness
(lm)
UntreatedGDL mean
pore diameter (lm)
10 wt. % treatedGDL mean porediameter (lm)
TGP-030 110 25:23 6 0:47 25.46 6 0.86TGP-060 190 25:95 6 0:66 26.94 6 2.27TGP-090 280 27:68 6 1:05 26.49 6 3TGP-120 370 25:45 6 0:22 NA
Fig. 3 GDL mean pore size as a function of its thickness
Fig. 4 SEM image of different locations on a treated GDL sample
021002-4 / Vol. 11, APRIL 2014 Transactions of the ASME
Downloaded From: http://fuelcellscience.asmedigitalcollection.asme.org/ on 12/06/2013 Terms of Use: http://asme.org/terms
groups such as Fairweather et al. [31] and Benziger et al. [32]. Italso lead us to draw the conclusion that PTFE particles mostlypenetrate through the GDL and agglomerate within the GDL,rather than sitting on its surface.
Mean Pore Diameter. The GDLs’ mean pore diameters wereobtained by analyzing the SEM images based on the procedureintroduced by Parikh et al. [25]. For each GDL case, five SEMimages were obtained with a scan size of 507 lm� 356 lm, asdefined by the ImageJ software developed by the National Insti-tutes of Health. The overall mean pore diameter was calculated byaveraging the mean pore diameters obtained for each SEM image.The GDL pore diameter is characterized by the equivalent porediameter (EPD), given by Eq. (3)
EPD ¼ 2ffiffiffiffiffiffiffiffiA=p
p(3)
where A is the area of the pore [33].The GDL pore size is one of the most important parameters in
liquid water transport from the catalyst layer, where water is
produced as one of the byproducts of the electrochemical reaction,to the gas channel, where it can be drained, either by detachmentcaused by shear gas flow or corner flow across the edges of thegas channels [5]. Liquid water passes through the GDL poreswhen its pressure exceeds the capillary pressure and, for a contin-uous flow, its pressure should remain higher than the capillarypressure [16]. Capillary pressure is defined as the differencebetween the pressure of the liquid and gas phase at equilibrium(Pc¼Pl�Pg) and is a function of the mean curvature of thewater-air interface, contact angle, and surface energy
Pc ¼2rwater cos h
rpore
(4)
where rwater is the interfacial surface tension, h is the contactangle, and rpore is the pore radius. The smaller the pore radius, thegreater the capillary pressure liquid water should overcome to beable to pass through the GDL. Tamayol and Bahrami [19] mod-eled the GDL as a network of pores connected by throats. Basedon their model, it is assumed that air and liquid water are stored inthe pores and the volume occupied by the throats is negligible.
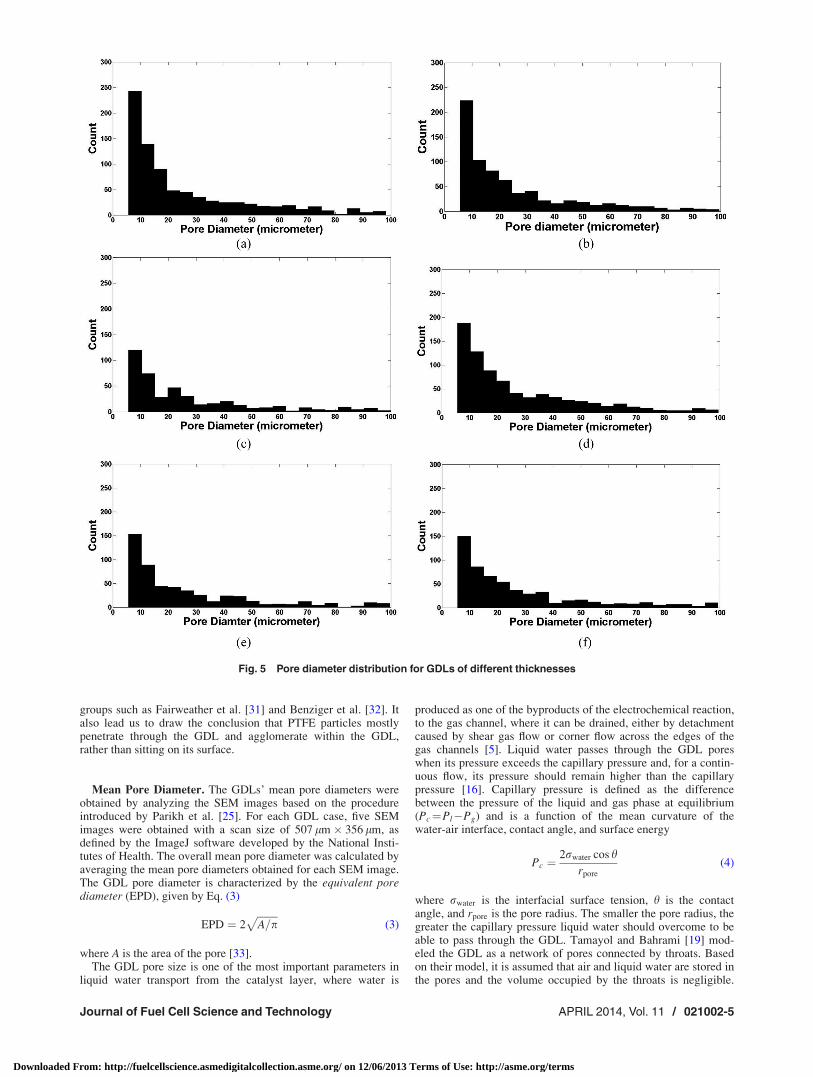
Fig. 5 Pore diameter distribution for GDLs of different thicknesses
Journal of Fuel Cell Science and Technology APRIL 2014, Vol. 11 / 021002-5
Downloaded From: http://fuelcellscience.asmedigitalcollection.asme.org/ on 12/06/2013 Terms of Use: http://asme.org/terms
Only throats resist liquid water transport and pores do not haveany resistance to the flow [34]. It was reported that the capillarypressure increases with the Toray carbon paper thickness [19].Based on the model discussed in Ref. [19], as the thickness of theGDL increases, the number of layers forming the GDL alsoincreases. This directly increases the breakthrough pressure of theliquid water. Table 3 lists the mean pore diameter calculated forGDLs of different thicknesses. Based on the results obtained bythis approach, the GDL mean pore diameter is not changing withthe GDL thickness and even the mean pore diameters foruntreated and treated GDLs are the same. The mean pore diameterobtained for all GDLs is about 26 lm, which is in good agreementwith the mean pore diameter reported by Parikh et al. [25] forToray carbon paper. The mean pore size given in Refs. [8,35] iswithin the range of 30� 40 lm, that is, again, in agreement withthe results obtained in this work.
Considering the average pore diameter of 26 lm, average con-tact angle of 150 deg, and water surface tension of 0:072 Nm�1,the capillary pressure will be calculated at 9:5 kPa, based on Eq.(4). This pressure is almost twice as much as the breakthroughpressure reported in Ref. [36]. The reason behind this is that for amean pore diameter of 26 lm, there are some pores with largerdiameters in the GDLs that result in lower capillary pressure and,as Bazylak et al. [37] had reported, liquid water chooses the pathof least resistance through the GDL and emerges from the surfaceof the GDL in the form of droplets. A further discussion aboutpore diameter distribution will be given in the Pore Diameter Dis-tribution section. Figure 3 shows the calculated mean pore diame-ter as a function of the GDL thickness both for treated anduntreated GDLs. As mentioned earlier, the mean pore diameterdoes not change, neither with the GDL thickness nor with thePTFE content, within the GDL. The PTFE particles are within therange of 50� 500 nm [38], which is much smaller than the meanpore diameter.
Figure 3 and Table 3 also show a higher standard deviation ofthe mean pore diameter for treated GDLs compared to untreatedones. The SEM images of the treated GDL surface are shown inFig. 4. As shown in Fig. 4, the white areas between the carbonfibers are the PTFE emulsion dried on the surface of the GDL.Figure 4 shows that, even for the same GDL, the sample PTFE isnot uniformly distributed and there can be some areas withhigher PTFE content (see Fig. 4(b)) and some areas with lowerPTFE content (see Fig. 4(d)). Other than the uneven PTFE distri-bution in the plane of the GDL, Fig. 4 shows that the PTFEemulsion mostly covers the top layers of the GDL and it seemsfrom the figure that the PTFE hardly penetrates into the GDL.The same observation has been reported by Lim and Wang [39]when they took SEM images of carbon papers treated with fluo-rinated ethylene propylene. However, this observation is indiscrepancy with the conclusion drawn from the contactangle measurement. The PTFE distribution through the GDLwill be studied further by the authors. Rofaiel et al. [38] hadmeasured the heterogeneous through-plane PTFE distribution incarbon papers by using SEM energy dispersive X-ray spectrome-try and detected a larger concentration of fluorine (as the PTFE’shigh concentration element) along the surface fibers and less flu-orine in the central region of the GDL. Fishman and Bazylak[40] measured the through-plane porosity distribution of GDLsand concluded that the PTFE accumulates at a local minima nearthe surface of the paper GDLs. The SEM images taken for thisstudy, however, cannot be used for the PTFE through-planedistribution analysis.
Pore Diameter Distribution. Pore diameter distributions wereobtained from the MATLAB code and are shown in Fig. 5 for eachGDL sample. It can be concluded that for both treated anduntreated GDLs, the majority of pores have diameters of less than20 lm. However, the existence of larger pores mitigatesthe liquidwater transport through the GDL by lowering the capillary
pressure required for intrusion. Furthermore, pore diameter distri-butions show that the thinnest GDL (TGP_030) has more porescompared to the other two GDLs. This can be interpreted as thethinnest GDL is more porous compared to other samples. Thisresult is in good agreement with the manufacturer specified poros-ity values given in Table 1 although the difference is minor. Thepore size distribution could also be obtained by using mercuryintrusion porosimetery [20,41]. In such a technique, mercury, as anonwetting fluid on most surfaces, is penetrated into the pores ofthe GDL by applying pressure. The applied pressure is a functionof the pore diameter. Williams et al. [1] used this approach andobtained pore size distributions for E-TEK carbon paper, E-TEKcarbon cloth, and SGL carbon paper.
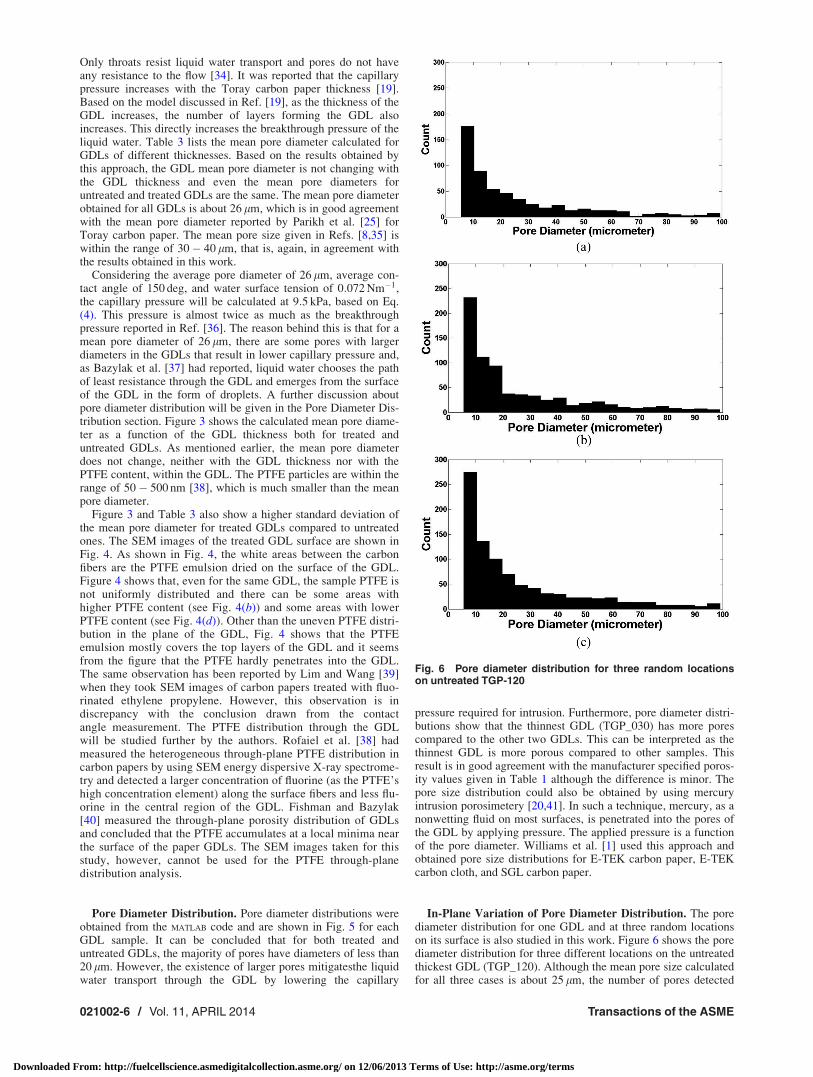
In-Plane Variation of Pore Diameter Distribution. The porediameter distribution for one GDL and at three random locationson its surface is also studied in this work. Figure 6 shows the porediameter distribution for three different locations on the untreatedthickest GDL (TGP_120). Although the mean pore size calculatedfor all three cases is about 25 lm, the number of pores detected
Fig. 6 Pore diameter distribution for three random locationson untreated TGP-120
021002-6 / Vol. 11, APRIL 2014 Transactions of the ASME
Downloaded From: http://fuelcellscience.asmedigitalcollection.asme.org/ on 12/06/2013 Terms of Use: http://asme.org/terms
within each range of diameters are different. Again, it can beobserved that the majority of the detected pores have diameters ofless than 20 lm, while there are larger pores detected in all threelocations.
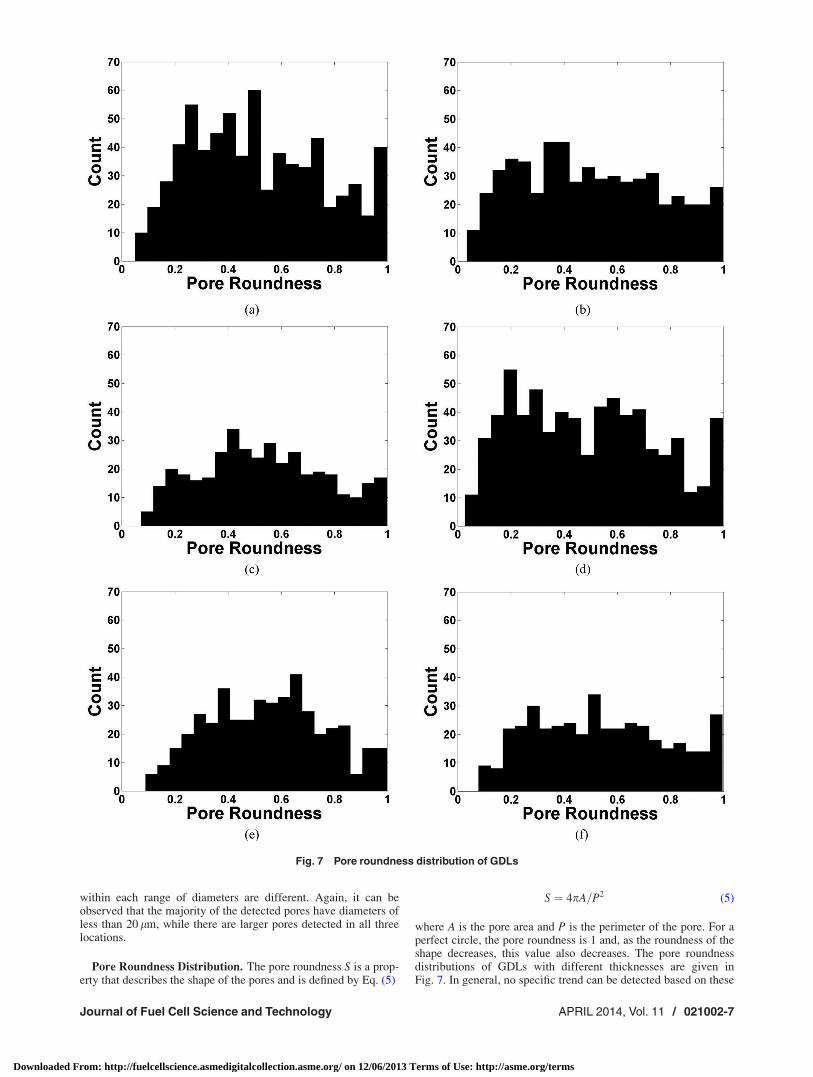
Pore Roundness Distribution. The pore roundness S is a prop-erty that describes the shape of the pores and is defined by Eq. (5)
S ¼ 4pA=P2 (5)
where A is the pore area and P is the perimeter of the pore. For aperfect circle, the pore roundness is 1 and, as the roundness of theshape decreases, this value also decreases. The pore roundnessdistributions of GDLs with different thicknesses are given inFig. 7. In general, no specific trend can be detected based on these
Fig. 7 Pore roundness distribution of GDLs
Journal of Fuel Cell Science and Technology APRIL 2014, Vol. 11 / 021002-7
Downloaded From: http://fuelcellscience.asmedigitalcollection.asme.org/ on 12/06/2013 Terms of Use: http://asme.org/terms
histograms. It may be concluded that Toray carbon paper poresare mostly in random shapes and do not follow any specific trendof a shape.
Effect of Threshold on Mean Pore Diameter. The MATLAB
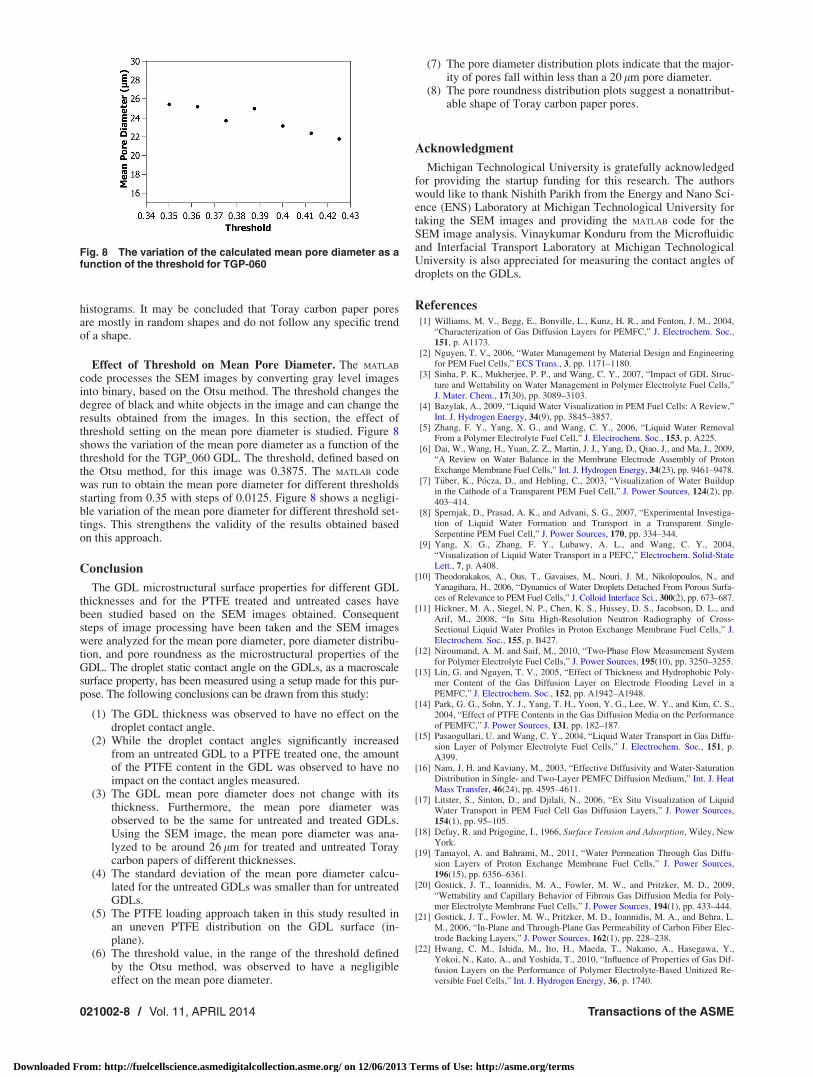
code processes the SEM images by converting gray level imagesinto binary, based on the Otsu method. The threshold changes thedegree of black and white objects in the image and can change theresults obtained from the images. In this section, the effect ofthreshold setting on the mean pore diameter is studied. Figure 8shows the variation of the mean pore diameter as a function of thethreshold for the TGP_060 GDL. The threshold, defined based onthe Otsu method, for this image was 0.3875. The MATLAB codewas run to obtain the mean pore diameter for different thresholdsstarting from 0.35 with steps of 0.0125. Figure 8 shows a negligi-ble variation of the mean pore diameter for different threshold set-tings. This strengthens the validity of the results obtained basedon this approach.
Conclusion
The GDL microstructural surface properties for different GDLthicknesses and for the PTFE treated and untreated cases havebeen studied based on the SEM images obtained. Consequentsteps of image processing have been taken and the SEM imageswere analyzed for the mean pore diameter, pore diameter distribu-tion, and pore roundness as the microstructural properties of theGDL. The droplet static contact angle on the GDLs, as a macroscalesurface property, has been measured using a setup made for this pur-pose. The following conclusions can be drawn from this study:
(1) The GDL thickness was observed to have no effect on thedroplet contact angle.
(2) While the droplet contact angles significantly increasedfrom an untreated GDL to a PTFE treated one, the amountof the PTFE content in the GDL was observed to have noimpact on the contact angles measured.
(3) The GDL mean pore diameter does not change with itsthickness. Furthermore, the mean pore diameter wasobserved to be the same for untreated and treated GDLs.Using the SEM image, the mean pore diameter was ana-lyzed to be around 26 lm for treated and untreated Toraycarbon papers of different thicknesses.
(4) The standard deviation of the mean pore diameter calcu-lated for the untreated GDLs was smaller than for untreatedGDLs.
(5) The PTFE loading approach taken in this study resulted inan uneven PTFE distribution on the GDL surface (in-plane).
(6) The threshold value, in the range of the threshold definedby the Otsu method, was observed to have a negligibleeffect on the mean pore diameter.
(7) The pore diameter distribution plots indicate that the major-ity of pores fall within less than a 20 lm pore diameter.
(8) The pore roundness distribution plots suggest a nonattribut-able shape of Toray carbon paper pores.
Acknowledgment
Michigan Technological University is gratefully acknowledgedfor providing the startup funding for this research. The authorswould like to thank Nishith Parikh from the Energy and Nano Sci-ence (ENS) Laboratory at Michigan Technological University fortaking the SEM images and providing the MATLAB code for theSEM image analysis. Vinaykumar Konduru from the Microfluidicand Interfacial Transport Laboratory at Michigan TechnologicalUniversity is also appreciated for measuring the contact angles ofdroplets on the GDLs.
References[1] Williams, M. V., Begg, E., Bonville, L., Kunz, H. R., and Fenton, J. M., 2004,
“Characterization of Gas Diffusion Layers for PEMFC,” J. Electrochem. Soc.,151, p. A1173.
[2] Nguyen, T. V., 2006, “Water Management by Material Design and Engineeringfor PEM Fuel Cells,” ECS Trans., 3, pp. 1171–1180.
[3] Sinha, P. K., Mukherjee, P. P., and Wang, C. Y., 2007, “Impact of GDL Struc-ture and Wettability on Water Management in Polymer Electrolyte Fuel Cells,”J. Mater. Chem., 17(30), pp. 3089–3103.
[4] Bazylak, A., 2009, “Liquid Water Visualization in PEM Fuel Cells: A Review,”Int. J. Hydrogen Energy, 34(9), pp. 3845–3857.
[5] Zhang, F. Y., Yang, X. G., and Wang, C. Y., 2006, “Liquid Water RemovalFrom a Polymer Electrolyte Fuel Cell,” J. Electrochem. Soc., 153, p. A225.
[6] Dai, W., Wang, H., Yuan, Z. Z., Martin, J. J., Yang, D., Qiao, J., and Ma, J., 2009,“A Review on Water Balance in the Membrane Electrode Assembly of ProtonExchange Membrane Fuel Cells,” Int. J. Hydrogen Energy, 34(23), pp. 9461–9478.
[7] T€uber, K., P�ocza, D., and Hebling, C., 2003, “Visualization of Water Buildupin the Cathode of a Transparent PEM Fuel Cell,” J. Power Sources, 124(2), pp.403–414.
[8] Spernjak, D., Prasad, A. K., and Advani, S. G., 2007, “Experimental Investiga-tion of Liquid Water Formation and Transport in a Transparent Single-Serpentine PEM Fuel Cell,” J. Power Sources, 170, pp. 334–344.
[9] Yang, X. G., Zhang, F. Y., Lubawy, A. L., and Wang, C. Y., 2004,“Visualization of Liquid Water Transport in a PEFC,” Electrochem. Solid-StateLett., 7, p. A408.
[10] Theodorakakos, A., Ous, T., Gavaises, M., Nouri, J. M., Nikolopoulos, N., andYanagihara, H., 2006, “Dynamics of Water Droplets Detached From Porous Surfa-ces of Relevance to PEM Fuel Cells,” J. Colloid Interface Sci., 300(2), pp. 673–687.
[11] Hickner, M. A., Siegel, N. P., Chen, K. S., Hussey, D. S., Jacobson, D. L., andArif, M., 2008, “In Situ High-Resolution Neutron Radiography of Cross-Sectional Liquid Water Profiles in Proton Exchange Membrane Fuel Cells,” J.Electrochem. Soc., 155, p. B427.
[12] Niroumand, A. M. and Saif, M., 2010, “Two-Phase Flow Measurement Systemfor Polymer Electrolyte Fuel Cells,” J. Power Sources, 195(10), pp. 3250–3255.
[13] Lin, G. and Nguyen, T. V., 2005, “Effect of Thickness and Hydrophobic Poly-mer Content of the Gas Diffusion Layer on Electrode Flooding Level in aPEMFC,” J. Electrochem. Soc., 152, pp. A1942–A1948.
[14] Park, G. G., Sohn, Y. J., Yang, T. H., Yoon, Y. G., Lee, W. Y., and Kim, C. S.,2004, “Effect of PTFE Contents in the Gas Diffusion Media on the Performanceof PEMFC,” J. Power Sources, 131, pp. 182–187.
[15] Pasaogullari, U. and Wang, C. Y., 2004, “Liquid Water Transport in Gas Diffu-sion Layer of Polymer Electrolyte Fuel Cells,” J. Electrochem. Soc., 151, p.A399.
[16] Nam, J. H. and Kaviany, M., 2003, “Effective Diffusivity and Water-SaturationDistribution in Single- and Two-Layer PEMFC Diffusion Medium,” Int. J. HeatMass Transfer, 46(24), pp. 4595–4611.
[17] Litster, S., Sinton, D., and Djilali, N., 2006, “Ex Situ Visualization of LiquidWater Transport in PEM Fuel Cell Gas Diffusion Layers,” J. Power Sources,154(1), pp. 95–105.
[18] Defay, R. and Prigogine, I., 1966, Surface Tension and Adsorption, Wiley, NewYork.
[19] Tamayol, A. and Bahrami, M., 2011, “Water Permeation Through Gas Diffu-sion Layers of Proton Exchange Membrane Fuel Cells,” J. Power Sources,196(15), pp. 6356–6361.
[20] Gostick, J. T., Ioannidis, M. A., Fowler, M. W., and Pritzker, M. D., 2009,“Wettability and Capillary Behavior of Fibrous Gas Diffusion Media for Poly-mer Electrolyte Membrane Fuel Cells,” J. Power Sources, 194(1), pp. 433–444.
[21] Gostick, J. T., Fowler, M. W., Pritzker, M. D., Ioannidis, M. A., and Behra, L.M., 2006, “In-Plane and Through-Plane Gas Permeability of Carbon Fiber Elec-trode Backing Layers,” J. Power Sources, 162(1), pp. 228–238.
[22] Hwang, C. M., Ishida, M., Ito, H., Maeda, T., Nakano, A., Hasegawa, Y.,Yokoi, N., Kato, A., and Yoshida, T., 2010, “Influence of Properties of Gas Dif-fusion Layers on the Performance of Polymer Electrolyte-Based Unitized Re-versible Fuel Cells,” Int. J. Hydrogen Energy, 36, p. 1740.
Fig. 8 The variation of the calculated mean pore diameter as afunction of the threshold for TGP-060
021002-8 / Vol. 11, APRIL 2014 Transactions of the ASME
Downloaded From: http://fuelcellscience.asmedigitalcollection.asme.org/ on 12/06/2013 Terms of Use: http://asme.org/terms
[23] MnIT Research Group, 2013, “Microfluidics Laboratory,” Michigan Techno-logical University, Houghton, MI, http://www.me.mtu.edu/mnit/
[24] Konduru, V., 2010, “Static and Dynamic Contact Angle Measurement onRough Surfaces Using Sessile Drop Profile Analysis With Application to WaterManagement in Low Temperature Fuel Cells,” Master’s thesis, Michigan Tech-nological University, Houghton, MI.
[25] Parikh, N., Allen, J., and Yassar, R. S., 2012, “Microstructure of Gas DiffusionLayers for PEM Fuel Cells,” Fuel Cells, 12(3), pp. 382–390.
[26] Leinhardt, G. and Leinhardt, S., 1980, “Exploratory Data Analysis: New Toolsfor the Analysis of Empirical Data,” Review of Research in Education, Vol. 8,American Educational Research Association, Washington, DC, pp. 85–157.
[27] Sezgin, M. and Sankur, B., 2004, “Survey Over Image Thresholding Techniquesand Quantitative Performance Evaluation,” J. Electron. Imaging, 13(1), pp. 146–168.
[28] Otsu, N., 1979, “A Threshold Selection Method From Gray-Level Histograms,”IEEE Trans. Systems, Man Cybernetics, 9(1), pp. 62–66.
[29] Kumbur, E. C., Sharp, K. V., and Mench, M. M., 2006, “Liquid Droplet Behav-ior and Instability in a Polymer Electrolyte Fuel Cell Flow Channel,” J. PowerSources, 161(1), pp. 333–345.
[30] Whitesides, G. M. and Laibinis, P. E., 1990, “Wet Chemical Approaches to the Char-acterization of Organic Surfaces: Self-Assembled Monolayers, Wetting, and thePhysical-Organic Chemistry of the Solid-Liquid Interface,” Langmuir, 6(1), pp. 87–96.
[31] Fairweather, J. D., Cheung, P., and Schwartz, D. T., 2010, “The Effects of Wet-proofing on the Capillary Properties of Proton Exchange Membrane Fuel CellGas Diffusion Layers,” J. Power Sources, 195(3), pp. 787–793.
[32] Benziger, J., Nehlsen, J., Blackwell, D., Brennan, T., and Itescu, J., 2005,“Water Flow in the Gas Diffusion Layer of PEM Fuel Cells,” J. Membr. Sci.,261(1–2), pp. 98–106.
[33] Jennings, B. R. and Parslow, K., 1988, “Particle Size Measurement: The Equiv-alent Spherical Diameter,” Proc. Roy. Soc. London, Ser. A, 419(1856), pp.137–149.
[34] Dullien, F. A. L., 1992, Porous Media: Fluid Transport and Pore Structure,2nd ed., Academic, New York.
[35] Ihonen, J., Mikkola, M., and Lindbergh, G., 2004, “Flooding of Gas DiffusionBacking in PEFCs, Physical and Electrochemical Characterization,” J. Electro-chem. Soc., 151(8), pp. A1152–A1161.
[36] Liu, T. L., and Pan, C., 2012, “Visualization and Back Pressure Analysis ofWater Transport Through Gas Diffusion Layers of Proton Exchange MembraneFuel Cell,” J. Power Sources, 207, pp. 60–69.
[37] Bazylak, A., Sinton, D., and Djilali, N., 2008, “Dynamic Water Transport andDroplet Emergence in PEMFC Gas Diffusion Layers,” J. Power Sources,176(1), pp. 240–246.
[38] Rofaiel, A., Ellis, J. S., Challa, P. R., and Bazylak, A., 2012, “HeterogeneousThrough-Plane Distributions of Polytetrafluoroethylene in Polymer ElectrolyteMembrane Fuel Cell Gas Diffusion Layers,” J. Power Sources, 201, pp.219–225.
[39] Lim, C. and Wang, C. Y., 2004, “Effects of Hydrophobic Polymer Content inGDL on Power Performance of a PEM Fuel Cell,” Electrochim. Acta, 49(24),pp. 4149–4156.
[40] Fishman, Z. and Bazylak, A., 2011, “Heterogeneous Through-Plane PorosityDistributions for Treated PEMFC GDLs: I. PTFE Effect,” J. Electrochem. Soc.,158, p. B841.
[41] Gallagher, K. G., Darling, R. M., Patterson, T. W., and Perry, M. L., 2008,“Capillary Pressure Saturation Relations for PEM Fuel Cell Gas DiffusionLayers,” J. Electrochem. Soc., 155, p. B1225.
Journal of Fuel Cell Science and Technology APRIL 2014, Vol. 11 / 021002-9
Downloaded From: http://fuelcellscience.asmedigitalcollection.asme.org/ on 12/06/2013 Terms of Use: http://asme.org/terms