Texture and microstructure evolution during non-crystallographic shear banding in a plane strain...
14
Texture and microstructure evolution during non-crystallographic shear banding in a plane strain compressed Cu–Ag metal matrix composite N. Jia a,⇑ , D. Raabe b,⇑ , X. Zhao a a Key Laboratory for Anisotropy and Texture of Materials (MOE), Northeastern University, Shenyang 110819, People’s Republic of China b Max-Planck-Institut fu ¨ r Eisenforschung, D-40237 Du ¨ sseldorf, Germany Received 8 January 2014; received in revised form 20 April 2014; accepted 16 May 2014 Abstract We studied the texture and microstructure evolution in a plane strain compressed Cu–Ag metal matrix composite (MMC) with a het- erophase microstructure using crystal plasticity finite element simulations. Lattice reorientations induced by both crystallographic (dis- location slip and twinning) and non-crystallographic (shear banding) mechanisms are addressed. First, simulations on a polycrystalline composite are made. Quite similar texture trends are observed for the composites and for the individual single-phase materials, namely, copper-type texture components in the Cu phase and brass-type texture components in the Ag phase. This result differs from experimen- tal data that show less copper-type and more brass-type textures in both phases for the composite materials. To explore co-deformation mechanisms that lead to the specific crystallographic textures in the MMC, bicrystal simulations for the composite with specific initial orientation combinations are performed. The bicrystal simulations reproduce the experimentally observed trends of texture evolution in the respective phases of the composite, indicating that the localized stress and strain fields as well as the co-deformation mechanisms within the actual heterophase microstructure are well captured. The modeling shows that to accommodate plastic deformation between adjacent phases in the bicrystals, pronounced shear bands are triggered by stress concentration at the hetero-interfaces. With further deformation the bands penetrate through the phase boundaries and lead to larger lattice rotations. The simulations confirm that the shear banding behavior in heterophase composites is different from that in single-phase metals and the texture evolution in composite materials is strongly influenced by the starting texture, the local constraints exerted from the phase boundaries and the constitutive prop- erties of the abutting phases. Ó 2014 Acta Materialia Inc. Published by Elsevier Ltd. All rights reserved. Keywords: Shear band; Texture; Metal matrix composites; Crystal plasticity finite element analysis 1. Introduction Shear banding in plastically strained metallic materials is an important topic owing to the complex interaction of crystallographic and non-crystallographic deformation mechanisms. It is the most frequently observed yet least understood mesoscopic deformation phenomenon in high-performance materials [1–18]. Shear bands, in the form of non-crystallographic band-like regions of concen- trated plastic flow, set in when homogeneous dislocation slip or twinning is inhibited [7–9,14,18]. The bands start in individual crystallites but proceed across multiple inter- faces and finally cover a large volume fraction of the entire microstructure [1,8,9]. Owing to the non-crystallographic alignment of the bands, they add additional degrees of free- dom to the total deformation field. On the other hand, shear bands represent a type of deformation mechanism that involves very high dislocation (or twin) densities http://dx.doi.org/10.1016/j.actamat.2014.05.036 1359-6454/Ó 2014 Acta Materialia Inc. Published by Elsevier Ltd. All rights reserved. ⇑ Corresponding authors. E-mail addresses: [email protected] (N. Jia), [email protected] (D. Raabe). www.elsevier.com/locate/actamat Available online at www.sciencedirect.com ScienceDirect Acta Materialia 76 (2014) 238–251
Transcript of Texture and microstructure evolution during non-crystallographic shear banding in a plane strain...

Available online at www.sciencedirect.com
www.elsevier.com/locate/actamat
ScienceDirect
Acta Materialia 76 (2014) 238–251
Texture and microstructure evolution duringnon-crystallographic shear banding in a plane strain
compressed Cu–Ag metal matrix composite
N. Jia a,⇑, D. Raabe b,⇑, X. Zhao a
a Key Laboratory for Anisotropy and Texture of Materials (MOE), Northeastern University, Shenyang 110819, People’s Republic of Chinab Max-Planck-Institut fur Eisenforschung, D-40237 Dusseldorf, Germany
Received 8 January 2014; received in revised form 20 April 2014; accepted 16 May 2014
Abstract
We studied the texture and microstructure evolution in a plane strain compressed Cu–Ag metal matrix composite (MMC) with a het-erophase microstructure using crystal plasticity finite element simulations. Lattice reorientations induced by both crystallographic (dis-location slip and twinning) and non-crystallographic (shear banding) mechanisms are addressed. First, simulations on a polycrystallinecomposite are made. Quite similar texture trends are observed for the composites and for the individual single-phase materials, namely,copper-type texture components in the Cu phase and brass-type texture components in the Ag phase. This result differs from experimen-tal data that show less copper-type and more brass-type textures in both phases for the composite materials. To explore co-deformationmechanisms that lead to the specific crystallographic textures in the MMC, bicrystal simulations for the composite with specific initialorientation combinations are performed. The bicrystal simulations reproduce the experimentally observed trends of texture evolution inthe respective phases of the composite, indicating that the localized stress and strain fields as well as the co-deformation mechanismswithin the actual heterophase microstructure are well captured. The modeling shows that to accommodate plastic deformation betweenadjacent phases in the bicrystals, pronounced shear bands are triggered by stress concentration at the hetero-interfaces. With furtherdeformation the bands penetrate through the phase boundaries and lead to larger lattice rotations. The simulations confirm that theshear banding behavior in heterophase composites is different from that in single-phase metals and the texture evolution in compositematerials is strongly influenced by the starting texture, the local constraints exerted from the phase boundaries and the constitutive prop-erties of the abutting phases.� 2014 Acta Materialia Inc. Published by Elsevier Ltd. All rights reserved.
Keywords: Shear band; Texture; Metal matrix composites; Crystal plasticity finite element analysis
1. Introduction
Shear banding in plastically strained metallic materialsis an important topic owing to the complex interaction ofcrystallographic and non-crystallographic deformationmechanisms. It is the most frequently observed yet leastunderstood mesoscopic deformation phenomenon in
http://dx.doi.org/10.1016/j.actamat.2014.05.036
1359-6454/� 2014 Acta Materialia Inc. Published by Elsevier Ltd. All rights r
⇑ Corresponding authors.E-mail addresses: [email protected] (N. Jia), [email protected]
(D. Raabe).
high-performance materials [1–18]. Shear bands, in theform of non-crystallographic band-like regions of concen-trated plastic flow, set in when homogeneous dislocationslip or twinning is inhibited [7–9,14,18]. The bands startin individual crystallites but proceed across multiple inter-faces and finally cover a large volume fraction of the entiremicrostructure [1,8,9]. Owing to the non-crystallographicalignment of the bands, they add additional degrees of free-dom to the total deformation field. On the other hand,shear bands represent a type of deformation mechanismthat involves very high dislocation (or twin) densities
eserved.

N. Jia et al. / Acta Materialia 76 (2014) 238–251 239
locally inside them and at their rims. The regions surround-ing them are much less strained, typically by one to threeorders of magnitude [10,12]. Substructure evolution anddevelopment of shear bands are strongly influenced bythe stacking fault energy (SFE), as confirmed by a numberof experiments [1,7–9,14,18]. According to the terminologyof Wagner et al. [5], low-SFE materials with a pre-existingmicrostructure consisting of twin-matrix lamellae producebrass-type shear bands, and high-SFE metals with a micro-structure consisting of elongated dislocation walls and cellblocks produce copper-type shear bands. Therefore, shearbanding is preceded by the formation of planar obstaclesthat are determined by the SFE and by the crystallographyof homogeneous dislocation slip.
Shear banding, although appearing as a non-crystallo-graphic deformation mechanism, is also associated withlarge local crystallographic reorientations, i.e. texturechanges. Such local crystallographic orientations ofdeformed face-centered cubic (fcc) and body-centered cubic(bcc) metals have been characterized using transmissionelectron microscopy (TEM) [3,13,15,19]. It was found thatin both types of materials the shear banding induced textureevolution is profoundly different from crystal rotation thatoriginates from homogeneous dislocation and twinningshear alone. For fcc metals, activation of shear banding pro-duces the weaker copper ({112}h111i) and S ({123}h634i)texture components (copper-type textures) as well as thestronger Goss ({011}h100i) and brass ({011}h211i) tex-ture components (brass-type textures) compared to regionsoutside the shear bands. For bcc metals, the strain concen-tration in shear bands causes a rotation of the in-band crys-tal volume around the h110i crystal axis which is parallel tothe transverse direction of the cold rolled sample. Althoughthe shear banding induced textures in single-phase metalshave been studied in great detail, corresponding studies onmulti-phase metal matrix composites (MMCs) with a micro-structure constituting heterophase interfaces are rarely con-ducted. Actually, most of the deformation texture studies onmultiphase metallic materials so far were conducted byexperiments and a number of interesting results have beenobtained [20–28]. In a two-phase TiAl alloy consistingmainly of lamellar c and a2 grains [22], the brass-type rollingtexture was observed in the c-matrix when the alloy was sub-jected to two different deformation modes, i.e. compressionat room temperature and hot extrusion. The result wasunexpected and it was explained in terms of the fact thatin both types of processing a strong tendency prevailed todeform via plane strain condition, due to the influence ofthe a2 lamellae on the slip and twinning geometry in thematrix. Studies on Cu–Nb multilayer composites with dif-ferent layer thicknesses (ranging from submicron to nano-meter in scale) during accumulative roll bonding [24,27,28]revealed that the textures developed in Cu and Nb layerswere distinctly different from classical rolling textures fre-quently observed in their single-phase counterparts, bothby experiment [1–9] and by simulation [29–38]. It was sug-gested that the Cu/Nb interfaces influenced the slip activity
in both phases by constraining grain deformation orthrough the kinetics of dislocation–interface interactions.Although all these studies have clearly shown that in com-posite materials heterophase interfaces play a major rolein the texture development of the constituent phases, anunderstanding of how through-interface shear bandingaccommodates the imposed deformation and the effect ofshear banding on texture evolution is still lacking.
Hence, our aim here is the numerical simulation of tex-ture evolution in a composite consisting of two immisciblemetals, Ag as matrix and Cu as second phase, under plasticdeformation. The Cu–Ag sheet after cold rolling to largestrains can be used as a high-strength conductive material,as refinement of the microstructure leads to a high strength[11,39–41]. As mentioned above, in the mechanically pro-cessed composites, textures can be sensitively influencedby the presence of a massive volume fraction of a secondphase [20,24,26–28]. However, less effort has so far beenmade towards modeling the phase-to-phase interactionsfor predicting the evolution of preferred grain orientationdistributions and strain accommodation of shear bandedregions [42,43]. Therefore, in this work plane strain com-pression of polycrystal and bicrystal Cu–Ag composite issimulated using a crystal plasticity finite element (CPFE)framework that incorporates the non-crystallographicshear banding mechanism in addition to dislocation slipand mechanical twinning [16]. Both types of deformationmicromechanisms (crystallographic and non-crystallo-graphic) and the associated lattice reorientations in the het-erophase composite microstructure are addressed. Thelayout of the paper is as follows: First, the crystallographictextures obtained from polycrystal simulations for the Cu–Ag composite are presented. Discrepancies between predic-tions and experimental data from the literature are found.To explore co-deformation mechanisms that lead to spe-cific crystallographic textures in the MMC, bicrystal simu-lations for the composite with specific and ideal initialorientation combinations are performed. Next we analyzethe inhomogeneity of the resulting microstructures andplastic flow in the bicyrstals. Specifically, we address theobservation that compared to single-phase materials thecomposites are more prone to undergoing shear banding.This phenomenon is discussed in terms of the existence ofheterophases. Finally, polycrystal simulations incorporat-ing more non-crystallographic shear in one of the individ-ual phases of the composite are presented. This latter testis conducted to demonstrate that for modeling deformationtextures in a heterophase microstructure, stress and strainlocalization effects exhibit a strong influence on the shearbanding behavior.
2. Simulation procedures
2.1. Constitutive formulations
A CPFE model is used to simulate the texture evolutionin Cu–Ag heterophase composites during plane strain

240 N. Jia et al. / Acta Materialia 76 (2014) 238–251
compression. The model is based on a constitutive modelthat incorporates shear banding as a separate non-crystal-lographic deformation mechanism in conjunction with andcompeting to dislocation slip and mechanical twinning [44].The implementation of the different deformation mecha-nisms follows the recent work of Jia et al. [16]. For shearbanding as a collective, third type of deformation mecha-nism, we use and refer to the model developed by Anandand Su [45] for amorphous metallic materials.
2.2. Constitutive material parameters
The constitutive parameters for the individual Cu andAg phases are determined by fitting the macroscopicstress–strain curves obtained from uniaxial tensile testsconducted on each pure metal [46,47]. The experimentallyavailable data on the pure metals from literature show veryductile behavior in the annealed and coarse-grained form.The material parameters used in this study thus representvalues of the individual phases with micrometer-sizedgrains in the two-phase composite. The use of such fitteddata for the respective pure phases is justified since at themodest deformations simulated here mutual chemical mix-ing can be neglected. The fitted parameters are listed inTable 1. For the two fcc phases, 12 {11 1}h110i dislocationslip systems and 12 {111}h112i twinning systems areconsidered.
2.3. FEM implementation
Based on the constitutive laws outlined above, CPFEsimulations are carried out using the finite element solverMSC.Marc2010 together with a user defined material sub-routine [16,44]. This paper firstly focuses on the texturesimulation of fcc–fcc (Cu–Ag) heterophase compositeunder plane strain compression by using a polycrystalmodel. For further studying shear banding in such materi-als with heterophase interfaces in more micromechanicaldetail as a function of crystal orientation, the deformationof fcc Cu plus fcc Ag bicrystals with varying initial orienta-tions is simulated. For the bicrystal modeling, detailed
Table 1Material parameters of the Cu and Ag phases used in the crystal plasticity simudenote the bulk diffusion coefficient and the activation energy for dislocation cdislocation density qsgl,0 = 1.0 � 1012 m�2, dipole density qdip,0 = 1.0 m�2, initiaband systems _cv
0 = 1.0 � 10�4 m s�1. The asterisk (*) indicates fitting paramete
Phase C11 (GPa) C12 (GPa) C44 (GPa)
Cu 168.4 121.4 75.4Ag 124.0 93.1 46.1
ssolute (GPa)* QSD (J)* Q0 (J)*
Cu 0.0142 2.7 � 10�19 4.0 � 10�1
Ag 0.0048 3.4 � 10�19 3.58 � 10�
btwin (m) L0* _N0 (s�1)*
Cu 1.47 � 10�10 520 � b 1.0 � 1014
Ag 1.66 � 10�10 520 � b 2.0 � 1015
results on local orientation distributions, shear band topol-ogy and the governing micromechanisms are presented.
3. Polycrystal simulations of texture evolution
3.1. Polycrystal model
For simulating texture evolution of the polycrystallineCu–Ag composite, a finite element mesh including 2000eight-noded, isoparametric, three-dimensional brick ele-ments is used for the composite. Different material proper-ties representing different single-phase metals are given tothe respective elements so that the overall composition ofthe fcc–fcc composite is Cu–68.3 vol.% Ag or Cu–60.1 at.% Ag [48]. The elements of the different phasesare clustered in random order in the composite. By assign-ing one orientation to each of the eight integration pointsin an element before deformation, the numbers of initialorientations representing random textures of the constitu-ent phases in the as-received material are 5120 (640 � 8)for Cu and 10,880 (1360 � 8) for Ag. As loading state,plane strain compression at a strain rate of 10�3 s�1 in con-junction with periodic boundary conditions is simulated toapproximate the deformation state in the inner (mid-thick-ness) layers of a cold rolled specimen [20,49].
3.2. Texture evolution predicted by polycrystal modeling
As orientations that occur during plane strain compres-sion of materials with cubic symmetry are concentratedalong certain directions in Euler space, specific fibers inEuler space for each constituent phase in the Cu–Ag com-posite are used to characterize the texture evolution in therespective phases with increasing thickness reduction[2,4,50].
For the fcc phases in the composite, the simulated orien-tation densities along the a and b fibers are presented inFig. 1 [2,4,5,51]. The texture simulations for single-phaseCu and Ag with random initial textures are also presentedfor comparison. To simplify the presentation, Miller indi-ces and Euler angles of some ideal rolling texture compo-
lations. C11, C12 and C44 are the single crystal elastic constants. D0 and QSD
limb, respectively. The following parameters are used for all phases: initiall glide velocity v0 = 1.0 � 10�4 m s�1, and reference shear rate of the shearrs.
dgrain (lm) b (m) D0 (m2 s�1)
30 2.55 � 10�10 2.0 � 10�5
30 2.88 � 10�10 4.0 � 10�5
p* q* s (lm)
9 1.03 1.0 0.1519 1.15 1.0 0.15
r* csf (J m�2) ssb (GPa)*
2.0 0.042 0.1842.0 0.016 0.112

a b
c d
0 30 60 900
2
4
6
8
10
12
14
f(g)
ϕ1 (ο)
{011} <211>
{011} <111>
{011} <011>
{011} <100>
45 60 75 904
8
12
16
2050%_single phase Cu75%_single phase Cu89%_single phase Cu 50%_Cu in Cu-68.3 vol.% Ag 75%_Cu in Cu-68.3 vol.% Ag 89%_Cu in Cu-68.3 vol.% Ag
ϕ2 (ο)
f(g)
{123} <634>
{011} <211>
{112} <111>
0 30 60 900
2
4
6
8
10
12
14
f(g)
ϕ1 (ο)
{011} <211>
{011} <111>
{011} <011>
{011} <100>
45 60 75 904
8
12
16
20 50%_single phase Ag75%_single phase Ag89%_single phase Ag 50%_Ag in Cu-68.3 vol.% Ag 75%_Ag in Cu-68.3 vol.% Ag 89%_Ag in Cu-68.3 vol.% Ag
ϕ2 (ο)
f(g)
{123} <634>
{011} <211>
{112} <111>
Fig. 1. Predicted texture evolution of cold rolled pure metals and Cu–68.3 vol.% Ag composite at different thickness reductions in fiber representation: (a)a and (b) b fiber for single-phase Cu and Cu phase in the composite, (c) a and (d) b fiber for single-phase Ag and Ag phase in the composite. The a fiber isplaced at the Euler space section with constant angles U = 45� and u2 = 0�; the b fiber is a skeleton fiber, i.e. it follows the local maximum texture intensityf(g) in each Euler space section along the u2 angle.
Table 2Miller indices and Euler angles of the ideal texture orientations in fccmetals.
Component Indices {hk l}huvwi Bunge (u1, U and u2)
Copper {112}h111i 90�, 35�, 45�Goss {011}h100i 0�, 45�, 0�Brass {011}h211i 35�, 45�, 0�S {123}h634i 59�, 37�, 63�
N. Jia et al. / Acta Materialia 76 (2014) 238–251 241
nents are listed in Table 2 [1–5,52]. At 50% thickness reduc-tion, the Goss, brass and copper texture components arepredicted in both phases of the composite. This agrees withexperimental observations for pure Cu and Ag polycrystals[1,4,53,54]. However, after 50% deformation, differencesbetween the two phases start to appear. This can be seenon the a fiber in terms of the brass component and onthe b fiber in terms of the copper component: after 75%thickness reduction a more significant increase of the brassand Goss components and a less pronounced increase of
the copper and S components are predicted in the Ag phasecompared to the Cu phase. When the thickness reductionreaches 89%, in the Cu phase the copper component fur-ther develops and very sharp copper-type texture appears.In the Ag phase, the brass component is more significantlystrengthened compared to the copper component as a func-tion of deformation, which contributes to a dominantbrass-type texture. The predicted texture evolution in thetwo phases of the composite shows quite similar trends asthat of their respective single-phase counterparts. Never-theless, while the simulation of the Ag phase agrees wellwith bulk X-ray diffraction texture measurement, the pre-dicted result for the Cu phase deviates from the measure-ments of the same composite which exhibit a strongerbrass component compared to the copper component inCu at 75% and higher rolling reductions [26]. More specif-ically, the measured texture development in the Cu phaseof the composite is very different from the copper-type tex-tures expected for rolled pure metals with medium or highSFEs [1–5]. Thus, it is obvious that the existence of the Ag
X
Y
H0
L0
<hkl>Ag
<uvw>Ag
<hkl>Cu
<uvw>Cu
<hkl>Ag
<uvw>Ag
<hkl>Cu
<uvw>Cu
Cu
Ag
Cu
Ag
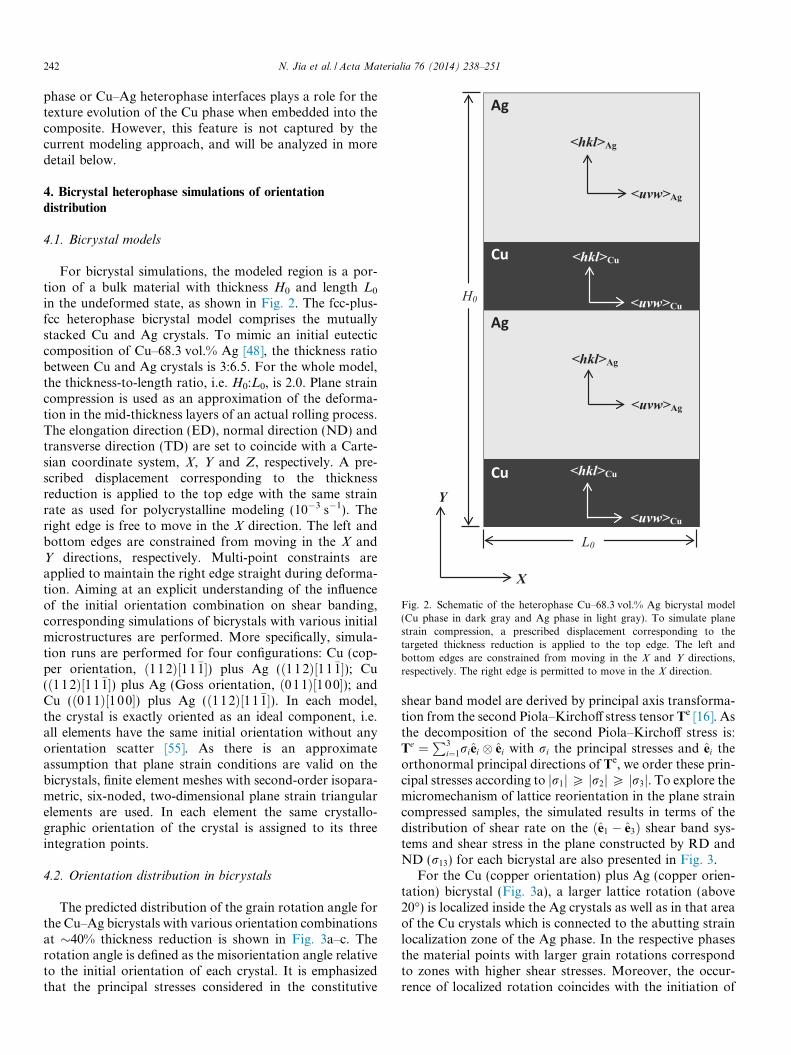
Fig. 2. Schematic of the heterophase Cu–68.3 vol.% Ag bicrystal model(Cu phase in dark gray and Ag phase in light gray). To simulate planestrain compression, a prescribed displacement corresponding to thetargeted thickness reduction is applied to the top edge. The left andbottom edges are constrained from moving in the X and Y directions,respectively. The right edge is permitted to move in the X direction.
242 N. Jia et al. / Acta Materialia 76 (2014) 238–251
phase or Cu–Ag heterophase interfaces plays a role for thetexture evolution of the Cu phase when embedded into thecomposite. However, this feature is not captured by thecurrent modeling approach, and will be analyzed in moredetail below.
4. Bicrystal heterophase simulations of orientation
distribution
4.1. Bicrystal models
For bicrystal simulations, the modeled region is a por-tion of a bulk material with thickness H0 and length L0
in the undeformed state, as shown in Fig. 2. The fcc-plus-fcc heterophase bicrystal model comprises the mutuallystacked Cu and Ag crystals. To mimic an initial eutecticcomposition of Cu–68.3 vol.% Ag [48], the thickness ratiobetween Cu and Ag crystals is 3:6.5. For the whole model,the thickness-to-length ratio, i.e. H0:L0, is 2.0. Plane straincompression is used as an approximation of the deforma-tion in the mid-thickness layers of an actual rolling process.The elongation direction (ED), normal direction (ND) andtransverse direction (TD) are set to coincide with a Carte-sian coordinate system, X, Y and Z, respectively. A pre-scribed displacement corresponding to the thicknessreduction is applied to the top edge with the same strainrate as used for polycrystalline modeling (10�3 s�1). Theright edge is free to move in the X direction. The left andbottom edges are constrained from moving in the X andY directions, respectively. Multi-point constraints areapplied to maintain the right edge straight during deforma-tion. Aiming at an explicit understanding of the influenceof the initial orientation combination on shear banding,corresponding simulations of bicrystals with various initialmicrostructures are performed. More specifically, simula-tion runs are performed for four configurations: Cu (cop-per orientation, ð112Þ½11�1�) plus Ag (ð1 12Þ½11�1�); Cu(ð1 12Þ½11�1�) plus Ag (Goss orientation, ð011Þ½100�); andCu (ð011Þ½100�) plus Ag (ð1 12Þ½11�1�). In each model,the crystal is exactly oriented as an ideal component, i.e.all elements have the same initial orientation without anyorientation scatter [55]. As there is an approximateassumption that plane strain conditions are valid on thebicrystals, finite element meshes with second-order isopara-metric, six-noded, two-dimensional plane strain triangularelements are used. In each element the same crystallo-graphic orientation of the crystal is assigned to its threeintegration points.
4.2. Orientation distribution in bicrystals
The predicted distribution of the grain rotation angle forthe Cu–Ag bicrystals with various orientation combinationsat �40% thickness reduction is shown in Fig. 3a–c. Therotation angle is defined as the misorientation angle relativeto the initial orientation of each crystal. It is emphasizedthat the principal stresses considered in the constitutive
shear band model are derived by principal axis transforma-tion from the second Piola–Kirchoff stress tensor Te [16]. Asthe decomposition of the second Piola–Kirchoff stress is:Te ¼
P3i¼1riei � ei with ri the principal stresses and ei the
orthonormal principal directions of Te, we order these prin-cipal stresses according to jr1jP jr2jP jr3j. To explore themicromechanism of lattice reorientation in the plane straincompressed samples, the simulated results in terms of thedistribution of shear rate on the ðe1 � e3Þ shear band sys-tems and shear stress in the plane constructed by RD andND (r13) for each bicrystal are also presented in Fig. 3.
For the Cu (copper orientation) plus Ag (copper orien-tation) bicrystal (Fig. 3a), a larger lattice rotation (above20�) is localized inside the Ag crystals as well as in that areaof the Cu crystals which is connected to the abutting strainlocalization zone of the Ag phase. In the respective phasesthe material points with larger grain rotations correspondto zones with higher shear stresses. Moreover, the occur-rence of localized rotation coincides with the initiation of

N. Jia et al. / Acta Materialia 76 (2014) 238–251 243
the shear band systems. It is found that shear bands in theupper Cu crystal are specifically triggered by stress concen-trations at phase boundaries, which leads to the significantreorientation of crystalline portions within the bands. Inaddition, at this stage significant bending of the regionsnear the phase boundaries is predicted and zones of largegrain rotation (�55�) penetrate through the curved hetero-phase boundaries. The curved phase boundaries are corre-sponding to the material points where shear band regionsintersect the interfaces. Accordingly, the elements insidethe shear bands of the Cu phase are severely narrowed,even though the Cu phase is mechanically stronger thanthe Ag phase. A consistent result has been observed inmetallic multilayers made from dissimilar metals whereshear bands running through the layers lead to neckingof the respectively harder material [17,56]. The highly com-pacted meshes in the microstructure indicate that elementsin those areas have been severely distorted.
Grain rotation
Shear rate on the (^
1e -^
3e ) shear band systems
a
Shear stress σ13
0 -0.001 -0.003-0.005-0.006-0.008-0.010-0.012-0.013-0.014-0.016
2.41e+082.05e+081.68e+081.31e+089.43e+075.75e+072.08e+05
-1.60e+07-5.27e+07-8.95e+07-1.26e+08
65.0º58.5º52.0º45.5º39.0º32.5º26.0º19.5º13.0º6.5º0.0ºCu crystal
(Copper orienta�on,1( 1 1[)2 11])
Cu crystal(Copper orienta�on,
1( 1 1[)2 11])
Ag crystal(Copper orienta�on,
1( 1 1[)2 11] )
Ag crystal(Copper orienta�on,
1( 1 1[)2 11])
‘A’
‘B’
b
Fig. 3. Predicted distributions of grain rotation angle, shear rate on the ðe1 � e3
orientations: (a) Cu (copper orientation, ð112Þ½11�1�) plus Ag (copper orientat(copper orientation, ð112Þ½11�1�) plus Ag (Goss orientation, ð011Þ½100�) heterð011Þ½100�) plus Ag (copper orientation, ð112Þ½11�1�) heterophase bicrystal abetween abutting crystals.
To emphasize and visualize the microtextures in the Cu–Ag bicrystals with different microstructures more clearly,the lattice rotations along the line AB, which is parallelto the ND, are traced. As indicated in Fig. 3a–c, in eachbicrystal the scanned line passes zones with large grainrotation and severe phase boundary curvature. Thepredicted grain rotation angle for the samples at a fixedstrain is plotted as a function of the 40 evaluated pointsreaching from “A” to “B”, as shown in Fig. 4. Equivalenttrue strain values are also shown in the plots against theevaluated points along each line scan. The insert in eachplot is the {111} pole figure for the most heavily rotatedpoint in the constituent phases of the deformed bicrystal.For the Cu (copper orientation) plus Ag (copper orienta-tion) sample (Fig. 4a), the grain rotation line scan revealslarge rotation spreads up to 50–55� with respect to the ori-ginal orientation of each point in both phases. These rota-tions occur about the TD//h110i axis and lead to the
Grain rotation
Shear rate on the (^
1e -^
3e ) shear band systems
Shear stress σ13
0-0.001 -0.003-0.005-0.006-0.008-0.010-0.012-0.013-0.014-0.016
1.58e+081.26e+089.45e+076.29e+073.12e+07
-4.66e+05-3.21e+07-6.38e+07-9.55e+07-1.27e+08-1.59e+08
Cu crystal(Copper orienta�on,
1( 1 1[)2 11] )
Cu crystal(Copper orienta�on,
1( 1 1[)2 11])
Ag crystal(Goss orienta�on,
0( 1 1[)1 0 ]0 )
Ag crystal (Goss orienta�on,
0( 1 1[)1 0 ]0 )
‘B’
‘A’
65.0º58.5º52.0º45.5º39.0º32.5º26.0º19.5º13.0º6.5º0.0º
Þ shear band systems and shear stress r13 for bicrystals with different initialion, ð112Þ½11�1�) heterophase bicrystal at 40% thickness reduction, (b) Cuophase bicrystal at 33% thickness reduction and (c) Cu (Goss orientation,t 40% thickness reduction. In these models, white lines indicate interfaces

a
0 10 20 30 400
10
20
30
40
50
60
0.0
0.6
1.2
1.8
2.3
2.9
3.5
Equivalent true strainEquivalent true strain
Equivalent true strain
Grain rotationEquivalent true strain
Points from 'A'to'B'
Points from 'A'to'B'
Points from 'A'to'B'
Gra
in ro
tatio
n(o )
Gra
in ro
tatio
n(o )
Gra
in ro
tatio
n(o )
(Copper orienta�on,1( 1 1[)2 11] )
Cu crystal
1( 1 1[)2 11])
Ag crystal(Copper orienta�on,
ED
TD
Cu crystal(Copper orienta�on,
1( 1 1[)2 11] )
1( 1 1[)2 11])
Ag crystal(Copper orienta�on,
b ED
TD
0 10 20 30 400
10
20
30
40
50
60
0.0
0.3
0.6
0.9
1.2
1.5
1.8
Grain rotation Equivalent true strain
0( 1 1[)1 0 ]0 )
Ag crystal (Goss orienta�on,
Cu crystal(Copper orienta�on,
1( 1 1[)2 11] )
0( 1 1[)1 0 ]0 )
Ag crystal (Goss orienta�on,
Cu crystal(Copper orienta�on,
1( 1 1[)2 11] )
c (Goss orienta�on,
0 10 20 30 400
10
20
30
40
50
60
0.0
0.6
1.2
1.8
2.3
2.9
3.5
Grain rotation Equivalent true strain
TD
ED
Ag crystal(Copper orienta�on,
1( 1 1[)2 11] )
Ag crystal(Copper orienta�on,
1( 1 1[)2 11] )
(Goss orienta�on,0( 1 1[)1 0 ]0 )
Cu crystal
0( 1 1[)1 0 ]0 )
Cu crystal
Fig. 4. Predicted evolution of grain rotation angle with respect to itsoriginal orientation and a equivalent true strain for each phase in adeformed Cu–Ag bicrystal, along the line scan from “A” to “B” (asmarked in Fig. 3a–c) for the corresponding models: (a) Cu (copperorientation, ð112Þ½11�1�) plus Ag (copper orientation, ð112Þ½11�1�) het-erophase bicrystal at 40% thickness reduction, (b) Cu (copper orientation,ð112Þ½11�1�) plus Ag (Goss orientation, ð011Þ½100�) heterophase bicrystalat 33% thickness reduction and (c) Cu (Goss orientation, ð011Þ½100�) plusAg (copper orientation, ð112Þ½11�1�) heterophase bicrystal at 40% thick-ness reduction. On each line the grain rotation angle and equivalent truestrain at 40 evenly distributed points are evaluated. The {111} pole figuresshow the initial orientation (in open circle “s”) and the orientation afterdeformation (with the maximum rotation angle, in solid circle “d”) foreach phase. Orientations of the Cu and Ag phases are represented in blackand red, respectively. (For interpretation of the references to color in thisfigure legend, the reader is referred to the web version of this article.)
Grain rotation
Shear rate on the (^
1e -^
3e ) shear band systems
c
Shear stress σ13
1.34e+081.11e+088.70e+076.35e+074.00e+071.65e+07
-7.04e+06-3.06e+07-5.41e+07-7.76e+07-1.01e+08
0-0.001 -0.003-0.005-0.006-0.008-0.010-0.012-0.013-0.014-0.016
Ag crystal(Copper orienta�on,
1( 1 1[)2 11] ) 65.0º58.5º52.0º45.5º39.0º32.5º26.0º19.5º13.0º6.5º0.0º
Cu crystal (Goss orienta�on,
0( 1 1[)1 0 ]0 )
Ag crystal(Copper orienta�on,
1( 1 1[)2 11] )
Cu crystal (Goss orienta�on,
0( 1 1[)1 0 ]0 )
‘A’
‘B’
Fig 3. (continued)
244 N. Jia et al. / Acta Materialia 76 (2014) 238–251
ð441Þ½�1�18� (near Goss) orientation, as shown in the corre-sponding pole figure. Along the line from point “A” topoint “B”, the change of rotation angle corresponds tothe lattice rotation distribution shown in Fig. 3a. It isworth noting in that context that strain localization doesnot necessarily occur at the regions with large rotationangles. In the upper Cu crystal, a rotation of �55� is iden-tified at the phase boundary between the crystal and thelower Ag crystal. However, at the corresponding points lesssignificant true strain (�1.5) but apparent shear banding isidentified. Still in this Cu crystal, at the boundary betweenthe crystal and the upper Ag crystal very sharp strain local-ization (�3.2) appears, whereas the corresponding grainrotation is below 10�. In the lower Ag crystal, the rotationangle of �55� (corresponding to a true strain range of 0.6–1.2) occurs at the points close to the upper Cu crystal. At20% thickness reduction we find that the shear band sys-tems have been activated in regions of both phases wherestress reaches the critical value to initiate the shear bandsystems. With further deformation, stress becomes homo-geneously distributed throughout the bicrystal. Accord-ingly, decreasing shear rates of the shear band systems ispredicted within the bands and activation of the shear band

N. Jia et al. / Acta Materialia 76 (2014) 238–251 245
systems is mainly localized at the border of the bands. Ourprevious simulations on Cu single crystals [57] have shownthat the activation of the shear band systems enables the in-band region to be rotated around the transverse directionof the rolled sample, which then facilitates further strainaccommodation by homogeneous slip along the shearplane. Consequently, the area outside the bands is gradu-ally incorporated into the bands with deformation. Thisfeature is extensively reported as the development of shearbands by experiments [9,14,15], and is predicted as bandthickening in our simulations [57]. Therefore, at 40% thick-ness reduction the insignificant shear banding inside theshear banding region is attributed to the release of stressin the firstly formed shear bands. This explains the signifi-cant grain rotation but the weakly activated shear bandsystems inside shear bands as well as the insignificant grainrotation at the border of the continuously thickened bandswith deformation. In regions far from the boundarybetween the upper Cu crystal and the lower Ag crystal,the rotation angle is within a range of 0–20�. This meansthat the Ag crystal undergoes a rotation about the h110iaxis to reach the ð114Þ½�2�21�(GT) orientation. In the lowerCu crystal, the rotation angle is below 10�, indicative of thestable orientation of the crystal. To this stage, a tentativeconclusion is that the localized true strain does not neces-sarily coincide with significant lattice rotations. The defor-mation mechanisms (dislocation slip, twinning and shearbanding) that contributes to crystallographic shear primar-ily determines the rotation of the crystal. Hence, to pre-cisely capture texture evolution in a bulk material withheterophase interfaces, it is essential to understand howthe strain distribution and the lattice rotations are influ-enced by co-deformation of the constituent phases, as willbe discussed in Section 5.
For the Cu (copper orientation) plus Ag (Goss orienta-tion) bicrystal at 33% thickness reduction, compared to thecorresponding phases in the Cu (copper orientation) plusAg (copper orientation) bicrystal, the maximum latticerotation is lower (�25�) in both the Ag and Cu phases(Fig. 3b). Since the Cu phase has an initial orientation thatpromotes shear banding as shown in Refs. [16,58], theregions with larger lattice rotation in the different phasesare connected with each other at those material regionsof the Cu crystals where significant shear banding appears.This observation shows that the local constraints exertedfrom a phase with shear bands reaching a hetero-interfacepromote lattice rotation also in its neighbor phase. In thelower Ag crystal larger rotation is also found between theleft and right edges of the crystal. However, no shear band-ing is activated in this phase with its initial Goss orienta-tion. Along the line scan in this bicrystal (Fig. 4b), thedistribution of true strain fluctuates although the maxi-mum value reaches �1.0. It is generally observed that theinitial textures in the respective phases rotate at higherdegrees in regions with larger strain localization. In theCu and Ag crystals, a rotation of �10� about TD//h110iwith respect to their respective original orientations occurs
at the phase boundaries. This corresponds to the formationof the ð4411Þ½1111�8�(D) orientation in Cu and the orienta-tion close to the ð26265Þ½�5�552�(DT) in Ag, respectively. Inregions adjacent to the phase boundaries, the rotationangle decreases with increasing distance between the evalu-ated points and the boundaries. As the initial orientation ofthe Ag phase is not preferential for activating the shearband systems, the larger rotation (�10�) in the Ag crystalsis irrelevant to shear banding. Moreover, in the Cu phasethe �10� rotation does not coincide with the activationof the shear band systems either, as clearly seen at theboundary between the lower Ag and Cu crystals whereno shear banding is identified (Fig. 3b). Therefore, in thissample dislocation slip is the main cause of grain rotationfor both phases.
For the 40% deformed Cu (Goss orientation) plus Ag(copper orientation) sample, in the Ag phase the regionwith large grain rotations (above 55�) yields an angle of�37� with respect to the ED (Fig. 3c). This pattern is closeto that of the copper-oriented Ag single crystal [58]. How-ever, very minor rotation is found in the Cu phase althoughphase boundaries of the upper Cu crystal have been largelyrotated to be approximately aligned with the rotated regionin the abutting Ag crystals. This is because shear banding isonly activated in the Ag phase but not in the Cu phase. Inthe Ag crystals shear banding is identified at the border ofthe zone with large rotations, suggesting that at this stageshear banding plays a major role in accommodating theimposed deformation between shear bands and regionsoutside the bands. The significant shear stress at the mate-rial points in the Ag crystals with large rotations indicatesthat the activation of the shear band systems is triggered inthis phase when local stress reaches the critical value to ini-tiate shear banding. Following the scanned line in thebicrystal (Fig. 4c), a maximum rotation about the TD upto �55� is predicted in the Ag phase. In addition, a largertrue strain (above 0.6) is found at the points located withinthe upper Cu crystal and the points within the Ag crystalswith large rotations. More specifically, 55� rotation of theAg crystals coincides with the occurrence of shear bandsand also of localized strain. In the upper Cu crystal, therotation angle is lower than 10� although a significant localtrue strain of �2.2 is predicted. In this sample, the initialorientation of the Cu phase is not preferential for activat-ing the shear band systems. Thus, the large strain in theCu crystals is not induced by shear banding but by disloca-tion slip. In other regions with relatively low true strain(below 0.6) as well as insignificant shear banding, smallrotations (less than 10�) are predicted in both phases.
5. Discussion
5.1. Lattice reorientation and micromechanics in heterophase
MMCs
According to the bicrystal simulations, it is found thatthe activation of the shear band systems is related to the

Grain rotation
Shear rate on the (^
1e -^
3e ) shear band systems
Shear stress σ13
Ag crystal(Copper orienta�on,
1( 1 1[)2 11])
Cu crystal (Cube orienta�on,
0( 0 1[)1 0 ]0 )
Ag crystal(Copper orienta�on,
1( 1 1[)2 11])
Cu crystal (Cube orienta�on,
0( 0 1[)1 0 ]0 )
‘A’
‘B’
65.0º58.5º52.0º45.5º39.0º32.5º26.0º19.5º13.0º6.5º0.0º
0-0.001 -0.003-0.005-0.006-0.008-0.010-0.012-0.013-0.014-0.016
1.36e+081.13e+089.06e+076.81e+074.56e+072.30e+074.91e+05
-2.20e+07-4.46e+07-6.71e+07-8.96e+07
Fig. 5. Predicted distributions of grain rotation angle, shear rate on the ðe1 � e3Þ shear band systems and shear stress r13 for a Cu (cube orientation, with a10� spherical Gaussian scattering about ð001Þ½100�) plus Ag (copper orientation, ð112Þ½11�1�) heterophase bicrystal at 60% thickness reductions. Whitelines indicate interfaces between the abutting crystals. Finite element mesh is only shown in the first row of results for better visibility of the distribution ofshear bands.
Cu crystal (Cube orienta�on,
0( 0 1[)1 0 ]0 )
Cu crystal
ED
TD
Ag crystal(Copper orienta�on,
1( 1 1[)2 11] )
Ag crystal(Copper orienta�on,
1( 1 1[)2 11] )
(Cube orienta�on,0( 0 1[)1 0 ]0 )
0 10 20 30 400
10
20
30
40
50
60
0.0
0.6
1.2
1.8
2.3
2.9
3.5
Grain rotation Equivalent true strain
Equivalent true strain
Points from 'A'to'B'
Gra
in ro
tatio
n(o )
Fig. 6. Predicted evolution of grain rotation angle and equivalent truestrain in a 60% deformed Cu (cube orientation, with a 10� sphericalGaussian scattering about ð001Þ½100�) plus Ag (copper orientation,ð112Þ½11�1�) bicrystal, along the line scan from “A” to “B” (as marked inFig. 5). On the line the grain rotation angle and equivalent true strain at 40evenly distributed points are evaluated. The {111} pole figures show theinitial orientation (in open circle “s”) and the orientation after deforma-tion (with the maximum rotation angle, in solid circle “d”) for each phase.Orientations of the Cu and Ag phases are represented in black and red,respectively. (For interpretation of the references to color in this figurelegend, the reader is referred to the web version of this article.)
246 N. Jia et al. / Acta Materialia 76 (2014) 238–251
actual topology of heterophase microstructures in additionto the crystallographic orientations of the grains involved.This is in accordance with the observation made in somesingle-phase metals that pre-existing anisotropic features,such as microbands or lamellar microstructures, are a nec-essary precursor to shear band formation [14,20]. More-over, shear banding plays a major role in theinhomogeneous orientation distribution within the sam-ples. To observe lattice reorientation modified by micro-structures more clearly, a simulation of a Cu (cubeorientation) plus Ag (copper orientation) bicrystal is per-formed. Under plane strain load the ideally cube-orientedfcc crystals are not susceptible to shear band formation[10,16,59]. However, if some scatter about the cube orien-tation is used as the initial texture of the crystals, shearbanding can be triggered when a high enough stress isreached. The initial texture scatter of the Cu phase isdescribed in the form of a spherical Gauss component[44,55,59] with a full width at half maximum of 10� aboutthe (001)[1 10] orientation, while the other model parame-ters are the same as those used for Cu–Ag samples pre-sented above. As the shear band systems in the cube-oriented crystal are activated at a later deformation stagecompared to the copper orientation, the predicted distribu-tion of grain rotation angle, shear rate on the ðe1 � e3Þ

N. Jia et al. / Acta Materialia 76 (2014) 238–251 247
shear band systems and shear stress r13 for the Cu (cubeorientation, with a 10� scatter) plus Ag (copper orientation,ð112Þ½11�1�)) bicrystal at 60% deformation is presented(Fig. 5). In the Ag crystals large rotations (above 50�) areobserved, while in the Cu crystals the area connected tothe localization of the Ag phase shows a lattice rotationabove 20�. Shear banding is clearly identified at the regionwith larger rotations in the respective phases. These shearbands induce severe curvature of the phase boundaries.Moreover, in both phases the area with larger stress coin-cides with the material points where shear banding initi-ates. This again causes shear bands in the upper Cucrystal to be triggered by such stress concentration nearphase boundaries. To this stage, a curved lamellar structureis predicted as a result of local plastic instability in theshear banding region. This phenomenon agrees very wellwith experimental observations reported on cold rolledCu–Ag [11,48] and Cu–Nb [20,49] composites with layeredstructures.
The lattice rotation as well as the equivalent true strainin the bicrystal along the line AB which is parallel to theND (Fig. 5) is traced, as shown in Fig. 6. In the Ag phase,larger rotations (above 10�) are seen in the region close tothe phase boundaries. At the bottom of the upper Ag crys-tal, the TD rotation reaches �55�, while at the top of thelower Ag crystal, the rotation about the TD is �30�. Theserotations lead to the formation of the ð110Þ½001� andð332Þ½11�3� orientations, respectively. By examining thedistribution of shear rate of the shear band systems, it isobvious that at this deformation stage the initial coppertexture in the Ag phase rotates about the TD towards theGoss component with significant shear induced by shearbanding. In regions with weak shear banding, the maxi-mum rotation in the Ag crystals is �10�, although a strongtrue strain localization of �3.0 is identified at those points,e.g. the second top point in the upper Ag crystal. For theCu phase, in the upper crystal showing the activation ofshear banding, a larger rotation value is observed. Theassociated rotations towards Goss occur as shown in thepole figure, i.e. the initial ð00 1Þ½110� orientation undergoesa �33� rotation about the ED//h100i axis to reach theð023Þ½100� orientation. In the lower Cu crystal where veryweak shear banding is activated, the resultant orientationcorresponds to a rotation of �10� to (014)[1 00]. There-fore, in the Cu crystals the large rotations observed aboutthe ED are associated with the occurrence of shear bands.This interpretation is also confirmed by microtexture mea-surements on a channel-die compressed Cu cube crystalshowing well-developed shear bands [60]. Hence, thebehavior of the cube oriented Cu crystal can be describedin the following way. When the thickness reduction islow (below 60%), shear banding is only activated in theAg phase and no shear banding occurs in the Cu phase.The activation of the shear band systems in the Ag phaseenables the lattice to be rotated about the TD anti-clock-wise, which also imposes a TD rotation on the upper Cucrystal embedded between the Ag crystals. That is to say,
the TD rotation in the Cu phase originates from a rigid-body rotation induced by the abutting Ag crystals; there-fore, its value would also be small (below 10�). Withincreasing deformation, shear banding is triggered in theCu phase at the material points adjacent to the already-activated bands in the Ag phase. More specifically, shearbands “seem” to run across the phase boundaries andextend into the Cu crystals. This leads to the reorientationof the shear banding region in the Cu phase. At the sametime, the second shear band that is roughly symmetric tothe firstly formed band rotated about the ND appears inthe Ag phase, causing the strain localized region in bothphases to rotate clockwise about TD. These rotations,together with the rotation occurring at small strains, con-tribute to the significant rotation angle of the upper Cucrystal (above 20�) and the inclined grain boundaries, asshown in Fig. 5.
It is well known that cube-oriented crystals in fcc metalsare metastable during near-plane strain deformation,depending on the exact boundary conditions imposed dur-ing loading [10,16,57,61]. There are four slip system withmaximum orientation factor for the cube orientation, i.e.ð111Þ½1 0�1�, ð�1�11Þ½�10�1�, ð�11 1Þ½�10�1� and ð1�11Þ½1 0�1�.According to the current simulation, when the thicknessreduction is below �40% (0.51 true strain), in the Cu phaseonly dislocation slip occurs. At higher deformations, ourprediction clearly demonstrates the formation of shearbanding in the Cu phase, while the above-mentioned slipsystems become less active in the shear bands. Due to anincrease of the Schmid factor on the reoriented {111}plane, two new slip systems (ð�1�11Þ½�110� and ð�111Þ½1 10�)are activated in the shear banding region. These newly acti-vated slip systems lead to the predominant rotation aboutthe ED and accordingly the cube texture is rotated towardsthe Goss position. This case has been experimentally veri-fied by an investigation on the evolution of rolling texturesin fcc metals with initial cube texture [62], and explicitlystated as a correlation to the formation of microshearbands [60]. Finally, note that in this simulation, the hetero-phase boundaries experience severe curvature and thelattice rotation is strongly affected by the shear bandingbehavior of the constitutive phases, as also predicted forother bicrystals (Fig. 3), indicating the ubiquitous natureof the phenomenon.
5.2. Texture evolution with shear banding
As revealed by experiments for the same type of Cu–Agcomposite as studied in this work, after rolling to variousthickness reductions the Cu and Ag phases develop similartextures, i.e. less copper-type and instead more brass-typecomponents [26]. Moreover, a similar texture evolutionshowing a low volume fraction of the copper and S compo-nents is also observed in the Cu phase of the Cu–Nb com-posite [20]. These results are not a priori expected becausein single-phase Cu under the same rolling conditions, thecopper-type rather than the brass-type textures have been

Thickness reduction: 75% Thickness reduction: 89%
Maximum intensity: 8.83
Twin volume fraction: 2.0%
Maximum intensity: 12.01
Twin volume fraction: 2.65%
Maximum intensity: 7.30
Twin volume fraction: 11.86%
Maximum intensity: 9.04
Twin volume fraction: 14.23%
Maximum intensity: 5.40
Twin volume fraction: 0.12%
Maximum intensity: 6.48
Twin volume fraction: 0.18%
Maximum intensity: 2.54 Maximum intensity: 2.16
EDED
TDTD
Fig. 7. Polycrystal model predicted and experimental {111} pole figures of the Cu phase in Cu–68.3 vol.% Ag composite at different thickness reductions.The experimental data is obtained from Ref. [26]. (d) Copper orientation ({112}h111i), (j) Goss orientation ({011}h100i), (N) brass orientation({011}h211i).
248 N. Jia et al. / Acta Materialia 76 (2014) 238–251
reported to be typically developed [2,4,54]. Thus, the exper-imental measurements conducted on composites indicatethat the existence of the abutting phase or the interfacebetween phases plays an important role in the texture
development of the Cu phase within composite materials.However, this feature is not captured by the polycrystallinemodel presented above. Considering the characteristic tex-ture evolution in the Cu–Ag composite as obtained by

a b
0 30 60 900
2
4
6
8
10
12
14
f(g)
ϕ1 (ο)
{011} <211>
{011} <111>
{011} <011>
{011} <100>
45 60 75 904
8
12
16
20
ϕ2 (ο)
f(g)
{123} <634>
{011} <211>
{112} <111>
GPa0. 211ˆ1.0 01 s ,
GPa0. 481ˆ2.0 01 s ,
GPa0. 481ˆ1.0 01 s ,
sb41 1
0
sb51 1
0
sb41 1
0
=× =
=× =
=× =
−
−
−
τττ
NNN
&
&
&
Fig. 8. Polycrystal model predicted texture evolution of the Cu phase in Cu–68.3 vol.% Ag composite at 89% thickness reduction in (a) a and (b) b fiberrepresentation.
N. Jia et al. / Acta Materialia 76 (2014) 238–251 249
experiments, two main analyses apply: (1) the Cu phasedeforms via similar relative contributions of dislocationslip and twinning as the Ag phase. In the Cu phase twin-ning would also contribute to the formation of brass-typetextures. However, some prior studies place this idea inquestion, because in either cold rolled Cu–Ag or Cu–Nbcomposites with a starting layer thickness in the sub-micron regime [26,63] mechanical twinning is not identifiedas an important deformation mechanism in the Cu phase,at least not at modest strains such as imposed here. (2)For fcc materials, at large deformations non-crystallo-graphic deformation in the form of shear banding can beinitiated by a mechanical instability that contains band-likedislocation cells in high-SFE metals [18,64] or twin-matrixlamellae in low-SFE metals [1,2,8,9]. In both cases, shearbanding leads to a weaker copper-type but strongerbrass-type texture. This would mean that in the Cu phaseof the studied Cu–Ag composite more shear banding maybe activated compared to pure Cu. On the other hand, amore detailed analysis of the orientation distributions ina variety of bicrystal samples reveals that lattice rotationin the Cu phase is significantly influenced by the interfacebetween the abutting phases. To accommodate deforma-tion between hetero-phases, pronounced shear bands aretriggered by stress concentration at the interfaces, i.e. phaseboundaries. This leads to highly localized strains and lat-tice reorientations within the bands. According to thebicrystal simulations, in the Cu–Ag samples the �55� rota-tion of the copper-oriented Cu crystal coincides with theactivation of the shear band systems and leads to a texturecomponent close to the Goss orientation. Concerning theset-up of the polycrystal and the bicrystal models, in bothcases only one single phase and one orientation areassigned to the respective integration points. Therefore,the different micromechanisms as revealed by the differenttexture evolutions between the different modeling methods
occur primarily because in the former case the phases arerandomly arranged within the polycrystal, whereas in thelatter case they are mutually stacked to model the lamellarstructure typically found in real Cu–Ag composites [48,49].Moreover, using the Taylor assumption the polycrystallinesimulations do not exactly mimic the strong boundaryconstrains of individual crystals as that imposed by thebicrystal model. These dissimilarities lead to the minorshear banding activity triggered from the presence of het-erophase interfaces when implementing polycrystallinemodeling.
To demonstrate the shear banding effect on texturedevelopment in the Cu phase of the Cu–Ag composite, wereduce the activation stress for shear banding (ssb) of Cufrom 0.184 GPa down to 0.112 GPa in the polycrystal sim-ulation. Fig. 7 shows {111} pole figures of the Cu phase at75% and 89% rolling reductions predicted by the differentsimulations. For comparison, the modeling using anincreased initial nucleation rate for twinning ( _N 0) [16] aswell as the experimental results [26] are also presented. Atcorresponding deformation stages the predicted twin vol-ume fractions in the Cu phase are given. Comparing thesimulations with different threshold stress for shear band-ing, it is seen that at 75% deformation an easier activationof the shear band systems (ssb = 0.112 GPa) leads to a sup-pression of the development of the copper component, andwith increasing deformation this suppression becomes morepronounced. In addition, stronger brass-type textures arepredicted when using a 0.112 GPa activation stress, as seenfrom the a and b fibers at 89% deformation in Fig. 8. Whenan initial twin nucleation rate of 2.0 � 1015 s�1 is used, thesimulation predicts the suppression of the texture evolutiontowards the copper component and a strengthening of thebrass-type texture. This means that the textures are influ-enced by an increase of the twin volume fraction to anextent of �11%. However, compared to the simulation

250 N. Jia et al. / Acta Materialia 76 (2014) 238–251
using 0.112 GPa activation stress for shear banding themodel with higher twin nucleation rate ( _N 0 = 2.0 � 1015 s�1) shows a weaker suppression of the copper component,although in the former case only very weak deformationtwinning occurs. Therefore, the prediction incorporatingmore non-crystallographic shear contributions reproducesexperimental textures of the composite better.
In fact, the texture development in plane strain deformedlamellar composites is a clear example of the effect of the co-deformation mechanisms on texture evolution in hetero-phase microstructures. In this work, lattice rotations in aCu–Ag composite are studied by performing a series of sim-ulations for bicrystal configurations with specific/ideal crys-tallographic orientation combinations. Simulations of thetexture evolution in polycrystalline composites withoutconsidering the initial heterophase microstructures are alsopresented for comparison. Although gross simplifications interms of capturing initial microstructures (crystal morphol-ogy and crystal orientation) and setting boundary condi-tions have been made in the current bicrystal simulations,the localized stress and strain distributions as well as theco-deformation mechanisms within heterophase micro-structures have been revealed. One of the important find-ings is that for each individual crystal, the actual presenceof abutting crystals of another phase influences its shearbanding behavior and thus leads to the texture transitionof the crystal affected from the copper-type to the brass-type. For accurately predicting textures of bulk compositematerials under loading, the accurate initial microstructuresshould be incorporated in the models. Besides, an in-depthinvestigation that includes deformation mechanisms occur-ring within realistic microstructure topologies is required.For instance, for modeling nanoscale multilayer compositesin which heterophase interfaces confine slip to crystallo-graphic planes closely aligned with the interface planes,the numerical model should also account for the effects ofconfined layer slip and dislocation transmission acrossinterfaces [12,64–66] on the texture evolution. Experimentalinvestigations and simulations at the atomic scale [67–69]are essential for elucidating the structures of heterophaseinterfaces and the localized stress and strain fields whenunder load, thus guiding and informing the developmentof an advanced mesoscopic model for predicting texturesand more complex microstructures. However, these arebeyond the scope of the current paper.
6. Conclusions
We have presented crystal plasticity finite element simu-lations of the texture evolution in plane strain compressedCu–Ag polycrystalline MMC. Comparisons of the simu-lated and experimental textures were conducted and quan-titatively evaluated. Simulations based on bicrystal modelsconsidering characteristic initial heterophase microstruc-tures of the composite were performed in order to reveallattice rotations, shear banding behavior and the underly-ing micromechanics. The main results are as follows:
� Using the polycrystal model, the Goss, brass, copperand S texture components are predicted in both phasesof the composite at 50% thickness reduction. With fur-ther deformation, the copper and S components signifi-cantly increase in the Cu phase and the resultanttextures are of the copper-type. This result deviates fromexperimental measurements that reveal brass-type tex-tures in the composite at 75% and higher deformations.In the Ag phase, significant development of the brassand Goss components is predicted, which matchesexperimental measurements.� The bicrystal simulations reveal that significant non-
crystallographic shear banding occurs in the fcc crystals,depending on the specific initial orientations. In the Cu–Ag composite, for crystals initially oriented with copperof either phase, the �55� rotation about the h110i axiscoincides with the activation of shear banding and theresultant texture is close to the Goss component. Onthe other hand, less rotation (below 10�) occurs whenthe plane strain deformation is mainly assisted by dislo-cation slip and twinning.� The bicrystal simulations reproduce the experimentally
observed trends of texture evolution in the respectivephases of the Cu–Ag composite. This indicates thatthe localized stress and strain fields as well as the co-deformation mechanisms within the actual heterophasemicrostructures are well captured by the bicrystal mod-eling. To accommodate deformation between adjacentphases in the bicrystal samples, pronounced shear bandsare triggered by stress concentration at phase bound-aries. These bands penetrate through the phase bound-aries with deformation, leading to the highly localizedstrain and promoting lattice reorientations in the neigh-bor phase. The initial orientation of each individualcrystal and mechanical properties of the abutting crys-tals are the most important factors in affecting shearband development and the associated texture evolution.� We thus conclude that the main deformation mechanism
in heterophase MMCs is different from that in single-phase metals. Also the texture evolution in compositematerials is strongly influenced by the local constraintsexerted from the immediate presence of hetero-inter-faces and the abutting phases. By incorporating morenon-crystallographic shear contributions in an individ-ual phase of the composite, polycrystalline simulationscapture the experimental textures. This suggests thatfor modeling deformation textures in heterophasemicrostructures, the localized stress and strain fields thatexhibit a strong influence on the shear banding behaviorhave to be precisely predicted.
Acknowledgements
We gratefully acknowledge the financial support of theNational Natural Science Foundation of China (GrantNo. 51101030), the Fundamental Research Funds for the

N. Jia et al. / Acta Materialia 76 (2014) 238–251 251
Central Universities (N130510001) and the Program forNew Century Excellent Talents in University (NCET-13-0104). The authors are also grateful to the kind supportof the Alexander von Humboldt Stiftung (AvH, Alexandervon Humboldt Foundation, www.humboldtfoundation.de)for N.J.
References
[1] Duggan BJ, Hatherly M, Hutchinson WB, Wakefield PT. Metal Sci1978;12:343.
[2] Hirsch J, Lucke K. Acta Metall 1988;36:2863.[3] Ushioda K, Hutchinson WB. ISIJ Int 1989;29:862.[4] Donadille C, Valle R, Dervin P, Penelle R. Acta Metall 1989;37:1547.[5] Wagner P, Engler O, Lucke K. Textures Microstruct 1991;14:927.[6] Tvergaard V, Needleman A. Proc R Soc London A 1993;443:547.[7] Paul H, Driver JH, Maurice C, Jasienski Z. Mater Sci Eng A
2003;359:178.[8] Paul H, Morawiec A, Bouzy E, Fundenberger JJ, Pia A. Metall Mater
Trans A 2004;35:3775.[9] Paul H, Driver J, Maurice C, Piatkowski A. Acta Mater 2007;55:575.
[10] Kuroda M, Tvergaard V. Int J Plast 2007;23:244.[11] Davy CA, Han K, Kalu PN, Bole ST. IEEE Trans Appl Supercond
2008;18:560.[12] Li YP, Tan J, Zhang GP. Scr Mater 2008;59:1226.[13] Xiao GH, Tao NR, Lu K. Scr Mater 2008;59:975.[14] Paul H, Morawiec A, Driver JH, Bouzy E. Int J Plast 2009;25:1588.[15] Hong CS, Tao NR, Huang X, Lu K. Acta Mater 2010;58:3103.[16] Jia N, Roters F, Eisenlohr P, Kords C, Raabe D. Acta Mater
2012;60:1099.[17] Govindaraj NV, Frydendahl JG, Holmedal B. Mater Des
2013;52:905.[18] Duckham A, Knutsen RD, Engler O. Acta Mater 2001;49:2739.[19] Nguyen-Minh T, Sidor JJ, Petrov RH, Kestens LAI. Scr Mater
2012;67:935.[20] Raabe D, Ball J, Gottstein G. Scr Metall Mater 1992;27:211.[21] Bolmaro RE, Browning RV, Guerra FM, Rollett AD. Mater Sci Eng
A 1994;175:113.[22] Mecking H, Seeger J, Hartig C, Frommeyer G. Mater Sci Forum
1994;157–162:813.[23] Akdut N, Foct J. Scr Metall Mater 1995;32:103.[24] Anderson PM, Bingert JF, Misra A, Hirth JP. Acta Mater
2003;51:6059.[25] Belyakov A, Kimura Y, Tsuzaki K. Acta Mater 2006;54:2521–32.[26] Beyerlein IJ, Mara NA, Bhattacharyya D, Alexander DJ, Necker CT.
Int J Plast 2011;27:121.[27] Carpenter JS, Vogel SC, LeDonne JE, Hammon DL, Beyerlein IJ,
Mara NA. Acta Mater 2012;60:1576.[28] Lee SB, LeDonne JE, Lim SCV, Beyerlein IJ, Rollett AD. Acta Mater
2012;60:1747.[29] Kalidindi SR, Bronkhorst CA, Anand L. J Mech Phys Solids
1992;40:537.
[30] Bronkhorst CA, Kalidindi SR, Anand L. Philos Trans R Soc LondonA 1992;341:443.
[31] Beaudoin AJ, Dawson PR, Mathur KK, Kocks UF, Korzekwa DA.Comput Methods Appl Mech Eng 1994;117:49.
[32] Becker R, Panchanadeeswaran S. Acta Metall Mater 1995;43:2701.[33] Clausen B, Lorentzen T, Leffers T. Acta Mater 1998;46:3087.[34] Dawson PR, Marin EB. Adv Appl Mech 1998;34:77.[35] Kalidindi SR. J Mech Phys Solids 1998;46:267.[36] Staroselsky A, Anand L. J Mech Phys Solids 1998;46:671.[37] Myagchilov S, Dawson PR. Modell Simul Mater Sci Eng 1999;7:975.[38] Kalidindi SR. J Int Plast 2001;17:837.[39] Raabe D, Mattissen D. Acta Mater 1998;46:5973.[40] Mattissen D, Raabe D, Heringhaus F. Acta Mater 1999;47:1627.[41] Raabe D, Miyake K, Takahara H. Mater Sci Eng A 2000;291:186.[42] Jia N, Lin Peng R, Wang YD, Johansson S, Liaw PK. Acta Mater
2008;56:782.[43] Hartig C, Mecking H. Comput Mater Sci 2005;32:370.[44] Roters F, Eisenlohr P, Hantcherli L, Tjahjanto DD, Bieler TR, Raabe
D. Acta Mater 2010;58:1152.[45] Anand L, Su C. J Mech Phys Solids 2005;53:1362.[46] Wang YM, Chen MW, Zhou FH, Ma E. Nature 2002;419:912.[47] Kuhlmann-Wilsdorf D, Wilsdorf H. Acta Metall 1953;1:394.[48] Ohsaki S, Kato S, Tsuji N, Ohkubo T, Hono K. Acta Mater
2007;55:2885.[49] Raabe D, Heringhaus F, Hangen U, Gottstein G. Z Metallkd
1995;86:405.[50] Wagner P, Engler O, Lucke K. Acta Metall Mater 1995;43:3799.[51] Raabe D. Acta Metall Mater 1995;43:1023.[52] Raabe D. Acta Mater 1997;45:1137.[53] Dillamore IL, Roberts WT. Acta Metall 1964;12:281.[54] Kocks UF, Tome CN, Wenk HR. Texture and Anisotropy. Cam-
bridge: Cambridge University Press; 1998.[55] Raabe D, Roters F. Int J Plast 2004;20:339.[56] Hebert RJ, Perepezko JH. Scr Mater 2004;50:807.[57] Jia N, Eisenlohr P, Roters F, Raabe D, Zhao X. Acta Mater
2012;60:3415.[58] Jia N, Roters F, Eisenlohr P, Raabe D, Zhao X. Acta Mater
2013;61:4591.[59] Raabe D, Zhao Z, Roters F. Scr Mater 2004;50:1085.[60] Basson F, Driver JH. Acta Mater 2000;48:2101.[61] Holscher M, Raabe D, Lucke K. Acta Metall 1994;42:879.[62] Mao W. Chin J Met Sci Technol 1990;6:325.[63] Misra A, Hirth JP, Hoagland RG, Embury JD, Kung H. Acta Mater
2004;52:2387.[64] Quadir MZ, Ferry M, Al-Buhamad O, Munroe PR. Acta Mater
2009;57:29.[65] Misra A, Hirth JP, Hoagland. Acta Mater 2005;53:4817.[66] Li YP, Zhang GP. Acta Mater 2010;58:3877.[67] Han WZ, Carpenter JS, Wang J, Beyerlein IJ, Mara NA. Appl Phys
Lett 2012;100:011911.[68] Wang J, Misra A, Hoagland RG, Hirth JP. Acta Mater 2012;60:1503.[69] Yan JW, Zhu XF, Yang B, Zhang GP. Phys Rev Lett
2013;110:155502.