In-plane and through-thickness properties, failure modes, damage and delamination in 3D woven carbon...
15
In-plane and through-thickness properties, failure modes, damage and delamination in 3D woven carbon fibre composites subjected to impact loading Robert Gerlach ⇑ , Clive R. Siviour, Jens Wiegand, Nik Petrinic University of Oxford, Department of Engineering Science, Parks Road, Oxford OX1 3PJ, United Kingdom article info Article history: Received 30 August 2011 Received in revised form 23 November 2011 Accepted 27 November 2011 Available online 3 December 2011 Keywords: A. Textile composites B. Fracture C. Multiscale modelling B. Matrix cracking Strain rate abstract Two noncrimp 3D woven carbon fibre composites (through thickness angle interlock) of binder volume fractions 3% and 6% were characterised for their response to applied deformation. Experiments were per- formed at quasi static, medium and high strain rates under a large variety of load cases (tension in warp/ weft direction, interlaminar/intralaminar shear, through thickness tension/compression, 3-point bending and plate bending). During the study, novel experimental methods were developed in order to address several challenges specific to 3D composite materials. The results show that, while the different binder volume fractions of 3% and 6% have only a small effect on the in-plane stiffness (warp and weft direction), its effect on the delamination resistance in plate bending experiments is considerable. This is a very important result for the use of these materials in the future. The availability, in previous publications, of complementary data for the matrix and the interface between matrix pockets and fibre bundles makes the comprehensive data set a generically useful reference for hierarchical numerical modelling strategies. Ó 2011 Elsevier Ltd. All rights reserved. 1. Introduction 3D fibre reinforced polymers (3DFRP), such as 3D weaves, offer several significant advantages over traditional in-plane fibre rein- forced composites. Most importantly, their 3D reinforcement re- sults in excellent delamination resistance and thus very good response to impact loading [1–5]. Furthermore, 3D weavings exhi- bit much higher permeability than stacked 2D preforms, resulting in increased matrix infusion rates, which allows a reduction of infusion time during manufacture or use of higher viscosity (e.g. toughened) matrix materials [6]. In addition, 3D weavings exhibit near net shape capabilities: complex preforms close to the shape of the final part can be produced [7–9]. These characteristics allow 3D weavings to be used in applications for which traditional lam- inates and 2D composites are not suited, whilst at the same time offering additional economic benefits. Despite these advantages, 3D weavings have so far failed to achieve widespread application, which is mainly related to the dif- ficulty of analytically or numerically predicting their complex mechanical behaviour. This, in turn, is a consequence of their struc- tural complexity, the large number of different available weave architectures [10], and the numerous possibilities for combining different fibre and matrix systems. The resulting theoretically indefinite number of essentially different 3D weaving materials is generally concluded to require a hierarchical modelling approach, relating the material response of the constituents to the global re- sponse of the composite [6,11–25]. Therefore, experimental data for both the 3D composite, its constituents (matrix, fibre, inter- faces) as well as information about the architecture of the weave are required in order to advance the development of generic numerical modelling capabilities for 3D weaves, and consequently, allow for a wider application of these promising materials. Unfortunately, available experimental data for 3D composites are very rare; particularly in the case of carbon fibre reinforced polymer (CFRP) 3D weaves. It is especially challenging to develop data sets that are of sufficient comprehensiveness to serve as refer- ence for constitutive model development. This is due to (i) the full anisotropy of 3D weaves, requiring characterisation in all six nor- mal and shear directions, (ii) their complex failure and damage behaviour, (iii) the difficulty in experimentally characterising the out of plane properties and (iv) the requirement for complementary experimental data of the 3D weave constituents matrix and fibre. The majority of experimental data addressing intrinsic material properties of 3D CFRP weaves deals with tension [1,3,5,26–28] and/or compression [23,29–31] for in-plane loading (warp and weft directions) only. This is because of the previously mentioned difficulty to address the out of plane material properties experi- mentally, especially as no generally accepted methods are avail- able. However, a data set addressing only in plane properties is of questionable use in case of 3D weaves, as these composites were designed to improve the out of plane properties of 2D composite materials. Therefore, the experimental characterisation of the out of plane properties of 3D weaves is of particular importance. 0266-3538/$ - see front matter Ó 2011 Elsevier Ltd. All rights reserved. doi:10.1016/j.compscitech.2011.11.032 ⇑ Corresponding author. Tel.: +44 1865 283475; fax: +44 1865 273906. E-mail address: [email protected] (R. Gerlach). Composites Science and Technology 72 (2012) 397–411 Contents lists available at SciVerse ScienceDirect Composites Science and Technology journal homepage: www.elsevier.com/locate/compscitech
-
Upload
independent -
Category
Documents
-
view
3 -
download
0
Transcript of In-plane and through-thickness properties, failure modes, damage and delamination in 3D woven carbon...

In-plane and through-thickness properties, failure modes, damage and
delamination in 3D woven carbon fibre composites subjected to impact loading
Robert Gerlach ⇑, Clive R. Siviour, Jens Wiegand, Nik Petrinic
University of Oxford, Department of Engineering Science, Parks Road, Oxford OX1 3PJ, United Kingdom
a r t i c l e i n f o
Article history:
Received 30 August 2011
Received in revised form 23 November 2011
Accepted 27 November 2011
Available online 3 December 2011
Keywords:
A. Textile composites
B. Fracture
C. Multiscale modelling
B. Matrix cracking
Strain rate
a b s t r a c t
Two noncrimp 3D woven carbon fibre composites (through thickness angle interlock) of binder volume
fractions 3% and 6% were characterised for their response to applied deformation. Experiments were per-
formed at quasi static, medium and high strain rates under a large variety of load cases (tension in warp/
weft direction, interlaminar/intralaminar shear, through thickness tension/compression, 3-point bending
and plate bending). During the study, novel experimental methods were developed in order to address
several challenges specific to 3D composite materials. The results show that, while the different binder
volume fractions of 3% and 6% have only a small effect on the in-plane stiffness (warp and weft direction),
its effect on the delamination resistance in plate bending experiments is considerable. This is a very
important result for the use of these materials in the future. The availability, in previous publications,
of complementary data for the matrix and the interface between matrix pockets and fibre bundles makes
the comprehensive data set a generically useful reference for hierarchical numerical modelling strategies.
Ó 2011 Elsevier Ltd. All rights reserved.
1. Introduction
3D fibre reinforced polymers (3DFRP), such as 3D weaves, offer
several significant advantages over traditional in-plane fibre rein-
forced composites. Most importantly, their 3D reinforcement re-
sults in excellent delamination resistance and thus very good
response to impact loading [1–5]. Furthermore, 3D weavings exhi-
bit much higher permeability than stacked 2D preforms, resulting
in increased matrix infusion rates, which allows a reduction of
infusion time during manufacture or use of higher viscosity (e.g.
toughened) matrix materials [6]. In addition, 3D weavings exhibit
near net shape capabilities: complex preforms close to the shape
of the final part can be produced [7–9]. These characteristics allow
3D weavings to be used in applications for which traditional lam-
inates and 2D composites are not suited, whilst at the same time
offering additional economic benefits.
Despite these advantages, 3D weavings have so far failed to
achieve widespread application, which is mainly related to the dif-
ficulty of analytically or numerically predicting their complex
mechanical behaviour. This, in turn, is a consequence of their struc-
tural complexity, the large number of different available weave
architectures [10], and the numerous possibilities for combining
different fibre and matrix systems. The resulting theoretically
indefinite number of essentially different 3D weaving materials is
generally concluded to require a hierarchical modelling approach,
relating the material response of the constituents to the global re-
sponse of the composite [6,11–25]. Therefore, experimental data
for both the 3D composite, its constituents (matrix, fibre, inter-
faces) as well as information about the architecture of the weave
are required in order to advance the development of generic
numerical modelling capabilities for 3D weaves, and consequently,
allow for a wider application of these promising materials.
Unfortunately, available experimental data for 3D composites
are very rare; particularly in the case of carbon fibre reinforced
polymer (CFRP) 3D weaves. It is especially challenging to develop
data sets that are of sufficient comprehensiveness to serve as refer-
ence for constitutive model development. This is due to (i) the full
anisotropy of 3D weaves, requiring characterisation in all six nor-
mal and shear directions, (ii) their complex failure and damage
behaviour, (iii) the difficulty in experimentally characterising the
out of plane properties and (iv) the requirement for complementary
experimental data of the 3D weave constituents matrix and fibre.
The majority of experimental data addressing intrinsic material
properties of 3D CFRP weaves deals with tension [1,3,5,26–28]
and/or compression [23,29–31] for in-plane loading (warp and
weft directions) only. This is because of the previously mentioned
difficulty to address the out of plane material properties experi-
mentally, especially as no generally accepted methods are avail-
able. However, a data set addressing only in plane properties is
of questionable use in case of 3D weaves, as these composites were
designed to improve the out of plane properties of 2D composite
materials. Therefore, the experimental characterisation of the out
of plane properties of 3D weaves is of particular importance.
0266-3538/$ - see front matter Ó 2011 Elsevier Ltd. All rights reserved.
doi:10.1016/j.compscitech.2011.11.032
⇑ Corresponding author. Tel.: +44 1865 283475; fax: +44 1865 273906.
E-mail address: [email protected] (R. Gerlach).
Composites Science and Technology 72 (2012) 397–411
Contents lists available at SciVerse ScienceDirect
Composites Science and Technology
journal homepage: www.elsevier .com/ locate/compsci tech

So far, very few experimental data addressing interlaminar
shear are available [32,33]. The methods currently used often rely
on a sharp cutting edge to ‘punch’ through the 3D composite. It is
questionable whether this method produces local stress states rep-
resentative for a pure interlaminar shear load. No literature data
for through thickness tension were found.
Furthermore, the data available in the literature are limited to
the quasi static regime, and no publications investigating the high
strain rate behaviour of 3D CFRP weaves could be found. However,
as 3D weaves are designed to improve impact resistance, their
high-strain rate properties are of particular importance. The strain
rate dependent failure and damage behaviour 3D CFRP weaves is
still not well understood, especially regarding the effect of the
3D reinforcement (called binder in 3D weaves) on both strength
and damage propagation.
While data for material characterisation are scarce, even fewer
data from validation experiments, such as short beam [4,27,30,34]
and plate bending experiments [34–36] are available.
Finally, most of the published data concentrates on orthogonal
and layer to layer angle interlock weave architectures only. The
CFRP 3D weaves that have been investigated usually have high
crimp induced by the through thickness reinforcement, and are
therefore unsuitable for applications requiring high in-plane
strength and stiffness. 3D weaves with less binder volume content,
and therefore reduced crimp, are more interesting for many aero-
space applications, where high in plane strength and stiffness are
equally as important as impact resistance.
This paper addresses the important challenges and needs out-
lined so far by experimentally characterising two ‘noncrimp’
through-thickness angle-interlock architecture (TTAIL) 3D weaves,
with 3D reinforcement specifically designed to maintain high in-
plane properties. Experiments have been performed at quasi-static
(�10ÿ3 sÿ1), high (�103 sÿ1) and in specific cases medium rates
(�101 sÿ1) of strain. In order to obtain a large set of material data,
a number of different load cases were investigated. Tensile loading
was applied in x (warp) and y (weft) direction, comparing the effect
of the binder volume fraction on in-plane properties. Shear loading
was applied in plane as well as in both interlaminar shear direc-
tions (xz and yz), addressing the effect of binder volume content
on damage initiation and evolution. In addition, compression
experiments in the through thickness direction were performed,
and a novel experimental method to investigate the tensile out
of plane properties was developed. These experiments provide
intrinsic material properties and generate information about local
failure and damage mechanisms as well as material nonlinearity
and strain rate dependency. In order to further quantify the influ-
ence of the binder on delamination resistance, to characterise the
delamination behaviour and to provide validation experiments
for constitutive modelling approaches, beam- and plate-bending
experiments were performed at quasi-static and impact speeds. Fi-
nally, conclusions and recommendations for numerical modelling
strategies are presented.
It is important to note that the work reported here is related to
previous experimental characterisations of the matrix material
[37] and the interface between matrix pockets and fibre bundles
[38] of the same constituent materials used for the TTAIL reported
here. In conjunction with detailed information about the weave
architecture (see Section 1.1) of the characterised TTAIL and avail-
able manufacturing data for the fibres, the data set reported here
represents a comprehensive experimental database of generic use-
fulness for a variety of hierarchical modelling strategies.
1.1. Parent material
The selected TTAIL weaves were especially designed to mini-
mise crimp and increase in-plane strength and stiffness. The two
different TTAIL versions investigated here exhibit a comparably
low binder volume fraction (3% and 6% respectively), and are
otherwise identical. Idealised (regular) dimensions needed for
modelling purposes are shown in Fig. 1 (6% binder version), and
were obtained as an average of micrographs taken from slices ex-
tracted from different positions of the TTAIL (Figs. 2–4).
All warp and weft stuffers consist of Tenax HTS carbon rovings
while the binder consists of Tenax HTA carbon fibre rovings. The
warp stuffers are made up of two combined 12 k rovings (24 k in
total), yielding an average warp fibre volume fraction (fvf) of
64.4% (using the dimensions listed in Fig. 1). The weft stuffers con-
sist of a single 12 k roving, with an average fvf of 63.6%. For the 3%
binder version of the weave, the binder consists of a single 6 k rov-
ing, while the 6% binder version uses two 6 k rovings. The overall
fvf of the 3D weave is 51% for the 6% version and 49% for the 3%
version.
The TTAIL weaves were obtained as unconsolidated fabrics, and
infiltrated with RTM-6 resin using VARTM technology. The pres-
sure used was one bar, the resin temperature at infiltration 80 °C
and the tool temperature 120 °C. The cure cycle used was
2 °C minÿ1 heating to 130 °C, 1 h dwell at 130 °C, 1 °C minÿ1 heat-
ing to 180 °C and finally 2 h cure at 180 °C. Ultrasound scans were
performed for each panel in order to check for cavities. Due to the
good permeability of the fabric and the excellent flow characteris-
tics of RTM-6, the achieved infiltration was very good.
Generally, the crimp of the stuffers is low, while the weft stuff-
ers show higher distortion than the warp stuffers, as shown in
Fig. 3. This results from the fact that the warp stuffers are kept in
tension during the weaving process. The matrix pockets are of con-
siderable size, while the yarns depict a sharp transition from areas
of high fvf to pure matrix pocket (Fig. 2C). The stuffer cross sections
are of ellipsoidal shape (Figs. 3 and 2B), except at the top and bot-
tom surface of the TTAIL panel, where the binder deforms the sur-
face weft yarns (Figs. 3 and 2A). The binder path is relatively
irregular, in contrast to the idealised path shown in Fig. 1. The dif-
ferences between the weave types are shown in Fig. 4. It can be
seen that the binder is less curved for the 3% version of the weave
and that the binder for the 6% weave completely fills the pocket.
This implies that the 6% material represents the maximum amount
of binder that could be used without introducing significant distor-
tion in the stuffers.
Utilising the yarn dimensions extracted from the micrographs
(Fig. 1), the average fibre volume fractions (fvf) in the respective
yarn systems can be estimated utilising the yarn cross section area
Fig. 1. Idealised geometry showing terminology and geometry of the TTAIL.
398 R. Gerlach et al. / Composites Science and Technology 72 (2012) 397–411

and the cross section area and number of the fibres contained in
the respective yarn. For the warp stuffers, the average warp fvf is
64.4%, for the weft stuffers it is 63.6% and for the binder it is
66.3%. The overall fvf of the 3D weave is 51.1% for the 6% version
and 49.1% for the 3% version. It should be noted that these values
are approximations only, as they are calculated using a single
representative cross section slice of the 3D weaves. Due to the sta-
tistical variability within the weave architecture, an average over
several cross section slices is likely to yield more representative
values [39].
1.2. 3D composites: specific experimental challenges
There are a number of challenges involved in testing composite
materials across different strain rates, particularly in the case of 3D
composites.
1.2.1. Specimen size
When performing comparisons across strain rates, it is prefera-
ble to use identical specimen sizes at all rates. However, high strain
rate experiments require short specimens so that mechanical equi-
librium can be achieved before significant strain has been imposed.
It is, therefore, required to use specimen dimensions much smaller
than those typically employed in quasi static experiments. Due to
size effects and the variability of the TTAIL architecture (Fig. 3), a
certain amount of experimental scatter is therefore unavoidable.
In order to address this challenge, all specimens were designed
to minimise scatter, as described in Section 2.
1.2.2. Testing out of plane properties
Although the main purpose of 3D reinforcement is to increase
interlaminar properties, few experimental data and methods suit-
able to address the through thickness response are available. The
difficulty of developing appropriate tests arises from the fact that
composite preforms are manufactured as comparably thin plates,
and resulting specimens are of very small dimensions in the
through thickness direction. Increasing the thickness of the com-
posite preform is generally unfeasible, since 3-D fabric preforms
are usually limited in thickness and the quality of composite de-
creases as the thickness of the fabric increases. Therefore, the
development of appropriate out of plane test methods was a major
focus of this work, and is presented in Sections 2.3 and 2.5.
1.2.3. Comparability of results
Any comparison of experimental results obtained with work on
3D weaves by other authors is very difficult since the studied
weave architectures and constituents, although similar in some
cases, are not the same. Comparisons will therefore only be per-
formed in a qualitative manner.
1.3. Loading devices
Experiments were performed in three strain/loading rate re-
gimes: Quasi-static (3–5 � 10-5 sÿ1 or 3–4 � 10ÿ3 mm sÿ1); Med-
ium (10 sÿ1 or 85 mm sÿ1); and High (450–6000 sÿ1 or 11 m sÿ1).
In order to examine failure and damage evolution, and to draw
Fig. 2. Optical micrographs showing the meso and microstructure of the TTAIL.
Fig. 3. Optical micrographs showing the difference in crimp between warp and
weft direction and matrix pockets.
Fig. 4. Micrographs showing the differences in architecture between the 3% and 6% version.
R. Gerlach et al. / Composites Science and Technology 72 (2012) 397–411 399

conclusions about respective failure modes and their sequence,
optical displacement measurement methods were used through-
out this work.
For quasi-static testing, a screw-driven tensile testing machine
was used. Displacement was measured using a laser extensometer
tracking white markers on the specimen surface. A digital camera
was used to examine crack propagation patterns and to correlate
failure phenomena with the corresponding points on the stress
strain curves.
For medium strain rates a hydraulic loading system was used.
The load is measured using instrumented rods calibrated against
standard load cells. A digital high speed camera is used to monitor
the gauge length displacement by utilising Digital Speckle Photog-
raphy (DSP).
The high-rate experiments were performed using the split-Hop-
kinson compression bars (SHPB, Fig. 5A and C) and tension bars
(SHTB, Fig. 5B) discussed in [40]. In order to improve the signal
quality, all high-rate tensile experiments were performed using a
pulse shaping mechanism (Fig. 5B) discussed in detail in previous
work [41].
The strain rate as well as the stresses and strains in the speci-
men are calculated using a standard analysis outlined in [42]. For
certain loading directions, further displacement measurement
was performed using ultra high speed photography. In compres-
sion, standard Hopkinson bar analysis was confirmed using DSP.
In the tensile experiments, speckles were painted onto the speci-
men surface, enabling displacement to be calculated as a function
of position (on the specimen) and time using image correlation
[43,44].
Three point bend experiments were performed under quasi-sta-
tic and impact loading. A modified direct impact split Hopkinson
bar technique was used for the impact tests. In this device, an
instrumented titanium rod (the impactor) with a wedge-shaped
tip is propelled into the centre of a beam shaped specimen, which
is supported rigidly at its two ends (Fig. 5D). The impactor is held
in low friction bearings and is initially at rest. A gas gun is used to
propel a striker into the impactor; the striker and impactor are of
the same material and dimensions, so this theoretically causes
the impactor to travel unstressed into the specimen [45].
During the experiment, the axial strains within the impactor bar
are recorded by means of four strain gauges arranged in a single
strain gauge station halfway down the bar. The same methodology
as described by [42] is applied and the force, velocity and thus dis-
placement at the tip of the impactor are obtained as functions of
time. Knowing the displacement of the impactor, and assuming a
rigid support, the deflection of the specimen is given. Furthermore,
an energy balance can be drawn and the amount of energy dissi-
pated due to inelastic deformation and fracture can be estimated.
Quasi-static plate bending experiments were performed using
the loading device described above. For the impact tests, however,
the available 9.81 mm diameter impact gun was not capable of
delivering enough impact energy to produce a sufficient amount
of damage. Furthermore, the small radius of the hemispherical
tip would result in a high dependence of the result on the location
of impact, as reported in [2]. Therefore, an impact bending gun
using a 15 mm diameter titanium rod, a 25 mm diameter hemi-
spherical tip and a 50 mm diameter support was used.
1.4. Damage characterisation
In order to assess the extent and type of observed damage, a
number of different technologies were applied. An air coupled
Ultrasound System (resolution 1 mm) was used in order to assess
the panel quality prior to specimen manufacture and the plate-
bending specimens before and after testing in order to investigate
the progression of impact related damage. X-ray tomography
(using an X-Tek XlT system) was applied in order to acquire infor-
mation about damage propagation. Due to the small density differ-
ence between carbon fibres and matrix, however, the quality of the
XlT scans is relatively low. Therefore, a 3D microscopy system
(Alicona Infinite Focus, 5� magnification) was used to characterise
damaged specimen surfaces. Its operating principle combines the
small depth of focus of an optical system with vertical scanning
to provide topographical and colour information from the variation
of focus.
2. Experimental results
For the convenience of the reader, a summary of all experiments
described in this paper is shown in Table 1. All loading directions
are covered, with the exception of compression in stuffer direction
(no valid results could be obtained due to bending in the dog bone
specimens).
Tables 2 and 3 show averaged engineering constants derived
from the experiments performed. A detailed discussion of the
experiments for each loading-direction follows below.
2.1. In plane tension in warp and weft direction
In order to assess the effects of material irregularities (crimp)
and strain rate on the warp and weft directions of the TTAIL, dog
bone shaped tensile specimens were loaded along both directions
respectively (Fig. 6 top).
In order to maintain the continuity of the surface yarns in the
composite coupon, reduce machining induced damage and in-
crease the size of the tested unit cell (consequently reducing scat-
ter, see Section 1.2), the dog bone specimens retained the thickness
of the original composite panel. However, this, as well as the high
strength of the CFRP yarns, complicated load transmission into the
specimen considerably. In order to prevent the specimen from
pulling out of the metal endcaps, a clamping mechanism was em-
ployed. Here, a lightweight clamping device (Fig. 6 bottom) was
designed, enabling fibre-failure within the specimen gauge length
at stress peaks of more than 1 GPa. A set of two clamps manufac-
tured from tool steel is attached to the end caps of the specimen.
The clamps are threaded in order to prevent movement due to
inertia, and apply pressure on the specimen end caps, therefore
increasing internal friction between specimen and end cap. This
additional friction is sufficient to prevent a specimen coupon
pull-out.Fig. 5. Schematic representation of the Hopkinson bars used for the dynamic
experiments. (A) Compression, (b) tension, (c) shear, (d) bending.
400 R. Gerlach et al. / Composites Science and Technology 72 (2012) 397–411

The clamps were only used on the specimens loaded in warp or
weft direction, the strongest specimens. When tested at high load-
ing rates, the speed of the specimen at the input bar end increases
from 0 to �15 m sÿ1 in about 10 ls, an acceleration of
�15 � 105 m sÿ2, whilst that at the output bar end increases from
0 to 5 m sÿ1, an acceleration of 5 � 105 m sÿ1. This means that the
extra force required to accelerate the clamps, whose mass is 8.5 g
each, is of the order 1.5 kN and 0.5 kN on the input and output ends
respectively. Noting that the maximum force seen by the specimen
is �20 kN and that the extra force on the input bar end only occurs
prior to constant strain rate being achieved, this is an acceptable
level of error, given the already large variations in specimen
strength, and the fact that otherwise, no data at all could be
obtained.
The results obtained from both materials, tested in warp and
weft direction, are summarised in Table 2.
Fig. 7 shows the quasi static stress strain response of the tested
3D weaves, which follows a linear trend. These results are compa-
rable to results obtained for an orthogonal weave with modified
binder content and reduced crimp [28]. Compared to the far less
linear stress strain response of more densely 3D reinforced archi-
tectures presented in the literature [23,29,30,46], the effect of the
reduced crimp of the 3D weaves tested in this study (i.e. the rela-
tively linear stress strain response) is therefore clearly visible.
In relation to the experimental scatter, the differences in mod-
ulus between loading directions and materials are small. However,
it could be argued that the difference in crimp between warp and
weft directions manifests itself in a slightly lower average elastic
modulus in weft directions for both materials respectively
(Table 2). Furthermore, it appears that the elastic properties for
the 6% material are somewhat less than for the 3% material, which
might be a result of the influence of the binder content on crimp.
Generally, matrix cracks appear at around 0.4% global strain in
the stuffer layers perpendicular to the loading direction, and their
density gradually increases. For specimens tested in the weft direc-
tion, surface weft yarns that are initially bent by a binder often
straighten out. Brittle failure occurs as stuffers loaded in the fibre
direction rupture, and is distributed over the whole gauge section.
Thus, the failure stress shows large scatter, which is common for
3D weaves tested in tension [3,28]. While this is partly a conse-
quence of the phenomena mentioned earlier, it could also be inter-
preted also an indicator for a possibly significant influence of local
irregularities in the initiation of fibre failure.
During dynamic loading, the failure stress reaches a signifi-
cantly higher average value compared to the quasi static results,
whilst the experimental scatter also increases (Table 2). Consider-
ing the carbon fibre (stuffer) dominated loading direction, this is
somewhat surprising, as carbon fibres are generally considered to
exhibit strain rate independent material behaviour [47,48]. A pos-
Table 1
Summary of performed experiments.
Directions Dimensions Purpose
Tension x,y,xy Dog-bone, 70 � 10 Mat-charact./validation Elastic properties, nonlinearity, strain rate dependency,
effect of weaving process on stiffness, failure and damage
behaviour
Tension z Cross, 20 � 20 Mat-charact./validation Effect of 3D reinforcement on tensile strength, strain rate
dependency
Shear xz,yz Notched beam 25 � 20 Mat-charact./validation Effect of 3D reinforcement on out of plane shear strength,
strain rate dependency
Compr. z Cube, 10 � 10 Mat-charact./validation Elastic properties, strain rate dependency
3 PB (x,y) Prism, 60 � 10 Validation Effect of 3D reinforcement on delamination–behaviour,
strain-rate dependency
Plate bending – Plate, 100 � 100 Validation Effect of 3D reinforcement on delamination–behaviour,
delamination propagation, strain-rate dependency
Table 2
Engineering constants obtained for in-plane loading and out of plane compression.
Test
type
Strain
rate
Material Valid
tests
Modulus
(GPa)
Strength
(MPa)
Mean St. Dev Mean St. Dev
x tens. 5 � 10ÿ5 3% 2 66 0 750 150
6% 5 64 3 770 90
Av. – 65 760 –
450 3% 4 – 1070 240
6% 5 – 930 250
Av. – – – 1000 –
y tens. 5 � 10ÿ5 3% 3 64 4 570 10
6% 4 62 3 640 80
Av. – 63 605 –
450 3% 5 – 780 130
6% 2 – 1060 90
Av. – – – 920 –
xy tens. 3 � 10ÿ5 6% 5 11 1 116 3
10 2 11 1 130 1
1300 2 – – 189 9
z comp. 3 � 10ÿ3 6% 4 7 0.1 610 50
6000 3 10 0.3 590 10
Table 3
Engineering constants obtained for out of plane loading.
Test type Loading-rate
(mm/s)
Material (%) Valid
tests
Strength (MPa)
Mean St. Dev
xz shear 0.003 3 7 37 4
6 7 33 2
85 3 4 33 2
6 6 38 5
11,000 3 6 55 6
6 6 45 3
yz shear 0.003 3 6 42 4
6 6 39 4
85 3 5 45 7
6 5 41 8
11,000 3 6 55 7
6 5 50 7
z tens. 0.004 3 5 18 2
6 6 17 3
85 3 6 23 3
6 5 22 5
11,000 3 6 32 7
6 5 31 5
R. Gerlach et al. / Composites Science and Technology 72 (2012) 397–411 401

sible explanation is that local irregularities, such as crimp, crossing
binders and the distribution of matrix pockets influence the onset
of fibre failure. Consequently, the apparent strain rate dependency
of a fibre failure dominated failure mode observed here can be as-
sumed to be attributed to the well documented strain rate depen-
dency of the matrix material [37] and related matrix dominated
failure modes.
2.2. Intralaminar shear
The absence of stuffers in ±45° direction results in a character-
istically different material behaviour compared to the major in
plane loading directions (x and y, or warp and weft). Here, a study
over a range of three strain rates is performed for the 6% binder
content version of the TTAIL weave; dog bone shaped specimens
were cut from parent material, again retaining the parent material
thickness of �3 mm (see Fig. 8).
The stress strain curve shows the expected highly nonlinear
material behaviour of this matrix dominated material direction.
While the experiments performed at medium strain rates show a
moderate increase of apparent stiffness and peak stress, a signifi-
cant rate dependency can be shown for high loading rates, with
the failure stress nearly doubling (Table 2). The observed signifi-
cant strain rate dependency can be directly attributed to the obser-
vations made for RTM-6, while the significant increase from
medium to high strain rates results from the nonlinear strain rate
dependency of the matrix yield strength and modulus [37].
2.3. Out of plane tension
Experimentally characterising the through thickness tensile
properties of composite materials is challenging, mainly due to
the difficulty to adequately transmit the tensile load into the com-
posite. Standard dog bone or cylindrical shaped specimens have
been proposed for 2D composite materials, but are usually only
suitable relatively thick composite laminates [49–51]. However,
even for thick composite panels, load transmission becomes a ma-
jor challenge if any form of 3D reinforcement is present. This is be-
cause the 3D reinforcement, such as binders, tufting loops or
stitches do not enfold their reinforcement contribution at the top
or bottom surfaces of thin composite plates, where an adhesive
bond would transmit the force, but in the centre of the composite.
In order to investigate their effect, the force therefore has to be
transmitted into a plane already containing effective 3D reinforce-
ment. For this reason, component tests, such as T-Joints [52], are
often used to assess the out of plane tensile properties of 3D com-
posites. A further possibility to address this issue lies in utilising
various shapes of curved specimen designs [53]. Utilising this con-
cept, an L shaped specimen design has recently been proposed
[54], and very promising results were achieved. Unfortunately,
both component tests and curved specimen designs do not allow
for the characterisation of standard planar composite panels, and
are furthermore ill suited for Hopkinson bar testing.
Therefore, a new small scale specimen design was proposed.
The specimens are manufactured from a small rectangular section
of a thin composite panel using the following procedure (Fig. 9).
Two prismatic pieces are machined off (2) using a silicon carbide
grinding wheel. This step is repeated on the opposite side of the
specimen perpendicular to the direction of the first cut of (3),
resulting in a specimen with a cross like shape (4), in the following
called ‘cross specimen’. The transition from beam to gauge section
uses a fillet to reduce stress concentrations, the dimensions are dis-
played in Fig. 10.
The specimen is loaded in compression using U shaped steel
rigs (Fig. 10), while 3 mm thick steel beams adhesively bonded to
the beams of the specimen prevent bending.
Due to the shape of the specimen, a tensile stress state is subse-
quently generated in the part of the specimen where both beams
overlap. This design offers the following advantages:
Fig. 6. Specimens design used for tension in warp and weft direction (top) and the
developed clamping mechanism (bottom).
Fig. 7. Quasi static nominal stress–strain curve for both tested 3D weave, in both
warp and weft directions. A donates the start of matrix cracking within stuffers
loaded perpendicular to the fibre direction.
Fig. 8. Normal stress vs. normal strain for specimens tested in the ±45° direction at
3 strain rates. The strains for the high-rate experiments were calculated using
optical displacement analysis.
402 R. Gerlach et al. / Composites Science and Technology 72 (2012) 397–411

1. Thin composite plates can be loaded in tension in the through
thickness direction while ensuring failure in the gauge section.
2. Since the force is transmitted into the gauge section through the
crossing beams and not using an adhesive bond, the cross spec-
imen design is applicable even for highly 3D reinforced com-
posite materials that naturally exhibit a high strength in
through thickness direction.
3. The specimen type can be used in a split Hopkinson compres-
sion bar setup, enabling the characterisation of through thick-
ness properties at high strain rates.
4. Dependent on the size of the Representative Volume Element
(RVE) in the through thickness direction, only a small section
of a composite panel is sufficient to produce the cross specimen,
thus enabling the manufacture of many specimens even from
small amounts of parent material available.
It should be noted that this design makes any investigation of
stiffness properties very difficult, as the gauge section is very small,
and the steel rigs prevent the use of noncontact strain measure-
ment methods. Furthermore, the tensile stress state in the gauge
section becomes nonuniform unless a sufficiently large fillet can
be machined, which may not be possible for small specimen thick-
nesses, Fig. 9. Nevertheless, the design is an efficient way to inves-
tigate through thickness damage initiation and progression as well
as the influence of the loading rate on strength and damage modes,
especially as otherwise no data at all could be obtained.
Using this design, through thickness failure was generated for
specimens cut from both TTAIL weaves at three different strain
rates. Table 3 summarises the strength values obtained for differ-
ent loading rates, and Fig. 11 shows the respective stress time
curves.
During quasi static loading, the stress rises until the peak value
is reached, at which the two specimen halves debond from each
other, and a significant stress drop occurs. This process is schemat-
ically sketched in Fig. 12A and B. At this point, a small amount of
residual strength remains, which results from the binder still con-
necting the two halves. Deforming the specimen further, fibre rota-
tion and the formation of matrix cracks occur within the binder
(Fig. 12C), however, it still retains its connective ability as the fi-
bres have not yet broken. If the specimen is deformed further, a
critical stress state in the binder is reached, and it fractures
(Fig. 12D). The fibre failure mode is assumed to be related to a
combination of interlaminar shear and tensile loads. The fact that
the binder crosses adjacent layers of stuffers at a very large angle
(see Fig. 3) is responsible for the small effect the binder has on
the remaining nominal strength (50 N; �0.5 MPa). For the same
reason, the binder has virtually no reinforcing effect on the peak
stress. This holds for both reinforcement densities of 3% and 6%.
The results for medium and high loading rates show a rate
dependency of the initial failure stress, which agrees with observa-
tions made for the through thickness strength of 2D composite
materials reported in the literature [55–58]. The failure and dam-
age mechanisms observable for medium and high loading rates
are similar to those observed for quasi static tests.
2.4. Out of plane compression
In order to acquire information about the out of plane stiffness,
complementing the results for out of plane tension, simple
10 � 10 mm prismatic specimens were extracted from the 6%
TTAIL panel, retaining the panel thickness. Fig. 13 shows nominal
stress strain curves for both quasi static and high rate loading.
The quasi static material response is nearly linear; with an aver-
age elastic modulus of 8 GPa (see Table 1). At a strain rate of
�6000 sÿ1 the apparent modulus (measured using the tangent at
300 MPa) increases very slightly. The average strength for quasi
static and high rate loading appears to remain constant at around
600 MPa. Failure is triggered by compressive failure in the yarns,
which results into the explosive ejection of fragments of failed lay-
ers perpendicular to the loading direction.
2.5. Interlaminar shear
Experimentally addressing interlaminar shear in composite
materials is challenging due to the small thickness of the compos-
ite panels and the difficulty to design a specimen in which failure
occurs under a state of pure shear.
In order to achieve this goal, thin walled tube specimens are
usually used. Although useful for 2D composite plates [59]they
are impractical for 3D weaves because of the discrete arrangement
and wide spacing of the 3D reinforcement. In order to address the
effect of the 3D reinforcement adequately, a larger area than
achievable with thin walled tube specimens, containing a sufficient
amount of 3D reinforcement, must be subjected to shear. A further
disadvantage of thin walled tube specimens is that they do not al-
low for a characterisation of potential differences between xz and
yz shear.
As an alternative, short beams designed for punch tests have
been proposed [60,61], however, they are infeasible for the large
unit cell size in 3D composite materials. A setup similar to the
punch test, using a cutting mechanism with sharp corners, has
been used to characterise orthogonal 3D weaves [32,33], but is ill
suited for 3D composite materials, as described in Section 1.Fig. 9. Sequence of production steps for the cross specimen design.
Fig. 10. Principle of the load transfer, specimens dimensions and example of a
failed cross specimen.
R. Gerlach et al. / Composites Science and Technology 72 (2012) 397–411 403

A further alternative lies in the use of various versions of asym-
metrically notched specimens, such as the double notched shear
specimen design. These designs allow for the characterisation of
a large cross section area under interlaminar shear loading, and
furthermore offer the potential to address both interlaminar shear
directions xy and xz independently. Asymmetrically notched spec-
imen designs have successfully been used for studies of the strain
rate dependency of unidirectional composite materials, while both
strain rate independence of strength [62,63] and an increase of
strength with strain rate [64–66] were reported. Therefore, a dou-
ble notched shear specimen design with similar dimensions to
those suggested in the literature [63] was adopted for the charac-
terisation of the 3D woven composite subjected to this study. Two
notches at opposite sides of the specimen create a region of shear
in the centreline of the compressive force applied (Fig. 14A). The
specimen is guided along two opposing vertical faces in order to
prevent rotation.
As a consequence of the specimen design, the shear stress along
the gauge section is not uniform, as stress concentrations near the
notches are inevitable. However, it has been shown that for a com-
parable geometry, the measured strength values agree well with
the uniform shear stress level away from the notch grounds [63].
This is related to the layout as a compression test, where normal
(peeling) stresses at the notch ground are negative (i.e. compres-
sive), which increases the critical shear strength at these regions
due to Mohr–Coulomb type of failure behaviour of composite
materials.
The strength values obtained are used for comparative purpose
at different strain rates. The specimens are cut out in both warp
and weft direction respectively in order to investigate the different
confinement of the binder, see Fig. 14B. When deformed in weft
direction, the binder is confined by matrix pockets within the
gap created between adjacent weft stuffers, while in warp direc-
tion the binder is confined between weft stuffers.
Fig. 15 shows the experimental results obtained for quasi static
loading, the two shear directions and both materials respectively.
The failure strength for all three loading directions was calculated
Fig. 11. Nominal stress time curves for cross specimens at quasi static, medium and high loading rate.
Fig. 12. Schematic description of failure in cross specimens.
Fig. 13. Stress–strain relationship for specimens tested in compression.
Fig. 14. Specimens dimensions, principle and section of the unit cell subjected to xz
and xy shear loading.
404 R. Gerlach et al. / Composites Science and Technology 72 (2012) 397–411

by dividing the force by the cross section area of the joint, and is
listed in Table 3.
The experimental scatter is significant, as expected from the
specimen design. Nevertheless, it is obvious that the measured
average shear strength is higher in the yz direction than in the
xz. It is unclear whether this effect can be attributed to the binder.
Furthermore, a clear trend indicating an increase of the average
strength with increasing loading rate is recognisable, for both
directions and for both materials tested (Table 3). With the excep-
tion of medium-rate xz shear, the average shear strength seems to
be slightly higher for the 3% material compared to the 6% material,
which might be a result of potential negative effect of the binder on
initial shear strength.
The quasi static results shown in Fig. 15 are plotted against glo-
bal strain along the loading direction. The global strain was used
because optical shear strain measurements were of inadequate res-
olution and accuracy, and is defined as the strain in loading direc-
tion (parallel to the shear plane), measured between the two
notches in the double notch shear specimen. All specimens showed
a nonlinear stress global-strain response, which could be attrib-
uted to the matrix dominated deformation mode or, though mini-
mised, bending of the specimen. All specimens subsequently failed
when the interlaminar shear strength between the stuffer layers
was reached, resulting in a significant stress drop.
In the warp direction, the stress drops to a lower level than in
the weft direction. Whether this is due to a higher residual
strength as a result of the binder still connecting the specimen
halves or different crack surface ‘roughness’, resulting in dissimilar
friction during further loading, remains unclear. Similarly to the
cross specimens, the effect of the binder on the initial strength ap-
pears to be negligible. Specimens tested in the warp direction have
usually failed completely at the end of the test, i.e. both specimen
halves were separated. If the load is transmitted along the warp
direction, the binder is firmly confined by adjacent weft stuffers
(as shown in Fig. 14B). Furthermore, the applied normal force flows
roughly in the direction of the fibres in the binder. Consequently, a
brittle fibre failure mode occurs within the binder, as shown in
Fig. 16, and the binder is sheared off (Fig. 16B).
An example of a failed binder is shown in the form of 3D micro-
graph images in Fig. 17. The binder fibre failure mode hereby is
either fibre tensile failure or fibre kinking (compressive failure),
depending on the orientation within the unit cell with respect to
the loading direction.
When deformed along weft direction, the specimen halves often
remain connected after the test. Fig. 18 shows CT scan slices for a
3% binder version specimen tested in the weft direction, which re-
mained connected after the test.
It is clearly visible that the binder shows matrix cracks in the
area where it connects the two halves. However, the fibres remain
Fig. 15. Stress vs. global strain for interlaminar shear specimens tested at quasi-static loading.
Fig. 16. Schematic description of failure in interlaminar shear specimens tested in
warp direction.
Fig. 17. 3D microscopy images (3% version) of failure in interlaminar shear
specimens tested in warp direction.
R. Gerlach et al. / Composites Science and Technology 72 (2012) 397–411 405

largely intact, meaning that the binder is able to connect the spec-
imen halves, and, most importantly, undergo a significant amount
of deformation. The reason for this can be attributed to the softer
confinement of the binder in this loading direction, as mentioned
earlier (Fig. 14B), and, additionally, that the force in the binder is
not transmitted along the fibre direction, therefore preventing an
early fibre failure. Fig. 19 shows 3D microscopy images of speci-
mens that were deformed until the specimen halves were com-
pletely separated, for both the 3% and the 6% version, respectively.
The succession of failure modes for loading in weft direction is
shown in Fig. 20A–C.
After the appearance of matrix cracks, as mentioned above, the
binder is finally sheared off, resulting in large rotations of fibre
bundles and a brush like appearance of the failed binder. The fail-
ure mode responsible is assumed to be a combination of fibre ten-
sile failure and shear failure of the fibres.
2.6. Three point bending
Three point bending experiments are usually performed be-
cause of their ability to address delamination resistance of com-
posite materials. Amongst their advantages over plate bending
experiments (featuring a complex 3D stress state, see Section 2.7)
are a quasi 2D stress state and simpler boundary conditions. A
wedge shaped indenter geometry creates a uniform loading across
the specimen width. Although edge effects at the beam sides are
unavoidable [67], it remains a good setup for the examination of
the delamination and damage progress in different material direc-
tions and has been widely used for composites [30,45,68].
In this study, 3 point bending tests were performed in order to
investigate differences in delamination resistance and progression
for warp and weft direction. Prismatic beams of dimensions 60 mm
long � 10 mm wide were cut in the warp and weft direction of
both TTAIL plates respectively. The experiments showed that for
a span of 20 mm, delamination occurred before compressive fail-
ure at the top surface (Fig. 22). Due to this small span, most of
the beam is not subjected to bending. The beams have not been
shortened, however, in order to allow for a large area to
delaminate.
Fig. 21 shows normalised force displacement plots for the
tested beams during quasi static loading and during impact bend-
ing (impactor speed 6 m/s). The normalised force was calculated by
dividing the force by the width of the beam.
The quasi static force displacement curves show a linear behav-
iour, as reported for heavily compacted 3D weavings tested in
bending [30]. A distinct difference in the stiffness of the beams in
warp and weft directions is visible. This difference is related to
the different stacking sequence, with the surface layers aligned
along the beam in the case of the beams cut in the weft direction.
After the peak stress is reached and delamination initiated, the
bending stiffness (and therefore the force) drops significantly.
Compared to the 6% material, the peak stress is larger for the 3%
material in the weft direction, while it is smaller in the warp direc-
tion. Interestingly, although stiffer initially, the beams in the weft
direction tend to drop bending stiffness to a lower level than the
beams in the warp direction.
The higher loss in bending stiffness indicates a larger delami-
nated area for beams tested in the weft direction. This might be
a result of a lower reinforcement effect of the binder when sheared
in yz (along weft) direction compared to shear in xz (along warp)
direction. This appears to be partially related to the binder elongat-
ing along the beam length in warp direction (where it preserves its
continuity) and along the beam width in weft direction (where it is
cut into pieces of 10 mm each). It also confirms the results of the
interlaminar shear tests (Section 2.5), where the residual strength
Fig. 18. CT slices (3% version) of an interlaminar shear specimen tested quasi
statically in weft direction.
Fig. 19. 3D microscopy images (3% and 6% version) of failure in interlaminar shear specimens tested in weft direction.
406 R. Gerlach et al. / Composites Science and Technology 72 (2012) 397–411

was higher for xz shear than it was for yz shear. Fig. 22 shows typ-
ical damage formation of the beams tested.
During quasi static experiments, depending on the presence of
the binder, delamination either ran through several layers (pre-
dominant mode in weft direction), or got arrested by the binder.
The predominant mode for warp direction was local shear failure
within layers of stuffers. In most cases, the delamination eventu-
ally ran through the complete beams cut from the 3% material
tested in the warp direction, while it was arrested for all other
specimens tested.
The dynamic experiments show a small increase of bending
stiffness, which is assumed to be attributed to inertia effects of
the long free beam ends. In common with the quasi static experi-
ments, the difference of peak stress measured shows the same
trend. Furthermore, it is clearly visible that the bending stiffness
drops to a lower residual load level for beams tested in weft direc-
tion. Another common effect is the arrest of delamination in warp
direction for the 6% material, while the 3% material allowed for the
delamination to run through the beam. This might be an indicator
for the effect of different binder volume fraction on delamination
resistance.
2.7. Plate bending
Compared to the 3 point bending experiments, plate bending
experiments introduce a more complex stress state, allow for a bet-
ter characterisation of delamination progression, and are often
used for characterising 2D and 3D composite materials [69–71].
Therefore, and in order to further assess the ability of the binder
to arrest delamination and impede damage growth, plate bending
tests were performed quasi statically and at impact loads. Fig. 23
shows the force deflection curve obtained during the quasi static
experiments. After an initial elastic response up to a load of
approximately 1.8 kN, local shear failure at the region of indenta-
tion is initiated. Damage progresses as various types (inter and in-
tra bundle failure), in the following categorised as delamination for
simplicity, and results in a reduction of the bending stiffness for
both materials tested. This reduction seems to be higher initially
for the 6%material, until eventually both materials follow the same
trend. Simultaneously, fibre kinking of the top surface weft yarns
occurs (Fig. 24A). Due to the large matrix volume content of the
weave, a large amount of permanent deformation resulting from
damage and yielding matrix material [37] is induced.
At a peak load of approximately 7–8 kN, the weft yarns at the
bottom surface fail in tension (Fig. 24B), resulting in a progressive
drop of force. The scatter in the peak load is relatively high, which
corresponds to the high scatter observed for the in-plane tensile
tests failing due to the same failure mode (fibre tensile failure).
The force drop is larger for the 3% material, indicating that the
remaining bending stiffness is higher for the 6% material, which
might be attributed to a slightly higher amount of delamination
present in the 3% material at this stage.
Fig. 20. Schematic description of failure in interlaminar shear specimens tested in
weft direction.
Fig. 21. Normalised force deflection curves for beams of both materials tested in warp and weft direction.
R. Gerlach et al. / Composites Science and Technology 72 (2012) 397–411 407
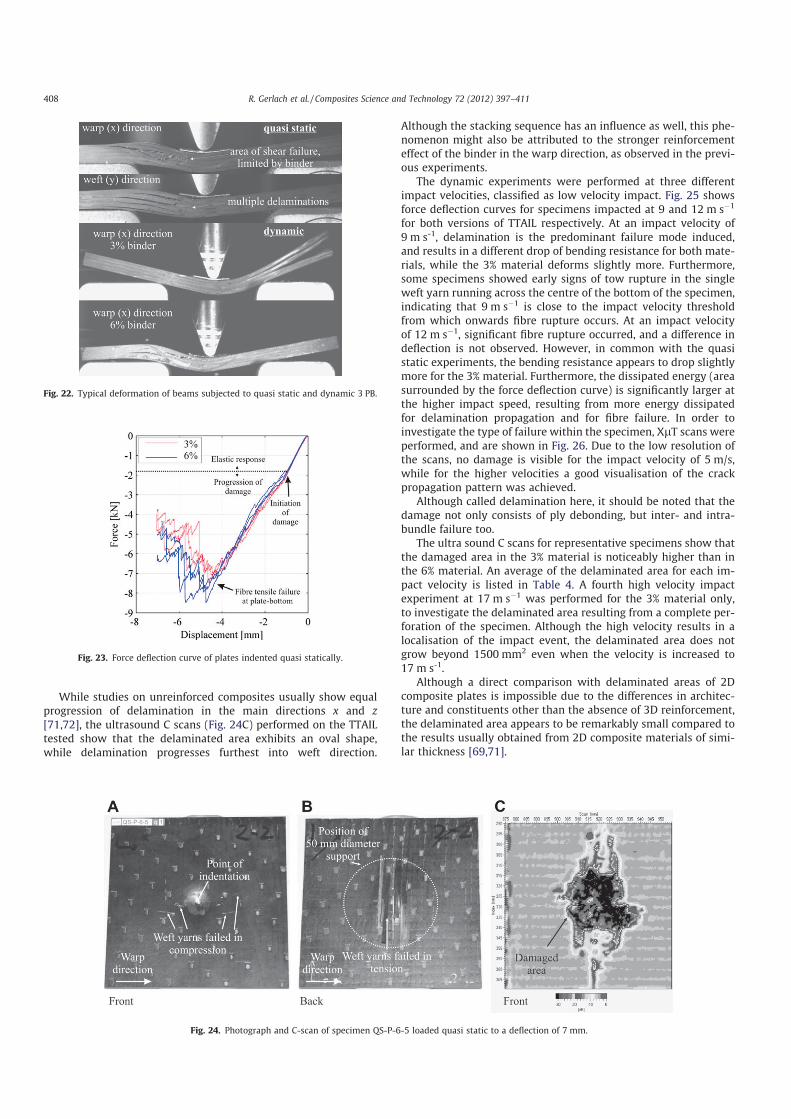
While studies on unreinforced composites usually show equal
progression of delamination in the main directions x and z
[71,72], the ultrasound C scans (Fig. 24C) performed on the TTAIL
tested show that the delaminated area exhibits an oval shape,
while delamination progresses furthest into weft direction.
Although the stacking sequence has an influence as well, this phe-
nomenon might also be attributed to the stronger reinforcement
effect of the binder in the warp direction, as observed in the previ-
ous experiments.
The dynamic experiments were performed at three different
impact velocities, classified as low velocity impact. Fig. 25 shows
force deflection curves for specimens impacted at 9 and 12 m sÿ1
for both versions of TTAIL respectively. At an impact velocity of
9 m s-1, delamination is the predominant failure mode induced,
and results in a different drop of bending resistance for both mate-
rials, while the 3% material deforms slightly more. Furthermore,
some specimens showed early signs of tow rupture in the single
weft yarn running across the centre of the bottom of the specimen,
indicating that 9 m sÿ1 is close to the impact velocity threshold
from which onwards fibre rupture occurs. At an impact velocity
of 12 m sÿ1, significant fibre rupture occurred, and a difference in
deflection is not observed. However, in common with the quasi
static experiments, the bending resistance appears to drop slightly
more for the 3% material. Furthermore, the dissipated energy (area
surrounded by the force deflection curve) is significantly larger at
the higher impact speed, resulting from more energy dissipated
for delamination propagation and for fibre failure. In order to
investigate the type of failure within the specimen, XlT scans were
performed, and are shown in Fig. 26. Due to the low resolution of
the scans, no damage is visible for the impact velocity of 5 m/s,
while for the higher velocities a good visualisation of the crack
propagation pattern was achieved.
Although called delamination here, it should be noted that the
damage not only consists of ply debonding, but inter- and intra-
bundle failure too.
The ultra sound C scans for representative specimens show that
the damaged area in the 3% material is noticeably higher than in
the 6% material. An average of the delaminated area for each im-
pact velocity is listed in Table 4. A fourth high velocity impact
experiment at 17 m sÿ1 was performed for the 3% material only,
to investigate the delaminated area resulting from a complete per-
foration of the specimen. Although the high velocity results in a
localisation of the impact event, the delaminated area does not
grow beyond 1500 mm2 even when the velocity is increased to
17 m s-1.
Although a direct comparison with delaminated areas of 2D
composite plates is impossible due to the differences in architec-
ture and constituents other than the absence of 3D reinforcement,
the delaminated area appears to be remarkably small compared to
the results usually obtained from 2D composite materials of simi-
lar thickness [69,71].
Fig. 22. Typical deformation of beams subjected to quasi static and dynamic 3 PB.
Fig. 23. Force deflection curve of plates indented quasi statically.
Fig. 24. Photograph and C-scan of specimen QS-P-6-5 loaded quasi static to a deflection of 7 mm.
408 R. Gerlach et al. / Composites Science and Technology 72 (2012) 397–411

3. Conclusions
A comprehensive experimental study investigating the strain
rate dependent and nonlinear failure and damage response of
two 3D weaves especially designed to minimise crimp was con-
ducted. During the study, novel experimental methods have been
introduced in order to address several 3DFRP specific challenges,
such as the investigation of the out of plane failure and damage
behaviour. A clamping mechanism allowed for the test of panel-
thick dog bone specimens in both warp and weft direction, while
enabling fibre rupture failure in the gauge section, instead of inva-
lid coupon pull out. A novel cross specimen design was developed,
enabling the characterisation of thin composite plates from quasi
static to Hopkinson bar rates of loading. Using this design, it was
possible to generate failure of the through thickness reinforcement
in tension along the z direction of the material and examine the
damage modes leading to binder rupture. Furthermore, the double
notch shear specimen design was adopted for 3D composites, en-
abling the investigation of both reinforcement effect and damage
evolution for different binder volume fractions. Three point bend-
ing as well as plate bending experiments were performed, and the
effect of the binder content on delamination resistance and dam-
age modes was investigated.
The results show that while the different binder volume fraction
of 3% and 6% only has a small effect on the stiffness in-plane (warp
and weft direction), its effect on the delamination resistance in
plate bending experiments is considerable. Furthermore, a differ-
ence in the binder reinforcement effect depending on loading
direction (xz or yz interlaminar shear) was demonstrated using
double notch shear specimens as well as plate bending tests. The
failure and damage modes within the 3D reinforcement were char-
acterised in detail using XlT scans and 3D microscopy.
The generated dataset expands the scarce and incomplete data
available in the literature, and provides a comprehensive set of cal-
ibration and validation experiments. Hereby, the availability of re-
lated experimental data for the matrix material used,
manufacturer data for the fibre system and detailed information
about the weave geometry make this data set a very important
and generically useful reference for hierarchical numerical model-
ling strategies. Related, and based on the results reported here, the
following recommendations for modellers can be drawn from this
research:
� A hierarchical modelling approach is required to provide a
generically useful material model for the large variety of 3D
weaving architectures and material combinations.
� The considerable amount of plastic deformation seen in the
experiments necessitates a nonlinear and strain rate dependent
material model for both the matrix material (matrix pockets)
and the quasi-UD composite (stuffers and binder).
� The key to numerically predicting the advantages of any 3D
reinforcement on 3D weavings lies in the accurate modelling
of the binder deformation, failure, damage progression and its
effect on the materials resistance to delamination.
� The significant amount of deformation and damage encoun-
tered in the binder requires a robust and stable numerical
methodology.
Acknowledgements
The authors would like to thank Rolls-Royce for their continued
support of composites research at Oxford. In particular, we would
like to thank Dr. A. McMillan for invaluable interactions on this and
other projects. Furthermore, we would like to thank Dr. A. McIlhag-
ger from the University of Ulster for the continuing cooperation
and providing the TTAIL fabric.
References
[1] Tan P, Tong LY, Steven GP, Ishikawa T. Behavior of 3D orthogonal woven CFRPcomposites. Part I. Experimental investigation. Compos Part A – Appl Sci Manuf2000;31(3):259–71.
[2] King S, Stewart G, McIlhagger AT, Quinn JP. Incremental damage developmentin a 3D woven carbon fibre composite. Polym Polym Compos2007;15(7):521–33.
Fig. 25. Comparison of force displacement curves for two different impact velocities.
Fig. 26. XlT scan slices cut in weft direction from the centre of plates (6% version)
impacted at different velocities.
Table 4
Average of delaminated area of both materials tested at different impact velocities.
Average impact velocity in m/s 5 9 12 17
Average delaminated 3% 250 1200 1500 1500
Area (mm2) 6% 170 700 1300 –
R. Gerlach et al. / Composites Science and Technology 72 (2012) 397–411 409

[3] Quinn JP, Mellhagger AT, McIlhagger R. Examination of the failure of 3D wovencomposites. Compos Part A – Appl Sci Manuf 2008;39(2):273–83.
[4] McIlhagger R, Quinn JP, McIlhagger AT, Wilson S, Simpson D, Wenger W. Theinfluence of binder tow density on the mechanical properties of spatiallyreinforced composites. Part 2 – Mechanical properties. Compos Part A – ApplSci Manuf 2008;39(2):334–41.
[5] Lomov SV, Bogdanovich AE, Ivanov DS, Mungalov D, Verpoest I, Karaham M.Damage progression in 2D and non crimp 3D woven composites. In: 2ndECCOMAS thematic conference on the mechanical response of composites.London; 2009.
[6] Bogdanovich AE. Multi-scale modeling, stress and failure analyses of 3-Dwoven composites. J Mater Sci 2006;41(20):6547–90.
[7] Quinn JP, McIlhagger AT, Ridgeway K. The feasibility of manufacture of 3Dwoven hybrid composite materials. In: TexComp-8 int conference. Universityof Nottingham; 2006.
[8] Taylor LW. The development of fully integrated 3d Preforms & theircommercial availability. In: TexComp-8 Int conference. University ofNottingham; 2006.
[9] Mouritz AP, Bannister MK, Falzon PJ, Leong KH. Review of applications foradvanced three-dimensional fibre textile composites. Compos Part A – Appl SciManuf 1999;30(12):1445–61.
[10] Tong L, Mouritz AP, Bannister MK. 3D fibre reinforced polymercomposites. Elsevier; 2002.
[11] Wang XF, Wang XW, Zhou GM, Zhou CW. Multi-scale analyses of 3D wovencomposite based on periodicity boundary conditions. J Compos Mater2007;41(14):1773–88.
[12] Haasemann G, Kastner M, Ulbricht V. A new modelling approach based onbinary model and X-FEM to investigate the mechanical behaviour of textilereinforced composites. CMES – Comput Model Eng Sci 2009;42(1):35–58.
[13] Tabiei A, Ivanov I. Micro-mechanical model with strain-rate dependency anddamage for impact simulation of woven fabric composites. Mech Adv MaterStruct 2007;14(5):365–77.
[14] Aminjikarai SB, Tabiei A. A strain-rate dependent 3-D micromechanical modelfor finite element simulations of plain weave composite structures. ComposStruct 2007;81(3):407–18.
[15] Zhao LG, Warrior NA, Long AC. Finite element modelling of damageprogression in non-crimp fabric reinforced composites. Compos Sci Technol2006;66(1):36–50.
[16] Lua J, Gregory W, Sankar J. Multi-scale dynamic failure prediction tool formarine composite structures. J Mater Sci. 2006;41(20):6673–92.
[17] Verpoest I, Lomov SV. Virtual textile composites softwareWiseTex: integrationwith micro-mechanical, permeability and structural analysis. Compos SciTechnol 2005;65(15–16):2563–74.
[18] Lee CS, Chung SW, Shin H, Kim SJ. Virtual material characterization of 3Dorthogonal woven composite materials by large-scale computing. J ComposMater 2005;39(10):851–63.
[19] Ladeveze P. Multiscale modelling and computational strategies for composites.Int J Numer Methods Eng 2004;60(1):233–53.
[20] Zako M, Uetsuji Y, Kurashiki T. Finite element analysis of damaged wovenfabric composite materials. Compos Sci Technol 2003;63(3–4):507–16.
[21] Sheng SZ, Hoa SV. Modeling of 3D angle interlock woven fabric composites. JThermoplast Compos Mater 2003;16(1):45–58.
[22] Naik NK, Azad SNM, Prasad PD. Stress and failure analysis of 3D angle interlockwoven composites. J Compos Mater 2002;36(1):93–123.
[23] Cox BN, Carter WC, Fleck NA. A binary model of textile composites – I.Formulation. Acta Metall Mater 1994;42(10):3463–79.
[24] Lomov SV, Perie G, Ivanov DS, Verpoest I, Marsal D. Modeling three-dimensional fabrics and three-dimensional reinforced composites:challenges and solutions. Text Res J 2011;81(1):28–41.
[25] Ansar M, Wang XW, Zhou CW. Modeling strategies of 3D woven composites: areview. Compos Struct 2011;93(8):1947–63.
[26] Cox BN, Dadkhah MS, Morris WL. On the tensile failure of 3-D wovencomposites. Composites: Part A 1996;77a:447–58.
[27] Pochiraju K, Chou TW. Three-dimensionally woven and braided composites. II:An experimental characterization. Polym Compos 1999;20(6):733–47.
[28] Leong KH, Lee B, Herszberg I, Bannister MK. The effect of binder path on thetensile properties and failure of multilayer woven CFRP composites. ComposSci Technol 2000;60(1):149–56.
[29] Cox BN, Dadkhah MS, Inman RV, Morris WL, Zupon J. Mechanisms ofcompressive failure in 3D composites. Acta Metall Mater1992;40(12):3285–98.
[30] Cox BN, Dadkhah MS, Morris WL, Flintoff JG. Failure mechanisms of 3D wovencomposites in tension, compression and bending. Acta Metall Mater1994;42(12):3967–84.
[31] Kuo WS, Ko TH. Compressive damage in 3-axis orthogonal fabric composites.Compos Part A – Appl Sci Manuf 2000;31(10):1091–105.
[32] Kuo WS, Fang H, Lin HW. Failure behavior of 3D woven composites undertransverse shear. Compos Part A – Appl Sci Manuf 2003;34(7):561–75.
[33] Kuo WS, Ko TH, Lo TS. Failure behavior of three-axis woven carbon/carboncomposites under compressive and transverse shear loads. Compos SciTechnol 2002;62(7–8):989–99.
[34] Chou S, Chen HC, Chen HE. Effect of weave structure on mechanical fracture-behavior of 3-dimensional carbon-fiber fabric reinforced epoxy-resincomposites. Compos Sci Technol 1992;45(1):23–35.
[35] McIlhagger R, Quinn JP, McIlhagger AT, Wilson S, Simpson D, Wenger W. Theinfluence of binder tow density on the mechanical properties of spatially
reinforced composites. Part 1 – Impact resistance. Compos Part A – Appl SciManuf 2007;38(3):795–801.
[36] Naik NK, Meduri S. Polymer–matrix composites subjected to low-velocityimpact: effect of laminate configuration. Compos Sci Technol2001;61(10):1429–36.
[37] Gerlach R, Siviour CR, Petrinic N, Wiegand J. Experimental characterisation andconstitutive modelling of RTM-6 resin under impact loading. Polymer2008;49(11):2728–37.
[38] Gerlach R, Pabst A, Petrinic N, Hornig A, Wiegand J, Siviour CR, et al. Theinterface between matrix pockets and fibre bundles under impact loading.Compos Sci Technol 2009;69(11–12):2024–6.
[39] Karahan M, Lomov SV, Bogdanovich AE, Mungalov D, Verpoest I. Internalgeometry evaluation of non-crimp 3D orthogonal woven carbon fabriccomposite. Compos Part A – Appl Sci Manuf 2010;41(9):1301–11.
[40] Buckley CP, Harding J, Hou JP, Ruiz C, Trojanowski A. Deformation ofthermosetting resins at impact rates of strain. Part I: Experimental study. JMech Phys Solids 2001;49(7):1517–38.
[41] Gerlach R, Sivasubramaniam SK, Siviour CR, Petrinic N. A novel method forpulse shaping of Split Hopkinson Tensile Bar signals. Int J Impact Eng2011;38(12):976–80.
[42] Harding J, Welsh LM. A tensile testing technique for fiber-reinforcedcomposites at impact rates of strain. J Mater Sci 1983;18(6):1810–26.
[43] Sjödahl M. Electronic speckle photography: increased accuracy by non-integral pixel shifting. Appl. Opt. 1994;33:6667–73.
[44] Sjödahl M, Benckert LR. Electronic speckle photography: analysis of analgorithm giving the displacement with subpixel accuracy. Appl. Opt.1993;32:2278–84.
[45] Wiegand J. Constitutive modelling of composite materials under impactloading, in PhD thesis. Department of Engineering, University of Oxford;2008.
[46] Xu J, Cox BN, McGlockton MA, Carter WC. A binary model of textile composites– II. The elastic regime. Acta Metall Mater 1995;43(9):3511–24.
[47] Zhou Y, Jiang D, Xia Y. Tensile mechanical behavior of T300 and M40J fiberbundles at different strain rate. J Mater Sci 2001;36(4):919–22.
[48] Zhou Y, Wang Y, Jeelani S, Xia Y. Experimental study on tensile behavior ofcarbon fiber and carbon fiber reinforced aluminum at different strain rate.Appl Compos Mater 2007;14(1):17–31.
[49] Abot JL, Daniel IM. Through-thickness mechanical characterization of wovenfabric composites. J Compos Mater 2004;38(7):543–53.
[50] Olsson R. A survey of test methods for multiaxial and out-of-plane strength ofcomposite laminates. Compos Sci Technol 2011;71(6):773–83.
[51] Gerlach R, Siviour CR, Wiegand J, Petrinic N. The strain rate dependent materialbehaviour of S-GFRP extracted from GLAREÒ. Mechanics of advanced materialsand structures; 2011. doi:10.1080/15376494.2011.627646.
[52] Koh TM, Feih S, Mouritz AP. Experimental determination of the structuralproperties and strengthening mechanisms of z-pinned composite T-joints.Compos Struct 2011;93(9):2222–30.
[53] Cui WC, Liu T, Len JX, Ruo RB. Interlaminar tensile strength (ILTS)measurement of woven glass/polyester laminates using four-point curvedbeam specimen. Compos Part A – Appl Sci Manuf 1996;27(11):1097–105.
[54] Hufenbach W, Hornig A, Zhou B, Langkamp A, Gude M. Determination of strainrate dependent through-thickness tensile properties of textile reinforcedthermoplastic composites using L-shaped beam specimens. Compos SciTechnol 2011;71(8):1110–6.
[55] Daniel IM, Hsiao HM, Cordes RD. Dynamic response of carbon/epoxycomposites. In: Rajapakse YDS, Vinson JR, editors. New York, AD-vol. 48;1995 p. 167–77.
[56] Daniel IM, Labedz RH, Liber T. New method for testing composites at veryhigh-strain rates. Exp Mech 1981;21(2):71–7.
[57] Melin LG, Asp LE. Effects of strain rate on transverse tension properties of acarbon/epoxy composite: studied by moire photography. Compos Part A –Appl Sci Manuf 1999;30(3):305–16.
[58] Rio TG, Barbero E, Zaera R, Navarro C. Dynamic tensile behaviour at lowtemperature of CFRP using a split Hopkinson pressure bar. Compos Sci Technol2005;65(1):61–71.
[59] Naik NK, Asmelash A, Kavala VR, Ch V. Interlaminar shear properties ofpolymer matrix composites: strain rate effect. Mech Mater2007;39(12):1043–52.
[60] Hamouda AMS, Hashmi MSJ. Testing of composite materials at high rates ofstrain: advances and challenges. J Mater Process Technol 1998;77(1–3):327–36.
[61] Sun BZ, Gu BH. Shear behavior of 3D orthogonal woven fabric compositesunder high strain rates. J Reinf Plast Compos 2006;25(17):1833–45.
[62] Bouette B, Cazeneuve C, Oytana C. Effect of strain rate on interlaminar shearproperties of carbon/epoxy composites. Compos Sci Technol1992;45(4):313–21.
[63] Yokoyama T, Nakai K. Evaluation of interlaminar shear strength of aunidirectional carbon/epoxy laminated composite under impact loading. JPhys IV 2006;134:797–804.
[64] Hallett SR, Ruiz C, Harding J. The effect of strain rate on the interlaminar shearstrength of a carbon/epoxy cross-ply laminate: comparison betweenexperiment and numerical prediction. Compos Sci Technol1999;59(5):749–58.
[65] Hiley MJ, Dong L, Harding J. Effect of strain rate on the fracture process ininterlaminar shear specimens of carbon fibre-reinforced laminates. ComposPart A – Appl Sci Manuf 1997;28(2):171–80.
410 R. Gerlach et al. / Composites Science and Technology 72 (2012) 397–411

[66] Dong L, Harding J. A single-lap shear specimen for determining the effect ofstrain-rate on the interlaminar shear-strength of carbon-fiber-reinforcedlaminates. Composites 1994;25(2):129–38.
[67] Chang F-K, Choi HY, Jeng S-T. Study on impact damage in laminatedcomposites. Mech Mater 1990;10(1–2):83–95.
[68] Hallett SR. Three-point beam impact tests on T300/914 carbon-fibrecomposites. Compos Sci Technol 2000;60(1):115–24.
[69] Bibo GA, Hogg PJ. The role of reinforcement architecture on impact damagemechanisms and post-impact compression behaviour. J Mater Sci1996;31(5):1115–37.
[70] Kim J-K, Sham M-L. Impact and delamination failure of woven-fabriccomposites. Compos Sci Technol 2000;60(5):745–61.
[71] Wu XF, Ghoshal G, Kartashov M, Aslan Z, Turner JA, Dzenis YA. Experimentalcharacterization of the impact-damage tolerance of a cross-ply graphite-fiber/epoxy laminate. Polym Compos 2008;29(5):534–43.
[72] Naik NK, Borade SV, Arya H, Sailendra M, Prabhu SV. Experimental studies onimpact behaviour of woven fabric composites: effect of impact parameters. JReinf Plast Compos 2002;21(15):1347–62.
R. Gerlach et al. / Composites Science and Technology 72 (2012) 397–411 411