Improving learning through smart learning analytics
60
Improving learning through smart learning analytics Kinshuk, PhD Dean, College of Information University of North Texas, USA [email protected] http://www.kinshuk.info
-
Upload
khangminh22 -
Category
Documents
-
view
0 -
download
0
Transcript of Improving learning through smart learning analytics
Improving learning through smart learning analytics
Kinshuk, PhDDean, College of Information
University of North Texas, [email protected]
http://www.kinshuk.info
Springer’sLecture Notes in Educational Technology
http://www.springer.com/series/11777
Series EditorsRonghuai Huang, Kinshuk, Mohamed Jemni,
Nian-Shing Chen and J. Michael Spector
BooksProceedings
e-books
Slide 2
Slide 3
Springer’sSmart Learning Environments
http://www.springer.com/education+%26+language/journal/40561
EditorsRonghuai Huang
KinshukElliot Soloway
SpringerOpen
Slide 4
International Association of Smart Learning Environmentshttp://www.iasle.net/
Slide 5
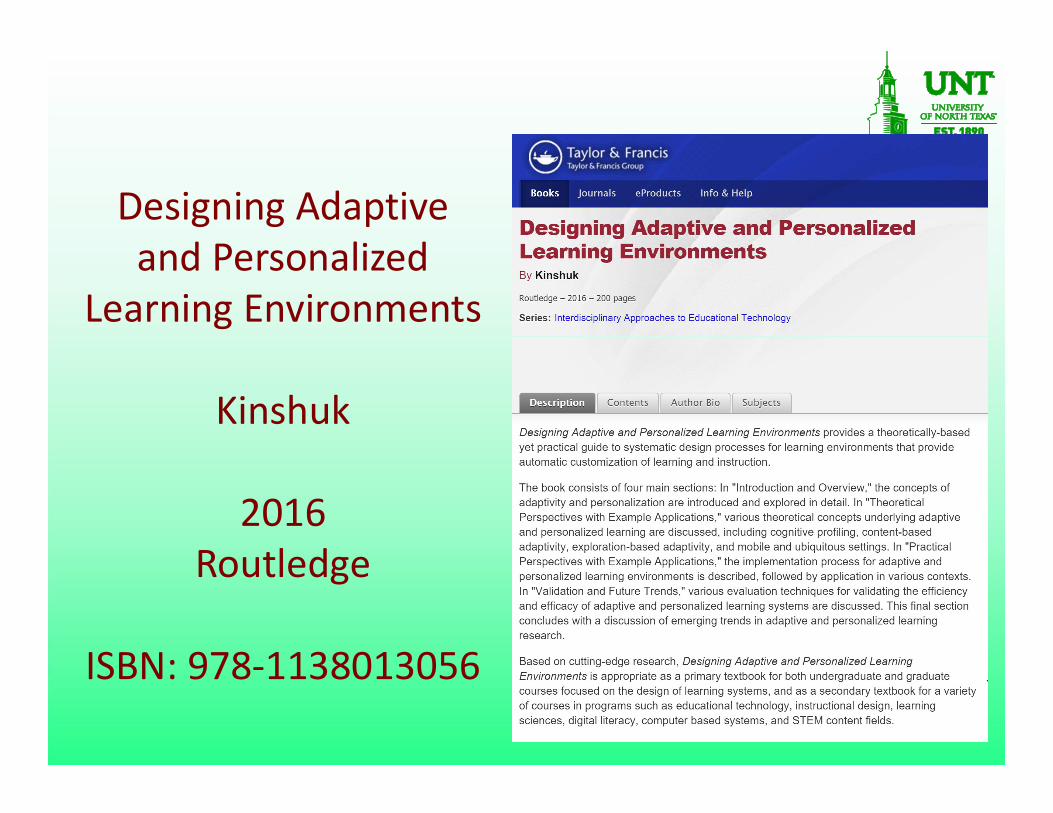
Designing Adaptive and Personalized
Learning Environments
Kinshuk
2016Routledge
ISBN: 978-1138013056
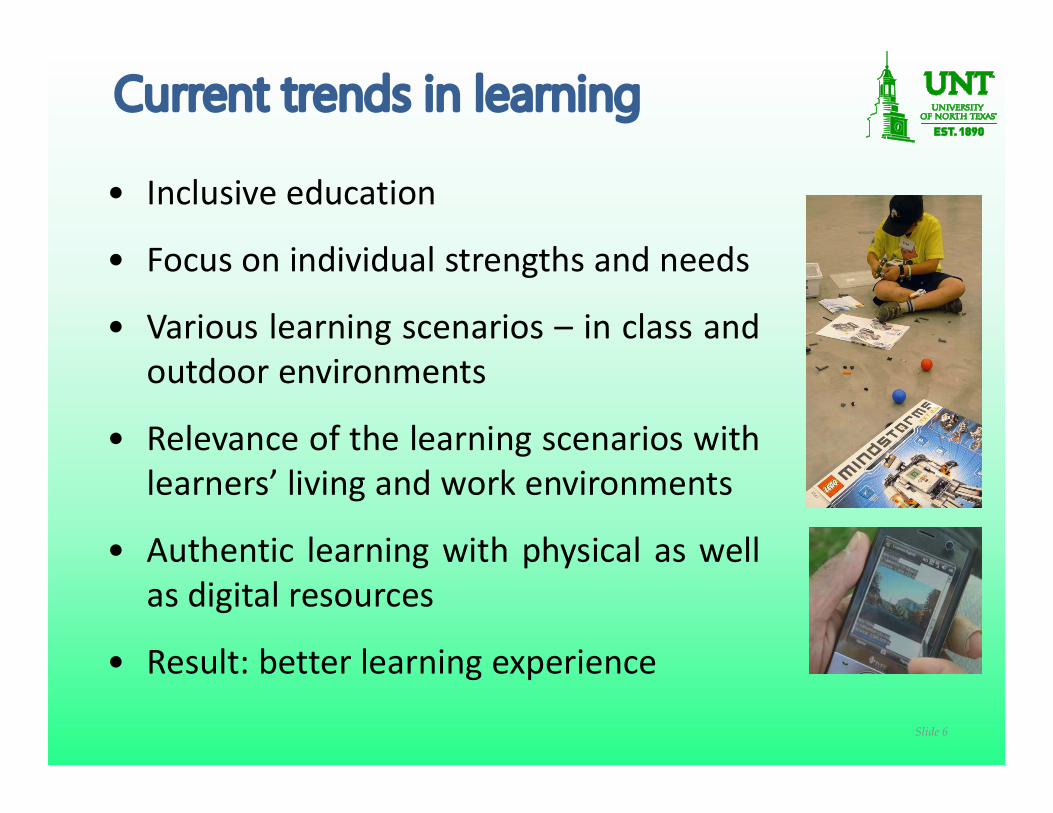
• Inclusive education
• Focus on individual strengths and needs
• Various learning scenarios – in class andoutdoor environments
• Relevance of the learning scenarios withlearners’ living and work environments
• Authentic learning with physical as wellas digital resources
• Result: better learning experience
Slide 6
Current trends in learning
~ Learning omnipresent and highly contextual ~
Slide 7
seamless integration of learning into every aspect of life
which implies
immersive, always-on learning
that happens so naturally and in such small chunks
that no conscious effort is needed
to be actively learning while engaged in everyday life
Vision
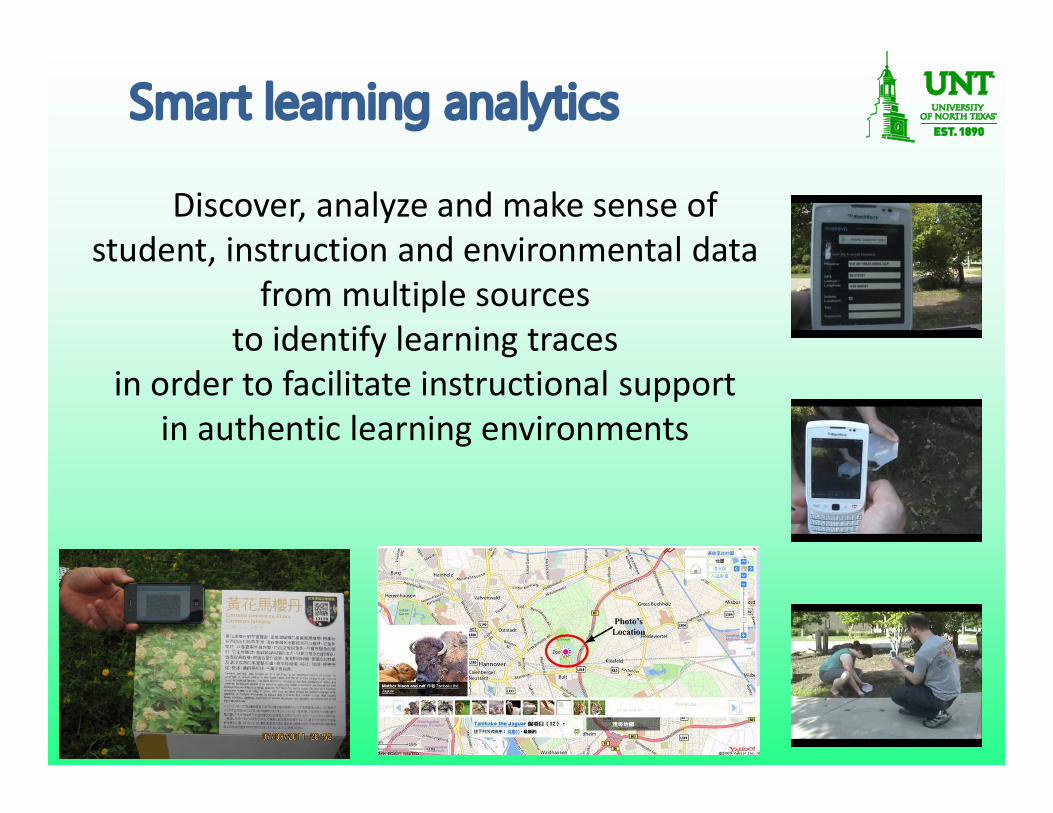
Smart learning analytics
Discover, analyze and make sense ofstudent, instruction and environmental data
from multiple sourcesto identify learning traces
in order to facilitate instructional supportin authentic learning environments
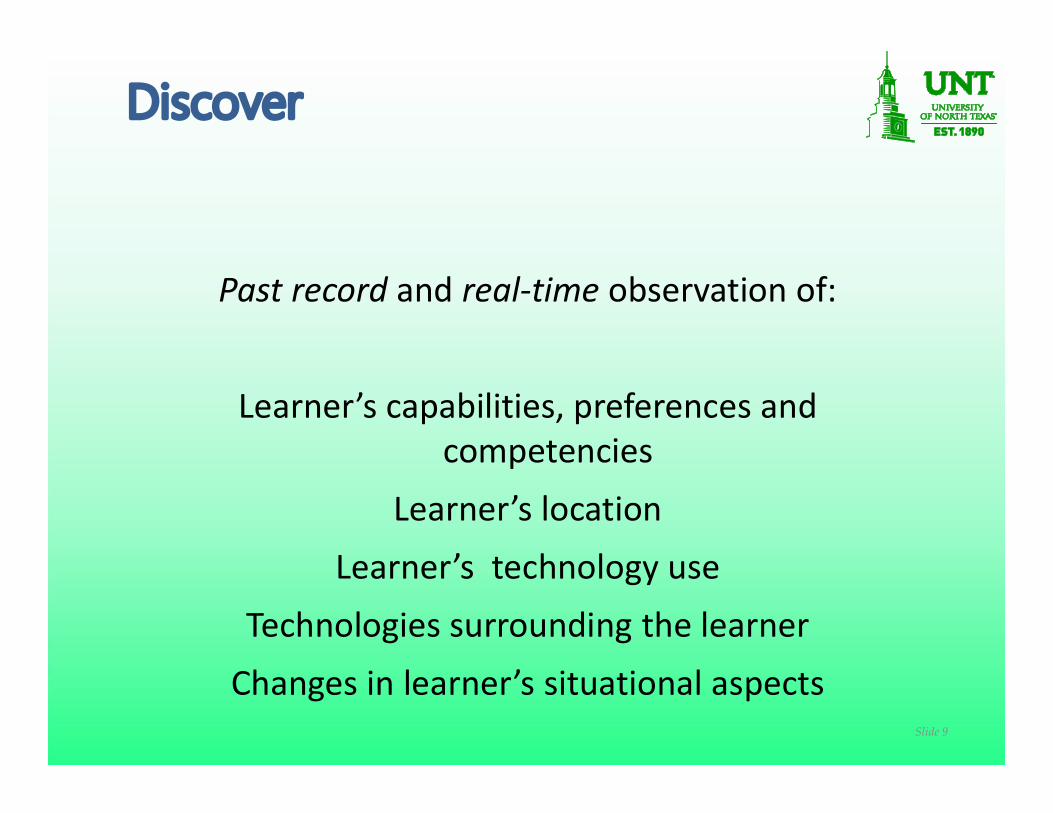
Discover
Past record and real-time observation of:
Learner’s capabilities, preferences and competencies
Learner’s location
Learner’s technology use
Technologies surrounding the learner
Changes in learner’s situational aspectsSlide 9
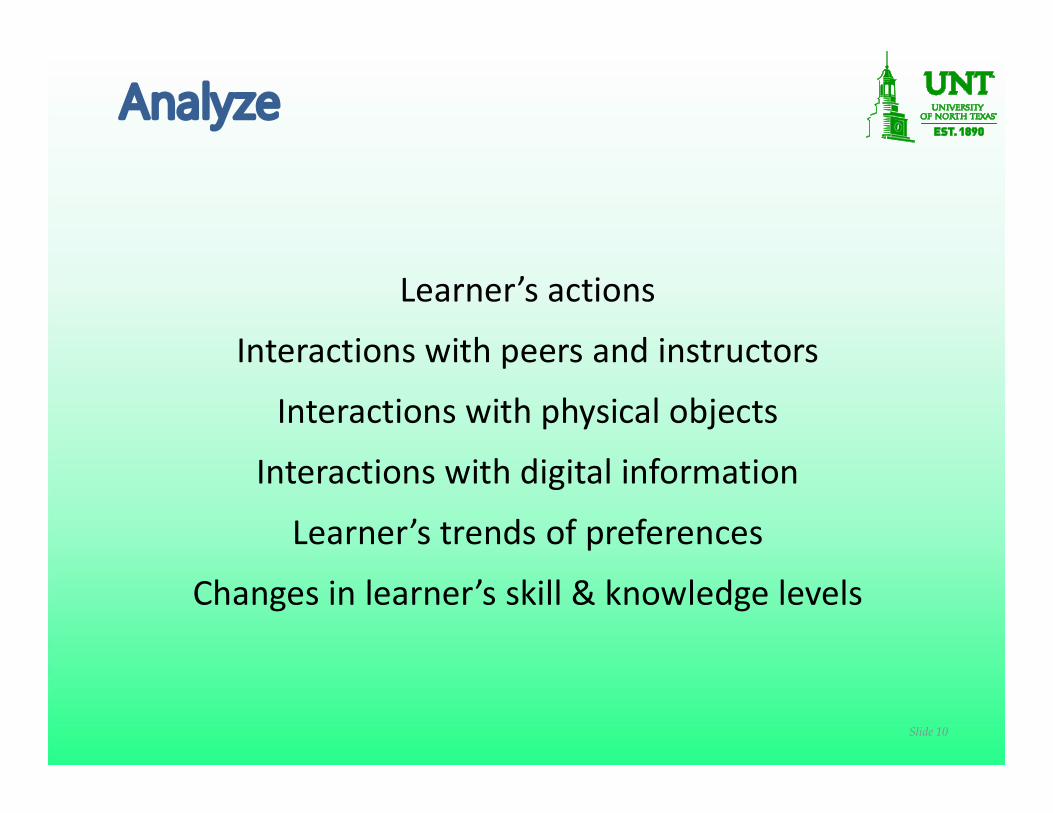
Analyze
Learner’s actions
Interactions with peers and instructors
Interactions with physical objects
Interactions with digital information
Learner’s trends of preferences
Changes in learner’s skill & knowledge levels
Slide 10
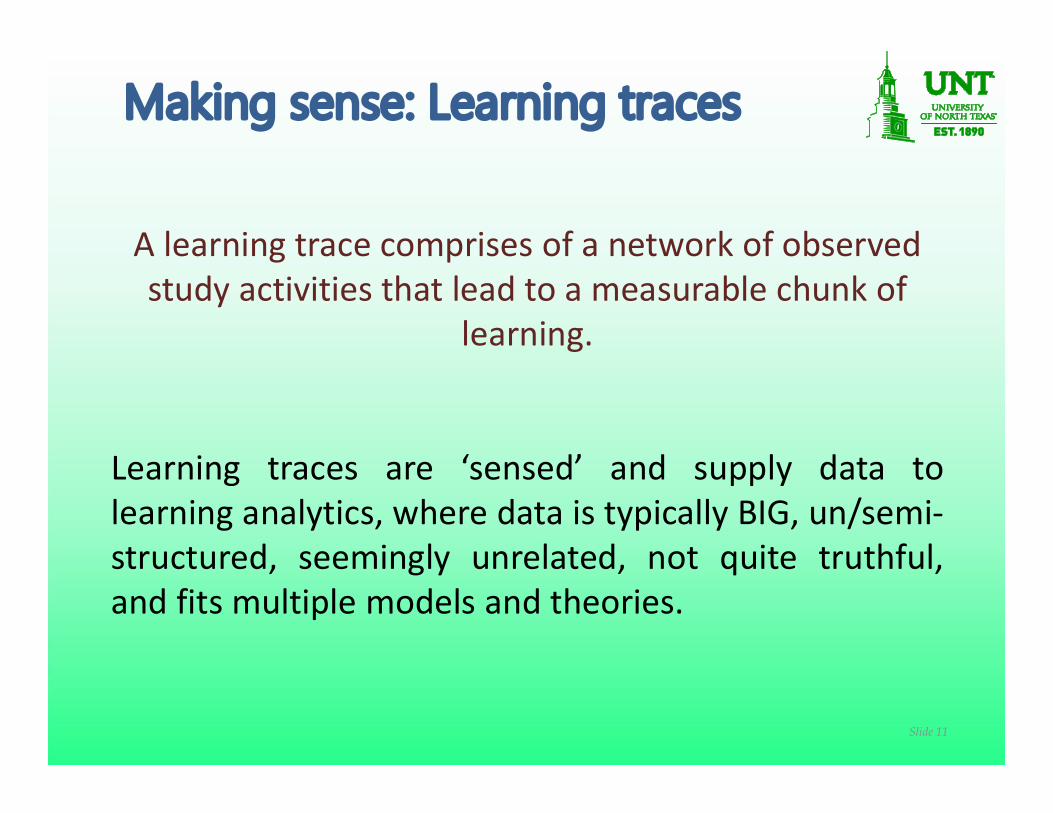
Making sense: Learning traces
A learning trace comprises of a network of observed study activities that lead to a measurable chunk of
learning.
Learning traces are ‘sensed’ and supply data tolearning analytics, where data is typically BIG, un/semi-structured, seemingly unrelated, not quite truthful,and fits multiple models and theories.
Slide 11
Why learning traces are important?
Different students can adopt different learningapproaches for the same learning activity!
Ex: Why a pointed object penetrates better than a blunt object?
• A visual-oriented learner may choose to see this inaction and explain the results
• A psychomotor-oriented learner may take a sharppencil and test it against his/her palm to explain theresults
• A cognition-oriented student may workout themathematics behind pressure to explain the results
Slide 12
Examplesof
Smart Learning Analytics
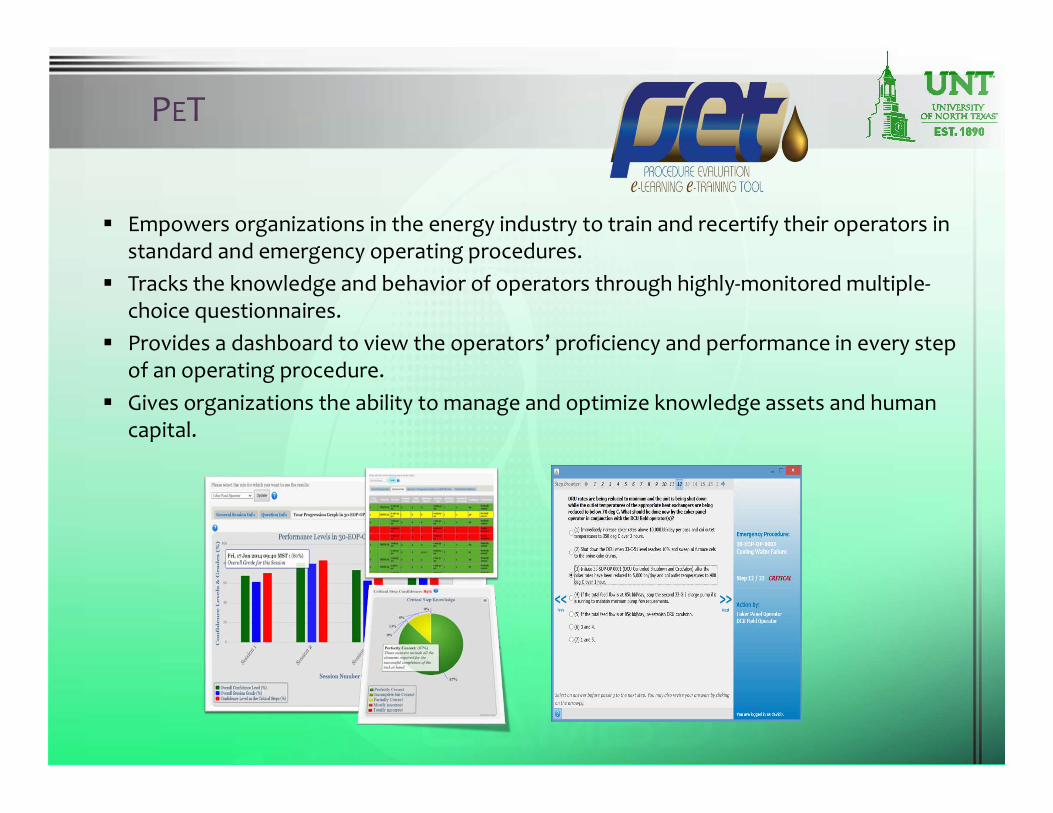
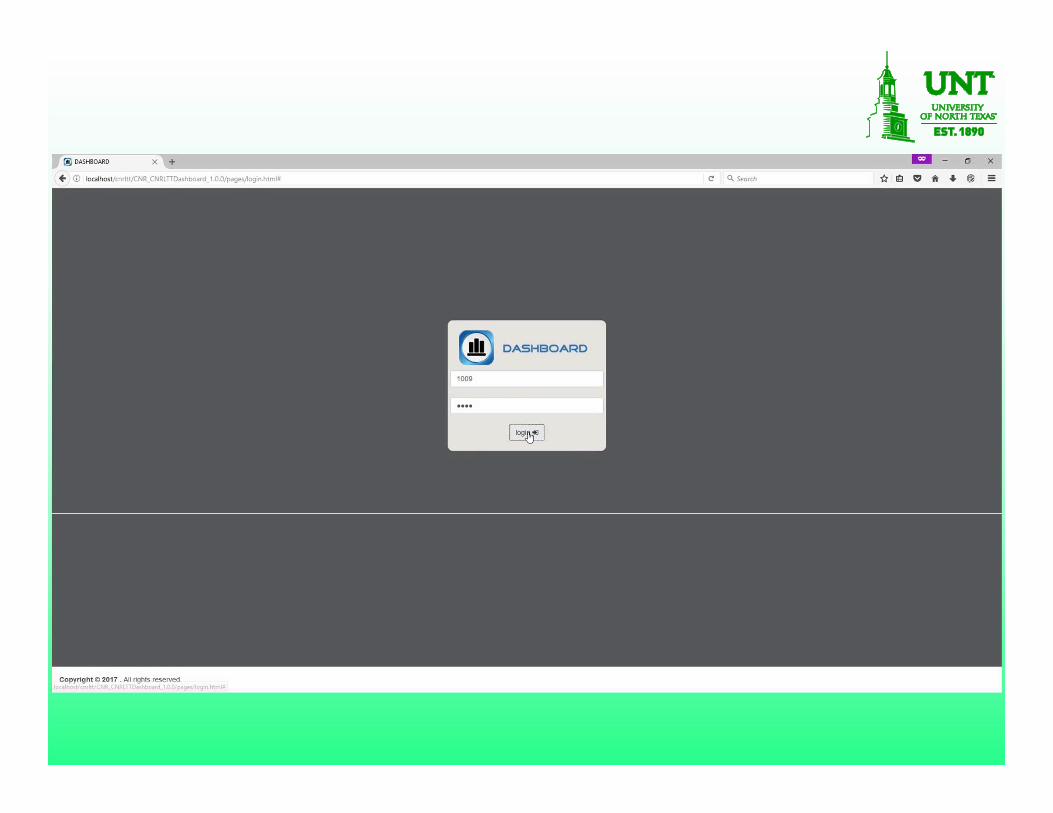
Empowers organizations in the energy industry to train and recertify their operators in standard and emergency operating procedures.
Tracks the knowledge and behavior of operators through highly-monitored multiple-choice questionnaires.
Provides a dashboard to view the operators’ proficiency and performance in every step of an operating procedure.
Gives organizations the ability to manage and optimize knowledge assets and human capital.
PET
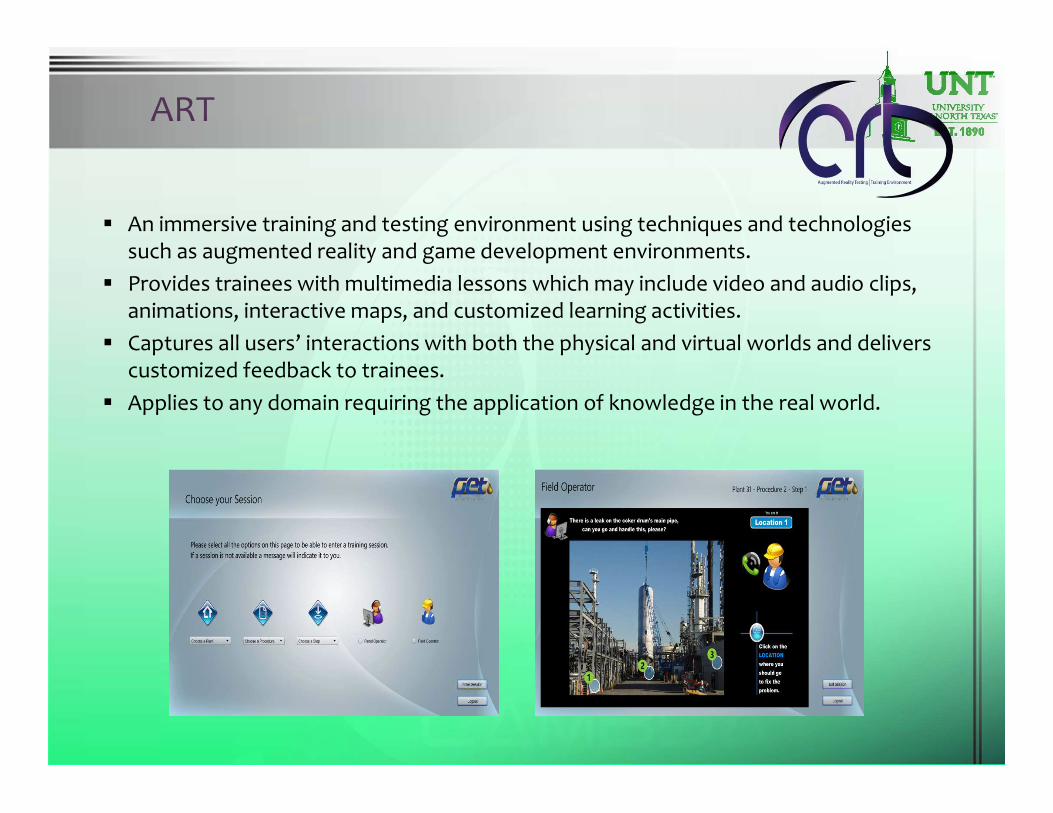
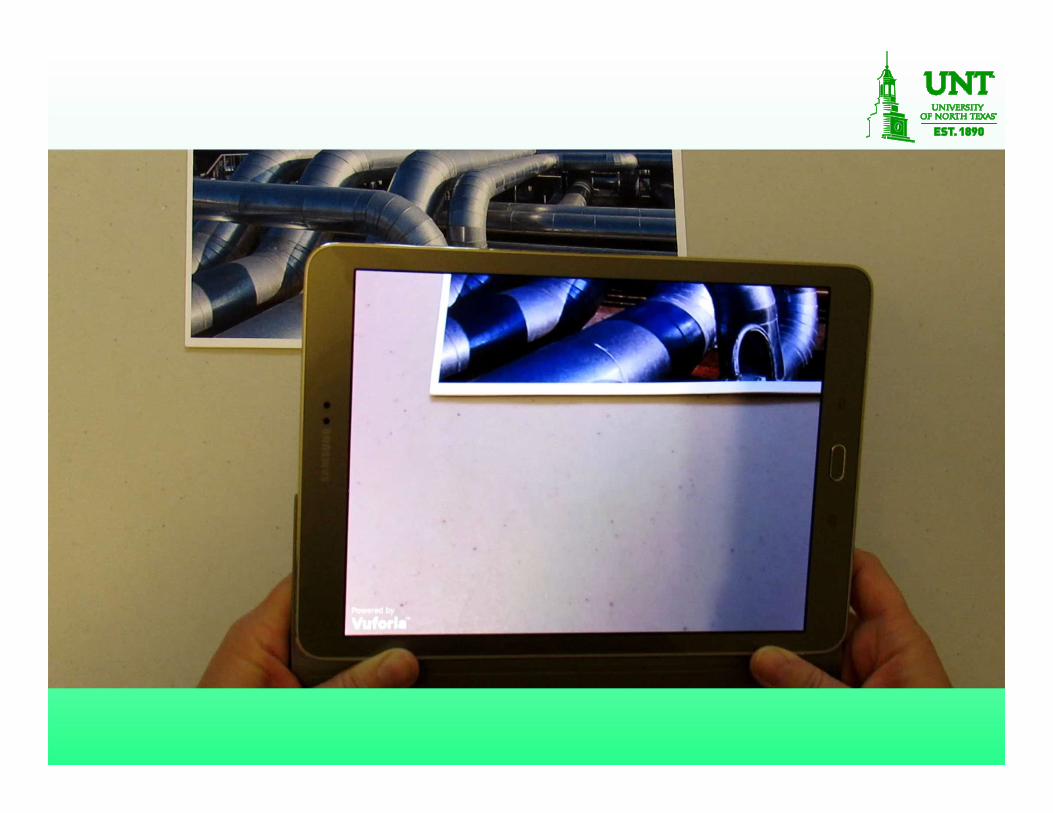
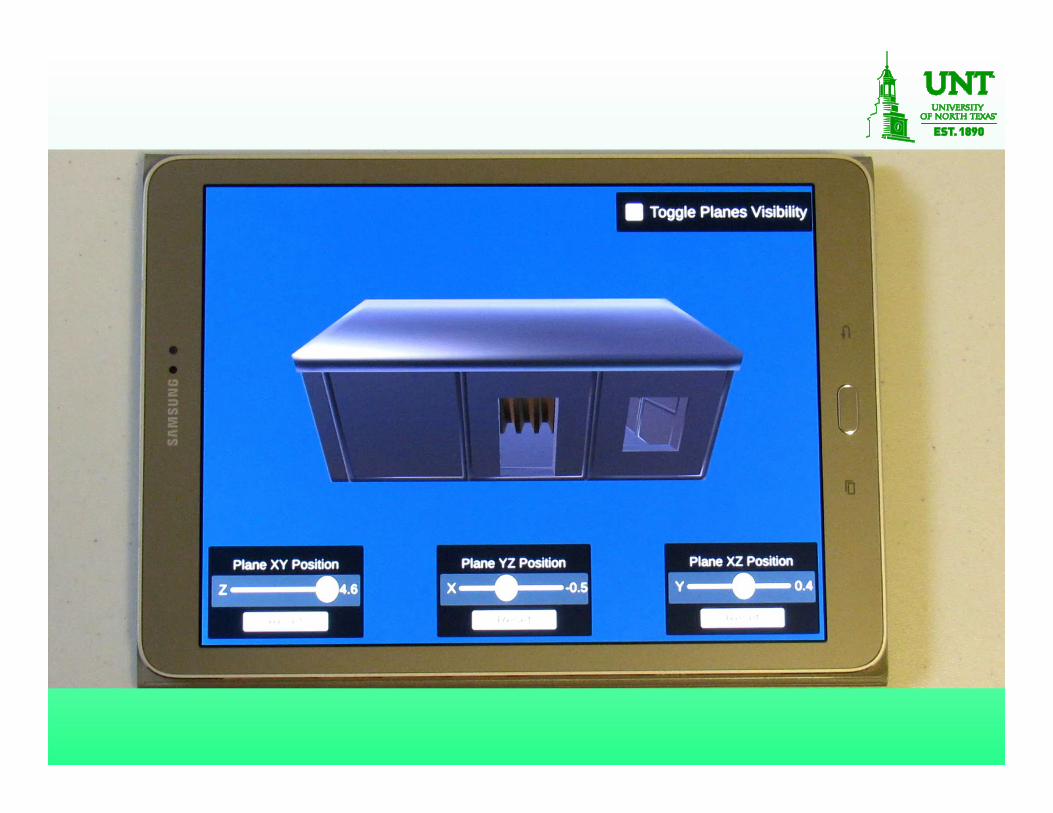
An immersive training and testing environment using techniques and technologies such as augmented reality and game development environments.
Provides trainees with multimedia lessons which may include video and audio clips, animations, interactive maps, and customized learning activities.
Captures all users’ interactions with both the physical and virtual worlds and delivers customized feedback to trainees.
Applies to any domain requiring the application of knowledge in the real world.
ART
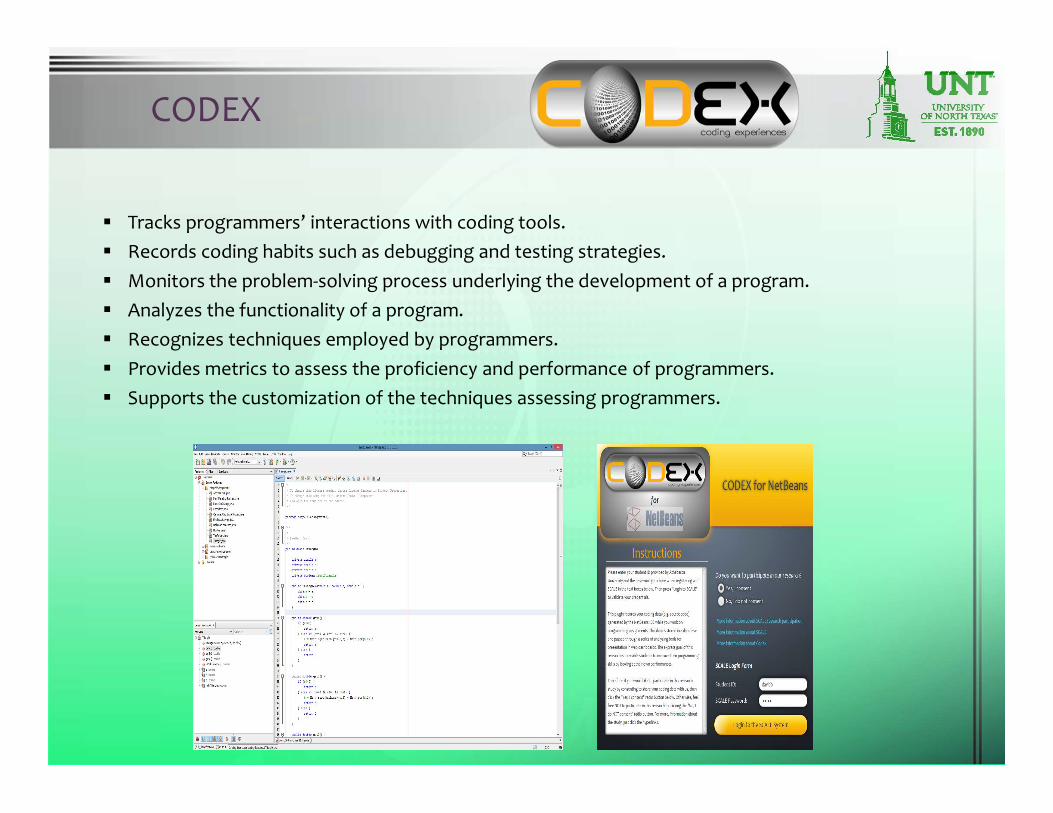
Tracks programmers’ interactions with coding tools. Records coding habits such as debugging and testing strategies. Monitors the problem-solving process underlying the development of a program. Analyzes the functionality of a program. Recognizes techniques employed by programmers. Provides metrics to assess the proficiency and performance of programmers. Supports the customization of the techniques assessing programmers.
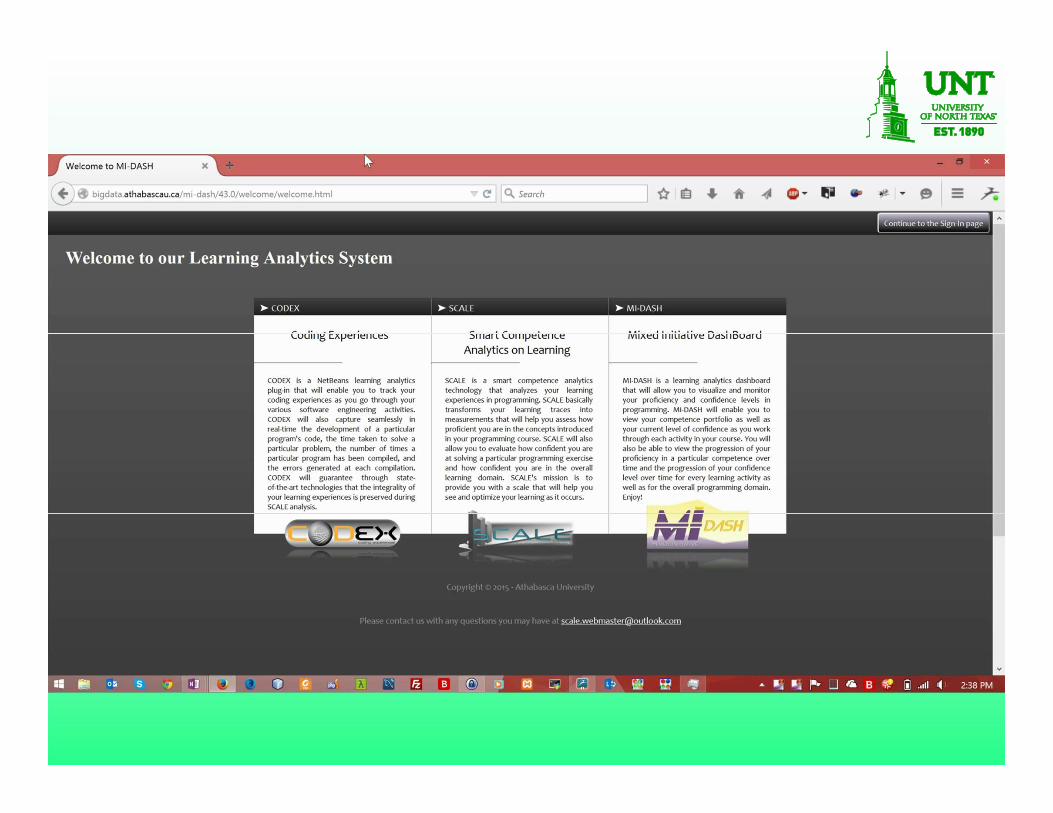
CODEX
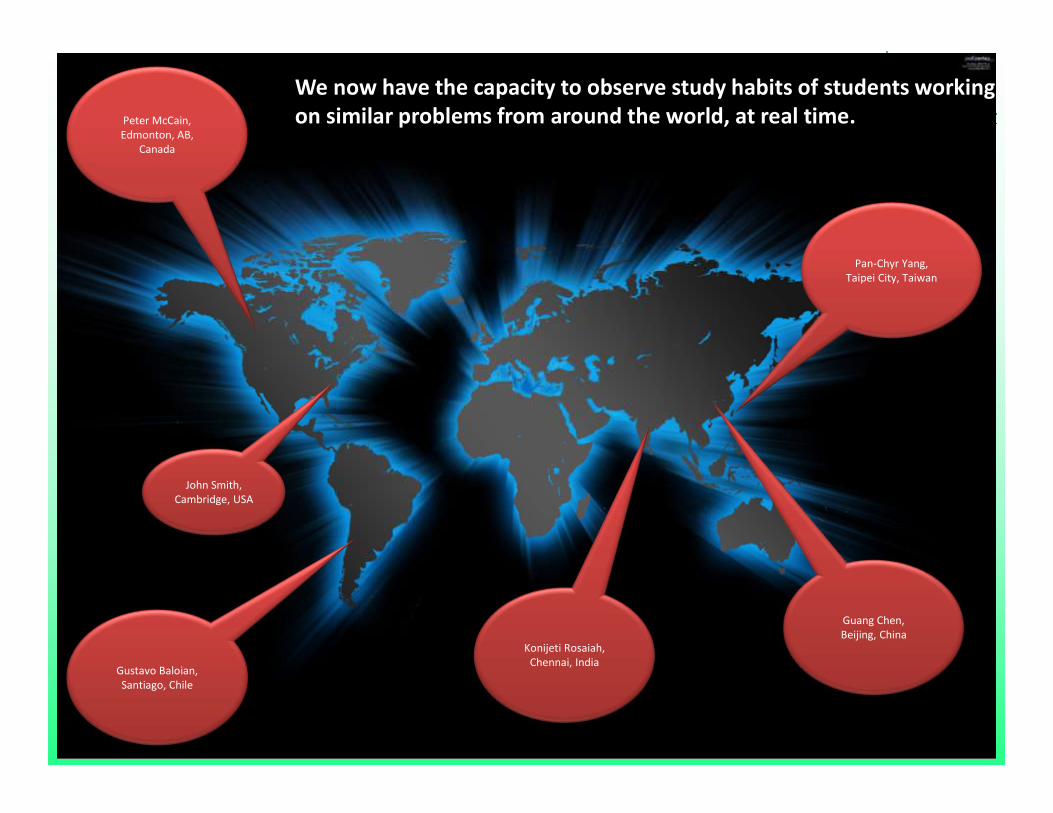
Konijeti Rosaiah, Chennai, India
Guang Chen, Beijing, China
Gustavo Baloian, Santiago, Chile
Peter McCain, Edmonton, AB,
Canada
John Smith, Cambridge, USA
Pan-Chyr Yang, Taipei City, Taiwan
We now have the capacity to observe study habits of students working on similar problems from around the world, at real time.
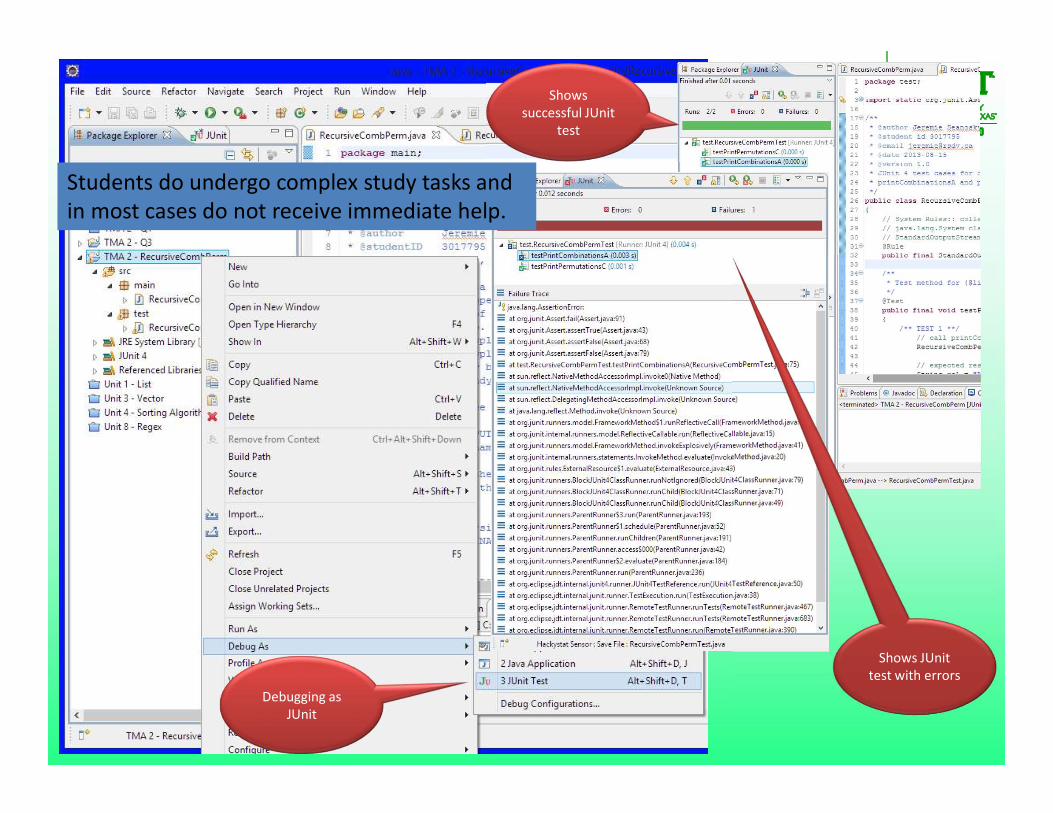
Shows successful JUnit
test
Shows JUnit test with errors
Debugging as JUnit
Students do undergo complex study tasks and in most cases do not receive immediate help.
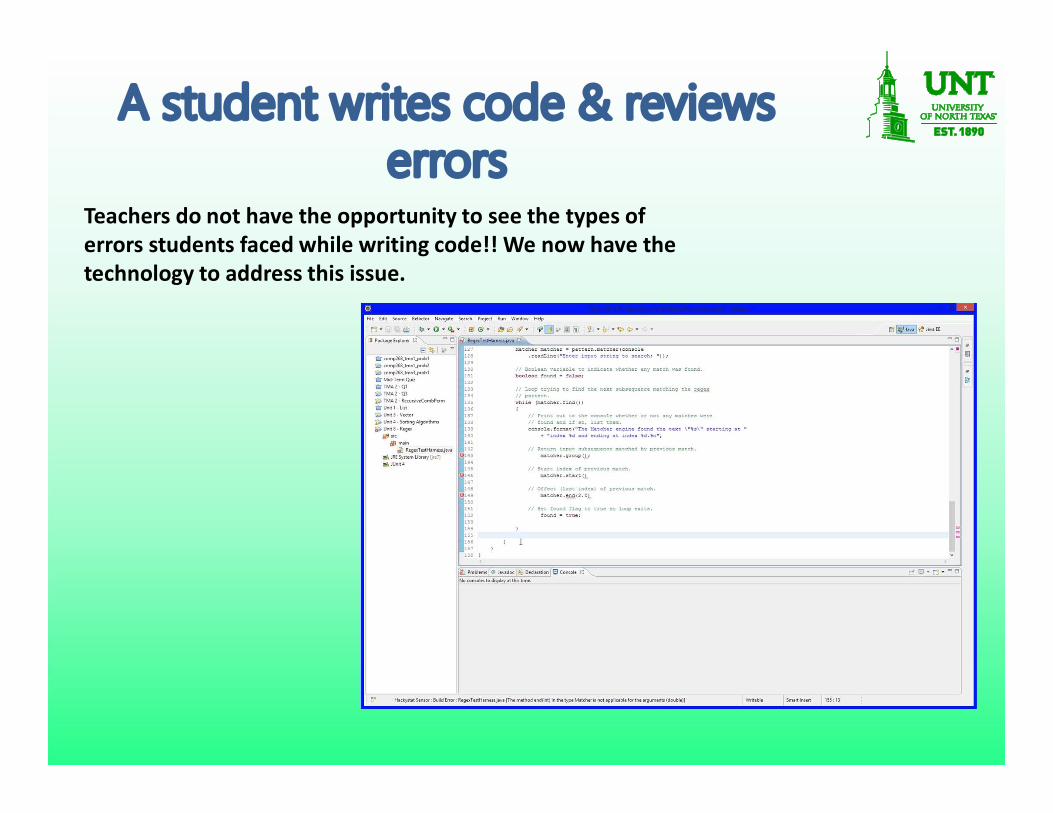
A student writes code & reviews errors
Teachers do not have the opportunity to see the types of errors students faced while writing code!! We now have the technology to address this issue.
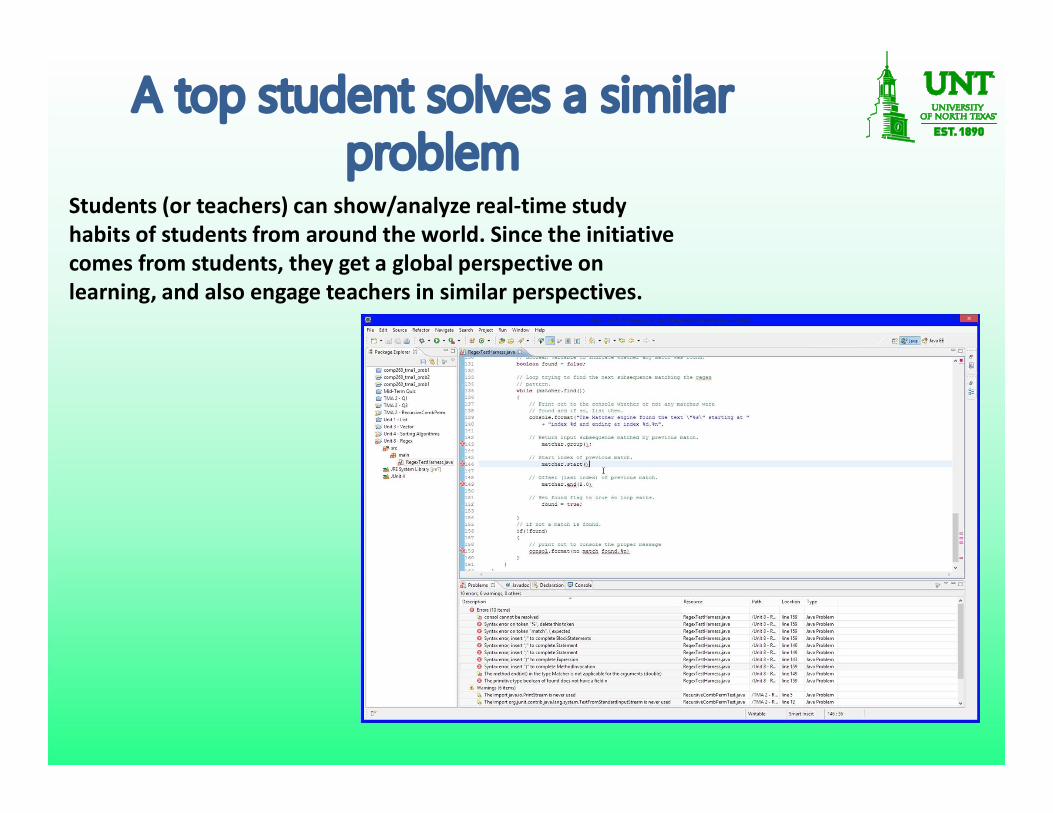
A top student solves a similar problem
Students (or teachers) can show/analyze real-time study habits of students from around the world. Since the initiative comes from students, they get a global perspective on learning, and also engage teachers in similar perspectives.
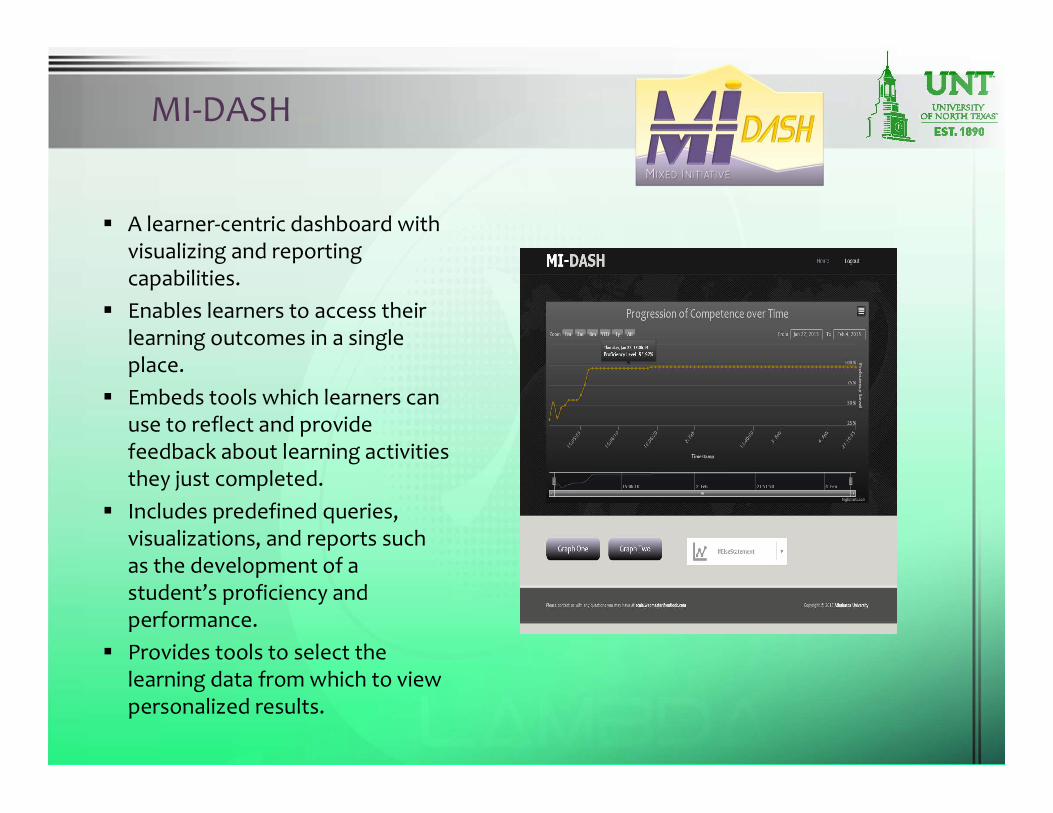
A learner-centric dashboard with visualizing and reporting capabilities.
Enables learners to access their learning outcomes in a single place.
Embeds tools which learners can use to reflect and provide feedback about learning activities they just completed.
Includes predefined queries, visualizations, and reports such as the development of a student’s proficiency and performance.
Provides tools to select the learning data from which to view personalized results.
MI-DASH
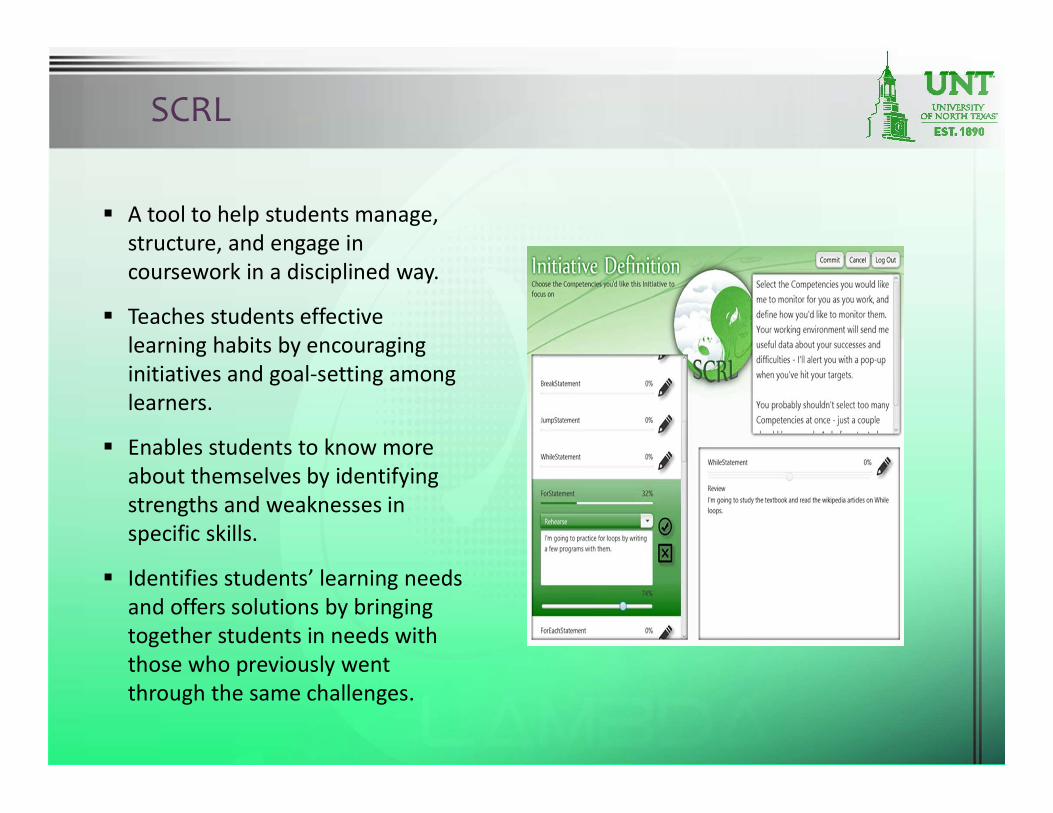
A tool to help students manage, structure, and engage in coursework in a disciplined way.
Teaches students effective learning habits by encouraging initiatives and goal-setting among learners.
Enables students to know more about themselves by identifying strengths and weaknesses in specific skills.
Identifies students’ learning needs and offers solutions by bringing together students in needs with those who previously went through the same challenges.
SCRL
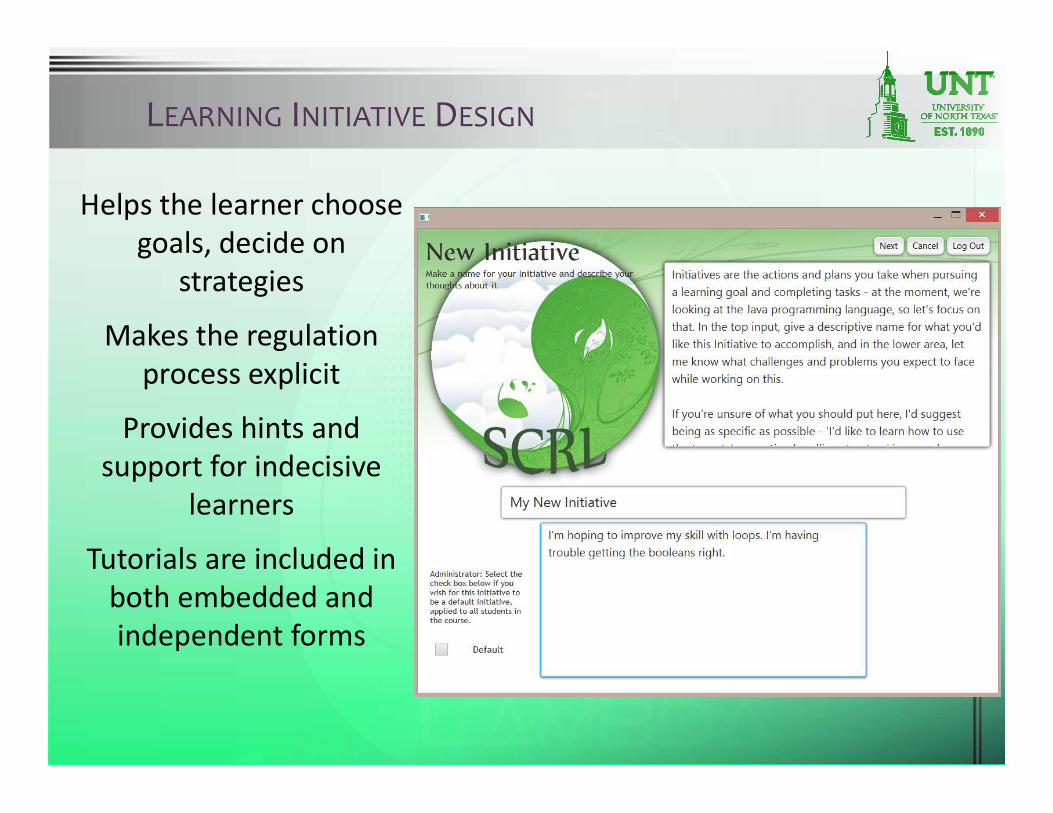
LEARNING INITIATIVE DESIGN
Helps the learner choose goals, decide on
strategies
Makes the regulation process explicit
Provides hints and support for indecisive
learners
Tutorials are included in both embedded and independent forms
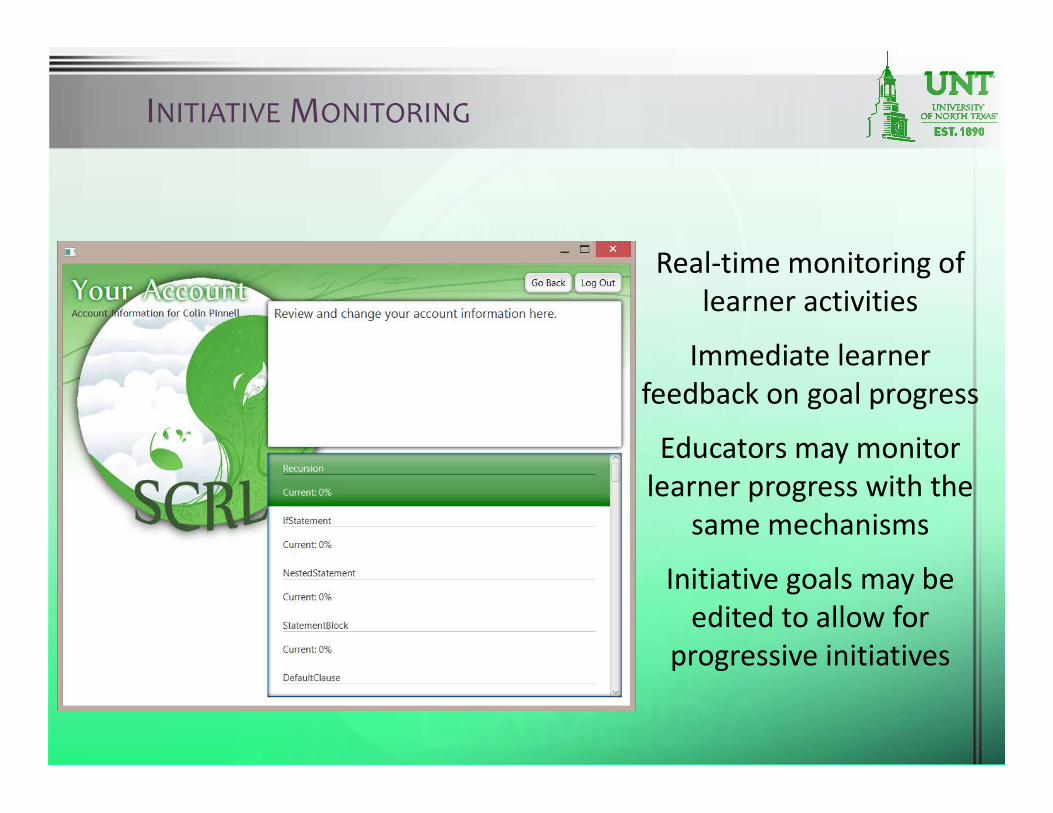
INITIATIVE MONITORING
Real-time monitoring of learner activities
Immediate learner feedback on goal progress
Educators may monitor learner progress with the
same mechanisms
Initiative goals may be edited to allow for
progressive initiatives
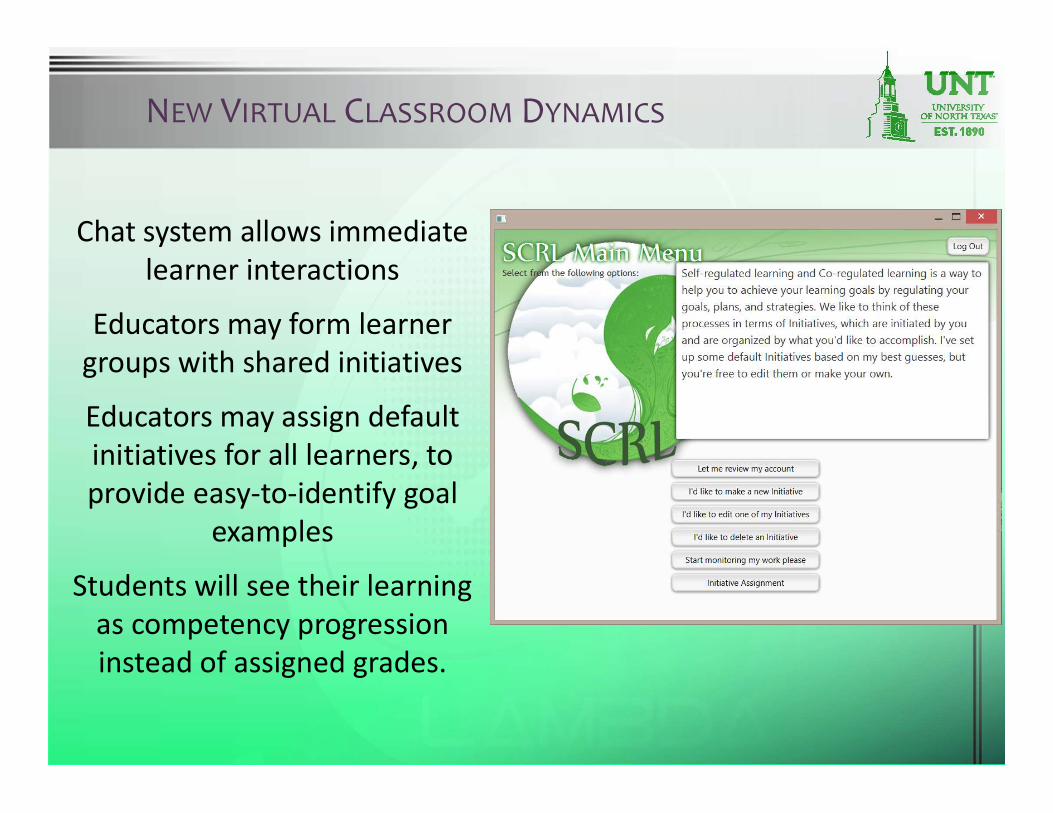
NEW VIRTUAL CLASSROOM DYNAMICS
Chat system allows immediate learner interactions
Educators may form learner groups with shared initiatives
Educators may assign default initiatives for all learners, to provide easy-to-identify goal
examples
Students will see their learning as competency progression instead of assigned grades.
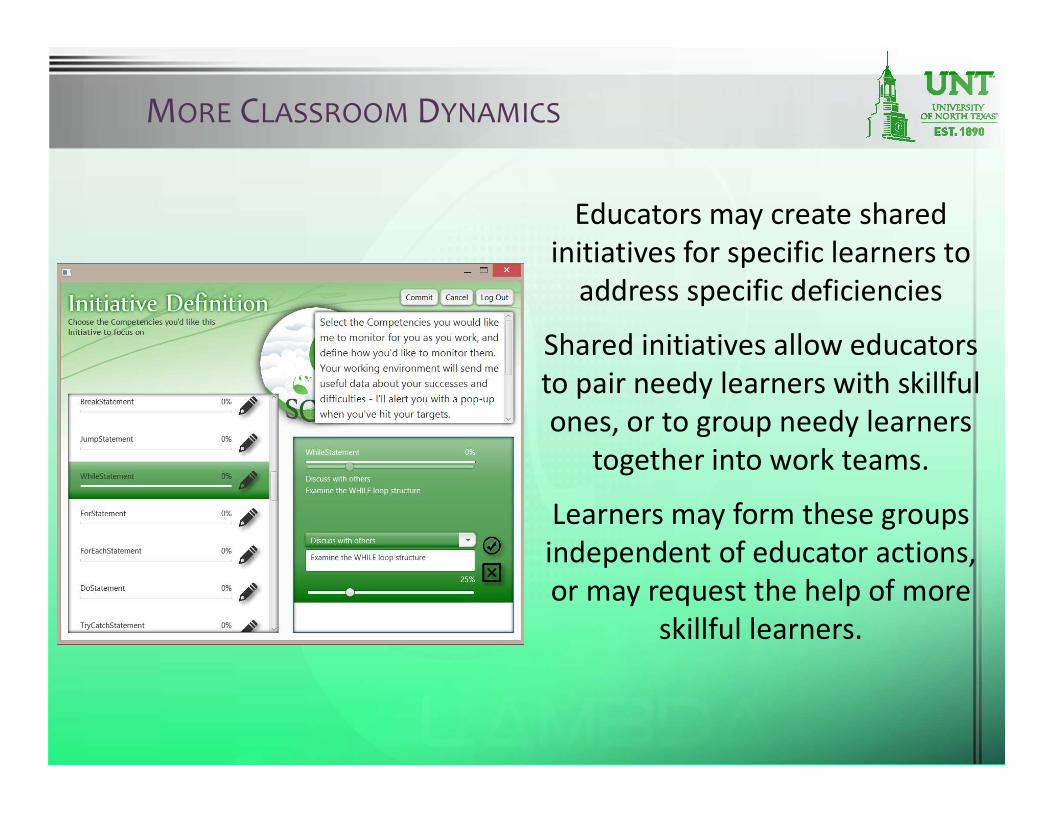
MORE CLASSROOM DYNAMICS
Educators may create shared initiatives for specific learners to
address specific deficiencies
Shared initiatives allow educators to pair needy learners with skillful ones, or to group needy learners
together into work teams.
Learners may form these groups independent of educator actions, or may request the help of more
skillful learners.
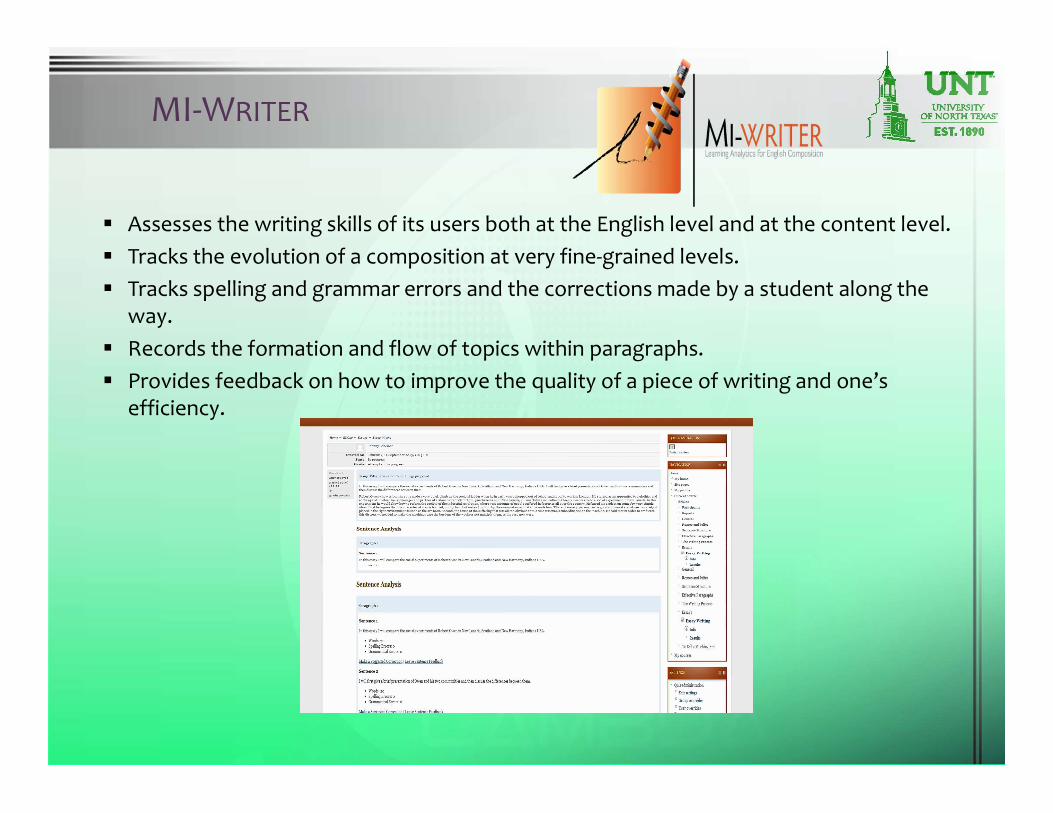
Assesses the writing skills of its users both at the English level and at the content level. Tracks the evolution of a composition at very fine-grained levels. Tracks spelling and grammar errors and the corrections made by a student along the
way. Records the formation and flow of topics within paragraphs. Provides feedback on how to improve the quality of a piece of writing and one’s
efficiency.
MI-WRITER
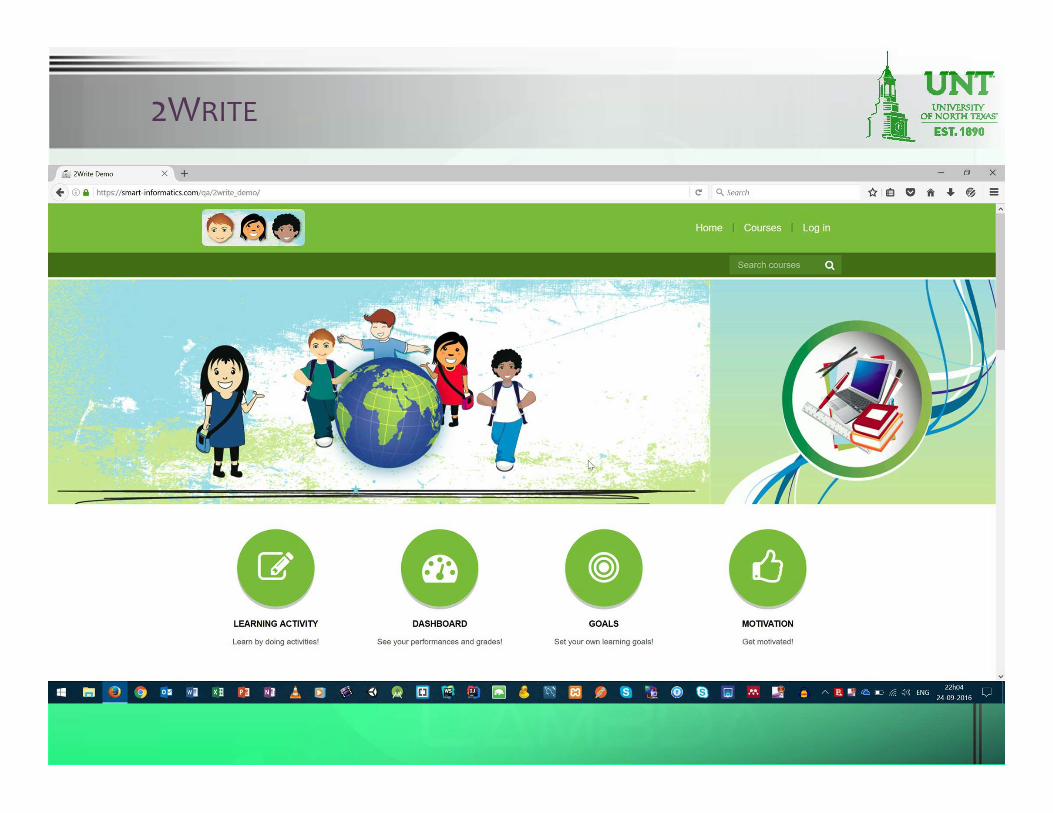
2WRITE
MUSIX stands for MUSIc eXperiences. MUSIX enables learners and teachers to reflect and regulate on music-oriented data
and instruction.
MUSIX
MUSIX
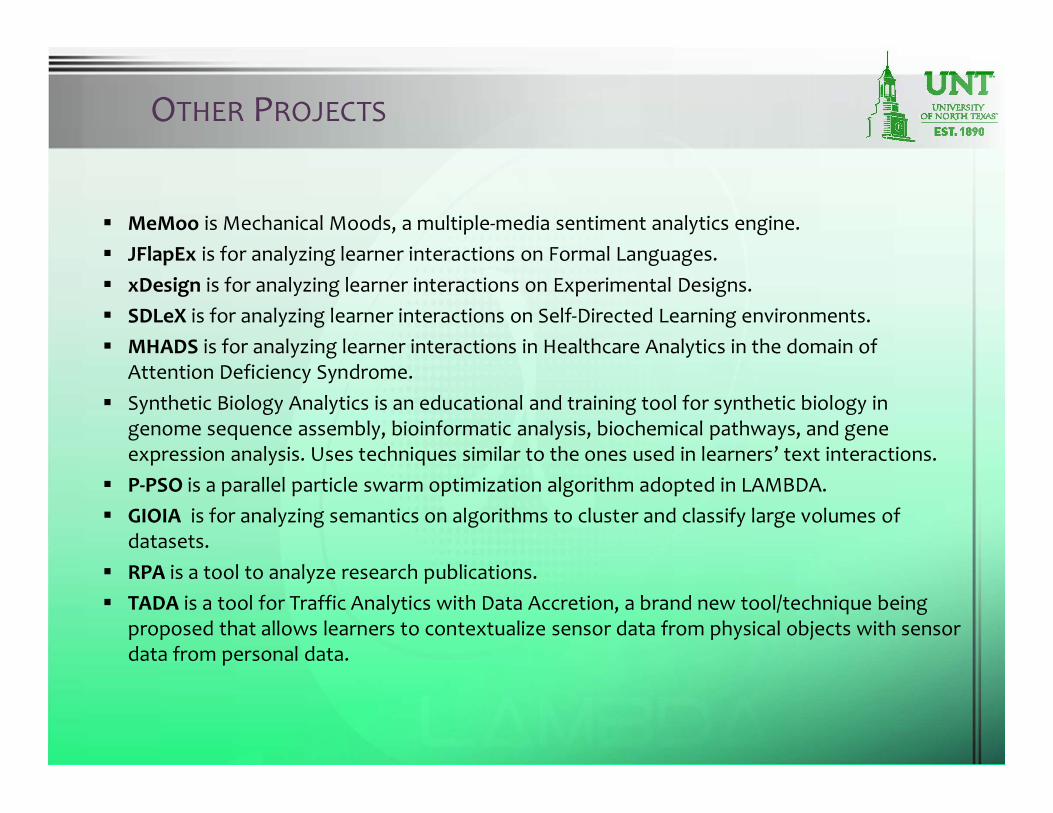
MeMoo is Mechanical Moods, a multiple-media sentiment analytics engine. JFlapEx is for analyzing learner interactions on Formal Languages. xDesign is for analyzing learner interactions on Experimental Designs. SDLeX is for analyzing learner interactions on Self-Directed Learning environments. MHADS is for analyzing learner interactions in Healthcare Analytics in the domain of
Attention Deficiency Syndrome. Synthetic Biology Analytics is an educational and training tool for synthetic biology in
genome sequence assembly, bioinformatic analysis, biochemical pathways, and gene expression analysis. Uses techniques similar to the ones used in learners’ text interactions.
P-PSO is a parallel particle swarm optimization algorithm adopted in LAMBDA. GIOIA is for analyzing semantics on algorithms to cluster and classify large volumes of
datasets. RPA is a tool to analyze research publications. TADA is a tool for Traffic Analytics with Data Accretion, a brand new tool/technique being
proposed that allows learners to contextualize sensor data from physical objects with sensor data from personal data.
OTHER PROJECTS
Interview Mastery Analytics is a system that simulates an online interview environment, conducts a simulated interview, observes the response of the candidate, offers feedback, and allows reflection/regulation opportunities to the candidate.
ListenEx is an environment where learners can listen to utterances and respond to follow-up questions to measure their level of listening comprehension. Moreover, the system measures the time intervals between the question and the answer, as well as, the quality of responses.
MUSIX is a tool to explore and research ways to enhance the experiences of musicians by means of technology.
ReadEx is a reading analytics tool tracking the ability of the learner to read and understand the content, the speed with which reading comprehension happens, and the relation between reading comprehension and working memory.
SpeakEx is a speaking analytics tool that parses translated written material arising from speech utterances and presents a scaffolded dashboard to provide feedback, reflection, and regulation opportunities to learners. The types of feedback include grammar-based feedback, feedback on the pacing of the speech, feedback on the breaks in speech, and identification of misspoken words.
OTHER PROJECTS (CONTINUED)
Learner awareness
Personalization of learning experience throughdynamic learner modeling
• Performance
• Meta-cognitive skills
• Cognitive skills
• Learning styles
• Affective state
• Physiological symptoms
Technology awareness
Personalization of learning experience through theidentification of technological functionality
• Identifying various device functionality
• Dynamically optimize the content to suit thefunctionality
Display capability, Audio and video capability, Multi-language capability, Memory, Bandwidth,
Operation platform
Slide 43
Location awareness
Personalization of learning experience through theuse of location modeling
• Location based optimal grouping
• Location based adaptation of learningcontent
Slide 44
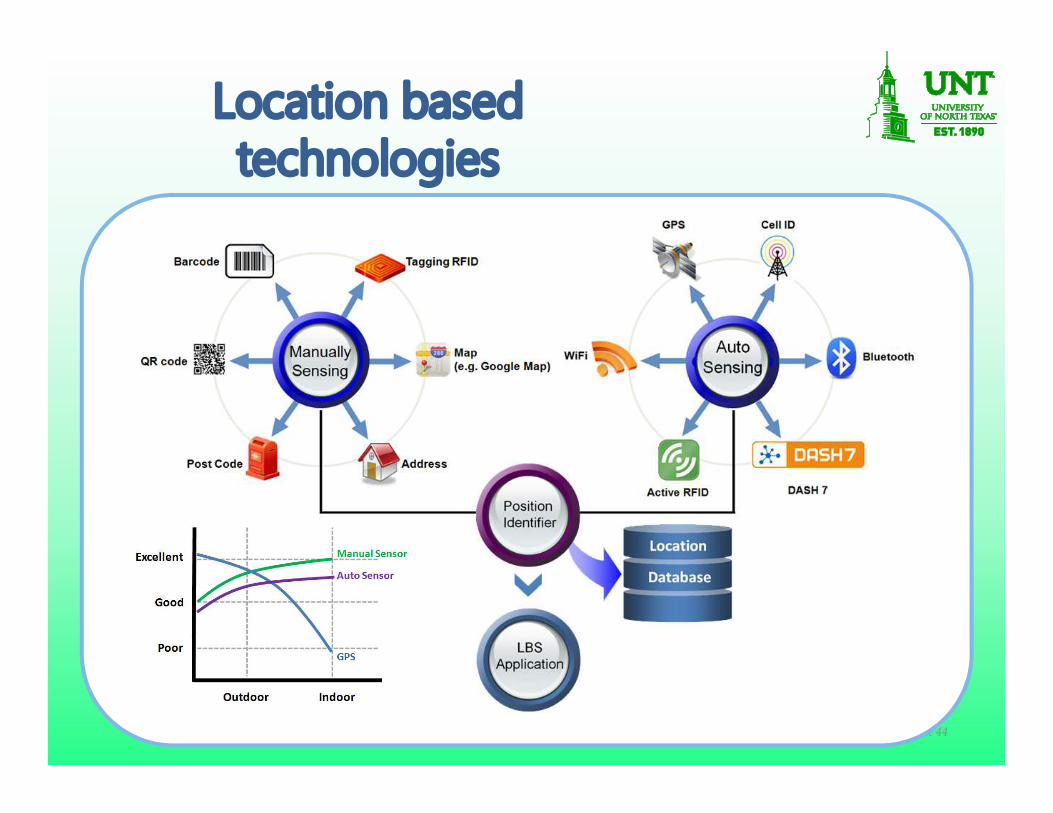
Location based technologies
Slide 45
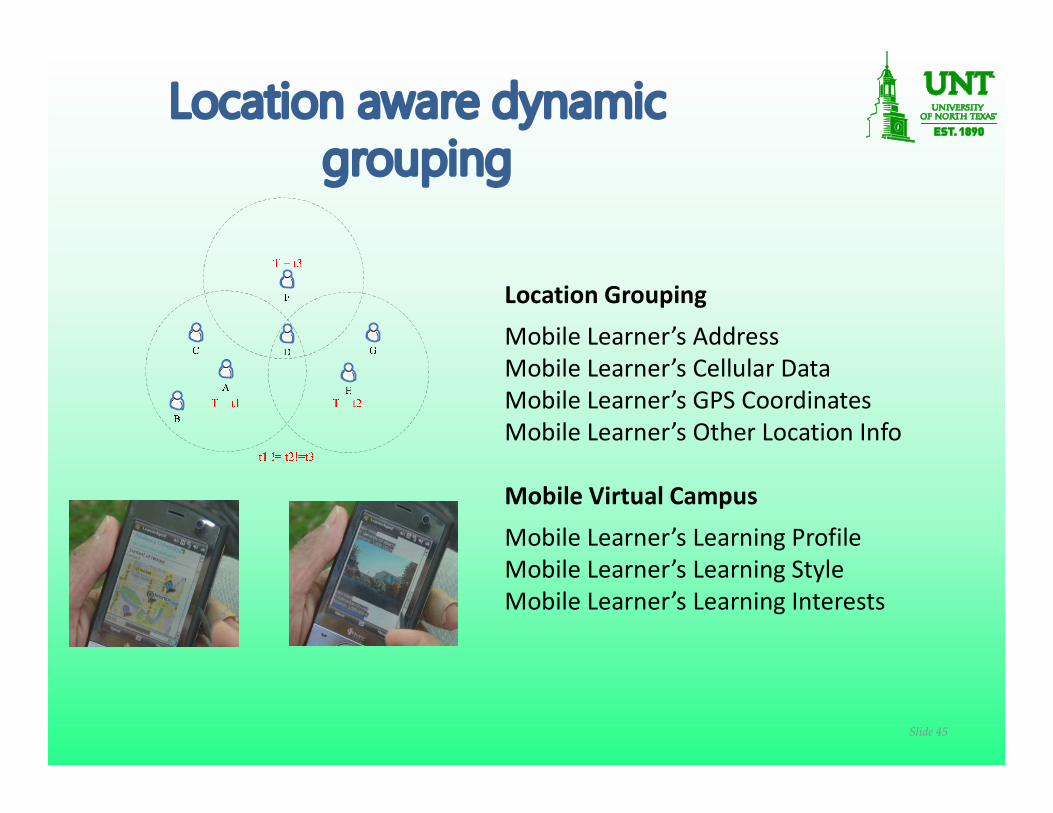
Location Grouping
Mobile Learner’s AddressMobile Learner’s Cellular DataMobile Learner’s GPS CoordinatesMobile Learner’s Other Location Info
Mobile Virtual Campus
Mobile Learner’s Learning ProfileMobile Learner’s Learning StyleMobile Learner’s Learning Interests
Location aware dynamic grouping
Slide 46
Real-life physical objects
Personalization of learning experience as persurrounding environment
Public databases of POIs
QR CodesWi-Fi & Bluetooth Access Point identification
Active and Passive RFIDs
Surrounding awareness
Personalization of learning experience through theuse of surrounding context
• Identifying specific context-aware knowledgestructure among different domains
• Identify the learning objective(s) that the learneris really interested in
• Propose learning activities to the learner
• Lead the learner around the learningenvironment
Slide 47
Skills and knowledge level detection
Competency levelConfidence level
Slide 48
Slide 49
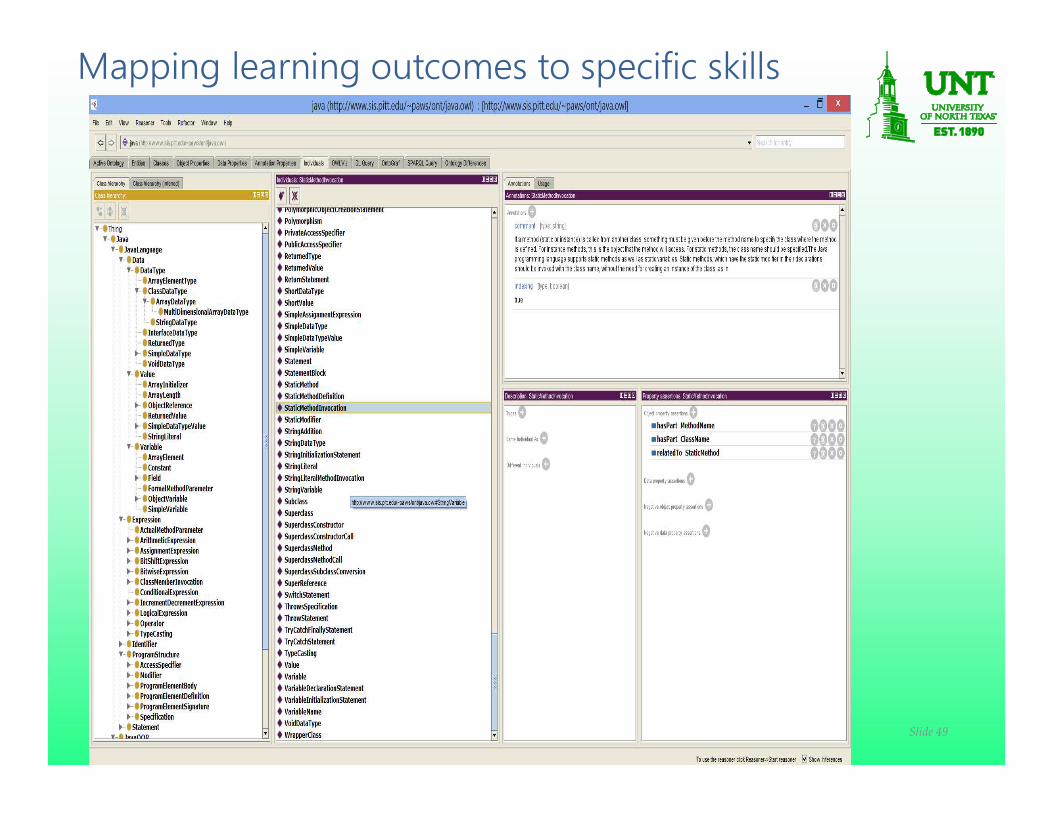
Mapping learning outcomes to specific skills
Slide 50
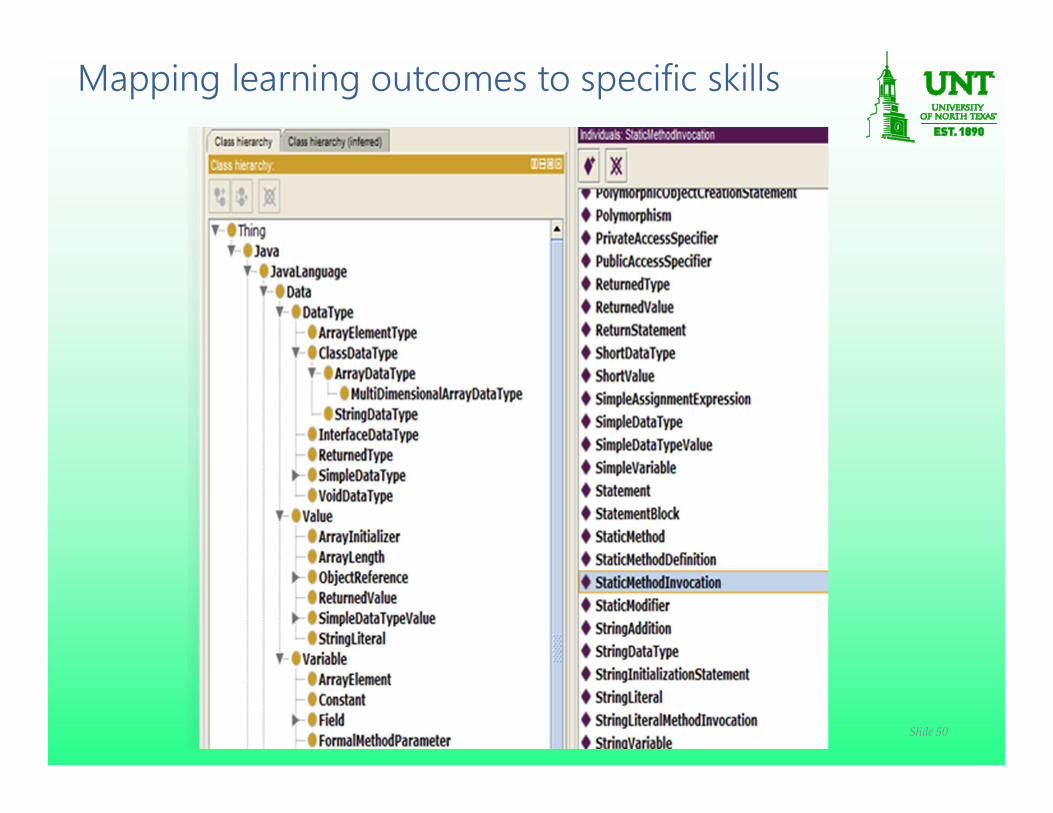
Mapping learning outcomes to specific skills
Slide 51
0.97
0.27
0.90
0.630.50
0.850.71 0.660.66
0.23
0.540.67 0.59
0.860.74
0.17
0.84
0.050.18 0.23 0.30
0.830.59
0.100.000.200.400.600.801.001.20
Skill History
AbstractModifier
AccessSpecifier
ArithmeticAssignmentExpression
0.000.200.400.600.801.001.20
Abst
ract
Clas
s
Abst
ract
Clas
sDef
ini…
Abst
ract
Met
hod
Abst
ract
Met
hodD
e…
Abst
ract
Mod
ifier
Acce
ssSp
ecifi
er
Arith
met
icAs
sign
m…
Arith
met
icEx
pres
sion
Arra
yCre
atio
nSta
te…
Arra
yDat
aTyp
e
Arra
yEle
men
t
Arra
yEle
men
tTyp
e
Arra
yIni
tializ
atio
nS…
Arra
yIni
tializ
er
Arra
yLen
gth
Arra
yVar
iabl
e
Assi
gnm
entE
xpre
ss…
Auto
Boxi
ng
Bool
eanV
alue
DevEvent54%
CodeIssue5%
CheckStyle10%FindBugs
4%
Emma2%
Junit7%
Ant17%
NCSS1%
Student skills using toolsStudent Profile
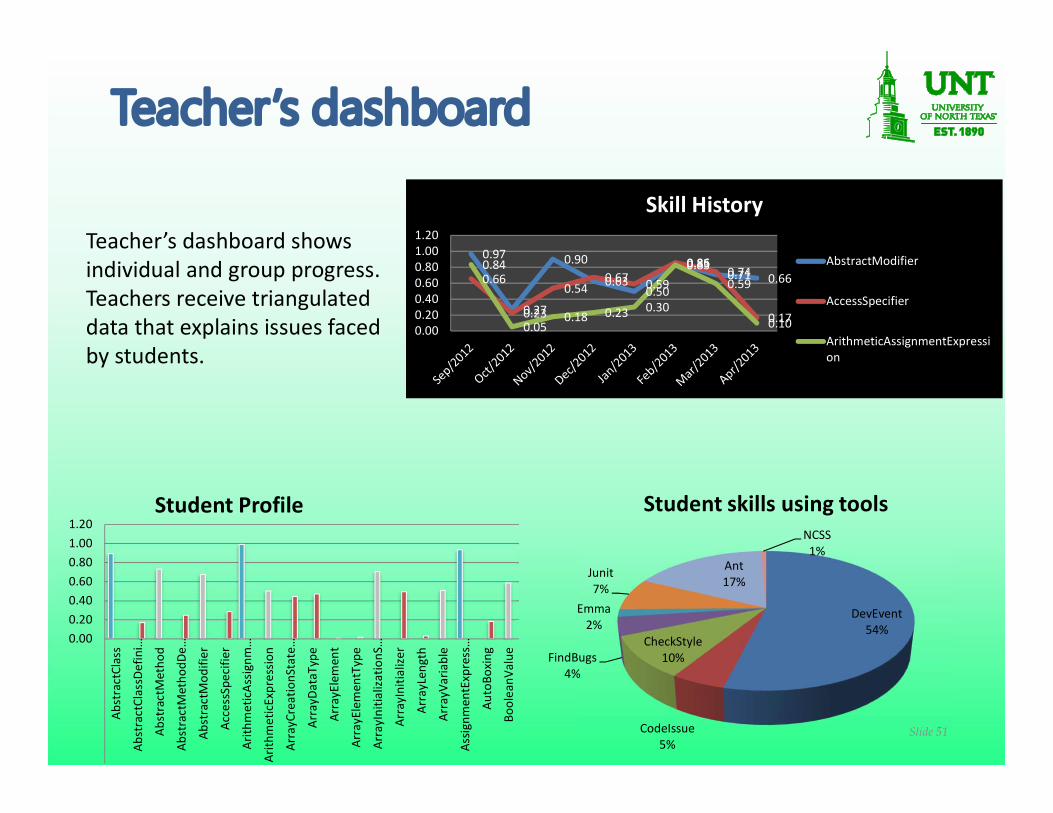
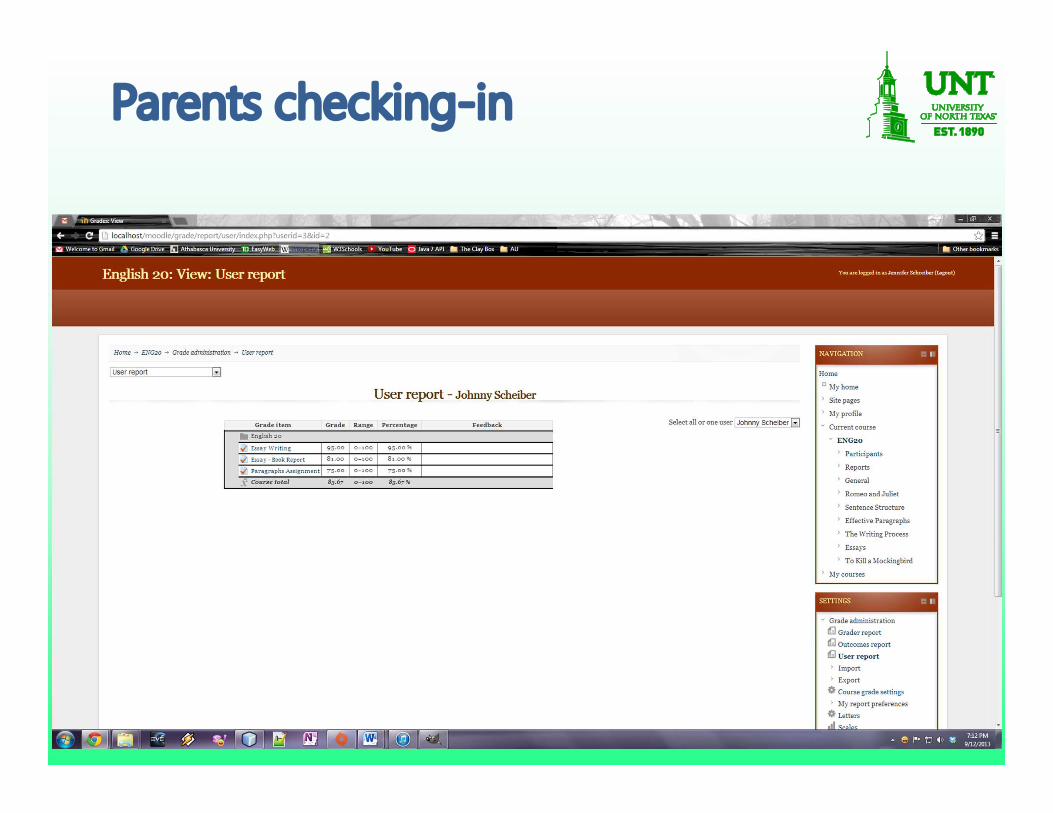
Teacher’s dashboard
Teacher’s dashboard shows individual and group progress. Teachers receive triangulated data that explains issues faced by students.
Slide 52
Parents checking-in
Slide 53
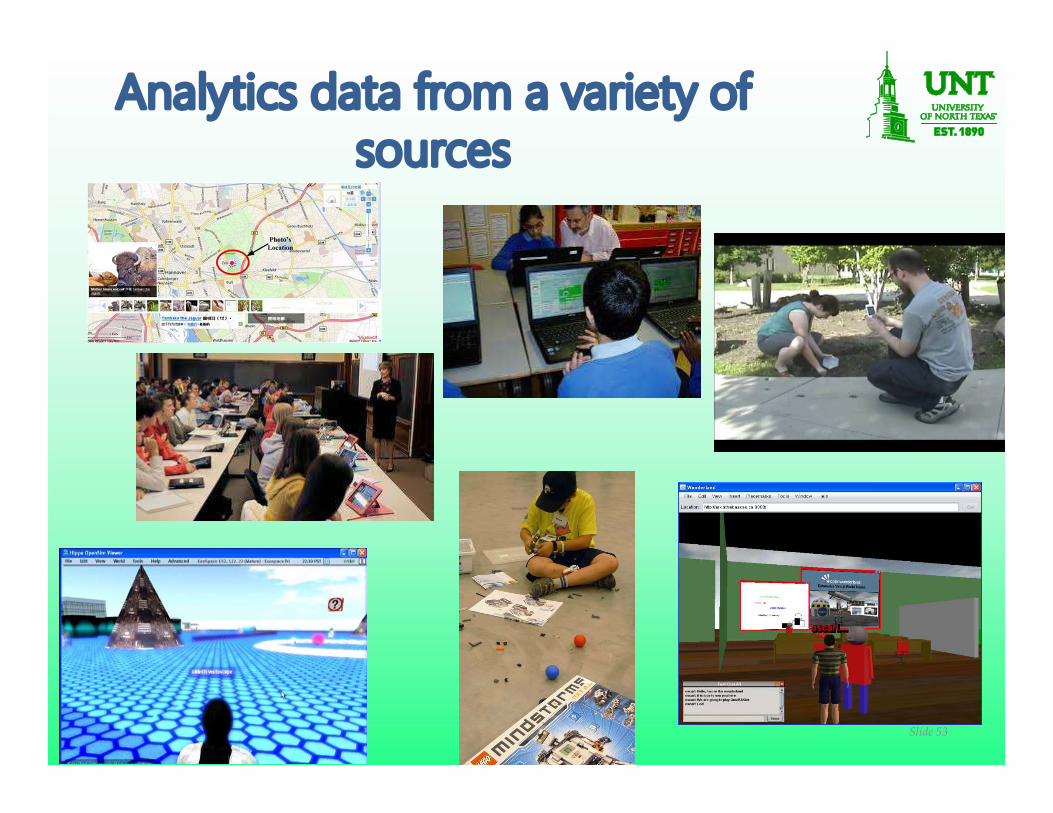
Analytics data from a variety of sources
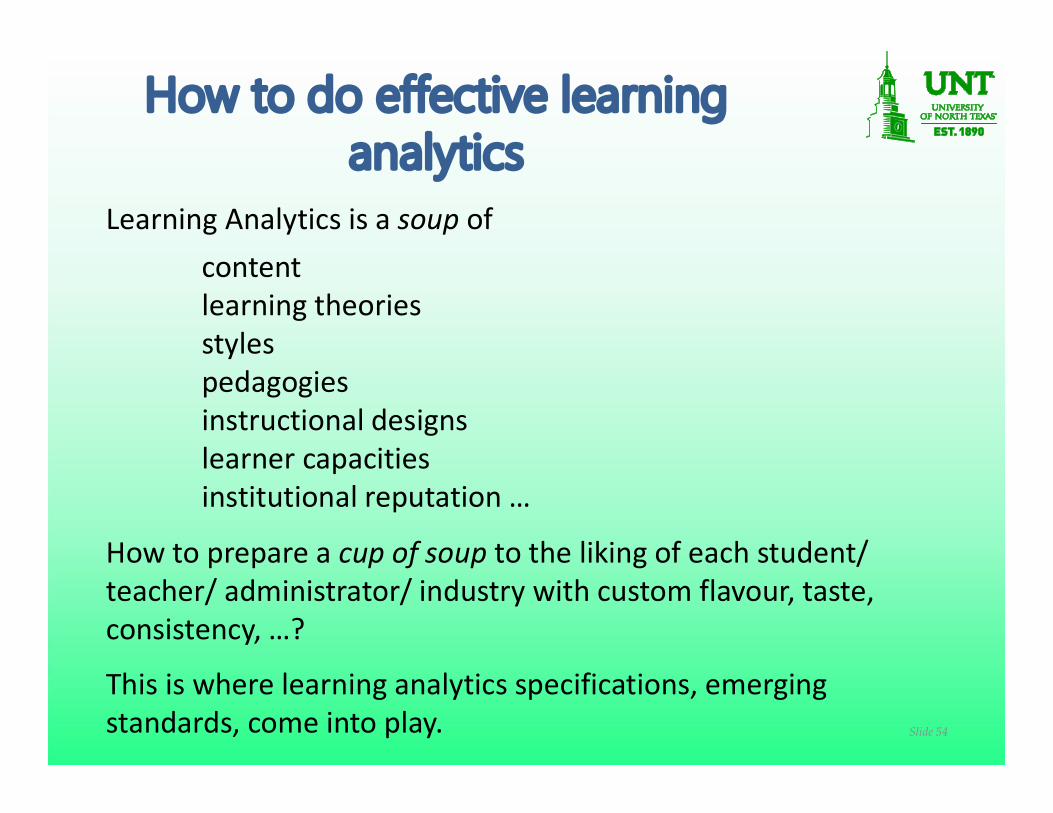
How to do effective learning analytics
Learning Analytics is a soup of contentlearning theoriesstylespedagogiesinstructional designslearner capacitiesinstitutional reputation …
How to prepare a cup of soup to the liking of each student/ teacher/ administrator/ industry with custom flavour, taste, consistency, …?
This is where learning analytics specifications, emerging standards, come into play. Slide 54
Slide 55
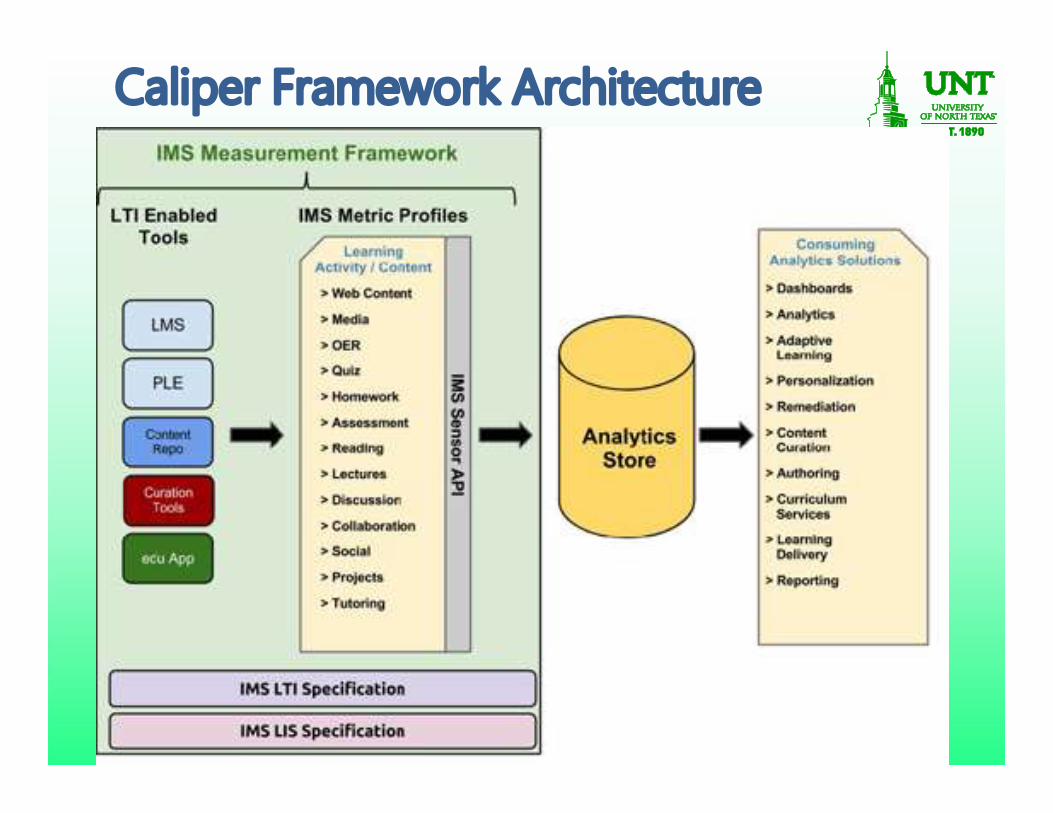
Caliper Framework Architecture
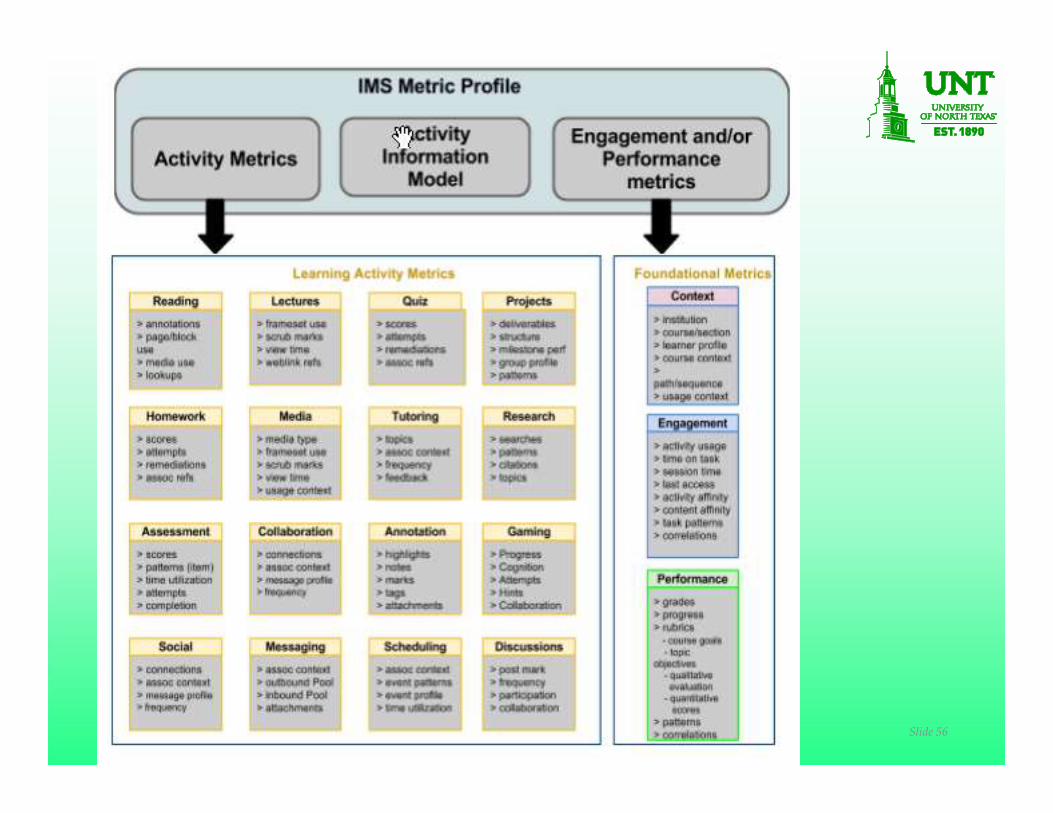
Slide 56
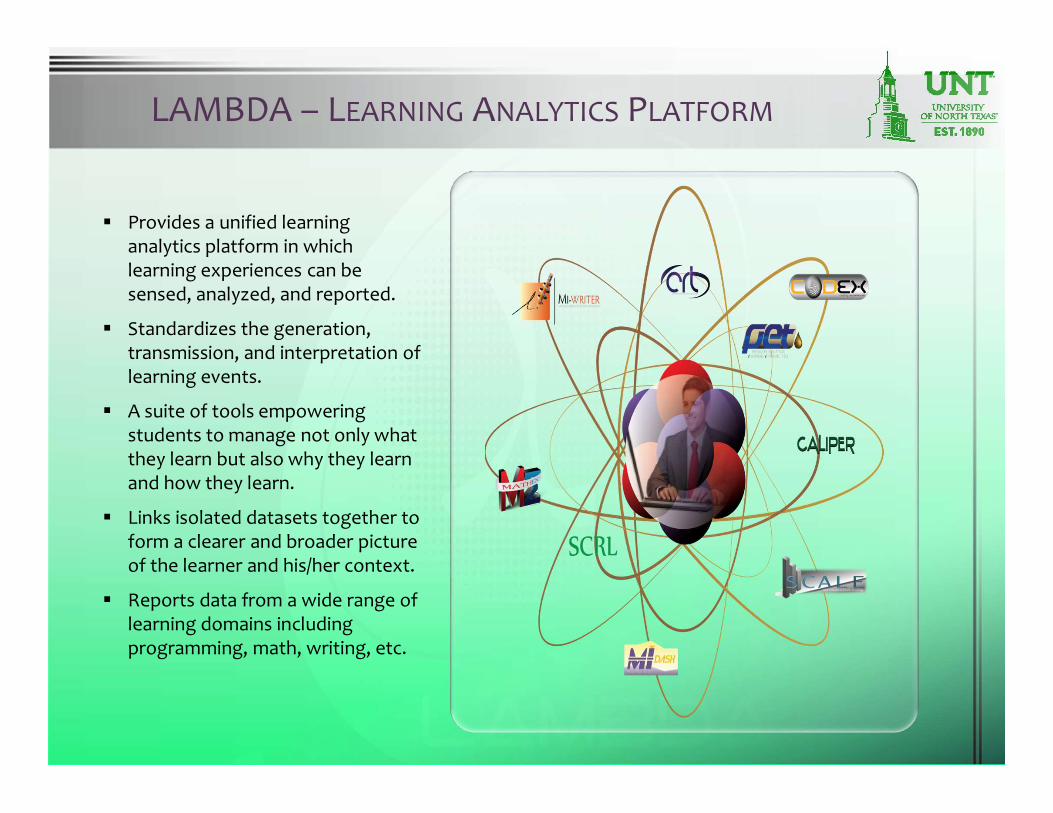
Provides a unified learning analytics platform in which learning experiences can be sensed, analyzed, and reported.
Standardizes the generation, transmission, and interpretation of learning events.
A suite of tools empowering students to manage not only what they learn but also why they learn and how they learn.
Links isolated datasets together to form a clearer and broader picture of the learner and his/her context.
Reports data from a wide range of learning domains including programming, math, writing, etc.
LAMBDA – LEARNING ANALYTICS PLATFORM
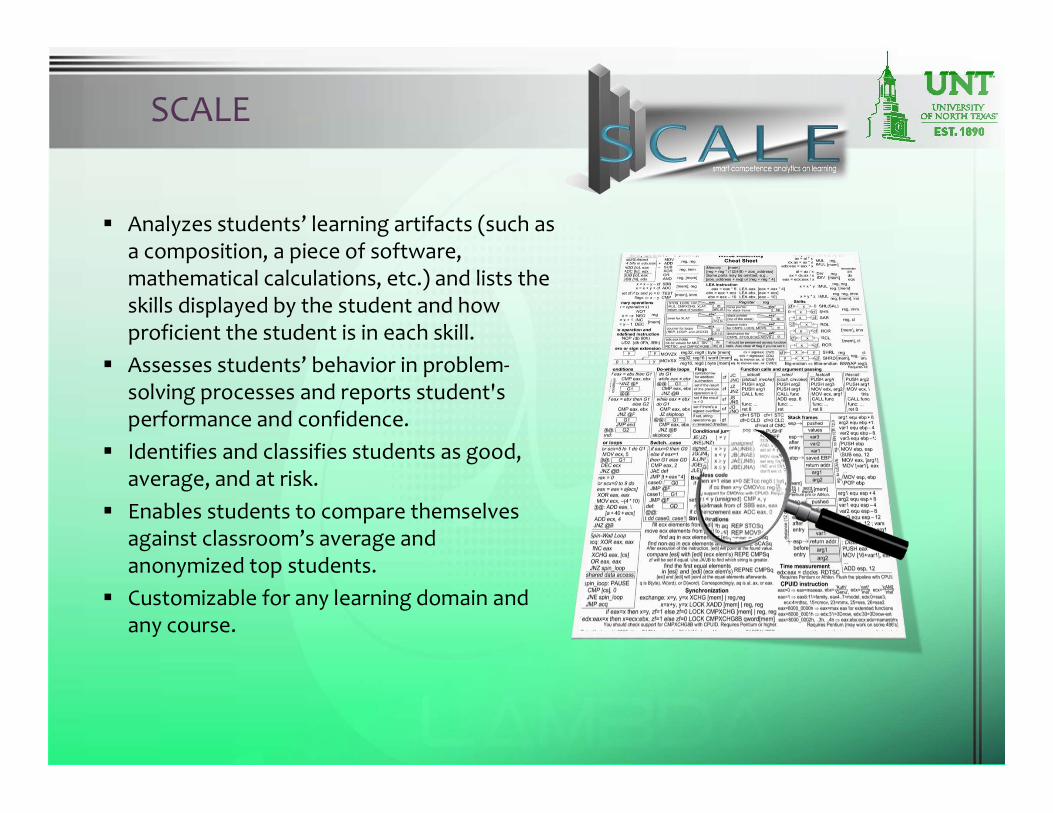
Analyzes students’ learning artifacts (such as a composition, a piece of software, mathematical calculations, etc.) and lists the skills displayed by the student and how proficient the student is in each skill.
Assesses students’ behavior in problem-solving processes and reports student's performance and confidence.
Identifies and classifies students as good, average, and at risk.
Enables students to compare themselves against classroom’s average and anonymized top students.
Customizable for any learning domain and any course.
SCALE
References Learning Measurement for Analytics
(http://www.imsglobal.org/IMSLearningAnalyticsWP.pdf) What is the Tin Can API? (http://tincanapi.com/overview/) What is a Learning Record Store (LRS)?
(http://tincanapi.com/learning-record-store/) Layers of the Tin Can Onion (http://tincanapi.com/the-layers-of-
tin-can/) Learning Tools Interoperability™
(http://www.imsglobal.org/toolsinteroperability2.cfm) IMS Question & Test Interoperability Overview
(http://www.imsglobal.org/question/qtiv2p1/imsqti_oviewv2p1.html)
IMS Global Learning Information Services Specification Primer (http://www.imsglobal.org/lis/lisv2p0p1/LISSpecPrimerv2p0p1.html)
59