IMPROVING CO2 EFFICIENCY FOR RECOVERING OIL IN HETEROGENEOUS RESERVOIRS
120
IMPROVING CO2 EFFICIENCY FOR RECOVERING OIL IN HETEROGENEOUS RESERVOIRS DOE CONTRACT NO. DE-FG26-01BC15364 New Mexico Petroleum Recovery Research Center New Mexico Institute of Mining and Technology 801 Leroy Place Socorro, NM 87801 (505) 835-5142 Report Date: May 17, 2005 Contract Date: September 28, 2001 Completion Date: March 31, 2005 DOE Total Award: $999,997 Program Manager: Reid B. Grigg Principal Investigator: Reid B. Grigg Other Major Contributors: Robert K. Svec Zheng Wen Zeng Baiojun Bai Yi Liu Contracting Officer’s Representative: Paul West Reporting Period: September 28, 2001–March 31, 2005
-
Upload
independent -
Category
Documents
-
view
0 -
download
0
Transcript of IMPROVING CO2 EFFICIENCY FOR RECOVERING OIL IN HETEROGENEOUS RESERVOIRS

IMPROVING CO2 EFFICIENCY FOR RECOVERING OIL IN HETEROGENEOUS RESERVOIRS DOE CONTRACT NO. DE-FG26-01BC15364 New Mexico Petroleum Recovery Research Center New Mexico Institute of Mining and Technology 801 Leroy Place Socorro, NM 87801 (505) 835-5142 Report Date: May 17, 2005 Contract Date: September 28, 2001 Completion Date: March 31, 2005 DOE Total Award: $999,997 Program Manager: Reid B. Grigg Principal Investigator: Reid B. Grigg Other Major Contributors: Robert K. Svec Zheng Wen Zeng Baiojun Bai Yi Liu Contracting Officer’s Representative: Paul West Reporting Period: September 28, 2001–March 31, 2005

ii
DISCLAIMER This report was prepared as an account of work sponsored by an agency of the United States Government. Neither the United States Government nor any agency thereof, nor any of their employees, makes any warranty, express or implied, or assumes any legal liability or responsibility for the accuracy, completeness, or usefulness of any information, apparatus, product, or process disclosed, or represents that its use would not infringe privately owned rights. Reference herein to any specific commercial product, process, or service by trade name, trademark, manufacturer, or otherwise does not necessarily constitute or imply its endorsement, recommendation, or favoring by the United States Government or any agency thereof. The views and opinions of authors expressed herein do not necessarily state or reflect those of the United States Government or any agency thereof.

iii
ABSTRACT
This document is the Final Report for the U.S. Department of Energy under contract No. DE-
FG26-01BC15364, a three-year contract with a no-cost extension entitled: “Improving CO2
Efficiency for Recovering Oil in Heterogeneous Reservoirs.” This research improved our
knowledge and understanding of CO2 flooding and included work in the areas of injectivity and
mobility control. Chapter 1 summarizes a survey performed for all the CO2 injection projects in
the Permian Basin. Chapter 2 covers CO2-brine-reservoir rock interactions that were studied to
better understand injectivity implications. Chapter 3 summarizes work performed to determine
possible injectivity and productivity reduction due to high flow rate in near-wellbore regions, and
Chapter 4 summarizes work in the areas of foam stability, interfacial tension, surfactant
adsorption and desorption, and mobility control. Chapter 5 lists the papers, reports, workshops,
and presentations produced as a result of the research work under this contract.
The work performed under this contract and the results achieved through this research in
the related fields of mobility control and injectivity will improve industry understanding of CO2
flooding mechanisms, with the ultimate goal of economically recovering more of the U.S. oil
reserves. Results include:
• Identification of the extent that various properties affect foaming agent adsorption, i.e.: rock
type, surfactant type, surfactant concentration, co-surfactants, sacrificial agents, brine
salinity, pH, and temperature.
• Understanding of the extent of synergistic effects on adsorption and desorption in dual
chemical systems for five powdered minerals and three rock types.
• Identification of parameters that change injectivity and improve sweep efficiency.
• Identification of causes of injectivity changes: fines migration, permeability changes,
dissolution, precipitation, stress/pressure gradient, phase behavior, flow rate, etc.
• Development of models to predict advancing rates of individual components in mixed
chemical systems with adsorption and desorption kinetic and equilibrium rates, foam
behavior in heterogeneous systems, and injectivity.

iv
TABLE OF CONTENTS
DISCLAIMER ................................................................................................................................ ii ABSTRACT .................................................................................................................................. iii TABLE OF CONTENTS............................................................................................................... iv LIST OF TABLES...........................................................................................................................v LIST OF FIGURES ....................................................................................................................... vi INTRODUCTION ..........................................................................................................................1 EXECUTIVE SUMMARY .............................................................................................................5 EXPERIMENTAL...........................................................................................................................7 RESULTS AND DISCUSSION....................................................................................................27
Chapter 1: State of the Industry in CO2 Injection ....................................................................27
Chapter 2: CO2/Brine/Rock Interaction ...................................................................................29
Chapter 3. Flow Rate and Injectivity .......................................................................................53
Chapter 4. Surfactant Sorption, Stability, and Mobility ..........................................................58
Chapter 5. Technology Transfer ..............................................................................................97
CONCLUSIONS..........................................................................................................................100 ACKNOWLEDGMENTS ...........................................................................................................105 REFERENCES ............................................................................................................................106

v
LIST OF TABLES Table 1. Equations of CLS Standard Curves with Different Salts.................................................17 Table 2. Peak Absorbance of CD Solution at Different CD Concentrations.................................18 Table 3. Equations of CD Standard Curves at Different Concentrations of CLS..........................22 Table 4. Equations of CD Standard Curves at Different Concentrations of CLS (Distilled Water)...............................................................................................................25 Table 5. Brine Compositions Used in the Series of Five Large- Core Floods...............................35 Table 6. Parameters of Dolomite Core ..........................................................................................67 Table 7. Experiment Schedule of CLS Adsorption/Desorption onto Dolomite ............................67 Table 8. Results of Modeling CLS Adsorption onto Dolomite Using a Pseudo-Second-Order Equation .........................................................................................................................................70 Table 9. Results of Modeling CLS Adsorption Kinetics Using A Pseudo-First-Order Equation .72 Table 10. Parameters from Modeling the CLS Adsorption and Desorption Isotherm Using the Langmuir Isotherm Equation .........................................................................................................76 Table 11. Parameters from Modeling CLS Adsorption and Desorption Isotherms onto Dolomite Using the Freundlich Equation ......................................................................................................77 Table 12. Results of Modeling CLS Desorption from Dolomite Using Pseudo-Second-Order Equation .........................................................................................................................................80 Table 13. Pseudo-First-Order Equation used to model CLS Desorption from Dolomite..............81 Table 14 Tests Identifications........................................................................................................92 Table 15. The Results of Tests Exposed to the Light ....................................................................93 Table 16. The Results of Tests in the Dark....................................................................................96

vi
LIST OF FIGURES Fig. 1. The coreflooding apparatus is set up for alternate or co-injection of two fluids. The effluent can be sampled under ambient or system (installed for last two experiments) conditions.........................................................................................................................................8 Fig. 2. Experimental system.............................................................................................................9 Fig. 3. Triaxial core holder. .............................................................................................................9 Fig. 4. Illustration of needle and drop............................................................................................11 Fig. 5. Harkins-Brown correction factor for drop-weight method (after Adamson). ....................11 Fig. 6. Foam stability apparatus setup. ..........................................................................................12 Fig. 7. CO2 foam stability high pressure observation cell..............................................................12 Fig. 8. Circulation schematic for sorption tests. ............................................................................13 Fig. 9. Flow-through schematic for sorption tests. ........................................................................13 Fig. 10. Static schematic diagram for sorption tests. .....................................................................14 Fig. 11. CLS standard curve at 283 nm (2% brine). ......................................................................16 Fig. 12. Effect of salt on CLS absorbance at 283 nm. ...................................................................17 Fig. 13. Effect of pH on CLS absorbance at the wavelength of 283 nm. ......................................17 Fig. 14. Standard curve of CD at 295 nm. .....................................................................................19 Fig. 15. Standard curve of CD at 523 nm. .....................................................................................19 Fig. 16. Absorbance of 100mg/l CD prepared with different brine...............................................20 Fig. 17. Absorbance of 200 mg/l CD prepared with different brine..............................................20 Fig. 18. Effect of pH on CD absorbance at wavelength of 520 nm...............................................21 Fig. 19. Effect of CD on CLS absorbance at 283 nm. ...................................................................22 Fig. 20. CD standard curve at different concentration of CLS. .....................................................22 Fig. 21. The relationship between CLS concentration and slope of fit equations. ........................23

vii
Fig. 22. The relationship of CLS concentration and intercept of fit equations..............................24 Fig. 23. Standard curve of CD at different concentration CLS (distilled water). ..........................25 Fig. 24. Calculation of slope and intercept at different CLS. ........................................................26 Fig. 25. Post-WAG Indiana limestone dissolution channel extends from inlet face into first half of core length (~ 25 cm). ...................................................35 Fig. 26. Second half of the core did not have a solution channel (last ~ 25 cm). Final permeability of unchannelled core, k=19.5 mD. Initial perm in this same region before WAG ~ 36 mD. ...............................................................36 Fig. 27. Limestone permeabilities..................................................................................................36 Fig. 28. Pre-flood dolomite, Seminole San Andres, Gaines County TX. Vuggy anhydritic, very fine grain-dominated packstone, anhydrite nodules, and stylolites. ......................................37 Fig. 29. Post waterflood sectioned core after brine flood showing anhydrite dissolution.............37 Fig. 30. Post-WAG Seminole San Andres core showing dolomite dissolution with additional anhydrite dissolution......................................................................................................................38 Fig. 31. Measured and calculated porosity and permeability during the flooding of San Andres dolomite. ........................................................................................................................................38 Fig. 32 Pre-flood limestone core....................................................................................................39 Fig. 33. Post-flood limestone core sectioned. ................................................................................40 Fig. 34. End view of Segment A inlet............................................................................................40 Fig. 35. Permeability results limestone (Coreflood C). .................................................................40 Fig. 36. Cross-section composition for manganese and strontium along the length of both core segments in Coreflood C................................................................................................................41 Fig. 37. BSE Quantitative analysis [% as carbonate] for calcium, magnesium, manganese, and strontium. .......................................................................................................................................41 Fig. 38. BSE Quantitative analysis [% as carbonate] for calcium, magnesium, manganese, and strontium. .......................................................................................................................................42 Fig. 39. Three limestone core segments after the first flooding period. ........................................45

viii
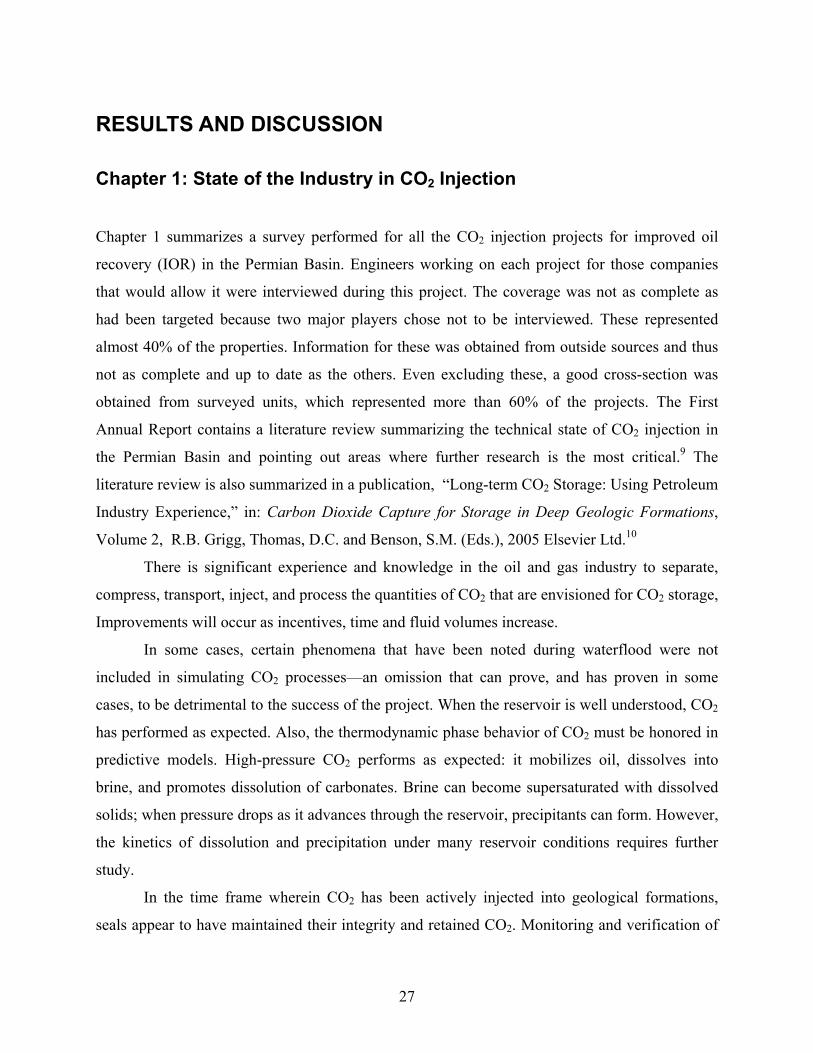
Fig. 40. First segment inlet after each flooding period (limestone Coreflood D)..........................45 Fig. 41. CT cross section images at ~6 cm from the end of the original limestone Segment A inlet. Pre-flood (IL), after the first flooding period (IIL), and post-flood (IIIL) (limestone Coreflood D). ................................................................................................................................45 Fig. 42. CT longitudinal sections of core after first flooding period with the corresponding cross sections (Fig. 18 marked (limestone Coreflood D).......................................................................46 Fig. 43. Bromide diffusivity and alkalinity results (limestone Coreflood D). ...............................46 Fig. 44. Manganese concentration in the effluent (limestone Coreflood D). ................................47 Fig. 45. Calcium concentration in the effluent (limestone Coreflood D). .....................................47 Fig. 46. Magnesium concentration in the effluent (limestone Coreflood D).................................47 Fig. 47. Three dolomite core segments after the first flooding period (Coreflood E). ..................48 Fig. 48. Inlet of first segment after each flooding period (dolomite Coreflood E).......................48 Fig. 49. CT cross section images at ~6 cm from the end of the original dolomite Segment A inlet. Pre-flood (ID), after the first flooding period (IID), and post-flood (IIID) (Coreflood E)............48 Fig. 50. Dolomite core segment porosity and permeability trends (dolomite Coreflood E). ........48 Fig. 51. CT longitudinal sections of core after first flooding period with the corresponding cross section (Fig. 26) marked (dolomite Coreflood E)..........................................................................49 Fig. 52. Bromide diffusivity and alkalinity results (dolomite Coreflood E).................................49 Fig. 53. Manganese concentration in the effluent (dolomite Coreflood E). .................................50 Fig. 54. Calcium concentration in the effluent (dolomite Coreflood E). .......................................50 Fig. 55. Magnesium concentration in the effluent (dolomite Coreflood E)...................................50 Fig. 56. Fluid Mn production versus PV injected brine for dolomite. ..........................................51 Fig. 57. Fluid Ca production versus PV injected brine for dolomite.............................................51 Fig. 58. Fluid Mg production versus PV injected brine for dolomite............................................52 Fig. 59. Example of dolomite core samples from a high permeability zone about 100 feet from the injection well after several years of WAG...............................................................................52
ix
Fig. 60. Kinetics of CLS adsorption onto dolomite. ......................................................................69 Fig. 61. CLS adsorption kinetics model on dolomite using a pseudo-second-order equation.......70 Fig. 62. Modeling CLS adsorption onto dolomite using a pseudo-first-order equation. ...............72 Fig. 63. Dolomite results of CLS adsorption kinetics fit to pseudo-first-order equations.............73 Fig. 64. The fit result of CLS adsorption kinetics onto dolomite using a diffusion model. ..........73 Fig. 65. CLS adsorption and desorption isotherm onto dolomite at 45 ºC. ...................................74 Fig. 66. Concentration change and loss due to adsorption. ...........................................................75 Fig. 67. Modeling CLS adsorption and desorption isotherms onto dolomite using the Langmuir equation..........................................................................................................................................75 Fig. 68. Modeling CLS adsorption and desorption isotherms using the Freundlich equation.......76 Fig. 69. Effect of temperature on CLS adsorption onto dolomite. ................................................77 Fig. 70. Effect of salt type and concentration on CLS adsorption onto dolomite..........................78 Fig. 71. Adsorption change with time during the desorption process. ..........................................79 Fig. 72. The pseudo-second-order model to fit CLS desorption from dolomite............................80 Fig. 73. Pseudo-first-order model to fit CLS desorption from dolomite. ......................................81 Fig. 74. Diffusion model to fit CLS desorption from dolomite. ....................................................81 Fig. 75. Interruption effect on CLS desorption from dolomite......................................................82 Fig. 76. Interruption and flow rate effect on CLS desorption........................................................83 Fig. 77. Gases effect on IFT and CMC..........................................................................................87 Fig. 78. 2500 mg/L lignosulfonate effect on IFT and CMC..........................................................88 Fig. 79. 5000 mg/L lignosulfonate effect on IFT and CMC..........................................................88 Fig. 80. 7500 mg/L lignosulfonate effect on IFT and CMC..........................................................89 Fig. 81. CO2 foam stability at different CD concentration. ...........................................................89 Fig. 82. N2 foam stability at different CD concentration...............................................................90

x
Fig. 83. CLS effect on foam stability.............................................................................................90

1
INTRODUCTION
This study, “Improving CO2 Efficiency for Recovering Oil in Heterogeneous Reservoirs,”
emphasized laboratory studies with related analytical models for improved oil recovery (IOR). In
the United States (US), oil that is potentially producible by IOR methods amounts to
approximately 32 billion cubic meters (m3) (200 billion barrels) of the 56 billion m3 (351 billion
barrels) remaining in US oil reserves. Of the available IOR methods, carbon dioxide (CO2)
injection holds the greatest promise for additional oil recovery from light oil reservoirs in the US.
CO2 flooding is a proven IOR technology for IOR that extends the life of mature oilfields. It is
almost universally a technical success when applied, and is reported to be profitable in a vast
majority of projects.1,2 Even during the 1998–1999 oil price collapse, most CO2 recovery
projects continued, although a number acquired new operators.
New CO2 projects are being initiated and new sources of CO2 are being identified every
year. The Permian Basin of west Texas and southeast New Mexico is the oil province most
active in CO2 usage, yielding about 80% of the oil produced by CO2 injection in the US—29,000
cubic meters per day (m3/d) (180,000 barrels of oil per day (BOPD)). Additionally, there are at
least nine other states that have active or planned CO2 projects: California, Colorado, Kansas,
Louisiana, Michigan, Mississippi, Oklahoma, Utah, and Wyoming. With increasing natural and
manmade (waste industrial products) CO2 sources and pressure to sequester anthropogenic CO2,
there will be continuing incentive to increase the use of CO2 for economic benefits.
The use of CO2 is not foolproof, as many CO2 floods display inadequate injectivity
and/or poor sweep efficiency. Many reservoirs have not been considered for CO2 flooding
because of low fracture pressure, poor injectivity, and/or extreme heterogeneity. The CO2 floods
that have not been economic successes are usually the results of poorly understood mechanisms
of sweep and displacement efficiency in heterogeneous reservoirs. Factors that increase sweep
efficiency also create resistance to flow and limit injectivity. A better understanding of these
mechanisms will lead to improved project economics, or prevent implementation of an
uneconomic project. This study has continued the investigation of improve sweep efficiency
through examining mobility control through CO2 foam and determining causes of injectivity

2
changes. Although the purpose of this study was not to judge the economics of systems, the
results concentrated on systems, products and methods that have a realistic potential for
economic viability.
This report describes new research in CO2 flooding that is an extension of previous work
preformed at the PRRC and elsewhere for understanding and improving CO2 and other gas
injection processes for IOR in heterogeneous reservoirs. It is more crucial than ever that research
organizations and the DOE work with US operators on IOR techniques for optimizing CO2
injection, in order to maximize domestic hydrocarbon reserves. The completion of this project
results in the expansion of the range of reservoirs amenable to CO2 flooding. This research is a
direct result of interaction with CO2 operators—it focused on solving the most important
ongoing technical challenges in CO2 flooding. Thus, developments from the past, present and
future projects are an asset to the economic and strategic future of the US.
Results of previous work have been described in reports to the DOE, in papers presented
to the Society of Petroleum Engineers (SPE), and in other conference proceedings and refereed
publications. A summary of resent accomplishments can be obtained from DOE Annual and
Final Project Reports.3-6 These reports covered specific topics such as: injectivity, phase behavior
and multiphase flow, pressure effects, mobility control and foam properties, selective mobility
reduction, foam mechanisms, mixed surfactants and sacrificial agents, gravity drainage,
imbibition, interfacial tension, field foam modeling and history matching, numerical methods,
and CO2 reservoir injection studies.
This report summaries results of this project taken from Annual Reports,7-9 published
work from refereed journals and conference presentations,10-26 and yet unpublished work. Areas
of interests are: 1) mobility control, 2) understanding and mitigation of reduced injectivity, and
3) modeling process mechanisms.
Despite favorable characteristics of CO2 for IOR,27 CO2 floods frequently experience
poor sweep efficiency caused by gas fingering and gravity override, augmented by reservoir
heterogeneity,28 and low productivity caused by lower-than-expected injectivity. Poor sweep
efficiency results from a high mobility ratio caused by the low viscosity of even high density
CO2 compared to that of water or oil. The effectiveness of water injection alternating with gas
(WAG), a common process used for mobility control during CO2 floods, is reduced by gravity
segregation between water and CO2 and amplified by permeability differences. Foaming agents

3
introduced in the aqueous phase control mobility. However, costs incurred by the loss of
expensive chemicals to adsorption on reservoir rock often exclude this potentially beneficial
option for many well operators. This work demonstrates systems with lower concentrations of
good foaming agents that will reduce cost. These systems are derived using a sacrificial agent or
a cosurfactant that shows synergistic improvements when mixed with the good foaming agents.
The WAG process frequently reduces injectivity more than expected and the addition of
mobility control agents inherently compounds this problem. Normally, improved mobility ratios
reduce injectivity, and for this purpose it is critical that the two effects be optimized together.
Improved injectivity also result from the lower chemical concentrations and through some of the
synergistic improvements using the cosurfactant systems mentioned above.
Some of the beneficial results of this project are:
• Identification of the extent that various properties affect foaming agent adsorption, i.e.: rock
type, surfactant type, surfactant concentration, co-surfactants, sacrificial agents, brine
salinity, pH, and temperature.
• Understanding of the extent of synergistic effects on adsorption and desorption in dual
chemical systems for five powdered minerals and three rock types.
• Identification of parameters that change injectivity and improve sweep efficiency.
• Identification of causes of injectivity changes: fines migration, permeability changes,
dissolution, precipitation, stress/pressure gradient, phase behavior, flow rate, etc.
• Development of models to predict advancing rates of individual components in mixed
chemical systems with adsorption and desorption kinetic and equilibrium rates, foam
behavior in heterogeneous systems, and injectivity.
Project results have immense consequences for the future of IOR. Parameters determined
will result in more efficient CO2 flooding in heterogeneous reservoirs and include the following
benefits:
• Extending the life of the petroleum reservoir, maintaining or increasing employment, and
increasing oil recovery.
• Expanded range of reservoirs amenable to CO2 flooding, and
• Reduction of chemical cost: optimizing oil saturation tolerance of foam, decreasing primary
foaming agent adsorption, and decreasing required primary foaming agent concentration.
• Improved sweep efficiency using SMR foam to decreased CO2 mobility,

4
• Delayed production of CO2 and increased retention of CO2 in the reservoir (sequestration),
• Improved injectivity of CO2 and water,
• Improved CO2 flooding predictions, and
• Decrease in the mobility of CO2 during the alternate injection of brine and CO2.

5
EXECUTIVE SUMMARY This document is the Final Report for the U.S. Department of Energy under contract No. DE-
FG26-01BC15364, a three-year contract with a no-cost extension entitled: “Improving CO2
Efficiency for Recovering Oil in Heterogeneous Reservoirs.” The research improved our
knowledge and understanding of CO2 flooding and includes work in the areas of injectivity and
mobility control. The bulk of this work has been performed by the New Mexico Petroleum
Recovery Research Center, a research division of New Mexico Institute of Mining and
Technology. This report covers the reporting period of September 28, 2001 through March 31,
2005.
This report summarizes the work completed under the above-mentioned contract, except
for the completion and documentation of a revised version of the U.S. Department of Energy
pseudo-miscible simulator, MASTER (Miscible Applied Simulation Technique for Energy
Recovery). A topical report on MASTER is forthcoming in mid-2005. This document does not
attempt to detail all the work that has been completed. Much of the work from this project has
been reported in the three previous annual reports7-9 and various publications,10-26 and thus will
not be duplicated here, but generally only summarized for the previously published work.
Chapter 1 summarizes a survey performed for all the CO2 injection projects in the
Permian Basin. Engineers working on each project for those companies that would allow it were
interviewed during this project. The coverage was not as good as that hoped for, because two
major players did not choose to be interviewed. These represented almost 40% of the properties.
Information for these was obtained best we could from outside sources. Even excluding these, a
good cross section was obtained from more than 60% of the companies ultimately surveyed. The
first Annual Report contains a literature review that, with a publication, summarizes the technical
state of CO2 injection in the Permian Basin as well as areas where further research is the most
critical.
Chapter 2 covers CO2-brine-reservoir rock interactions. This study evolved from research
designed to understand causes of greater than expected injectivity losses often occurring during
water alternating with gas (WAG) in CO2 injection projects. The dissolution of carbonates near
the wellbore injection and precipitation of carbonates occur as the fluid moves from the near
wellbore region, with subsequent deposition as the fluid becomes supersaturated with dissolved

6
solids with pressure drop. This dissolution appears to occur in the field. The evidence of
precipitation in the field apart from permanent reduction in injectivity in many CO2 WAG
projects has not been identified.
Chapter 3 summarizes the work that has been performed over the past several years to
determine possible injectivity and productivity reduction due to high flow rate in the near-
wellbore regions. High flow rates are evident especially in the production wells at CO2
breakthrough. This causes increased pressure drop due to non-Darcy flow behavior. This
reduction does not appear to be permanent, but can cause reduction in production after CO2
breakthrough and related well damage. If near-wellbore conditions are at or near the critical
conditions for CO2, cooling can occur that further limits production and might damage the near-
wellbore region. This cooling was seen both experimentally and in a CO2 production well.
Chapter 4 summarizes work in the areas of foam stability, interfacial tension, surfactant
adsorption and desorption, and mobility control. Parameters that were studied that affect foam
stability included: pH, brine salinity, brine composition, temperature, pressure, and surfactant
concentration and type. Surfactant adsorption and desorption kinetics and equilibrium were
studied as a function of surfactant concentration and type, temperature, pH, brine composition
and salinity, and rock and mineral type.
Chapter 5, “Technology Transfer,” summarizes the numerous papers, reports,
presentations, and workshops as a result of research performed under this contract.

7
EXPERIMENTAL
Equipment
Corefloods. Two types of corefloods were performed. The first series were about 5 cm in
diameter by at least 15 cm long, used to determine rock-brine-CO2 interactions. The second used
a triaxial overburden pressure system for determining effects of overburden and high fluid flow
rates. A simplified diagram of the apparatus used for the first type of corefloods is illustrated in
Fig. 1. Large volumes of brine and CO2 are supplied from high-pressure floating piston
accumulators that are driven by external high-pressure syringe pumps. These pumps are late
models with high accuracy digital control and may be configured by the system plumbing for
continuous flow or alternating flow to simulate any desired injection scheme. Oil injection was
accomplished through a metering pump connected by a valve ahead of the core. System pressure
was maintained by a backpressure regulator (BPR) at the core outlet. Each accumulator pressure
was maintained by an individual BPR in order to precisely control fluid density and avoid any
fluid surges due to multiphase flow effects. System pressures were measured by absolute and
differential pressure transducers and a computer controlled data acquisition board logged the
data.
BSE imaging and compositional analysis was performed on pre-flood samples of each core
and on a number of samples from along the length of each flooded core. The electron microprobe
(model SX-100) utilized three wavelength-dispersive spectrometers, and an accelerating voltage
of 15 kV and 20 nA beam current.
The second series of corefloods were performed in order to simulate high velocity fluid flow
at the near-wellbore region, an experimental system was designed that could vary flow rate,
temperature, and axial and radial pressures. Figure 2 is a schematic of the system. It has the
following features:
1. Independent axial and radial stresses up to 10,000 psi; independent inlet and outlet backup
pressures up to 5,000 psi;
2. Controlled heating and cooling of the injection pump, the tubing and the core up to 200ºF;
and
3. Pump rate from 0 to 10,000 cc/hr, and injection pressure from 10 to 3750 psi.

8
Tests were done on Indiana limestone, Berea sandstone, and Dakota sandstone. Samples of 1 in.
diameter by 2 in. long were drilled, flushed with 5–10 pore volumes (PV) of tetrahydrofuran
(THF), and oven-dried at 100ºF for two days before use. The key part of this experimental
system is the triaxial core holder. Figure 3 shows the structure of the core holder used in this
research. The sample was sealed by the rubber sleeve in the radial direction and by the end plugs
in the axial direction.
Fig. 1. The coreflooding apparatus is set up for alternate or co-injection of two fluids. The effluent can be sampled under ambient or system (installed for last two experiments) conditions.
Core Flooding System
Pump Pump
BRINE Floating Piston Accumulator
CO2 Floating Piston Accumulator
Back Pressure Regulator
Back Pressure Regulator
Back Pressure Regulator
Filter
CORE
P PdP
Core Holder
Overburden P=4000 psi
Wet Test Meter
BRINE Collection
P=2000 psi
P=3000
P=3000 psi
Air Bath T=100F, 38C
Fluid High Pressure Sampler

9
Fig. 2. Experimental system.
Fig. 3. Triaxial core holder.

10
IFT and Foam Stability Measurement Methods. Interfacial tension (IFT) is a measurement of
the cohesive energy present at an interface, expressed in either energy/area or force/length. The
common units for surface tension are milliNewtons/meter (mN/m) or dynes/centimeter.
The drop weight method of measuring the interfacial tension of liquid with respect to air
(dense CO2 in CO2 foam) consists of determining the number of drops falling/rising from a
capillary (Fig 4). The drops are allowed to fall into a container until enough have been collected
so that the weight per drop can be determined accurately. The principle of the method is that the
size of the drop falling from a capillary tube depends on the surface tension of the liquid. A
considerable portion of the drop (up to 40%) may remain attached to the capillary tip after the
drop detaches. This effect is compensated with Harking-Brown correction factor, f,29,30 as
described by Adamson30 (Fig 5),
W = ∆mg .......................................................1
where W is the weight of the drop, ∆m is the differential mass between the two fluids in grams; g
is the gravitational force, cm/sec2; r is the needle radius, cm; σ is the IFT, dynes/cm. Also
∆mg = 2πrσf ...................................................2
or
πrσf)gρ(ρπR COsurf 234
2
3 =− .............................3
where R is the average bubble radius, cm; ρis the fluid densities, g/cm3; and f is the Harking-
Brown correction factor.
In this work, the calculation of the IFT measurements is analogous to that of the drop
weight method.29,30 The rate of introducing dense CO2 is determined by the aqueous phase
withdrawal rate. The number of produced bubbles per time period is recorded, from which the
volume and radius of each bubble are calculated. The correction factor takes into account effects
of attraction to the end of the tube and imperfections in the system, generally ranging from 0.5 to
1.0 (see Fig. 5). The correction factor in most of the experiments in this study range from 0.5 to
0.7. The drop weight method is fairly accurate and perhaps the most convenient in the laboratory
for measuring both gas-liquid and liquid-liquid interfacial tensions. Design and construction of
the apparatus (Fig. 6) was based on this method.
Like other types of colloidal dispersions, foams are not thermodynamically stable,.
Eventually they collapse, but it is possible to make surfactant-stabilized, static bubbles and films
that endure for months or even years under suitable conditions. Though foams are not

11
thermodynamically stable, they can exhibit kinetic stability, which is defined here as the CO2
foam kinetic stability. Equation 4 shows how CO2 foam stability was calculated from foam
height measurements.
⎟⎟⎠
⎞⎜⎜⎝
⎛×
+−= 100
(0)2H)0(1H
(t)1H100 stability foam 2CO ............. 4
where t is time, H1(t) is the height of the CO2 layer with time, H1(0) is the initial height of the
CO2 layer, and H2(0) is the initial height of the foam layer.
Fig. 4. Illustration of needle and drop.
0.5
0.6
0.7
0.8
0.9
1
1.1
0 0.3 0.6 0.9 1.2 1.5 1.8rtube/V
1/3
Cor
rect
ion
Fact
or f
a
Fig. 5. Harkins-Brown correction factor for drop-weight method (after Adamson).30

12
Fig. 6. Foam stability apparatus setup.
Fig. 7. CO2 foam stability high pressure observation cell.
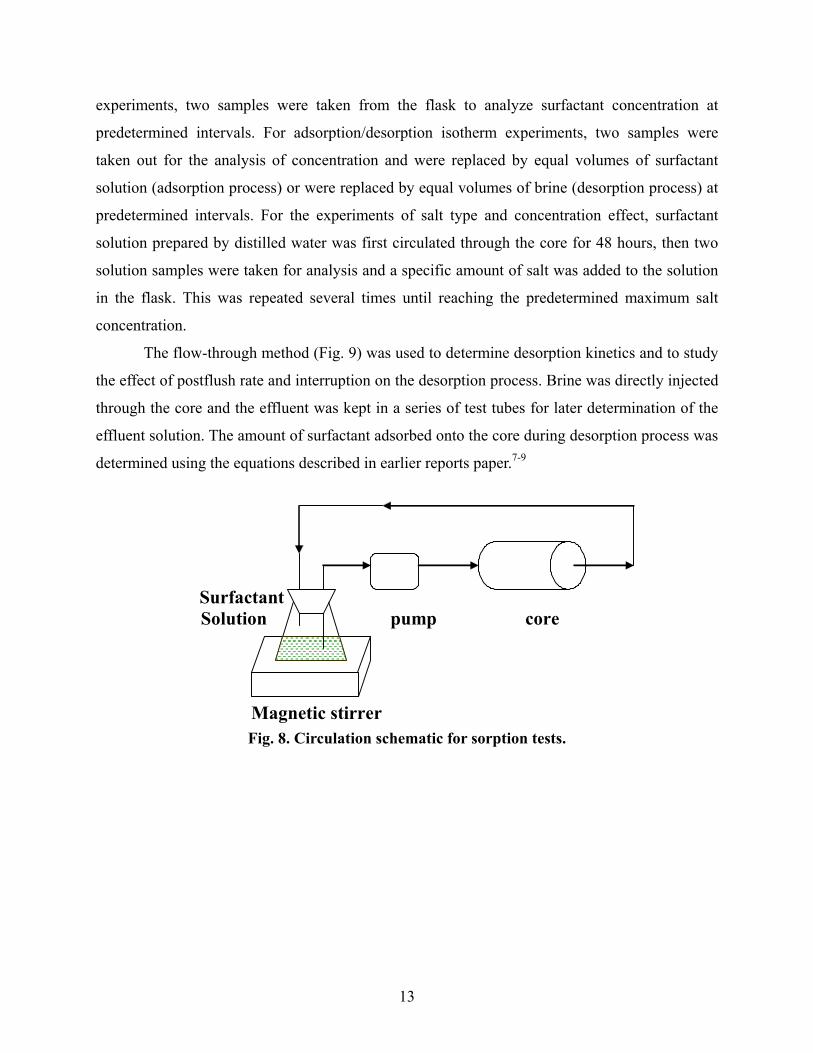
Adsorption. Two dynamic flow methods, circulation and flow-through experiments, were used
to study surfactant adsorption and desorption onto three core types; these methods have been
detailed in an earlier report.8 A static method was also used to study surfactant sorption onto five
powdered minerals.
The circulation method (Fig. 8) was used: (1) to study the kinetics of surfactant
adsorption onto reservoir core; (2) to establish the adsorption/desorption isotherm; and (3) to
study the effects of salt type and concentration and temperature on surfactant equilibrium
adsorption density. The apparatus consists of a flask with a solution of known weight and
concentration; a core of known PV, bulk volume and weight; and a metering pump and some
tube lines connecting each part. A known initial concentration of surfactant solution was
circulated through the core at constant temperature and injection rate. For adsorption kinetic
H1:Dense CO2
H2:CO2 Foam
Surfactant Solution
13
experiments, two samples were taken from the flask to analyze surfactant concentration at
predetermined intervals. For adsorption/desorption isotherm experiments, two samples were
taken out for the analysis of concentration and were replaced by equal volumes of surfactant
solution (adsorption process) or were replaced by equal volumes of brine (desorption process) at
predetermined intervals. For the experiments of salt type and concentration effect, surfactant
solution prepared by distilled water was first circulated through the core for 48 hours, then two
solution samples were taken for analysis and a specific amount of salt was added to the solution
in the flask. This was repeated several times until reaching the predetermined maximum salt
concentration.
The flow-through method (Fig. 9) was used to determine desorption kinetics and to study
the effect of postflush rate and interruption on the desorption process. Brine was directly injected
through the core and the effluent was kept in a series of test tubes for later determination of the
effluent solution. The amount of surfactant adsorbed onto the core during desorption process was
determined using the equations described in earlier reports paper.7-9
Fig. 8. Circulation schematic for sorption tests.
Surfactant Solution pump core Magnetic stirrer

14
Fig. 9. Flow-through schematic for sorption tests.
Static experiments were performed to study surfactant adsorption onto pure powdered
minerals. A specific volume of solution with a desired surfactant concentration was pipetted into
a bottle. The bottle and a mineral were kept in a thermostatic bath to allow the solution to
achieve thermal equilibrium. Then a weighed amount of mineral was put into the bottle and
vigorously agitated for about a minute. This was then placed into a mechanical shaker and
agitated continuously for 24 hrs and then left undisturbed for another 48 hrs. A sample was
removed and centrifuged at 2000 rpm for 20 min, and then the supernatant solutions were
separated by decantation from the solids after gravity sedimentation. The concentration
difference between the stock and the sample were used to evaluate the adsorption density. Figure
10 is the schematic diagram of the static experiment.
Fig. 10. Static schematic diagram for sorption tests.
Shaker (isotherm)
adsorbent solution
Pump Core Effluent Solution

15
Materials
Chemicals. The calcium lignosulfonate (CLS) used in this study was Lignosite®100, which was
obtained from the Georgia-Pacific Corporation. The product provided is a powder produced by
sulfonation of softwood lignin. Chaser CD1045 (CD), the good foaming agent, is Chaser
CD1045™, which was identified as one of the best foaming agents in several earlier studies3-6
and was supplied by Chaser International as 46.7 wt% active aqueous solution. Dimidium
Bromide-Disulphine Blue Indicator, used for anionic surfactant determination, supplied by BDH
Laboratory Supplies, was used to detect CD. HPLC grade chloroform containing approximately
0.75% ethanol as a preservative was used as part of the CD process. A 2% synthetic brine (1.5
wt% NaCl and 0.5 wt% CaCl2) was prepared and used in all solutions. Sodium chloride (NaCl)
and calcium chloride dehydrate (CaCl2·2H2O) are both A.C.S. reagent grade (98+%), the nitric
acid (HNO3) is 70% nitric acid and the sodium hydroxide (NaOH) is A.C.S. reagent grade
(98.6%).
Adsorbents. Five minerals common in oil reservoirs were used as adsorbents: silica, kaolinite,
montmorillonite, calcite, and dolomite. All minerals are non-porous. Silicates are oxides of
silicon with traces of other elements constructed of SiO4 tetrahedra that share all four corners
with other SiO4 tetrahedra. Kaolinite is 2Al2Si2O5 (OH)4 or 2SiO4·Al2O3·2H2O per unit cell, with
no isomorphous substitutions. The montmorillonite is a Wyoming bentonite composed primarily
of sodium montmorillonite. It is a hydrous aluminum silicate approximately represented by the
formula: 4SiO2·Al2O3·2H2O+water; but with some of the aluminum cations, Al3+, being
displaced by magnesium cations, Mg2+. The name sodium montmorillonite refers to clay
minerals in which the loosely held cation is the Na+ ion. Calcite and dolomite are carbonate
minerals with similar structures. Calcite is formed by alternate layers of calcium ions and
carbonate ion groups. Dolomite is composed of alternate layers of calcium ions, magnesium ions,
and carbonate ions. Both solids are salt type minerals; therefore, their solubility in water is
higher than oxides and silicates. Three types of porous media were applied: Berea sandstone,
Lockport sandstone and Indian limestone. There were no visual fractures in these cores.

16
Analytical Method to Detect Surfactant Concentration. CD is a multi-component
formulation, colorless in solution. One analytical method suggested by the manufacturer and
used in this study is a colorimetric method. Since CD is colorless, an indicator solution of
dimidium bromide-disulphine blue is used. The procedure is described in more detail an earlier
publication.3-6 The absorbance of CD solution has an excellent absorbance peak at 523 nm that
has minimal interference with co-surfactant CLS.
Calcium lignosulfonate (CLS) calibration curve. A spectrophotometer was used to
determine the concentration of CLS. The 283 nm wavelength was used in all measurements to
analyze the CLS concentration. CLS had earlier been determined to have the maximum
absorbance in the neighborhood of 283 nm. To calculate CLS concentration, a standard
calibration curve of CLS in 2 wt% brine was established, shown in Fig. 11. CLS was diluted to
less than 400 mg/l before its concentration was measured because concentration versus
absorbance is linear at concentrations below 400 mg/l.
Conc. = 110.68*ABS + 3.3705R2 = 0.9999
0
100
200
300
400
0.0 0.5 1.0 1.5 2.0 2.5 3.0Absorbance at 283 nm
Con
c. (m
g/l)
Fig. 11. CLS standard curve at 283 nm (2% brine).
The absorbance of CLS prepared by different salt types and concentrations was measured
using a spectrophotometer. Figure 12 shows the effect of salt type and concentration on CLS
absorbance at the wavelength of 283 nm. Both the type and concentration of salt have influence
on CLS absorbance. Table 1 lists the fit equations of CLS standard curve at different salt types
and concentrations. The absorbance of 200 mg/l of CLS solution was measured at different pH

17
conditions, shown in Fig. 13. Under these conditions, solution pH has negligible effect on the
absorbance of CLS.
0.0
1.0
2.0
3.0
4.0
0 100 200 300 400 500
CLS concentration (mg/l)
Abs
orba
nce
at 2
83 n
m0% brine5% NaCl10% NaCl5% CaCl210% CaCl2
Fig. 12. Effect of salt on CLS absorbance at 283 nm.
Table 1. Equations of CLS Standard Curves with Different Salts Salt Equations of standard curves R2
Distilled water 0075.0.0084.0 +⋅= ConcABS 0.9985
5% NaCl 019.0.0082.0 +⋅= ConcABS 0.9982
10% NaCl 0202.0.0086.0 +⋅= ConcABS 0.9964
5% CaCl2 0184.0.0084.0 +⋅= ConcABS 0.9977
10% CaCl2 0113.0.0087.0 +⋅= ConcABS 0.9985 ............................................................................................................................................................
1.70
1.72
1.74
1.76
1.78
1.80
3 5 7 9 11
pH
Abs
orba
nce
at 2
83 n
m
Fig. 13. Effect of pH on CLS absorbance at the wavelength of 283 nm.

18
CD solution is colorless, so an indicator solution must be used to treat it before
measurement the colorimetric method using a spectrophotometer can be employed. It is
suggested by the supplier that dimidium bromide-disulphine blue stock solution be used as an
indicator. The indicator solution used to measure CD concentration states that it is a solution for
anionic surfactant determination. Therefore, it is assumed that CD is an anionic surfactant. The
procedure to determine CD concentration have been discussed in earlier publications.3-9
The absorbance of CD solution prepared with 2 wt% brine was measured by a
spectrophotometer, which was set to scan through a set range of wavelength from 0 to 700 nm.
CD solution has three peaks in the measured range of wavelength: 295 nm, 406 nm and 520 nm.
Table 2 gives a series of absorbance measurement results of CD solution with different
concentration.
Table 2. Peak Absorbance of CD Solution at Different CD Concentrations
Absorbance at Peak
Conc. 295 nm 406 nm 523 nm
10 0.1017 -0.0333 -0.0227
50 0.2405 -0.0315 -0.0095
100 0.4135 -0.0300 0.0125
150 0.5970 -0.0290 0.0340
200 0.8120 -0.0200 0.0600
250 0.8750 -0.0270 0.0730
300 1.0380 -0.0250 0.0910
400 1.5090 -0.0190 0.1340
500 1.7400 -0.0190 0.1750
600 2.1560 0.0130 0.2160
For the peak of 406 nm, the absorbance is very small and is not linear with CD
concentration. For the 295 nm and 523 nm peaks, the absorbance is linear with CD concentration
if the concentration is below 600 mg/l, as shown in Figs. 14 and 15. The standard equations are:

19
At 295 nm: 9938.0R 41.2783.299. 2 =−⋅= ABSConc …………………....5
At 523 nm: 9964.0R 10.6177.2493. 2 =+⋅= ABSConc ……….……….…6
where Conc. refers to CD concentration and ABS refers to the absorbance value of CD solution at
295 nm or 523 nm.
Conc.=299.848*ABS-27.407R2 = 0.9938
0.00
0.50
1.00
1.50
2.00
2.50
0 200 400 600 800
CD Conc. (mg/l)
Abso
rban
ce a
t 295
nm
Fig. 14. Standard curve of CD at 295 nm.
Conc.=2493.77*ABS+61.10R2 = 0.9964
-0.05
0.00
0.05
0.10
0.15
0.20
0.25
0 200 400 600 800
CD Conc. (mg/l)
Abs
orbe
nce
at 5
23nm
Fig. 15. Standard curve of CD at 523 nm.

20
The absorbance of CD solution at the peak of 523 nm was selected as an evaluation
standard for the CD concentration because CLS is mixed with CD as a sacrificial agent for some
tests in this study and it has an absorbance peak at the wavelength of 283 nm, which interferes
with the peak of CD at 295 nm.
Effect of salt and pH on the absorbance of CD solution. Increasing the concentration of CaCl2
and NaCl will decrease absorbance of CD at 520 nm with CaCl2 having a greater impact, shown
in Figs. 16 and 17. Figure 18 shows the influence of pH on the absorbance of CD. Within the
range of tested pH and concentration, pH has negligible effect.
0.00
0.01
0.01
0.02
0.02
0.03
2%bri
ne
5%NaC
l
5%CaC
L2
10%NaCl
10%CaCl2
abso
rban
ce
Fig. 16. Absorbance of 100mg/l CD prepared with different brine.
0.00
0.02
0.04
0.06
0.08
2%brine 5%NaCl 5%CaCL2 10%NaCl 10%CaCl2
abso
rban
ce
Fig. 17. Absorbance of 200 mg/l CD prepared with different brine.
21
0
0.05
0.1
0.15
0.2
0.25
0.3
0 100 200 300 400 500 600
CD Conc. (mg/l)
Abs
orba
nce
at 5
20 n
m
pH=3 pH=5
pH=7 pH=9
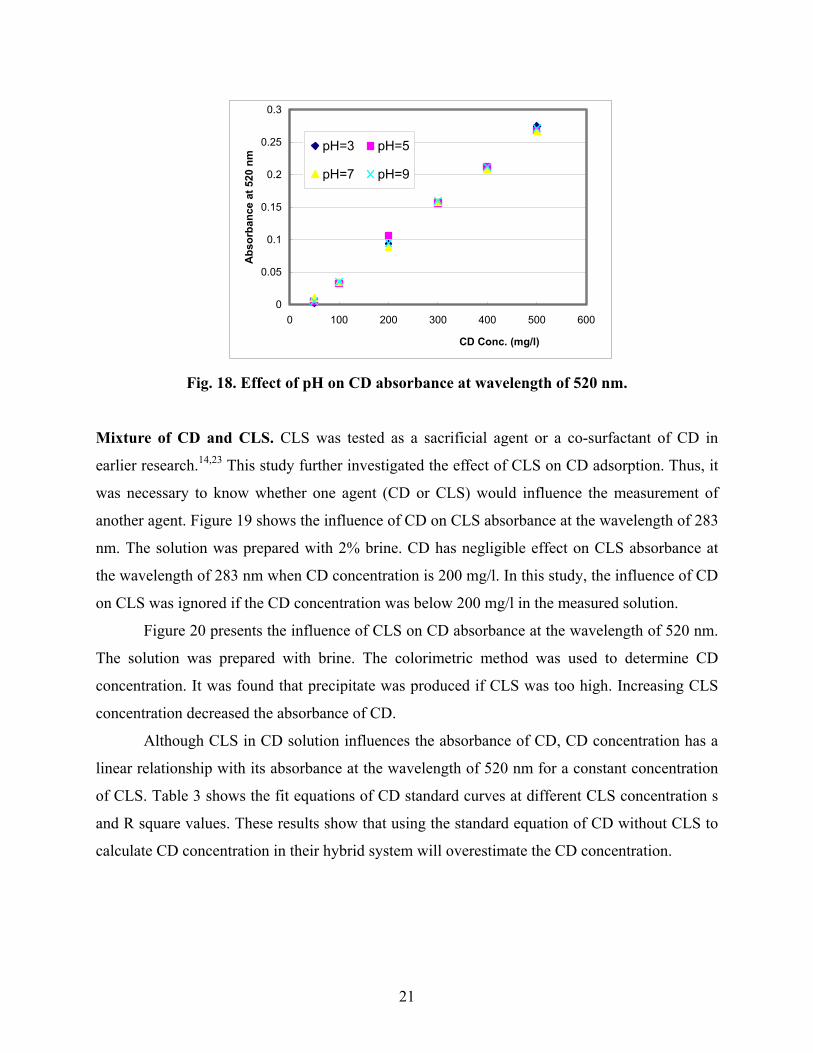
Fig. 18. Effect of pH on CD absorbance at wavelength of 520 nm.
Mixture of CD and CLS. CLS was tested as a sacrificial agent or a co-surfactant of CD in
earlier research.14,23 This study further investigated the effect of CLS on CD adsorption. Thus, it
was necessary to know whether one agent (CD or CLS) would influence the measurement of
another agent. Figure 19 shows the influence of CD on CLS absorbance at the wavelength of 283
nm. The solution was prepared with 2% brine. CD has negligible effect on CLS absorbance at
the wavelength of 283 nm when CD concentration is 200 mg/l. In this study, the influence of CD
on CLS was ignored if the CD concentration was below 200 mg/l in the measured solution.
Figure 20 presents the influence of CLS on CD absorbance at the wavelength of 520 nm.
The solution was prepared with brine. The colorimetric method was used to determine CD
concentration. It was found that precipitate was produced if CLS was too high. Increasing CLS
concentration decreased the absorbance of CD.
Although CLS in CD solution influences the absorbance of CD, CD concentration has a
linear relationship with its absorbance at the wavelength of 520 nm for a constant concentration
of CLS. Table 3 shows the fit equations of CD standard curves at different CLS concentration s
and R square values. These results show that using the standard equation of CD without CLS to
calculate CD concentration in their hybrid system will overestimate the CD concentration.

22
0.0
1.0
2.0
3.0
4.0
0 100 200 300 400 500
CLS concentration (mg/l)
Abs
orba
nce
at 2
83 n
m
CD=0 mg/l CD=25 mg/l
CD=50 mg/l CD=100 mg/l
CD=200 mg/l
Fig. 19. Effect of CD on CLS absorbance at 283 nm.
-0.05
0.00
0.05
0.10
0.15
0.20
0.25
0 200 400 600Conc. (mg/l)
AB
S
CD without CLSCD with 100mg/L CLSCD with 500mg/L CLSCD with 1000mg/L CLSCD with 5000mg/L CLS
Fig. 20. CD standard curve at different concentration of CLS.
Table 3. Equations of CD Standard Curves at Different Concentrations of CLS
No. CLS Conc. (mg/l) Equations of standard curves R2
1 0 17.5661.2057. +⋅= ABSConc 0.9991
2 100 80.5149.2136. +⋅= ABSConc 0.9987
3 500 16.6046.2145. +⋅= ABSConc 0.9996
4 1000 67.5774.2406. +⋅= ABSConc 0.9974
5 5000 99.9211.3610. +⋅= ABSConc 0.9979
Notes: ABS refers to the absorbance value measured at 520 nm from a spectrophotometer and CONC. refers to CD concentration.

23
Based on the results shown in Figs. 21 and 22, a method was developed to calculate CD
concentration when it is mixed with CLS. Figure 21 shows that the line slope and CLS
concentration from equations listed in Table 4 have a good linear relationship. The fit equation
is:
6.2062.3096.0 +⋅= ConcSlope (R2 = 0.9951)…………………………... 7
y = 0.3096x + 2062.6
R2 = 0.9951
0
1000
2000
3000
4000
0 1000 2000 3000 4000 5000 6000
CLS concentration (mg/l)
slope
Fig. 21. The relationship between CLS concentration and slope of fit equations.
Figure 22 shows that the intercept and CLS concentration are also linear. The fit equation
is:
9690.0R 4467.53.0078.0 2 =+⋅= ConcIntercept ……………………...8

24
y = 0.0078 x + 53.4467
R2 = 0.9690
0
20
40
60
80
100
0 1000 2000 3000 4000 5000 6000
CLS concentration (mg/l)
intercept
Fig. 22. The relationship of CLS concentration and intercept of fit equations.
For many experiments in this study, CD concentration was measured from the mixture of
CD and CLS. Because CD has negligible effect on CLS absorbance (shown Fig. 20), the CLS
standard calibration curve without CD was used directly to calculate CLS concentration. For CD
concentration calculations, new calibration equations were calculated from Eqs. 7 and 8. For
example, if the CLS concentration is 2000 mg/l, the corresponding standard curve should be
obtained according to the following steps:
1. Use Eq. 7 to calculate slope: y=0.3096*2000+2062.6=2681.8;
2. Use Eq. 8 to calculate intercept: y=0.0078*2000+53.4467=69.0467; Therefore
3. The standard calibration equation is: Conc.=2681.8*Abs.+69.0467
Figure 23 shows the standard curves of CD solution at different concentration of CLS.
The solution was prepared with distilled water. Table 4 lists the fit equations of these standard
curves.

25
-0.05
0.00
0.05
0.10
0.15
0.20
0.25
0 100 200 300 400 500CD Conc. (mg/l)
Abs
orba
nce
CLS=0 CLS=500
CLS=1000 CLS=2500
CLS=5000 CLS=100
Fig. 23. Standard curve of CD at different concentration CLS (distilled water).
Table 4. CD Standard Curves at Different Concentrations of CLS (Distilled Water)
CLS Conc. (mg/l) Equations of standard curves R2
0 514.458.1791. +⋅= ABSConc 0.9988
100 46.442.1838. +⋅= ABSConc 0.9971
500 477.393.2013. +⋅= ABSConc 0.999
1000 676.407.2159. +⋅= ABSConc 0.9944
2500 231.412601. +⋅= ABSConc 0.9451
5000 534.968.4481. +⋅= ABSConc 0.9909
The same method as the hybrid system prepared with brine can be used to determine CLS
and CD concentration when they are mixed. Figure 24 shows the relationship of slope/intercept
with CLS concentration.
The following equations can be used to calculate standard curve of CD at different CLS
concentrations.
9953.0R 3.18551378.0108 225 =++⋅×= − CConcSlope ……..……….9
9951.0R 87.450127.0105 226 =+−×= − ConcConcIntercept ……… 10

26
Slope = 8E-05x2 + 0.1378x + 1855.3
Intercept = 5E-06x2 - 0.0127x + 45.87
0
1000
2000
3000
4000
5000
0 1000 2000 3000 4000 5000 6000
CLS Conc. (mg/l)
Slo
pe
0
20
40
60
80
100
Inte
rcep
t
Fig. 24. Calculation of slope and intercept at different CLS.
27
RESULTS AND DISCUSSION
Chapter 1: State of the Industry in CO2 Injection
Chapter 1 summarizes a survey performed for all the CO2 injection projects for improved oil
recovery (IOR) in the Permian Basin. Engineers working on each project for those companies
that would allow it were interviewed during this project. The coverage was not as complete as
had been targeted because two major players chose not to be interviewed. These represented
almost 40% of the properties. Information for these was obtained from outside sources and thus
not as complete and up to date as the others. Even excluding these, a good cross-section was
obtained from surveyed units, which represented more than 60% of the projects. The First
Annual Report contains a literature review summarizing the technical state of CO2 injection in
the Permian Basin and pointing out areas where further research is the most critical.9 The
literature review is also summarized in a publication, “Long-term CO2 Storage: Using Petroleum
Industry Experience,” in: Carbon Dioxide Capture for Storage in Deep Geologic Formations,
Volume 2, R.B. Grigg, Thomas, D.C. and Benson, S.M. (Eds.), 2005 Elsevier Ltd.10
There is significant experience and knowledge in the oil and gas industry to separate,
compress, transport, inject, and process the quantities of CO2 that are envisioned for CO2 storage,
Improvements will occur as incentives, time and fluid volumes increase.
In some cases, certain phenomena that have been noted during waterflood were not
included in simulating CO2 processes—an omission that can prove, and has proven in some
cases, to be detrimental to the success of the project. When the reservoir is well understood, CO2
has performed as expected. Also, the thermodynamic phase behavior of CO2 must be honored in
predictive models. High-pressure CO2 performs as expected: it mobilizes oil, dissolves into
brine, and promotes dissolution of carbonates. Brine can become supersaturated with dissolved
solids; when pressure drops as it advances through the reservoir, precipitants can form. However,
the kinetics of dissolution and precipitation under many reservoir conditions requires further
study.
In the time frame wherein CO2 has been actively injected into geological formations,
seals appear to have maintained their integrity and retained CO2. Monitoring and verification of

28
CO2 flow in geological formations is critical to verification of storage, but additional research
and monitoring demonstration are needed.
Summary
Listed below are major lessons learned from CO2 injection into geological formations for IOR
and that are most applicable to CO2 storage.
1. Significant experience and knowledge in the industry exists to separate, compress, transport,
inject, and process the quantities of CO2 that are envisioned for CO2 injection into geological
formations for IOR or hydrocarbon storage. As the volume of injected CO2 increases,
significant technological improvements are expected.
2. Monitoring and verification of CO2 flow in geological formations is in the infancy of its
development.
3. Experience has shown that CO2 goes where expected. The challenge is developing detailed
reservoir characterizations and honoring them. In some cases, phenomena have been noted
during waterflood, but not included when simulating the CO2 oil recovery process, resulting
in surprises during the project that could have been avoided. The phase behavior of CO2 must
be honored as well.
4. CO2 does what is expected: mobilizes oil, dissolves in brine, and promotes dissolution of
carbonates. Through dissolution of reservoir rock as brine flows away from the injector,
brine will become supersaturated, the pressure will drop and precipitation will result. The
kinetics of these processes under a wide range of reservoir conditions requires further studies.
5. In the short geological timeframe that CO2 has been actively injected into geological
formations for IOR, seals generally are retaining the CO2 subsurface. Oil reservoir seals, to
date are generally performing as expected, but it must be remembered that a maximum of
several decades is short compared to the longer time periods required for effective CO2
storage.

29
Chapter 2: CO2/Brine/Rock Interaction
Chapter 2 covers CO2-brine-reservoir rock interactions. This research developed out of previous
attempts at trying to understand the causes of greater-than-expected injectivity losses that often
occur during water alternating with gas (WAG) in CO2 injection projects. The dissolution of
carbonates near the wellbore injection and precipitation of carbonates occur as the fluid moves
from the near-wellbore region, with subsequent deposition as the fluid becomes supersaturated
with dissolved solids with pressure drop. This dissolution appears to occur in the field, but the
evidence of precipitation in the field apart from permanent reduction in injectivity in many CO2
WAG projections has not been identified. 2.1 Physical Effects of WAG Fluids on Carbonate Core Plugs 11
It is a given that carbonate mineral dissolution and deposition occur in a formation in geologic
time; these are expected, to some degree, in carbon dioxide (CO2) floods. Water-alternating-gas
(WAG) core flood experiments conducted on limestone and dolomite core plugs confirm that
these processes can occur over relatively short time periods (hours to days) and in close
proximity to each other.
Summary
1. Dissolution features were observed in both the dolomite and limestone cores. In the dolomite
core anhydrite dissolution occurred during brine flood and dolomite dissolution occurring
during the WAG cycles. In the limestone core the calcite dissolved during the WAG process.
2. In the shorter dolomite core no carbonate deposition was detected, while in the longer
limestone core significant carbonate was deposited downstream, indicated by decreased
permeability. But in neither case was significant impurity or compositional difference
detected with respect to either pre- and postflooding samples or position along the core.
3. In the limestone core both permeability increases and decreases were noted. The permeability
increases were caused by dissolution of calcite grains and cement and channel formation. The
permeability decreases appear to be caused by precipitation of calcite in the downstream area
of the core once a calcium carbonate saturated condition is reached in the WAG fluid.

30
4. Oil contamination tests performed in both core types showed no evidence that oil
contamination would cause permanent permeability reduction. In each case the system
returned to pre-oil conditions after CO2 was injected into the system. However an injectivity
reduction effect was noted if the oil slug was followed by a brine half-cycle.
Implications for field injectivity. What implications do these laboratory tests have for CO2
flooding field projects? Since the cores were only 5 to 20 in. long, they most closely simulate
near-wellbore conditions. Dissolution of carbonate or other soluble minerals occurring near-
wellbore would increase porosity, permeability, and injectivity. Both dissolution and deposition
of carbonate could occur as fluid advances a short distance into the reservoir. As fluid flows
away from the wellbore, the carbonate solubility decreases with the rapid pressure drop. If the
fluid is at or near saturation then solid mineral phases will precipitate, changing formation
porosity, permeability, and/or injectivity. Thus, injectivity can be increasing and decreasing
locally and whichever process dominates will be measured at the surface. Though these tests
indicate that oil contamination effects should only be temporary near-wellbore, they might have
implications deeper into the reservoir.
2.2 Evaluation of CO2-Brine-Reservoir Rock Interaction with Laboratory Flow Tests and
Reactive Transport Modeling12
Injection of carbon dioxide (CO2) into geological formations, already used in IOR, is one method
proposed for isolating anthropogenic CO2 from the atmosphere. Determining the viability, risks,
and optimal locations for CO2 injection into the subsurface requires detailed knowledge of the
complex interactions among CO2, rock matrix, and pore fluids under appropriate in-situ pressure
and temperature conditions. Many physical and chemical processes are known to occur both
during and after geologic CO2 injection, including diagenetic chemical reactions and associated
permeability changes. Although it is commonly assumed that CO2 injected into a reservoir, given
enough time, will ultimately become mineralized, the rates of these changes, including CO2
hydration in brines, are known to be relatively slow. Together with hydrated CO2, cations from
produced brines may form solid-state carbonate minerals, ostensibly providing permanent
sequestration.

31
We used results of earlier laboratory CO2-brine flow experiments performed in rock core
to calibrate a reactive transport simulator. We are using the calibrated model to estimate in situ
effects of a range of possible sequestration options in depleted oil/gas reservoirs. The code
applied in this study is a combination of the well known TOUGH2 simulator, for coupled
groundwater/brine and heat flow, with the chemistry code TRANS for chemically reactive
transport.
Variability in response among rock types suggests that CO2 injection will induce ranges
of transient and spatially dependent changes in intrinsic rock permeability and porosity.
Determining the effect of matrix changes on CO2 mobility is crucial in evaluating the efficacy
and potential environmental implications of storing CO2 in the subsurface.
Summary
Although the TRANSTOUGH model remains in the developmental stages, simulated results
compared favorably to experimental results, suggesting that the model accurately simulates CO2
sequestration under deep reservoir conditions, at least for small spatial scales.
Additional TRANSTOUGH simulations were performed employing a range of geologic
media, solution pH, and brine alkalinities. The results indicate that under equivalent volumetric
fluid injection of CO2 and brine, little difference in the magnitude of dissolution occurs with
variation in brine pH and alkalinity. The results of the laboratory experiments and the
corresponding bench scale numerical simulations suggest that chemical reactivity with the
geologic media can be extreme, depending on mineral kinetic reaction rates and the volume of
brine fluid present.
Bench scale simulations and laboratory experiments are a necessary first step to better
characterization of CO2-brine-media interactions. Reservoir scale simulations are critical in
gaining an understanding of the more applicable large scale effects of heterogeneities that may
be incurred from CO2 injection.
Other Tests
Simulations of a calcite reservoir cross-section model were performed as a basic examination of
larger scale processes, paving the way for future reservoir studies. Contrary to the calcite bench
scale model, little dissolution occurred in the comparable calcite reservoir scale model. A close

32
examination near the injection well revealed that as CO2 was injected, the brine solution was
forced outward, away from the injection well, causing the saturation of separate phase CO2 to
increase locally. As the saturation of separate phase CO2 increased, the mobility of the residual
brine solution decreased as a result of decreasing relative permeability and capillary effects.
Therefore, simultaneous flushing of several pore volumes of CO2 and brine through the same
rock volume did not occur. As a result, little dissolution was predicted in the reservoir as
compared to the constant injection bench scale laboratory experiments, suggesting the possibility
that matrix changes to the media induced by CO2 injection at the reservoir scale may be minor.
2.3 Laboratory and Model Tests at Reservoir Conditions for CO2-Brine-Carbonate Rock
Systems Interactions13
Determining the viability of, risks in, and optimal locations for injecting CO2 into the subsurface
requires detailed knowledge of the complex interactions among CO2, rock matrix, and pore
fluids under appropriate in-situ pressure and temperature conditions. Many physical and
chemical processes are known to occur both during and after geologic CO2 injection, including
diagenetic chemical reactions and associated permeability changes. Although it is commonly
assumed that CO2 sequestered in this way will ultimately become mineralized, the rates of these
changes, including CO2 hydration in brines, are known to be relatively slow. Together with
hydrated CO2, cations from brines may form solid-state carbonate minerals, ostensibly providing
permanent sequestration.
Results of a series of laboratory CO2-brine flow tests in rock core were used to calibrate a
recently coupled reactive transport simulator, TRANSTOUGH. TRANSTOUGH is a
combination of the TOUGH2 simulator, for coupled groundwater/brine and heat flow, with the
LANL chemistry code TRANS for chemically reactive transport. This paper presents laboratory
test results and compares these to the model predictions. Variability in response among rock
types suggests that CO2 injection will induce ranges of transient and spatially dependent changes
in intrinsic rock permeability and porosity. Determining the effect of matrix changes on CO2
mobility is crucial in evaluating the efficacy and potential environmental implications of storing
CO2 in the subsurface.

33
Summary
The TRANSTOUGH model was shown to quantitatively replicate the outcome of the dolomite-
anhydrite and the limestone, CO2 and brine injection experiments. The major controlling
influence was found to be lithology type, while in the case of the quartz-evaporite media,
dissolution may be time-dependent. A secondary influence was the magnitude of fluid flushed
through the media in relation to the reactive surface area. Although the TRANSTOUGH model
remains in the developmental stages, simulated results compared favorably to experimental
results, suggesting that the model could accurately simulate CO2 sequestration under known
conditions. As bench scale simulations and laboratory experiments are a necessary first step to
better characterization of CO2-brine-media interactions, reservoir-scale simulations are critical in
gaining an understanding of the more applicable large scale effects of heterogeneities that may
be incurred from CO2 injection.
Laboratory tests show that dissolution does occur and that at least some carbonates can
precipitate in a relatively short distance. Dissolution and precipitation can be detected from
porosity, permeability, and compositional changes in the reservoir rock. The introduction of
tracers that will form carbonates into the brine was successfully tested. Both in the laboratory
tests and the simulation model, deposition of dissolved carbonates in a saturated solution seem to
create a deposition bank at the leading edge of the wormhole.
2.4 Co-Injected CO2-Brine Interactions with Indiana Limestone14
Limestone was coreflooded with co-injected carbon dioxide (CO2) and brine at reservoir pressure
and temperature. Metal chlorides were added as tracer components to the injection brine and
appeared in quantities well above natural levels in deposited carbonates. Core segment porosity
and permeability are reported to indicate dissolution and deposition. Finally, the core was
sectioned and analyzed by chemical and back-scattered electron imaging (BSEI) and chemical
titration for compositional changes.
Porosity and permeability increased and decreased corresponding to suspected
dissolution and precipitation. Qualitative and quantitative analyses confirmed the deposition of
trace metals within deposited carbonate material, providing direct evidence of deposition. These
phenomena can occur during CO2 injection into carbonate geological formations, whether for

34
improved oil recovery (IOR) or greenhouse gas sequestration. With IOR the concern is for
injectivity changes, while the issues for sequestration are long-term storage capacity and seal
integrity.
Summary
1. Dissolution of carbonates at reservoir conditions during co-injection of CO2 and brine was
confirmed visually, and by porosity and permeability increases.
2. Deposition of carbonates was indicated by porosity and permeability reduction.
3. Deposition was determined by BSEI identification of high Z areas and reached a maximum
near the end of the solution channel.
4. The composition of deposits was strongly influenced by the tracer brine composition.
5. Deposition and dissolution were found to occur in close proximity.
2.5 CO2/Brine/Carbonate Rock Interactions: Dissolution and Precipitation15
Five large-core flooding experimental series were performed on quarried and reservoir
carbonates (limestone and dolomite) with co-injected or alternating injections of CO2 and brine
at reservoir conditions. Metal chlorides were added as tracer components in injection brines for
three tests, appearing in quantities well above natural levels in deposited carbonates in one test.
Core segment porosity and permeability are reported to indicate dissolution and deposition.
Cores were sectioned and analyzed by chemical and back-scattered electron imaging (BSEI) and
chemical titration for compositional changes. In two tests fluid samples taken at reservoir
conditions and neutron computed tomography (CT) were used to monitor changes in in-situ fluid
compositions and the development of the 3-D porosity structure of the flooded cores,
respectively.
Dissolution of carbonates at reservoir conditions during co-injection of CO2 and brine
was confirmed by porosity and permeability increases, neutron CT, and brine compositional
analysis performed on effluent brine samples obtained at reservoir conditions. When deposition
occurred it was indicated by porosity and permeability reductions in downstream core, BSEI
identification, and modeling. The composition and extent of deposits was strongly influenced by
the brine composition. Deposition and dissolution were found to occur in close proximity. The

35
results are being used to calibrate a CO2 model coupling multiphase flow to chemical reactions
that will be used to predict in situ dissolution and deposition related to CO2 geologic
sequestration.
Table 5. Brine Compositions Used in the Series of Five Large- Core Floods
Reservoir Brine #1
Reservoir Brine #2
Brine #3 Tracer #1
Brine #4 Tracer #2
NaCl 64700 13531 10000 25000 CaCl2 11000 4330 5000 4040 MgCl2 3810 1914 5000 190 NaHCO3 1850 5645 Na2SO4 5590 4831 MnCl2 5000 198 SrCl2 5000 TDS 86950 30251 30000 29428
COREFLOOD A – INDIANA LIMESTONE
The first coreflood was on quarried Indiana limestone at 2000 psig and 100ºF using Reservoir
Brine #1 (Table 5). Brine was injected alternating with CO2 (WAG). After injecting several
hundred pore volumes (PV) a 25-cm long solution channel had formed while the permeability of
the whole core was essentially the same as the fresh core (Figs. 25 and 27). There was no
evidence of plugging, though the permeability of the second core half was reduced by about half,
which is an indication of deposition (Fig. 26). Using BSEI and compositional analyses, all
possible deposition had the same composition as the fresh core; thus in Coreflood C metal tracers
were added to aid in identifying deposition.
Fig. 25. Post-WAG Indiana limestone dissolution channel extends from inlet face into first half of core length (~ 25 cm).

36
Fig. 26. Second half of the core did not have a solution channel (last ~ 25 cm). Final permeability of unchannelled core, k=19.5 mD. Initial perm in this same region before WAG ~ 36 mD.
` Fig. 27. Limestone permeabilities.
Coreflood B – San Andres Dolomite
The second coreflood was on San Andres core from the Seminole field in west Texas (Fig. 28).
The primary component of the San Andres is dolomite. A significant increase in porosity
occurred during the brine flood (Fig. 29) due to anhydrite dissolution. Brine #2 composition was
patterned after Seminole produced water (Table 5). Extensive porosity and permeability
increases occurred during the WAG portion of the flood with dissolution of dolomite and further
dissolution of anhydrites (Figs. 30 and 31).
Limestone
15202530354045
0 20 40 60Volume Injected [l]
Perm
eabi
lity[
mD
First CO2
Last half core
Total core
•

37
Fig. 29. Post waterflood sectioned core after brine flood showing anhydrite dissolution.
Upstream Mid-core
Downstream
Fig. 28. Pre-flood dolomite, Seminole San Andres, Gaines County TX. Vuggy anhydritic, very fine grain-dominated packstone, anhydrite nodules, and stylolites.

38
Fig. 30. Post-WAG Seminole San Andres core showing dolomite dissolution with additional anhydrite dissolution.
Fig. 31. Measured and calculated porosity and permeability during the flooding of San Andres dolomite. COREFLOOD C – INDIANA LIMESTONE WITH BRINE #3 TRACER #1
The third coreflood was on quarried Indiana limestone core (Fig. 32) with a co-injection of brine
having high levels of metal tracers manganese and strontium added to the brine as chlorides,
100 120 140 160 180 200 220 240 260 Porosity exp.Porosity simulatedPerm. exp.Perm. calculated
Initial PV=41.5cc Final PV=68.3cc
Permeability [mD]
1
1
1
1
1
1
1
1
2
2
0 5 10 15
Total Volume
Porosity [%]
246
8
UpstreamMid- core
Downstream
Porosity [%]

39
which are naturally found at very low levels in this limestone. The limestone is over 98% calcite
(Figs. 37 and 38) in the non-reacted areas. A solution channel formed in the first 15 cm of
Segment A (Figs. 33 and 34) while over all permeability and porosity stayed about the same or
decreased (Fig. 35). Significant deposits of manganese and strontium occurred as carbonates
throughout the core shown in the plot in Fig. 36 and BSE images and quantitative analysis shown
Figs. 37 and 38. It was suspected that the system was oversaturated with the tracer carbonates
and that in a new system the tracer quantities would be reduced significantly.
Diameter [cm] Length [cm] Porosity [%] Segment A 5.03 17.15 16.91 Segment B 5.03 39.37 17.54 Entire Core 5.03 56.52 17.35
Fig. 32 Pre-flood limestone core.
Seg-A
Seg-B
INLET
OUTLET

40
Fig. 33. Post-flood limestone core sectioned.
IIL Fig. 34. End view of Segment A inlet.
Fig. 35. Permeability results limestone (Coreflood C).
Seg-B
Seg-A
Seg-B
0
2
4
6
8
10
12
14
16
18
20
0 20 40 60 80 100 120 140
Pore Volumes Fluid Injected
K [m
d]
0
200
400
600
800
1000
1200
1400
1600
1800
2000
Seg-
A k
[md]
EntireSeg-BSeg-A

41
Fig. 36. Cross-section composition for manganese and strontium along the length of both core segments in Coreflood C.
Fig. 37. BSE Quantitative analysis [% as carbonate] for calcium, magnesium, manganese, and
strontium.
200um 20um
1 2
3
@ 35 cm zonation
Ca Mg Mn Sr 1. 98.7 0.65 0.62 0.00 2. 35.2 0.32 64.1 0.20 3. 19.4 0.30 79.7 0.28
10
100
1000
10000
100000
0 10 20 30 40 50
Distance [cm]
Mn
[ppm
]
100
1000
Sr [p
pm]
Sr base
Sr
Mn base
Mn

42
Fig. 38. BSE Quantitative analysis [% as carbonate] for calcium, magnesium, manganese, and strontium.
COREFLOOD D – INDIANA LIMESTONE & COREFLOOD E – LOCKPORT
DOLOMITE (both with Brine #4 Tracer #2)
The fourth (D) coreflood was on quarried Indiana limestone, and the fifth (E) on quarried
Lockport dolomite. Each was performed at 2000 psig and 100ºF with co-injected CO2 and Brine
#4. Brine #4, compared to Brine #3, contained no strontium, less than 4% as much manganese
and magnesium, similar calcium concentration, and increased sodium to make up to a similar
level of dissolved solids. The intent was to have levels of tracer high enough to detect but not
high enough to saturate the system with manganese. In addition to the tests performed during the
earlier test series, three CT scans were performed on each core segment: one on the fresh core,
one at an interval during the flood, and the final after the last flood period; a bromide tracer
diffusivity test was performed for each system (Figs. 43–46 and 52–55), and in situ fluid samples
were taken for compositional analysis to compare with ambient samples.
Figure 39 is a view of all three limestone sections after the first flood period. The flood
had to be stopped because the core sleeve failed due to dissolution, creating a cavity near the
inlet. In the limestone test injection was interrupted twice due to sleeve failure. After each flood
Ca Mg Mn Sr 1. 98.9 0.94 0.05 0.00 2. 30.5 0.47 68.6 0.26
1 2
200um 20um
@ 15 cm
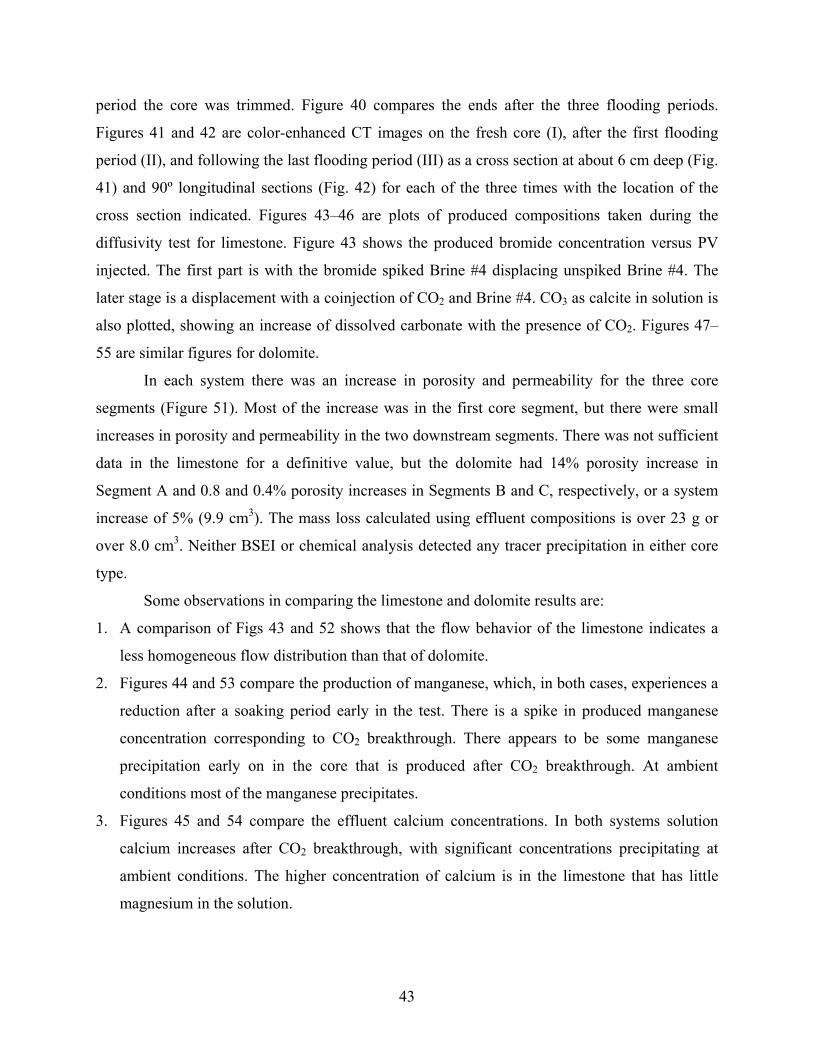
43
period the core was trimmed. Figure 40 compares the ends after the three flooding periods.
Figures 41 and 42 are color-enhanced CT images on the fresh core (I), after the first flooding
period (II), and following the last flooding period (III) as a cross section at about 6 cm deep (Fig.
41) and 90º longitudinal sections (Fig. 42) for each of the three times with the location of the
cross section indicated. Figures 43–46 are plots of produced compositions taken during the
diffusivity test for limestone. Figure 43 shows the produced bromide concentration versus PV
injected. The first part is with the bromide spiked Brine #4 displacing unspiked Brine #4. The
later stage is a displacement with a coinjection of CO2 and Brine #4. CO3 as calcite in solution is
also plotted, showing an increase of dissolved carbonate with the presence of CO2. Figures 47–
55 are similar figures for dolomite.
In each system there was an increase in porosity and permeability for the three core
segments (Figure 51). Most of the increase was in the first core segment, but there were small
increases in porosity and permeability in the two downstream segments. There was not sufficient
data in the limestone for a definitive value, but the dolomite had 14% porosity increase in
Segment A and 0.8 and 0.4% porosity increases in Segments B and C, respectively, or a system
increase of 5% (9.9 cm3). The mass loss calculated using effluent compositions is over 23 g or
over 8.0 cm3. Neither BSEI or chemical analysis detected any tracer precipitation in either core
type.
Some observations in comparing the limestone and dolomite results are:
1. A comparison of Figs 43 and 52 shows that the flow behavior of the limestone indicates a
less homogeneous flow distribution than that of dolomite.
2. Figures 44 and 53 compare the production of manganese, which, in both cases, experiences a
reduction after a soaking period early in the test. There is a spike in produced manganese
concentration corresponding to CO2 breakthrough. There appears to be some manganese
precipitation early on in the core that is produced after CO2 breakthrough. At ambient
conditions most of the manganese precipitates.
3. Figures 45 and 54 compare the effluent calcium concentrations. In both systems solution
calcium increases after CO2 breakthrough, with significant concentrations precipitating at
ambient conditions. The higher concentration of calcium is in the limestone that has little
magnesium in the solution.
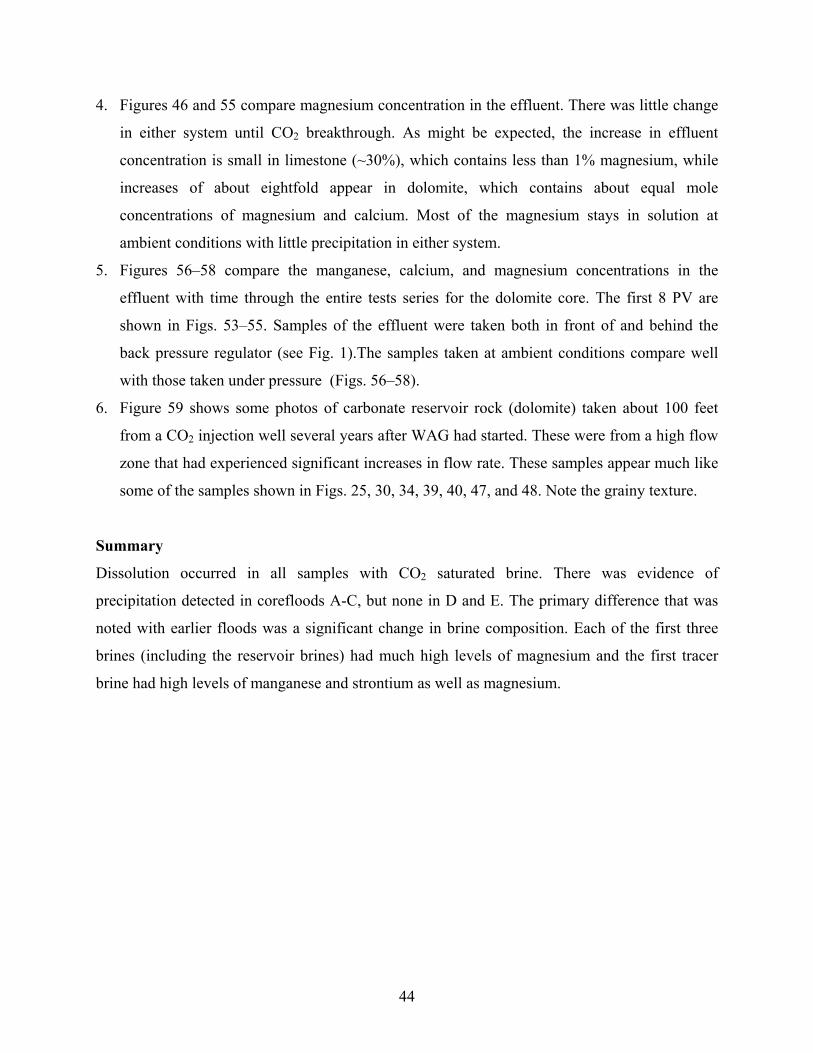
44
4. Figures 46 and 55 compare magnesium concentration in the effluent. There was little change
in either system until CO2 breakthrough. As might be expected, the increase in effluent
concentration is small in limestone (~30%), which contains less than 1% magnesium, while
increases of about eightfold appear in dolomite, which contains about equal mole
concentrations of magnesium and calcium. Most of the magnesium stays in solution at
ambient conditions with little precipitation in either system.
5. Figures 56–58 compare the manganese, calcium, and magnesium concentrations in the
effluent with time through the entire tests series for the dolomite core. The first 8 PV are
shown in Figs. 53–55. Samples of the effluent were taken both in front of and behind the
back pressure regulator (see Fig. 1).The samples taken at ambient conditions compare well
with those taken under pressure (Figs. 56–58).
6. Figure 59 shows some photos of carbonate reservoir rock (dolomite) taken about 100 feet
from a CO2 injection well several years after WAG had started. These were from a high flow
zone that had experienced significant increases in flow rate. These samples appear much like
some of the samples shown in Figs. 25, 30, 34, 39, 40, 47, and 48. Note the grainy texture.
Summary
Dissolution occurred in all samples with CO2 saturated brine. There was evidence of
precipitation detected in corefloods A-C, but none in D and E. The primary difference that was
noted with earlier floods was a significant change in brine composition. Each of the first three
brines (including the reservoir brines) had much high levels of magnesium and the first tracer
brine had high levels of manganese and strontium as well as magnesium.

45
Fig. 39. Three limestone core segments after the first flooding period.
Fig. 40. First segment inlet after each flooding period (limestone Coreflood D).
Fig. 41. CT cross section images at ~6 cm from the end of the original limestone Segment A inlet. Pre-flood (IL), after the first flooding period (IIL), and post-flood (IIIL) (limestone Coreflood D).
IIL
IL
IIIL
IIL
IIL IIIL

46
Fig. 42. CT longitudinal sections of core after first flooding period with the corresponding cross sections (Fig. 18 marked (limestone Coreflood D).
Fig. 43. Bromide diffusivity and alkalinity results (limestone Coreflood D).
IIIL IILIL
0
10
20
30
40
50
0 1 2 3 4 5 6Brine Injection [PV]
Br [
ppm
]
0
50
100
150
200
250
300
Alk
alin
ity [p
pm]
Br ppmBrine + CO2Alkalinity

47
Fig. 44. Manganese concentration in the effluent (limestone Coreflood D).
Fig. 45. Calcium concentration in the effluent (limestone Coreflood D).
Fig. 46. Magnesium concentration in the effluent (limestone Coreflood D).
0
50
100
150
200
0 1 2 3 4 5Brine Injection [PV]
Mn
[ppm
]
0
200
400
600
800
1000
1200
1400
Brin
e R
esid
ence
Tim
e [m
inMn in Solution
Mn in Precipitant
Mn TotalBrine Residence Time
1000
1500
2000
2500
3000
0 1 2 3 4 5Brine Injection [PV]
Ca
[ppm
]
0
200
400
600
800
1000
1200
1400
Res
iden
ce T
ime
[min
]
Ca in SolutionCa in PrecipitantCa TotalBrine Residence Time
0.0
10.0
20.0
30.0
40.0
0 1 2 3 4 5Brine Injection [PV]
Mg
[ppm
]
0
200
400
600
800
1000
1200
1400R
esid
ence
Tim
e [m
in
Mg in SolutionMg in PrecipitantMg TotalBrine Residence Time
ID

48
Fig. 47. Three dolomite core segments after the first flooding period (Coreflood E).
Fig. 48. Inlet of first segment after each flooding period (dolomite Coreflood E).
Fig. 49. CT cross section images at ~6 cm from the end of the original dolomite Segment A inlet.
Pre-flood (ID), after the first flooding period (IID), and post-flood (IIID) (Coreflood E).
Fig. 50. Dolomite core segment porosity and permeability trends (dolomite Coreflood E).
ID IID IIID
IID IIID
64
66
68
70
72
74
76
0 5000 10000 15000 20000 25000 30000 35000
Co-injection [cc]
Cor
e Se
gmen
t PV
[cc]
.
0
20
40
60
80
100
120
140
160Pe
rmea
bilit
y [m
D]
.PV APV BPV CPerm APerm BPerm C
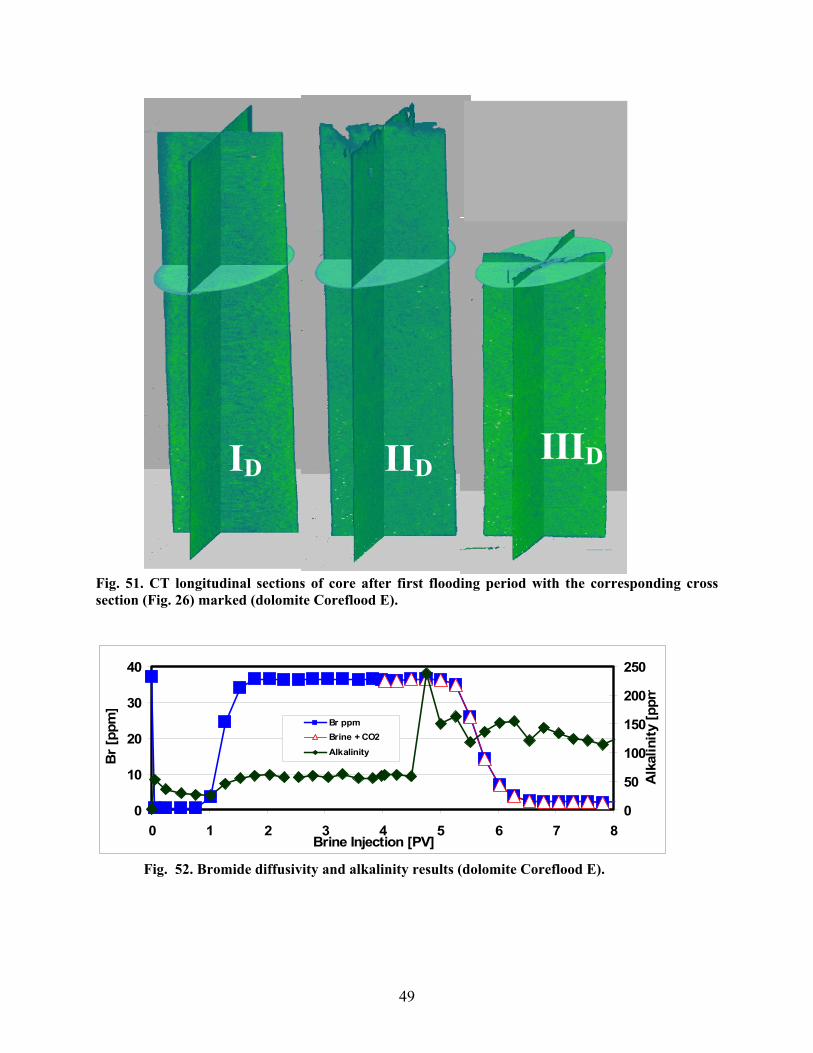
49
Fig. 51. CT longitudinal sections of core after first flooding period with the corresponding cross section (Fig. 26) marked (dolomite Coreflood E).
Fig. 52. Bromide diffusivity and alkalinity results (dolomite Coreflood E).
ID IIID IID
0
10
20
30
40
0 1 2 3 4 5 6 7 8Brine Injection [PV]
Br
[ppm
]
0
50
100
150
200
250A
lkal
inity
[ppm
Br ppmBrine + CO2Alkalinity
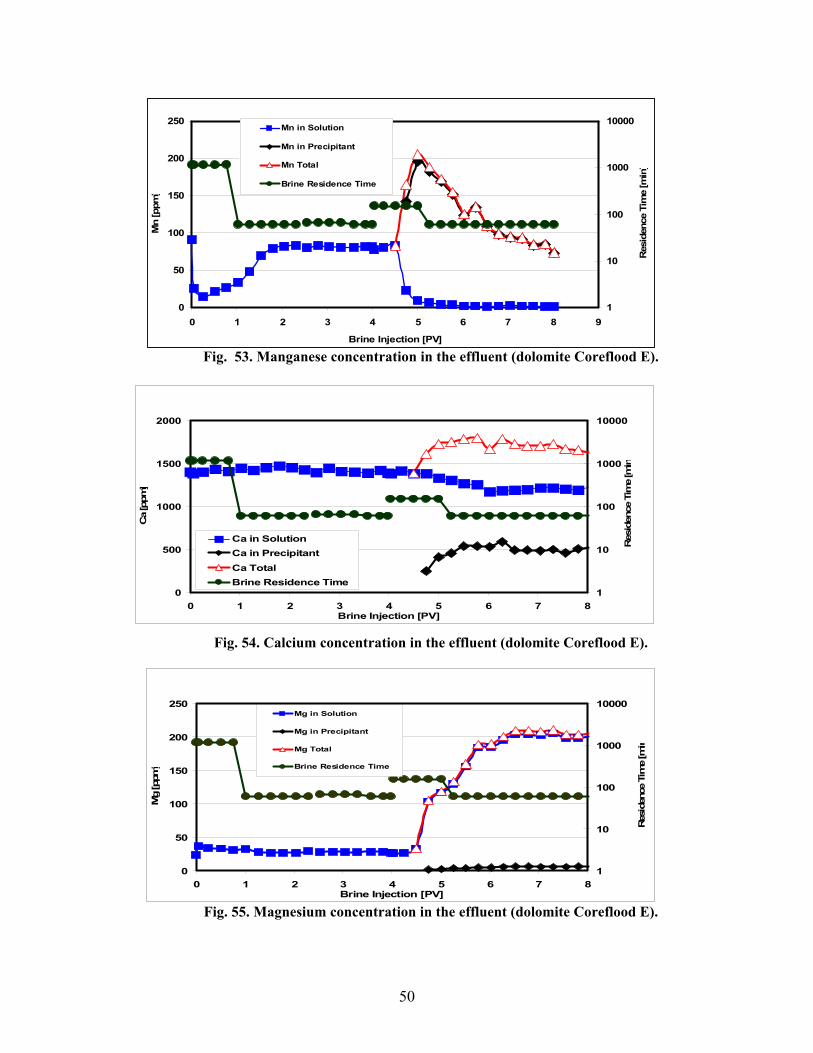
50
Fig. 53. Manganese concentration in the effluent (dolomite Coreflood E).
Fig. 54. Calcium concentration in the effluent (dolomite Coreflood E).
Fig. 55. Magnesium concentration in the effluent (dolomite Coreflood E).
0
500
1000
1500
2000
0 1 2 3 4 5 6 7 8Brine Injection [PV]
Ca
[ppm
]
1
10
100
1000
10000
Res
iden
ce T
ime
[min
Ca in SolutionCa in PrecipitantCa TotalBrine Residence Time
0
50
100
150
200
250
0 1 2 3 4 5 6 7 8 9
Brine Injection [PV]
Mn
[ppm
]
1
10
100
1000
10000
Res
iden
ce T
ime
[min
]
Mn in Solution
Mn in Precipitant
Mn Total
Brine Residence Time
0
50
100
150
200
250
0 1 2 3 4 5 6 7 8Brine Injection [PV]
Mg
[ppm
]
1
10
100
1000
10000
Res
iden
ce T
ime
[min
Mg in Solution
Mg in Precipitant
Mg Total
Brine Residence Time

51
Dolomite, Solution Mn Concentration
0.0
50.0
100.0
150.0
200.0
250.0
0 20 40 60 80 100 120 140 160 180PV Inj.
Mn
ppm
before CO2 injection after CO2 injectionLP1 HP1LP2 HP2LP3 HP3LP4 HP4
Fig. 56. Fluid Mn production versus PV injected brine for dolomite.
Dolomite, Solution Ca Concentration
1000
1200
1400
1600
1800
2000
2200
2400
0 20 40 60 80 100 120 140 160 180PV Brine Inj
ppm
before CO2 injection after CO2 injectionLP 1 LP2LP3 LP4HP 1 HP2HP3 HP4
Fig. 57. Fluid Ca production versus PV injected brine for dolomite.
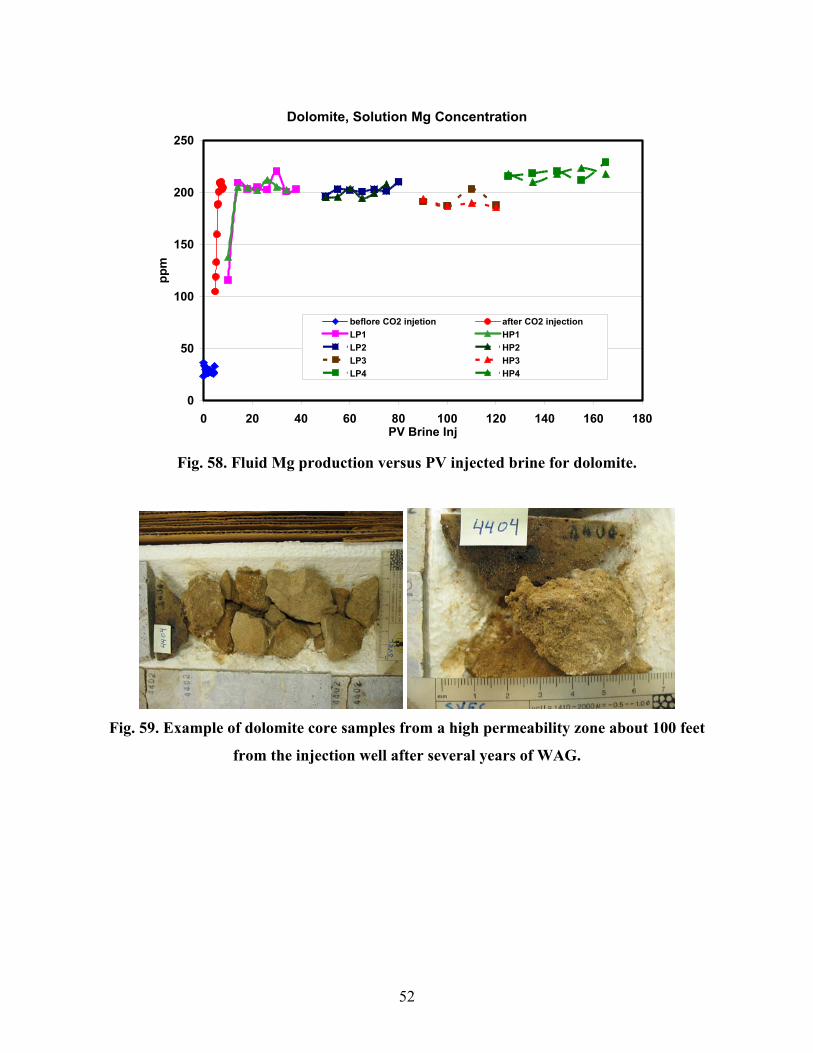
52
Dolomite, Solution Mg Concentration
0
50
100
150
200
250
0 20 40 60 80 100 120 140 160 180PV Brine Inj
ppm
beflore CO2 injetion after CO2 injectionLP1 HP1LP2 HP2LP3 HP3LP4 HP4
Fig. 58. Fluid Mg production versus PV injected brine for dolomite.
Fig. 59. Example of dolomite core samples from a high permeability zone about 100 feet
from the injection well after several years of WAG.

53
Chapter 3. Flow Rate and Injectivity
Flow rates increase approaching the wellbore for both injection and production wells. Assuming
a constant fluid density, as the wellbore is approached the flow rate increases inversely
proportional to the distance from the wellbore; the closer the proximity, the higher the rate.
Moving away from the injector, the fluid expands, decreasing the rate at which the fluid velocity
decreases due to an increase in volume corresponding to a decrease in density. Near the
production well the pressure decreases as one approaches the wellbore. This decrease in pressure
results in a decrease in density of the produced fluid. This decrease results in an increase in
volume and subsequently in the flow rate. With the increase in pressure gradient due to non-
Darcy flow behavior and the expanding fluid compounding the flow rate near wellbore, the
pressure drop can become extremely large; with possible liquid dropout the productivity of the
reservoir can be significantly reduced. In our work an Indiana limestone, Berea sandstone, and
Dakota sandstone were tested for flow rates over three orders of magnitude, pore pressures from
1000 to 10,000 psi and overburden pressure in both the axial and radial directions form 1000 to
10,000 psi.
3.1 Experimental Study of Overburden and Stress Influence on Non-Darcy Gas Flow in
Dakota Sandstone16
A series of laboratory experiments were conducted to investigate the influence of overburden
and in-situ stresses on non-Darcy gas flow behavior in Dakota sandstone. Nitrogen was flooded
through cylindrical core in a triaxial core holder under specific condition of temperature at
100ºF, with core outlet pore pressure at 500 psi, axial and radial stress from 2,000 to 10,000 psi,
and nitrogen reservoir pump pressure at 2,000 psi with pump flow rates from 25 to 10,000 cc/hr
at 80ºF. Permeability and non-Darcy coefficient were determined using Forchheimer’s method. It
was found that with the increase of overburden and in-situ stresses, permeability decreases while
non-Darcy flow coefficient increases. Average effective normal stress and shear stress were used
to quantitatively express the influence of overburden and in-situ stresses. It was found that
average effective normal stress has a good linear relationship with both permeability and non-

54
Darcy flow coefficient. In contrast, average shear stress did not appear to influence the
permeability and non-Darcy coefficient.
Summary
From this study, the following conclusions are arrived on the non-Darcy nitrogen flow behavior
through Dakota sandstone:
1. Non-Darcy flow behavior is influenced by overburden/in-situ stresses. The higher the
overburden and in-situ stress level, the lower the permeability and the higher the non-Darcy
flow coefficient.
2. Linear correlations were determined between permeability, non-Darcy flow coefficient and
overburden/ in-situ stresses in terms of average effective normal stress. Results also show
that average shear stress does not correlate to permeability and non-Darcy flow coefficient,
indicating that pore deformation is a less important factor in comparing to compaction.
3. This work confirms previous studies, which indicated that though the Forchheimer equation
is useful in describing high velocity flow in porous media, that in many cases it is not
sufficient.
3.2 Laboratory Investigation of Stress-Sensitivity of Non-Darcy Gas Flow Parameters17
Non-Darcy flow parameters were investigated in 159 series of high pressure/high
temperature/high velocity gas flooding experiments on five different rock samples under field
reservoir conditions. The results of these experiments reconfirm and extend to new conditions
that permeability increases, while non-Darcy flow coefficient decreases with effective stresses;
both are independent of shear stresses. General formulas have been developed to quantify the
stress sensitivity in terms of nominal non-Darcy parameters. General equations have been
proposed to predict the change of permeability and non-Darcy flow coefficient with given
effective stresses and nominal non-Darcy flow parameters.

55
Summary
In summary, 159 series of high temperature, high pressure and high velocity gas flooding
experiments have been conducted in five rocks to investigate the stress sensitivity of non-Darcy
flow parameters. The tested rocks have petrophysical properties that represent many reservoir
formations. The test conditions cover the majority of field in-situ stress fields, temperatures and
gas production/injection flow rates. All the experiments gave consistent results which confirmed
and extended previous conclusions observed in one single rock at a single temperature. Based on
these experiments in this study, the following conclusions are derived:
1. Permeability, k, decreases while non-Darcy flow coefficient, β, increases linearly with
effective stresses.
2. Stress sensitivity of non-Darcy flow parameters, sk and sβ, is proportional to the nominal
permeability, k0, and nominal non-Darcy flow coefficient, β0, regardless of rock properties,
in-situ stress fields, and temperatures. General stress sensitivity functions have been
developed and can be used to estimate the stress sensitivity of non-Darcy flow parameters.
3. General functions, k(σeff) and β(σeff) were derived in terms of stress sensitivity, sk and sβ, and
nominal non-Darcy flow parameters, k0 and β0. Influence of reservoir pressure change on k
and β can be predicted using these functions.
4. Under the same effective stress, permeability increases with reservoir pressures and
decreases with reservoir temperatures; non-Darcy flow coefficient changes in an opposite
manner under these two factors.
5. Shear stress does not have significant correlation with permeability and non-Darcy flow
coefficient, indicating that k and β are not sensitive to the change of shear stresses.
3.3 Comparison of Non-Darcy Flow of CO2 and N2 in a Carbonate Rock18
In this part of the project, 85 series of high-velocity gas flooding experiments under high-
pressure and high-temperature conditions were used to investigate the non-Darcy behavior
results of CO2 compared to the previous studies using N2. It was found that pore pressure has
more influence on permeability in CO2 flooding than it does in N2 flooding. In contrast,
temperature has definite and consistent influence on both permeability and non-Darcy flow
coefficient in N2 flooding, but the same influence in CO2 flooding was not observed. Mechanism

56
behind these differences is attributed to physical property differences of the two gases. Much of
the work was near the CO2 critical point or liquid regions. Other anomalies are attributed to
thermal effects caused by expansion cooling of the CO2. Field data indicates that this
phenomenon could be responsible for productivity loses in high flow rate CO2 wells.
Accordingly, attention should be paid to avoid flowing CO2 at conditions near its critical point.
Summary
Based on 85 series of laboratory experiments, comparisons between the non-Darcy flow
behaviors of N2 and CO2, flooding under high-pressure/high temperature revealed that non-
Darcy flow parameters in CO2 flooding are different from those in N2 flooding. Mechanisms for
the differences have been analyzed, and significance to field operations discussed. In summary,
the following conclusions were obtained.
1. Non-Darcy flow parameters measured in CO2 flooding are different from those in N2
flooding while the non-Darcy flow coefficient in CO2 flooding is slightly higher than that in
N2 flooding.
2. Pore pressure has an obvious influence on permeability in CO2 flooding; a similar influence
on permeability in N2 flooding is less obvious.
3. Temperature shows clear and consistent influence on non-Darcy flow parameters in N2
flooding, but its influence in CO2 flooding is less pronounced.
4. Some difference in non-Darcy flow behavior between CO2 and N2 is attributed to a cooling
effect in CO2 flooding. As temperature and pressure within the core approaches critical point
conditions of CO2, the cooling effect enhances. Multiphase flow may occur within the core.
5. This cooling effect and the resulting multiphase flow could be responsible for the loss of
injectivity and productivity in some CO2 wells. Care should be paid to avoid flowing CO2 at
conditions close to the critical point.
3.4 A Criterion for Non-Darcy Flow in Porous Media19
Non-Darcy behavior is important for describing fluid flow in porous media in situations where
high velocity occurs. A criterion to identify the beginning of non-Darcy flow is needed. Two
types of criteria, the Reynolds number and the Forchheimer number, have been used in the past
for identifying the beginning of non-Darcy flow. Because each of these criteria has different

57
versions of definitions, consistent results cannot be achieved. Based on a review of previous
work, the Forchheimer number is revised and recommended here as a criterion for identifying
non-Darcy flow in porous media. Physically, this revised Forchheimer number has the advantage
of clear meaning and wide applicability. It equals the ratio of pressure drop caused by liquid-
solid interactions to that by viscous resistance. It is directly related to the non-Darcy effect.
Forchheimer numbers are experimentally determined for nitrogen flow in Dakota sandstone,
Indianan limestone and Berea sandstone at flowrates varying by four orders of magnitude. These
results indicate that superficial velocity in the rocks increases nonlinearly with the Forchheimer
number. The critical Forchheimer number for non-Darcy flow is expressed in terms of the
critical non-Darcy effect. Considering a 10% non-Darcy effect, the critical Forchheimer number
would be 0.11.
Summary
1. The two types of non-Darcy criteria, the Reynolds number and the Forchheimer number, for
fluid flow in porous media have been reviewed. A revised Forchheimer number is
recommended due to the clear meaning of variables involved.
2. The Forchheimer number represents the ratio of pressure drop consumed by liquid-solid
interactions to that by viscous resistance. It has a direct relation to non-Darcy effect.
3. Forchheimer numbers for nitrogen flow at varied flowrates in Dakota sandstone, Indiana
limestone and Berea sandstone are determined using experimentally measured permeability
and non-Darcy coefficient. The results add considerably to the array of Forchheimer numbers
for characterizing fluid flow in consolidated rocks.
4. An expression for the critical Forchheimer number is given in terms of non-Darcy effect
limit. This non-Darcy effect-based expression allows the user to define the critical
Forchheimer number according to the features of the problem, and should be scientifically
more reasonable in comparing to a fixed critical value. A good reference for the critical
Forchheimer number is 0.11, which corresponds to a 10% non-Darcy effect.

58
Chapter 4. Surfactant Sorption, Stability, and Mobility
Chapter 4 summarizes research results in studies on foam stability, interfacial tension, surfactant
adsorption and desorption, and mobility control. During this period of the project, foam stability
as a function of pH, brine salinity, brine composition, temperature, pressure, and surfactant
concentration and type were explored. Surfactant adsorption and desorption kinetics and
equilibrium versus surfactant concentration and type, temperature, pH, brine composition and
salinity, and rock and mineral type were studied.
4.1 Cost Reduction and Injectivity Improvements for CO2 Foams for Mobility Control20
The results of a series of tests on CO2 foams identified chemical cost reduction derived from the
synergistic effects of co-surfactant systems using a good foaming agent and a less expensive,
poor foaming agent. The required good foaming agent was reduced by at least 75%. Also the
effect on injectivity was reduced by as much as 50% using the co-surfactant system, compared to
a previously used surfactant system. Test results demonstrate that mobility control of injected
CO2 for improved oil recovery can be achieved with significant reduction in the chemical cost of
SAG (injection of surfaction solution alternating with gas), improved injectivity of SAG, and
improved economics of CO2 injection project when compared to reported systems.
Summary
Several concepts were inferred from the laboratory tests that are recommended for field tests:
1. The concentration of CD with CLS can be lowered well below the concentration required
without CLS and still have significant foaming/diversion capability, thus oil production.
2. The co-surfactant system had significant oil production with much less effect on injectivity
(lower pressure drop).
3. The co-surfactant system foaming properties seemed to be less sensitive to oil saturation.
Fluid diversion caused by foam started before oil saturation in the high permeability region
was reduced to miscible residual saturation.
4. The co-surfactant system appears to have the possibility of varying concentrations of the two
surfactants in such a way as to tailor a system to optimize the competing effects of sweep
injectivity.

59
5. The analysis of the EVGSAU (East Vacuum Grayburg San Andres Unit) results using the
results of the co-surfactant system suggests that the new technology can be profitable.
4.2 Salinity, pH, and Surfactant Concentration Effects on CO2-Foam21
The influence of a number of parameters on CO2-foam stability and surfactant adsorption at
reservoir conditions were determined in a series of tests. Changes of pH from 1 to 12, salinity
from 0 to 25 wt%, and surfactant concentration from 0 to 1 wt % were tested for foam stability in
a bubble chamber and for adsorption in a static adsorption apparatus using pure kaolinite powder.
The mechanisms by which pH and salinity influence CO2-foam behavior were also elucidated.
Stability of CO2-foam is surfactant concentration-dependent. The foam was stable under
all tested pH and salinities at concentrations both below and above the critical micelle
concentration (CMC) except at the lowest concentration tested (0.005 wt%). The adsorption of
surfactant onto kaolinite increased with salinity for both NaCl and CaCl2 with the divalent salt
system inducing a higher adsorption onto the kaolinite.
Summary
1. CO2 foam stability is surfactant concentration-dependent. Only at CD concentration of 0.005
wt%, well below the CMC, can coalescence of bubbles be observed.
2. Adsorption onto kaolinite increases with surfactant concentration.
3. Foam stability is insensitive to a wide range of surfactant (CD) concentrations in synthetic 2
wt% brine (NaCl:CaCl2 weight ratio of 3:1).
4. Adsorption increases with salinity for both NaCl and CaCl2, with the divalent salt system
inducing a higher adsorption on the kaolinite.
5. Foam stability is insensitive to salinity when CD concentrations are 0.025 wt% and high, but
is sensitive to salinity when CD concentration is 0.005 wt%.
6. Adsorption decreases with pH due to the electrostatic repulsion between bubbles and the
grains of rock.
7. Foam stability is insensitive to pH when CD concentrations are 0.05 wt% and high but
decreases with pH decreases when CD concentration is 0.005 wt%.

60
4.3 CO2 Foam Behavior: Influence of Temperature, Pressure, and Concentration of
Surfactant22
In these tests, a high-pressure, high-temperature (HPHT) bubble chamber apparatus was used to
determine CO2 foam stability, interfacial tension (IFT) between HPHT CO2 and surfactant
solutions and critical micelle concentration (CMC). CD was used for this study. Changes of
temperature from 25 to 75ºC, pressure from 800 to 2000 psig, and surfactant concentration from
0.005 wt% to 1 wt% were tested for foam stability, IFT and CMC. The relationship of foam
stability to IFT was also addressed.
IFT decreased with surfactant concentration below the CMC and was essentially constant
above the CMC, increasing with the increase of temperature and the decrease of pressure.
Stability of CO2-foam is surfactant concentration-dependent. The foam was stable under all
tested temperatures at surfactant concentrations of 0.1 wt% and above, and decreased with
increase of temperature at surfactant concentrations of 0.05 wt%. The foam was stable under all
tested pressure at surfactant concentrations of 0.025 wt% and above, and decreased with increase
of temperature at surfactant concentration of 0.005 wt%.
Summary
1. IFT was determined to decrease with surfactant concentration below the CMC and to be
essentially constant above the CMC, to increase with the increase of temperature and
decrease of pressure, to remain essentially constant over the initial pH range from 1 to 12,
and to be insensitive to brine concentration over a wide range with a minimum around 10%.
2. Foam is stable at 60ºC and below, at all tested temperatures and CD concentrations, except at
the lowest CD concentration (0.005 wt%) tested. However, foam stability increases with CD
concentration at 75ºC.
3. Foam is stable under all tested pressures at surfactant concentrations of 0.025 wt% and
above, and foam stability decreases with increasing temperature at the surfactant CD
concentration of 0.005 wt%.
4. Interfacial tension (IFT) does not directly correlate to foam stability and foam stability
cannot be predicted solely by the value of IFT.

61
4.4 Parameters Effecting and Magnitude of Adsorption of Calcium Lignosulfonate onto
Five Minerals8
Lignosulfonate (LS), a paper waste product, has been used as a sacrificial agent and proposed as
a co-surfactant for improved oil recovery (IOR). Its effectiveness mainly depends on its
adsorption properties onto mineral sites. This series of experiments investigated calcium
lignosulfonate (CLS) adsorption onto minerals common to oil reservoirs: silica, kaolinite,
bentonite, calcite, and dolomite. Comparing CLS adsorption density onto different minerals will
be an aid in estimating relative adsorption mass in a well-characterized reservoir.
A number of series of batch static adsorption experiments were carried out to study the
effects of CLS concentration, pH, salinity, brine hardness, and temperature on CLS adsorption
density onto five minerals. For silica adsorbent, CLS adsorption density was near zero at all
tested conditions. For the other four, adsorption density increased with the increase of CLS
concentration, salinity and valence, and decreased with increasing temperature. At pH above 7,
adsorption was neutral for the four systems; but at pH below 7, adsorption density increased with
increased pH for bentonite and kaolin clay, and decreased with increasing pH for calcite and
dolomite.
This study also elucidated adsorption mechanisms that operate under the various
conditions. The results of this research will aid in designing surfactant systems for specific
reservoir types and conditions.
Summary
To develop transport and sorption models and to better predict chemical requirement, the
adsorption density of pure components for five common reservoir rock minerals with varied
parameters was determined in this task. This information can be used for qualitative assessment
of chemical requirements in reservoir flooding processes.
Based on a series of batch static adsorption experiments of calcium lignosulfonate onto
five minerals common to reservoirs: silica, montmorillonite, kaolinite, dolomite and calcite, the
following conclusions were drawn:
1. For silica, CLS adsorption density was essentially zero at all tested conditions,
2. For the other four, adsorption increased with increasing concentration, salinity and valence,
and decreased with increasing temperature.

62
3. At pH below 7—neutral for all systems; above 7—increased with increased pH for
montmorillonite and kaolinite, and decreased for increasing pH for calcite and dolomite.
4. The order of CLS adsorption density onto the five minerals is:
montmorillonite >kaolinite>dolomite>calcite>silica.
4.6 Calcium Lignosulfonate Adsorption and Desorption on Berea Sandstone23
Adsorption and desorption studies were carried out with calcium lignosulfonate (CLS) on Berea
sandstone. Circulation experiments were performed to determine CLS adsorption isotherms and
the effects of CLS concentration, temperature, salinity, brine hardness, and injection rate on
adsorption density. Flow-through experiments were performed to assess the reversibility of CLS
adsorption and the influence of postflush rate, brine concentration, brine hardness, brine pH, and
temperature on the desorption process. Results indicated that CLS adsorption isotherms on Berea
sandstone follow the Freundlich Isotherm law. The results of this research on the effects of CLS
adsorption and desorption on Berea sandstone show that: (1) increasing CLS concentration and
salinity increases CLS adsorption density; (2) increasing temperature will decrease adsorption
density; (3) increasing injection rate of CLS solution will slightly decrease CLS adsorption
density, (4) post-flush rate and salinity of brine have a large impact on the CLS desorption
process; (5) the adsorption and desorption process are not completely reversible; and (5)
temperature and pH of the postflush brine have little effect on desorption.
Summary
In a chemical process in a reservoir, it is not uncommon to have over 90% of a component
required to satisfy adsorption onto the rock. Thus, understanding adsorption and desorption
processes is critical in assessing transport of chemicals and in accurately assessing the volume of
chemicals required for a successful operation. In this study, CLS was used to look at the effects
on sorption of a number of parameters for a single rock type, Berea sandstone.
Based on the results of CLS adsorption and desorption experiments using Berea
sandstone, the following conclusions can be drawn:
1. The CLS adsorption density on Berea sandstone was influenced by CLS solution
concentration, temperature, salinity, and injection rate. The results show that:
63
a. Increasing CLS concentration (to at least 25,000 mg/L) increases adsorption density.
b. The adsorption isotherm can be fit using Langmiur and Freundlich adsorption models.
c. Increasing temperature will decrease adsorption density. This is an indication that
physical adsorption is a principal mechanism controlling CLS adsorption.
d. Increasing brine and divalent concentration will increase CLS adsorption density.
e. Increasing the flow rate results in a slight decrease in adsorption density.
2. Postflush brine concentration, temperature, pH and injection rate have the following effects
on CLS desorption on Berea sandstone:
a. Two Freundlich adsorption isotherm equations with different slopes fit the desorption
isotherm curves well, indicating different adsorption/desorption mechanisms.
b. Temperature and pH have little effect on CLS desorption.
c. Increasing brine concentration reduces CLS desorption mass and may stop desorption.
d. Changing postflush flow rates changed the effluent concentration of CLS, indicating that
equilibrium was not reached and that the kinetics and/or diffusion are slow relative to the
flow rates.
3. Adsorption and desorption are not completely reversible in the time frame of the experiments
and desorption rates lag well behind adsorption rates in solution concentrations below 2600
mg/L CLS.
4. Core conditions before commencement of desorption experiments are the principal factors
influencing the recovery of CLS from Berea sandstone.
4.6 Calcium Lignosulfonate Transport through Berea Sandstone9
Another series of experiments looked at CLS transport mechanisms through Berea sandstone by
combining the experiment results of calcium lignosulfonate (CLS) adsorption onto Berea
sandstone and five powdered pure minerals that are found on sandstone. SEM and tracer
breakthrough experiments were carried out to describe sandstone cores and to address on
analyzing the transport mechanisms of CLS.
The equilibrium time of CLS adsorption onto porous Berea sandstone and powdered
minerals were compared. Results show that the equilibrium time for the former is much longer
than that for any of the latter, indicating that diffusion is the main mechanism controlling CLS
transport time through Berea sandstone. Effects of flow interruption or changing postflush rate

64
on effluent concentrations were investigated during desorption. Results show that in a coreflood
CLS desorption is not an equilibrium process under normal reservoir flow rate.
CLS adsorption densities onto five common reservoir minerals were compared. Results
show that silica, which constitutes more than 80% of Berea sandstone and is the bone structure
of sandstone, adsorbs little CLS, and that other minerals found in sandstone contribute most of
the adsorption of CLS onto Berea sandstone.
A dual porosity model is suggested to simulate CLS transport through Berea sandstone,
even though sandstone is generally regarded as a homogeneous porous medium.
Summary
1. The equilibrium time of CLS adsorption on porous Berea sandstone is much longer than any
of five powered pure minerals.
2. Diffusion is the principle mechanism to control equilibrium time of CLS adsorption onto
Berea sandstone.
3. CLS desorption onto Berea sandstone is a non-equilibrium process under normal reservoir
flow rate.
4. The adsorption of CLS onto silica, the primary component of Berea sandstone, is essentially
zero, and other minerals (minor components) contribute essentially all the adsorption of CLS
on Berea sandstone.
5. A dual porosity model is suggested to simulate CLS transport through Berea sandstone,
though sandstone is generally regarded as a homogeneous porous medium.
4.7 Kinetics and Equilibria of Calcium Lignosulfonate Adsorption and Desorption onto
Limestone24
Equilibria and kinetics are two basic properties needed to adequately understand the adsorption
and desorption processes between surfactants and rocks. The adsorption and desorption of
calcium lignosulfonate (CLS), commonly used as a sacrificial agent in surfactant-based EOR
processes, was examined in a series of dynamic depletion experiments.
Kinetics results show that adsorption and desorption are both time-dependent—not
instantaneous. Both adsorption and desorption were characterized by a biphasic pattern, a fast

65
step followed by a slow step. Apparent adsorption and desorption rate coefficients were
determined by a one-site second-order kinetic model. Desorption is a much slower process than
adsorption. Desorption is an unequilibrium process under normal reservoir flow rate condition.
Equilibrium results showed that CLS adsorption and desorption onto limestone can well
be described by Langmiur isotherm in our tested CLS concentration range, and increasing
concentration increases adsorption density. Both CLS adsorption and desorption are subject to
hysteresis. Increasing flow rate slightly decreased CLS equilibrium adsorption. Increasing both
NaCl and CaCl2 concentrations increased adsorption density; however, CaCl2 has a much greater
impact on the adsorption. Increasing pH decreased CLS adsorption onto limestone. The reasons
for different factors’ effect were elucidated through further investigation.
Summary
1. CLS adsorption and desorption onto limestone are both time-dependent, not instant. Both
adsorption and desorption were characterized by a biphasic pattern, a fast step followed by a
slow step.
2. CLS adsorption onto limestone follows the pseudo-second-order kinetic model for the whole
process, and it also follows diffusion equation at the later stage.
3. The pseudo-first-order and pseudo-second-order kinetic models were derived. CLS
desorption from limestone follows the pseudo-first-order kinetic model, the pseudo-second-
order kinetic model, and the diffusion model, except for the first two points.
4. Desorption is a much slower process than adsorption. A higher temperature has a higher
pseudo-adsorption rate.
5. CLS desorption from limestone is an unequilibrium process under normal reservoir flow rate
conditions.
6. CLS adsorption and desorption onto limestone can well be described by the Langmuir
isotherm in our tested CLS concentration range, and increasing concentration increases
adsorption density. CLS adsorption and desorption are subject to hysteresis.
7. Increasing NaCl and CaCl2 concentrations both increases adsorption density; CaCl2 has a
much greater impact on the adsorption.
8. CLS equilibrium adsorption increases with the increase of pH and the decrease of flow rate.
66
4.8 Kinetics and Equilibrium of Calcium Lignosulfonate Adsorption and Desorption onto
Dolomite
This section reports the results of studies on the adsorption and desorption of calcium
lignosulfonate (CLS) onto dolomite. Kinetic results have shown that adsorption and desorption
are both time-dependent, not instantaneous. Both adsorption and desorption were characterized
by a biphasic pattern: a fast step followed by a slow step. Apparent adsorption rate coefficients
were determined by a second-order kinetic model. Desorption did not reach equilibrium in the
rested core under normal reservoir flow rates. Equilibrium results show that CLS adsorption and
desorption onto dolomite are well-described by the Langmuir isotherm over the tested CLS
concentration range, and that increasing concentration increases adsorption density. There is
significant hysteresis between CLS adsorption and desorption isotherms. Increasing both NaCl
and CaCl2 concentrations increased adsorption density; however, CaCl2 had a much greater
impact on the adsorption. The reasons for the effects of the different factors are elucidated in this
chapter.
Equilibrium and kinetics. Equilibrium and kinetics are basic to the proper understanding of
adsorption and desorption processes between surfactants and rocks.34 Equilibrium data provide
information about the final state of a system, and kinetic data are concerned especially with rates
of change. Equilibrium adsorption of lignosulfonate onto certain rocks has been
studied.3,20,23,26,31,33-35 Little, however, has appeared in literatures concerning lignosulfonate
adsorption kinetics. Knowledge of the adsorption and desorption rates aids in discerning the
mechanisms controlling surfactant transport through reservoirs and predicting the fate of
surfactant to provide cost-effective injection strategies. As Section 4.4 summarized the study of
kinetics and equilibrium of CLS adsorption onto limestone, so this chapter focuses on the
kinetics and equilibrium of CLS adsorption and desorption onto dolomite.
Experimental Materials. In each test 2 wt% (1.5 wt% NaCl and 0.5 wt% CaCl2) synthetic brine
was used unless otherwise stated. The lignosulfonate used in this study is Lignosite®100 calcium
lignosulfonate (CLS), obtained from the Georgia-Pacific Corporation. The product provided is a
powder produced by sulfonation of softwood lignin. A spectrophotometer was used to determine

67
the concentration of CLS in solutions. CLS has a maximum absorbance in the neighborhood of
283 nm. Detailed information on CLS solution preparation and concentration determination is
described in the literature.23
Table 6. Parameters of Dolomite Core
Code Length, cm
Diameter, cm
Volume, cm3
Mass, g
PV, cm3
Porosity, %
Permeability, md
D01 5.70 3.81 64.99 150.47 10.36 15.94 24.72
Table 7. Experiment Schedule of CLS Adsorption/Desorption onto Dolomite
Series No Experiment Description
D01-A Adsorption: Establish CLS adsorption isotherm; Desorption: Establish CLS desorption isotherm; Desorption: Interruption effect on desorption process(Inject 2% brine to flush the core at 15 cm3/hr, direct flow).
D01-B Adsorption: NaCl concentration effect on equilibrium concentration. Desorption: Injection rate effect on desorption process. (Inject 5% NaCl brine to flush the core, direct flow)
D01-C Adsorption: CaCl2 concentration effect on equilibrium concentration. Desorption: Injection rate effect on desorption process.
D01-D Adsorption kinetics: circulate 4,794 mg/L CLS solution at 23 ºC (core was saturated by distilled water before circulation); Desorption: Inject 2% brine to flush the core at 15 cm3/hr(direct flow)
D01-E Adsorption kinetics: circulate 4,833 mg/L CLS solution at 45 ºC (core was saturated by 2% brine before circulation); Adsorption: temperature effect on CLS equilibrium adsorption Desorption: Inject 2% brine to flush the core at 15 cm3/hr(direct flow)
D01-F Adsorption kinetics: circulate 4,830 mg/L CLS solution at 23 ºC (core was saturated by 2% brine before circulation); Desorption: Inject 2% brine to flush the core at 15 cm3/hr(direct flow)
Note: D01-D and D01-F were carried out at 23ºC; other experiments were carried out at 45 ºC unless specifically mentioned.
The core material used in this study was dolomite, composed mainly of CaMg(CO3)2.36
The properties and parameters of the core used in this study are found in Table 6. Six series of
adsorption/desorption experiments were run in this core; the schedules for all the experiment
series are found in Table 7. Between every two series of experiments, the core was flushed with
400 cm3 (~38 pore volumes (PV)) of tetrahydrofuran (THF), dried using nitrogen gas flow, and
evacuated before being resaturated with 2 wt% brine or distilled water (distilled water was used
to resaturate the core before experiments D01-B, D01-C and D01-D and brine for the other
three).

68
Experimental methods. Two dynamic flow methods, circulation and flow-through experiments,
were used to study CLS adsorption and desorption onto dolomite core; these methods have been
detailed in an earlier annual report.34,35
Results: Kinetics of CLS Adsorption onto Dolomite. Circulation experiments were carried out
to investigate the effect of contact time versus adsorption of CLS onto dolomite at the initial CLS
concentration of about 4,800 mg/L and a circulation rate of 15 cm3/hr (Step 1 of D01-D, D01-E
and D01-F). The difference between D01-D and D01-F is that the core was saturated by different
fluid before CLS solution was circulated. The core for D01-D experiment was saturated with
distilled water before CLS solution was circulated. The core for D01-F experiment was saturated
with 2% brine before CLS solution was circulated. The adsorption densities as a function of
circulation time for the three adsorption kinetics are plotted in Fig. 60.
The adsorption density increases with the elapsed time within our measured time range
for both temperatures. As shown in Fig. 60, triple curves were characterized by a short period of
rapid adsorption, followed by a long period of slower adsorption. During the tests the CSL
concentration of the circulating solution decreased. This is caused by dilution with brine from the
core and tube line and CLS adsorption onto the pore surface of the dolomite. During the initial
few hours, the CLS solution that flowed through the core displaced brine out of core pores and
line tube to dilute the CLS solution in the flask and partial CLS was adsorbed onto the surface as
the surfactant flowed through the core. In general, the pores that CLS flowed through during the
initial few hours were the main fluid flow path and the surface area contributed most of the
surface area of the dolomite core. Thus rapid adsorption occurred within the initial few hours.
This stage was controlled by solution advection and dispersion. After circulating a number of
PVs of CLS solution, the concentration between the main flow path of the core and the flask was
not affected by concentration gradients due to dilution.37 The CLS concentration loss was
principally caused by diffusion between macropores (main path) and micropores (stagnant areas
or low permeability paths) due to concentration differences.

69
0.00
0.05
0.10
0.15
0.20
0.25
0.30
0.35
0.40
0 15 30 45 60
Time (hrs)
Ads
orpt
ion
(mg/
g)
23C_2% brine45C_2% brine23 C_Distilled water
Fig. 60. Kinetics of CLS adsorption onto dolomite.
Comparing CLS adsorption for which core was saturated with brine shows that the
adsorption density was greater at the lower temperature. This is an indication that CLS
adsorption onto dolomite is physical. Comparing CLS adsorption densities at the same
temperature with the core saturated by different solution (one was prepared by distilled water and
another one was prepared with brine) shows that CLS adsorption with distilled water is much
lower than that with brine, indicating salinity increase CLS adsorption and preflush core using
low salinity brine before surfactant injection will decrease surfactant loss in the rock incurred by
adsorption.
Modeling CLS adsorption kinetics onto dolomite. CLS adsorption onto dolomite did not reach equilibrium during
the test time. The equilibrium adsorption data is thus not available, so the pseudo-first-order cannot be used directly
to fit our results. Figure 61 shows the result using the pseudo-second-order model to fit CLS adsorption kinetics onto
dolomite.
The plot of tqt / versus t is a straight line for each experiment and CLS adsorption
kinetics are well-described by the pseudo-second-order equation. Table 8 lists the fitting

70
equations, correlation factors and the calculated equilibrium density and pseudo-second-order
rate constants.
0
50
100
150
200
0.0 15.0 30.0 45.0 60.0Time (hrs)
t/qt (
mg/
g)
23C_2% brine45C_2% brine23C_Distilled Water
Fig. 61. CLS adsorption kinetics model on dolomite using a pseudo-second-order equation.
Table 8. Results of Modeling CLS Adsorption onto Dolomite Using a Pseudo-Second-Order
Equation
Series No. Fitting Equation R2 qe Ka Temp, (ºC)
Step 1 of D01-E 436.315831.2 += tqt
t 0.9943 0.387 0.212 45
Step 1 of D01-F 25.0131948.2 += tqt
t 0.9982 0.456 0.193 23
Step 1 of D01-D 46.0498728.2 += tqt
t 0.9861 0.348 0.179 23
The calculated equilibrium adsorption densities listed in Table 8 are 0.387 and 0.456 and
0.348 mg/g, respectively, which are higher (20-25%) than the adsorption densities (0.307, 0.365
and 0.263 mg/g) determined after 48 hours, which indicated CLS adsorption onto dolomite takes
a longer time to reach equilibrium than it does onto limestone.24 The rate constants of D01-E and
D01-F are 0.193 and 0.212 at 23°C and 45°C, respectively, which indicates an increasing

71
reaction rate between CLS and dolomite with increasing temperature. Thus, the required time to
reach adsorption equilibrium should be shorter at the higher temperature.
Rearranging equations listed in Table 8, the following equations can then be used to
calculate CLS adsorption rate:
At 23 ºC (core was saturated with brine):
013.251948.2
1+
=tt
qt …………………………...11
At 45 ºC (core was saturated with brine):
436.315831.21+
=tt
qt
…………..………………12
At 23 ºC (core was saturated with distilled water):
049.468728.21+
=tt
qt
…………………….......... 13
If the calculated equilibrium adsorption densities are applied to the pseudo-first-order
equation, it can be used to fit the CLS adsorption kinetics onto dolomite.24 The plot of te
e
qqq−
versus t has a fair linear relationship as shown in Fig. 62, and the fit equations are:
At 23 ºC (core was saturated with brine):
9629.0R 4078.1 20288.0 ==−
t
te
e eqq
q …………….......14
At 45 ºC (core was saturated with brine):
9606.0R 352.1 20293.0 ==−
t
te
e eqq
q …………………15
At 23 ºC (core was saturated with distilled water):
9118.0R 3217.1 20245.0 ==−
t
te
e eqq
q…………..……16
Figure 62 shows that the y-intercept is not 1; thus, CLS adsorption onto dolomite does
not follow the pseudo-first-order equation.24

72
1.0
10.0
0 15 30 45 60
Time (hrs)
qe/(q
e-qt
)
23C_2% brine45_2% brine23 C_Distilled Water
Fig. 62. Modeling CLS adsorption onto dolomite using a pseudo-first-order equation.
The plot of ⎟⎟⎠
⎞⎜⎜⎝
⎛− te qq1log versus t also shows a straight line, shown in Fig. 63 with the
results shown in Table 9.
Table 9. Results of Modeling CLS Adsorption Kinetics Using A Pseudo-First-Order
Equation
Experiment Fitting Equations R2 Ka qe Temp, (ºC)
D01-D 5795.00107.01log +=⎟⎟⎠
⎞⎜⎜⎝
⎛−
tqq te
0.9118 0.0246 3.7975 23
D01-E 5434.00127.01log +=⎟⎟⎠
⎞⎜⎜⎝
⎛−
tqq te
0.9606 0.0292 3.4946 45
D01-F 4896.00125.01log +=⎟⎟⎠
⎞⎜⎜⎝
⎛−
tqq te
0.9629 0.0288 3.0875 23

73
The calculated equilibrium adsorption densities shown in Table 9 are much higher than
those calculated from the pseudo-second-order equation; however, these are not reasonable.
Therefore, CLS adsorption onto dolomite does not follow the pseudo-first-order equation.
1.0
10.0
100.0
0 15 30 45 60Time (hrs)
1/(q
e -qt )
23C_2% brine
45_2% brine
23 C_Distilled Water
Fig. 63. Dolomite results of CLS adsorption kinetics fit to pseudo-first-order equations.18
Figure 64 shows the relationship between qt and 5.0t , used to determine whether the
diffusion model fits the adsorption kinetics. The curve is not linear for the first few points but it
is almost linear for the last few points. This result indicates that diffusion is not a controlling
mechanism, at least not initially.
0.00
0.08
0.16
0.24
0.32
0.40
0.00 2.00 4.00 6.00 8.00
Time 0̂.5, hrs 0̂.5
Adso
rptio
n, m
g/g
23C_2% Briine
45C_2% Brine
23C_Distilled Water
Fig. 64. The fit result of CLS adsorption kinetics onto dolomite using a diffusion model.

74
Equilibrium of CLS adsorption onto dolomite: experimental results of adsorption and
desorption isotherm. CLS adsorption and desorption isotherms onto dolomite were established
at 45°C, (see Fig. 65) for Steps 1 and 2 of experiment D01-A. For both isotherms, surfactant
adsorption increased with increased CLS solution concentration. When the two isotherms are
compared, the adsorption density for the desorption isotherm is higher than the adsorption
isotherm at the same equilibrium concentration, indicating adsorption hysteresis. This may be
caused by the attraction forces between pore surfaces of dolomite and CLS above the displacing
force and other repulsion forces.
0.00
0.15
0.30
0.45
0.60
0 3000 6000 9000 12000 15000
Equlibrium Conc. ( mg/l)
Adso
rptio
n (m
g/g
AdsorptionDesorption
Fig. 65. CLS adsorption and desorption isotherm onto dolomite at 45 ºC.
Figure 66 compares CLS initial and equilibrium concentrations and relative loss due to
CLS adsorption onto dolomite. The CLS concentration decrease is from 6.09% to 13.56%; the
percentage lost decreased with increasing solution concentration over the measured range while
total adsorption increased.

75
0
3000
6000
9000
12000
15000
986 2473 5048 7505 9950 12383
Initial Conc. (mg/l)
Ini.
or E
qul.
Con
c. (m
g/l)
0.0
3.0
6.0
9.0
12.0
15.0
Con
c. L
oss
(%)
Initial Conc.
Equil. Conc.
Conc. Loss(%)
Fig. 66. Concentration change and loss due to adsorption.
Modelling CLS Adsorption and Desorption Isotherms. Figure 67 shows the fit of the
experimental adsorption data to the Langmuir equation and Table 10 summarizes the results. The
CLS adsorption isotherm onto dolomite can be described by the Langmuir equation with a
correlation factor of 0.9642. Correspondingly, the maximum adsorption density is 0.534 mg/g
and the Langmuir adsorption constant is 2.3×10⁻⁴ l/mg. In contrast, the desorption isotherm does
not fit the Langmuir model.
0.00
2.00
4.00
6.00
8.00
10.00
12.00
0 0.005 0.01 0.015 0.02
1/Ce
1/q e
AdsorptionDesorption
Fig. 67. Modeling CLS adsorption and desorption isotherms onto dolomite using the
Langmuir equation.

76
Table 10. Parameters from Modeling the CLS Adsorption and Desorption Isotherm Using
the Langmuir Isotherm Equation
Equation R2 qmax (mg/g) KL (l/mg)
Ads. 8658.115.81441 +⋅=ee Cq
0.9642 0.534 0.00023
Des. 1548.3129.1511 +⋅=ee Cq
0.7632 0.317 0.02085
Figure 68 shows the fit of the adsorption and desorption isotherm using the Freundlich
equation. Table 11 summarizes the fit to the Freundlich equation and corresponding parameters.
The CLS adsorption isotherm for dolomite can be described by a Freundlich equation with a
correlation factor of 0.9929 and a Freundlich constant and heterogeneity factor of 0.0010 and
1.5017, respectively. The CLS desorption isotherm also was fit by a Freundlich equation with a
relative low correlation factor of 0.9405; the corresponding Freundlich constant and
heterogeneity factor are 0.0941 and 6.2972, respectively.
0.01
0.10
1.00
1 1000 1000000
Equlibrium Conc. ( mg/l)
Adso
rptio
n (m
g/g
AdsorptionDesorption
Fig. 68. Modeling CLS adsorption and desorption isotherms using the Freundlich equation.

77
Table 11. Parameters from Modeling CLS Adsorption and Desorption Isotherms onto
Dolomite Using the Freundlich Equation
Equation R2 KF n
Adsorption 6659.0001.0 ee Cq = 0.9929 0.0010 1.5017
Desorption 1588.00941.0 ee Cq = 0.9405 0.0941 6.2972
Effect of Temperature on Equilibrium Adsorption. A temperature gradient can exist near-
wellbore and from reservoir to reservoir. Thus, CLS equilibrium adsorption densities at different
temperatures were measured by the circulation method at Step 2 of D01-E at a circulation rate of
15 cm3/hr. The experiment started from the end of the adsorption kinetics experiment at 45°C.
The temperature was decreased to 40°, 34°, and 23°C, and then returned to 45°C. Figure 69
shows CLS adsorption density change for each temperature. CLS adsorption density increased as
temperature decreased and returned to near the initial adsorption when the temperature was
returned to 45°C. These results are an indication that physical adsorption is one of the main
mechanisms controlling CLS adsorption onto dolomite.
0.00
0.10
0.20
0.30
0.40
0.50
45 40 34 23 45
Temperature (C)
Adso
rptio
n (m
g/g
Fig. 69. Effect of temperature on CLS adsorption onto dolomite.
Effect of Salt Type and Concentration on Equilibrium Adsorption. Two series of
experiments were run to study the influence of NaCl and CaCl2 on CLS adsorption onto dolomite
(D01-B and D01-C). For each experiment, About 4,700 mg/L CLS solution was circulated until

78
adsorption equilibrium was achieved. Then salt (NaCl or CaCl2) was added incrementally to the
circulation solution in flask until the salt concentration reached the desired maximum. The
highest concentrations were 5 wt% brine for both NaCl and CaCl2. Figure 70 shows CLS
adsorption densities onto dolomite at different NaCl and CaCl2 concentrations. For both NaCl
and CaCl2, increasing concentration increased CLS adsorption, with the divalent CaCl2 having
the stronger effect. The adsorption of CLS prepared by distilled water is about 0.240 mg/g.
Adding 0.01 M (Molar) or 0.058 wt% NaCl increased CLS adsorption density to 0.276 mg/g,
and adding 0.01 M (0.11 wt%) CaCl2 increased CLS adsorption density to 0.491 mg/g.
0.00
0.10
0.20
0.30
0.40
0.50
0.60
0.70
0.00 1.00 2.00 3.00 4.00 5.00 6.00
Salt Concentration (mg/g)
Ads
orpt
ion
(mg/
g)
CaCl2NaCL
Fig. 70. Effect of salt type and concentration on CLS adsorption onto dolomite.
Although there is no universal agreement regarding the isoelectric condition of
dolomite,38,39 much research indicates that dolomite has a negative charge in aqueous solutions
with a pH near neutral.40 The measured equilibrium pH of a CLS solution circulated through
dolomite is close to neutral. The effect of NaCl and CaCl2 on adsorption can be explained as
follows: CLS is an anionic surfactant having a functional group with a negative charge in
aqueous medium. Adding NaCl or CaCl2 decreases the functional group-group electrostatic
repulsion in the adsorbed layer. Increasing salt concentration can compress the electric double
layer and thus CLS adsorption will increase with an increase of salt concentration. Ca2+ may
adsorb onto the dolomite surface, which may be the reason that CaCl2 has a stronger effect than

79
NaCl. The adsorbed Ca2+ can make the surface more positive, thus attracting more CLS by
electrostatic interaction.
Kinetics of CLS Desorption from Dolomite. Most of the previous work reported has focused
on adsorption kinetics,40-46 with little attention devoted to desorption kinetics. Desorption
kinetics models were derived by referring to the definitions of adsorption kinetics described
earlier.24
Modeling CLS desorption from dolomite. The core was flushed with 2% brine to displace the
solution left in the pore space and tube line and to desorb the adsorbed CLS at the constant flow
rate of 15 cm3/hr at 45ºC (D01-D, D01-E, D01-F). Figure 71 shows adsorption density as a
function of time during desorption. The adsorption density during desorption is characterized by
a short, rapid desorption period followed by a longer, slow desorption period.
0.000.050.100.150.200.250.300.350.40
0.0 10.0 20.0 30.0 40.0 50.0Time (hrs)
Ads
orpt
ion
(mg/
g)
D01-D D01-E
D01-F
Fig. 71. Adsorption change with time during the desorption process.
The plot of tq/1 versus t shown in Fig. 72 indicates that CLS desorption can be well fit by
the pseudo-second-order desorption kinetic model. Table 12 lists the fitting equations,
correlation factors, and the calculated desorption rate constant and residual adsorption density.
The residual adsorption is close to zero, indicating the CLS can almost completely desorb from
dolomite.
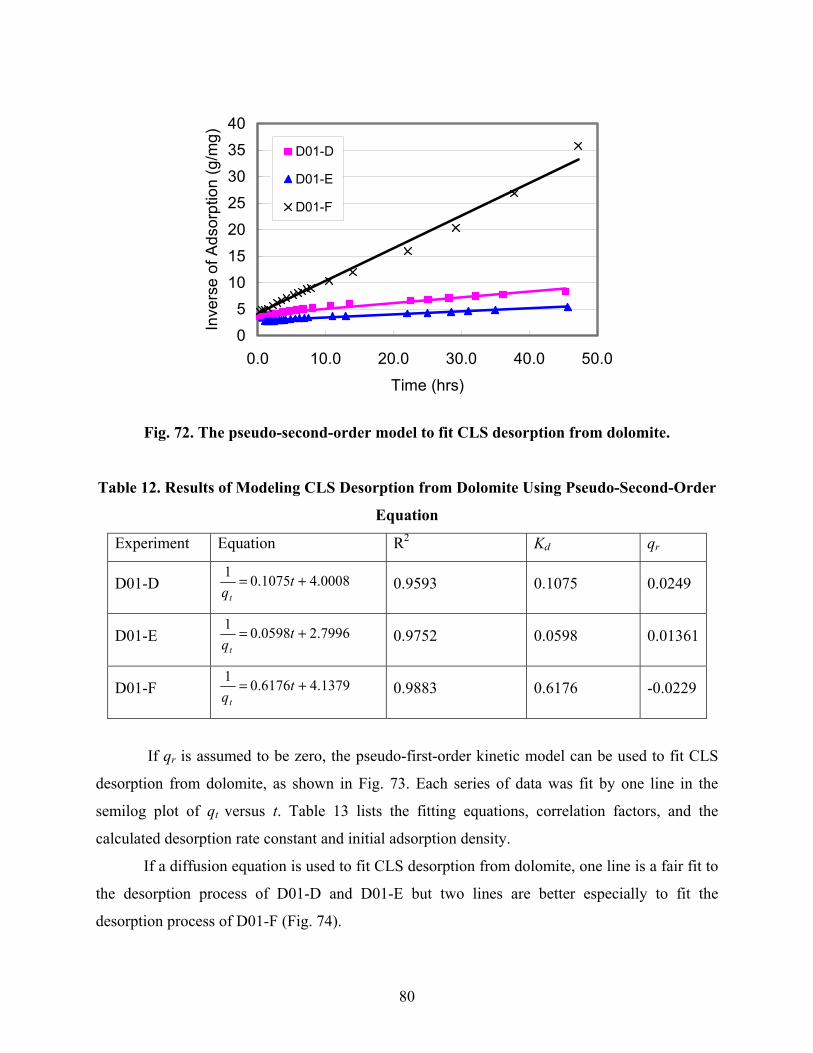
80
05
101520
25303540
0.0 10.0 20.0 30.0 40.0 50.0
Time (hrs)
Inve
rse
of A
dsor
ptio
n (g
/mg)
D01-D
D01-E
D01-F
Fig. 72. The pseudo-second-order model to fit CLS desorption from dolomite.
Table 12. Results of Modeling CLS Desorption from Dolomite Using Pseudo-Second-Order
Equation
Experiment Equation R2 Kd qr
D01-D 0008.41075.01 += tqt
0.9593 0.1075 0.0249
D01-E 7996.20598.01 += tqt
0.9752 0.0598 0.01361
D01-F 1379.46176.01 += tqt
0.9883 0.6176 -0.0229
If qr is assumed to be zero, the pseudo-first-order kinetic model can be used to fit CLS
desorption from dolomite, as shown in Fig. 73. Each series of data was fit by one line in the
semilog plot of qt versus t. Table 13 lists the fitting equations, correlation factors, and the
calculated desorption rate constant and initial adsorption density.
If a diffusion equation is used to fit CLS desorption from dolomite, one line is a fair fit to
the desorption process of D01-D and D01-E but two lines are better especially to fit the
desorption process of D01-F (Fig. 74).

81
0.01
0.10
1.00
0.0 10.0 20.0 30.0 40.0 50.0Time (hrs)
Ads
orpt
ion
(mg/
g)
D01-D D01-E D01-F
Fig. 73. Pseudo-first-order model to fit CLS desorption from dolomite.
Table 13. Pseudo-First-Order Equation used to model CLS Desorption from Dolomite.
Experiment Equation R2 Kd1 qi
D01-D tt eq 019.02462.0 −= 0.9103 0.0190 0.2462
D01-E tt eq 0157.03510.0 −= 0.9425 0.0157 0.3510
D01-F tt eq 0428.01776.0 −= 0.9503 0.0428 0.1776
0.00
0.05
0.10
0.15
0.20
0.25
0.30
0.35
0.40
0.0 2.0 4.0 6.0 8.0
t0.5, (hrs0.5)
Ads
orpt
ion
(mg/
g)
D01-D D01-E
D01-F
Fig. 74. Diffusion model to fit CLS desorption from dolomite.

82
Effect of interruption and flow rate on CLS desorption. Interrupting or changing the flow rate
during the desorption experiment aids in determining if the flow stream is equilibrating with the
core during its resonance time.47,48 Interrupting (stopping) the flow during the tests allows
additional time to equilibrate. Interruption experiments were performed at Step 3 of D01-E
during flow-through experiments at a flow rate of 15 cm3/hr. Flow was stopped at 5.50 PV (Fig.
75). After flow resumed, the effluent concentration was increased to above the effluent
concentration immediately before the interruption and then returned to a decreasing CLS
concentration curve similar to that before the interruption. The results indicate that CD
desorption does not reach equilibrium in the core at a flow rate of 15 cm3/hr.
1
10
100
1000
10000
0.0 10.0 20.0 30.0 40.0 50.0
Time (hrs)
Effl
uent
Con
c. (m
g/l)
Interrupt
Fig. 75. Interruption effect on CLS desorption from dolomite.
Varied flow rates and flow interruptions were performed in Step 2 of D01-C at 45°C. The
desorption experiment was run at 15 cm3/hr for 4.80 PV, then at 3 cm3/hr for 19.80 PV (from
4.80 PV to 24.62 PV) with a 24 hr interruption at 8.34 PV. Finally, flow was returned to 15
cm3/hr for the remainder of the test, shown in Fig. 76. When the flow rate was decreased from 15
to 3 cm3/hr, effluent CLS concentration increased. When the flow rate was increased from 3 to
15 cm3/hr, effluent CLS concentration decreased. After the interruption, the effluent CLS
concentration was higher than the effluent concentration before the interruption. Results from
both interruption and flow rate changes indicate that CLS desorption equilibrium is not achieved

83
at the flow rates and core lengths tested. The two rates (15 and 3 cm3/hr), translating to
interstitial flow rates of 14 and 2.8 ft/day, which cover a range frequently encountered at
reservoir conditions.
1
10
100
1000
10000
0.0 10.0 20.0 30.0 40.0 50.0
Brine Injected (PV)
Effl
uent
Con
c. (m
g/l)
V=0.25 v=0.05
Interruption
Fig. 76. Interruption and flow rate effect on CLS desorption.
Summary
1. CLS adsorption and desorption onto dolomite core are both time-dependent. Both adsorption
and desorption are characterized by a two-phase pattern, a rapid sorption period followed by
a slower period.
2. CLS adsorption onto dolomite is best fit by a pseudo-second-order kinetic model, but can
also be fit to a diffusion equation during the second period. Even though the plot of
⎟⎟⎠
⎞⎜⎜⎝
⎛− te qq1log versus t is linear, CLS adsorption does not follow a pseudo-first-order kinetic
adsorption model due to the inconsistent match between measured and calculated equilibrium
adsorption density.
3. A higher temperature gives a higher pseudo-adsorption rate, but lower absolute adsoprtion.
4. Equilibrated CLS adsorption and desorption isotherm onto dolomite can be described by a
Langmuir equation in the tested CLS concentration range; increasing concentration increases
adsorption density. Desorption isotherm better fits using the Freundlich model.

84
5. Increasing both NaCl and CaCl2 concentrations increases adsorption density with a greater
impact of CaCl2.
6. CLS desorption from dolomite can be fit using either pseudo-first-order kinetic model or
pseudo-second-order kinetic models.
4.9 Sorption of Surfactant Used in CO2 Flooding onto Five Minerals and Three Porous
Media25
This series of experiments involved adsorption and desorption tests performed for five powdered
mineral and three rock types using a carbon dioxide–aqueous phase foaming agent, surfactant
CD. These experiments were performed in order to better understand surfactant adoption
behaviors and transport mechanisms through three different porous media. Batch experiments
were run to determine the kinetics of the surfactant adsorption onto five powdered minerals
common to the selected three porous media. Dynamic experiments were performed to determine
the kinetics and equilibria of surfactant adsorption onto three porous media. Characterizations of
the three porous media were performed by SEM (Scanning Electron Microscopy) to aid in
discerning the mechanisms controlling the retention and release reaction rates of the surfactant
through the three different rock types.
Results showed that CD adsorption and desorption onto powered minerals could be
established in one hour. The decreasing order of the surfactant adsorption density onto the five
minerals is: montmorillonite, dolomite, kaolinite, silica and calcite. Surfactant adsorption onto
the three core systems took at least one order of magnitude longer than that onto the five
powdered minerals, and the surfactant adsorption onto Berea sandstone required a longer time
than either Indiana limestone or Lockport dolomite. Desorption of the surfactant from the three
porous media followed exponent decline equations.
Summary
The decreasing order of the surfactant CD adsorption density (mg/g) onto the five powdered
minerals is: montmorillonite, dolomite, kaolinite, silica and calcite.
1. Surfactant adsorption onto the three core systems took much longer than that onto the five
powered minerals, and the surfactant adsorption Berea sandstone required a longer time than

85
either Indianan limestone or Lockport dolomite due to its multicomponent and complex
porous structure.
2. Increasing CD concentration increased CD adsorption density onto the three tested porous
media. No plateau was found even when surfactant concentration was above its CMC.
3. Exponent decline equations can be used to describe surfactant desorption process from the
three porous media.
4. CD desorption from Berea sandstone does not reach equilibrium in a short core unless it is
circulated over several days.
4.10 Competitive Adsorption of a Hybrid Surfactant System onto Five Minerals, Berea
Sandstone, and Limestone26
This series of experiments examined adsorption/desorption with two surfactant systems and with
a mixture of the two onto five minerals and two porous media. The systems were composed of
CD and CLS. Two series of experiments were carried out: (1) static adsorption of CLS, CD, and
CLS/CD mixtures onto five pure minerals (silica, montmorillonite, kaolinite, dolomite, and
calcite); (2) dynamic adsorption of CLS, CD, and CLS/CD mixtures onto core samples of Berea
sandstone and Indian limestone. All experiments were performed at 40°C using a 2.0% brine
solution with concentrations of 500 mg/l of CD and 5,000 mg/l of CLS. Static adsorption
experiment results showed that: (1) CLS adsorption density onto silica is less then background
noise (zero); on the other four minerals, adsorption density ranged from 0.5 to 10 mg CLS per g
of mineral; (2) CD adsorption density onto the five minerals ranged from 0.4 to 1.2 mg CD per g
of mineral; (3) CD adsorption density onto the five minerals decreased by 20 to 70% when
mixed with CLS. Dynamic adsorption experiment results showed that: (1) The times required to
reach adsorption equilibrium for both CD and CLS were longer for Berea sandstone than for
Indiana limestone and for both porous media, were much longer than those for the non-porous
minerals; (2) Competitive adsorption generally took several days to reach equilibrium. Stability
and interfacial tension tests on both injected and effluent samples were performed. Results
correlated well with the adsorption/desorption tests; for example, foaming capability was lost in
some systems due to adsorption.

86
Summary
1. Static adsorption experiment results showed that:
a. CLS with an initial concentration of 5000 mg/l adsorption density onto silica is essentially
zero; CLS adsorption density for the other four minerals ranges from 0.5 to 10 mg/g on
calcite, dolomite, kaolinite, and montmorillonite, respectively.
b. CD with an initial concentration of 500 mg/l adsorption density onto the five minerals
ranged from 0.4 to 1.2 mg/g for calcite, silica, kaolinite, dolomite, and montmorillonite,
respectively.
c. CD adsorption density onto five minerals decreased from 20 to 70% when CD was mixed
with CLS. The reduction of CD adsorption onto clay was higher than that onto the other
minerals.
2. Dynamic adsorption experiment results showed that:
a. CD adsorption can be greatly reduced by pre-adsorbing CLS onto sandstone or limestone
or by injecting a mixture of CD and CLS;
b. Adsorption equilibrium time of CD and CLS onto Berea sandstone is much longer than
that onto Indiana limestone;
c. Competitive adsorption of CD and CLS generally took several days.
3. Foam stability and IFT show a decrease in foaming capability similar to that expected due to
adsorption.
4. The results from this work are being used to develop optimum solution concentrations of CD
and CLS for specific reservoir rock, which are anticipated to optimize foaming ability,
production cost economy, and adsorption.
4.12 Foam Stability and Surfactant Solution Stability
Effect of gases on IFT and CMC. The IFT between N2 and CD aqueous solutions was greater
than the IFT between CO2 and CD aqueous solutions at 1500 psig and 25ºC. Also, the critical
micelle concentration (CMC) was greater for N2 than for CO2. Since CO2 is a liquid under the
temperature and pressure conditions tested while N2 is a gas, the significant density difference
and the difference in molecular structure are probably the cause of these differences in interfacial
behavior.

87
1
10
100
10 100 1000 10000 100000
CD Concentration (mg/L)
IFT
(mN
/m)
a
N2
CO2
Fig. 77. Gases effect on IFT and CMC.
Co-surfactant CLS and CD. For a mixture of CLS and CD, the IFT increased with increasing
concentrations of lignosulfonate at constant CD concentration. IFT decreased with CD
concentrations at constant lignosulfonate concentration (Figs. 78–80). CMC for a mixture of
CLS and CD with 2500 mg/L CLS is much higher than the CMC for CD brine solution (Fig. 78).
But when the concentration of CLS was equal to or more than 5000 mg/L, the CMC for a
mixture of CLS and CD was greater than the measured values, 10,000 mg/L (Figs. 79 and 80).
Additionally, IFTs among a mixture of CLS, CD, and CO2 were much high than the CD brine
solution’s IFT (Figs. 79 - 80).

88
0
5
10
15
20
25
10 100 1000 10000
CD concentration (mg/L)
IFT
(mN
/m)
2500mg/L
0 mg/L
Fig. 78. 2500 mg/L lignosulfonate effect on IFT and CMC.
0
5
10
15
20
25
10 100 1000 10000
CD concentration (mg/L)
IFT
(mN
/m)
5000mg/L
0 mg/L
Fig. 79. 5000 mg/L lignosulfonate effect on IFT and CMC.

89
0
5
10
15
20
25
10 100 1000 10000
CD concentration (mg/L)
IFT
(mN
/m)
7500mg/L
0 mg/L
Fig. 80. 7500 mg/L lignosulfonate effect on IFT and CMC.
Effect of gases on foam stability. The CO2 foam stability of CD was insensitive to surfactant
concentration over a wide range of concentrations (from 0.01wt% CD to 1 wt CD). Coalescence
of bubbles was observed only at 0.005 wt% CD concentration (Fig. 81). A similar trend was
observed for N2 foam stability with CD (Fig. 82).
020406080
100120
0 50 100Time (min)
Foam
(%)
0.005wt% 0.01wt%0.025wt% 0.05wt%0.1wt% 0.5wt%1wt%
Fig. 81. CO2 foam stability at different CD concentration.

90
020406080
100120
0 15 30 45 60 75 90Time, min
Foam
, % 1% 0.5% 0.25%0.1% 0.05% 0.025%0.01% 0.005%
Fig. 82. N2 foam stability at different CD concentration.
Effect of CLS on foam stability. For a mixture of CLS and CD, the IFT increased with
increasing concentrations of CLS at a constant CD concentration (Figs. 78–80).
Correspondingly, adding CLS destabilized CO2 foam (Fig. 83).
0
20
40
60
80
100
120
0 2000 4000 6000 8000 10000 12000CD concentration (mg/L)
Foam
(%) 0 mg/L
2500 mg/L5000 mg/L7500 mg/L
Fig. 83. CLS effect on foam stability.

91
Lignosulfonate solution stability. Non-aqueous materials have been observed in both CLS and
sodium lignosulfonate (SLS) solutions. This is a concern especially if injecting these solutions
into low permeability reservoirs, causing reduced permeability and thus reduced injectivity.
There is also the inconvenience of filtering when required to remove precipitates before using the
lignosulfonates solutions. The possibility that the chemical structure or composition is changing,
and the effect these might have on the absorbance of the lignosulfonates is another concern.
Two types of material have been observed. The first are fine particles that settle to the
bottom, usually in small quantities and occuring in the first couple of days after mixing. These
are a concern because they could cause problems in the near-wellbore region. These particles
appear to be inorganic and are expected to be insoluble material in the lignosulfonates. The
second material does not settle, but remains suspended and has the appearance of a gel.
Microbial experiments were performed on samples of SLS and CLS that had been prepared for a
long period of time and had developed the gel. The gels were observed under an optical
microscope and found to be bacteria, fungi and a certain amount of dirt.
Two batches of solutions were prepared with each batch containing pairs of 2% brine and
5000 ppm lignosulfonate solutions. A pair was made up of a SLS and a CLS set. Table 14
summarizes the different treatment types. Table 15 summarizes each of the treatments left in the
light over a period of 65 days. For the last 40 days there were little or no changes. Table 16
summarizes the changes in the same set of treatments as listed in Table 15, except each vial was
kept in the dark for 192 days.
Summary
1. Formaldehyde prevents formation of a suspended material (gel) or a precipitate when the
applied formaldehyde concentration is equal to or greater than 500 mg/L.
2. Sodium azide prevents a suspended solid (gel) and a minimum of precipitate forming in CLS
solution in concentrations at least as low as 50 mg/L. Gel decreased in SLS with sodium
azide concentration increase.
3. SLS solution had precipitate no matter what treatment was applied. If no treatment is applied
both SLS and CLS solutions will form gel with time, but CLS solution will not have
precipitate.

92
4. Sodium hypochlorite will bleach the solution to a very light yellow and will have white
precipitate for both SLS and CLS. This occurred the first day with no change thereafter.
5. In tests conducted and reported earlier ultrasonic and boiling tests were run. The ultrasonic
test had no effect and the boiling test, once filtered, had no further effect.
Table 14. Tests Identifications Treatment Type Composition No treatment (Standard) 5000ppm Ligno+Brine* Bleach (sodium hypochlorite) 1% bleach +5000ppm Ligno + Brine
0.1 % sodium azide + 5000ppm Ligno + Brine 0.05% sodium azide + 5000ppm Ligno + Brine 0.01% sodium azide + 5000ppm Ligno + Brine
Sodium azide (Sodium Trinitride)
0.005 % sodium azide + 5000ppm Ligno + Brine 0.1% HCHO + 5000ppm Ligno + Brine 0.05% HCHO + 5000ppm Ligno + Brine 0.01% HCHO + 5000ppm Ligno + Brine
Formaldehyde (HCHO)
0.005% HCHO + 5000ppm Ligno + Brine * All brine was the same composition (1.5wt% NaCl + 0.5wt% CaCl2)

93
Table 15. The Results of Tests Exposed to the Light
TREATMENT TYPE
SAMPLE TYPE
DAY 1 DAY 2 DAY 3 DAY 4 DAY 5
Calcium None Few strands Strands
increase Increase Standard (No treatment)
Sodium None
Gel and precipitate Visible at bottom of test tube
Gel increases. Precipitate stays the same
Increase (precipitate and Gel)
Increase
Formaldehyde Calcium None Small
Precipitate 0.1% Sodium
None precipitate Precipitate increase
Precipitate increase
No Change
Calcium None
0.05% Sodium None Precipitate Precipitate
increase Precipitate increase
Precipitate increases
Calcium None Few Strands Gel 0.01% Sodium
None Precipitate & gel
Precipitate and Gel increase.
Precipitate and Gel increase.
Increases
Calcium None Few strands Gel
0.005% Sodium None Precipitate.
Few Strands
Precipitate increase. Gel formed
Precipitate and gel increase Increase
Sodium Azide Calcium None Few strands Small
precipitate 0.1% Sodium None Precipitate Precipitate
increase Precipitate increases Increase
Calcium None Few Strands Small precipitate 0.05%
Sodium None Precipitate Precipitate
increase Precipitate increases Increase
calcium None Few strands Small precipitate 0.01%
Sodium None Precipitate &
Gel Slight increase in Precipitate
Precipitate increases Increase
Calcium None Few Strands Small precipitate 0.005%
Sodium None Precipitate &
Gel Slight increase in precipitate
Precipitate increases Increase
Calcium Bleach (sodium hypochlorite)
Sodium
Color intensity was reduced and white precipitate formed
No Change after 1st Day

94
Table 15. (cont.)
TREATMENT TYPE
SAMPLE TYPE
DAY 6 DAY 8 DAY 10 DAY 11 DAY 15
Calcium Precipitate and gel continue to increase Standard
(No treatment)
Sodium
Precipitate stays the same. Gel increase
Gel increase
Formaldehyde Calcium No change in precipitate after Day 5
0.1% Sodium No Change Precipitate
increase Increase (precipitate)
Calcium
Slight increase No change
0.05% Sodium No change Precipitate
increase Increase (precipitate)
Calcium Small precipitate Precipitate stays the same and gel increases
0.01% Sodium
Increase ( precipitate and gel)
Calcium
Precipitate and gel Gel increase Precipitate and
gel increase Increase 0.005% Sodium Increase ( precipitate and gel)
Sodium Azide Calcium
Small increase precipitate
No change in precipitate 0.1% Sodium No change Increase
Calcium No change in precipitate Small precipitate
0.05% Sodium No change Increase
calcium Increase No change Increase 0.01% Sodium No change Increase
Calcium Increase No change Increase 0.005% Sodium No change Increase No change
Calcium Bleach (sodium hypochlorite)
Sodium No Change after first day

95
Table 15. (cont.)
TREATMENT TYPE
SAMPLE TYPE
DAY 17 DAY 23 DAY 25 DAY 26 DAYS 30/43/65
Calcium Precipitate and gel continue to Increase No change Standard
(No treatment) Sodium No change increases No change
Formaldehyde Calcium No change after day 5
0.1% Sodium
No change after day 10
Calcium
No change after day 10 0.05%
Sodium No change Precipitate increase No Change
Calcium Gel increase
Gel increases (Mesh). Mold-like substance appears on mesh
Mesh increase No change
0.01%
Sodium
Increase ( precipitate and gel)
Calcium Gel increase No Change 0.005%
Sodium Increase ( precipitate and gel)
Sodium Azide Calcium No change
0.1% Sodium No change
Calcium No change 0.05%
Sodium No change
calcium No change
0.01% Sodium No change
Calcium No change
0.005% Sodium No change
Calcium
Bleach (sodium hypochlorite)
Sodium No change after first day

96
Table 16. The Results of Tests in the Dark
TREATMENT TYPE
SAMPLE TYPE
Observed after 192 days
Calcium Gel present ( amount less that the samples exposed to light) Standard
(No treatment)
Sodium Gel present (floating on liquid surface), precipitate at bottom of test tube. ** less gel than the sample exposed to light
Formaldehyde Calcium No precipitate or gel noted
0.1% Sodium Small amount of precipitate but no gel
Calcium Few particles are visible
0.05% Sodium Precipitate (brown) at bottom of test tube
Calcium Gel present 0.01% Sodium
Gel present.
Calcium Gel present 0.005%
Sodium Gel & Precipitate
Sodium Azide Calcium No change 0.1%
Sodium Precipitate. No gel Calcium No change 0.05%
Sodium Precipitate present.
About two gel strands are visible calcium No change 0.01%
Sodium Precipitate
2-3 gel strands
Calcium No change 0.005% Sodium Precipitate
4 strands of gel Calcium
Bleach (sodium hypochlorite)
Sodium Solution decolorized White precipitate

97
Chapter 5. Technology Transfer
A considerable number of papers and presentations were generated in the pursuit of this research
project. These include:
Bai, B. and Grigg, R.B.: “Kinetics and Equilibria of Calcium Lignosulfonate Adsorption and
Desorption onto Limestone,” paper SPE 93098 presented at the 2005 SPE International
Symposium on Oilfield Chemistry, Houston, 2- 4 February.
Grigg, R.B., Tsau, J-S., and Martin, F.D.: “Cost Reduction and Injectivity Improvements for CO2
Foams for Mobility Control,” paper SPE 75178 presented at the SPE/DOE Improved Oil
Recovery Symposium, Tulsa, 13-17 April 2002.
Grigg, R.B., McPherson, B.J., and Svec, R.K.: “Laboratory and Model Tests at Reservoir
Conditions for CO2-Brine-Carbonate Rock Systems Interactions,” prepared for The Second
Annual Conference on Carbon Capture and Sequestration Conference, 5-8 May 2003,
Washington, D.C.
Grigg, R.B. and Svec, R.B.: “Co-injected CO2-Brine Interactions with Indiana Limestone,”
SCA2003-19 presented at the International Symposium of the Society of Core Analysts, Pau,
France, 21-24 September 2003.
Grigg, R.B., Zeng, Z.W., and Bethapudi, L.V.: “Comparison of Non-Darcy Flow of CO2 and N2
in a Carbonate Rock,” paper SPE 89471 presented at the SPE/DOE Fourteenth Symposium on
Improved Oil Recovery, Tulsa, 17–21 April 2004.
Grigg, R.B. and Bai, B.: “Calcium Lignosulfonate Adsorption and Desorption on Berea
Sandstone,” Journal of Colloid and Interface Science, 279 (2004) 36-45.

98
Grigg, R.B., Bai, B., and Liu, Y.: “Competitive Adsorption of a Hybrid Surfactant System onto
Five Minerals, Berea Sandstone, and Limestone,” paper SPE 90612 presented at the SPE Annual
Technical Conference and Exhibition, Houston, 26–29 September 2004.
Grigg, R.B. and Bai, B.: “Sorption of Surfactant Used in CO2 Flooding Onto Five Minerals and
Three Porous Media,” paper SPE 93100 presented at the 2005 SPE International Symposium on
Oilfield Chemistry, Houston, 2-4 February.
Grigg, R.B., and Svec, R.K., Carey, W., Lichtner, P.C., and Lesher, C.E.: “CO2/Brine/Carbonate
Rock Interactions: Dissolution and Precipitation,” prepared for The Fourth Annual Conference
on Carbon Capture and Sequestration, 2-5 May 2005, Washington, D.C.
Grigg, R.B.: “Long-term CO2 Storage: Using Petroleum Industry Experience,” Carbon Dioxide
Capture for Storage in Deep Geologic Formations, Volume 2, Chapter 11, D.C. Thomas and
S.M. Benson (Eds.), 2005 Elsevier Ltd.
Liu, Y., Grigg, R.B., and Bai, B.: “Salinity, pH, and Surfactant Concentration Effects on CO2-
Foam,” paper SPE 93095 presented at the 2005 SPE International Symposium on Oilfield
Chemistry, Houston, 2-4 February.
Liu, Y., Grigg, R.B., and Svec, R.K.: “CO2 Foam Behavior: Influence of Temperature, Pressure,
and Concentration of Surfactant,” paper SPE 94307 prepared for presentation at the 2005 SPE
Production and Operations Symposium, Oklahoma City, 17-19 April.
Svec, R.K. and Grigg, R.B.: “Physical Effects of WAG Fluids on Carbonate Core Plugs,” paper
SPE 71496 presented at the 2001 SPE Annual Technical Conference and Exhibition, New
Orleans, 30 September-3 October.
Wellman, T.P., Grigg, R.B., McPherson, B.J., Svec, R.K., and Lichtner, P.C.: “Evaluation of
CO2-Brine-Reservoir Rock Interaction with Laboratory Flow Tests and Reactive Transport

99
Modeling,” paper SPE 80228 presented at the SPE International Symposium on Oilfield
Chemistry, Houston, 5-8 February 2003.
Zeng, Z.W., Grigg, R.B., and Ganda, S.: “Experimental Study of Overburden and Stress
Influence on Non-Darcy Gas Flow in Dakota Sandstone,” Paper SPE 84069 presented at the SPE
Annual Technical Conference and Exhibition, Denver, 5-8 October 2003.
Zeng, Z.W., Reid B. Grigg, R.B., and Gupta, D.B.: “Laboratory Investigation of Stress-
Sensitivity of Non-Darcy Gas Flow Parameters,” paper SPE 89431 presented at the SPE/DOE
Fourteenth Symposium on Improved Oil Recovery, Tulsa, 17–21 April 2004.
Zeng, Z.W. and Grigg, R.B.: “A Criterion for Non-Darcy Flow in Porous Media,” Transport in
Porous Media (in press).
The following are presentations that did not include a published paper.
AUG Chapman Conference: San Diego – January 2005
US/Norway Summer School: Research Experience in Carbon Sequestration: Santa Fe – August
2004
DOE/NPTO Project Review: Tulsa – August 2003
Project review with producers: Midland – March 2003
Presentation at the Regional American Chemical Society Meeting: Oklahoma City – June 2002
Project review with producers: Midland – November 2001
Project review with producers: Houston – November 2001
Thesis – D.B. Gupta
Thesis – Sakish Ganda
Thesis – Tristan Wellman
Thesis – L.V. Bethapudi

100
CONCLUSIONS A number of conclusions are drawn in the work comprising this Final Report. They are
summarized by chapter.
Chapter 1: Industry Survey
Results of this survey showed that:
• Significant experience and knowledge in the industry exist to enable the successful
management of CO2 injection into geological formations for IOR or hydrocarbon storage.
• Monitoring and verification of CO2 flow in geological formations is in the infancy of its
development.
• Experience has shown that CO2 goes where expected. The challenge is developing
detailed reservoir characterizations and honoring them and the phase behavior of CO2 as
well.
• CO2 does what is expected: mobilizes oil, dissolves in brine, and promotes dissolution of
carbonates. The kinetics of these processes under a wide range of reservoir conditions
requires further studies.
• In the short geological timeframe that CO2 has been actively injected into geological
formations for IOR, seals generally are retaining the CO2 subsurface.
Chapter 2: CO2/Brine/Rock Interaction
• Water-alternating-gas (WAG) core flood experiments conducted on limestone and
dolomite core plugs confirmed that carbonate mineral dissolution and deposition can
occur over relatively short time periods (hours to days) and in close proximity to each
other.
• Results of earlier laboratory CO2-brine flow experiments performed in rock core were
used to calibrate a reactive transport simulator. The calibrated model was used to estimate
in situ effects of a range of possible sequestration options in depleted oil/gas reservoirs.
The code applied in this study, TRANSTOUGH, was a combination of the well known
TOUGH2 simulator, for coupled groundwater/brine and heat flow, with the chemistry
code TRANS for chemically reactive transport. Although the TRANSTOUGH model
remains in the developmental stages, simulated results compared favorably to
experimental results, suggesting that the model accurately simulates CO2 sequestration
under deep reservoir conditions, at least for small spatial scales.

101
• Limestone was coreflooded with co-injected CO2 and brine at reservoir pressure and
temperature. Analysis confirmed the deposition of trace metals within deposited
carbonate material, providing direct evidence of deposition. These phenomena can occur
during CO2 injection into carbonate geological formations: in IOR the concern is for
injectivity changes, while the issues for sequestration are long-term storage capacity and
seal integrity.
• Five large-core flooding experimental series were performed on quarried and reservoir
carbonates (limestone and dolomite) with co-injected or alternating injections of CO2 and
brine at reservoir conditions. The results are being used to calibrate a CO2 model
coupling multiphase flow to chemical reactions that will be used to predict in situ
dissolution and deposition that can result in significant reservoir injectivity.
Chapter 3: Flow Rate and Injectivity
• A series of core experiments with nitrogen flowed through cylindrical core confirmed
previous studies, which indicated that though the Forchheimer equation is useful in
describing high velocity flow in porous media, that in many cases it is not sufficient.
• Non-Darcy flow parameters were investigated in 159 series of high pressure/high
temperature/high velocity gas flooding experiments on five different rock samples under
field reservoir conditions. The results of these experiments reconfirm and extend to new
conditions that permeability increases, while non-Darcy flow coefficient decreases with
effective stresses; both are independent of shear stresses.
• The non-Darcy behavior results of CO2 (compared to the previous studies using N2) were
investigated in 85 series of high-velocity gas flooding experiments under high pressure
and high temperature. It was found that pore pressure has more influence on permeability
in CO2 flooding than it does in N2 flooding. In contrast, though temperature has definite
and consistent influence on both permeability and non-Darcy flow coefficient in N2
flooding, the same influence in CO2 flooding was not observed. Field data indicates that
this phenomenon could be responsible for productivity loses in high flow rate CO2 wells.
Accordingly, attention should be paid to avoid flowing CO2 at conditions near its critical
point.

102
• The two types of non-Darcy criteria, the Reynolds number and the Forchheimer number,
for fluid flow in porous media were reviewed. A revised Forchheimer number is
recommended due to the clear meaning of variables involved.
Chapter 4: Surfactant Sorption, Stability, and Mobility
• The results of a series of tests on CO2 foams identified chemical cost reduction derived
from the synergistic effects of co-surfactant systems using a good foaming agent and a
less expensive poor foaming agent. The required good foaming agent was reduced by at
least 75%. Additionally, the deleterious effect on injectivity was reduced by as much as
50% using the co-surfactant system, compared to a previously used surfactant system.
• The influence of a number of parameters on CO2-foam stability and surfactant adsorption
at reservoir conditions were determined in a series of tests. The stability of CO2-foam was
found to be surfactant concentration-dependent. Another series of tests demonstrated that
interfacial tension (IFT) does not directly correlate to foam stability and foam stability
cannot be predicted solely by the value of IFT.
• A series of experiments investigated calcium lignosulfonate (CLS) adsorption onto
minerals common to oil reservoirs: silica, kaolinite, bentonite, calcite, and dolomite.
Comparing CLS adsorption density onto different minerals was undertaken to develop
transport and sorption models to better predict chemical requirements in reservoir
flooding processes. The order of CLS adsorption density onto the five minerals was
found to be: montmorillonite >kaolinite>dolomite>calcite>silica.
• Adsorption and desorption studies were carried out with CLS on Berea sandstone. The
results of this research show that: increasing CLS concentration and salinity increases
CLS adsorption density; increasing temperature will decrease adsorption density;
increasing injection rate of CLS solution will slightly decrease CLS adsorption density,
post-flush rate and salinity of brine have a large impact on the CLS desorption process;
the adsorption and desorption process are not completely reversible; and temperature and
pH of the postflush brine have little effect on desorption.
• Another series of experiments looked at CLS transport mechanisms through Berea
sandstone by combining the experiment results of calcium lignosulfonate (CLS)
adsorption onto Berea sandstone and five powdered pure minerals that are found on
sandstone. Results showed that the Berea sandstone required a much longer equilibrium

103
time for CLS adsorption than did any of the other substances. indicating that diffusion is
the main mechanism controlling CLS transport time through Berea sandstone. When
• CLS adsorption densities onto five common reservoir minerals were compared, results
showed that silica, which constitutes more than 80% of Berea sandstone and is the bone
structure of sandstone, adsorbed little CLS, and that other minerals found in sandstone
contributed most of the adsorption of CLS onto Berea sandstone. Thus, a dual porosity
model is suggested to simulate CLS transport through Berea sandstone, though sandstone
is generally regarded as a homogeneous porous medium.
• Another series of experiments looked at CLS transport mechanisms through Berea
sandstone by combining the experiment results of calcium lignosulfonate (CLS)
adsorption onto Berea sandstone and five powdered pure minerals that are found on
sandstone. Results showed that the Berea sandstone required a much longer equilibrium
time for CLS adsorption than did any of the other substances, indicating that diffusion is
the main mechanism controlling CLS transport time through Berea sandstone.
• When CLS adsorption densities onto five common reservoir minerals were compared,
results showed that silica, which constitutes more than 80% of Berea sandstone and is the
bone structure of sandstone, adsorbed little CLS, and that other minerals found in
sandstone contributed most of the adsorption of CLS onto Berea sandstone. Thus, a dual
porosity model is suggested to simulate CLS transport through Berea sandstone, though
sandstone is generally regarded as a homogeneous porous medium.
• Studies on the adsorption and desorption of calcium lignosulfonate (CLS) were
performed with limestone and dolomite. Kinetic results have shown that adsorption and
desorption are both time-dependent, not instant. Both adsorption and desorption were
characterized by a biphasic pattern: a fast step followed by a slow step. Apparent
adsorption rate coefficients were determined by a second-order kinetic model. Desorption
did not reach equilibrium in the rested core under normal reservoir flow rates.
Equilibrium results show that CLS adsorption and desorption onto limestone or dolomite
can be described well by the Langmuir isotherm over the tested CLS concentration range,
and that increasing concentration increases adsorption density. There is significant
hysteresis between CLS adsorption and desorption isotherms. Increasing both NaCl and

104
CaCl2 concentrations increased adsorption density; however, CaCl2 had a much greater
impact on the adsorption.
• A series of experiments comprising adsorption and desorption tests was performed for
five powdered minerals and three rock types using a CO2–aqueous phase foaming agent,
surfactant CD. Results showed that CD adsorption and desorption onto powered minerals
could be established in one hour. The decreasing order of the surfactant adsorption
density onto the five minerals is: montmorillonite, dolomite, kaolinite, silica and calcite.
Surfactant adsorption onto the three core systems took at least one order of magnitude
longer than that onto the five powdered minerals, and the surfactant adsorption onto
Berea sandstone required a longer time than either Indiana limestone or Lockport
dolomite. These results led to a better understanding of surfactant adoption behaviors and
transport mechanisms through different porous media.
• Another series of experiments examined adsorption/desorption with two surfactant
systems (CD and CLS) and with a mixture of the two onto five minerals and two porous
media. The results from this work are being used to develop optimum solution
concentrations of CD and CLS for specific reservoir rock, which are anticipated to
optimize foaming ability, production cost economy, and adsorption.
• A number of foam stability and surfactant solution stability tests were carried out. The
results showed that :
Formaldehyde prevents formation of a suspended material (gel) or a precipitate when
the applied formaldehyde concentration is equal to or greater than 500 mg/L.
Sodium azide prevents a suspended solid (gel) and a minimum of precipitate forming
in CLS solution to concentrations at least as low as 50 mg/L. Gel decreased in SLS
with sodium azide concentration increase.
SLS solution had precipitate no matter what treatment was applied. If no treatment is
applied both SLS and CLS solutions will form gel with time, but CLS solution will
not have precipitate.
Sodium hypochlorite will bleach the solution to a very light yellow and will have
white precipitate for both SLS and CLS. This occurred the first day with no change
thereafter.
Previously conducted ultrasonic and boiling tests were found to have no effect

105
In addition to these experimental results, a substantial technology transfer effort, detailed in
Chapter 5, was accomplished.
ACKNOWLEDGEMENTS
The authors acknowledge the support of the US Department of Energy (contract no. DE-FC26-
01BC-15364) and the State of New Mexico. The authors acknowledge the assistance of the New
Mexico Tech Electron Microprobe Lab in obtaining BSEI and compositional analysis of the core
materials. We would like to thank Elizabeth Bustamante for aiding in the preparations of this
manuscript.
The correspondence and exchange of material, information, ideas and support of the following
companies is appreciated.
Amerada Hess
Anadarko
ChevronTexaco
ConocoPhillips
Dauben International
Devon
Denbury
ExxonMobil
Kinder Morgan
Oxy Permain
Pure
Quay Valley
Transpetco
List of Contributors to the Final Report and earlier Annual Reports
Reid B. Grigg
Robert K. Svec
Zheng Wen Zeng
Baojun Bai
Yi Liu
Brian J.O. McPhersen
F. David Martin
Tristan P. Wellman
Mary Harper
D.B. Gupta
Sankish Ganda
Laxman B. Bethapudi
Ghislain Fai-Yengo
Yusuf Oni

106
REFERENCES 1. Moritis, G.: “2000 Worldwide EOR Survey,” Oil & Gas Journal, (20 March 2000) 39-61
2. Grigg, R.B. and Schechter, D.S.: “State of the Industry in CO2 Floods,” paper SPE 38849
presented at the 1997 SPE Annual Technical conference and Exhibition held in San Antonio,
5-8 October.
3. Grigg, R.B.: “Improved Efficiency of Miscible CO2 Floods and Enhanced Prospects of CO2
Flooding Heterogeneous Reservoirs,” Final Report, Contract No. DE-FG26-97BC15047,
U.S. DOE (April 2001) covering June 1, 1997 – September 30, 2000.
4. Grigg, R.B., and Schechter, D.S.: “Improved Efficiency of Miscible CO2 Floods and
Enhanced Prospects of CO2 Flooding Heterogeneous Reservoirs,” Annual Report, Contract
No. DE-FG26-97BC15047, U.S. DOE (October 1999).
5. Grigg, R.B. and Schechter, D.S.: “Improved Efficiency of Miscible CO2 Floods and
Enhanced Prospects of CO2 Flooding Heterogeneous Reservoirs,” Annual Report, Contract
No. DE-FG26-97BC15047, U.S. DOE, (July 1998).
6. Grigg, R.B. and Schechter, D.S.: “Improved Efficiency of Miscible CO2 Floods and
Enhanced Prospects of CO2 Flooding Heterogeneous Reservoirs,” Final Report, Contract No.
DE-FG22-94BC14977, U.S. DOE, (FEB. 1998).
7. Grigg, R.B.: “Improved CO2 Efficiency for Recovering Oil in Heterogeneous Reservoirs,”
Third Annual Report for DOE contract no. DE-FC26-01BC15364, October 2004.
8. Grigg, R.B.: “Improved CO2 Efficiency for Recovering Oil in Heterogeneous Reservoirs,”
Second Annual Report for DOE contract no. DE-FC26-01BC15364, October 2003.
9. Grigg, R.B.: “Improved CO2 Efficiency for Recovering Oil in Heterogeneous Reservoirs,”
First Annual Report for DOE contract no. DE-FC26-01BC15364, January 2003.
10. Grigg, R.B.: “Long-term CO2 Storage: Using Petroleum Industry Experience,” Carbon
Dioxide Capture for Storage in Deep Geologic Formations, Volume 2, Chapter 11, D.C.
Thomas and S.M. Benson (Eds.), 2005 Elsevier Ltd.
11. Svec, R.K. and Grigg, R.B.: “Physical Effects of WAG Fluids on Carbonate Core Plugs,”
paper SPE 71496 presented at the 2001 SPE Annual Technical Conference and Exhibition,
New Orleans, 30 September-3 October.
12. Wellman, T.P., Grigg, R.B., McPherson, B.J., Svec, R.K., and Lichtner, P.C.: “Evaluation of
CO2-Brine-Reservoir Rock Interaction with Laboratory Flow Tests and Reactive Transport

107
Modeling,” paper SPE 80228 presented at the SPE International Symposium on Oilfield
Chemistry, Houston, 5-8 February 2003.
13. Grigg, R.B., McPherson, B.J., and Svec, R.K.: “Laboratory and Model Tests at Reservoir
Conditions for CO2-Brine-Carbonate Rock Systems Interactions,” prepared for The Second
Annual Conference on Carbon Capture and Sequestration Conference, 5-8 May 2003,
Washington, D.C.
14. Grigg, R.B. and Svec, R.B.: “Co-injected CO2-Brine Interactions with Indiana Limestone,”
SCA2003-19 presented at the International Symposium of the Society of Core Analysts, Pau,
France, 21-24 September 2003.
15. Grigg, R.B., and Svec, R.K., Carey, W., Lichtner, P.C., and Lesher, C.E.:
“CO2/Brine/Carbonate Rock Interactions: Dissolution and Precipitation,” prepared for The
Fourth Annual Conference on Carbon Capture and Sequestration, 2-5 May 2005,
Washington, D.C.
16. Zeng, Z.W., Grigg, R.B., and Ganda, S.: “Experimental Study of Overburden and Stress
Influence on Non-Darcy Gas Flow in Dakota Sandstone,” Paper SPE 84069 presented at the
SPE Annual Technical Conference and Exhibition, Denver, 5-8 October 2003.
17. Zeng, Z.W., Reid B. Grigg, R.B., and Gupta, D.B.: “Laboratory Investigation of Stress-
Sensitivity of Non-Darcy Gas Flow Parameters,” paper SPE 89431 presented at the
SPE/DOE Fourteenth Symposium on Improved Oil Recovery, Tulsa, 17–21 April 2004.
18. Grigg, R.B., Zeng, Z.W., and Bethapudi, L.V.: “Comparison of Non-Darcy Flow of CO2 and
N2 in a Carbonate Rock,” paper SPE 89471 presented at the SPE/DOE Fourteenth
Symposium on Improved Oil Recovery, Tulsa, 17–21 April 2004.
19. Zeng, Z.W. and Grigg, R.B.: “A Criterion for Non-Darcy Flow in Porous Media,” Transport
in Porous Media (in press).
20. Grigg, R.B., Tsau, J-S., and Martin, F.D.: “Cost Reduction and Injectivity Improvements for
CO2 Foams for Mobility Control,” paper SPE 75178 presented at the SPE/DOE Improved Oil
Recovery Symposium, Tulsa, 13-17 April 2002.
21. Liu, Y., Grigg, R.B., and Bai, B.: “Salinity, pH, and Surfactant Concentration Effects on
CO2-Foam,” paper SPE 93095 presented at the 2005 SPE International Symposium on
Oilfield Chemistry, Houston, 2-4 February.

108
22. Liu, Y., Grigg, R.B., and Svec, R.K.: “CO2 Foam Behavior: Influence of Temperature,
Pressure, and Concentration of Surfactant,” paper SPE 94307 prepared for presentation at the
2005 SPE Production and Operations Symposium, Oklahoma City, 17-19 April.
23. Grigg, R.B. and Bai, B.: “Calcium Lignosulfonate Adsorption and Desorption on Berea
Sandstone,” Journal of Colloid and Interface Science, 279 (2004) 36-45.
24. Bai, B. and Grigg, R.B.: “Kinetics and Equilibria of Calcium Lignosulfonate Adsorption and
Desorption onto Limestone,” paper SPE 93098 presented at the 2005 SPE International
Symposium on Oilfield Chemistry, Houston, 2- 4 February.
25. Grigg, R.B. and Bai, B.: “Sorption of Surfactant Used in CO2 Flooding Onto Five Minerals
and Three Porous Media,” paper SPE 93100 presented at the 2005 SPE International
Symposium on Oilfield Chemistry, Houston, 2-4 February.
26. Grigg, R.B., Bai, B., and Liu, Y.: “Competitive Adsorption of a Hybrid Surfactant System
onto Five Minerals, Berea Sandstone, and Limestone,” paper SPE 90612 presented at the
SPE Annual Technical Conference and Exhibition, Houston, 26–29 September 2004.
27. Taber, J.J.: In Situ (1990) 14(4), 345-404.
28. Stalkup, F.K., Jr.: Miscible Displacement, SPE Monograph No. 8, New York (1983).
29. Harkins, W.D. and Brown, J.J.: “The determination of surface tension (free surface energy),
and the weight of falling drops: the surface tension of water and benzene by the capillary
height method,” Amer. Chem. Soc, 41, 499, (1919).
30. Adamson, A.W.: “Physical Chemistry of Surfaces,” John Wiley & Sons, New York City
(1982).
31. Syahputra, A.E., Tsau, J-S., and Grigg, R.B.: “Laboratory Evaluation of Using
Lignosulfonate and Surfactant Mixture in CO2 Flooding,” paper SPE 59368 presented at the
SPE/DOE Improved Oil Recovery Symposium held in Tulsa, April 3–5, 2000.
32. Tsau, J.S., Syahputra, A.E., and Grigg, R.B.: “Economic Evaluation of Surfactant Adsorption
in CO2 Foam Application,” paper SPE 59365 presented at the SPE/DOE Improved Oil
Recovery Symposium held in Tulsa, April 3–5, 2000.
33. Do, D.: Adsorption Analysis: Equilibria and Kinetics,. Imperial College Press, 1998.
34. Hong, S. A., and Bae, J. H.: “Field Experiment of Lignosulfonate Preflushing for Surfactant
Adsorption Reduction,” SPERE (1990) 11, p.467-474.
35. Tsau, J-S., Syahputra, A. E, Yaghoobi, H., and Grigg, R.B.: “Use of Sacrificial Agents in

109
CO2 Foam Flooding Application,” paper SPE 56609 presented at the 1999 SPE Annual
Technical Conference and Exhibition, Houston, Oct. 3–6.
36. http://mineral.galleries.com/minerals/carbonat/dolomite/dolomite.htm
37. Austad, T. et al.: “Adsorption II: Nonequilibrium Adsorption of Surfactant onto Three
Reservoir Cores from the Norwegian Continental Shelf. The Effects of Clay Minerals,”
Journal of Petroleum Science and Engineering, 6 (1991), p.125-135.
38. Mannhardt, K, Schramm, L.L., and Novosad, J.J., “Effect of Rock Type and Brine
Composition on Adsorption of Two Foam-Forming Surfactants,” paper SPE20463 presented
at the 1990 Annual Technique Conference and Exhibition of the Society of Petroleum
Engineers, New Orleans, Sept. 23-26.
39. Somasundaran, P. and Agar, G.E., “The Zero Point of Charge of Calcite,” Journal of Colloid
and Interface Science, 24 (1967), 433–440.
40. Azizian, S.: “Kinetics Models of Sorption: a Theoretical Analysis,” Journal of Colloid and
Interface Science, 276(August 2004), p.1 47-52.
41. Rengaraj, S., et al.: “Removal of Copper from Aqueous Solution by Aminated and
Protonated Mesoporous Aluminas: Kinetics and Equlibrium,” Journal of Colloid and
Interface Science, 273 (2004), 14-21.
42. Tsai, W.T., Lai, C. W., and Hsien, K.J.: “Adsorption Kinetics of Herbicide Paraquat from
Aqueous Solution onto Activated Bleaching Earth,” Chemosphere 55 (2004) , p.829–837.
43. Ozcan, A.S. and Ozcan, A.: “Adsorption of Acid Dyes from Aquous Solution onto Acid-
Activated Bentonite,” Journal of Colloid and Interface Science, 276(August 2004), No. 1,
p.39-46.
44. Zhang, Z. and Bai, R.: “Mechanisms and Kinetics of Humic Acid Adsorption onto Chitosan-
Coated Granules,” Journal of Colloid and Interface Science, 264 (2003), p. 30-38.
45. Demirbas, E.: “Adsorption Kinetics for the Removal of Chromium (VI) from Aquous
Solutions on the Activated Carbons Prepared from Agricultural Wastes,” Water SA 30(2004),
533-539.
46. Biswas, S.C. and Chattoraj, D.K.: “Kinetics of Adsorption of Cationic Surfactants at Silica-
Water Interface,” Journal of Colloid and Interface Science, 205 (1998), 12-20.
47. Zhang, H. and Sorbie, K.S.: “Non-Equilibrium Adsorption and Precipitation of Scale
Inhibitors: Corefloods and Mathematical Modelling,” paper SPE 64755 presented at the SPE

110
International Oil and Gas Conference and Exhibition, Beijing, Nov. 7–10, 2000.
48. Brusseau, M.L., Rao, R.E. and Davidson, J.M.: “Flow Interruption: a Method for
Investigating Sorption Nonequilibrium,” J. Contam. Hydrol, (1989) 4, 223-240.