Upshifted decision criteria in attentional blink and repetition blindness
ORIGINAL ARTICLE
Improved quantification from 1H-NMR spectra using reducedrepetition times
Santosh Kumar Bharti Æ Neeraj Sinha ÆBhawani Shankar Joshi Æ Sudhir Kumar Mandal ÆRaja Roy Æ Chunni Lal Khetrapal
Received: 8 May 2008 / Accepted: 28 August 2008 / Published online: 14 September 2008
� Springer Science+Business Media, LLC 2008
Abstract A method of choosing the correction factor
based on Bloch equation for the quantitative estimation of
metabolite from 1H NMR spectra recorded with reduced
recycle delay is prescribed. The procedure reduces the
experimental time without substantially compromising the
accuracy of quantitative estimation. It is based on choosing
the correction factors, which depend on T1 and T2 of the
metabolite and recycle delay used for recording the spectra.
It is validated by studying a mixture of amino acids with
known concentration of constituents and human serum
sample and it provides accuracy of quantitative estimation
to 95–96%.
Keywords T1 and T2 relaxation � CPMG �NMR spectroscopy � Body fluids � Metabolites �Quantitation
Abbreviations
CPMG Carr–Purcell–Meiboom–Gill
FID Free induction decay
qNMR Quantitative NMR
TSP Trimethyl silane propionic acid sodium salt
1 Introduction
NMR spectroscopy has tremendous potential for the me-
tabonomic studies of the biological fluids as it provides both
qualitative as well as quantitative information for the small
molecular weight metabolites present in the sample (Bell
and Sadler 1999; Malz and Jancke 2005; Gang et al. 2007).
The added advantage is the wealth of information for a
number of metabolites that can be obtained in a single step
analysis of biological fluids. Considerable progress has
been achieved in this field over last few years. The tech-
nique has been applied to identify biomarkers for various
diseases (Gang et al. 2007; Lindon et al. 2000, 2004; Viant
et al. 2003) such as diagnosis of Malabsorption syndrome
(Bala et al. 2004, 2006), Meningitis (Subramanian et al.
2005), Tyrosinemia (Bell et al. 1989), Alkaptonuria (Shuchi
et al. 1989), Dicarboxylic aciduria (Daviesa et al. 1992),
and identification of organs dysfunction like chronic Renal
failure (Bell et al. 1991), Hepatic failure (Saxena et al.
2006), monitoring Liver graft dysfunction (Singh et al.
2006) etc. However, there are some experimental factors
associated with quantitative determination from NMR
which need careful consideration (Pauli et al. 2006). For the
accurate quantitative analysis from NMR spectra, all
experimental parameters should be carefully optimized to
achieve acceptable accuracy and precision. Recycle delay is
one of the most important parameters for quantitative
analysis. Many research articles have reported different
recycle delay times of 50 s, 60 s etc. for complete relaxa-
tion of magnetization (Saxena et al. 2006; Gang et al. 2007;
Griffiths and Irving 1998; Larive et al. 1997) for recording
the NMR spectra. It is recommended that recycle delay
should ideally be five times the longest longitudinal
relaxation time (T1) of a particular metabolite present in
the sample (Evilia 2001). For a large number of samples,
S. K. Bharti � N. Sinha � S. K. Mandal � R. Roy �C. L. Khetrapal (&)
Centre of Biomedical Magnetic Resonance, Sanjay Gandhi
Postgraduate Institute of Medical Sciences (SGPGIMS) Campus,
Raibarelli Road, Lucknow 226014, Uttar Pradesh, India
e-mail: [email protected]
B. S. Joshi
Bruker India Scientific Pvt. Ltd., Lucknow,
Uttar Pradesh, India
123
Metabolomics (2008) 4:367–376
DOI 10.1007/s11306-008-0130-6
such allowance of complete relaxation leads to increase in
overall measurement time for each sample under study.
Metabonomics study requires analysis of hundreds of
samples for statistical significance and this requirement
harnesses the limitation on experimental time (Saude et al.
2006). Experimental time should be as low as possible with
an acceptable accuracy for quantification. Although the
difference of errors due to incomplete relaxation of various
metabolites associated in any metabonomic/metabolomic
studies remains constant when compared with control
subjects but quantitative variation when compared with
other analytical methods result in significant ambiguities.
The effect of incomplete relaxation due to shorter repetition
time can be removed by using relaxation agents (Griffiths
and Irving 1998; Caytana et al. 2007). But this method has
limitation since choice of unique relaxation agent for dif-
ferent metabolites is difficult. Standard addition method
followed by re-measurement of spectra (Gang et al. 2007)
can also be used to provide relative intensities which are not
affected by T1 relaxation. This method requires measure-
ment of a single sample twice and hence it also increases
the overall experimental time. In this article, we report
a method based on Bloch Equation (Bloch 1946)
for improved quantitative estimation by one dimensional1H NMR experiment recorded with incomplete relaxation
delay, usually much shorter than five times longest spin–
lattice relaxation (T1) delay.
Quantitative analysis of small metabolites in biofluids
such as serum, plasma, ascitic fluids etc. cannot be carried
out by single pulse NMR spectroscopy due to broad reso-
nances from high molecular weight lipids and lipoproteins.
There are several methodologies like de-proteinization
(Voet and Voet 1990; Wevers et al. 1994) ultracentrifu-
gation (Voet and Voet 1990; Daykin et al. 2002) and
diffusion sensitized technique (de Graaf and Behar 2003)
etc. to overcome the problem. Hahn-echo (Kriat et al.
1992) and CPMG (Van et al. 2003) have also been used for
such a purpose. All these methods have advantages and
disadvantages related to quantitative accuracy. Retaining
the noninvasive nature and minimal sample preparation
required for NMR spectroscopy, CPMG and Hahn-echo are
widely used methods for analyses of bio-fluids where
concentrations of macromolecules are high (Viant et al.
2003; Saxena et al. 2006; Singh et al. 2006; de Graaf and
Behar 2003; Van et al. 2003; Nishijima et al. 1997; Lucas
et al. 2005; Shiyan et al. 1992). NMR parameter which
affects the quantitative accuracy is spin–spin relaxation
(T2) when CPMG and Hahn-echo pulse sequences are used.
The quantitative accuracy is greatly affected by spin-spin
relaxation (T2) times for different metabolites and total
echo time used in CPMG pulse sequence to filter broad
signals. In this article, we propose a T2 correction factor to
improve the accuracy of quantification of small molecular
weight metabolites. We further demonstrate that CPMG
measurement, using shorter recycle time along with
implementation of T1 and T2 correction factors can provide
quantitative results with 95–96% accuracy.
2 Materials and methods
2.1 Solution preparation
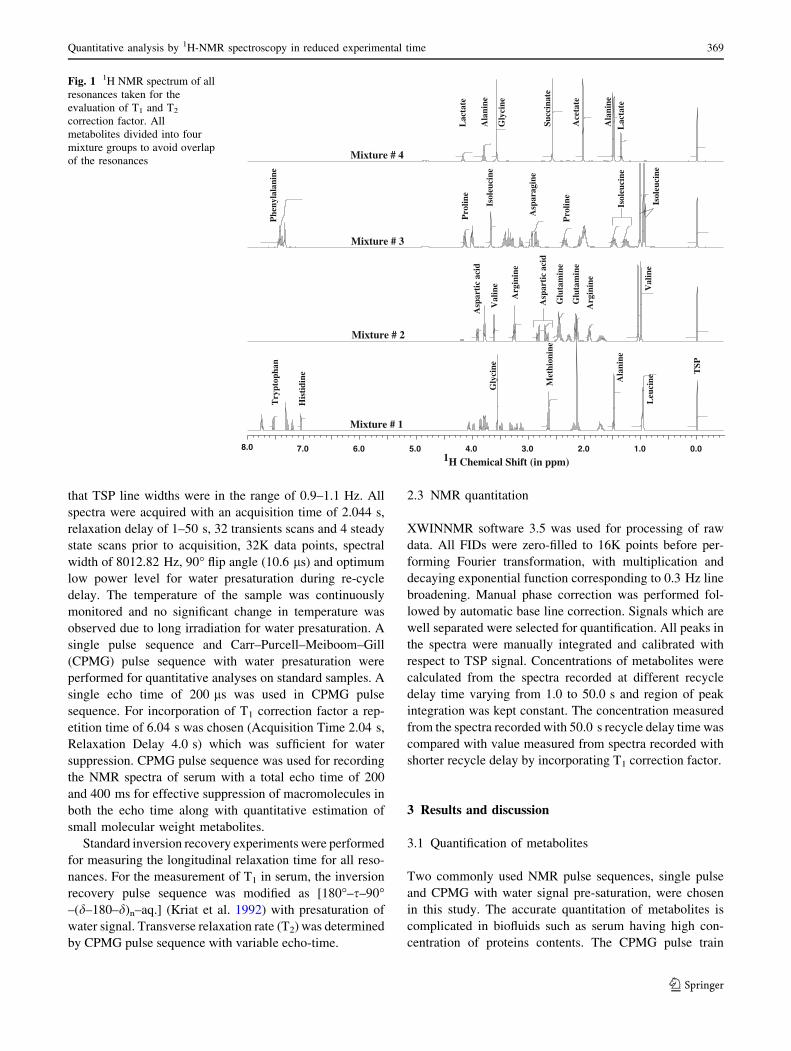
We used standard solutions of mixtures of amino acids and
other metabolites for evaluation of T1 and T2 as well as for
quantitative estimation. Four groups of sample consisting of
mixtures of 14 amino acids, lactate, acetate and succinate
were employed. All compounds were purchased from
Merck Chemicals and Sigma–Aldrich with a minimum
purity of 99% (AR grade). Therefore, no further purification
was carried out. Deuterium oxide (99.8% D atom, Sigma–
Aldrich) was used for solution preparation. All samples
were divided into groups so as to avoid overlap of the sig-
nals. Mixture #1 contained Alanine, Leucine, Methionine,
Glycine, Histidine, and Tryptophan, Mixture #2 contained
Valine, Arginine, Glutamine, and Aspartic acid. Mixture #3
contained Isoleucine, Proline, Asparagines, and Phenylal-
anine. And Mixture #4 contained Lactate, Alanine, Acetate,
Succinate and Glycine. The one dimensional 1H NMR
spectra with the resonance assignments are shown in Fig. 1.
For verification of the results some of the metabolites e.g.
Alanine, Glycine were taken in two groups in two different
concentrations. The concentrations of all metabolites in
different samples varied in the range of 60–200 mg/dl. T1
values of different resonances from standard samples were
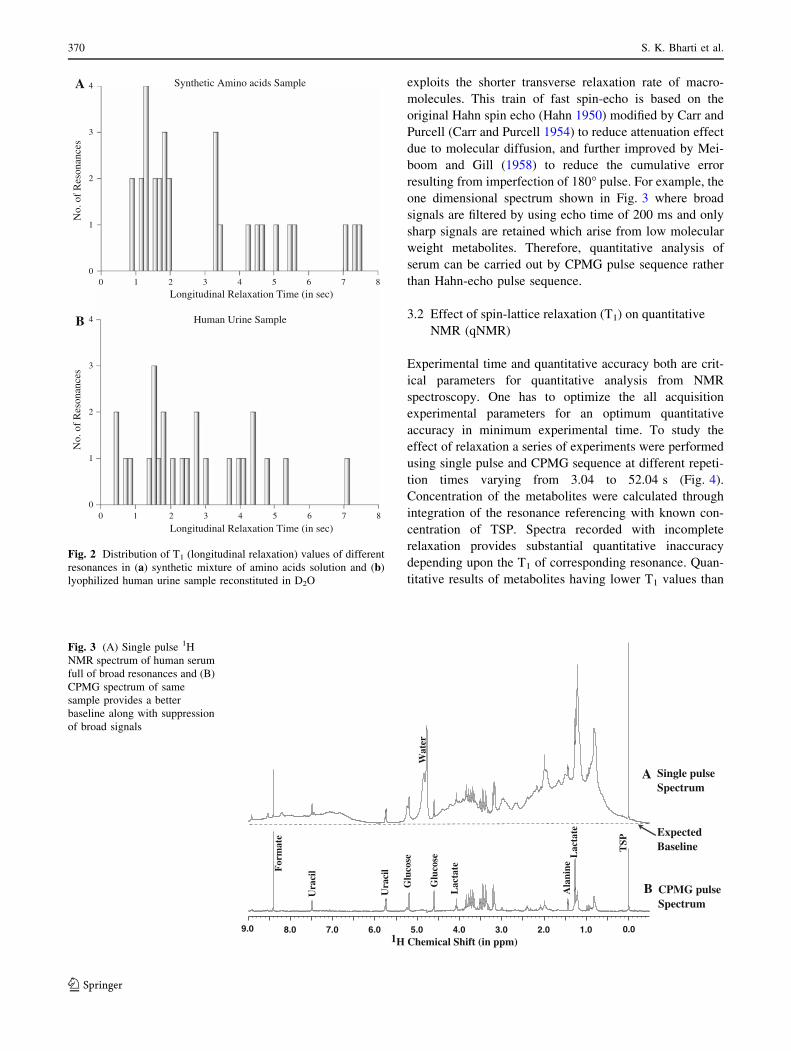
measured by inversion recovery method. The distribution of
T1 values are shown in Fig. 2a. It can be seen we have wide
variation in T1 values ranging from 0.8 to 7.5 s. Similarly
T1 distribution of some of the unassigned resonances in
human urine sample are shown in Fig. 2b.
For validation of the results, a known concentration of
Formate and Uracil (40 mg/dl) was mixed with 400 ll
serum sample with ammonium chloride. NH4Cl was used
(final concentration of 0.8 M) to release the bindings of
small metabolites and serum proteins and for achieving
better water suppression (Yamaguchi et al. 1989).
2.2 NMR experimental acquisition
All NMR experiments were performed on Bruker Biospin
Avance 400 MHz wide bore (89 mm) NMR spectrometer
with 5 mm Broad Band Inverse probe at 300 K tempera-
ture. Wilmad NMR tubes (5 mm) and coaxial insert
containing reference standard TSP dissolved in D2O, were
used (Griffiths and Irving 1998; Henderson 2002). For each
spectrum, manual shimming was done and optimized so
368 S. K. Bharti et al.
123
that TSP line widths were in the range of 0.9–1.1 Hz. All
spectra were acquired with an acquisition time of 2.044 s,
relaxation delay of 1–50 s, 32 transients scans and 4 steady
state scans prior to acquisition, 32K data points, spectral
width of 8012.82 Hz, 90� flip angle (10.6 ls) and optimum
low power level for water presaturation during re-cycle
delay. The temperature of the sample was continuously
monitored and no significant change in temperature was
observed due to long irradiation for water presaturation. A
single pulse sequence and Carr–Purcell–Meiboom–Gill
(CPMG) pulse sequence with water presaturation were
performed for quantitative analyses on standard samples. A
single echo time of 200 ls was used in CPMG pulse
sequence. For incorporation of T1 correction factor a rep-
etition time of 6.04 s was chosen (Acquisition Time 2.04 s,
Relaxation Delay 4.0 s) which was sufficient for water
suppression. CPMG pulse sequence was used for recording
the NMR spectra of serum with a total echo time of 200
and 400 ms for effective suppression of macromolecules in
both the echo time along with quantitative estimation of
small molecular weight metabolites.
Standard inversion recovery experiments were performed
for measuring the longitudinal relaxation time for all reso-
nances. For the measurement of T1 in serum, the inversion
recovery pulse sequence was modified as [180�–s–90�–(d–180–d)n–aq.] (Kriat et al. 1992) with presaturation of
water signal. Transverse relaxation rate (T2) was determined
by CPMG pulse sequence with variable echo-time.
2.3 NMR quantitation
XWINNMR software 3.5 was used for processing of raw
data. All FIDs were zero-filled to 16K points before per-
forming Fourier transformation, with multiplication and
decaying exponential function corresponding to 0.3 Hz line
broadening. Manual phase correction was performed fol-
lowed by automatic base line correction. Signals which are
well separated were selected for quantification. All peaks in
the spectra were manually integrated and calibrated with
respect to TSP signal. Concentrations of metabolites were
calculated from the spectra recorded at different recycle
delay time varying from 1.0 to 50.0 s and region of peak
integration was kept constant. The concentration measured
from the spectra recorded with 50.0 s recycle delay time was
compared with value measured from spectra recorded with
shorter recycle delay by incorporating T1 correction factor.
3 Results and discussion
3.1 Quantification of metabolites
Two commonly used NMR pulse sequences, single pulse
and CPMG with water signal pre-saturation, were chosen
in this study. The accurate quantitation of metabolites is
complicated in biofluids such as serum having high con-
centration of proteins contents. The CPMG pulse train
7.0 6.0 5.0 4.0 3.0 2.0 1.0 0.0
TSP
Leu
cineA
lani
ne
Met
hion
ine
Gly
cine
His
tidi
ne
Try
ptop
han
Val
ine
Arg
inin
e
Arg
inin
e
Glu
tam
ine
Glu
tam
ine
Asp
arti
c ac
id
Asp
arti
c ac
id
Val
ine
Isol
euci
ne
Isol
euci
ne
Isol
euci
ne
Pro
line
Pro
line
Asp
arag
ine
Phe
nyla
lani
ne
Lac
tate
Ala
nine
Ace
tate
Succ
inat
e
Gly
cine
Lac
tate
Ala
nine
8.0
Mixture # 1
Mixture # 3
Mixture # 2
Mixture # 4
1H Chemical Shift (in ppm)
Fig. 1 1H NMR spectrum of all
resonances taken for the
evaluation of T1 and T2
correction factor. All
metabolites divided into four
mixture groups to avoid overlap
of the resonances
Quantitative analysis by 1H-NMR spectroscopy in reduced experimental time 369
123
exploits the shorter transverse relaxation rate of macro-
molecules. This train of fast spin-echo is based on the
original Hahn spin echo (Hahn 1950) modified by Carr and
Purcell (Carr and Purcell 1954) to reduce attenuation effect
due to molecular diffusion, and further improved by Mei-
boom and Gill (1958) to reduce the cumulative error
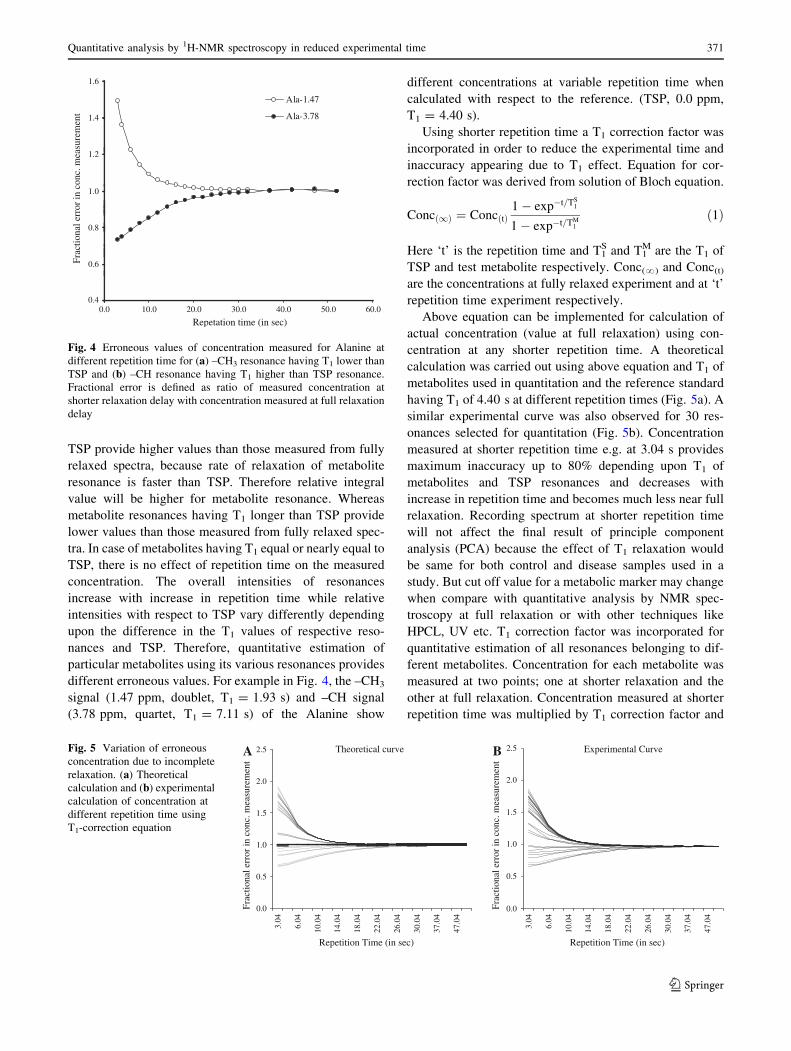
resulting from imperfection of 180� pulse. For example, the
one dimensional spectrum shown in Fig. 3 where broad
signals are filtered by using echo time of 200 ms and only
sharp signals are retained which arise from low molecular
weight metabolites. Therefore, quantitative analysis of
serum can be carried out by CPMG pulse sequence rather
than Hahn-echo pulse sequence.
3.2 Effect of spin-lattice relaxation (T1) on quantitative
NMR (qNMR)
Experimental time and quantitative accuracy both are crit-
ical parameters for quantitative analysis from NMR
spectroscopy. One has to optimize the all acquisition
experimental parameters for an optimum quantitative
accuracy in minimum experimental time. To study the
effect of relaxation a series of experiments were performed
using single pulse and CPMG sequence at different repeti-
tion times varying from 3.04 to 52.04 s (Fig. 4).
Concentration of the metabolites were calculated through
integration of the resonance referencing with known con-
centration of TSP. Spectra recorded with incomplete
relaxation provides substantial quantitative inaccuracy
depending upon the T1 of corresponding resonance. Quan-
titative results of metabolites having lower T1 values than
8.0 7.0 6.0 5.0 4.0 3.0 2.0 1.0
For
mat
e
Ura
cil
Glu
cose
Glu
cose
Lac
tate
Lac
tate
Ala
nine
TSP
Wat
er
9.0 0.0
Single pulse Spectrum
CPMG pulse Spectrum
ExpectedBaseline
A
BUra
cil
1H Chemical Shift (in ppm)
Fig. 3 (A) Single pulse 1H
NMR spectrum of human serum
full of broad resonances and (B)
CPMG spectrum of same
sample provides a better
baseline along with suppression
of broad signals
0 1 2 3 4 5 6 7 8
0
1
2
3
4
0
1
2
3
4
0 1 2 3 4 5 6 7 8
Longitudinal Relaxation Time (in sec)
Longitudinal Relaxation Time (in sec)
No.
of
Res
onan
ces
No.
of
Res
onan
ces
Human Urine Sample
Synthetic Amino acids SampleA
B
Fig. 2 Distribution of T1 (longitudinal relaxation) values of different
resonances in (a) synthetic mixture of amino acids solution and (b)
lyophilized human urine sample reconstituted in D2O
370 S. K. Bharti et al.
123
TSP provide higher values than those measured from fully
relaxed spectra, because rate of relaxation of metabolite
resonance is faster than TSP. Therefore relative integral
value will be higher for metabolite resonance. Whereas
metabolite resonances having T1 longer than TSP provide
lower values than those measured from fully relaxed spec-
tra. In case of metabolites having T1 equal or nearly equal to
TSP, there is no effect of repetition time on the measured
concentration. The overall intensities of resonances
increase with increase in repetition time while relative
intensities with respect to TSP vary differently depending
upon the difference in the T1 values of respective reso-
nances and TSP. Therefore, quantitative estimation of
particular metabolites using its various resonances provides
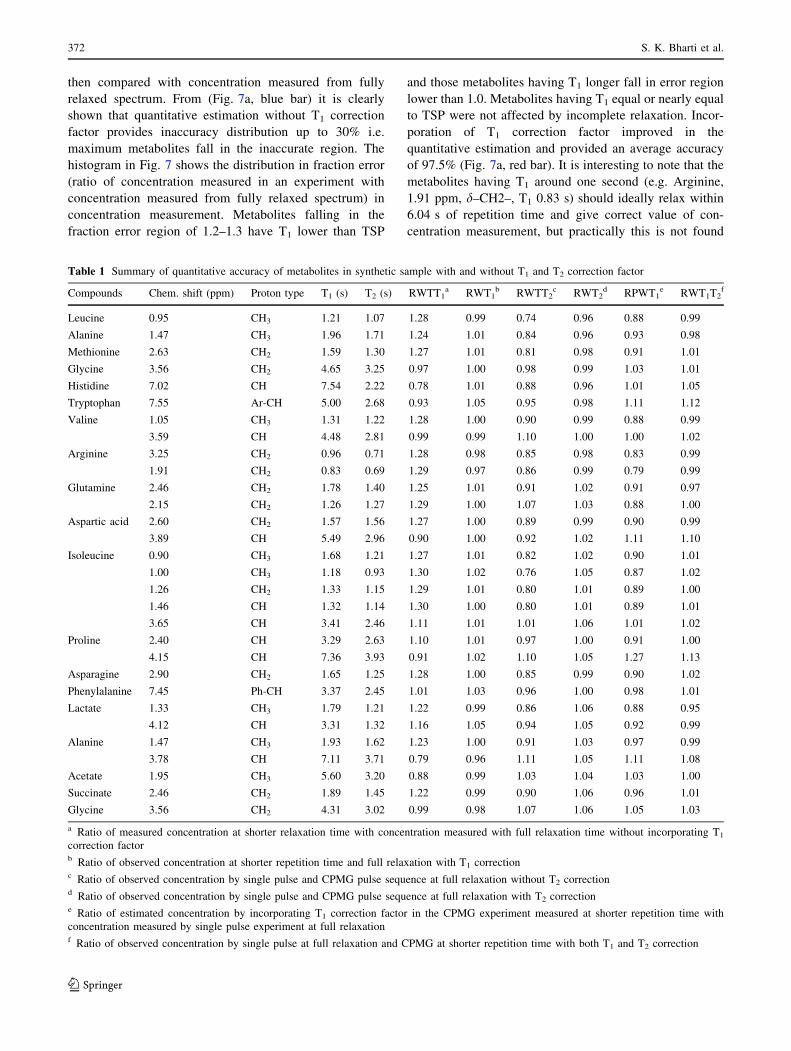
different erroneous values. For example in Fig. 4, the –CH3
signal (1.47 ppm, doublet, T1 = 1.93 s) and –CH signal
(3.78 ppm, quartet, T1 = 7.11 s) of the Alanine show
different concentrations at variable repetition time when
calculated with respect to the reference. (TSP, 0.0 ppm,
T1 = 4.40 s).
Using shorter repetition time a T1 correction factor was
incorporated in order to reduce the experimental time and
inaccuracy appearing due to T1 effect. Equation for cor-
rection factor was derived from solution of Bloch equation.
Concð1Þ ¼ ConcðtÞ1� exp�t=TS
1
1� exp�t=TM1
ð1Þ
Here ‘t’ is the repetition time and T1S and T1
M are the T1 of
TSP and test metabolite respectively. Conc(?) and Conc(t)
are the concentrations at fully relaxed experiment and at ‘t’
repetition time experiment respectively.
Above equation can be implemented for calculation of
actual concentration (value at full relaxation) using con-
centration at any shorter repetition time. A theoretical
calculation was carried out using above equation and T1 of
metabolites used in quantitation and the reference standard
having T1 of 4.40 s at different repetition times (Fig. 5a). A
similar experimental curve was also observed for 30 res-
onances selected for quantitation (Fig. 5b). Concentration
measured at shorter repetition time e.g. at 3.04 s provides
maximum inaccuracy up to 80% depending upon T1 of
metabolites and TSP resonances and decreases with
increase in repetition time and becomes much less near full
relaxation. Recording spectrum at shorter repetition time
will not affect the final result of principle component
analysis (PCA) because the effect of T1 relaxation would
be same for both control and disease samples used in a
study. But cut off value for a metabolic marker may change
when compare with quantitative analysis by NMR spec-
troscopy at full relaxation or with other techniques like
HPCL, UV etc. T1 correction factor was incorporated for
quantitative estimation of all resonances belonging to dif-
ferent metabolites. Concentration for each metabolite was
measured at two points; one at shorter relaxation and the
other at full relaxation. Concentration measured at shorter
repetition time was multiplied by T1 correction factor and
0.4
0.6
0.8
1.0
1.2
1.4
1.6
10.0
Repetation time (in sec)
Frac
tiona
l err
or in
con
c. m
easu
rem
ent
Ala-1.47
Ala-3.78
0.0 60.050.040.030.020.0
Fig. 4 Erroneous values of concentration measured for Alanine at
different repetition time for (a) –CH3 resonance having T1 lower than
TSP and (b) –CH resonance having T1 higher than TSP resonance.
Fractional error is defined as ratio of measured concentration at
shorter relaxation delay with concentration measured at full relaxation
delay
0.5
1.0
1.5
2.0
2.5
0.0
Experimental CurveB
Frac
tiona
l err
or in
con
c. m
easu
rem
ent
Theoretical curve
0.0
0.5
1.0
1.5
2.0
2.5
3.04
6.04
10.0
4
14.0
4
18.0
4
22.0
4
26.0
4
30.0
4
37.0
4
47.0
4
Frac
tiona
l err
or in
con
c. m
easu
rem
ent
Repetition Time (in sec)
A
3.04
6.04
10.0
4
14.0
4
18.0
4
22.0
4
26.0
4
30.0
4
37.0
4
47.0
4
Repetition Time (in sec)
Fig. 5 Variation of erroneous
concentration due to incomplete
relaxation. (a) Theoretical
calculation and (b) experimental
calculation of concentration at
different repetition time using
T1-correction equation
Quantitative analysis by 1H-NMR spectroscopy in reduced experimental time 371
123
then compared with concentration measured from fully
relaxed spectrum. From (Fig. 7a, blue bar) it is clearly
shown that quantitative estimation without T1 correction
factor provides inaccuracy distribution up to 30% i.e.
maximum metabolites fall in the inaccurate region. The
histogram in Fig. 7 shows the distribution in fraction error
(ratio of concentration measured in an experiment with
concentration measured from fully relaxed spectrum) in
concentration measurement. Metabolites falling in the
fraction error region of 1.2–1.3 have T1 lower than TSP
and those metabolites having T1 longer fall in error region
lower than 1.0. Metabolites having T1 equal or nearly equal
to TSP were not affected by incomplete relaxation. Incor-
poration of T1 correction factor improved in the
quantitative estimation and provided an average accuracy
of 97.5% (Fig. 7a, red bar). It is interesting to note that the
metabolites having T1 around one second (e.g. Arginine,
1.91 ppm, d–CH2–, T1 0.83 s) should ideally relax within
6.04 s of repetition time and give correct value of con-
centration measurement, but practically this is not found
Table 1 Summary of quantitative accuracy of metabolites in synthetic sample with and without T1 and T2 correction factor
Compounds Chem. shift (ppm) Proton type T1 (s) T2 (s) RWTT1a RWT1
b RWTT2c RWT2
d RPWT1e RWT1T2
f
Leucine 0.95 CH3 1.21 1.07 1.28 0.99 0.74 0.96 0.88 0.99
Alanine 1.47 CH3 1.96 1.71 1.24 1.01 0.84 0.96 0.93 0.98
Methionine 2.63 CH2 1.59 1.30 1.27 1.01 0.81 0.98 0.91 1.01
Glycine 3.56 CH2 4.65 3.25 0.97 1.00 0.98 0.99 1.03 1.01
Histidine 7.02 CH 7.54 2.22 0.78 1.01 0.88 0.96 1.01 1.05
Tryptophan 7.55 Ar-CH 5.00 2.68 0.93 1.05 0.95 0.98 1.11 1.12
Valine 1.05 CH3 1.31 1.22 1.28 1.00 0.90 0.99 0.88 0.99
3.59 CH 4.48 2.81 0.99 0.99 1.10 1.00 1.00 1.02
Arginine 3.25 CH2 0.96 0.71 1.28 0.98 0.85 0.98 0.83 0.99
1.91 CH2 0.83 0.69 1.29 0.97 0.86 0.99 0.79 0.99
Glutamine 2.46 CH2 1.78 1.40 1.25 1.01 0.91 1.02 0.91 0.97
2.15 CH2 1.26 1.27 1.29 1.00 1.07 1.03 0.88 1.00
Aspartic acid 2.60 CH2 1.57 1.56 1.27 1.00 0.89 0.99 0.90 0.99
3.89 CH 5.49 2.96 0.90 1.00 0.92 1.02 1.11 1.10
Isoleucine 0.90 CH3 1.68 1.21 1.27 1.01 0.82 1.02 0.90 1.01
1.00 CH3 1.18 0.93 1.30 1.02 0.76 1.05 0.87 1.02
1.26 CH2 1.33 1.15 1.29 1.01 0.80 1.01 0.89 1.00
1.46 CH 1.32 1.14 1.30 1.00 0.80 1.01 0.89 1.01
3.65 CH 3.41 2.46 1.11 1.01 1.01 1.06 1.01 1.02
Proline 2.40 CH 3.29 2.63 1.10 1.01 0.97 1.00 0.91 1.00
4.15 CH 7.36 3.93 0.91 1.02 1.10 1.05 1.27 1.13
Asparagine 2.90 CH2 1.65 1.25 1.28 1.00 0.85 0.99 0.90 1.02
Phenylalanine 7.45 Ph-CH 3.37 2.45 1.01 1.03 0.96 1.00 0.98 1.01
Lactate 1.33 CH3 1.79 1.21 1.22 0.99 0.86 1.06 0.88 0.95
4.12 CH 3.31 1.32 1.16 1.05 0.94 1.05 0.92 0.99
Alanine 1.47 CH3 1.93 1.62 1.23 1.00 0.91 1.03 0.97 0.99
3.78 CH 7.11 3.71 0.79 0.96 1.11 1.05 1.11 1.08
Acetate 1.95 CH3 5.60 3.20 0.88 0.99 1.03 1.04 1.03 1.00
Succinate 2.46 CH2 1.89 1.45 1.22 0.99 0.90 1.06 0.96 1.01
Glycine 3.56 CH2 4.31 3.02 0.99 0.98 1.07 1.06 1.05 1.03
a Ratio of measured concentration at shorter relaxation time with concentration measured with full relaxation time without incorporating T1
correction factorb Ratio of observed concentration at shorter repetition time and full relaxation with T1 correctionc Ratio of observed concentration by single pulse and CPMG pulse sequence at full relaxation without T2 correctiond Ratio of observed concentration by single pulse and CPMG pulse sequence at full relaxation with T2 correctione Ratio of estimated concentration by incorporating T1 correction factor in the CPMG experiment measured at shorter repetition time with
concentration measured by single pulse experiment at full relaxationf Ratio of observed concentration by single pulse at full relaxation and CPMG at shorter repetition time with both T1 and T2 correction
372 S. K. Bharti et al.
123
due to incomplete relaxation of the standard reference TSP.
It is therefore obvious that T1 of both reference and
metabolites resonances play important roles in quantitative
accuracy. Detailed analysis of concentration measurement
for each metabolite is presented in Table 1. In case of
ERETIC method used for quantitation, the electronically
generated reference signal intensity is not affected by
repetition time (Akoka et al. 1999). But quantitative
accuracy will also be affected when ERETIC method is
used at shorter repetition time, because of metabolites
resonances having longer T1 values e.g formate having
longer T1 value is 7.65 s which needs a repetition time of
approximately 38.0 s (5 * T1), consequently increases the
experimental time. Therefore ERETIC method cannot be
helpful in reduction of the experimental time because of
wide distribution of T1 in a mixture (see Fig. 2). For
quantitative analysis by ERETIC method using shorter
repetition time, a T1 correction factor due to metabolites
resonance should be incorporated. ERETIC method would
be performed in new version instrument without any
additional electronic device to generate reference signal
(Silvestre et al. 2001) whereas in old spectrometers it is not
possible without adding an external electronic device for
synthesizing electronic reference signal.
Quantitative analysis using overlapping signals can also
be performed with help deconvolution if the T1 of that
particular resonance is known or can be evaluated.
3.3 Effect of spin–spin relaxation (T2) on qNMR
A detailed study has been carried out by earlier worker
(Van et al. 2003) for analysis of body fluids containing
macromolecules using CPMG pulse sequence along with
WET pulse sequence for suppression of water signal.
Suppression of broad signal depends upon the T2 of cor-
responding signal and total echo time used. But along with
suppression of broad signal most of the sharp signal is also
suppressed depending upon the T2 of corresponding signal.
For study of T2 effect a series of experiments were per-
formed using single pulse sequence and CPMG pulse
sequence with a fix echo time and recycle delays. A con-
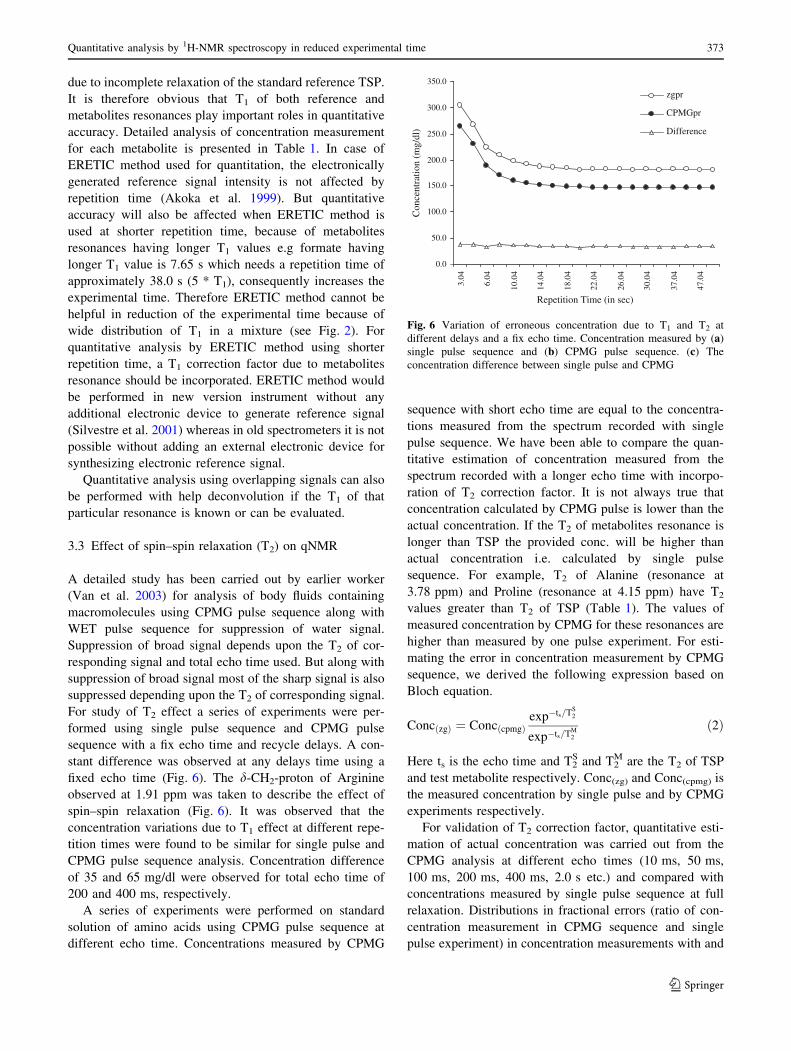
stant difference was observed at any delays time using a
fixed echo time (Fig. 6). The d-CH2-proton of Arginine
observed at 1.91 ppm was taken to describe the effect of
spin–spin relaxation (Fig. 6). It was observed that the
concentration variations due to T1 effect at different repe-
tition times were found to be similar for single pulse and
CPMG pulse sequence analysis. Concentration difference
of 35 and 65 mg/dl were observed for total echo time of
200 and 400 ms, respectively.
A series of experiments were performed on standard
solution of amino acids using CPMG pulse sequence at
different echo time. Concentrations measured by CPMG
sequence with short echo time are equal to the concentra-
tions measured from the spectrum recorded with single
pulse sequence. We have been able to compare the quan-
titative estimation of concentration measured from the
spectrum recorded with a longer echo time with incorpo-
ration of T2 correction factor. It is not always true that
concentration calculated by CPMG pulse is lower than the
actual concentration. If the T2 of metabolites resonance is
longer than TSP the provided conc. will be higher than
actual concentration i.e. calculated by single pulse
sequence. For example, T2 of Alanine (resonance at
3.78 ppm) and Proline (resonance at 4.15 ppm) have T2
values greater than T2 of TSP (Table 1). The values of
measured concentration by CPMG for these resonances are
higher than measured by one pulse experiment. For esti-
mating the error in concentration measurement by CPMG
sequence, we derived the following expression based on
Bloch equation.
ConcðzgÞ ¼ ConcðcpmgÞexp�ts=T
S2
exp�ts=TM2
ð2Þ
Here ts is the echo time and T2S and T2
M are the T2 of TSP
and test metabolite respectively. Conc(zg) and Conc(cpmg) is
the measured concentration by single pulse and by CPMG
experiments respectively.
For validation of T2 correction factor, quantitative esti-
mation of actual concentration was carried out from the
CPMG analysis at different echo times (10 ms, 50 ms,
100 ms, 200 ms, 400 ms, 2.0 s etc.) and compared with
concentrations measured by single pulse sequence at full
relaxation. Distributions in fractional errors (ratio of con-
centration measurement in CPMG sequence and single
pulse experiment) in concentration measurements with and
0.0
50.0
100.0
150.0
200.0
250.0
300.0
350.0
3.04
6.04
10.0
4
14.0
4
18.0
4
22.0
4
26.0
4
30.0
4
37.0
4
47.0
4
zgpr
CPMGpr
Difference
Repetition Time (in sec)
Con
cent
ratio
n (m
g/dl
)
Fig. 6 Variation of erroneous concentration due to T1 and T2 at
different delays and a fix echo time. Concentration measured by (a)
single pulse sequence and (b) CPMG pulse sequence. (c) The
concentration difference between single pulse and CPMG
Quantitative analysis by 1H-NMR spectroscopy in reduced experimental time 373
123
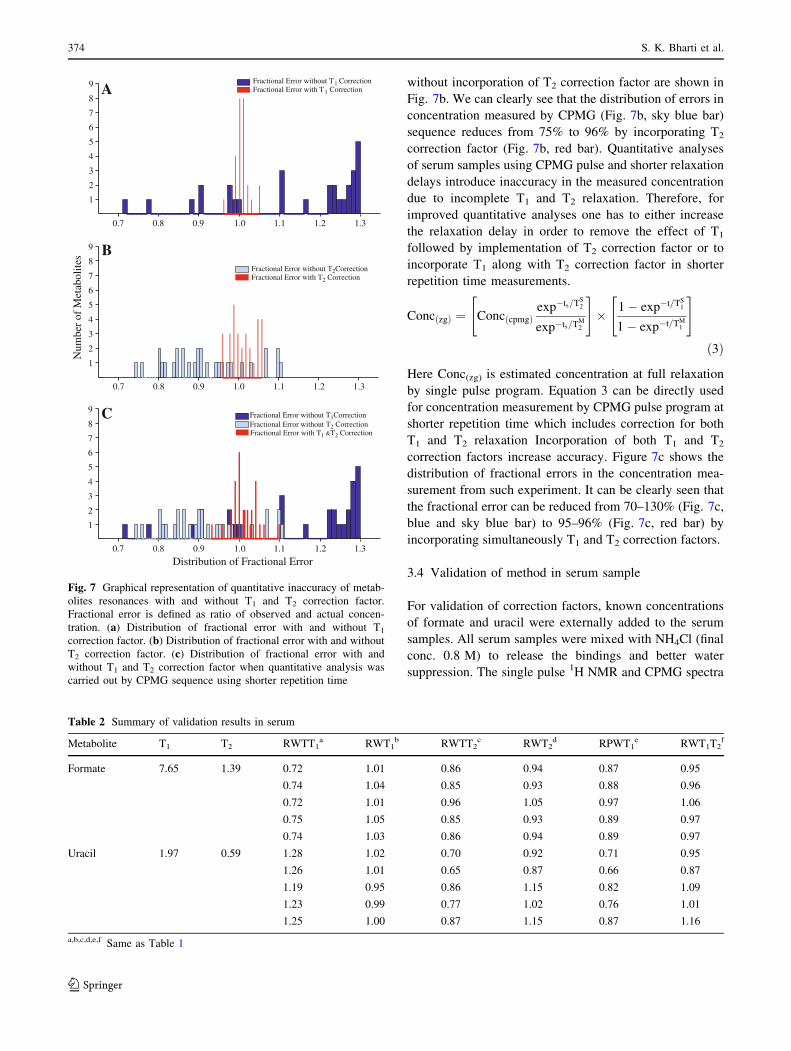
without incorporation of T2 correction factor are shown in
Fig. 7b. We can clearly see that the distribution of errors in
concentration measured by CPMG (Fig. 7b, sky blue bar)
sequence reduces from 75% to 96% by incorporating T2
correction factor (Fig. 7b, red bar). Quantitative analyses
of serum samples using CPMG pulse and shorter relaxation
delays introduce inaccuracy in the measured concentration
due to incomplete T1 and T2 relaxation. Therefore, for
improved quantitative analyses one has to either increase
the relaxation delay in order to remove the effect of T1
followed by implementation of T2 correction factor or to
incorporate T1 along with T2 correction factor in shorter
repetition time measurements.
ConcðzgÞ ¼ ConcðcpmgÞexp�ts=T
S2
exp�ts=TM2
" #� 1� exp�t=TS
1
1� exp�t=TM1
" #
ð3Þ
Here Conc(zg) is estimated concentration at full relaxation
by single pulse program. Equation 3 can be directly used
for concentration measurement by CPMG pulse program at
shorter repetition time which includes correction for both
T1 and T2 relaxation Incorporation of both T1 and T2
correction factors increase accuracy. Figure 7c shows the
distribution of fractional errors in the concentration mea-
surement from such experiment. It can be clearly seen that
the fractional error can be reduced from 70–130% (Fig. 7c,
blue and sky blue bar) to 95–96% (Fig. 7c, red bar) by
incorporating simultaneously T1 and T2 correction factors.
3.4 Validation of method in serum sample
For validation of correction factors, known concentrations
of formate and uracil were externally added to the serum
samples. All serum samples were mixed with NH4Cl (final
conc. 0.8 M) to release the bindings and better water
suppression. The single pulse 1H NMR and CPMG spectra
0.7 0.8 0.9 1.0 1.1 1.2 1.3
1
2
3
4
5
6
7
8
9 Fractional Error without T1 CorrectionFractional Error with T1 Correction
1
2
3
4
5
6
7
8
9
Num
ber
of M
etab
olite
s
0.7 0.8 0.9 1.0 1.1 1.2 1.3
0.7 0.8 0.9 1.0 1.1 1.2 1.3
1
2
3
4
5
6
7
8
9
Distribution of Fractional Error
Fractional Error without T2CorrectionFractional Error with T2 Correction
Fractional Error without T1CorrectionFractional Error without T2 CorrectionFractional Error with T1 &T2 Correction
A
B
C
Fig. 7 Graphical representation of quantitative inaccuracy of metab-
olites resonances with and without T1 and T2 correction factor.
Fractional error is defined as ratio of observed and actual concen-
tration. (a) Distribution of fractional error with and without T1
correction factor. (b) Distribution of fractional error with and without
T2 correction factor. (c) Distribution of fractional error with and
without T1 and T2 correction factor when quantitative analysis was
carried out by CPMG sequence using shorter repetition time
Table 2 Summary of validation results in serum
Metabolite T1 T2 RWTT1a RWT1
b RWTT2c RWT2
d RPWT1e RWT1T2
f
Formate 7.65 1.39 0.72 1.01 0.86 0.94 0.87 0.95
0.74 1.04 0.85 0.93 0.88 0.96
0.72 1.01 0.96 1.05 0.97 1.06
0.75 1.05 0.85 0.93 0.89 0.97
0.74 1.03 0.86 0.94 0.89 0.97
Uracil 1.97 0.59 1.28 1.02 0.70 0.92 0.71 0.95
1.26 1.01 0.65 0.87 0.66 0.87
1.19 0.95 0.86 1.15 0.82 1.09
1.23 0.99 0.77 1.02 0.76 1.01
1.25 1.00 0.87 1.15 0.87 1.16
a,b,c,d,e,f Same as Table 1
374 S. K. Bharti et al.
123
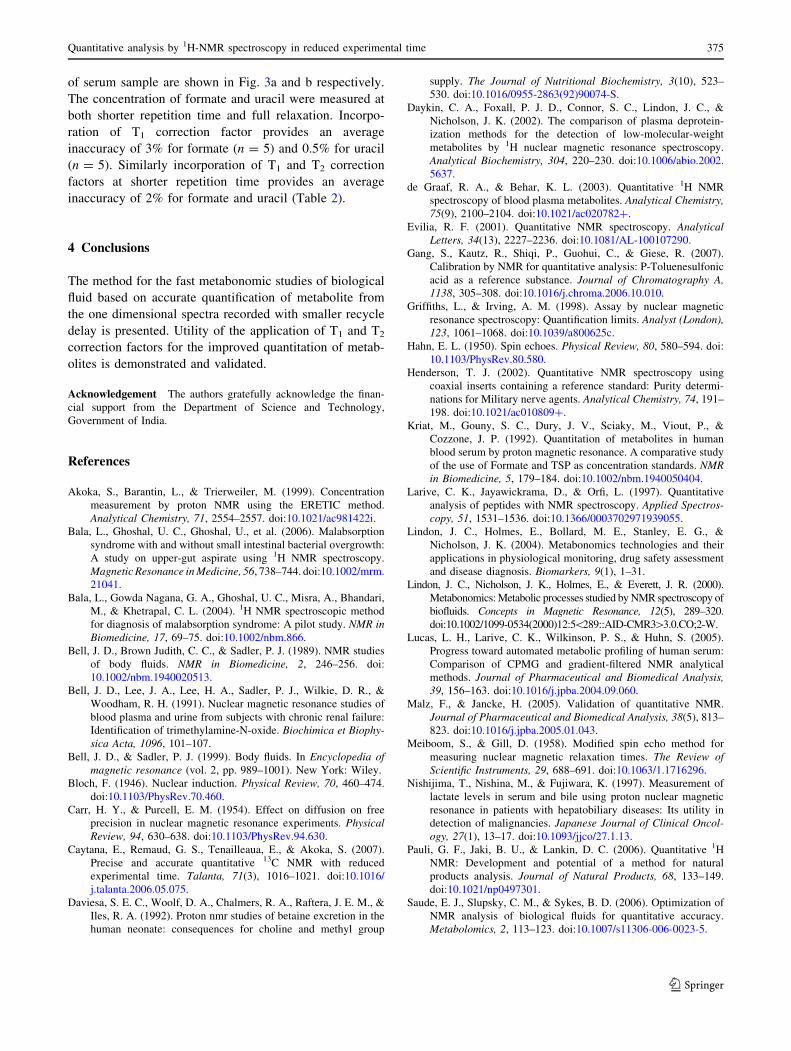
of serum sample are shown in Fig. 3a and b respectively.
The concentration of formate and uracil were measured at
both shorter repetition time and full relaxation. Incorpo-
ration of T1 correction factor provides an average
inaccuracy of 3% for formate (n = 5) and 0.5% for uracil
(n = 5). Similarly incorporation of T1 and T2 correction
factors at shorter repetition time provides an average
inaccuracy of 2% for formate and uracil (Table 2).
4 Conclusions
The method for the fast metabonomic studies of biological
fluid based on accurate quantification of metabolite from
the one dimensional spectra recorded with smaller recycle
delay is presented. Utility of the application of T1 and T2
correction factors for the improved quantitation of metab-
olites is demonstrated and validated.
Acknowledgement The authors gratefully acknowledge the finan-
cial support from the Department of Science and Technology,
Government of India.
References
Akoka, S., Barantin, L., & Trierweiler, M. (1999). Concentration
measurement by proton NMR using the ERETIC method.
Analytical Chemistry, 71, 2554–2557. doi:10.1021/ac981422i.
Bala, L., Ghoshal, U. C., Ghoshal, U., et al. (2006). Malabsorption
syndrome with and without small intestinal bacterial overgrowth:
A study on upper-gut aspirate using 1H NMR spectroscopy.
Magnetic Resonance in Medicine, 56, 738–744. doi:10.1002/mrm.
21041.
Bala, L., Gowda Nagana, G. A., Ghoshal, U. C., Misra, A., Bhandari,
M., & Khetrapal, C. L. (2004). 1H NMR spectroscopic method
for diagnosis of malabsorption syndrome: A pilot study. NMR inBiomedicine, 17, 69–75. doi:10.1002/nbm.866.
Bell, J. D., Brown Judith, C. C., & Sadler, P. J. (1989). NMR studies
of body fluids. NMR in Biomedicine, 2, 246–256. doi:
10.1002/nbm.1940020513.
Bell, J. D., Lee, J. A., Lee, H. A., Sadler, P. J., Wilkie, D. R., &
Woodham, R. H. (1991). Nuclear magnetic resonance studies of
blood plasma and urine from subjects with chronic renal failure:
Identification of trimethylamine-N-oxide. Biochimica et Biophy-sica Acta, 1096, 101–107.
Bell, J. D., & Sadler, P. J. (1999). Body fluids. In Encyclopedia ofmagnetic resonance (vol. 2, pp. 989–1001). New York: Wiley.
Bloch, F. (1946). Nuclear induction. Physical Review, 70, 460–474.
doi:10.1103/PhysRev.70.460.
Carr, H. Y., & Purcell, E. M. (1954). Effect on diffusion on free
precision in nuclear magnetic resonance experiments. PhysicalReview, 94, 630–638. doi:10.1103/PhysRev.94.630.
Caytana, E., Remaud, G. S., Tenailleaua, E., & Akoka, S. (2007).
Precise and accurate quantitative 13C NMR with reduced
experimental time. Talanta, 71(3), 1016–1021. doi:10.1016/
j.talanta.2006.05.075.
Daviesa, S. E. C., Woolf, D. A., Chalmers, R. A., Raftera, J. E. M., &
Iles, R. A. (1992). Proton nmr studies of betaine excretion in the
human neonate: consequences for choline and methyl group
supply. The Journal of Nutritional Biochemistry, 3(10), 523–
530. doi:10.1016/0955-2863(92)90074-S.
Daykin, C. A., Foxall, P. J. D., Connor, S. C., Lindon, J. C., &
Nicholson, J. K. (2002). The comparison of plasma deprotein-
ization methods for the detection of low-molecular-weight
metabolites by 1H nuclear magnetic resonance spectroscopy.
Analytical Biochemistry, 304, 220–230. doi:10.1006/abio.2002.
5637.
de Graaf, R. A., & Behar, K. L. (2003). Quantitative 1H NMR
spectroscopy of blood plasma metabolites. Analytical Chemistry,75(9), 2100–2104. doi:10.1021/ac020782?.
Evilia, R. F. (2001). Quantitative NMR spectroscopy. AnalyticalLetters, 34(13), 2227–2236. doi:10.1081/AL-100107290.
Gang, S., Kautz, R., Shiqi, P., Guohui, C., & Giese, R. (2007).
Calibration by NMR for quantitative analysis: P-Toluenesulfonic
acid as a reference substance. Journal of Chromatography A,1138, 305–308. doi:10.1016/j.chroma.2006.10.010.
Griffiths, L., & Irving, A. M. (1998). Assay by nuclear magnetic
resonance spectroscopy: Quantification limits. Analyst (London),123, 1061–1068. doi:10.1039/a800625c.
Hahn, E. L. (1950). Spin echoes. Physical Review, 80, 580–594. doi:
10.1103/PhysRev.80.580.
Henderson, T. J. (2002). Quantitative NMR spectroscopy using
coaxial inserts containing a reference standard: Purity determi-
nations for Military nerve agents. Analytical Chemistry, 74, 191–
198. doi:10.1021/ac010809?.
Kriat, M., Gouny, S. C., Dury, J. V., Sciaky, M., Viout, P., &
Cozzone, J. P. (1992). Quantitation of metabolites in human
blood serum by proton magnetic resonance. A comparative study
of the use of Formate and TSP as concentration standards. NMRin Biomedicine, 5, 179–184. doi:10.1002/nbm.1940050404.
Larive, C. K., Jayawickrama, D., & Orfi, L. (1997). Quantitative
analysis of peptides with NMR spectroscopy. Applied Spectros-copy, 51, 1531–1536. doi:10.1366/0003702971939055.
Lindon, J. C., Holmes, E., Bollard, M. E., Stanley, E. G., &
Nicholson, J. K. (2004). Metabonomics technologies and their
applications in physiological monitoring, drug safety assessment
and disease diagnosis. Biomarkers, 9(1), 1–31.
Lindon, J. C., Nicholson, J. K., Holmes, E., & Everett, J. R. (2000).
Metabonomics: Metabolic processes studied by NMR spectroscopy of
biofluids. Concepts in Magnetic Resonance, 12(5), 289–320.
doi:10.1002/1099-0534(2000)12:5\289::AID-CMR3[3.0.CO;2-W.
Lucas, L. H., Larive, C. K., Wilkinson, P. S., & Huhn, S. (2005).
Progress toward automated metabolic profiling of human serum:
Comparison of CPMG and gradient-filtered NMR analytical
methods. Journal of Pharmaceutical and Biomedical Analysis,39, 156–163. doi:10.1016/j.jpba.2004.09.060.
Malz, F., & Jancke, H. (2005). Validation of quantitative NMR.
Journal of Pharmaceutical and Biomedical Analysis, 38(5), 813–
823. doi:10.1016/j.jpba.2005.01.043.
Meiboom, S., & Gill, D. (1958). Modified spin echo method for
measuring nuclear magnetic relaxation times. The Review ofScientific Instruments, 29, 688–691. doi:10.1063/1.1716296.
Nishijima, T., Nishina, M., & Fujiwara, K. (1997). Measurement of
lactate levels in serum and bile using proton nuclear magnetic
resonance in patients with hepatobiliary diseases: Its utility in
detection of malignancies. Japanese Journal of Clinical Oncol-ogy, 27(1), 13–17. doi:10.1093/jjco/27.1.13.
Pauli, G. F., Jaki, B. U., & Lankin, D. C. (2006). Quantitative 1H
NMR: Development and potential of a method for natural
products analysis. Journal of Natural Products, 68, 133–149.
doi:10.1021/np0497301.
Saude, E. J., Slupsky, C. M., & Sykes, B. D. (2006). Optimization of
NMR analysis of biological fluids for quantitative accuracy.
Metabolomics, 2, 113–123. doi:10.1007/s11306-006-0023-5.
Quantitative analysis by 1H-NMR spectroscopy in reduced experimental time 375
123
Saxena, V., Gupta, A., Gupta Nagana, G. A., Saxena, R., Yachha, S.
K., & Khetrapal, C. L. (2006). 1H NMR spectroscopy for the
prediction of therapeutic outcome in patients with fulminant
hepatic failure. NMR in Biomedicine, 19(5), 521–526. doi:
10.1002/nbm.1034.
Shiyan, F., Choy, W. Y., Lam, S. L., & Au-Yeung, S. C. F. (1992).
Quantitative determination of glucose in blood plasma and in fruit
juices by combined WATR-CPMG 1H NMR spectroscopy.
Analytical Chemistry, 64, 2570–2574. doi:10.1021/ac00045a018.
Silvestre, V., Goupry, S., Trierweiler, M., Robins, R., & Akoka, S.
(2001). Determination of substrate and product concentration in
lactic acid bacterial fermentations by proton NMR using the
ERETIC method. Analytical Chemistry, 73, 1862–1868. doi:
10.1021/ac0013204.
Singh, H. K., Yachha, S. K., Saxena, R., et al. (2006). New dimension
of 1H-NMR spectroscopy in assessment of liver graft dysfunc-
tion. NMR in Biomedicine, 16(4), 185–188. doi:10.1002/nbm.
829.
Subramanian, A., Gupta, A., Saxena, S., et al. (2005). Proton MR CSF
analysis and a new software as predictors for the differentiation
of meningitis in children. NMR in Biomedicine, 18, 213–225.
doi:10.1002/nbm.944.
Van, Q. N., Chmurny, G. N., & Veenstra, T. D. (2003). The depletion
of protein signals in metabonomics analysis with the WET-
CPMG pulse sequence. Biochemical and Biophysical ResearchCommunications, 301, 952–959. doi:10.1016/S0006-291X(03)
00079-2.
Viant, M., Rosenblum, E., & Tjeerdema, R. (2003). NMR-based
metabolomics: A powerful approach for characterizing the
effects of environmental stressors on organism health. Environ-mental Science & Technology, 37, 4982–4989. doi:10.1021/
es034281x.
Voet, D., & Voet, J. G. (1990). Biochemistry. Canada: Wiley.
Wevers, R. A., Engelke, U., & Heerschap, A. (1994). High-resolution1HNMR spectroscopy of blood plasma for metabolic studies.
Clinical Chemistry, 40(7), 1245–1250.
Yamaguchi, S., Koda, N., & Yamamoto, H. (1989). Analysis for
homogentisic acid by NMR spectrometry, to aid diagnosis of
Alkaptonurla. Clinical Chemistry, 35(8), 1806–1807.
376 S. K. Bharti et al.
123
Copyright © 2022 FDOKUMEN