Importance of Full Product Lifetime Analyses in Parts and Materials Selection Process Warranty...
15
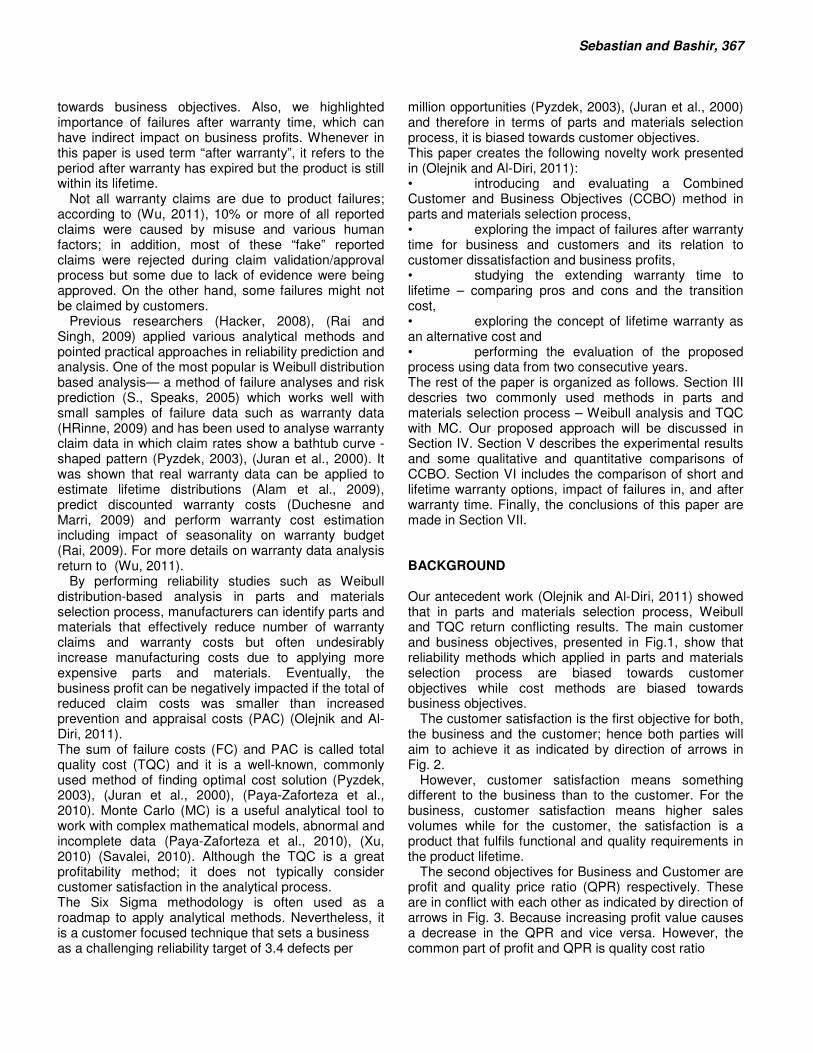
Global Advanced Research Journal of Management and Business Studies (ISSN: 2315-5086) Vol. 3(8) pp. 366-380, August, 2014 Available online http://garj.org/garjmbs/index.htm Copyright © 2014 Global Advanced Research Journals Full Length Research Paper Importance of Full Product Lifetime Analyses in Parts and Materials Selection Process Warranty Coverage and Its Relation to Customer Satisfaction and Business Profits Sebastian B. Olejnik 1 and Bashir Al-Diri, PhD 2 1 Cummins Generator Technologies Peterborough, UK [email protected] 2 Lincoln School of Computer Science University of Lincoln Lincoln, UK [email protected] Accepted 01 August 2014 A new combining customer and business objectives method of parts and materials selection process based on quality cost ratio is proposed and discussed. It is shown that pure reliability and cost approaches are biased and do not cover the main customer and business objectives. The impact of failures after warranty expires is analyzed, discussed and explored in relation to customer satisfaction and business profits. A paradox where increased warranty costs contribute to both higher business profits and customer satisfaction is discussed showing how the costs of lifetime warranty become an alternative to goodwill and sales losses. Conclusions are made based on analysis of real warranty data of three electronic temperature sensors. Keywords: Quality; Reliability; Warranty; Cost; Lifetime; Weilbull; Monte Carlo; TQC; Parts; Materials; Selection; impact of failures; INTRODUCTION Every year manufacturers spend a significant part of their profits to cover costs of warranty claims (Warranty Week, 2012). Typically, manufacturers address this issue in two different approaches, either: focusing their activities on reducing total warranty costs by decreasing the number of warranty claims (quality improvements) (Pyzdek, 2003), (Juran et al., 2000), or focusing on minimizing total quality costs (TQC) by applying optimal cost solutions (cost) (Duchesne and Marri, 2009). With the first approach, manufacturers perform reliability analyses such as Weibull (HRinne, 2009) and apply more reliable parts and materials. With the second approach, manufacturers target the most cost effective parts and materials for which the TQC is minimal (Duchesne and Marri, 2009). In our previous publication (Olejnik and Al-Diri, 2011), we showed that these two approaches can give conflicting solutions in parts and materials selection process, revealing that at least one of these approaches (if not both) is inappropriate. In addition, we identified the main customer and business objectives and concluded that in parts and materials selection process, pure reliability approaches are biased towards customer objectives while pure cost approaches are biased
Transcript of Importance of Full Product Lifetime Analyses in Parts and Materials Selection Process Warranty...
Global Advanced Research Journal of Management and Business Studies (ISSN: 2315-5086) Vol. 3(8) pp. 366-380, August, 2014
Available online http://garj.org/garjmbs/index.htm
Copyright © 2014 Global Advanced Research Journals
Full Length Research Paper
Importance of Full Product Lifetime Analyses in Parts and Materials Selection Process
Warranty Coverage and Its Relation to Customer Satisfaction and Business Profits
Sebastian B. Olejnik1 and Bashir Al-Diri, PhD2
1Cummins Generator Technologies Peterborough, UK [email protected]
2Lincoln School of Computer Science
University of Lincoln Lincoln, UK [email protected]
Accepted 01 August 2014
A new combining customer and business objectives method of parts and materials selection process based on quality cost ratio is proposed and discussed. It is shown that pure reliability and cost approaches are biased and do not cover the main customer and business objectives. The impact of failures after warranty expires is analyzed, discussed and explored in relation to customer satisfaction and business profits. A paradox where increased warranty costs contribute to both higher business profits and customer satisfaction is discussed showing how the costs of lifetime warranty become an alternative to goodwill and sales losses. Conclusions are made based on analysis of real warranty data of three electronic temperature sensors. Keywords: Quality; Reliability; Warranty; Cost; Lifetime; Weilbull; Monte Carlo; TQC; Parts; Materials; Selection; impact of failures;
INTRODUCTION Every year manufacturers spend a significant part of their profits to cover costs of warranty claims (Warranty Week, 2012). Typically, manufacturers address this issue in two different approaches, either: focusing their activities on reducing total warranty costs by decreasing the number of warranty claims (quality improvements) (Pyzdek, 2003), (Juran et al., 2000), or focusing on minimizing total quality costs (TQC) by applying optimal cost solutions (cost) (Duchesne and Marri, 2009). With the first approach, manufacturers perform reliability analyses such as Weibull (HRinne, 2009) and apply more reliable parts and materials. With
the second approach, manufacturers target the most cost effective parts and materials for which the TQC is minimal (Duchesne and Marri, 2009).
In our previous publication (Olejnik and Al-Diri, 2011), we showed that these two approaches can give conflicting solutions in parts and materials selection process, revealing that at least one of these approaches (if not both) is inappropriate. In addition, we identified the main customer and business objectives and concluded that in parts and materials selection process, pure reliability approaches are biased towards customer objectives while pure cost approaches are biased
towards business objectives. Also, we highlighted importance of failures after warranty time, which can have indirect impact on business profits. Whenever in this paper is used term “after warranty”, it refers to the period after warranty has expired but the product is still within its lifetime.
Not all warranty claims are due to product failures; according to (Wu, 2011), 10% or more of all reported claims were caused by misuse and various human factors; in addition, most of these “fake” reported claims were rejected during claim validation/approval process but some due to lack of evidence were being approved. On the other hand, some failures might not be claimed by customers.
Previous researchers (Hacker, 2008), (Rai and Singh, 2009) applied various analytical methods and pointed practical approaches in reliability prediction and analysis. One of the most popular is Weibull distribution based analysis— a method of failure analyses and risk prediction (S., Speaks, 2005) which works well with small samples of failure data such as warranty data (HRinne, 2009) and has been used to analyse warranty claim data in which claim rates show a bathtub curve -shaped pattern (Pyzdek, 2003), (Juran et al., 2000). It was shown that real warranty data can be applied to estimate lifetime distributions (Alam et al., 2009), predict discounted warranty costs (Duchesne and Marri, 2009) and perform warranty cost estimation including impact of seasonality on warranty budget (Rai, 2009). For more details on warranty data analysis return to (Wu, 2011).
By performing reliability studies such as Weibull distribution-based analysis in parts and materials selection process, manufacturers can identify parts and materials that effectively reduce number of warranty claims and warranty costs but often undesirably increase manufacturing costs due to applying more expensive parts and materials. Eventually, the business profit can be negatively impacted if the total of reduced claim costs was smaller than increased prevention and appraisal costs (PAC) (Olejnik and Al-Diri, 2011). The sum of failure costs (FC) and PAC is called total quality cost (TQC) and it is a well-known, commonly used method of finding optimal cost solution (Pyzdek, 2003), (Juran et al., 2000), (Paya-Zaforteza et al., 2010). Monte Carlo (MC) is a useful analytical tool to work with complex mathematical models, abnormal and incomplete data (Paya-Zaforteza et al., 2010), (Xu, 2010) (Savalei, 2010). Although the TQC is a great profitability method; it does not typically consider customer satisfaction in the analytical process. The Six Sigma methodology is often used as a roadmap to apply analytical methods. Nevertheless, it is a customer focused technique that sets a business as a challenging reliability target of 3.4 defects per
Sebastian and Bashir, 367 million opportunities (Pyzdek, 2003), (Juran et al., 2000) and therefore in terms of parts and materials selection process, it is biased towards customer objectives. This paper creates the following novelty work presented in (Olejnik and Al-Diri, 2011): • introducing and evaluating a Combined Customer and Business Objectives (CCBO) method in parts and materials selection process, • exploring the impact of failures after warranty time for business and customers and its relation to customer dissatisfaction and business profits, • studying the extending warranty time to lifetime – comparing pros and cons and the transition cost, • exploring the concept of lifetime warranty as an alternative cost and • performing the evaluation of the proposed process using data from two consecutive years. The rest of the paper is organized as follows. Section III descries two commonly used methods in parts and materials selection process – Weibull analysis and TQC with MC. Our proposed approach will be discussed in Section IV. Section V describes the experimental results and some qualitative and quantitative comparisons of CCBO. Section VI includes the comparison of short and lifetime warranty options, impact of failures in, and after warranty time. Finally, the conclusions of this paper are made in Section VII. BACKGROUND Our antecedent work (Olejnik and Al-Diri, 2011) showed that in parts and materials selection process, Weibull and TQC return conflicting results. The main customer and business objectives, presented in Fig.1, show that reliability methods which applied in parts and materials selection process are biased towards customer objectives while cost methods are biased towards business objectives.
The customer satisfaction is the first objective for both, the business and the customer; hence both parties will aim to achieve it as indicated by direction of arrows in Fig. 2.
However, customer satisfaction means something different to the business than to the customer. For the business, customer satisfaction means higher sales volumes while for the customer, the satisfaction is a product that fulfils functional and quality requirements in the product lifetime.
The second objectives for Business and Customer are profit and quality price ratio (QPR) respectively. These are in conflict with each other as indicated by direction of arrows in Fig. 3. Because increasing profit value causes a decrease in the QPR and vice versa. However, the common part of profit and QPR is quality cost ratio

368 Glo. Adv. Res. J. Manag. Bus. Stud.
Figure 1. Main customer and business objectives
Figure 2.Interaction of agreed customer and business objectives
Figure 3.Interaction of conflicted customer and business objectives (QCR).
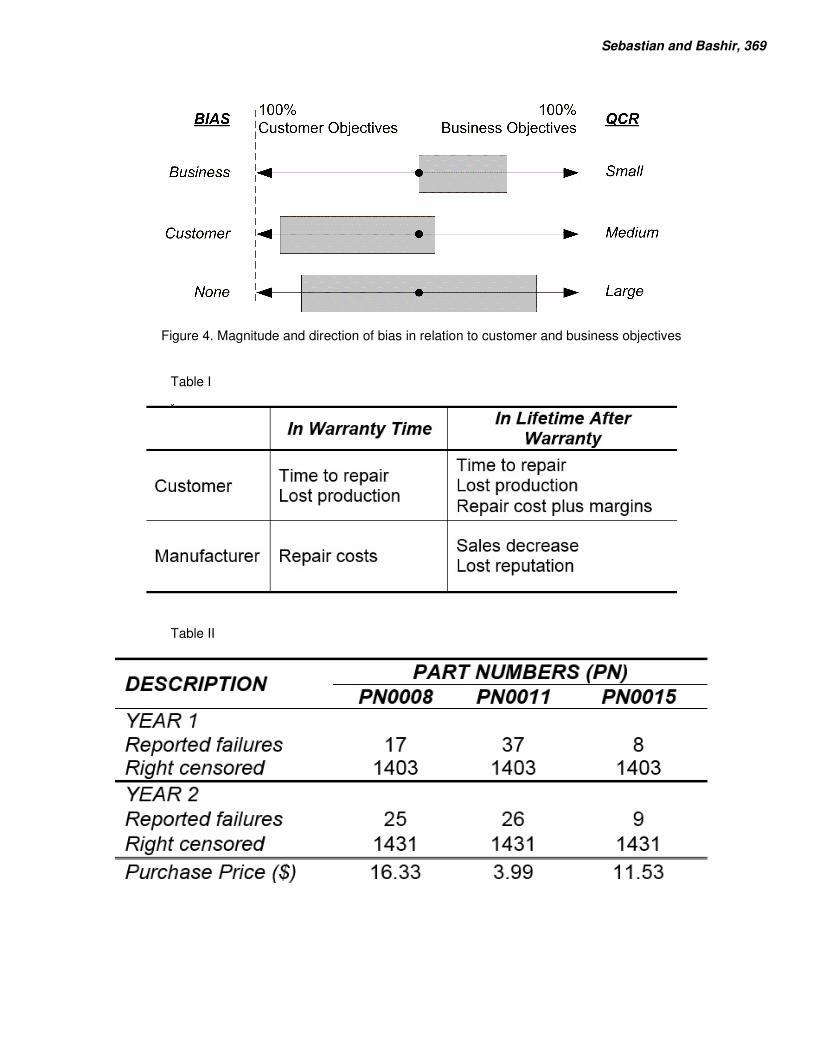
An imbalance of the second objective elements will cause a bias either towards customer or business objectives (Olejnik and Al-Diri, 2011). The bias magnitude and direction are presented in Fig. 4 where the width of the rectangles represents the value of the QCR and the location between customer and business objectives determine level of that bias.
customer and business objectives. From a customer perspective, a failure is a
degradation of service or capability of the product (Wood, 2001). Depending on inherent product reliability, failures are more or less likely to occur during a product lifetime. If a failure occurs in warranty time then the manufacturer is obliged to either repair or replace the faulty product. Alternatively, if the failure occurs after warranty time then manufacturer has no
obligation to cover the cost of a failed product and therefore the customer has to pay for the product repair or replacement. Table I presents how failures in, and after warranty time, impact customer and manufacturer.
Customers do not buy product or service as much as they buy expectation (Levitt, 1986). By purchasing a product, customers believe that the product price is the final cost of the product excluding any maintenance and running costs in anticipated or given product lifetime. Any additional costs such as repair costs, due to a product failure will cause customer dissatisfaction. The level of dissatisfaction depends on how additional costs added to product price affect the QPR. The bigger the change (i.e. lower QPR) the more escalates customer dissatisfaction. For example, assume that a customer bought two new cars for their household, one cost $60,000 and the other $ 10,000; both cars failed twice
Sebastian and Bashir, 369
Figure 4. Magnitude and direction of bias in relation to customer and business objectives
Table I
Table II

370 Glo. Adv. Res. J. Manag. Bus. Stud.
Table III
after warranty time and sum of repairs for each car was $6,000. Adding repair costs to the purchase price, each car cost respectively $66,000 (+10%) and $16,000 (+60%). If the price of the more expensive car was 10% higher (i.e. $66,000) the customer could still consider purchasing this car, but it is very unlikely that the customer would consider purchasing the cheaper car if the sale price was 60% higher ($16,000), simply because for $16,000 the customer could get a higher quality product – worth the extra 60% with higher QPR. This example reflects impact of failures after warranty time on QPR value, which leads to customer dissatisfaction.
Referring to Table I, it might be concluded that any unexpected costs, such as cost of failure after warranty time, will have a bigger impact to the customer than any expected cost in warranty time (e.g. maintenance). Failures in warranty time decrease QPR by decreasing only the numerator (Quality) of the QPR while failures after warranty time impact QPR by decreasing its numerator (Quality) and increasing denominator (Price) at the same time. Therefore failures after warranty time impact customer satisfaction much stronger than failures in warranty time.
Customer dissatisfaction has a negative influence on future sales volumes and impacts the manufacturer and/or brand reputation. Decreased sales have a negative effect on business profits and cash flow, and in longer-term, can lead to business bankruptcy. Therefore it is important to include indirect failure costs in the analytical process. METHODOLOGY MATERIALS Two years of real warranty data from three electronic temperature sensors fitted on track type machines were studied and analysed where the sell date was the base point. The real part numbers and technical specification of these parts remained intellectual property of the manufacturer who agreed to share their data for the purpose of this research. The number of
failures, censored data and price of sensors on purchase are provided in Table II.
The following assumptions were made in the analytical process: • Production volume = 2,000 machines, • Warranty time = 1,000 work hours, • Lifetime = 7,000 work hours, • Average labour cost = $250 / failure, • Maximum accepted error = 2%, • Significance level = 5%. METHODS Using Weibull and TQC analysis in parts and materials process (Olejnik and Al-Diri, 2011) we illustrated that the first method is biased towards customer, and the second towards business objectives; for that reason, reliability analysis was named customer approach and cost analysis was named business approach.
The reliability analysis is focused on selecting the most reliable parts and materials to minimize the number of failures. The bias towards customer objectives can lead to decreased business profits and/or increased product prices. A popular method applied with this approach is Weibull analysis. The Weibull method provides accurate failure analysis and risk predictions even when working with small sample size data (S., Speaks, 2005). The Probability Density Function (PDF) of 2-parameter Weibull is expressed by
(1) where α is the scale parameter (characteristic life), β is the shape parameter (slope) and t is the failure time (HRinne, 2009).
Some field data may require applying a 3-parameter Weibull distribution. It is also always necessary to perform a hypothesis test to understand if the studied

Sebastian and Bashir, 371
Figure 5.Weibull probability plot – 1st year
Figure 6.Weibull probability plot – 2nd
year
failures follow a selected distribution. By default, a
5% significance level is applied but in cases where higher confidence is required, the significance level might be 1% or even lower (HRinne, 2009).
Reliability of the three temperature sensors in this study was estimated using 2-parameter Weibull distribution. An Anderson-Darling hypothesis test at the 5% significance level provided sufficient evidence to
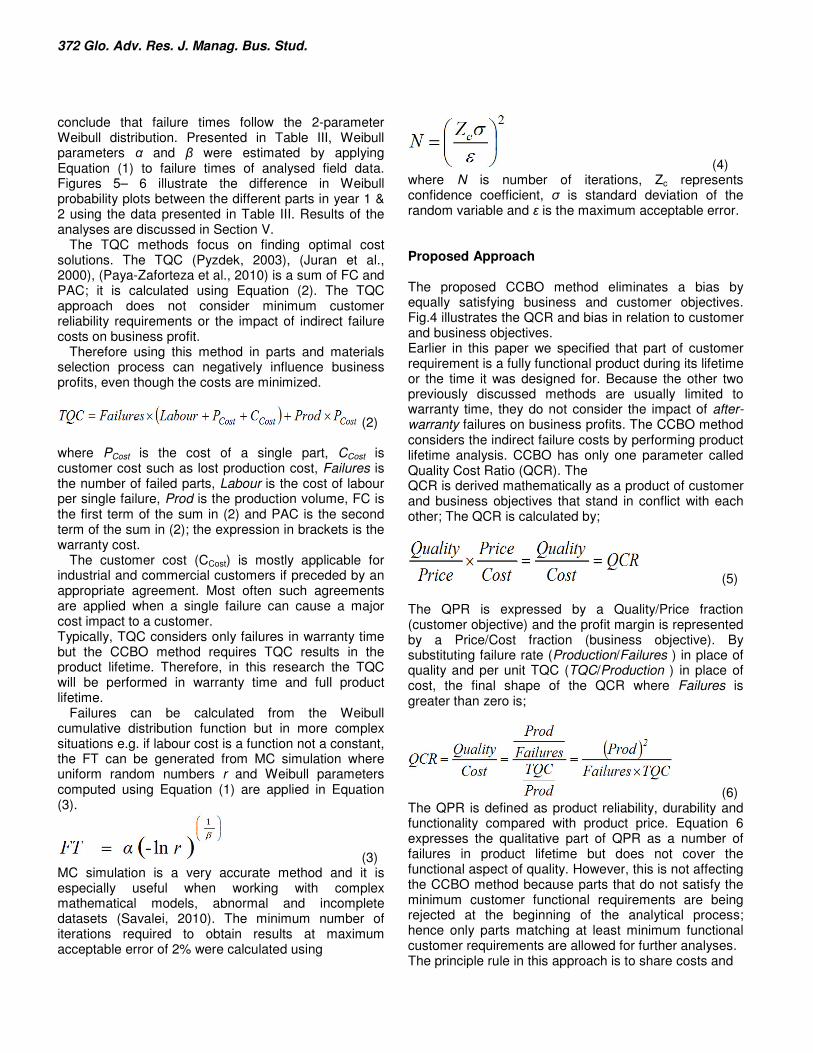
372 Glo. Adv. Res. J. Manag. Bus. Stud. conclude that failure times follow the 2-parameter Weibull distribution. Presented in Table III, Weibull parameters α and β were estimated by applying Equation (1) to failure times of analysed field data. Figures 5– 6 illustrate the difference in Weibull probability plots between the different parts in year 1 & 2 using the data presented in Table III. Results of the analyses are discussed in Section V.
The TQC methods focus on finding optimal cost solutions. The TQC (Pyzdek, 2003), (Juran et al., 2000), (Paya-Zaforteza et al., 2010) is a sum of FC and PAC; it is calculated using Equation (2). The TQC approach does not consider minimum customer reliability requirements or the impact of indirect failure costs on business profit.
Therefore using this method in parts and materials selection process can negatively influence business profits, even though the costs are minimized.
(2) where PCost is the cost of a single part, CCost is customer cost such as lost production cost, Failures is the number of failed parts, Labour is the cost of labour per single failure, Prod is the production volume, FC is the first term of the sum in (2) and PAC is the second term of the sum in (2); the expression in brackets is the warranty cost.
The customer cost (CCost) is mostly applicable for industrial and commercial customers if preceded by an appropriate agreement. Most often such agreements are applied when a single failure can cause a major cost impact to a customer. Typically, TQC considers only failures in warranty time but the CCBO method requires TQC results in the product lifetime. Therefore, in this research the TQC will be performed in warranty time and full product lifetime.
Failures can be calculated from the Weibull cumulative distribution function but in more complex situations e.g. if labour cost is a function not a constant, the FT can be generated from MC simulation where uniform random numbers r and Weibull parameters computed using Equation (1) are applied in Equation (3).
(3) MC simulation is a very accurate method and it is especially useful when working with complex mathematical models, abnormal and incomplete datasets (Savalei, 2010). The minimum number of iterations required to obtain results at maximum acceptable error of 2% were calculated using
(4) where N is number of iterations, Zc represents confidence coefficient, σ is standard deviation of the random variable and ε is the maximum acceptable error. Proposed Approach The proposed CCBO method eliminates a bias by equally satisfying business and customer objectives. Fig.4 illustrates the QCR and bias in relation to customer and business objectives. Earlier in this paper we specified that part of customer requirement is a fully functional product during its lifetime or the time it was designed for. Because the other two previously discussed methods are usually limited to warranty time, they do not consider the impact of after-warranty failures on business profits. The CCBO method considers the indirect failure costs by performing product lifetime analysis. CCBO has only one parameter called Quality Cost Ratio (QCR). The QCR is derived mathematically as a product of customer and business objectives that stand in conflict with each other; The QCR is calculated by;
(5) The QPR is expressed by a Quality/Price fraction (customer objective) and the profit margin is represented by a Price/Cost fraction (business objective). By substituting failure rate (Production/Failures ) in place of quality and per unit TQC (TQC/Production ) in place of cost, the final shape of the QCR where Failures is greater than zero is;
(6) The QPR is defined as product reliability, durability and functionality compared with product price. Equation 6 expresses the qualitative part of QPR as a number of failures in product lifetime but does not cover the functional aspect of quality. However, this is not affecting the CCBO method because parts that do not satisfy the minimum customer functional requirements are being rejected at the beginning of the analytical process; hence only parts matching at least minimum functional customer requirements are allowed for further analyses. The principle rule in this approach is to share costs and
Sebastian and Bashir, 373
Table IV
Table V
Table VI

374 Glo. Adv. Res. J. Manag. Bus. Stud.
Table VII
benefits equally between the customer and the business. For example, if we replace a part in our product with another one, identical in terms of quality and functionality but $10 cheaper; $5 per product shall contribute to business profits and the other $5 shall contribute to QPR, either in the form of reduced price (QPR denominator) or increased product value-added such as quality, functionality (QPR numerator). Even if some manufacturers would equally distribute the profits, others would keep the all to increase business profits. Such “greedy” decisions can lead to decreasing QPR and affect customer satisfaction, hence finally impact sales and business profits. By maintaining relatively high QPR and QCR manufacturers can obtain sustain development build on customer satisfaction and good reputation, at the same time increasing sales and achieving higher profits. The CCBO method is not just selecting parts and materials with the highest QCR, it is keeping QPR and business profits at an optimal level
The CCBO approach is inappropriate for products where bias is a part of customer requirements. For critical products used in safety, nuclear or aviation applications where product price becomes less important than qualitative factors, the customer approach is a more appropriate method. On the other hand, for some disposable products where cost is the main driver for the customer, the business approach is more relevant than CCBO or a qualitative approach. The CCBO method is divided into 6 steps: 1. Functional requirements: Exclude parts from further analysis if they do not fulfil customer functional requirements; e.g. non bulletproof windscreens for a bulletproof vehicle. 2. Reliability requirements: Perform reliability analysis followed by hypothesis tests confirming the data follows a selected distribution (e.g. Weibull). If data does not pass the hypothesis tests investigate for mixed failure modes within one dataset. Parts which reliability does not satisfy customer reliability requirements (if applicable) need to be rejected from further analysis. 3. Estimate lifetime failures: Number of failures
should be calculated using e.g. Weibull cumulative distribution function for a period equal to the estimated or quoted product lifetime. For complex mathematical models and functions, MC simulation should be performed to estimate lifetime failures. Weibull parameters obtained in the previous step can be applied with MC and uniformly generated random numbers (3). The number of required scenarios can be calculated using (4) at a specified significance level and maximum possible error. 4. Compute TQC: Calculate TQC by Equation (2) using the estimated number of failures in product lifetime that were computed in the previous step. 5. Calculate QCR: Calculate QCR by (6) using calculated values in previous steps with required production volume, part cost and labour cost. 6. Comparison: Select the part with the greatest QCR value which is the optimal business and customer solution according to CCBO method. RESULTS Weibull, TQC and CCBO analysis were performed and compared based on field data of three electronic temperature sensors mounted on track type machines. The data contains failures from machines sold in two consecutive years. The failure times and right censored data were used to estimate Weibull parameters presented in Table III and Fig. 5–6. For parts PN011 and PN015, β values are less than 1 which classifies these parts in infant mortality stage of the bathtub curve. For the PN008 β in the first year is greater than one indicating early wear-out stage while in the second year smaller than one indicating infant mortality stage. This change reflects adopted assembly changes introduced at the end of the 1
st year and can be observed in Fig. 5–
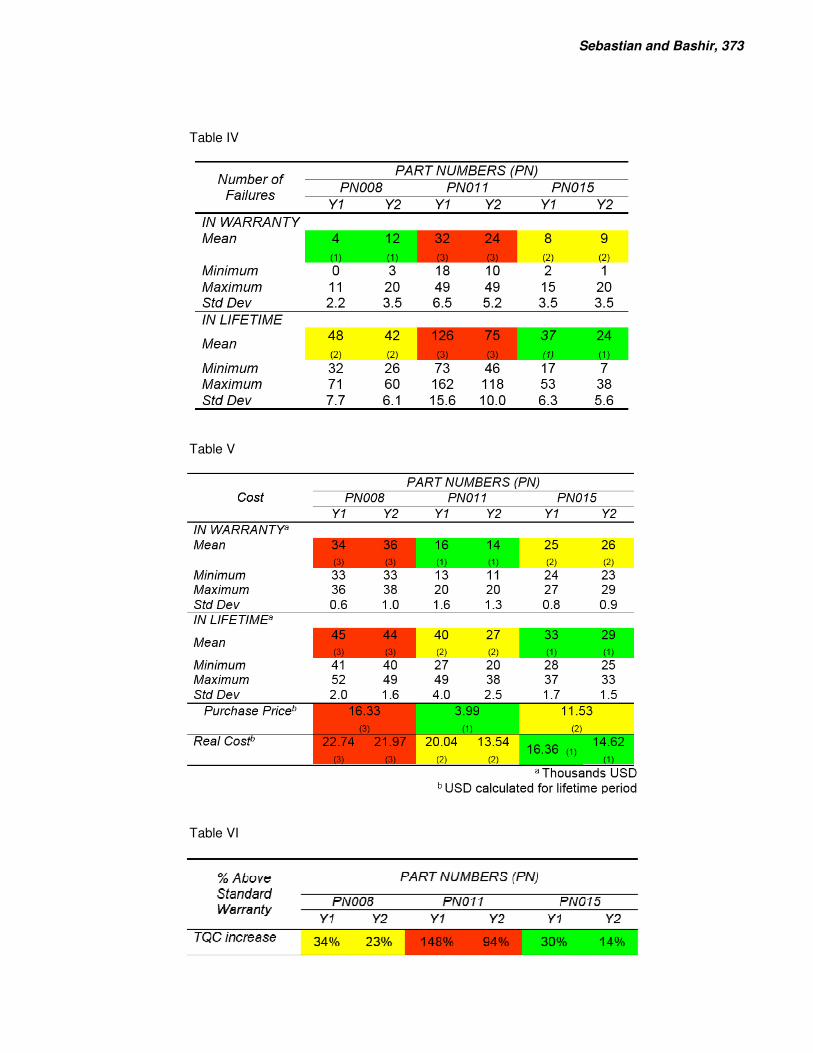
6. All other results, i.e. MC, TQC and QCR were obtained from the bespoke developed analytical software for this project. Table IV presents basic failure statistics for each year and part number. Obtained MC results were used to compute TQC (Table V) in warranty time and in full product lifetime.
Sebastian and Bashir, 375
Table VIII
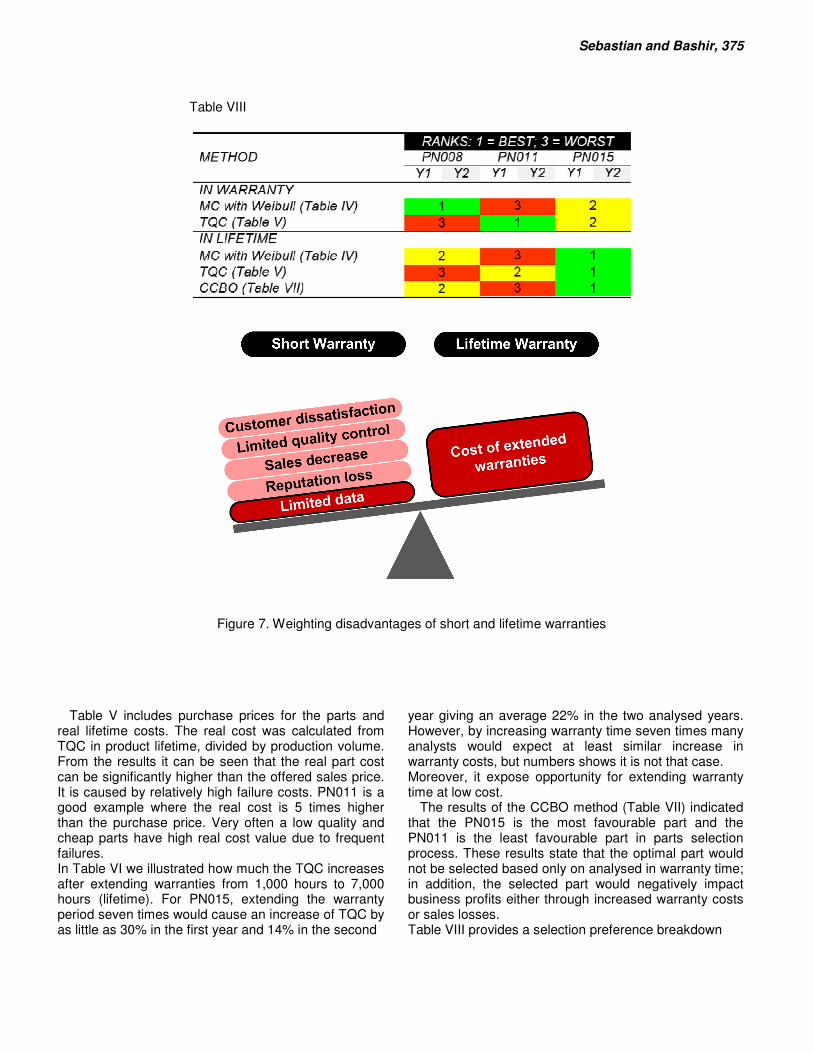
Figure 7. Weighting disadvantages of short and lifetime warranties
Table V includes purchase prices for the parts and
real lifetime costs. The real cost was calculated from TQC in product lifetime, divided by production volume. From the results it can be seen that the real part cost can be significantly higher than the offered sales price. It is caused by relatively high failure costs. PN011 is a good example where the real cost is 5 times higher than the purchase price. Very often a low quality and cheap parts have high real cost value due to frequent failures. In Table VI we illustrated how much the TQC increases after extending warranties from 1,000 hours to 7,000 hours (lifetime). For PN015, extending the warranty period seven times would cause an increase of TQC by as little as 30% in the first year and 14% in the second
year giving an average 22% in the two analysed years. However, by increasing warranty time seven times many analysts would expect at least similar increase in warranty costs, but numbers shows it is not that case. Moreover, it expose opportunity for extending warranty time at low cost.
The results of the CCBO method (Table VII) indicated that the PN015 is the most favourable part and the PN011 is the least favourable part in parts selection process. These results state that the optimal part would not be selected based only on analysed in warranty time; in addition, the selected part would negatively impact business profits either through increased warranty costs or sales losses. Table VIII provides a selection preference breakdown

376 Glo. Adv. Res. J. Manag. Bus. Stud.
Figure 8. Weighting positives of short and lifetime warranties
for each discussed method. Results clearly show
conflict performing analysis in warranty time only. Parts PN008 and PN011 are alternately best and worst selection depends on used method. Results of lifetime analysis are much more consistent pointing PN015 as best part selection in all methods. We discuss this further in next section. DISCUSSION An interesting observation can be made comparing the Monte Carlo simulation results (Table IV) representing the customer approach with the TQC results (Table V) representing the business approach. In warranty time, the results indicate that it is the least favoured part (PN011) in the customer approach (Table IV) because of its number of failures; however, it is the most favoured one in the business approach (Table V) because of its price. The opposite bias and conflict for these two approaches are well illustrated in Table VIII. Therefore perhaps the decision based only on results of one type of analysis can be biased, unless the analyst intentionally applies a biased solution.
Another useful observation was that in lifetime analyses all three methods equally pointed to PN015 as the most favourable part. However, with different datasets the results could differ.
Weibull and TQC analysis in warranty time did not help to select the optimal part in parts and materials selection process.
Before purchasing a product, the customer assumes that the selected products match a set of qualitative requirements (reliability, durability and functionality) and has the best QPR compared with other products
matching these requirements. Product functionality can be recognized by product testing or reading the product specification. Reliability is based on product/brand reputation, customer experience /recommendation, duration of warranty and less often nowadays on price (Steenkamp, 1998). Products with a lifetime warranty increase customer confidence in the product quality and therefore can often work like a sales “turbocharger”. If not clearly specified by the manufacturer e.g. “Use Before Date”, customers will make their own judgments on product lifetime, which to them is the time duration that product shall remain fully functional. If the product fails in warranty time then the customer dissatisfaction does not escalate as much as when product fails after warranty time. This is related to “unexpected”, additional costs related to repairs of failed product or its replacement if necessary. Customers may add this cost to the product price and re-estimates the QPR. Failures in warranty time decrease QPR by decreasing the numerator of the QPR while failures after warranty time impact QPR more by decreasing the numerator and increasing the denominator of the QPR simultaneously. Low QPR (after sale) in a longer time leads to customer dissatisfaction, loss of product/brand reputation, sales decrease and a negative impact to business profits. In most cases the indirect failure costs cause a negative impact on business profit and take effect with some delays depended on the scale of the customer loss. The more significant the loss the shorter is the time to affect the business. Once the business reputation has been negatively impacted, it is difficult to recover and usually it is a long road to recovery.
Profit is the main business objective. Based on the model presented in this paper, increased profits can be achieved by manufacturers through higher sales
Sebastian and Bashir, 377
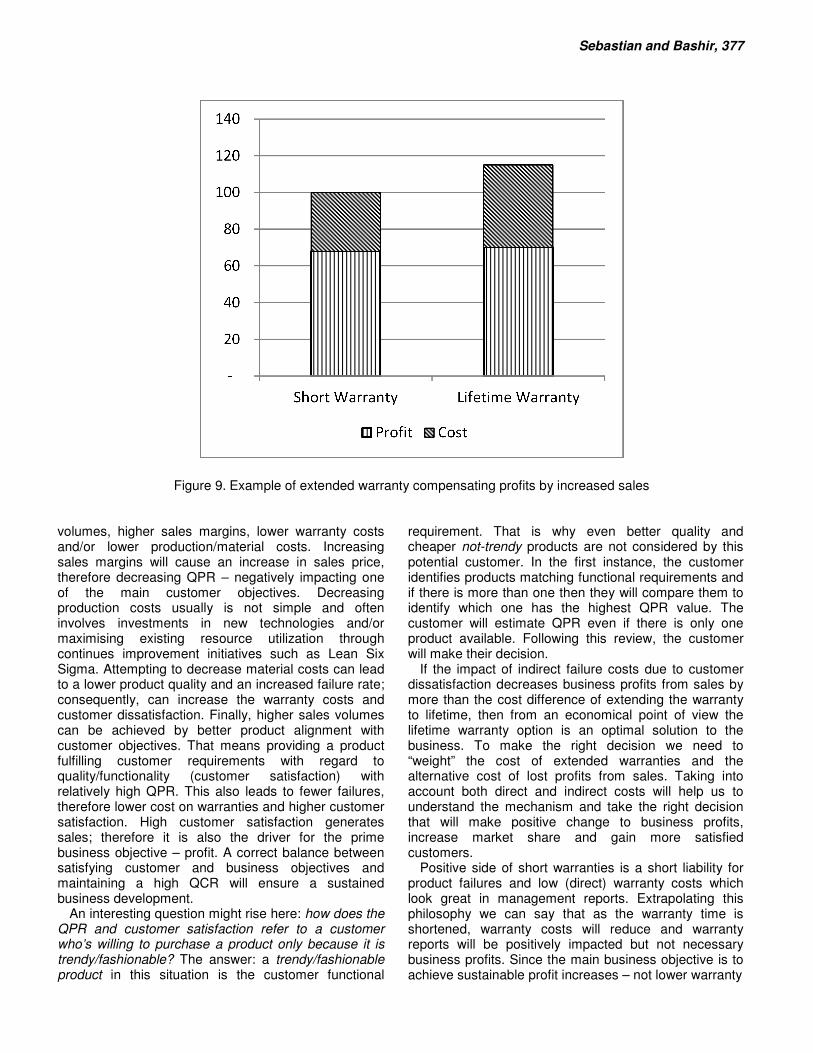
Figure 9. Example of extended warranty compensating profits by increased sales volumes, higher sales margins, lower warranty costs and/or lower production/material costs. Increasing sales margins will cause an increase in sales price, therefore decreasing QPR – negatively impacting one of the main customer objectives. Decreasing production costs usually is not simple and often involves investments in new technologies and/or maximising existing resource utilization through continues improvement initiatives such as Lean Six Sigma. Attempting to decrease material costs can lead to a lower product quality and an increased failure rate; consequently, can increase the warranty costs and customer dissatisfaction. Finally, higher sales volumes can be achieved by better product alignment with customer objectives. That means providing a product fulfilling customer requirements with regard to quality/functionality (customer satisfaction) with relatively high QPR. This also leads to fewer failures, therefore lower cost on warranties and higher customer satisfaction. High customer satisfaction generates sales; therefore it is also the driver for the prime business objective – profit. A correct balance between satisfying customer and business objectives and maintaining a high QCR will ensure a sustained business development.
An interesting question might rise here: how does the QPR and customer satisfaction refer to a customer who’s willing to purchase a product only because it is trendy/fashionable? The answer: a trendy/fashionable product in this situation is the customer functional
requirement. That is why even better quality and cheaper not-trendy products are not considered by this potential customer. In the first instance, the customer identifies products matching functional requirements and if there is more than one then they will compare them to identify which one has the highest QPR value. The customer will estimate QPR even if there is only one product available. Following this review, the customer will make their decision.
If the impact of indirect failure costs due to customer dissatisfaction decreases business profits from sales by more than the cost difference of extending the warranty to lifetime, then from an economical point of view the lifetime warranty option is an optimal solution to the business. To make the right decision we need to “weight” the cost of extended warranties and the alternative cost of lost profits from sales. Taking into account both direct and indirect costs will help us to understand the mechanism and take the right decision that will make positive change to business profits, increase market share and gain more satisfied customers.
Positive side of short warranties is a short liability for product failures and low (direct) warranty costs which look great in management reports. Extrapolating this philosophy we can say that as the warranty time is shortened, warranty costs will reduce and warranty reports will be positively impacted but not necessary business profits. Since the main business objective is to achieve sustainable profit increases – not lower warranty
378 Glo. Adv. Res. J. Manag. Bus. Stud. costs – there is no justification to decrease the warranty period, as this would negatively impact sales and subsequently, business profits. The disadvantages of short warranty are: • uncontrolled number of failures after warranty time, limited analytical data affecting long-term planning, • uncontrolled escalation of customer dissatisfaction, • goodwill/reputation losses (long term), • decreased of sales volumes (long term), and • limited to warranty period ability to monitor product quality. The advantages of extended to lifetime warranty are: • appropriated data to perform quality lifetime analysis supporting parts/materials selection process and more accurate long-term planning, • satisfied customers with higher confidence in the product quality, • had a good reputation and increasing goodwill positively impacting stock prices, • sustained sales increase due to maintaining existing customers as well as attracting new customers, and • had the ability to monitor product quality during the whole product lifetime without affecting sales. The disadvantage of extended to lifetime warranty period is higher warranty costs which in short-term has negative impact on business key performance indicators (KPI). In Fig. 7, the disadvantages of short and lifetime warranties were weighted. The lifetime warranty option has one negative impact – cost of extended warranties which seems to be “heavy” mainly because it has a direct cost, i.e. visible in management reports on the debit side. Nevertheless, the sum of the indirect failure costs of short warranties can be “heavier” although not explicitly visible to managers and shareholders. As shown in Table I failures after warranty time escalate customer dissatisfaction and negatively impacting sales and business profits. Figure 7 shows the negatives of short and lifetime warranties exposing direct cost and tangible effects. It can be observed that short warranties have more negative factors than lifetime warranties, although a short warranty system is still more often applied by manufacturers than lifetime warranty. This can be caused by one or more of the following reasons: • Products are too unreliable to expect lifetime warranty benefits to cover the cost of an extended warranty. • Management reports are limited to direct costs which make indirect costs and benefits of extended warranties invisible to the management and
shareholders. • Business analysts do not consider the indirect costs and benefits in analysis.
Fig. 8 are presented the advantages of short and lifetime warranties which together with disadvantages that are presented in Fig. 7 provide a good summary of pros and cons of short and lifetime warranties.
It seems that lifetime warranty has smaller number of negative and greater number of positive impacts compared to short warranty. However, in most cases manufacturers consider only the highlighted (darker coloured) in Fig. 7– 8 factors, which are either, direct (visible on reports) or expected (obvious) factors. All other factors (lighter colour) can be better seen by those who have the ability to look on the impact of failures mechanism from a higher perspective and understand the whole process. Performing analysis using biased methods with incomplete number of factors is impacting business profits which may lead to wrong decisions and does not allow an accurate long-term planning process. In fact, not much attention has been given to indirect failure costs by researchers.
Based on real warranty data, we showed, that the cost of extending warranties from 1,000 hrs to 7,000 hrs (lifetime) for part PN015 (Table VI) would increase the TQC by 22% (2 years average). At this point the voice of business would say that the business aims to decrease the warranty cost to increase profit, not the other way round. To validate this argument the following hypothesis can be developed. Let assume that present TQC (for short warranty) constitute 32% of sales. By extending warranty to lifetime 22% (Table VI) increase of TQC can be considered which corresponds to about 7% of sales. Therefore for lifetime warranty the TQC would constitute to 39% of sales as shown in Fig.9.
If - due to higher customer satisfaction and increased confidence in the product quality- product sales increased only by 15% a year, then cost of extending warranty to lifetime period would be fully compensated and could contribute further to increase business profits. Moreover, all other benefits resulting from providing lifetime warranty such as reputation, goodwill, data availability and better quality/cost control would not remain unnoticed. Of course, the process of introducing lifetime warranty can be stretched in time, e.g. every 2—3 years warranty period is extended by a specific period. Also, the lifetime warranty can be applied only to selected, most reliable products to test the pros and cons of this approach. In fact, reputation, goodwill and sales volumes will increase gradually; therefore a gradual introduction of lifetime warranty would bring the best economical effect without putting at risk business profits and cash-flow.
In recent years, some manufacturers like (Vauxhall Lifetime Warranty, 2012) and (Kia, 2012) made a step forward to understand their customers’ objectives and extended length of warranty time of their products.
Longer warranty periods ensure customers that the manufacturer is confident about its product quality. At the same time, it increases customer confidence about the product quality which in turn influences higher sales volumes.
Hyundai began offering a 10-year/100,000-mile powertrain warranty in the U.S. to differentiate itself from its competitors. In 2007, Hyundai reported its ninth consecutive year of record sales in the United States, and its improved quality has been noted by several sources, including Consumers Digest ultimately the business increased its share in the U.S. market by 4.6% by 2010 (Good Car Bad Car, 2010).
The availability of extended data provides better quality control during the whole product lifetime and allows for improved quality of parts and materials used on this product. Lifetime warranty also allows for better control of dealers’ practices, service performance and applied price policies after warranty time. Bad service performance or too expensive service / parts negatively affects manufacturer reputation and customer satisfaction. Dealer services are considered to be expensive therefore customers may move to much cheaper (not necessary less skilled) private service providers where service and parts cost much less. With lifetime warranty the customers would use dealer services more often and use genuine manufacturer parts and materials in the whole product lifetime (Vauxhall Lifetime Warranty, 2012) (Kia, 2012), (Good Car Bad Car, 2010). This usually prevents products from more frequent failures and product malfunctions, which is the domain of applying cheap replacements, often out-of-spec parts. Higher product reliability increases customer satisfaction and QPR which drives manufacturer to achieving main business objectives even faster.
Unlike the other two approaches the new CCBO method takes into account all main customer and business objectives and includes cost of failures after warranty time. The CCBO method helps to select parts and materials for products where product reliability and price are equally important to the customer. In further studies the authors would tend to feature the CCBO method with a bias factor allowing the application of this method with products where a specified level of bias is required. Meanwhile, for products where reliability is relatively more important than the cost (nuclear, safety or aviation products) the authors recommend remaining with the customer approach but extending the analysis to product lifetime; while for products where reliability is less important than cost (e.g. some disposable products), the business approach but also analysing in full product lifetime. CONCLUSIONS In this paper we discussed methods used in parts and
Sebastian and Bashir, 379 materials selection process focusing on satisfying main customers and businesses objectives. We proved that Weibull and TQC methods are biased in opposite directions and applied in-warranty time analyses do not cover main customer and business objectives. To equally satisfy main customer and business objectives we introduced a new CCBO method based on QCR and discussed the analytical process step by step. This method considers indirect failure costs and optimizes customer and business objectives. We compared and discussed short and lifetime warranties analysing impacts of failures on customer and manufacturer. The lifetime warranty can be economically justified even though it generates higher warranty costs than short (standard) warranty. The indirect failure costs in parts and materials selection process, often omitted by analysts and researchers, was highlighted and discussed. The CCBO can be successfully applied with products covered with lifetime warranty as well as covered with short warranties. However, it is not recommended for products where either quality or cost is more important from customer perspective.
The CCBO is not just selecting parts and materials with the highest QCR; it is also balanced distribution of costs and benefits aiming to maintain customer satisfaction, QPR and business profits at a high level. That means maximizing the middle ground between customer and business objectives called QCR and maintaining the QCR in the central location between business and customer objectives. Also, we recommend maintaining stable margin levels within industrial ranges applied for the same or similar products.
Concluding results from all applied methods – a proper parts and materials selection process is not about analysing reliability and/or cost in warranty period; the proper parts and materials selection process is about understanding and satisfying the main customer and business objectives within a period described in the objectives. The CCBO method was derived from these principles and provides an optimum customer and business solution.
The findings from this research are useful to business analysts who can apply the CCBO in parts and materials selection process and consider extending warranties towards lifetime. ACKNOWLEDGEMENT The authors are grateful to Dr Shaomin Wu and Dr Paul M. Gibbons for their valuable comments and contributions to the production of this paper. The authors are also grateful to the unnamed company which shared warranty data for the purpose of this research.
REFERENCES Warranty Week, (2012). “Warranty Cost Per
380 Glo. Adv. Res. J. Manag. Bus. Stud. Vehicle”.http://www.warrantyweek.com/archive/ww20120712.html, 21
August 2012. (Pyzdek T 2003) The Six Sigma Handbook. New York: The McGraw-
Hill, 2003, pp. 219. Juran JM, Godfrey AB, Hoogstoel RE, Schilling EG, (2000). Juran's
QualityHhandbook, Fifth Edition. Singapore: McGraw-Hill, 2000, pp. 8.14.
Duchesne T, Marri F (2009). “General distributional properties of discounted warranty costs with risk adjustment under minimal repair,” IEEE Transactions on Reliability, vol. 58, no. 1, Mar 2009, pp. 143-151. Rinne H (2009). The Weibull Distribution. Boca Raton: Chapman &
Hall/CRC,2009. Olejnik SB, Al-Diri B (2011). "Reliability vs. Total Quality Cost—Part
selection criteria based on field data, combined optimal customer and business solution," 2011 IEEE International Conference on Quality and Reliability (ICQR), 14-17 Sept. 2011, pp.408-412. doi: 10.1109/ICQR.2011.6031751.
Wu S (2011). “Warranty claim analysis considering human factors.” Reliability Engineering and System Safety, 2011, pp.131-138. Hacker L (2008). “Reliability prediction methods for electronic
products,”Reliability Edge, vol. 9, no. 1, 2008, pp. 1, 9-11, 15-16, 19.
Rai BK, Singh N (2009). Reliability analysis and prediction with warranty data, London, CRC Press, 2009.
Speaks (2005).. Reliability and MTBF Overview. Vicor Power. [Online] 10 Aug 2005. [Accessed: 9 Oct 2011.] pp. 122. http://www.vicr.com/documents/quality/Rel_MTBF.pdf.
Alam MM, Suzuki K, Kazuyuki (2009). “Lifetime estimation using only failure data information from warranty database,” IEEE Transactions On Reliability. vol. 58, no. 4, Dec 2009, pp. 573-582.
Rai BK (2009)., “Warranty spend forecasting for subsystem failures influenced by calendar month seasonality,” IEEE transactions on the Reliability, vol. 58, no. 4, Dec 2009, pp. 649-657.
Wu S , Warranty Data Analysis: A Review, Quality and Reliability Engineering International, DOI: 10.1002/qre.1282
Paya-Zaforteza I, Yepes V, Gonzalez-Vidosa F, Hospitaler A (2010). “On the Weibull Cost Estimation of Building Frames Designed by Simulated Annealing”. Meccanica. vol. 45, no. 5, Feb 2010, pp. 693-704.
Xu D (2010). “An Efficient Estimation for Switching Regression Models: A Monte Carlo Study”. Communications in Statistics - Simulation and Computation, vol. 39, no 7, 2010, pp. 1403-1421.
Savalei V (2010). “Small Sample Statistics for Incomplete Nonnormal Data : Extentions of Complete Data Formulae and Monte Carlo Comparision”. Structual Equation Modeling, vol. 17, no. 2, 2010, pp. 241-264.
Wood AP (2001). "Reliability-metric varieties and their
relationships,"Reliability and Maintainability Symposium, 2001. Proceedings. Annual,2001, pp.110-115.
Levitt T (1986). The Marketing Imagination, The Free Press, New York, 1986
Steenkamp JEM (1998). “The relationship between price and quality in the
marketplace.” De Economist, December 1998. Vauxhall Lifetime Warranty (2012). ”Vauxhall’s Industry-Beating
Lifetime / 100,000 Mile Warranty”. [Accessed: 2 September 2012]
http://www.caranddriving.com/features2/Vauxhall%20Lifetime%20Warranty.pdf.
Kia, (2012). “Corporate News”. [Accessed: 2 September 2012]http://www.kiamotors.com/about-kia/company/corporate-news-view.aspx?idx=17.
Good Car Bad Car, (2012). “Hyundai USA Sales Figures And PercentageGrowth In 2010”. [Accessed: 8
September 2012] http://www.goodcarbadcar.net/2011/01/hyundai-usa-sales-figures-
and.html.