IMPLICATIONS OF CHANGING RAINFALL PATTERN ON BUILDING LOSS IN CALABAR
9
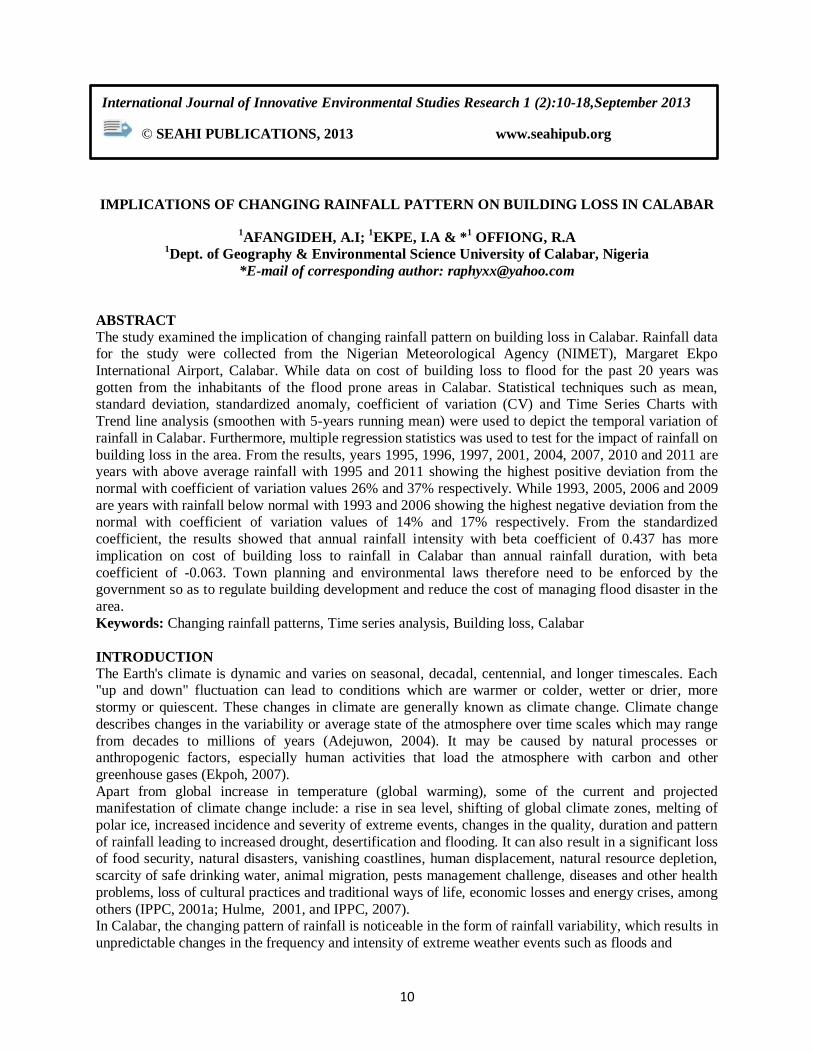
10 IMPLICATIONS OF CHANGING RAINFALL PATTERN ON BUILDING LOSS IN CALABAR 1 AFANGIDEH, A.I; 1 EKPE, I.A & * 1 OFFIONG, R.A 1 Dept. of Geography & Environmental Science University of Calabar, Nigeria *E-mail of corresponding author: [email protected] ABSTRACT The study examined the implication of changing rainfall pattern on building loss in Calabar. Rainfall data for the study were collected from the Nigerian Meteorological Agency (NIMET), Margaret Ekpo International Airport, Calabar. While data on cost of building loss to flood for the past 20 years was gotten from the inhabitants of the flood prone areas in Calabar. Statistical techniques such as mean, standard deviation, standardized anomaly, coefficient of variation (CV) and Time Series Charts with Trend line analysis (smoothen with 5-years running mean) were used to depict the temporal variation of rainfall in Calabar. Furthermore, multiple regression statistics was used to test for the impact of rainfall on building loss in the area. From the results, years 1995, 1996, 1997, 2001, 2004, 2007, 2010 and 2011 are years with above average rainfall with 1995 and 2011 showing the highest positive deviation from the normal with coefficient of variation values 26% and 37% respectively. While 1993, 2005, 2006 and 2009 are years with rainfall below normal with 1993 and 2006 showing the highest negative deviation from the normal with coefficient of variation values of 14% and 17% respectively. From the standardized coefficient, the results showed that annual rainfall intensity with beta coefficient of 0.437 has more implication on cost of building loss to rainfall in Calabar than annual rainfall duration, with beta coefficient of -0.063. Town planning and environmental laws therefore need to be enforced by the government so as to regulate building development and reduce the cost of managing flood disaster in the area. Keywords: Changing rainfall patterns, Time series analysis, Building loss, Calabar INTRODUCTION The Earth's climate is dynamic and varies on seasonal, decadal, centennial, and longer timescales. Each "up and down" fluctuation can lead to conditions which are warmer or colder, wetter or drier, more stormy or quiescent. These changes in climate are generally known as climate change. Climate change describes changes in the variability or average state of the atmosphere over time scales which may range from decades to millions of years (Adejuwon, 2004). It may be caused by natural processes or anthropogenic factors, especially human activities that load the atmosphere with carbon and other greenhouse gases (Ekpoh, 2007). Apart from global increase in temperature (global warming), some of the current and projected manifestation of climate change include: a rise in sea level, shifting of global climate zones, melting of polar ice, increased incidence and severity of extreme events, changes in the quality, duration and pattern of rainfall leading to increased drought, desertification and flooding. It can also result in a significant loss of food security, natural disasters, vanishing coastlines, human displacement, natural resource depletion, scarcity of safe drinking water, animal migration, pests management challenge, diseases and other health problems, loss of cultural practices and traditional ways of life, economic losses and energy crises, among others (IPPC, 2001a; Hulme, 2001, and IPPC, 2007). In Calabar, the changing pattern of rainfall is noticeable in the form of rainfall variability, which results in unpredictable changes in the frequency and intensity of extreme weather events such as floods and International Journal of Innovative Environmental Studies Research 1 (2):10-18,September 2013 © SEAHI PUBLICATIONS, 2013 www.seahipub.org
Transcript of IMPLICATIONS OF CHANGING RAINFALL PATTERN ON BUILDING LOSS IN CALABAR
10
IMPLICATIONS OF CHANGING RAINFALL PATTERN ON BUILDING LOSS IN CALABAR
1AFANGIDEH, A.I;
1EKPE, I.A & *
1 OFFIONG, R.A
1Dept. of Geography & Environmental Science University of Calabar, Nigeria
*E-mail of corresponding author: [email protected]
ABSTRACT
The study examined the implication of changing rainfall pattern on building loss in Calabar. Rainfall data for the study were collected from the Nigerian Meteorological Agency (NIMET), Margaret Ekpo
International Airport, Calabar. While data on cost of building loss to flood for the past 20 years was
gotten from the inhabitants of the flood prone areas in Calabar. Statistical techniques such as mean, standard deviation, standardized anomaly, coefficient of variation (CV) and Time Series Charts with
Trend line analysis (smoothen with 5-years running mean) were used to depict the temporal variation of
rainfall in Calabar. Furthermore, multiple regression statistics was used to test for the impact of rainfall on
building loss in the area. From the results, years 1995, 1996, 1997, 2001, 2004, 2007, 2010 and 2011 are years with above average rainfall with 1995 and 2011 showing the highest positive deviation from the
normal with coefficient of variation values 26% and 37% respectively. While 1993, 2005, 2006 and 2009
are years with rainfall below normal with 1993 and 2006 showing the highest negative deviation from the normal with coefficient of variation values of 14% and 17% respectively. From the standardized
coefficient, the results showed that annual rainfall intensity with beta coefficient of 0.437 has more
implication on cost of building loss to rainfall in Calabar than annual rainfall duration, with beta
coefficient of -0.063. Town planning and environmental laws therefore need to be enforced by the government so as to regulate building development and reduce the cost of managing flood disaster in the
area.
Keywords: Changing rainfall patterns, Time series analysis, Building loss, Calabar
INTRODUCTION
The Earth's climate is dynamic and varies on seasonal, decadal, centennial, and longer timescales. Each "up and down" fluctuation can lead to conditions which are warmer or colder, wetter or drier, more
stormy or quiescent. These changes in climate are generally known as climate change. Climate change
describes changes in the variability or average state of the atmosphere over time scales which may range
from decades to millions of years (Adejuwon, 2004). It may be caused by natural processes or anthropogenic factors, especially human activities that load the atmosphere with carbon and other
greenhouse gases (Ekpoh, 2007).
Apart from global increase in temperature (global warming), some of the current and projected manifestation of climate change include: a rise in sea level, shifting of global climate zones, melting of
polar ice, increased incidence and severity of extreme events, changes in the quality, duration and pattern
of rainfall leading to increased drought, desertification and flooding. It can also result in a significant loss of food security, natural disasters, vanishing coastlines, human displacement, natural resource depletion,
scarcity of safe drinking water, animal migration, pests management challenge, diseases and other health
problems, loss of cultural practices and traditional ways of life, economic losses and energy crises, among
others (IPPC, 2001a; Hulme, 2001, and IPPC, 2007). In Calabar, the changing pattern of rainfall is noticeable in the form of rainfall variability, which results in
unpredictable changes in the frequency and intensity of extreme weather events such as floods and
International Journal of Innovative Environmental Studies Research 1 (2):10-18,September 2013
© SEAHI PUBLICATIONS, 2013 www.seahipub.org

11
erosion. While the number of geophysical disasters has remained fairly steady, the number of hydro-
meteorological disasters since 1996 has more than doubled. During the past decade over 90 percent of
those affected by natural disasters are linked to hydro-meteorological event such as flood (Paredes et al. 2006). The recent floods in the study area have highlighted how important it is to analyze the trends in the
rainfall regime of this area. This is because of its effects on the city’s population, environment and socio-
economic activities. Increasing flood risk is now being recognized as the most important sectorial threat from climate change in most parts of the world. This has prompted public debate on the apparent
increased frequency of extreme, and in particular, on perceived increases in rainfall intensities.
Several studies have adduced extreme rainfall to be the major cause of flood in Nigeria. Such studies includes Gobo (1988), McEwen (1989), Oriola (1994), Babatolu (1996); Fowler and Kilsby (2003),
Odekunle (2001), and Ologunorisa (2001, 2004). Other studies have identified the characteristics of
extreme rainfall that are associated with flood frequency to include duration, intensity, frequency,
seasonality, variability, trend and fluctuation (Olaniran, 1983; Ologunorisa, 2001; Ologunorisa and Diagi, 2005).
Adefolalu et. al. (2001) summed the impact of the 1999 flooding thus: ‘There were at least 56 deaths;
over N12 billion ha of farmlands washed away resulting in estimated farm produce loss of 100 million tons. Infrastructural facilities (houses, schools, roads, etc.) destroyed will cost over N50 billion to
rehabilitate or replace. Conversely, flood disasters as a result of heavy rainfall were recorded in 2001,
2002, 2003, 2005 and 2006 in Kafanchan. The floods of September, 2005 alone resulted in major disasters: the washing away of farmlands, disruption of socio-economic activities, displacement of
people, and damage of residences and infrastructure worth millions of naira (Abaje et. al, 2010).
This study therefore seeks to assess the implications of changing pattern of rainfall on building loss in
Calabar.
MATERIALS AND METHOD
Study Area Calabar is the capital of Cross River State. It is located at the Southern part of Cross River State as seen in
Fig.1, Calabar is located between longitudes 8017’00’’E and 8
020’00’’E latitudes 4
050’00’’N and
5010’00’’N. Calabar metropolis comprises of Calabar Municipality and Calabar South Local Government
Areas and covers an area of about 1,480 Sq km. As depicted in Fig.1 Calabar is sandwiched between the Great Kwa River to the East and the Calabar River to the West. The presence of urban area is on the
eastern bank of the Calabar River; its growth to the south is hindered by the mangrove swamps.
Calabar falls within tropical equatorial (Af) climate with high temperature, high relative humidity and abundant annual rainfall (Oguntoyimbo, 1978; Inyang, 1980). Two major air masses affect the climate of
Calabar as well as other contiguous locations in the West African region. The Tropical Maritime (mT)
and the tropical continental (cT) air masses affect the climate in two distinct seasons. mT air prevails and influences its moisture characteristic while the cT air influences the dry season condition due to is desert
source across the two air masses at the upper troposphere from east to west. This is called the Equatorial
Esterlies (EE). The two air masses meet at the pressure front called Inter Tropical discontinuity (ITD)
(Oguntoyimbo, 1978). There have been a massive development and urban expansion in the area over the last 10 years. This
development is not without repercussions on the natural environment as lands that were formally
vegetated, used for agriculture and as habitat for biodiversity are now being used for residential, commercial and industrial purposes to accommodate the growing population and businesses. The loss of
once vegetated land implies a corresponding alteration of the micro-climate of the area which in turn has
great impact on the long term climatic averages of the area.
Afangideh, , Ekpe & Offiong.. Int. J. Innovative Environ. Studies Res. 1 (2):10-18, 2013
12
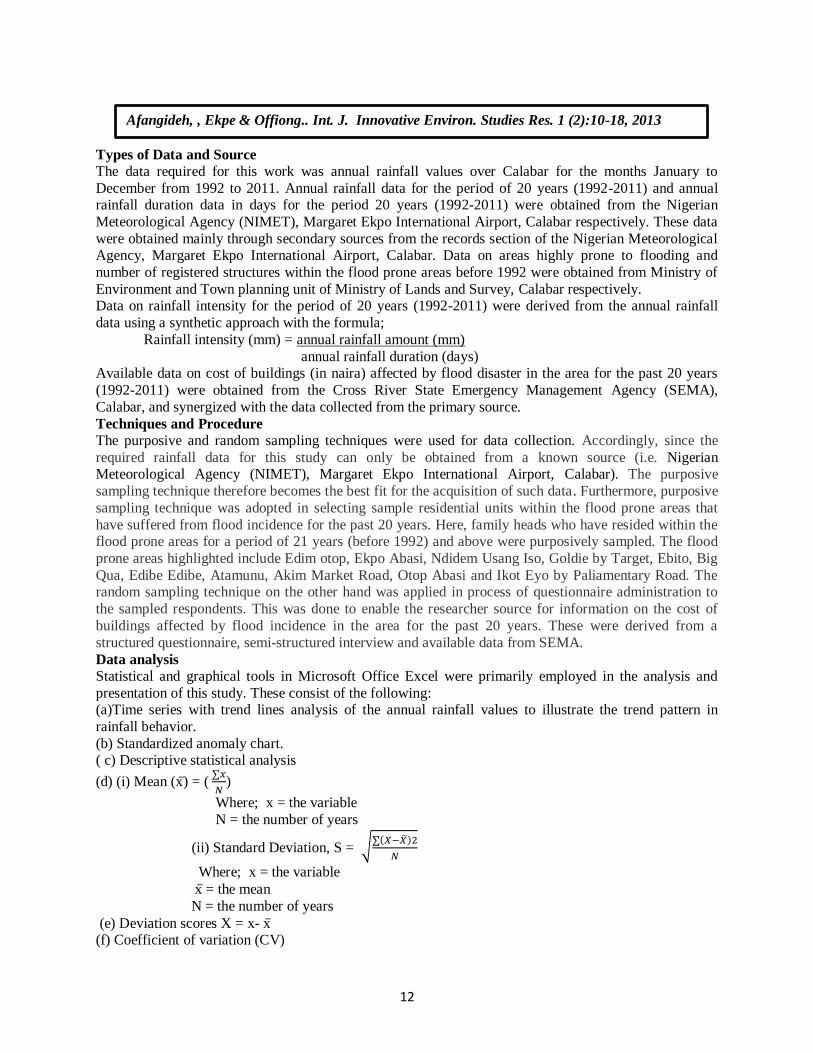
Types of Data and Source
The data required for this work was annual rainfall values over Calabar for the months January to
December from 1992 to 2011. Annual rainfall data for the period of 20 years (1992-2011) and annual rainfall duration data in days for the period 20 years (1992-2011) were obtained from the Nigerian
Meteorological Agency (NIMET), Margaret Ekpo International Airport, Calabar respectively. These data
were obtained mainly through secondary sources from the records section of the Nigerian Meteorological Agency, Margaret Ekpo International Airport, Calabar. Data on areas highly prone to flooding and
number of registered structures within the flood prone areas before 1992 were obtained from Ministry of
Environment and Town planning unit of Ministry of Lands and Survey, Calabar respectively. Data on rainfall intensity for the period of 20 years (1992-2011) were derived from the annual rainfall
data using a synthetic approach with the formula;
Rainfall intensity (mm) = annual rainfall amount (mm)
annual rainfall duration (days) Available data on cost of buildings (in naira) affected by flood disaster in the area for the past 20 years
(1992-2011) were obtained from the Cross River State Emergency Management Agency (SEMA),
Calabar, and synergized with the data collected from the primary source.
Techniques and Procedure
The purposive and random sampling techniques were used for data collection. Accordingly, since the
required rainfall data for this study can only be obtained from a known source (i.e. Nigerian Meteorological Agency (NIMET), Margaret Ekpo International Airport, Calabar). The purposive
sampling technique therefore becomes the best fit for the acquisition of such data. Furthermore, purposive
sampling technique was adopted in selecting sample residential units within the flood prone areas that
have suffered from flood incidence for the past 20 years. Here, family heads who have resided within the flood prone areas for a period of 21 years (before 1992) and above were purposively sampled. The flood
prone areas highlighted include Edim otop, Ekpo Abasi, Ndidem Usang Iso, Goldie by Target, Ebito, Big
Qua, Edibe Edibe, Atamunu, Akim Market Road, Otop Abasi and Ikot Eyo by Paliamentary Road. The random sampling technique on the other hand was applied in process of questionnaire administration to
the sampled respondents. This was done to enable the researcher source for information on the cost of
buildings affected by flood incidence in the area for the past 20 years. These were derived from a
structured questionnaire, semi-structured interview and available data from SEMA.
Data analysis
Statistical and graphical tools in Microsoft Office Excel were primarily employed in the analysis and
presentation of this study. These consist of the following: (a)Time series with trend lines analysis of the annual rainfall values to illustrate the trend pattern in
rainfall behavior.
(b) Standardized anomaly chart. ( c) Descriptive statistical analysis
(d) (i) Mean (x ) = (
)
Where; x = the variable
N = the number of years
(ii) Standard Deviation, S = √ ( ̅)
Where; x = the variable
x = the mean
N = the number of years
(e) Deviation scores X = x- x (f) Coefficient of variation (CV)
Afangideh, , Ekpe & Offiong.. Int. J. Innovative Environ. Studies Res. 1 (2):10-18, 2013
13
(g) Similarly, data on the impact of the rainfall regime on building infrastructure in Calabar for the period
1992-2011 were presented and analyzed using tables and frequencies.
(h) On the other hand, the multiple regression analysis was used to examine the impact of rainfall on buildings in the area for the period 1992-2011.
RESULTS AND DISCUSSION
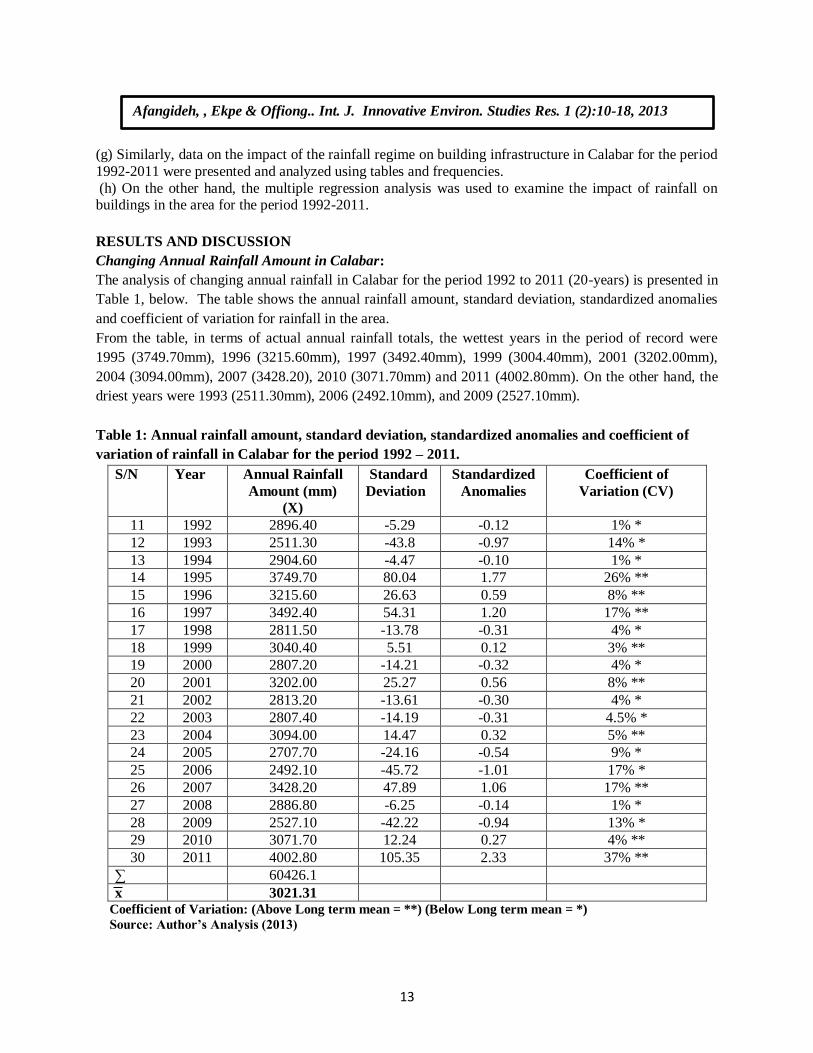
Changing Annual Rainfall Amount in Calabar:
The analysis of changing annual rainfall in Calabar for the period 1992 to 2011 (20-years) is presented in
Table 1, below. The table shows the annual rainfall amount, standard deviation, standardized anomalies
and coefficient of variation for rainfall in the area.
From the table, in terms of actual annual rainfall totals, the wettest years in the period of record were
1995 (3749.70mm), 1996 (3215.60mm), 1997 (3492.40mm), 1999 (3004.40mm), 2001 (3202.00mm),
2004 (3094.00mm), 2007 (3428.20), 2010 (3071.70mm) and 2011 (4002.80mm). On the other hand, the
driest years were 1993 (2511.30mm), 2006 (2492.10mm), and 2009 (2527.10mm).
Table 1: Annual rainfall amount, standard deviation, standardized anomalies and coefficient of
variation of rainfall in Calabar for the period 1992 – 2011.
S/N Year Annual Rainfall
Amount (mm)
(X)
Standard
Deviation
Standardized
Anomalies
Coefficient of
Variation (CV)
11 1992 2896.40 -5.29 -0.12 1% *
12 1993 2511.30 -43.8 -0.97 14% *
13 1994 2904.60 -4.47 -0.10 1% *
14 1995 3749.70 80.04 1.77 26% **
15 1996 3215.60 26.63 0.59 8% **
16 1997 3492.40 54.31 1.20 17% **
17 1998 2811.50 -13.78 -0.31 4% *
18 1999 3040.40 5.51 0.12 3% **
19 2000 2807.20 -14.21 -0.32 4% *
20 2001 3202.00 25.27 0.56 8% **
21 2002 2813.20 -13.61 -0.30 4% *
22 2003 2807.40 -14.19 -0.31 4.5% *
23 2004 3094.00 14.47 0.32 5% **
24 2005 2707.70 -24.16 -0.54 9% *
25 2006 2492.10 -45.72 -1.01 17% *
26 2007 3428.20 47.89 1.06 17% **
27 2008 2886.80 -6.25 -0.14 1% *
28 2009 2527.10 -42.22 -0.94 13% *
29 2010 3071.70 12.24 0.27 4% **
30 2011 4002.80 105.35 2.33 37% **
∑ 60426.1
x 3021.31 Coefficient of Variation: (Above Long term mean = **) (Below Long term mean = *)
Source: Author’s Analysis (2013)
Afangideh, , Ekpe & Offiong.. Int. J. Innovative Environ. Studies Res. 1 (2):10-18, 2013
14
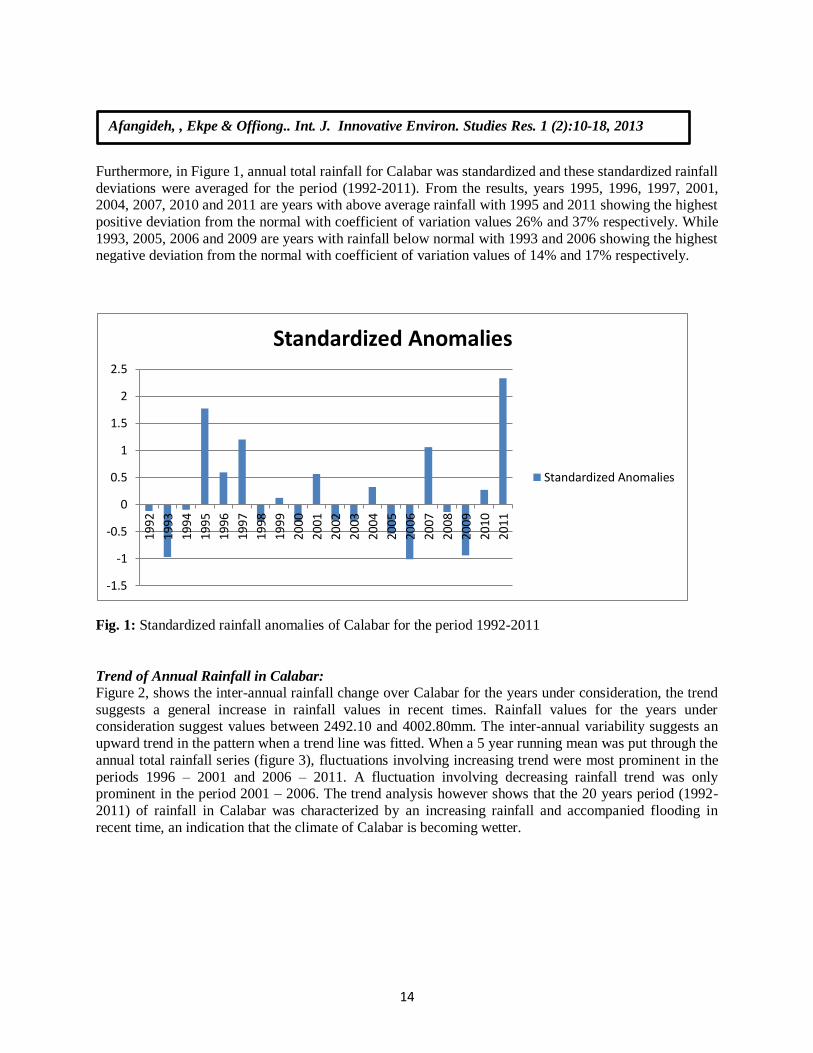
Furthermore, in Figure 1, annual total rainfall for Calabar was standardized and these standardized rainfall
deviations were averaged for the period (1992-2011). From the results, years 1995, 1996, 1997, 2001, 2004, 2007, 2010 and 2011 are years with above average rainfall with 1995 and 2011 showing the highest
positive deviation from the normal with coefficient of variation values 26% and 37% respectively. While
1993, 2005, 2006 and 2009 are years with rainfall below normal with 1993 and 2006 showing the highest negative deviation from the normal with coefficient of variation values of 14% and 17% respectively.
Fig. 1: Standardized rainfall anomalies of Calabar for the period 1992-2011
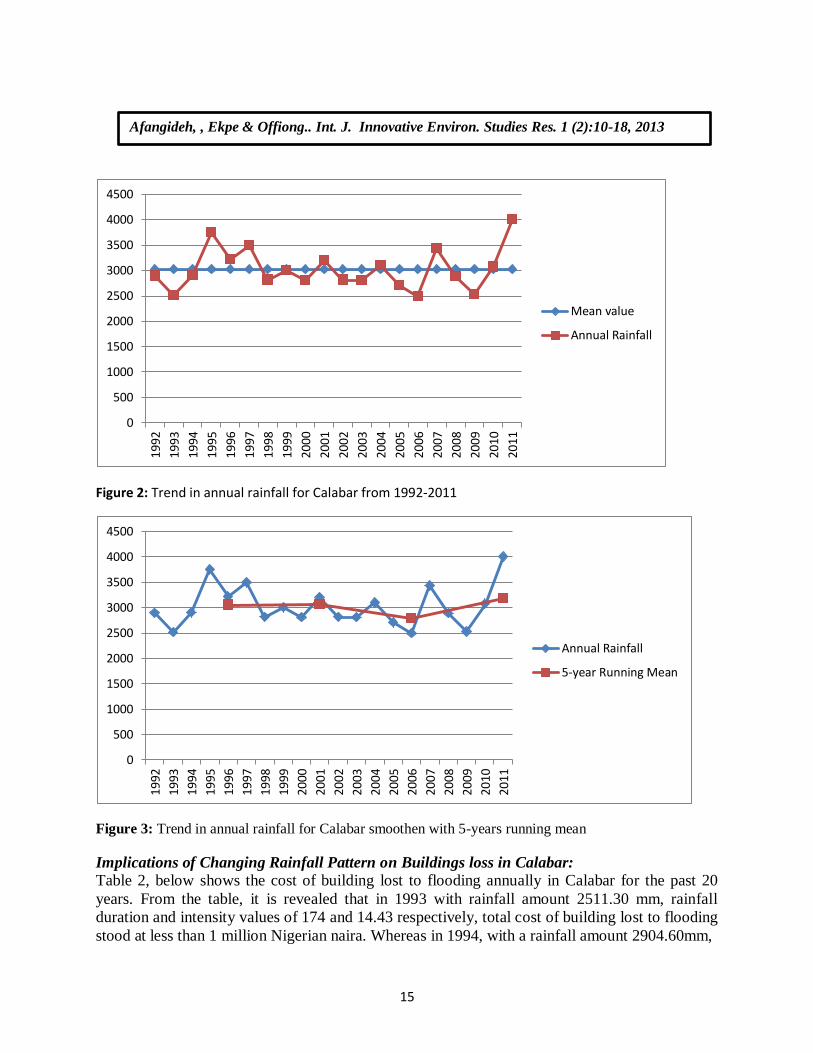
Trend of Annual Rainfall in Calabar:
Figure 2, shows the inter-annual rainfall change over Calabar for the years under consideration, the trend
suggests a general increase in rainfall values in recent times. Rainfall values for the years under consideration suggest values between 2492.10 and 4002.80mm. The inter-annual variability suggests an
upward trend in the pattern when a trend line was fitted. When a 5 year running mean was put through the
annual total rainfall series (figure 3), fluctuations involving increasing trend were most prominent in the
periods 1996 – 2001 and 2006 – 2011. A fluctuation involving decreasing rainfall trend was only prominent in the period 2001 – 2006. The trend analysis however shows that the 20 years period (1992-
2011) of rainfall in Calabar was characterized by an increasing rainfall and accompanied flooding in
recent time, an indication that the climate of Calabar is becoming wetter.
-1.5
-1
-0.5
0
0.5
1
1.5
2
2.5
1992
1993
1994
1995
1996
1997
1998
1999
2000
2001
2002
2003
2004
2005
2006
2007
2008
2009
2010
2011
Standardized Anomalies
Standardized Anomalies
Afangideh, , Ekpe & Offiong.. Int. J. Innovative Environ. Studies Res. 1 (2):10-18, 2013
15
Figure 2: Trend in annual rainfall for Calabar from 1992-2011
Figure 3: Trend in annual rainfall for Calabar smoothen with 5-years running mean
Implications of Changing Rainfall Pattern on Buildings loss in Calabar:
Table 2, below shows the cost of building lost to flooding annually in Calabar for the past 20
years. From the table, it is revealed that in 1993 with rainfall amount 2511.30 mm, rainfall
duration and intensity values of 174 and 14.43 respectively, total cost of building lost to flooding
stood at less than 1 million Nigerian naira. Whereas in 1994, with a rainfall amount 2904.60mm,
0
500
1000
1500
2000
2500
3000
3500
4000
4500
1992
1993
1994
1995
1996
1997
1998
1999
2000
2001
2002
2003
2004
2005
2006
2007
2008
2009
2010
2011
Mean value
Annual Rainfall
0
500
1000
1500
2000
2500
3000
3500
4000
4500
1992
1993
1994
1995
1996
1997
1998
1999
2000
2001
2002
2003
2004
2005
2006
2007
2008
2009
2010
2011
Annual Rainfall
5-year Running Mean
Afangideh, , Ekpe & Offiong.. Int. J. Innovative Environ. Studies Res. 1 (2):10-18, 2013

16
rainfall duration and intensity values of 185 and 16.69 respectively, between 1 million to 10
million naira worth of buildings were being lost to flooding in the area. In the same vein, the
years 2007, 2008, 2009, 2010 and 2011 are years with cost of buildings between 20 million to 30
million naira being lost annually to flood in the area. The regression results revealed that given a
unit increase in rainfall duration while holding the effect of rainfall constant, cost of building loss
Table 2: Cost of Buildings Loss to Rainfall in Calabar for The Period 1992-2011 (20 Years).
S/N
Year
Annual Rainfall
Amount
(MM)
Rainfall
Duration
(Days)
Rainfall Intensity
(MM)
Cost of Building Lost
to Flood (Naira)
1
1992 2896.40 181
16.00 Less than
N1,000,000
2
1993 2511.30 174
14.43 Less than
N1,000,000
3
1994 2904.60 185
16.69 N1,000000 –
N10,000000
4 1995 3749.70 194
19.33 N10,100000 – N20,000000
5
1996 3215.60 195
16.49 N10,100000 –
N20,000000
6
1997 3492.40 188
18.58 N10,100000 –
N20,000000
7
1998 2811.50 186
15.12 N1,000000 –
N10,000000
8
1999 3004.40 199
15.10 Less than
N1,000,000
9
2000 2807.20 182
15.42 N1,000000 –
N10,000000
10
2001 3202.00 188
17.03 N1,000000 –
N10,000000
11
2002 2813.20 189
14.88 Less than
N1,000,000
12
2003 2807.40 178
15.77 Less than
N1,000,000
13
2004 3094.00 176
17.58 N20,000000 –
N30,000000
14
2005 2707.70 186
14.56 N1,000000 –
N10,000000
15
2006 2492.10 191
13.05 N1,000000 –
N10,000000
16
2007 3428.20 206
16.64 N30,000,000 and
above
17
2008 2886.80 168
17.18 N20,000000 –
N30,000000
18
2009 2527.10 176
14.36 N30,000,000 and
above
19
2010 3071.70 188
16.34 N20,000000 –
N30,000000
20
2011 4002.80 195
20.53 N30,000,000 and
above
Source: Author’s Field Report (2013)
Afangideh, , Ekpe & Offiong.. Int. J. Innovative Environ. Studies Res. 1 (2):10-18, 2013
17
to rainfall will decrease by -76250.604 units. Also if the effect of rainfall duration is held
constant, there is a unit increase in rainfall intensity, cost of building loss to rainfall will increase
by 2690531.024 units. From the standardized coefficient, it can be concluded that annual rainfall
intensity with beta coefficient of 0.437, has more implication on cost of buildings loss to rainfall
in Calabar than annual rainfall duration, with beta coefficient of -0.063. This confirms earlier
findings by (Olaniran, 1983; Ologunorisa, 2001; Ologunorisa and Diagi, 2005).
CONCLUSION/RECOMMENDATIONS
The study results reflect a changing pattern of rainfall in Calabar. From the results, years 1995, 1996,
1997, 2001, 2004, 2007, 2010 and 2011 are years with above average rainfall with 1995 and 2011 showing the highest positive deviation from the normal. While 1993, 2005, 2006 and 2009 are years with
rainfall below normal with 1993 and 2006 showing the highest negative deviation from the normal. The
results also showed that the climate of the area is becoming wetter with an increasing trend. However, this has not been without impact on the socio-economic wellbeing of the inhabitants of Calabar, as building
worth millions of naira have loss to flood over the past 20 years. The government therefore needs to
ensure that the inhabitants of the area help to prevent flood by enforcing town planning and environmental laws when building houses.
REFERENCES Abaje, I.B., S, Ishaya and S.U. Usman (2010), An Analysis of Rainfall Trends in Kafanchan, Kaduna
State, Nigeria. Research Journal of Environmental and Earth Sciences 2(2): 89-96, 2010.
Adefolalu D.O. et. al. (2001), Climate Change and Natural Disasters During the 1999 Rainy Season.FUT
– NUC/U BR Res. Pub. 88 pp. Adejuwon, S.A ., (2004). Impacts of Climate Variability and Climate Change on Crop Yield in Nigeria.
Being the Lead Paper Presented at the Stake holders ’ Workshop on Assessment of
Impacts and Adaptation to Climate Change (A IAC C), Conference Centre Obafemi Awolowo University, Ile-Ife, Sept, 20-21. Retrieved from: http://www.lead-
awa.org/docs/Ife%20September%202004%20Paper-ADEJUWON .doc. (Accessed date:
May 16, 2009 ). Babatola, J. S. (1996). Recent Changes in Rainfall Patterns and its Implication for Flood Occurrence in
Ondo, Nigeria. Ondo Journal of Arts and Social Sciences, 1 (1), pp. 125 – 136.
Ekpoh, I. J. (2007). Climate and Society in Northern Nigeria: Rainfall variability and farming. The
InternationalJournal Series on Tropical issues, 8(3), 157-162. Fowler, H J; Kilsby, C.G. (2003) Implications of Changes in Seasonal and Annual Extreme Rainfall.
Geophysical Research Letters, 30 (13), pp. 17 – 20.
Gobo, A. E (1988). Relationship Between Rainfall Trends and Flooding in the Niger – Benue River Basin. The Journal of Meteorology,Vol. 13, No. 132, pp. 318 – 324.
Hulme, M. (2001). Climate perspectives on Sahelian desiccation; 1973-1998. Global Environmental
Change, 11,19-29. doi:10.1016/S0959-3780(00)00042-X, http://dx.doi.org/10.1016/S0959-3780(00)00042-X
Inyang, P. E. B. (1980). Pollution: a factor in the climate of Calabar and environs: geographic studies
published by department of geography, university of calabar for the 23rd
Nigerian
Geographic Association Conference, Calabar, 16th
-21st March, 1980.
IPCC. (2001). Climate Change: Impacts, Vulnerability and Adaptation. Working group II, WMO, Geneva
IPPC. (2007). Climate Change 2007: Fourth Assessment Report (AR4).
McEwen, L. J (1989). Extreme Rainfall and its Implication for Flood Frequency: A Case Study of Makurdi.
Afangideh, , Ekpe & Offiong.. Int. J. Innovative Environ. Studies Res. 1 (2):10-18, 2013
18
Odekunle, T. O. (2001). The magnitude – Frequency Characteristic of Rainfall in Ondo, Southwestern
Nigeria. Ife Research Publications in Geography, Vol. 8, pp. 36 – 41.
Oguntoyimbo, J. S. (1978). Climatology of west Africa. New jersey Library of congress cataloguing in publication data.
Olaniran, O . J. (1983). Flood generating mechanisms at Ilorin, Nigeria GeoJournal. 7(3) 271 – 277
Ologunorisa, E .T (2004). Rainfall Flood Prediction in the Niger Delta, Nigeria (Abstract), International Conference in Hydrology: Science and Practice for the 21st Century, London, U.K.
Ologunorisa, E T; Diagi, P N (2005). Extreme Rainfall and its Implication for Flood Frequency in the
Western Niger Delta A Case Study of Warri. Nigerian Journal of Tropical Geography Vol. 1.
Ologunorisa, E.T (2001). An Assessment of Flood Risk in the Niger Delta, Nigeria. Unpublished Ph.D
Thesis Department of Geography and Environmental Management, University of Port
Harcourt, Port Harcourt, 303 pp. Oriola, E O (1994). Strategies for Combating Urban Flooding in a Developing Nation: A Case Study of
Ondo, Niger. The Environmentalist Vol. 14, pp. 57 – 62.
Paredes D, Trigo RM, Garcia-Herrera R. and Franco-Trigo I (2006) Understanding precipitation changes in Iberia in early spring: weather typing and storm-tracking approaches. Journal of
Hydrometeorology 7:101–113.
Afangideh, , Ekpe & Offiong.. Int. J. Innovative Environ. Studies Res. 1 (2):10-18, 2013