IMPERIAL OIL LIMITED - AnnualReports.com
201
1 UNITED STATES SECURITIES AND EXCHANGE COMMISSION WASHINGTON, D.C. 20549 FORM 10-K ANNUAL REPORT PURSUANT TO SECTION 13 OR 15(d) OF THE SECURITIES EXCHANGE ACT OF 1934 For the fiscal year ended December 31, 2021 or TRANSITION REPORT PURSUANT TO SECTION 13 OR 15(d) OF THE SECURITIES EXCHANGE ACT OF 1934 For the transition period from to Commission file number 0-12014 IMPERIAL OIL LIMITED (Exact name of registrant as specified in its charter) CANADA (State or other jurisdiction of incorporation or organization) 98-0017682 (I.R.S. Employer Identification No.) 505 QUARRY PARK BOULEVARD S.E., CALGARY, AB, CANADA (Address of principal executive offices) T2C 5N1 (Postal Code) 1-800-567-3776 (Registrant’s telephone number, including area code) Securities registered pursuant to Section 12(b) of the Act: Title of each class Trading symbol Name of each exchange on which registered None None Securities registered pursuant to Section 12(g) of the Act: Common Shares (without par value) (Title of Class) Indicate by check mark if the registrant is a well-known seasoned issuer (as defined in Rule 405 of the Securities Act). Yes No...... Indicate by check mark if the registrant is not required to file reports pursuant to Section 13 or Section 15(d) of the Securities Exchange Act of 1934. Yes...... No Indicate by check mark whether the registrant (1) has filed all reports required to be filed by Section 13 or 15(d) of the Securities Exchange Act of 1934 during the preceding 12 months (or for such shorter period that the registrant was required to file such reports), and (2) has been subject to such filing requirements for the past 90 days. Yes No...... Indicate by check mark whether the registrant has submitted electronically every Interactive Data File required to be submitted pursuant to Rule 405 of Regulation S-T (§ 232.405 of this chapter) during the preceding 12 months (or for such shorter period that the registrant was required to submit and post such files). Yes No...... Indicate by check mark whether the registrant is a large accelerated filer, an accelerated filer, a non-accelerated filer, a smaller reporting company, or an emerging growth company. See the definitions of "large accelerated filer", "accelerated filer", "smaller reporting company" and "emerging growth company" in Rule 12b-2 of the Securities Exchange Act of 1934. Large accelerated filer Smaller reporting company...... Accelerated filer...... Emerging growth company...... Non-accelerated filer...... If an emerging growth company, indicate by check mark if the registrant has elected not to use the extended transition period for complying with any new or revised financial accounting standards provided pursuant to Section 13(a) of the Exchange Act…… Indicate by check mark whether the registrant has filed a report on and attestation to its management’s assessment of the effectiveness of its internal control over financial reporting under Section 404(b) of the Sarbanes-Oxley Act (15 U.S.C. 7262(b)) by the registered public accounting firm that prepared or issued its audit report. Indicate by check mark whether the registrant is a shell company (as defined in Rule 12 b-2 of the Securities Exchange Act of 1934). Yes..... No As of the last business day of the 2021 second fiscal quarter, the aggregate market value of the voting stock held by non-affiliates of the registrant was Canadian $8,092,185,812 based upon the reported last sale price of such stock on the Toronto Stock Exchange on that date. The number of common shares outstanding, as of February 15, 2022, was 669,143,714.
-
Upload
khangminh22 -
Category
Documents
-
view
0 -
download
0
Transcript of IMPERIAL OIL LIMITED - AnnualReports.com

1
UNITED STATES SECURITIES AND EXCHANGE COMMISSION WASHINGTON, D.C. 20549
FORM 10-K
ANNUAL REPORT PURSUANT TO SECTION 13 OR 15(d) OF THE SECURITIES EXCHANGE ACT OF 1934
For the fiscal year ended December 31, 2021
or
TRANSITION REPORT PURSUANT TO SECTION 13 OR 15(d) OF THE SECURITIES EXCHANGE ACT OF 1934
For the transition period from to
Commission file number 0-12014
IMPERIAL OIL LIMITED (Exact name of registrant as specified in its charter)
CANADA (State or other jurisdiction of incorporation or organization)
98-0017682 (I.R.S. Employer Identification No.)
505 QUARRY PARK BOULEVARD S.E., CALGARY, AB, CANADA
(Address of principal executive offices) T2C 5N1
(Postal Code)
1-800-567-3776 (Registrant’s telephone number, including area code)
Securities registered pursuant to Section 12(b) of the Act:
Title of each class
Trading symbol
Name of each exchange on
which registered
None None
Securities registered pursuant to Section 12(g) of the Act:
Common Shares (without par value)
(Title of Class)
Indicate by check mark if the registrant is a well-known seasoned issuer (as defined in Rule 405 of the Securities Act). Yes � No......
Indicate by check mark if the registrant is not required to file reports pursuant to Section 13 or Section 15(d) of the Securities Exchange Act of 1934. Yes...... No
Indicate by check mark whether the registrant (1) has filed all reports required to be filed by Section 13 or 15(d) of the Securities Exchange Act of 1934 during the preceding 12 months (or for such shorter period that the registrant was required to file such reports), and (2) has been subject to such filing requirements for the past 90 days. Yes � No......
Indicate by check mark whether the registrant has submitted electronically every Interactive Data File required to be submitted pursuant to Rule 405 of Regulation S-T (§ 232.405 of this chapter) during the preceding 12 months (or for such shorter period that the registrant was required to submit and post such files). Yes � No......
Indicate by check mark whether the registrant is a large accelerated filer, an accelerated filer, a non-accelerated filer, a smaller reporting company, or an emerging growth company. See the definitions of "large accelerated filer", "accelerated filer", "smaller reporting company" and "emerging growth company" in Rule 12b-2 of the Securities Exchange Act of 1934. Large accelerated filer � Smaller reporting company...... Accelerated filer...... Emerging growth company...... Non-accelerated filer...... If an emerging growth company, indicate by check mark if the registrant has elected not to use the extended transition period for complying with any new or revised financial accounting standards provided pursuant to Section 13(a) of the Exchange Act……
Indicate by check mark whether the registrant has filed a report on and attestation to its management’s assessment of the effectiveness of its internal control over financial reporting under Section 404(b) of the Sarbanes-Oxley Act (15 U.S.C. 7262(b)) by the registered public accounting firm that prepared or issued its audit report. �
Indicate by check mark whether the registrant is a shell company (as defined in Rule 12 b-2 of the Securities Exchange Act of 1934). Yes..... No �
As of the last business day of the 2021 second fiscal quarter, the aggregate market value of the voting stock held by non-affiliates of the registrant was Canadian $8,092,185,812 based upon the reported last sale price of such stock on the Toronto Stock Exchange on that date. The number of common shares outstanding, as of February 15, 2022, was 669,143,714.

2
Table of contents Page PART I ................................................................................................................................................................................. 5 Item 1. Business ................................................................................................................................................................ 5
Upstream ........................................................................................................................................................... 6 Disclosure of reserves ................................................................................................................................ 6 Proved undeveloped reserves .................................................................................................................... 8 Oil and gas production, production prices and production costs ................................................................ 9 Drilling and other exploratory and development activities ......................................................................... 11 Present activities ...................................................................................................................................... 13 Delivery commitments .............................................................................................................................. 13 Oil and gas properties, wells, operations and acreage ............................................................................. 14
Downstream .................................................................................................................................................... 16 Supply and trading .................................................................................................................................... 16 Transportation .......................................................................................................................................... 16 Refining .................................................................................................................................................... 16 Distribution................................................................................................................................................ 16 Marketing .................................................................................................................................................. 17
Chemical .......................................................................................................................................................... 17 Human capital resources ................................................................................................................................. 18 Competition ..................................................................................................................................................... 18 Government regulations .................................................................................................................................. 19 The company online ........................................................................................................................................ 21
Item 1A. Risk factors ......................................................................................................................................................... 22 Item 1B. Unresolved staff comments ................................................................................................................................. 31 Item 2. Properties ............................................................................................................................................................ 31 Item 3. Legal proceedings ............................................................................................................................................... 31 Item 4. Mine safety disclosures ....................................................................................................................................... 31 PART II .............................................................................................................................................................................. 32 Item 5. Market for registrant’s common equity, related stockholder matters and issuer purchases of equity securities .. 32 Item 7. Management’s discussion and analysis of financial condition and results of operations ..................................... 33 Item 7A. Quantitative and qualitative disclosures about market risk .................................................................................. 33 Item 8. Financial statements and supplementary data .................................................................................................... 34 Item 9. Changes in and disagreements with accountants on accounting and financial disclosure .................................. 34 Item 9A. Controls and procedures ..................................................................................................................................... 34 Item 9B. Other information ................................................................................................................................................ 34 Item 9C. Disclosure regarding foreign jurisdiction that prevents inspections .................................................................... 34 PART III ............................................................................................................................................................................. 35 Item 10. Directors, executive officers and corporate governance ...................................................................................... 35 Item 11. Executive compensation ...................................................................................................................................... 35 Item 12. Security ownership of certain beneficial owners and management and related stockholder matters .................. 36 Item 13. Certain relationships and related transactions, and director independence ......................................................... 37 Item 14. Principal accountant fees and services................................................................................................................ 38 PART IV ............................................................................................................................................................................ 39 Item 15. Exhibits, financial statement schedules ............................................................................................................... 39 Item 16. Form 10-K summary ............................................................................................................................................ 40 SIGNATURES ................................................................................................................................................................... 41 Financial section ................................................................................................................................................................ 42 Proxy information section ................................................................................................................................................ 111
All dollar amounts set forth in this report are in Canadian dollars, except where otherwise indicated. Note that numbers may not add due to rounding.

3
Forward-looking statements
Statements of future events or conditions in this report, including projections, targets, expectations, estimates, and business plans are forward-looking statements. Forward-looking statements can be identified by words such as believe, anticipate, intend, propose, plan, goal, seek, project, predict, target, estimate, expect, strategy, outlook, schedule, future, continue, likely, may, should, will and similar references to future periods. Forward-looking statements in this report include, but are not limited to, references to estimates, development, timing and recovery of reserves; the improvement of recovery through experimental operations; the development drilling program at Cold Lake; the timing, cost, efficiency and production of the Aspen project and expansion project at Cold Lake; the continued evaluation of other oil sands leases and unconventional assets; the company’s intention to market its interest in XTO Energy Canada, and operations continuing as normal throughout marketing process and if it does not result in a sale; the upstream focus on key oil sands assets; future activities with respect to Beaufort Sea licences; the impact of the Kearl Boiler Flue Gas heat recovery unit, and potential further investment in this technology; the ability to capture additional synergies from the operatorship transition at Syncrude; the ability of rail infrastructure to mitigate pipeline capacity constraints; human capital resources strategy and impact; anticipated capital, exploration and operating expenditures, including with respect to environmental protection; continued evaluation of the company’s share purchase program; being well positioned to participate in future investments and reduce commodity price risk; the company’s long-term business outlook including demand, supply and energy mix and pathways related to greenhouse gas emissions; Imperial’s Scope 1 and 2 net zero goal by 2050 and the company’s greenhouse gas emissions intensity goals for 2023 and 2030 for its oil sands operations; the impact of participation in the Oil Sands Pathways to Net Zero alliance; market uncertainty and the extent of ongoing effects of the COVID-19 pandemic on economic activity and supply and demand; the impact of measures implemented by the company in response to COVID-19; inflation and uncertainty in global economic recovery, and the company’s ability to mitigate related cost impacts; segment growth, competitive strategies and benefits from an integrated business model; the ability of the company’s current investment strategy of value and select volume growth to deliver robust returns and support long term growth; continued evaluation of opportunities such rail shipments and pace of the Aspen project; the impact of Downstream strategies and competitive position; potential impacts from environmental risks, carbon policy, climate related regulations and biofuels mandates; the benefits to the Chemical business from integration with the Sarnia refinery and relationship with ExxonMobil; capital structure and financial strength as a competitive advantage, for risk mitigation and meeting funding requirements; expected full year capital expenditures of about $1.4 billion for 2022; earnings sensitivities; risks associated with use of derivative instruments; the impact of any pending litigation, accounting standards and unrecognized tax benefits; standardized measures of discounted future cash flows; anticipated productivity and greenhouse gas emissions intensity benefits from the LASER project at Cold Lake; the impact of the Sarnia products pipeline; and plans to construct a renewable diesel facility at Strathcona, including timing of a final investment decision. Forward-looking statements are based on the company's current expectations, estimates, projections and assumptions at the time the statements are made. Actual future financial and operating results, including expectations and assumptions concerning future energy demand, supply and mix; commodity prices, foreign exchange rates and general market conditions; production rates, growth and mix across various assets; project plans, timing, costs, technical evaluations and capacities, and the company’s ability to effectively execute on these plans and operate its assets; production life, resource recoveries and reservoir performance; plans to mitigate climate risk and the resilience of company strategy to a range of pathways for society’s energy transition; the adoption and impact of new facilities or technologies on capital efficiency, production and reductions to greenhouse gas emissions intensity, including but not limited to next generation technologies using solvents to replace energy intensive steam at Cold Lake, boiler flue gas technology at Kearl, Strathcona’s renewable diesel complex and support for and advancement of carbon capture and storage, and any changes in the scope, terms, or costs of such projects; the amount and timing of emissions reductions; that any required support from policymakers and other stakeholders for various new technologies such as carbon capture and storage will be provided; applicable laws and government policies, including taxation, restrictions in response to COVID-19 and with respect to climate change and greenhouse gas emissions reductions; receipt of regulatory approvals; performance of third-party service providers; refinery utilization and product sales; cash generation, financing sources and capital structure, such as dividends and shareholder returns, including the timing and amounts of share repurchases; capital and environmental expenditures; evolution of COVID-19 and its impacts on Imperial’s ability to operate its assets; and the company’s ability to effectively execute on its business continuity plans and pandemic response activities could differ materially depending on a number of factors.

4
These factors include global, regional or local changes in supply and demand for oil, natural gas, petroleum and petrochemical products, feedstocks and other market or economic conditions and resulting demand, price, differential and margin impacts; transportation for accessing markets; political or regulatory events, including changes in law or government policy, applicable royalty rates, tax laws, and actions in response to COVID-19; environmental risks inherent in oil and gas activities; environmental regulation, including climate change and greenhouse gas regulation and changes to such regulation; failure or delay of supportive policy and market development for emerging lower emission energy technologies; the receipt, in a timely manner, of regulatory and third-party approvals; third-party opposition to company and service provider operations, projects and infrastructure; availability and allocation of capital; availability and performance of third-party service providers, including in light of restrictions related to COVID-19; unanticipated technical or operational difficulties; management effectiveness and disaster response preparedness, including business continuity plans in response to COVID-19; commercial negotiations; project management and schedules and timely completion of projects; unexpected technological developments; the results of research programs and new technologies, including with respect to greenhouse gas emissions, and the ability to bring new technologies to commercial scale on a cost-competitive basis; reservoir analysis and performance; the ability to develop or acquire additional reserves; operational hazards and risks; cybersecurity incidents; currency exchange rates; the pace of regional and global economic recovery from the COVID-19 pandemic and the occurrence and severity of future outbreaks and variants; general economic conditions, including the occurrence and duration of economic recessions; and other factors discussed in Item 1A “Risk factors” and Item 7 “Management’s discussion and analysis of financial condition and results of operations” in this annual report on Form 10-K. Forward-looking statements are not guarantees of future performance and involve a number of risks and uncertainties, some that are similar to other oil and gas companies and some that are unique to Imperial Oil Limited. Imperial Oil Limited’s actual results may differ materially from those expressed or implied by its forward-looking statements and readers are cautioned not to place undue reliance on them. Imperial Oil Limited undertakes no obligation to update any forward-looking statements contained herein, except as required by applicable law. Energy demand models are forward-looking by nature and aim to replicate system dynamics of the global energy system, requiring simplifications. The reference to any scenario in this report, including any potential net-zero scenarios, does not imply Imperial views any particular scenario as likely to occur. In addition, energy demand scenarios require assumptions on a variety of parameters. As such, the outcome of any given scenario using an energy demand model comes with a high degree of uncertainty. For example, the IEA describes its NZE scenario as extremely challenging, requiring unprecedented innovation, unprecedented international cooperation and sustained support and participation from consumers. Third-party scenarios discussed in this report reflect the modeling assumptions and outputs of their respective authors, not Imperial, and their use by Imperial is not an endorsement by the company of their underlying assumptions, likelihood or probability. Investment decisions are made on the basis of Imperial’s separate planning process, but may be secondarily tested for robustness or resiliency against different assumptions, including against various scenarios. Any use of the modeling of a third-party organization within this report does not constitute or imply an endorsement by Imperial of any or all of the positions or activities of such organization. The term "project" as used in this report can refer to a variety of different activities and does not necessarily have the same meaning as in any government payment transparency reports.

5
PART I Item 1. Business Imperial Oil Limited was incorporated under the laws of Canada in 1880 and was continued under the Canada Business Corporations Act (the “CBCA”) by certificate of continuance dated April 24, 1978. The head and principal office of the company is located at 505 Quarry Park Boulevard S.E., Calgary, Alberta, Canada T2C 5N1. Exxon Mobil Corporation (“ExxonMobil”) owns approximately 69.6 percent of the outstanding shares of the company. In this report, unless the context otherwise indicates, reference to the “company” or “Imperial” includes Imperial Oil Limited and its subsidiaries, and reference to ExxonMobil includes Exxon Mobil Corporation and its affiliates, as appropriate. The company is one of Canada’s largest integrated oil companies. It is active in all phases of the petroleum industry in Canada, including the exploration for, and production and sale of, crude oil and natural gas. In Canada, it is a major producer of crude oil, the largest petroleum refiner, a leading marketer of petroleum products, and a major producer of petrochemicals. The company also pursues lower-emission business opportunities including carbon capture and storage and biofuels. The company’s operations are conducted in three main segments: Upstream, Downstream and Chemical. Upstream operations include the exploration for, and production of, crude oil, natural gas, synthetic oil and bitumen. Downstream operations consist of the transportation and refining of crude oil, blending of refined products and the distribution and marketing of those products. Chemical operations consist of the manufacturing and marketing of various petrochemicals. Operating data and financial information about the company’s business segments are contained in this report under the following: “Management’s discussion and analysis of financial condition and results of operations” and the “Financial section” under note 2 to the consolidated financial statements: “Business segments”.

6
Upstream
Disclosure of reserves Summary of oil and gas reserves at year-end The table below summarizes the net proved reserves for the company, as at December 31, 2021, as detailed in the "Supplemental information on oil and gas exploration and production activities" part of the “Financial section”, starting on page 42 of this report. All of the company's reported reserves are located in Canada. The company has reported proved reserves based on the average of the first-day-of-the-month price for each month during the last 12-month period ending December 31. Natural gas is converted to an oil-equivalent basis at six million cubic feet per one thousand barrels. No major discovery or other favourable or adverse event has occurred since December 31, 2021 that would cause a significant change in the estimated proved reserves as of that date.
Liquids (a) Natural gas Synthetic oil Bitumen
Total oil-equivalent
basis
millions of
barrels billions of cubic feet
millions of barrels
millions of barrels
millions of barrels
Net proved reserves:
Developed 14 205 326 1,957 2,331
Undeveloped 2 76 112 259 386
Total net proved 16 281 438 2,216 2,717
(a) Liquids include crude oil, condensate and natural gas liquids (NGLs). NGL proved reserves are not material and are therefore included under liquids.
The estimation of proved reserve volumes, which is based on the requirement of reasonable certainty, is an ongoing process based on rigorous technical evaluations, commercial and market assessments, detailed analysis of well information such as flow rates and reservoir pressures, and development and production costs, and other factors. Furthermore, the company only records proved reserves for projects which have received significant funding commitments by management made toward the development of the reserves. Although the company is reasonably certain that proved reserves will be produced, the timing and amount recovered can be affected by a number of factors, including completion and optimization of development projects, reservoir performance, regulatory approvals, government policies, consumer preferences, changes in the amount and timing of capital investments, royalty frameworks and significant changes in oil and gas price levels. In addition, proved reserves could be affected by an extended period of low prices which could reduce the level of the company’s capital spending and also impact its partners’ capacity to fund their share of joint projects. As a result of improved prices in 2021, under the U.S. Securities and Exchange Commission definition of proved reserves, an additional 1.7 billion barrels of bitumen at Kearl and 0.5 billion barrels of bitumen at Cold Lake qualified as proved reserves at year-end 2021.
7
Technologies used in establishing proved reserves estimates Imperial’s proved reserves in 2021 were based on estimates generated through the integration of available and appropriate geological, engineering and production data, utilizing well established technologies that have been demonstrated in the field to yield repeatable and consistent results. Data used in these integrated assessments included information obtained directly from the subsurface via wellbores, such as well logs, reservoir core samples, fluid samples, static and dynamic pressure information, production test data, and surveillance and performance information. The data utilized also included subsurface information obtained through indirect measurements, including seismic data, calibrated with available well control information. The tools used to interpret the data included seismic processing software, reservoir modeling and simulation software, and data analysis packages. In some circumstances, where appropriate analog reservoirs were available, reservoir parameters from these analogs were used to increase the quality of and confidence in the reserves estimates.
Preparation of reserves estimates Imperial has a dedicated reserves management group that is separate from the base operating organization. Primary responsibilities of this group include oversight of the reserves estimation process for compliance with the U.S. Securities and Exchange Commission rules and regulations, review of annual changes in reserves estimates and the reporting of Imperial's proved reserves. This group also maintains the official reserves estimates for Imperial’s proved reserves. In addition, this group provides training to personnel involved in the reserve estimation and reporting processes within Imperial. The reserves management group maintains a central database containing the company’s official reserves estimates. Appropriate controls, including limitations on database access and update capabilities, are in place to ensure data integrity within this central database. An annual review of the system's controls is performed by internal audit. Key components of the reserves estimation process include technical evaluations, commercial and market assessments, analysis of well and field performance, and long standing approval guidelines. No changes may be made to reserves estimates in the central database, including the addition of any new initial reserves estimates or subsequent revisions, unless those changes have been thoroughly reviewed and evaluated by duly authorized personnel within the base operating organization. In addition, changes to reserves estimates that exceed certain thresholds require further review and endorsement by the operating organization and the reserves management group, culminating in reviews with and approval by senior management and the company’s board of directors. The internal qualified reserves evaluator is a professional geoscientist registered in Alberta, Canada and has 19 years of petroleum industry experience, including 10 years of reserves related experience. The position provides leadership to the internal reserves management group and is responsible for filing a reserves report with the Canadian securities regulatory authorities. The company's internal reserves evaluation staff consists of 25 persons with an average of 11 years of relevant technical experience in evaluating reserves, of whom 22 persons are qualified reserves evaluators for purposes of Canadian securities regulatory requirements. The company's internal reserves evaluation management team is made up of 13 persons with an average of 11 years of relevant experience in evaluating and managing the evaluation of reserves.

8
Proved undeveloped reserves As at December 31, 2021, approximately 14 percent of the company's proved reserves were proved undeveloped reflecting volumes of 386 million oil-equivalent barrels. Proved undeveloped reserves are associated with Syncrude, Cold Lake, and the Montney and Duvernay unconventional assets. This compared to 138 million oil-equivalent barrels of proved undeveloped reserves reported at the end of 2020. The increase of 248 million oil-equivalent barrels of proved undeveloped reserves includes an increase of 262 million oil-equivalent barrels at Cold Lake, an increase of 6 million oil-equivalent barrels at the Montney and Duvernay unconventional assets, partially offset by a decrease of 20 million oil-equivalent barrels at Syncrude. Conversion of proved undeveloped reserves into proved developed was 34 million oil-equivalent barrels during 2021, associated with Cold Lake and the Montney and Duvernay unconventional assets. Proved undeveloped reserves that have remained undeveloped for five years or more represent about 53 percent (204 million oil-equivalent barrels) of proved undeveloped reserves and are associated with ongoing development programs at Cold Lake. These undeveloped reserves are planned to be developed in a staged approach to align with operational capacity and efficient capital spending commitment over the life of the asset. The company is reasonably certain that these proved reserves will be produced; however the timing and amount recovered can be affected by a number of factors including completion and optimization of development projects, reservoir performance, regulatory approvals, government policies, consumer preferences, changes in the amount and timing of capital investments, royalty frameworks and significant changes in oil and gas price levels. One of the company's requirements to report resources as proved reserves is that management has made significant funding commitments towards the development of the reserves. The company has a disciplined investment strategy and many major fields require a long lead-time in order to be developed. The company made investments of about $124 million during the year to progress the development of proved undeveloped reserves at Cold Lake, Syncrude and the Montney and Duvernay unconventional assets. These investments represented about 20 percent of the $632 million in total reported Upstream capital and exploration expenditures.

9
Oil and gas production, production prices and production costs Reference is made to the portion of the “Financial section” entitled “Management’s discussion and analysis of financial condition and results of operations” on page 48 of this report for a narrative discussion on the material changes.
Average daily production of oil The company’s average daily oil production by final products sold during the three years ended December 31, 2021 was as follows. All reported production volumes were from Canada.
thousands of barrels per day (a) 2021 2020 2019
Bitumen:
Kearl: - gross (b) 186 158 145
- net (c) 178 155 140
Cold Lake: - gross (b) 140 132 140
- net (c) 114 124 114
Total bitumen: - gross (b) 326 290 285
- net (c) 292 279 254
Synthetic oil (d): - gross (b) 71 69 73
- net (c) 62 68 65
Liquids (e): - gross (b) 11 13 16 - net (c) 10 12 14
Total: - gross (b) 408 372 374
- net (c) 364 359 333 (a) Volume per day metrics are calculated by dividing the volume for the period by the number of calendar days in the period.
(b) Gross production is the company’s share of production (excluding purchases) before deduction of the mineral owners’ or governments’ share or both.
(c) Net production is gross production less the mineral owners’ or governments’ share or both.
(d) The company's synthetic oil production volumes were from the company's share of production volumes in the Syncrude joint venture.
(e) Liquids include crude oil, condensate and NGLs.
Average daily production and production available for sale of natural gas The company’s average daily production and production available for sale of natural gas during the three years ended December 31, 2021 are set forth below. All reported production volumes were from Canada. All gas volumes in this report are calculated at a pressure base of 14.73 pounds per square inch absolute at 60 degrees Fahrenheit. Reference is made to the portion of the “Financial section” entitled “Management’s discussion and analysis of financial condition and results of operations” on page 48 of this report for a narrative discussion on the material changes.
millions of cubic feet per day (a) 2021 2020 2019
Gross production (b) (c) 120 154 145
Net production (c) (d) (e) 115 150 144
Net production available for sale (f) 81 115 108
(a) Volume per day metrics are calculated by dividing the volume for the period by the number of calendar days in the period.
(b) Gross production is the company’s share of production (excluding purchases) before deduction of the mineral owners’ or governments’ share or both.
(c) Production of natural gas includes amounts used for internal consumption with the exception of the amounts reinjected.
(d) Net production is gross production less the mineral owners’ or governments’ share or both.
(e) Net production reported in the above table is consistent with production quantities in the net proved reserves disclosure.
(f) Includes sales of the company’s share of net production and excludes amounts used for internal consumption.

10
Total average daily oil-equivalent basis production The company’s total average daily production expressed in an oil-equivalent basis is set forth below, with natural gas converted to an oil-equivalent basis at six million cubic feet per one thousand barrels. thousands of barrels per day (a) 2021 2020 2019
Total production oil-equivalent basis:
- gross (b) 428 398 398
- net (c) 383 384 357 (a) Volume per day metrics are calculated by dividing the volume for the period by the number of calendar days in the period.
(b) Gross production is the company’s share of production (excluding purchases) before deduction of the mineral owners’ or governments’ share or both.
(c) Net production is gross production less the mineral owners’ or governments’ share or both.
Average unit sales price The company’s average unit sales price and average unit production costs by product type for the three years ended December 31, 2021 were as follows.
Canadian dollars per barrel 2021 2020 2019
Bitumen 57.91 25.69 50.02
Synthetic oil 81.61 49.76 74.47
Liquids (a) 59.41 27.40 42.91
Canadian dollars per thousand cubic feet
Natural gas 3.83 1.90 2.05
(a) Liquids include crude oil, condensate and NGLs.
In 2021, Imperial’s average Canadian dollar realizations for bitumen increased generally in line with Western Canada Select (WCS). The company’s average Canadian dollar realizations for synthetic crude increased generally in line with West Texas Intermediate (WTI), adjusted for changes in exchange rates and transportation costs.
In 2020, Imperial's average Canadian dollar realizations for bitumen decreased primarily due to a decrease in WCS. The company's average Canadian dollar realizations for synthetic crude decreased generally in line with WTI, adjusted for changes in exchange rates and transportation costs.
Average unit production costs
Canadian dollars per barrel 2021 2020 2019
Bitumen 29.06 25.73 31.53
Synthetic oil 61.97 45.51 54.44
Total oil-equivalent basis (a) 34.32 28.73 34.82 (a) Includes liquids, bitumen, synthetic oil and natural gas.
In 2021, bitumen unit production costs were higher, primarily driven by higher energy costs. In 2021, synthetic oil unit production costs were higher, primarily driven by higher maintenance costs and mine tailings spend. In 2020, bitumen unit production costs were lower, primarily driven by higher Kearl production due to improved reliability and reduced downtime related to the addition of supplemental crushing facilities in 2020, and cost saving activities in response to market conditions. In 2020, synthetic oil unit production costs were lower, primarily driven by cost saving activities in response to market conditions.

11
Drilling and other exploratory and development activities The company has been involved in the exploration for and development of crude oil and natural gas in Canada only.
Wells drilled The following table sets forth the net exploratory and development wells that were drilled or participated in by the company during the three years ended December 31, 2021. wells 2021 2020 2019
Net productive exploratory - - -
Net dry exploratory - - -
Net productive development 13 29 28
Net dry development - - -
Total 13 29 28
In 2021, wells drilled to add productive capacity include 12 development wells at Cold Lake and 1 well associated with the Montney and Duvernay unconventional assets. In 2020, wells drilled to add productive capacity include 28 development wells at Cold Lake and 1 well associated with the Montney and Duvernay unconventional assets. In 2019, wells drilled to add productive capacity include 14 development wells at Cold Lake and 14 wells associated with the Montney and Duvernay unconventional assets.
Wells drilling At December 31, 2021, the company was participating in the drilling of the following exploratory and development wells within the Montney and Duvernay unconventional assets. All wells were located in Canada. 2021 Wells Gross Net Total 16 7
Exploratory and development activities regarding oil and gas resources Cold Lake To maintain production at Cold Lake, capital expenditures for additional production wells and associated facilities are required periodically. In 2021, additional wells were drilled on existing phases. In 2022, a development drilling program is planned within the approved development area to add productive capacity. The company also conducts experimental pilot operations to improve recovery of bitumen from wells by means of new drilling, production or recovery techniques. Aspen, Cold Lake expansion and other oil sands activities In October 2018, the company received regulatory approval for the Aspen solvent-assisted, steam-assisted gravity drainage (SA-SAGD) project from the Alberta Energy Regulator. Development was proposed to occur in two phases, each producing about 75,000 barrels per day, before royalties. The first phase of the project was approved by the company’s board, and appropriated for $2.6 billion. Construction began late in the fourth quarter of 2018. In March 2019, the company slowed the pace of development given market uncertainty stemming from the Government of Alberta’s temporary mandatory production curtailment regulations and other industry competitiveness challenges. Although the Government of Alberta repealed the regulatory authority for imposing temporary production curtailments at the end of 2021, major investment remains on hold. Aspen’s project pace will continue to be evaluated and remains an important opportunity for Imperial.

12
In August 2018, Imperial received regulatory approval from the Alberta Energy Regulator for an expansion project at Cold Lake to develop the Grand Rapids interval using SA-SAGD technology, capable of producing 50,000 barrels per day before royalties. Imperial intends to develop the Grand Rapids reservoir through capital-efficient investments that make use of available steam capacity from existing plants, with the initial phase of Grand Rapids development planned as an extension from the Nabiye plant. Imperial continues to progress this opportunity. Work progresses on technical and technology evaluations to support potential Clarke Creek, Corner, Clyden and Chard in-situ development regulatory applications. The company also has interests in other oil sands leases in the Athabasca region of northern Alberta. Evaluation wells completed on these leased areas established the presence of bitumen. The company continues to evaluate these leases to determine their potential for future development. Montney and Duvernay The company owns a 50 percent interest in XTO Energy Canada which includes the Montney and Duvernay unconventional assets located in central Alberta. In 2020, the company ramped down development drilling and revised long-term development plans to exclude a significant portion of the non-core, non-producing and undeveloped areas of the Montney and Duvernay unconventional assets. In 2021, the company resumed limited drilling activity to develop select portions of the acreage with other operators. In January 2022, Imperial announced its intention to market its interest in XTO Energy Canada jointly with ExxonMobil Canada, consistent with Imperial’s strategy to focus its upstream resources and efforts on its key oil sands assets. A definitive decision to sell the Montney and Duvernay unconventional assets has not been made. Operations will continue as normal throughout the marketing process and should the process not result in a sale. XTO Energy Canada net production from these assets is about 140 million cubic feet of natural gas per day and about 9,000 barrels per day of crude, condensate and natural gas liquids. Beaufort Sea The company holds a 25 percent interest in two exploration licences in the Beaufort Sea. In 2016, the Federal Government of Canada declared Arctic waters off limits to new offshore oil and gas licences for five years subject to review at the end of that period. Existing licences were not impacted. In June 2019, the Federal Government approved selective changes to the Canada Petroleum Resources Act to prohibit and freeze the existing licences through the completion of the Beaufort Sea Regional Environmental Assessment (BR-SEA) review. In 2021, the prohibition was extended until December 31, 2022, during which time the Federal Government will continue to consult with stakeholders as part of the BR-SEA review to address regional social, environmental, economic and spill response impacts of natural resource development in the Arctic. The company continues to hold the licences while maintaining community engagement and participation in the BR-SEA process.
Exploratory and development activities regarding oil and gas resources extracted by mining methods The company continues to evaluate other undeveloped, mineable oil sands acreage in the Athabasca region.

13
Present activities Review of principal ongoing activities Kearl Kearl is a joint venture established to recover shallow deposits of oil sands using open-pit mining methods to extract the crude bitumen, which is processed through extraction and froth treatment trains. The company holds a 70.96 percent participating interest in the joint venture and ExxonMobil Canada Properties holds the other 29.04 percent. The product, a blend of bitumen and diluent, is typically shipped to the company’s refineries, Exxon Mobil Corporation refineries and to other third parties. Diluent is natural gas condensate or other light hydrocarbons added to the crude bitumen to facilitate transportation by pipeline and rail. During 2021, the company’s share of Kearl’s net bitumen production was about 178,000 barrels per day and gross production was about 186,000 barrels per day. Total gross production for Kearl was about 263,000 barrels per day (186,000 barrels Imperial’s share), setting a new record for Kearl and continuing multi-year improvements in reliability, costs and performance. Total gross production increased about 41,000 barrels per day (28,000 barrels Imperial’s share) compared to 2020, which was the asset’s previous annual production record. Increased production was primarily driven by the absence of prior year production balancing with market demands, supported by the supplemental crushers and other reliability improvements. Kearl also eliminated its fall turnaround and transitioned to a single annual turnaround, one year ahead of schedule. Kearl successfully started up the first Kearl Boiler Flue Gas heat recovery unit in 2021. This technology recovers waste heat from a boiler’s combustion exhaust to pre-heat process water. This not only has the potential to reduce operating costs, but also emissions by up to 30,000 tonnes / year of carbon dioxide equivalent. Imperial is currently progressing plans to apply this innovative technology on up to five additional boilers. Cold Lake Cold Lake is an in-situ heavy oil bitumen operation. The product, a blend of bitumen and diluent, is typically shipped to the company’s refineries, Exxon Mobil Corporation refineries and to other third parties. During 2021, net bitumen production at Cold Lake was about 114,000 barrels per day and gross production was about 140,000 barrels per day. Gross production increased about 8,000 barrels per day compared to 2020 as a result of improved reliability, production optimizations, and recent capital-efficient infill drilling. Syncrude Syncrude is a joint venture established to recover shallow deposits of oil sands using open-pit mining methods to extract crude bitumen, and then upgrade it to produce a high-quality, light (32 degrees API), sweet, synthetic crude oil. The company holds a 25 percent participating interest in the joint venture. The produced synthetic crude oil is typically shipped to the company’s refineries, Exxon Mobil Corporation refineries and to other third parties. In 2021, the company’s share of Syncrude's net production of synthetic crude oil was about 62,000 barrels per day and gross production was about 71,000 barrels per day. On September 30, 2021, operatorship successfully transferred from Syncrude Canada to Suncor. With the transition complete, additional synergies are expected to be captured, in an effort to maximize profitability and improve reliability. The Province of Alberta, in its capacity as lessor of Kearl, Cold Lake, and Syncrude oil sands leases, is entitled to a royalty on production. Royalties are subject to the oil sands royalty regulations which are based upon a sliding scale determined largely by the price of crude oil.
Delivery commitments The company has no material commitments to provide a fixed and determinable quantity of oil or gas under existing contracts and agreements.
14
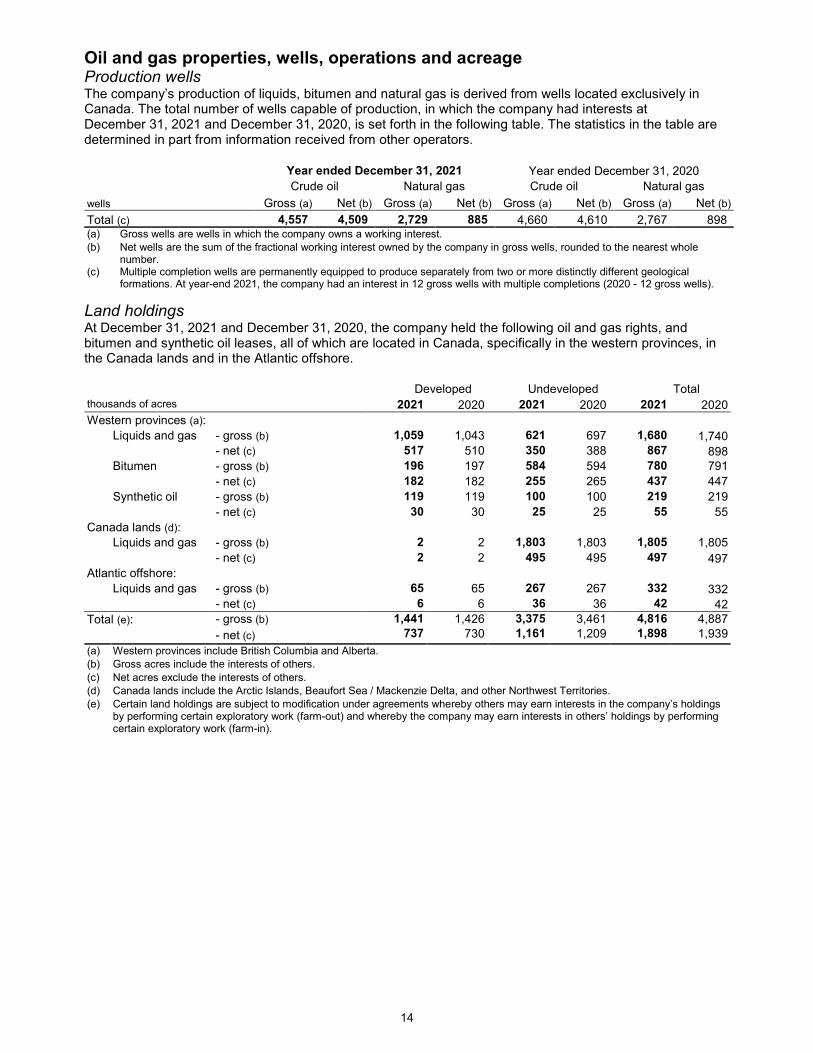
Oil and gas properties, wells, operations and acreage Production wells The company’s production of liquids, bitumen and natural gas is derived from wells located exclusively in Canada. The total number of wells capable of production, in which the company had interests at December 31, 2021 and December 31, 2020, is set forth in the following table. The statistics in the table are determined in part from information received from other operators. Year ended December 31, 2021 Year ended December 31, 2020
Crude oil Natural gas Crude oil Natural gas
wells Gross (a) Net (b) Gross (a) Net (b) Gross (a) Net (b) Gross (a) Net (b)
Total (c) 4,557 4,509 2,729 885 4,660 4,610 2,767 898 (a) Gross wells are wells in which the company owns a working interest.
(b) Net wells are the sum of the fractional working interest owned by the company in gross wells, rounded to the nearest whole number.
(c) Multiple completion wells are permanently equipped to produce separately from two or more distinctly different geological formations. At year-end 2021, the company had an interest in 12 gross wells with multiple completions (2020 - 12 gross wells).
Land holdings At December 31, 2021 and December 31, 2020, the company held the following oil and gas rights, and bitumen and synthetic oil leases, all of which are located in Canada, specifically in the western provinces, in the Canada lands and in the Atlantic offshore. Developed Undeveloped Total thousands of acres 2021 2020 2021 2020 2021 2020
Western provinces (a):
Liquids and gas - gross (b) 1,059 1,043 621 697 1,680 1,740
- net (c) 517 510 350 388 867 898
Bitumen - gross (b) 196 197 584 594 780 791
- net (c) 182 182 255 265 437 447
Synthetic oil - gross (b) 119 119 100 100 219 219
- net (c) 30 30 25 25 55 55
Canada lands (d):
Liquids and gas - gross (b) 2 2 1,803 1,803 1,805 1,805
- net (c) 2 2 495 495 497 497 Atlantic offshore:
Liquids and gas - gross (b) 65 65 267 267 332 332 - net (c) 6 6 36 36 42 42
Total (e): - gross (b) 1,441 1,426 3,375 3,461 4,816 4,887
- net (c) 737 730 1,161 1,209 1,898 1,939
(a) Western provinces include British Columbia and Alberta.
(b) Gross acres include the interests of others.
(c) Net acres exclude the interests of others. (d) Canada lands include the Arctic Islands, Beaufort Sea / Mackenzie Delta, and other Northwest Territories. (e) Certain land holdings are subject to modification under agreements whereby others may earn interests in the company’s holdings
by performing certain exploratory work (farm-out) and whereby the company may earn interests in others’ holdings by performing certain exploratory work (farm-in).

15
Western provinces The company's bitumen leases include about 161,000 net acres of oil sands leases near Cold Lake and an area of about 34,000 net acres at Kearl. The company also has about 68,000 net acres of undeveloped, mineable oil sands acreage in the Athabasca region. In addition, the company has interests in other bitumen oil sands leases in the Athabasca areas totalling about 173,000 net acres, which include about 62,000 net acres of oil sands leases in the Clyden area, about 34,000 net acres of oil sands leases in the Aspen area, about 30,000 net acres of oil sands leases in the Corner area, about 29,000 net acres in the Clarke Creek area and about 18,000 net acres in the Chard area. The 173,000 net acres are suitable for in-situ recovery techniques. The company's share of Syncrude joint venture leases covering about 55,000 net acres accounts for the entire synthetic oil acreage. Oil sands leases have an exploration period of 15 years and are continued beyond that point by payment of escalating rentals or by production. The majority of the acreage in Cold Lake, Kearl and Syncrude is continued by production. The company holds interests in an additional 867,000 net acres of developed and undeveloped land in the western provinces related to crude oil and natural gas, including about 369,000 net acres associated with the company’s unconventional portfolio in Alberta. These interests include lands that are part of Imperial’s recent announcement to market its interest in XTO Energy Canada jointly with ExxonMobil Canada. XTO Energy Canada assets include 568,000 net acres in the Montney shale, 85,000 net acres in the Duvernay shale and additional acreage in other areas of Alberta; Imperial owns a 50 percent interest in XTO Energy Canada. This is consistent with Imperial’s strategy to focus its upstream resources and efforts on its key oil sands assets. Crude oil and natural gas leases and licences from the western provinces have exploration periods ranging from two to 15 years and are continued beyond that point by proven production capability. Canada lands Land holdings in Canada lands primarily include exploration licence (EL) acreage in the Beaufort Sea of about 252,000 net acres and significant discovery licence (SDL) acreage in the Mackenzie Delta and Beaufort Sea areas of about 183,000 net acres. Exploration licences on Canada lands have a finite term. If a significant discovery is made, a SDL may be granted that holds the acreage under the SDL indefinitely, subject to certain conditions. The company’s net acreage in Canada lands is either continued by production or held through ELs and SDLs. Atlantic offshore Exploration licences on Atlantic offshore have a finite term. The Atlantic offshore acreage is continued by production licences or held by SDLs.
16
Downstream Supply and trading The company supplements its own production of crude oil, condensate and petroleum products with substantial purchases from a number of other sources at negotiated market prices, in addition to undertaking trading activities. Purchases and sales are made under both spot and term contracts from domestic and foreign sources, including ExxonMobil.
Transportation Imperial currently transports the company’s crude oil production and third-party crude oil required to supply refineries by contracted pipelines, common carrier pipelines and rail. To mitigate pipeline capacity constraints, the company has developed rail infrastructure. The Edmonton rail terminal has total capacity to ship up to 210,000 barrels per day of crude oil.
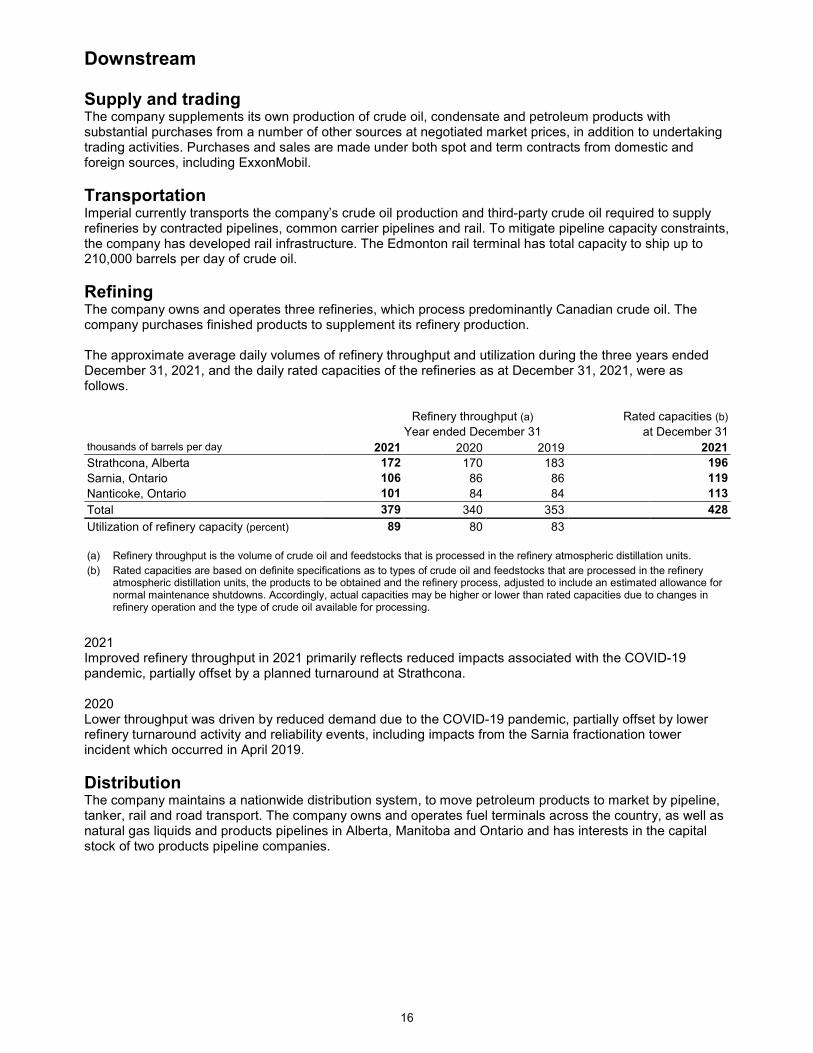
Refining The company owns and operates three refineries, which process predominantly Canadian crude oil. The company purchases finished products to supplement its refinery production. The approximate average daily volumes of refinery throughput and utilization during the three years ended December 31, 2021, and the daily rated capacities of the refineries as at December 31, 2021, were as follows.
Refinery throughput (a) Rated capacities (b)
Year ended December 31 at December 31 thousands of barrels per day 2021 2020 2019 2021
Strathcona, Alberta 172 170 183 196
Sarnia, Ontario 106 86 86 119
Nanticoke, Ontario 101 84 84 113
Total 379 340 353 428
Utilization of refinery capacity (percent) 89 80 83
(a) Refinery throughput is the volume of crude oil and feedstocks that is processed in the refinery atmospheric distillation units.
(b) Rated capacities are based on definite specifications as to types of crude oil and feedstocks that are processed in the refinery atmospheric distillation units, the products to be obtained and the refinery process, adjusted to include an estimated allowance for normal maintenance shutdowns. Accordingly, actual capacities may be higher or lower than rated capacities due to changes in refinery operation and the type of crude oil available for processing.
2021 Improved refinery throughput in 2021 primarily reflects reduced impacts associated with the COVID-19 pandemic, partially offset by a planned turnaround at Strathcona. 2020 Lower throughput was driven by reduced demand due to the COVID-19 pandemic, partially offset by lower refinery turnaround activity and reliability events, including impacts from the Sarnia fractionation tower incident which occurred in April 2019.
Distribution The company maintains a nationwide distribution system, to move petroleum products to market by pipeline, tanker, rail and road transport. The company owns and operates fuel terminals across the country, as well as natural gas liquids and products pipelines in Alberta, Manitoba and Ontario and has interests in the capital stock of two products pipeline companies.

17
Marketing The company markets petroleum products throughout Canada under well-known brand names, most notably Esso and Mobil, to all types of customers. Imperial supplies petroleum products to the motoring public through Esso and Mobil-branded sites and independent marketers. At the end of 2021, there were about 2,400 sites operating under a branded wholesaler model whereby Imperial supplies fuel to independent third parties who own and operate sites in alignment with Esso and Mobil brand standards. Imperial also sells petroleum products, including fuel, asphalt and lubricants, to large industrial and transportation customers, independent marketers, resellers, as well as other refiners. The company serves agriculture, residential heating and commercial markets through branded fuel and lubricant resellers. The approximate daily volumes of net petroleum products (excluding purchases / sales contracts with the same counterparty) sold during the three years ended December 31, 2021, are set out in the following table. thousands of barrels per day 2021 2020 2019
Gasolines 224 215 249
Heating, diesel and jet fuels 160 146 167
Heavy fuel oils 27 20 21
Lube oils and other products 45 40 38
Net petroleum product sales 456 421 475
In 2021, improved petroleum product sales primarily reflects reduced impacts associated with the COVID-19 pandemic. In 2020, lower sales were primarily driven by reduced demand due to the COVID-19 pandemic.
Chemical The company’s Chemical operations manufacture and market benzene, aromatic and aliphatic solvents, plasticizer intermediates and polyethylene resin. Its petrochemical and polyethylene manufacturing operations are located in Sarnia, Ontario, adjacent to the company’s petroleum refinery. The company’s total petrochemical sales volumes during the three years ended December 31, 2021, were as follows. thousands of tonnes 2021 2020 2019
Total petrochemical sales 831 749 732
In 2021, sales volumes increased primarily due to higher sales of intermediates and aromatics. In 2020, sales volumes increased primarily due to higher sales of intermediates.
18
Human capital resources Imperial operates in a complex, competitive and changing business environment where decisions and risks play out over time horizons that are often decades in length. This long-term orientation underpins the company’s philosophy on talent development. Talent development begins with recruiting exceptional candidates and continues with individually planned experiences and training designed to facilitate broad development and a deep understanding of our business across the business cycle. The company’s compensation is market competitive, long-term oriented, and highly differentiated by individual performance. In addition, benefits and workplace programs support the company’s talent management approach, and are designed to attract and retain employees for a long-term career. Overall, this multifaceted approach has resulted in strong employee retention. Imperial views diversity as an opportunity. The company encourages and respects diversity of thought, ideas, and perspective in its workforce. The company considers diversity through all stages of employment including recruitment, training and development of its employees. Imperial’s goal is to reflect the mix and diversity of the communities where it operates, and it continues to focus on diverse representation at all levels of the organization. The number of regular employees was about 5,400 at the end of 2021 (2020 - 5,800, 2019 - 6,000). Regular employees are defined as active executive, management, professional, technical and wage employees who work full-time or part-time for the company and are covered by the company’s benefit plans and programs.
Competition The Canadian energy and petrochemical industries are highly competitive. Competition exists in the search for and development of new sources of supply, the construction and operation of crude oil, natural gas and refined products pipelines and facilities and the refining, distribution and marketing of petroleum products and chemicals. The energy and petrochemical industries also compete with other industries in supplying the energy, fuel and chemical needs of both industrial and individual consumers. Certain industry participants, including Imperial, are expanding investments in lower-emission energy and emission-reduction services and technologies.

19
Government regulations
Petroleum, natural gas and oil sands rights Most of the company’s petroleum, natural gas and oil sands rights were acquired from governments, either federal or provincial. These rights, in the form of leases or licences, are generally acquired for cash or work commitments. A lease or licence entitles the holder to explore for petroleum, natural gas and / or oil sands on the leased lands for a specified period. In western provinces, the lease holder can produce the petroleum or natural gas discovered on the leased lands and retains the rights based on continued production. Oil sands leases are retained by meeting the minimum level of evaluation, payment of rentals, or by production. The holder of a licence relating to Canada lands and the Atlantic offshore can apply for a SDL if a discovery is made. If granted, the SDL holds the lands indefinitely subject to certain conditions. The holder may then apply for a production licence in order to produce petroleum or natural gas from the licenced land.
Project approval Approvals and licences from relevant provincial or federal governmental or regulatory bodies are required for the company to carry out, or make modifications to, its oil and gas activities. The project approval process for major projects can involve, among other things, environmental assessments (including relevant mitigation measures), stakeholder and Indigenous consultation and input regarding project concerns, and public hearings. Approval may be subject to various conditions and commitments arising through these processes. In 2019, the Canadian government implemented a new environmental assessment framework in Canada under the Impact Assessment Act (IAA), which may impact the manner in which large energy projects are approved. The IAA includes broader consideration for social, health, and gender-based impacts, the impact on Canada’s climate change commitments (including a requirement under the Strategic Assessment for Climate Change to provide a credible plan for the project to deliver net-zero greenhouse gas emissions by 2050), reliance on strategic and regional assessments and adjusted regulatory review timelines.
Environmental protection The company regards protecting the environment in connection with its various operations as a priority. The company is subject to extensive environmental regulations in Canada that apply to all phases of exploration, development, operation, and final closure. These requirements cover the management and monitoring of potential environmental impacts during active operations, including practices for land disturbance, wildlife protection, specifications for equipment operation and material storage and limitations on discharges to the environment. It also includes conducting environmental surveys and collecting continuous operational measurements and sampling to confirm that environmental practices are adequately protecting the environment. These regulations also specify the actions and requirements for final reclamation, abandonment and closure of facilities. The company works in cooperation with government agencies, industry associations and communities to address existing, and to anticipate potential, environmental protection issues. The company also maintains extensive operating procedures, processes and emergency response plans to address environmental risks at its operations. As discussed in Item 1A. “Risk factors” in this report, compliance with existing and potential future government regulations, including environmental regulations, may have material effects on the capital expenditures, earnings, and competitive position of the company. Imperial takes new and ongoing measures throughout its operations each year to prevent and minimize the impact of its operations on air, land and water. These include significant investments in refining infrastructure and technology to manufacture clean fuels, continued evaluation and implementation of new technologies to reduce greenhouse gas emissions, adherence to federal and provincial greenhouse gas emissions reduction and reporting programs, enhanced water and land management, and expenditures for asset retirement obligations. In the past five years, the company has made capital and operating expenditures of about $3.7 billion on environmental protection and facilities. In 2021, the company’s environmental capital and operating expenditures totalled approximately $1.1 billion, which was spent primarily on activities to protect the air, land and water, including remediation projects. Capital and operating expenditures relating to environmental protection are expected to be about $1.0 billion in 2022.

20
Crude oil Production The maximum allowable gross production of crude oil from wells in Canada is subject to limitations by various regulatory authorities on the basis of engineering and conservation principles. Additionally, the Government of Alberta has in the past used temporary mandatory production curtailment regulations to impose production limits on large producers in Alberta. Mandatory production curtailments were implemented in January 2019 and eliminated in December 2020. By the end of 2021, the regulatory authority to impose curtailments was repealed.
Exports Export contracts of more than one year for light crude oil and petroleum products and two years for heavy crude oil (including bitumen) require the prior approval of the Canada Energy Regulator (CER) and the Government of Canada. Export contracts of less than one year for light crude oil and petroleum products and two years for heavy crude oil (including bitumen) require an order from the CER.
Natural gas Production The maximum allowable gross production of natural gas from wells in Canada is subject to limitations by various regulatory authorities. These limitations are to ensure oil recovery is not adversely impacted by accelerated gas production practices. These limitations do not impact gas reserves, only the timing of production of the reserves and did not have a significant impact on Imperial’s 2021 gas production rates.
Exports The Government of Canada has the authority to regulate the export price for natural gas. Exports of natural gas from Canada require approval by the CER and the Government of Canada. The Government of Canada allows the export of natural gas by CER order without volume limitation for terms not exceeding 24 months.
Royalties The Government of Canada and the provinces in which the company produces crude oil and natural gas, impose royalties on production from lands where they own the mineral rights. Some producing provinces also receive revenue by imposing taxes on production from lands where they do not own the mineral rights. Different royalties are imposed by the Government of Canada and each of the producing provinces. Royalties imposed on crude oil, natural gas and natural gas liquids vary depending on a number of parameters, including well production volumes, selling prices and recovery methods. For information with respect to royalties for Kearl, Cold Lake and Syncrude, see “Upstream" section entitled “Present activities” under Item 1 on page 13.

21
Investment Canada Act The Investment Canada Act requires Government of Canada approval, in certain cases, of the acquisition of control of a Canadian business by an entity that is not controlled by Canadians. The acquisition of natural resource properties may, in certain circumstances, be considered a transaction that constitutes an acquisition of control of a Canadian business requiring Government of Canada approval. The Act also requires notification of the establishment of new unrelated businesses in Canada by entities not controlled by Canadians, but does not require Government of Canada approval except when the new business is related to Canada’s cultural heritage or national identity. The Government of Canada is also authorized to take any measures that it considers advisable to protect national security, including the outright prohibition of a foreign investment in Canada. By virtue of the majority stock ownership of the company by ExxonMobil, the company is considered to be an entity which is not controlled by Canadians.
Competition Act The Competition Bureau seeks to ensure that Canadian businesses and consumers prosper in a competitive and innovative marketplace. The Competition Bureau is responsible for the administration and enforcement of the Competition Act (the Act). A merger transaction, whether or not notifiable, is subject to examination by the Commissioner of the Competition Bureau to determine whether the merger will have, or is likely to have, the effect of preventing or lessening substantially competition in a definable market. The assessment of the competitive effects of a merger is made with reference to the factors identified under the Act. An Advance Ruling Certificate (ARC) may be issued by the Commissioner to a party or parties to a proposed merger transaction who want to be assured that the transaction will not give rise to proceedings under section 92 of the Act. An ARC may be issued when the Commissioner is satisfied that there would not be sufficient grounds on which to apply to the Competition Tribunal for an order against a proposed merger. The issuance of an ARC is discretionary. An ARC cannot be issued for a transaction that has been completed, nor does an ARC ensure approval of the transaction by any agency other than the Competition Bureau.
The company online The company’s website www.imperialoil.ca contains a variety of corporate and investor information, including the company’s annual report on Form 10-K, quarterly reports on Form 10-Q and current reports on Form 8-K and amendments to these reports. These reports are made available as soon as reasonably practicable after they are filed or furnished to the SEC. The SEC’s website, www.sec.gov, contains reports, proxy and information statements, interactive data files, and other information regarding issuers that are submitted and posted electronically with the SEC.
22
Item 1A. Risk factors Imperial’s financial and operating results are subject to a variety of risks inherent in oil, gas and petrochemical businesses, and the pursuit of lower-emission business opportunities. Many of these risk factors are not within Imperial’s control and could adversely affect Imperial’s business, financial and operating results, or financial position. These risk factors include:
Supply and demand The oil, gas, fuels and petrochemical businesses are fundamentally commodity businesses. This means the company's operations and earnings may be significantly affected by changes in oil, natural gas and petrochemical prices, and by changes in margins on refined products and petrochemicals. Crude oil, natural gas, petrochemical and petroleum product prices and margins depend on local, regional, and global events or conditions that affect supply and demand for the relevant commodity or product. Commodity prices have been volatile, and the company expects that volatility to continue. Any material decline in crude oil prices could have a material adverse effect on Imperial’s Upstream operations, financial position, proved reserves and the amount spent to develop reserves. On the other hand, a material increase in crude oil prices could have a material adverse effect on Imperial’s Downstream margins, depending on the market conditions for refined products. The demand for energy and petrochemicals is generally linked closely with broad-based economic activities and levels of prosperity. The occurrence of recessions or other periods of low or negative economic growth will typically have a direct adverse impact on the company's results. Other factors that may affect the demand for crude oil, gas, fuels and petrochemicals, and therefore could impact Imperial’s results include technological improvements in energy efficiency; seasonal weather patterns, which affect the demand for our products, including lower demand for gasoline, impacting Downstream results in the winter; increased competitiveness of, or government policy support for, alternative energy sources; new product quality regulations; technological changes or consumer preferences that alter fuel choices, such as technological advances in energy storage that make wind and solar more competitive for power generation; changes in consumer preferences for the company’s products, including consumer demand for alternative fueled or electric transportation or alternatives to plastic products; broad-based changes in personal income levels, interest rates and inflation; and security or public health issues and responses such as epidemics and pandemics. Market factors may also result in losses from commodity derivatives and other instruments used to hedge price exposures or for trading purposes. See also "Climate change, energy transition and greenhouse gas restrictions" below. Commodity prices and margins also vary depending on a number of factors affecting supply. For example, increased supply from the development of new oil and gas supply sources and technologies to enhance recovery from existing sources tends to reduce commodity prices to the extent such supply increases are not offset by commensurate growth in demand. Similarly, increases in industry refining or petrochemical manufacturing capacity relative to demand tend to reduce margins on affected products. Crude oil, gas and petrochemical supply levels can also be affected by factors that reduce available supplies, such as the level of and adherence by participating countries or others to production quotas established by OPEC or "OPEC+" and other agreements among sovereigns, government policies that restrict oil and gas production or increase associated costs, including actions intended to reduce greenhouse gas emissions and previous Government of Alberta curtailment regulations, the occurrence of wars, hostile actions, natural disasters, trade tariffs or broader breakdowns in global trade, disruptions in competitors’ operations, or unexpected pipeline or rail constraints that may disrupt supplies. Technological change can also alter the relative costs for competitors to find, produce, and refine oil and gas and to manufacture petrochemicals.
23
The market price for western Canadian heavy crude oil is typically lower than light and medium grades of oil, principally due to the higher transportation and refining costs. Western Canadian crude oil may also be subject to limits on transportation capacity to markets. Future crude price differentials between western Canadian crude oil relative to prices in the U.S. Gulf Coast are uncertain and changes in the heavy or light crude oil differentials could have a material adverse effect on the company's business. Increased differentials in 2018 also led the Government of Alberta to enact temporary mandatory production curtailment regulations in 2019. These regulations enabled the government to impose production limits on large producers in Alberta such as Imperial. Mandatory production curtailment was eliminated in December 2020 and the regulatory authority to impose curtailments was repealed at the end of 2021; however, the use of similar curtailment regulations in the future could have an adverse effect on the company's business. A significant portion of the company’s production is bitumen, which is blended with diluent for transportation and marketability of heavy crude oil. Increases to diluent prices, relative to heavy crude oil prices, could also have an adverse effect on the company’s business.
Government and political factors Imperial’s results can be adversely impacted by political, legal or regulatory developments affecting operations and markets. Changes in government policy or regulations, changes in law or interpretation of settled law, third-party opposition to company or infrastructure projects, and duration of regulatory reviews could impact Imperial’s existing operations and planned projects. This includes actions by policy-makers, regulators or other actors to delay or deny necessary licences and permits, restrict the availability of oil and gas leases or the operation of third-party infrastructure that the company relies on, such as pipelines to transport the company's upstream production to market or that supply feedstock to the company's refineries. Additionally, changes in environmental regulations, assessment processes or other laws and increasing and expanding stakeholder consultation (including Indigenous stakeholders), may increase the cost of compliance or reduce or delay available business opportunities and adversely impact the company’s results. Other government and political factors that could adversely affect the company’s financial results include increases in taxes or government royalty rates (including retroactive claims) and changes in trade policies and agreements. Further, the adoption of regulations mandating efficiency standards, and the use of alternative fuels or uncompetitive fuel components could affect the company’s operations. Many governments are providing tax advantages and other subsidies to support alternative energy sources or are mandating the use of specific fuels or technologies. Governments are also introducing bans on certain technologies that could impact demand for products, such as the Government of Canada's intention to ban the sale of new internal combustion engine cars and light trucks beginning in 2035. Governments and others are also promoting research into new technologies to reduce the cost and increase the scalability of alternative energy sources, and the success of these initiatives may decrease demand for the company’s products. Actions by policy makers, regulators or others may require changes in the company's business or strategy that could result in reduced returns. Governments may establish regulations with respect to the control of the company's production, such as when increased price differentials in 2018 led the Government of Alberta to impose temporary mandatory production curtailment regulations in effect from 2019 through 2021, as discussed in the "Supply and demand" section above. Government intervention in free markets may introduce unintended consequences such as market volatility and uncertainty, misallocation of resources, and erosion of investor confidence.
Environmental risks All phases of the Upstream, Downstream and Chemical businesses are subject to environmental regulation pursuant to a variety of Canadian federal, provincial, territorial and municipal laws and regulations, as well as international conventions (collectively, “environmental legislation”). Environmental legislation imposes, among other things, restrictions, liabilities and obligations in connection with the generation, handling, storage, transportation, treatment and disposal of hazardous substances and waste and in connection with spills, releases and emissions of various substances into the environment. As well, environmental regulations are imposed on the qualities and compositions of the products sold and imported, and include those aimed at reducing consumption or addressing environmental concerns with certain end products. Changes to these requirements could adversely affect the company's results by impacting commodity prices, increasing costs and reducing revenues.

24
Environmental legislation also requires that wells, facility sites and other properties associated with the company's operations be operated, maintained, monitored, abandoned and reclaimed to the satisfaction of applicable regulatory authorities. This includes the requirement for specific approvals for many areas of interaction with the environment, such as land use, air quality, water use, biodiversity protection and waste, including mine tailings management. The failure to operate as anticipated and adhere to conditions, the delay or denial of approvals and changes to conditions or regulations could impact the company's ability to operate its projects and facilities and adversely affect the company's results. The implementation of, and compliance with, policies and regulations related to air, water and land, such as Alberta’s Lower Athabasca Regional Plan and Wetland Policy applicable to the company's oil sands assets, could restrict development in current and future areas of operation. The company also depends on water obtained under licences for withdrawal, storage, reuse and discharge in both its Upstream and Downstream businesses, including future projects and expansions. Water use may be limited by regulatory requirements, seasonal fluctuations, competing demands, environmental sensitivities, increasingly stringent water management standards, and changes to conditions or availability of licences, which may restrict and adversely affect the company’s operations. Additionally, a number of air quality regulations and frameworks are being developed at the federal and provincial levels, and when implemented could impact existing and planned projects through increased capital and operating expenses including retrofits to existing equipment, and could adversely impact the company’s operations and financial results. Federal and provincial legislation aimed at protecting sensitive, threatened or endangered wildlife, such as woodland caribou and species of migratory birds, may also increase restoration and offset costs and impact the company’s projects. If it is determined that such wildlife and their habitat are not sufficiently protected, governments or other parties may take actions to limit the pace or ability to develop in areas of Imperial’s current and future projects. The company’s mining operations are subject to tailings management regulations that establish approval, monitoring, reporting and performance criteria for tailings ponds and management plans. Further, the absence or evolving nature of policies and regulations for the timing and closure of tailings ponds, including the approved technologies and methods for closure (such as the use of end pit lakes and water capped tailings), and dam safety directives, regulations, guides and abandonment requirements could have a material impact on conditions for approvals and ultimate mine closure costs. Additionally, successful management and closure requires the release of water to the environment, and although an Alberta water release policy and federal oil sands effluent regulations are being developed, the timing and impact of these regulations is uncertain and the absence of effective regulation could negatively impact the company’s operations and financial results. In addition, certain types of operations, including exploration and development projects and significant changes to certain existing projects, may require the submission and approval of environmental impact assessments. In 2019, the Government of Canada implemented a new environmental assessment framework under the Impact Assessment Act, which expands assessment considerations beyond the environment to include social, health, economic, and gender-based impacts and the impact on Canada’s climate change commitments (including a requirement under the Strategic Assessment for Climate Change to provide a credible plan for the project to deliver net-zero greenhouse gas emissions by 2050). It also includes a reliance on strategic and regional assessments and adjusted regulatory review timelines. The impact of this legislation is not fully apparent, but it may impact the cost, manner, duration and ability to advance large energy projects. Compliance with environmental legislation can require significant expenditures and failure to comply with environmental legislation may result in the cessation of operations, imposition of fines and penalties, and liability for clean-up costs and damages.

25
The costs of complying with environmental legislation in the future could have a material adverse effect on the company’s financial condition or results of operations. The company anticipates that changes in environmental legislation may require, among other things, reductions in emissions from its operations to the air and water and may result in increased capital expenditures. Changes in environmental legislation (including, but not limited to, application of regulations related to air, water, land, biodiversity and waste, such as mine tailings and the use of new or recycled plastics) may increase the cost of compliance or reduce or delay available business opportunities. Future changes in environmental legislation and the enforcement of regulations could occur and result in stricter standards and enforcement, larger fines, penalties and liability, and increased capital expenditures and operating costs, which could have a material adverse effect on the company's financial condition or results of operations. There are operational risks inherent in oil and gas exploration and production activities, as well as the potential to incur substantial financial liabilities, if the company does not manage those risks effectively. Environmental hazards including severe weather events may impact the company's operational performance, such as extreme cold weather that makes mining operations more difficult. The ability to insure risks is limited by the capacity of the applicable insurance markets, which may not be sufficient to cover the likely cost of a major adverse operating event. Accordingly, the company's primary focus is on prevention, including through its rigorous operations integrity management system. The company's future results will depend on the continued effectiveness of these efforts.
Climate change, energy transition and greenhouse gas restrictions Net zero scenarios Driven by concern over the risks of climate change, the provinces and the Government of Canada have adopted or have revised regulatory frameworks to reduce greenhouse gas emissions including emissions from the production and use of oil and gas, and their products. These actions are being taken both independently by national and regional governments and within the framework of United Nations Conference of the Parties' summits under which Canada has endorsed objectives to reduce the atmospheric concentration of CO2 over the coming decades, with an ambition ultimately to achieve “net zero.” Net zero means that emissions of greenhouse gases from human activities would be balanced by actions that remove such gases from the atmosphere. Expectations for transition of the world’s energy system to lower emission sources, and ultimately net zero, derive from hypothetical scenarios that reflect many assumptions about the future and reflect substantial uncertainties. The company’s actions with respect to the energy transition, including its announced ambition, ultimately, to achieve net zero with respect to emissions from its upstream oil sands operations, carries risks that the transition, including underlying technologies, policies, and markets as discussed in more detail below, will not develop at the pace or in the manner expected by current net-zero scenarios.
Greenhouse gas restrictions Government actions intended to reduce greenhouse gas emissions include adoption of carbon emissions pricing, cap and trade regimes, carbon taxes, emissions limits, increased mileage and other efficiency standards, low carbon fuels standards, mandates for sales of electrical vehicles and incentives or mandates for renewable energy. The Government of Canada has updated its nationally determined contribution (NDC) under the Paris Agreement on climate change, to reduce greenhouse gas emissions economy-wide by 40 to 45 percent below 2005 levels by 2030, a substantial increase in ambition beyond its original NDC. To implement these goals, the Government of Canada uses a number of policy tools including the Greenhouse Gas Pollution Pricing Act (GGPPA), which sets a federal backstop carbon price Canada-wide through a carbon levy applied to fossil fuels ($50 per tonne CO2 equivalent emissions starting in 2022 and increasing by $15 per tonne annually to $170 per tonne in 2030), and an output-based pricing system for large industrial emitters. Under the GGPPA, provinces are required to either adopt the GGPPA, or obtain equivalency by adopting a price-based system (with a minimum of the federal carbon pricing) or a cap and trade system. Further, in 2021 the Government of Canada enacted legislation to formalize Canada's target to achieve net-zero emissions by 2050 and establish interim emissions reductions targets at five year intervals. For 2022, under the Canadian Net-Zero Emissions Accountability Act, the Government of Canada is required to develop an emissions reduction plan for 2030 consistent with achieving net-zero emissions by 2050.

26
The Government of Alberta has obtained federal equivalency for its Technology Innovation and Emissions Reduction Regulation (TIER) that came into effect in 2020 and applies to facilities with CO2 emissions in excess of 100,000 tonnes per year. TIER is designed to reduce emissions by putting a price on nominally 10 percent of a facility’s emissions in 2020, increasing by 1 percent per year. Further, the Alberta Oil Sands Emissions Limit Act sets a limit of 100 megatonnes of CO2 per year of emissions in the oil sands sector, but oil sands emissions remain below the limit and it is not yet possible to predict the impact of this act on the company's future oil sands operations in Alberta. With respect to other provinces, with Ontario cancelling the cap and trade program in 2018, the company’s operations in Ontario were subject to the federal carbon levy and output based pricing system through 2021. Starting in 2022, Ontario has received equivalency for its Emissions Performance System, which puts a price on 8 percent of a facility's emissions. British Columbia has carbon pricing in place for all emissions, with pricing expected to align with federal pricing in 2022. Increases in carbon pricing could adversely impact the company's operations and financial results unless the company can adapt its operations. There are also various low carbon fuel standards being developed or already applicable to the company's products. The Government of Canada is finalizing draft regulations for the Clean Fuel Regulations, which will require the reduction in carbon intensity of liquid transportation fuels supplied in Canada starting in December 2022. The regulations build upon the existing federal renewable fuels regulations that require fuel producers and importers to have a specified amount of renewable fuel in gasoline and diesel. Similarly, British Columbia introduced a Low Carbon Fuel Standard in 2013, which increased to a 10 percent carbon intensity reduction requirement in 2020. The British Columbia government has announced its intention to reduce the carbon intensity of fuels by a further 20 percent by 2030. Compliance can be achieved by either blending renewable fuels with low carbon intensity or by purchasing credits. In 2019, the Government of Canada enacted the Impact Assessment Act, which links environmental assessment approvals to climate change-related goals, and has also discussed a goal of establishing legally-binding policies for being carbon-neutral by 2050. Changes and policies related to this act could adversely impact the company's ability to progress new oil sands projects. International accords and underlying regional and national regulations covering climate change and greenhouse gas emissions continue to evolve with uncertain timing and outcome, making it difficult to predict their business impact. Such laws and policies could make Imperial’s products more expensive and less competitive, reduce or delay available business opportunities, reduce demand for hydrocarbons, and shift hydrocarbon demand toward lower greenhouse gas emission energy sources. Current and pending greenhouse gas regulations or policies may also increase compliance and abatement costs including taxes and levies, increase abandonment and reclamation obligations and impact decommissioning timelines, lengthen project evaluation and implementation times, impact reserves evaluations and affect operations. Increased costs may not be recoverable in the market place, could negatively affect our returns and could reduce the global competitiveness of the company's crude oil, natural gas and refined products. Governments may also impose restrictions on production of, or emissions from, oil and gas to the extent they view such measures as a viable approach for pursuing national and global energy and climate policies. For example, the Government of Canada announced its intention to pursue a cap on greenhouse gas emission from oil and gas activities by 2030. Concern over the risks of climate change may lead governments to make laws applicable to the energy industry progressively more stringent over time. Political and other actors and their agents are also increasingly seeking to advance climate change objectives indirectly, such as by seeking to reduce the availability or increase the cost of financing and investment in the oil and gas sector and taking actions intended to promote changes in business strategy for oil and gas companies. Technology Achieving societal ambitions to reduce greenhouse gas emissions and ultimately achieve net zero will require new technologies to reduce the cost and increase the scalability of alternative energy sources as well as technologies such as carbon capture and sequestration (CCS). CCS technologies, focused initially capturing and sequestering CO2 emissions from high-intensity industrial activities, can assist in meeting society’s objective to mitigate atmospheric greenhouse gas levels while also helping ensure the availability of the reliable and affordable energy the world requires. The company’s future results and ability to succeed through the energy transition will depend in part on the success of these research and collaboration efforts and on the company’s ability to adapt and apply the strengths of its current business model to providing the energy products of the future in a cost-competitive manner.

27
Policy and market development The scale of the world’s energy system means that, in addition to developments in technology discussed above, a successful energy transition will require appropriate support from governments and private participants throughout the global economy. The company’s ability to develop and deploy CCS and other lower emission energy technologies at commercial scale will depend in part on the continued development of supportive government policies and markets. Failure or delay of these policies or markets to materialize or be maintained could adversely impact these investments. Policy and other actions that result in restricting the availability of hydrocarbon products without commensurate reduction in demand may have unpredictable adverse effects, including increased commodity price volatility; periods of significantly higher commodity prices and resulting inflationary pressures; and local or regional energy shortages. Such effects in turn may depress economic growth or lead to rapid or conflicting shifts in policy by different actors, with resulting adverse effects on the company’s business. See also the discussion of "Supply and demand", "Government and political factors", and "Management effectiveness" in this Item 1A.
Currency Prices for commodities produced by the company are commonly benchmarked in U.S. dollars. The majority of Imperial’s sales and purchases are related to these industry U.S. dollar benchmarks. As the company records and reports its financial results in Canadian dollars, to the extent that the value of the Canadian dollar strengthens, the company’s reported earnings will be negatively affected. The company does not currently make use of derivative instruments to offset exposures associated with foreign currency.
Other business risks Imperial is reliant on a number of key chemicals, catalysts and third-party service providers, including input and output commodity transportation (pipelines, rail, trucking, marine) and utilities providing services, including electricity and water, to various company operations. The lack of availability, capacity or proximity with respect to pipeline facilities and railcars could negatively impact Imperial's ability to produce at capacity levels. Transportation disruptions, including those caused by events unrelated to the company's operations, could adversely affect the company's price realizations, refining operations and sales volumes. This includes outages of key third-party infrastructure, such as pipelines servicing the company's oil sands assets or pipelines supplying feedstock to its refineries, which could impact the company's ability to operate its assets or limit the ability to deliver production and products to market. A third-party utilities outage could have an adverse impact on the company's operations and ability to produce. The company also enters into contractual relationships with suppliers, partners and other counterparties to procure and sell goods and services, and the company’s operations, market position and financial condition may be adversely impacted if these counterparties do not fulfil their obligations. Imperial may also be adversely affected by the outcome of litigation resulting from its operations or by government enforcement proceedings alleging non-compliance with applicable laws or regulations. Litigation is subject to uncertainty and success is not guaranteed, and the company may incur significant expenses and devote significant resources in defending litigation.
Management effectiveness In addition to external economic and political factors, Imperial’s future business results also depend on the company’s ability to manage successfully those factors that are at least in part within its control. The extent to which Imperial manages these factors will impact its performance relative to competition. For projects in which the company is not the operator, Imperial depends on the management effectiveness of one or more co-venturers whom the company does not control.

28
Project management The nature of the company’s Upstream, Downstream and Chemical businesses depend on complex, long-term, and capital intensive projects that require a high degree of project management expertise to maximize efficiency. This includes development, engineering, construction, commissioning and ongoing operational activities and expertise. The company's results are affected by its ability to develop and operate projects and facilities as planned, and by events or conditions that affect the advancement, operation, cost or results of such projects or facilities. These risks include the company's ability to obtain the necessary environmental and other regulatory approvals; changes in regulations; the ability to negotiate successfully with joint venturers, partners, governments, suppliers, customers and others; the ability to model and optimize reservoir performance; changes in resources and operating costs including the availability and cost of materials, equipment and qualified personnel; the impact of general economic, business and market conditions; and the company’s ability to respond effectively to unforeseen technical difficulties that could delay project start-up or cause unscheduled downtime.
Operational efficiency An important component of Imperial’s competitive performance, especially given the commodity based nature of Imperial’s business, is the ability to operate efficiently, including the company’s ability to manage expenses and improve production yields on an ongoing basis. This requires continuous management focus, including technological improvements, cost control, productivity enhancements and regular reappraisal of the company’s asset portfolio. The company's operations and results also depend on key personnel and subject matter expertise, the recruitment, development and retention of high caliber employees, and the availability of skilled labour.
Research and development and technical change Imperial relies upon the research and development organizations of the company and ExxonMobil, with whom the company conducts shared research. Innovation and technology are important to maintain the company’s competitive position, especially in light of the technological nature of Imperial’s business and the need for continuous efficiency improvement. The company's research and development organizations must be able to adapt to a changing market and policy environment, including developing technologies to help reduce greenhouse gas emissions intensity. To remain competitive, the company must also continuously adapt and capture the benefits of new technologies including growing the company's capabilities to utilize digital data technologies to gain new business insights. There are risks associated with projects that rely on new technology, including that the results of implementing the new technology may differ from simulated, piloted or expected results. The failure to develop and adopt new technology may have an adverse impact on the company’s operations, ability to meet regulatory requirements and operational commitments and targets (including environmental sustainability and reduction of greenhouse gas emissions), and financial results.
Safety, business controls and environmental risk management The scope and nature of the company’s operations present a variety of significant hazards and risks, including operational hazards and risks such as explosions, fires, pipeline ruptures and crude oil spills. Imperial’s operations are also subject to the additional hazards of pollution, releases of toxic gas and environmental hazards and risks, such as severe weather and geological events. The company’s results depend on management’s ability to minimize these inherent risks, to effectively control business activities and to minimize the potential for human error. Imperial applies rigorous management systems, including a combined program of effective operations integrity management, ongoing upgrades, key equipment replacements, and comprehensive inspection and surveillance. The company also maintains a disciplined framework of internal controls and applies a controls management system for monitoring compliance with this framework. The company’s upstream and downstream operations may experience loss of production, slowdowns or shutdowns and increased costs due to the failure of interdependent systems, and substantial liabilities and other adverse impacts could result if the company’s management systems and controls do not function as intended.
29
Cybersecurity Imperial is regularly subject to attempted cybersecurity disruptions from a variety of sources, including state-sponsored actors. Imperial’s defensive preparedness includes multi-layered technological capabilities for prevention and detection of cybersecurity disruptions: non-technological measures such as threat information sharing with governmental and industry groups; internal training and awareness campaigns including routine testing of employee awareness via mock threats; and an emphasis on resiliency including business response and recovery. If the measures the company is taking to protect against cybersecurity disruptions prove to be insufficient or if the company’s proprietary data is otherwise not protected, the company as well as its customers, employees or third parties could be adversely affected. The company is exposed to potential harm from cybersecurity events that may affect the operations of third parties, including our partners, suppliers, service providers (including providers of cloud-based services for our data or applications), and customers. Cybersecurity disruptions could cause physical harm to people or the environment; damage or destroy assets; compromise business systems; result in proprietary information being altered, lost or stolen; result in employee, customer or third-party information being compromised; or otherwise disrupt the company's business operations. Imperial could incur significant costs to remedy the effects of a major cybersecurity disruption, in addition to costs in connection with resulting regulatory actions, litigation or reputational harm.
Preparedness The company’s operations may be disrupted by severe weather events, natural disasters, human error, and similar events. Imperial’s ability to mitigate the adverse impacts of these events depends in part upon the effectiveness of its rigorous disaster preparedness and response planning, as well as business continuity planning.
COVID-19 As a result of COVID-19, governments in many countries, including Canada, have mandated quarantines, closures, stay-at-home orders and travel restrictions that have had a significant impact on demand for the company’s products. While these effects are expected to be temporary, the resurgence of cases of COVID-19 has led to a highly uncertain business environment. Although there has been some movement toward pre-pandemic activity levels, the duration of the business disruptions and related financial impact cannot be reasonably estimated at this time and continued or new restrictions could continue to impact the demand for petroleum products. Imperial’s future business results, including cash flows and financing needs, will be affected by the scope and severity of current and future COVID outbreaks; actions taken by governments and others to address the pandemic and the effects of those actions on national and global economies and markets; changes in consumer behavior that affect demand for our products; and the effectiveness of the company's own responsive actions to protect the safety and well-being of its people. The company has had positive COVID-19 cases, but these cases have not had a material impact on its operations or business. The company has initiated numerous emergency response and business continuity plans, and a substantial portion of the company's workforce has implemented remote working arrangements. However, if the company’s mitigation and response efforts prove insufficient, then large outbreaks of epidemics, pandemics or other health crises such as COVID-19 at operating sites, particularly in remote locations and where work camps are utilized, could materially impact the company’s personnel and its operations, reducing productivity and increasing costs. The company could also be impacted by disruption to supply chains, methods of distribution and key third-party service providers, which could impact the ability to produce or sell its products, as well as increase the costs associated with its operations and decrease revenues and margins. The COVID-19 pandemic continues to evolve, with changing case numbers and the potential for additional public health restrictions. The impact of the pandemic remains difficult to predict.

30
Reputation Imperial's reputation is an important corporate asset. Factors that could have an impact on the company's reputation including an operating incident or significant cybersecurity disruption; changes in consumer views concerning the company's products; a perception by investors or others that insufficient progress is being made with respect to the company’s ambition in the energy transition, or that pursuit of this ambition may result in allocation of capital to investments with reduced returns; and other adverse events such as those described in this Item 1A. Negative impacts on Imperial's reputation could, in turn, make it more difficult for the company to compete successfully for new opportunities, obtain necessary regulatory approvals, obtain financing, or could reduce consumer demand for the company's branded products. Imperial’s reputation may also be harmed by events which negatively affect the image of the industry as a whole, including public and investor perception of Alberta oil sands in relation to greenhouse gas emissions and environmental impact.
Reserves The company's future production and cash flows from bitumen, synthetic oil, liquids and natural gas reserves are highly dependent upon the company's success in exploiting its current reserves. To maintain production and cash flows over the long term, the company must replace produced reserves, which can be accomplished through exploration discovery of new resources, appraisal and investments in developing discovered resources, or acquisition of reserves. To the extent cash flows from operations are insufficient to fund capital expenditures and external sources of capital become limited or unavailable, the company's ability to make the necessary capital investments to maintain and grow oil and natural gas reserves will be adversely impacted. In addition, the company may be unable to find and develop or acquire additional reserves to replace oil and natural gas production at acceptable costs. Estimates of economically recoverable oil and natural gas reserves and future net cash flows involve many uncertainties, including factors beyond the company’s control. Key factors with uncertainty include: geological and engineering estimates, including that additional information obtained through seismic and drilling programs, reservoir analysis and production and operational history may result in revisions to reserves; the assumed effects of regulation or changes to regulation by government agencies, including royalty frameworks and environmental regulations (such as the regulation of greenhouse gas emissions, which could impose significant compliance costs on the company, require new technology, or impact the economic viability of certain projects); future commodity prices, where low commodity prices may affect reserves development; abandonment and reclamation costs, including reclamation and tailings requirements for mining operations; and operating costs. Actual production, revenues, taxes and royalties, development costs, abandonment and reclamation costs, and operating expenditures with respect to reserves will likely vary from such estimates, and such variances could be material.

31
Item 1B. Unresolved staff comments None.
Item 2. Properties Reference is made to Item 1 above.
Item 3. Legal proceedings On October 8, 2021, Imperial was charged by the Ontario Crown in the Ontario Court of Justice with committing the offences, at Imperial’s refinery in Nanticoke, Ontario, of: (a) discharging or causing or permitting the discharge of a petroleum product into a watercourse contrary to section 30(1) of the Ontario Water Resources Act, R.S.O. 1990, c. O. 40, as amended (the “OWRA”); (b) failing to forthwith notify the Ministry of the Environment, Conservation and Parks of the discharge contrary to section 30(2) of the OWRA; and (c) discharging or causing or permitting the discharge of a petroleum product into the natural environment contrary to section 14(1) of the Environmental Protection Act, R.S.O. 1990, c. E.19, as amended. These offences were alleged to have occurred between May 31, 2019 and June 3, 2019. No determination of impact can be made at this time. Refer to the relevant portions of note 9. Litigation and other contingencies of the “Financial section” of this report for additional information on legal proceedings. Imperial has elected to use a $1 million threshold for disclosing environmental proceedings.
Item 4. Mine safety disclosures Not applicable.

32
PART II Item 5. Market for registrant’s common equity, related
stockholder matters and issuer purchases of equity securities
Market information The company’s common shares are listed and trade on the Toronto Stock Exchange in Canada, and have unlisted trading privileges and trade on the NYSE American LLC in the United States. The symbol for the company’s common shares on these exchanges is IMO. As of February 15, 2022 there were 9,826 holders of record of common shares of the company.
Information for security holders outside Canada Cash dividends paid to shareholders resident in countries with which Canada has an income tax convention are usually subject to a Canadian non-resident withholding tax of 15 percent, but may vary from one tax convention to another. The withholding tax is reduced to 5 percent on dividends paid to a corporation resident in the U.S. that owns at least 10 percent of the voting shares of the company. The company is a qualified foreign corporation for purposes of the reduced U.S. capital gains tax rates, which are applicable to dividends paid by U.S. domestic corporations and qualified foreign corporations. There is no Canadian tax on gains from selling shares or debt instruments owned by non-residents not carrying on business in Canada, as long as the shareholder does not, in any given 60 month period, own 25 percent or more of the shares of the company. Canada has approved several positions with respect to the Multilateral Convention to Implement Tax Treaty Related Measures to Prevent Base Erosion and Profit Shifting (“MLI”), which may impact the taxability of dividends and capital gains in Canada if the shareholder’s country of residence has also approved these same positions of the MLI. Between October 1, 2021 and December 31, 2021, pursuant to the company’s restricted stock unit plan, 6,725 shares were issued to employees or former employees outside the U.S. in reliance on Regulation S under the Securities Act.
Securities authorized for issuance under equity compensation plans Sections of the company's management proxy circular are contained in the “Proxy information section”, starting on page 111. The company's management proxy circular is prepared in accordance with Canadian securities regulations. Reference is made to the section under the "Company executives and executive compensation":
Entitled "Performance graph" within the "Compensation discussion and analysis” section on page 170 of this report; and
Entitled "Equity compensation plan information", within the "Compensation discussion and analysis", on page 176 of this report.
33
Issuer purchases of equity securities
Total number of
shares purchased
Average price paid per share
(Canadian dollars)
Total number of shares purchased as part of publicly announced plans
or programs
Maximum number of shares that may
yet be purchased under the plans or
programs (a) October 2021
2,846,704 42.70 2,846,704 23,627,643 (October 1 - October 31) November 2021
7,089,309 43.49 7,089,309 16,538,334 (November 1 - November 30) December 2021
7,602,184 43.63 7,602,184 8,936,150 (December 1 - December 31) (a) On June 23, 2021, the company announced by news release that it had received final approval from the Toronto Stock Exchange
for a new normal course issuer bid and will continue its existing share purchase program. The program enables the company to purchase up to a maximum of 35,583,671 common shares during the period June 29, 2021 to June 28, 2022. This maximum includes shares purchased under the normal course issuer bid and from Exxon Mobil Corporation concurrent with, but outside of the normal course issuer bid. As in the past, Exxon Mobil Corporation has advised the company that it intends to participate to maintain its ownership percentage at approximately 69.6 percent. The program will end should the company purchase the maximum allowable number of shares, or on June 28, 2022.
In accordance with the company’s announcement in November 2021 that it intended to accelerate purchases under the normal course issuer bid, the program was subsequently completed on January 31, 2022 as a result of the company purchasing the maximum allowable number of shares under the program. The company will continue to evaluate the renewal of its normal course issuer bid share purchase program in June 2022 in the context of its overall capital activities. Purchase plans may be modified at any time without prior notice.
Item 7. Management’s discussion and analysis of financial condition and results of operations
Reference is made to the section entitled "Management's discussion and analysis of financial condition and results of operations" in the “Financial section”, starting on page 48 of this report.
Item 7A. Quantitative and qualitative disclosures about market risk
Reference is made to the section entitled "Market risks" in the “Financial section”, starting on page 63 of this report. All statements other than historical information incorporated in this Item 7A are forward-looking statements. The actual impact of future market changes could differ materially due to, among other things, factors discussed in this report.

34
Item 8. Financial statements and supplementary data Reference is made to the table of contents in the “Financial section” on page 42 of this report:
Consolidated financial statements, together with the report thereon of PricewaterhouseCoopers LLP (PCAOB ID: 271), Calgary, Canada dated February 23, 2022, beginning with the section entitled "Report of independent registered public accounting firm" on page 72 and continuing through note 17, "Other comprehensive income (loss) information” on page 106;
"Supplemental information on oil and gas exploration and production activities" (unaudited) starting on page 107.
Item 9. Changes in and disagreements with accountants on accounting and financial disclosure
None.
Item 9A. Controls and procedures As indicated in the certifications in Exhibit 31 of this report, the company’s principal executive officer and principal financial officer have evaluated the company’s disclosure controls and procedures as of December 31, 2021. Based on that evaluation, these officers have concluded that the company’s disclosure controls and procedures are effective in ensuring that information required to be disclosed by the company in the reports that it files or submits under the Securities Exchange Act of 1934, as amended, is accumulated and communicated to them in a manner that allows for timely decisions regarding required disclosures and are effective in ensuring that such information is recorded, processed, summarized and reported within the time periods specified in the SEC's rules and forms. Reference is made to page 71 of this report for "Management’s report on internal control over financial reporting" and page 72 for the "Report of independent registered public accounting firm" on the company's internal control over financial reporting as of December 31, 2021. There has not been any change in the company’s internal control over financial reporting during the last fiscal quarter that has materially affected, or is reasonably likely to materially affect, the company’s internal control over financial reporting.
Item 9B. Other information None.
Item 9C. Disclosure regarding foreign jurisdiction that prevents inspections Not applicable.

35
PART III Item 10. Directors, executive officers and corporate
governance Sections of the company's management proxy circular are contained in the “Proxy information section”, starting on page 111. The company's management proxy circular is prepared in accordance with Canadian securities regulations. The company currently has seven directors. The articles of the company require that the board have between five and fifteen directors. Each director is elected to hold office until the close of the next annual meeting. Each of the seven individuals listed in the section entitled "Nominees for director” on pages 112 to 115 of this report have been nominated for election at the annual meeting of shareholders to be held May 3, 2022. All of the nominees are now directors and have been since the dates indicated. Reference is made to the section under "Nominees for director":
"Director nominee tables", on pages 112 to 115 of this report;
Reference is made to the sections under "Corporate governance disclosure":
“Skills and experience of our board members and nominees”, on page 120 of this report.
“Other public company directorships of our board members and nominees”, on page 124 of this report.
The table entitled "Audit committee" under "Board and committee structure", on page 133 of this report;
"Ethical business conduct", starting on page 145 of this report; and
"Largest shareholder", on page 149 of this report. Reference is made to the sections under "Company executives and executive compensation":
"Named executive officers of the company" and "Other executive officers of the company", on pages 151 to 153 of this report.
Item 11. Executive compensation Sections of the company's management proxy circular are contained in the “Proxy information section”, starting on page 111. The company's management proxy circular is prepared in accordance with Canadian securities regulations. Reference is made to the sections under "Corporate governance disclosure":
"Director compensation", on pages 137 to 143 of this report; and
"Share ownership guidelines of independent directors and chairman, president and chief executive officer", on page 144 of this report.
Reference is made to the following sections under "Company executives and executive compensation":
"Letter to shareholders from the executive resources committee on executive compensation", starting on page 154 of this report; and
"Compensation discussion and analysis", on pages 156 to 178 of this report.

36
Item 12. Security ownership of certain beneficial owners and management and related stockholder matters
Sections of the company's management proxy circular are contained in the “Proxy information section”, starting on page 111. The company's management proxy circular is prepared in accordance with Canadian securities regulations. Reference is made to the section under "Company executives and executive compensation" entitled "Equity compensation plan information", within the "Compensation discussion and analysis” section, on page 176 of this report. Reference is made to the section under "Corporate governance disclosure" entitled "Largest shareholder", on page 149 of this report. Reference is also made to the security ownership information for directors and executive officers of the company under the preceding Items 10 and 11. The compensation of the directors and executive officers of the company for the year-ended December 31, 2021 is described in the sections under "Nominees for director" starting on page 112, “Director compensation” starting on page 137 and "Company executives and executive compensation" starting on page 151. The following table shows the number of Imperial Oil Limited and Exxon Mobil Corporation common shares owned and restricted stock units held by each named executive officer, and the incumbent directors and executive officers as a group, as of February 15, 2022. Imperial Oil Limited Exxon Mobil Corporation
Named executive officer Common
shares (a) Restricted
stock units (b) Common
shares (a) Restricted
stock units (b)
B.W. Corson - 234,600 114,686 88,000
D.E. Lyons - 78,000 10,046 14,400
S.P. Younger - 32,400 9,457 19,900
B.A. Jolly 31,361 68,600 - -
J.R. Wetmore 14,939 56,900 - -
Incumbent directors and executive officers as a group (17 people) 130,655 649,550 160,390 240,200 (a) No common shares are beneficially owned by reason of exercisable options. None of these individuals owns more than 0.01
percent of the outstanding shares of Imperial Oil Limited or Exxon Mobil Corporation. The directors and officers as a group own approximately 0.02 percent of the outstanding shares of Imperial Oil Limited, and less than 0.01 percent of the outstanding shares of Exxon Mobil Corporation. Information not being within the knowledge of the company has been provided by the directors and the executive officers individually.
(b) Restricted stock units do not carry voting rights prior to the issuance of shares on settlement of the awards.
37
Item 13. Certain relationships and related transactions, and director independence
Sections of the company's management proxy circular are contained in the “Proxy information section”, starting on page 111. The company's management proxy circular is prepared in accordance with Canadian securities regulations. Reference is made to the section under "Corporate governance disclosure" entitled "Independence of our board members and nominees", on page 121 of this report. Reference is made to the section under "Corporate governance disclosure" entitled "Transactions with Exxon Mobil Corporation", on page 149 of this report. M.R. Crocker is deemed a non-independent member of the board of directors and the executive resources committee, public policy and corporate responsibility committee, nominations and corporate governance committee and community collaboration and engagement committee under the relevant standards. As an employee of Exxon Mobil Corporation, M.R. Crocker is independent of the company's management and is able to assist these committees by reflecting the perspective of the company's shareholders.
38
Item 14. Principal accountant fees and services
Auditor information The audit committee of the board of directors recommends that PricewaterhouseCoopers LLP (PwC) be reappointed as the auditor of the company until the close of the next annual meeting. PwC has been the auditor of the company for more than five years and are located in Calgary, Alberta. PwC is a participating audit firm with the Canadian Public Accountability Board.
Auditor fees The aggregate fees of PwC for professional services rendered for the audit of the company’s financial statements and other services for the fiscal years ended December 31, 2021 and December 31, 2020 were as follows:
thousands of Canadian dollars 2021 2020
Audit fees 1,890 1,910
Audit-related fees 92 92
Tax fees - -
All other fees - -
Total fees 1,982 2,002
Audit fees included the audit of the company’s annual financial statements, internal control over financial reporting, and a review of the first three quarterly financial statements in 2021. Audit-related fees consisted of other assurance services including the audit of the company’s retirement plan and royalty statement audits for oil and gas producing entities. The company did not engage the auditor for any other services.
The audit committee formally and annually evaluates the performance of the external auditor, recommends the external auditor to be appointed by the shareholders, recommends their remuneration and oversees their work. The audit committee also approves the proposed current year audit program of the external auditor, assesses the results of the program after the end of the program period and approves in advance any non-audit services to be performed by the external auditor after considering the effect of such services on their independence.
All of the services rendered by the auditor to the company were approved by the audit committee.
Auditor independence The audit committee continually discusses with PwC their independence from the company and from management. PwC have confirmed that they are independent with respect to the company within the meaning of the Rules of Professional Conduct of the Chartered Professional Accountants of Alberta, the Public Company Accounting Oversight Board (United States) (PCAOB) and the rules of the U.S. Securities and Exchange Commission. The company has concluded that the auditor’s independence has been maintained.

39
PART IV Item 15. Exhibits, financial statement schedules
Reference is made to the table of contents in the “Financial section” on page 42 of this report.
The following exhibits, numbered in accordance with Item 601 of Regulation S-K, are filed as part of this report:
(3) (i) Restated certificate and articles of incorporation of the company (Incorporated herein by reference to Exhibit (3.1) to the company’s Form 8-K filed on May 3, 2006 (File No. 0-12014)).
(ii) By-laws of the company (Incorporated herein by reference to Exhibit (3)(ii) to the company’s Quarterly Report on Form 10-Q for the quarter ended March 31, 2003 (File No. 0-12014)).
(4) (vi) Description of capital stock. (Incorporated herein by reference to Exhibit (4)(vi) of the company’s Annual Report on Form 10-K for the year ended December 31, 2019 (File No. 0-12014)).
(10) (ii)
(1) Alberta Cold Lake Transition Agreement, effective January 1, 2000, relating to the royalties payable in respect of the Cold Lake production project and terminating the Alberta Cold Lake Crown Agreement dated June 25, 1984. (Incorporated herein by reference to Exhibit (10)(ii)(20) of the company’s Annual Report on Form 10-K for the year ended December 31, 2001 (File No. 0-12014)).
(2) Syncrude Bitumen Royalty Option Agreement, dated November 18, 2008, setting out the terms of the exercise by the Syncrude Joint Venture owners of the option contained in the existing Crown Agreement to convert to a royalty payable on the value of bitumen, effective January 1, 2009 (Incorporated herein by reference to Exhibit 1.01(10)(ii)(2) of the company’s Form 8-K filed on November 19, 2008 (File No. 0-12014)).
(iii)(A) (1) Form of Letter relating to Supplemental Retirement Income (Incorporated herein by reference to Exhibit (10)(c)(3) of the company’s Annual Report on Form 10-K for the year ended December 31, 1980 (File No. 2-9259)).
(2) Deferred Share Unit Plan for Nonemployee Directors. (Incorporated herein by reference to Exhibit (10)(iii)(A)(6) of the company’s Annual Report on Form 10-K for the year ended December 31, 1998 (File No. 0-12014)).
(3) Amended Restricted Stock Unit Plan with respect to Restricted Stock Units granted in 2011 and subsequent years, as amended effective November 14, 2011 (Incorporated herein by reference to Exhibit 9.01(c)[10(iii)(A)(1)] of the company's Form 8-K filed on February 23, 2012 (File No. 0-12014)).
(4) Amended Restricted Stock Unit Plan with respect to Restricted Stock Units granted in 2016 and subsequent years, as amended effective October 26, 2016 (Incorporated herein by reference to Exhibit 9.01(c)[10(iii)(A)(1)] of the company’s Form 8-K filed on October 31, 2016 (File No. 0-12014)).
(5) Amended Short Term Incentive Program with respect to awards granted in 2016 and subsequent years, as amended effective October 26, 2016 (Incorporated herein by reference to Exhibit 9.01(c)[10(iii)(A)(1)] of the company’s Form 8-K filed on October 31, 2016 (File No. 0-12014)).
(6) Amended Restricted Stock Unit Plan with respect to Restricted Stock Units granted in 2020 and subsequent years, as amended effective November 24, 2020 (Incorporated herein by reference to Exhibit (10)(iii)(A)(6) of the company’s Annual Report on Form 10-K for the year ended December 31, 2020 (File No. 0-12014)).
(21)
Imperial Oil Resources Limited is incorporated in Alberta, Canada and Canada Imperial Oil Limited is incorporated in Canada, and both are wholly-owned subsidiaries of the company. The names of all other subsidiaries of the company are omitted because, considered in the aggregate as a single subsidiary, they would not constitute a significant subsidiary as of December 31, 2021.
(31.1) Certification by principal executive officer of Periodic Financial Report pursuant to Rule 13a-14(a).
(31.2) Certification by principal financial officer of Periodic Financial Report pursuant to Rule 13a-14(a).

40
(32.1) Certification by chief executive officer of Periodic Financial Report pursuant to Rule 13a-14(b) and 18 U.S.C. Section 1350.
(32.2) Certification by chief financial officer of Periodic Financial Report pursuant to Rule 13a-14(b) and 18 U.S.C. Section 1350.
(101) Interactive Data Files (formatted as Inline XBRL).
(104) Cover Page Interactive Data File (formatted as Inline XBRL and contained in Exhibit 101).
Copies of Exhibits may be acquired upon written request of any shareholder to the vice president, investor relations, Imperial Oil Limited, 505 Quarry Park Boulevard S.E., Calgary, Alberta T2C 5N1, and payment of processing and mailing costs.
Item 16. Form 10-K summary Not applicable.

41
SIGNATURES Pursuant to the requirements of Section 13 or 15(d) of the Securities Exchange Act of 1934, the registrant has duly caused this report to be signed on its behalf on February 23, 2022 by the undersigned, thereunto duly authorized.
Imperial Oil Limited by /s/ Bradley W. Corson
(Bradley W. Corson) Chairman, president and chief executive officer
Pursuant to the requirements of the Securities Exchange Act of 1934, this report has been signed below on February 23, 2022 by the following persons on behalf of the registrant and in the capacities indicated.
Signature Title
/s/ Bradley W. Corson
(Bradley W. Corson)
Chairman, president and chief executive officer and director
(Principal executive officer)
/s/ Daniel E. Lyons
(Daniel E. Lyons)
Senior vice-president, finance and administration, and controller
(Principal financial officer and principal accounting officer)
/s/ David W. Cornhill
(David W. Cornhill)
Director
/s/ Matthew R. Crocker
(Matthew R. Crocker)
Director
/s/ Krystyna T. Hoeg Director
(Krystyna T. Hoeg)
/s/ Miranda C. Hubbs
(Miranda C. Hubbs)
Director
/s/ Jack M. Mintz
(Jack M. Mintz)
Director
/s/ David S. Sutherland
(David S. Sutherland)
Director
42
Financial section Table of contents Page
Financial information (U.S. GAAP) ..................................................................................................................................... 43 Frequently used terms ........................................................................................................................................................ 44 Management’s discussion and analysis of financial condition and results of operations .................................................... 48
Overview .................................................................................................................................................................. 48 Business environment.............................................................................................................................................. 49 Business results ....................................................................................................................................................... 52 Liquidity and capital resources ................................................................................................................................. 59 Capital and exploration expenditures ....................................................................................................................... 62 Market risks ............................................................................................................................................................. 63 Critical accounting estimates ................................................................................................................................... 65
Management’s report on internal control over financial reporting ....................................................................................... 71 Report of independent registered public accounting firm .................................................................................................... 72 Consolidated statement of income (U.S. GAAP) ................................................................................................................ 75 Consolidated statement of comprehensive income (U.S. GAAP) ....................................................................................... 76 Consolidated balance sheet (U.S. GAAP) .......................................................................................................................... 77 Consolidated statement of shareholders' equity (U.S. GAAP) ............................................................................................ 78 Consolidated statement of cash flows (U.S. GAAP) ........................................................................................................... 79 Notes to consolidated financial statements ........................................................................................................................ 80
1. Summary of significant accounting policies ......................................................................................................... 80 2. Business segments .............................................................................................................................................. 86 3. Income taxes ....................................................................................................................................................... 88 4. Employee retirement benefits .............................................................................................................................. 89 5. Other long-term obligations .................................................................................................................................. 94 6. Financial and derivative instruments .................................................................................................................... 95 7. Share-based incentive compensation programs .................................................................................................. 97 8. Investment and other income ............................................................................................................................... 98 9. Litigation and other contingencies ....................................................................................................................... 98 10. Common shares................................................................................................................................................. 99 11. Miscellaneous financial information ................................................................................................................. 100 12. Financing and additional notes and loans payable information ........................................................................ 101 13. Leases ............................................................................................................................................................. 102 14. Long-term debt ................................................................................................................................................ 104 15. Accounting for suspended exploratory well costs ............................................................................................ 104 16. Transactions with related parties ..................................................................................................................... 105 17. Other comprehensive income (loss) information .............................................................................................. 106
Supplemental information on oil and gas exploration and production activities (unaudited) ............................................. 107

43
Financial information (U.S. GAAP)
millions of Canadian dollars 2021 2020 2019
Revenues 37,508 22,284 34,002
Net income (loss):
Upstream 1,395 (2,318) 1,348
Downstream 895 553 961
Chemical 361 78 108
Corporate and other (172) (170) (217)
Net income (loss) 2,479 (1,857) 2,200
Cash and cash equivalents at year-end 2,153 771 1,718
Total assets at year-end 40,782 38,031 42,187
Long-term debt at year-end 5,054 4,957 4,961
Total debt at year-end 5,176 5,184 5,190
Other long-term obligations at year-end 3,897 4,100 3,637
Shareholders’ equity at year-end 21,735 21,418 24,276
Cash flow from operating activities 5,476 798 4,429
Per share information (Canadian dollars)
Net income (loss) per common share - basic 3.48 (2.53) 2.88
Net income (loss) per common share - diluted 3.48 (2.53) 2.88
Dividends per common share - declared 1.03 0.88 0.85

44
Frequently used terms Listed below are definitions of several of Imperial’s key business and financial performance measures. The definitions are provided to facilitate understanding of the terms and how they are calculated. These measures are not prescribed by U.S. Generally Accepted Accounting Principles (GAAP). These measures constitute “non-GAAP financial measures” under Securities and Exchange Commission Regulation G, and “specified financial measures” under National Instrument 52-112 Non-GAAP and Other Financial Measures Disclosure of the Canadian Securities Administrators. Reconciliation of these financial measures to the most comparable GAAP financial measure, and other information required by these regulations have been provided. Non-GAAP financial measures and specified financial measures are not standardized financial measures under GAAP and do not have a standardized definition. As such, these measures may not be directly comparable to measures presented by other companies and should not be considered a substitute for GAAP financial measures. Capital employed Capital employed is a non-GAAP financial measure that is a measurement of net investment. When viewed from the perspective of how capital is used by the business, it includes the company’s property, plant and equipment and other assets, less liabilities, excluding both short-term and long-term debt. When viewed from the perspective of the sources of capital employed in total for the company, it includes total debt and equity. The most directly comparable financial measure that is disclosed in the financial statements is total assets within the company’s Consolidated balance sheet. Both of these views include the company’s share of amounts applicable to equity companies, which the company believes should be included to provide a more comprehensive measurement of capital employed. Reconciliation of capital employed
millions of Canadian dollars 2021 2020 2019
From the Consolidated balance sheet
Business uses: asset and liability perspective
Total assets 40,782 38,031 42,187
Less: Total current liabilities excluding notes and loans payable (5,432) (3,153) (4,366)
Total long-term liabilities excluding long-term debt (8,439) (8,276) (8,355)
Add: Imperial's share of equity company debt 20 26 24
Total capital employed 26,931 26,628 29,490
Total company sources: Debt and equity perspective
Notes and loans payable 122 227 229
Long-term debt 5,054 4,957 4,961
Shareholders' equity 21,735 21,418 24,276
Add: Imperial's share of equity company debt 20 26 24
Total capital employed 26,931 26,628 29,490

45
Return on average capital employed (ROCE) ROCE is a non-GAAP ratio. From the perspective of the business segments, ROCE is annual business segment net income divided by average business segment capital employed (an average of the beginning and end-of-year amounts). Segment net income includes Imperial’s share of segment net income of equity companies, consistent with the definition used for capital employed, and excludes the cost of financing. Capital employed is a non-GAAP financial measure and is disclosed and reconciled above. The company’s total ROCE is net income excluding the after-tax cost of financing divided by total average capital employed. The company has consistently applied its ROCE definition for many years and views it as one of the best measures of historical capital productivity in a capital-intensive, long-term industry. Additional measures, which are more cash flow based, are used to make investment decisions. Components of return on average capital employed
millions of Canadian dollars 2021 2020 2019
From the Consolidated statement of income
Net income (loss) 2,479 (1,857) 2,200
Financing (after-tax) including Imperial's share of equity companies 40 52 66
Net income (loss) excluding financing 2,519 (1,805) 2,266
Average capital employed 26,780 28,059 29,591
Return on average capital employed (percent) – corporate total 9.4 (6.4) 7.7
Cash flows from operating activities and asset sales Cash flows from operating activities and asset sales is a non-GAAP financial measure that is the sum of the net cash provided by operating activities and proceeds from asset sales reported in the Consolidated statement of cash flows. This cash flow reflects the total sources of cash both from operating the company’s assets and from the divesting of assets. The most directly comparable financial measure that is disclosed in the financial statements is cash flows from (used in) operating activities within the company’s Consolidated statement of cash flows. The company employs a long-standing and regular disciplined review process to ensure that assets are contributing to the company’s strategic objectives. Assets are divested when they no longer meet these objectives or are worth considerably more to others. Because of the regular nature of this activity, the company believes it is useful for investors to consider sales proceeds together with cash provided by operating activities when evaluating cash available for investment in the business and financing activities, including shareholder distributions. Reconciliation of cash flows from (used in) operating activities and asset sales
millions of Canadian dollars 2021 2020 2019
From the Consolidated statement of cash flows
Cash flows from operating activities 5,476 798 4,429 Proceeds from asset sales 81 82 82
Total cash flows from operating activities and asset sales 5,557 880 4,511

46
Operating costs Operating costs is a non-GAAP financial measure that are the costs during the period to produce, manufacture, and otherwise prepare the company’s products for sale – including energy costs, staffing and maintenance costs. It excludes the cost of raw materials, taxes and interest expense and are on a before-tax basis. The most directly comparable financial measure that is disclosed in the financial statements is total expenses within the company’s Consolidated statement of income. While the company is responsible for all revenue and expense elements of net income, operating costs represent the expenses most directly under the company’s control and therefore, are useful in evaluating the company’s performance.
Reconciliation of operating costs
millions of Canadian dollars 2021 2020 2019
From the Consolidated statement of income Total expenses 34,307 24,796 32,055
Less:
Purchases of crude oil and products 23,174 13,293 20,946
Federal excise tax and fuel charge 1,928 1,736 1,808
Financing 54 64 93
Subtotal 25,156 15,093 22,847
Imperial's share of equity company expenses 61 64 76
Total operating costs 9,212 9,767 9,284
Components of operating costs
millions of Canadian dollars 2021 2020 2019
From the Consolidated statement of income Production and manufacturing 6,316 5,535 6,520
Selling and general 784 741 900
Depreciation and depletion (includes impairments) 1,977 3,293 1,598
Non-service pension and postretirement benefit 42 121 143
Exploration 32 13 47
Subtotal 9,151 9,703 9,208
Imperial's share of equity company expenses 61 64 76
Total operating costs 9,212 9,767 9,284

47
Net income (loss) excluding identified items Net income (loss) excluding identified items is a non-GAAP financial measure that is total net income (loss) excluding individually significant non-operational events with an absolute corporate total earnings impact of at least $100 million in a given quarter. The net income (loss) impact of an identified item for an individual segment in a given quarter may be less than $100 million when the item impacts several segments or several periods. The most directly comparable financial measure that is disclosed in the financial statements is net income (loss) within the company’s Consolidated statement of income. Management uses these figures to improve comparability of the underlying business across multiple periods by isolating and removing significant non-operational events from business results. The company believes this view provides investors increased transparency into business results and trends, and provides investors with a view of the business as seen through the eyes of management. Net income (loss) excluding identified items is not meant to be viewed in isolation or as a substitute for net income (loss) as prepared in accordance with U.S. GAAP. All identified items are presented on an after-tax basis. Reconciliation of net income (loss) excluding identified items
millions of Canadian dollars 2021 2020 2019
From the Consolidated statement of income
Net income (loss) (U.S. GAAP) 2,479 (1,857) 2,200
Less identified items included in Net income (loss)
Impairments - (1,171) -
Tax adjustments - - 662
Subtotal of identified items - (1,171) 662
Net income (loss) excluding identified items 2,479 (686) 1,538
48
Management’s discussion and analysis of financial condition and results of operations
Overview The following discussion and analysis of Imperial’s financial results, as well as the accompanying financial statements and related notes to consolidated financial statements to which they refer, are the responsibility of the management of Imperial Oil Limited. The company’s accounting and financial reporting fairly reflect its business model involving exploration for, and production of, crude oil and natural gas, manufacture, trade, transport and sale of crude oil, natural gas, petroleum products, petrochemicals and a variety of specialty products. Imperial, with its resource base, financial strength, disciplined investment approach and technology portfolio, is well-positioned to participate in substantial investments to develop new Canadian energy supplies. The company’s operating segments are Upstream, Downstream, Chemicals and Corporate and other. The company’s integrated business model generally reduces the company’s risk from changes in commodity prices. While commodity prices depend on supply and demand and may be volatile on a short-term basis, Imperial’s investment decisions are grounded on fundamentals reflected in its long-term business outlook, and use a disciplined approach in selecting and pursuing the most attractive investment opportunities. The corporate plan is a fundamental annual management process that is the basis for setting operating and capital objectives, in addition to providing the economic assumptions used for investment evaluation purposes. The foundation for the energy supply and demand assumptions supporting the corporate plan is ExxonMobil’s Outlook for Energy, and corporate plan volume projections are based on individual field production profiles, which are also updated annually. Price ranges for crude oil, natural gas, including price differentials, refinery and chemical margins, volumes and operating costs including greenhouse gas emission prices and foreign currency exchange rates are based on corporate plan assumptions developed annually and are utilized for investment evaluation purposes. Major investment opportunities are evaluated over a range of potential market conditions. Once major investments are made, a reappraisal process is completed to ensure relevant lessons are learned and improvements are incorporated into future projects. The term “project” as used in this report can refer to a variety of different activities and does not necessarily have the same meaning as in any government payment transparency reports.

49
Business environment Long-term business outlook The “Long-term business outlook” is based on Exxon Mobil Corporation’s Outlook for Energy (the Outlook), which combined with the near-term pathways, is used to help inform the company’s long-term business strategies and investment plans. The company’s business planning is underpinned by a deep understanding of long-term energy fundamentals. These fundamentals include energy supply and demand trends; the scale and variety of energy needs worldwide; capability, practicality and affordability of energy alternatives including low-carbon solutions; greenhouse gas emission-reduction technologies; and supportive government policies. The Outlook considers these fundamentals to form the basis for the company’s long-term business planning, investment decisions, and research programs. The Outlook reflects the company’s view of global energy demand and supply through 2050. It is a projection based on current trends in technology, government policies, consumer preferences, geopolitics, and economic development. In addition, the Outlook considers a range of scenarios - including remote scenarios - to help inform perspective of the future and enhance strategic thinking over time. Included in the range of these scenarios are the Intergovernmental Panel on Climate Change Lower 2°C and the International Energy Agency's Net Zero Emissions (IEA NZE) by 2050 scenario. To effectively evaluate the pace of change, ExxonMobil uses many scenarios to help identify signposts to provide leading indicators of future developments and allow for timely adjustments to the Outlook. The IEA describes the IEA NZE as extremely challenging, requiring all stakeholders – governments, businesses, investors and citizens – to take action this year and every year after so that the goal does not slip out of reach. The scenario assumes unprecedented and sustained energy efficiency gains, innovation and technology transfer, lower-emission investments, and globally coordinated greenhouse gas reduction policy. The IEA acknowledges that society is not on the IEA NZE pathway. By 2050, the world’s population is projected at around 9.7 billion people, or about 2 billion more than in 2019. Coincident with this population increase, the company expects worldwide economic growth to average close to 2.5 percent per year, with economic output growing by around 125 percent by 2050 compared to 2019. As economies and populations grow, and as living standards improve for billions of people, the need for energy is expected to continue to rise. Even with significant efficiency gains, global energy demand is projected to rise by almost 15 percent from 2019 to 2050. This increase in energy demand is expected to be driven by developing countries (i.e., those that are not member nations of the Organization for Economic Co-operation and Development (OECD)). As expanding prosperity drives global energy demand higher, increasing use of energy-efficient technologies and practices, as well as lower-emission products will continue to help significantly reduce energy consumption and emissions per unit of economic output over time. Substantial efficiency gains are likely in all key aspects of the world’s economy through 2050, affecting energy requirements for power generation, transportation, industrial applications, and residential and commercial needs. Under the Outlook, global electricity demand is expected to increase almost 75 percent from 2019 to 2050, with developing countries likely to account for about 80 percent of the increase. Consistent with this projection, power generation is expected to remain the largest and fastest growing major segment of global primary energy demand, supported by a wide variety of energy sources. The share of coal-fired generation is expected to decline substantially and approach 15 percent of the world’s electricity in 2050, versus nearly 35 percent in 2019, in part as a result of policies to improve air quality as well as reduce greenhouse gas emissions to address risks related to climate change. From 2019 to 2050, the amount of electricity supplied using natural gas, nuclear power, and renewables is likely to more than double, accounting for the entire growth in electricity supplies and offsetting the reduction of coal. Electricity from wind and solar is expected to increase more than 600 percent, helping total renewables (including other sources, i.e., hydropower) to account for about 80 percent of the increase in electricity supplies worldwide through 2050. Total renewables are expected reach about 50 percent of global electricity supplies by 2050. Natural gas and nuclear are also expected to increase shares over the period to 2050, reaching more than 25 percent and about 10 percent of global electricity supplies, respectively, by 2050. Supplies of electricity by energy type will reflect significant differences across regions reflecting a wide range of factors including the cost and availability of various energy supplies and policy developments.

50
Under the Outlook, energy for transportation – including cars, trucks, ships, trains and airplanes – is expected to increase by almost 25 percent from 2019 to 2050. Transportation energy demand is expected to account for over 40 percent of the growth in liquid fuels demand worldwide over this period. Light-duty vehicle demand for liquid fuels is projected to peak by around 2025 and then decline to levels seen in the early-2000s by 2050 as the impact of better fuel economy and significant growth in electric cars, led by China, Europe, and the United States, work to offset growth in the worldwide car fleet of about 75 percent. By 2050, light-duty vehicles are expected to account for around 15 percent of global liquid fuels demand. During the same time period, nearly all the world’s commercial transportation fleets are expected to continue to run on liquid fuels, including biofuels, which are widely available and offer practical advantages in providing a large quantity of energy in small volumes. Liquid fuels provide the largest share of global energy supplies today reflecting broad-based availability, affordability, ease of transportation, and fitness as a practical solution to meet a wide variety of needs. By 2050, global demand for liquid fuels is projected to grow to approximately 114 million oil-equivalent barrels per day, an increase of about 14 percent from 2019. The non-OECD share of global liquid fuels demand is expected to increase to nearly 70 percent by 2050, as liquid fuels demand in the OECD is expected to decline by more than 20 percent. Much of the global liquid fuels demand today is met by crude production from traditional conventional sources; these supplies will remain important, and significant development activity is expected to offset much of the natural declines from these fields. At the same time, a variety of emerging supply sources – including tight oil, deepwater, oil sands, natural gas liquids and biofuels – are expected to grow to help meet rising demand. The world’s resource base is sufficient to meet projected demand through 2050 as technology advances continue to expand the availability of economic and lower-carbon supply options. However, timely investments will remain critical to meeting global needs with reliable and affordable supplies. Natural gas is a lower-emission, versatile and practical fuel for a wide variety of applications, and it is expected to grow the most of any primary energy type from 2019 to 2050, meeting about 55 percent of global energy demand growth. Global natural gas demand is expected to rise nearly 35 percent from 2019 to 2050, with more than half of that increase coming from the Asia Pacific region. Significant growth in supplies of unconventional gas – the natural gas found in shale and other tight rock formations – will help meet these needs. In total, about 50 percent of the growth in natural gas supplies is expected to be from unconventional sources. At the same time, conventionally-produced natural gas is likely to remain the cornerstone of global supply, meeting more than two-thirds of worldwide demand in 2050. Liquefied natural gas (LNG) trade will expand significantly, meeting about 40 percent of the increase in global demand growth, with much of this supply expected to help meet rising demand in Asia Pacific. The world’s energy mix is highly diverse and will remain so through 2050. Oil is expected to remain the largest source of energy with its share remaining close to 30 percent in 2050. Coal is currently the second largest source of energy, but it is expected to lose that position to natural gas in the next few years. The share of natural gas is expected to reach more than 25 percent by 2050, while the share of coal falls to about half that. Nuclear power is projected to grow significantly, as many nations are likely to expand nuclear capacity to address rising electricity needs as well as energy security and environmental issues. Total renewable energy is expected to exceed 20 percent of global energy by 2050, with biomass, hydro and geothermal contributing a combined share of more than 10 percent. Total energy supplied from wind, solar and biofuels is expected to increase rapidly, growing over 420 percent from 2019 to 2050, when they are projected to be about 10 percent of the world energy mix. To meet this projected demand under the Outlook, the company anticipates that the world’s available oil and gas resource base will grow not only from new discoveries, but also from increases in previously discovered fields. Technology will underpin these increases. The investments to develop and supply resources to meet global demand through 2050 will be significant. This reflects a fundamental aspect of the oil and natural gas business as the International Energy Agency (IEA) describes in its World Energy Outlook 2021.

51
International accords and underlying regional and national regulations covering greenhouse gas emissions continue to evolve with uncertain timing and outcome, making it difficult to predict their business impact. Imperial’s estimates of potential costs related to greenhouse gas emissions align with applicable provincial and federal regulations. Additionally, Imperial uses ExxonMobil’s Outlook for Energy as a foundation for estimating energy supply and demand requirements from various energy sources and uses, and the Outlook for Energy takes into account policies established to reduce energy related greenhouse gas emissions. The climate accord reached at the Conference of the Parties (COP 21) in Paris set many new goals, and many related policies are still emerging. The Outlook for Energy reflects an environment with increasingly stringent climate policies and is consistent with the global aggregation of Nationally Determined Contributions (NDCs), as available at the end of 2020, which were submitted by signatories to the United Nations Framework Convention on Climate Change (UNFCCC) 2015 Paris Agreement. The Outlook for Energy seeks to identify potential impacts of climate related policies, which often target specific sectors. It estimates potential impacts of these policies on consumer energy demand by using various assumptions and tools – including, depending on the sector, and as applicable, use of a proxy cost of carbon or assessment of targeted policies (i.e., automotive fuel economy standards). As people and nations look for ways to reduce risks of global climate change, they will continue to need practical solutions that do not jeopardize the affordability or reliability of the energy they need. The company continues to monitor the updates to the NDCs that nations have provided around COP 26 in Glasgow in November 2021 as well as other policy developments in light of net zero ambitions recently formulated by some nations, including Canada. The information provided in the “Long-term business outlook” includes internal estimates and projections based upon ExxonMobil’s internal data and analyses, as well as publicly available information from external sources including the International Energy Agency. Advancing climate solutions Practical solutions to the world’s energy and climate challenges will benefit from market competition in addition to well-informed, well-designed and transparent policy approaches that carefully weigh costs and benefits. Such policies are likely to help manage the risks of climate change while also enabling societies to pursue other high priority goals around the world – including clean air and water, access to reliable and affordable energy, and economic progress for all people. The company encourages sound policy solutions that reduce climate-related risks across the economy at the lowest societal cost. All practical and economically viable energy sources will need to be pursued to continue meeting global energy demand, recognizing the scale and variety of worldwide energy needs, as well as the importance of expanding access to modern energy to promote better standards of living for billions of people. Imperial has a goal to achieve net zero Scope 1 and 2 greenhouse gas emissions in the company’s oil sands operations by 2050 in support of Canada’s commitment to move towards net zero emissions. To support this net-zero ambition, by the end of 2030 Imperial anticipates to reduce Scope 1 and 2 greenhouse gas emissions intensity of its operated oil sands facilities by 30 percent, compared with 2016 levels. The company plans to achieve this through implementation of lower greenhouse gas next generation technologies at its Cold Lake operation, efficiency improvements at its facilities, and the use of carbon capture and storage. In the near term, the company remains on track to meet its previous Scope 1 and Scope 2 greenhouse gas emissions intensity goal of a 10 percent reduction for operated oil sands facilities by the end of 2023, compared to 2016 levels. In June, Imperial and its industry peers announced the launch of the Oil Sands Pathways to Net Zero alliance. The goal of this unique alliance, working collectively with the federal and Alberta governments, is to achieve net zero greenhouse gas emissions from oil sands operations by 2050 to help Canada meet its climate goals.

1non-GAAP financial measure – see “Frequently used terms” section on page 44 for definition and reconciliation
52
Current business environment In early 2020, the balance of supply and demand for petroleum and petrochemical products experienced two significant disruptive effects. On the demand side, the COVID-19 pandemic spread rapidly through most areas of the world resulting in substantial reductions in consumer and business activity and significantly reduced demand for crude oil, natural gas and petroleum products. This reduction in demand coincided with announcements of increased production in certain key oil-producing countries which led to increases in inventory levels and sharp declines in prices for crude oil, natural gas and petroleum products. Through 2021, demand for petroleum and petrochemical products has continued to recover, with the company’s financial results benefiting from stronger prices and margins, notably prices for crude oil and natural gas as well as Chemical product margins. The company continues to closely monitor industry and global economic conditions amid this uneven global recovery from the COVID-19 pandemic which has brought unprecedented uncertainties to near-term economic outlooks, including recovery from the COVID-19 pandemic. The general rate of inflation in Canada and many other countries experienced a brief decline in the initial stage of the COVID-19 pandemic. However inflation rates increased in 2021 across major economies, with some regions experiencing multi-decade highs, largely reflecting overall imbalances between supply and demand recoveries from the pandemic. The underlying factors include, but are not limited to, global supply chain disruptions, shipping bottlenecks, labor market constraints and side effects from monetary and fiscal expansions. The global economic recovery remains uneven with significant uncertainty. Prices for services and materials continue to evolve in response to fast-changing commodity markets, industry activities, as well as government policies, impacting operating and capital costs. The company closely monitors market trends and works to mitigate cost impacts in all price environments through its economies of scale in global procurement, efficient project management practices, and general productivity improvements.
Business results
Consolidated
millions of Canadian dollars 2021 2020 2019
Net income (loss) (U.S. GAAP) 2,479 (1,857) 2,200
Identified items included in Net income (loss) (a)
Impairments - (1,171) -
Tax adjustments - - 662
Subtotal of identified items - (1,171) 662
Net income (loss) excluding identified items (a) 2,479 (686) 1,538 (a) Net income (loss) excluding identified items is a non-GAAP financial measure - see “Frequently used terms” section (page 44)
2021 Net income in 2021 was $2,479 million, or $3.48 per share on a diluted basis, compared to a net loss of $1,857 million or $2.53 per share in 2020. Prior year results include unfavourable identified items1 of $1,171 million after tax, related to the company's decision to no longer develop a significant portion of its unconventional portfolio. 2020 Net loss in 2020 was $1,857 million, or $2.53 per share on a diluted basis, compared to net income of $2,200 million or $2.88 per share in 2019. Current year results reflect a non-cash impairment charge of $1,171 million after tax, related to the company’s decision to no longer develop a significant portion of its unconventional portfolio. Full-year 2019 results included a favourable impact of $662 million associated with the Alberta corporate income tax rate decrease.

53
Upstream Overview Imperial produces crude oil and natural gas for sale predominantly into North American markets. Imperial’s Upstream business strategies guide the company’s exploration, development, production, research and gas marketing activities. These strategies include improving asset reliability, accelerating development and application of high impact technologies, maximizing value by capturing new business opportunities and managing the existing portfolio, as well as pursuing sustainable improvements in organizational efficiency and effectiveness. These strategies are underpinned by a relentless focus on operations integrity, commitment to innovative technologies, disciplined approach to investing and cost management, development of employees and investment in the communities within which the company operates. Imperial has a significant oil and gas resource base and a large inventory of potential projects. The company’s current investment strategy is to invest for value and select volume growth, with focus on optimization within existing assets, cost reduction opportunities and productivity enhancements that aim to deliver robust returns at a wide range of prices. The company also continues to evaluate opportunities to support long-term growth. Although actual volumes will vary from year to year, the focus is on value-add, long-term growth opportunities within the context of the factors described in Item 1A. “Risk factors”. Imperial continually evaluates opportunities, including crude shipments by rail and the pace of the development of its Aspen in-situ oil sands project, as economically justified. The upstream industry environment has a history of significant price volatility. Market demand and prices experienced a sharp decline in the first half of 2020 largely driven by the COVID-19 pandemic. Following this decline, prices improved in the second half of 2020 and throughout 2021, as supply and demand began to rebalance. Prices for most of the company’s crude oil sold are referenced to Western Canada Select (WCS) and West Texas Intermediate (WTI) oil markets. Additionally, the market price for WCS is typically lower than light and medium grades of oil, and price differentials between WCS and WTI can fluctuate. Volatility in differentials can lead to government action, such as in 2019 when the Government of Alberta imposed temporary mandatory production curtailment regulations on large producers. Mandatory curtailment was eliminated in December 2020 and the regulatory authority to impose curtailment was repealed at the end of 2021. Imperial believes prices over the long term will be driven by market supply and demand, with the demand side largely being a function of general economic activity, alternative energy sources, levels of prosperity, technology advancements, consumer preference and government policies. On the supply side, prices may be significantly impacted by political events, logistics constraints, the actions of OPEC, governments and other factors. To manage the risks associated with price, Imperial tests the resiliency of its annual plans and all major investments across a range of price scenarios. Key events In 2021, demand for petroleum and petrochemical products continued to recover, with the company’s financial results benefiting from stronger prices compared to the prior year. The company continues to closely monitor industry and global economic conditions, including recovery from the COVID-19 pandemic. Upstream asset performance met or exceeded expectations in 2021. The company continued to benefit from its actions implemented in 2020 to reduce the cost structure and improve reliability of its assets, enabling the Upstream to capture significant value and take advantage of the improving business environment throughout 2021. Upstream delivered its highest production in over 30 years, supported by Kearl achieving record annual total gross production of about 263,000 barrels per day (186,000 barrels Imperial’s share). The company adjusted its planned maintenance and turnaround activity at Kearl, eliminating its fall turnaround and transitioned to a single annual turnaround, one year ahead of schedule. During 2021, Cold Lake gross production was about 140,000 barrels per day, driven by continued focus on production optimization and reliability enhancements. As described in more detail in Item 1A. “Risk factors”, environmental risks and climate related regulations, and COVID-19 could have negative impacts on the upstream business.
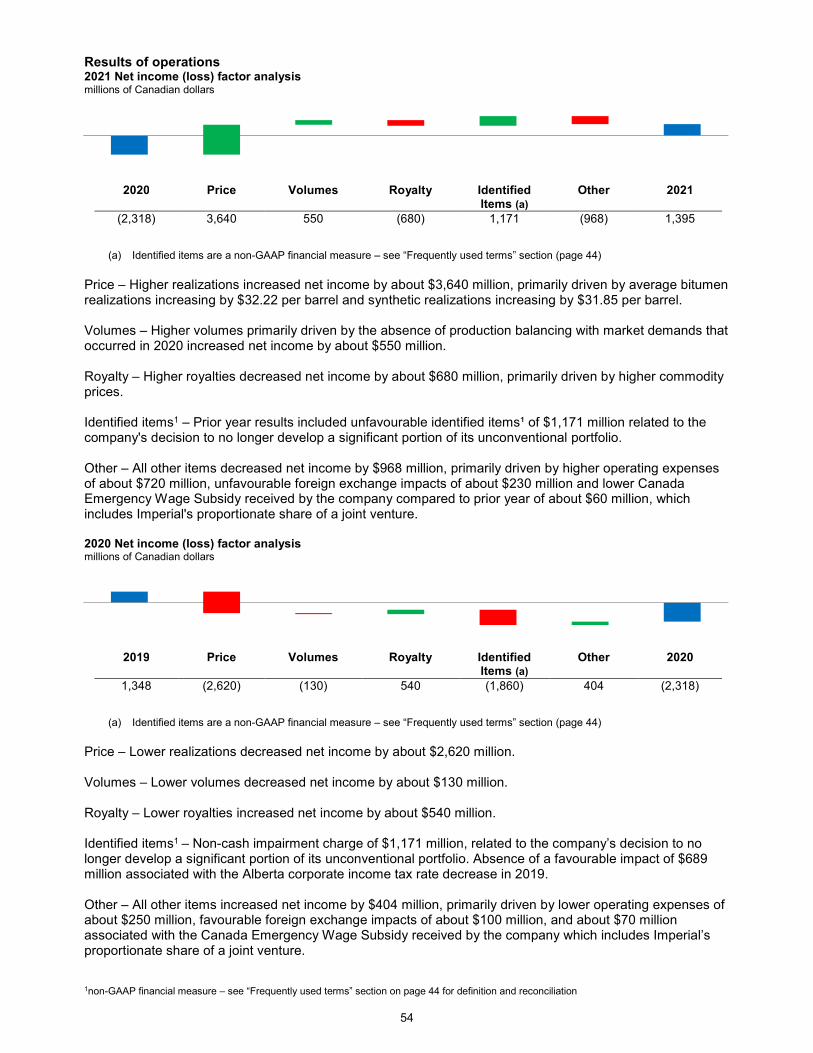
1non-GAAP financial measure – see “Frequently used terms” section on page 44 for definition and reconciliation
54
Results of operations 2021 Net income (loss) factor analysis millions of Canadian dollars
(a) Identified items are a non-GAAP financial measure – see “Frequently used terms” section (page 44)
Price – Higher realizations increased net income by about $3,640 million, primarily driven by average bitumen realizations increasing by $32.22 per barrel and synthetic realizations increasing by $31.85 per barrel. Volumes – Higher volumes primarily driven by the absence of production balancing with market demands that occurred in 2020 increased net income by about $550 million. Royalty – Higher royalties decreased net income by about $680 million, primarily driven by higher commodity prices. Identified items1 – Prior year results included unfavourable identified items¹ of $1,171 million related to the company's decision to no longer develop a significant portion of its unconventional portfolio. Other – All other items decreased net income by $968 million, primarily driven by higher operating expenses of about $720 million, unfavourable foreign exchange impacts of about $230 million and lower Canada Emergency Wage Subsidy received by the company compared to prior year of about $60 million, which includes Imperial's proportionate share of a joint venture. 2020 Net income (loss) factor analysis millions of Canadian dollars
(a) Identified items are a non-GAAP financial measure – see “Frequently used terms” section (page 44)
Price – Lower realizations decreased net income by about $2,620 million.
Volumes – Lower volumes decreased net income by about $130 million. Royalty – Lower royalties increased net income by about $540 million. Identified items1 – Non-cash impairment charge of $1,171 million, related to the company’s decision to no longer develop a significant portion of its unconventional portfolio. Absence of a favourable impact of $689 million associated with the Alberta corporate income tax rate decrease in 2019. Other – All other items increased net income by $404 million, primarily driven by lower operating expenses of about $250 million, favourable foreign exchange impacts of about $100 million, and about $70 million associated with the Canada Emergency Wage Subsidy received by the company which includes Imperial’s proportionate share of a joint venture.
2020 Price Volume Royalty Identifieditems
Other 2021
2020 Price Volume Royalty Identifieditems
Other 2021
2020 Price Volumes Royalty Identified Items (a)
Other 2021
(2,318) 3,640 550 (680) 1,171 (968) 1,395
2019 Price Volumes Royalty Identified Items (a)
Other 2020
1,348 (2,620) (130) 540 (1,860) 404 (2,318)
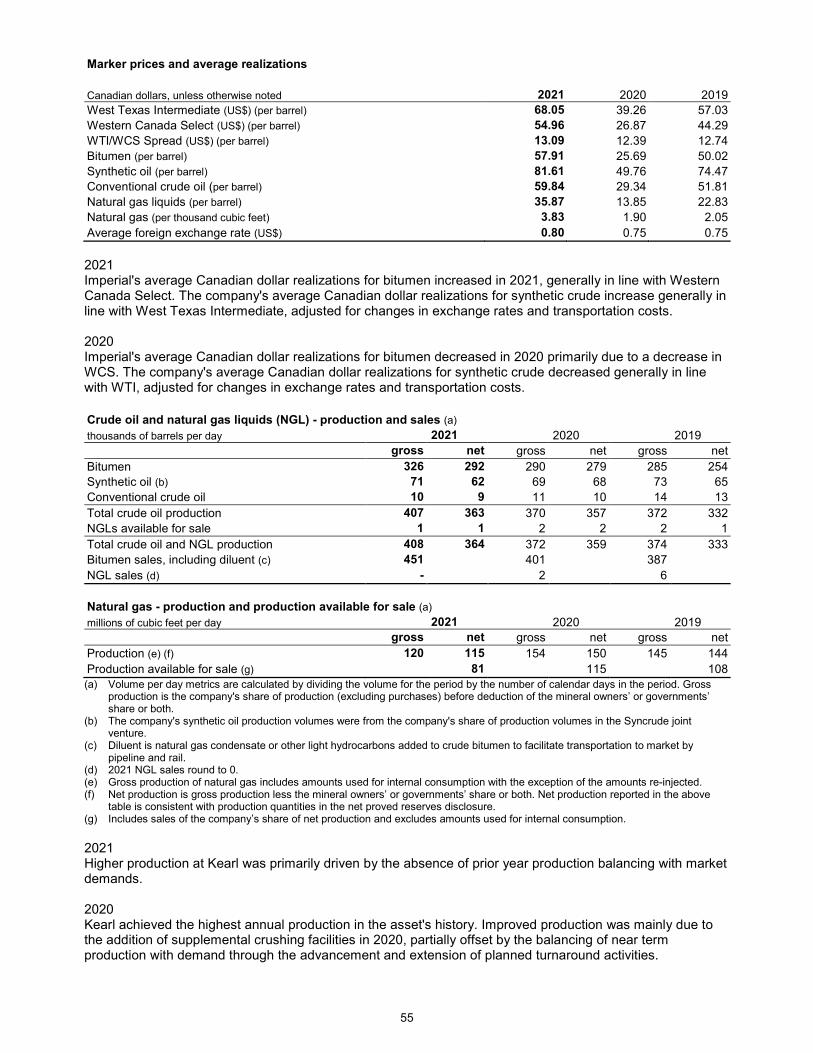
55
Marker prices and average realizations
Canadian dollars, unless otherwise noted 2021 2020 2019
West Texas Intermediate (US$) (per barrel) 68.05 39.26 57.03
Western Canada Select (US$) (per barrel) 54.96 26.87 44.29
WTI/WCS Spread (US$) (per barrel) 13.09 12.39 12.74
Bitumen (per barrel) 57.91 25.69 50.02
Synthetic oil (per barrel) 81.61 49.76 74.47
Conventional crude oil (per barrel) 59.84 29.34 51.81
Natural gas liquids (per barrel) 35.87 13.85 22.83
Natural gas (per thousand cubic feet) 3.83 1.90 2.05
Average foreign exchange rate (US$) 0.80 0.75 0.75
2021 Imperial's average Canadian dollar realizations for bitumen increased in 2021, generally in line with Western Canada Select. The company's average Canadian dollar realizations for synthetic crude increase generally in line with West Texas Intermediate, adjusted for changes in exchange rates and transportation costs. 2020 Imperial's average Canadian dollar realizations for bitumen decreased in 2020 primarily due to a decrease in WCS. The company's average Canadian dollar realizations for synthetic crude decreased generally in line with WTI, adjusted for changes in exchange rates and transportation costs. Crude oil and natural gas liquids (NGL) - production and sales (a)
thousands of barrels per day 2021 2020 2019
gross net gross net gross net
Bitumen 326 292 290 279 285 254
Synthetic oil (b) 71 62 69 68 73 65
Conventional crude oil 10 9 11 10 14 13
Total crude oil production 407 363 370 357 372 332
NGLs available for sale 1 1 2 2 2 1
Total crude oil and NGL production 408 364 372 359 374 333
Bitumen sales, including diluent (c) 451 401 387
NGL sales (d) - 2 6
Natural gas - production and production available for sale (a)
millions of cubic feet per day 2021 2020 2019
gross net gross net gross net
Production (e) (f) 120 115 154 150 145 144
Production available for sale (g) 81 115 108
(a) Volume per day metrics are calculated by dividing the volume for the period by the number of calendar days in the period. Gross production is the company's share of production (excluding purchases) before deduction of the mineral owners’ or governments’ share or both.
(b) The company's synthetic oil production volumes were from the company's share of production volumes in the Syncrude joint venture.
(c) Diluent is natural gas condensate or other light hydrocarbons added to crude bitumen to facilitate transportation to market by pipeline and rail.
(d) 2021 NGL sales round to 0. (e) Gross production of natural gas includes amounts used for internal consumption with the exception of the amounts re-injected. (f) Net production is gross production less the mineral owners’ or governments’ share or both. Net production reported in the above
table is consistent with production quantities in the net proved reserves disclosure. (g) Includes sales of the company’s share of net production and excludes amounts used for internal consumption.
2021 Higher production at Kearl was primarily driven by the absence of prior year production balancing with market demands. 2020 Kearl achieved the highest annual production in the asset's history. Improved production was mainly due to the addition of supplemental crushing facilities in 2020, partially offset by the balancing of near term production with demand through the advancement and extension of planned turnaround activities.
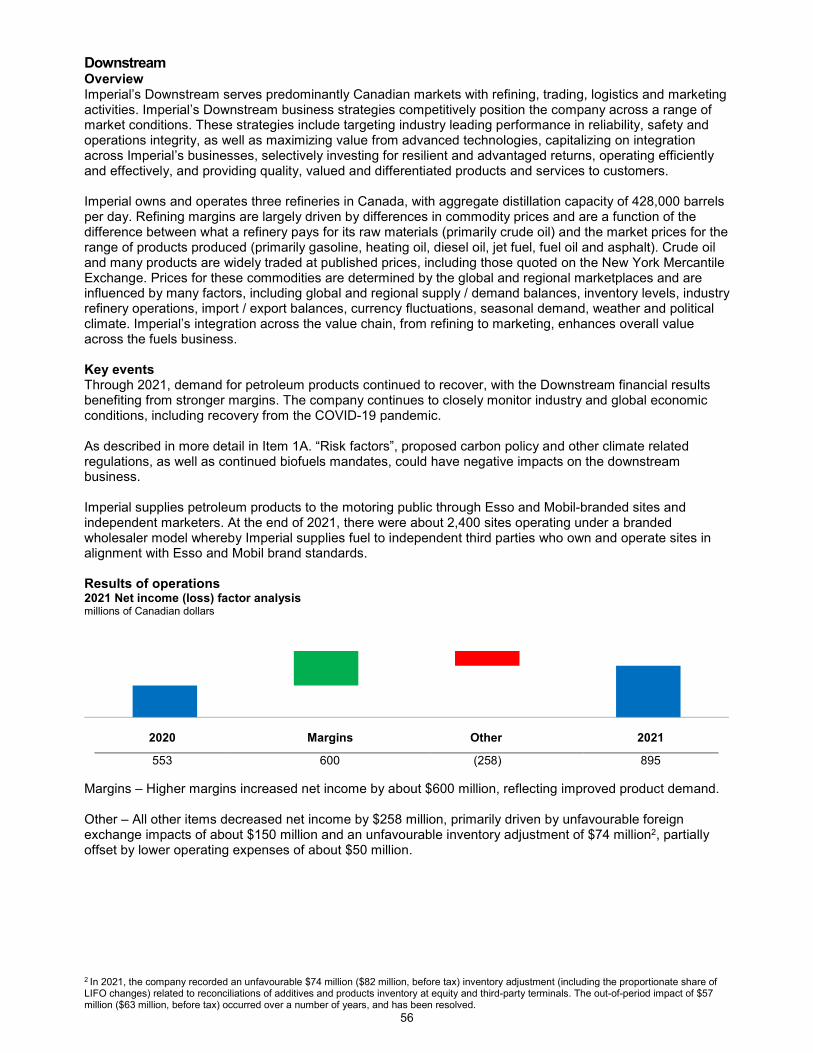
2 In 2021, the company recorded an unfavourable $74 million ($82 million, before tax) inventory adjustment (including the proportionate share of LIFO changes) related to reconciliations of additives and products inventory at equity and third-party terminals. The out-of-period impact of $57 million ($63 million, before tax) occurred over a number of years, and has been resolved.
56
Downstream Overview Imperial’s Downstream serves predominantly Canadian markets with refining, trading, logistics and marketing activities. Imperial’s Downstream business strategies competitively position the company across a range of market conditions. These strategies include targeting industry leading performance in reliability, safety and operations integrity, as well as maximizing value from advanced technologies, capitalizing on integration across Imperial’s businesses, selectively investing for resilient and advantaged returns, operating efficiently and effectively, and providing quality, valued and differentiated products and services to customers. Imperial owns and operates three refineries in Canada, with aggregate distillation capacity of 428,000 barrels per day. Refining margins are largely driven by differences in commodity prices and are a function of the difference between what a refinery pays for its raw materials (primarily crude oil) and the market prices for the range of products produced (primarily gasoline, heating oil, diesel oil, jet fuel, fuel oil and asphalt). Crude oil and many products are widely traded at published prices, including those quoted on the New York Mercantile Exchange. Prices for these commodities are determined by the global and regional marketplaces and are influenced by many factors, including global and regional supply / demand balances, inventory levels, industry refinery operations, import / export balances, currency fluctuations, seasonal demand, weather and political climate. Imperial’s integration across the value chain, from refining to marketing, enhances overall value across the fuels business. Key events Through 2021, demand for petroleum products continued to recover, with the Downstream financial results benefiting from stronger margins. The company continues to closely monitor industry and global economic conditions, including recovery from the COVID-19 pandemic. As described in more detail in Item 1A. “Risk factors”, proposed carbon policy and other climate related regulations, as well as continued biofuels mandates, could have negative impacts on the downstream business. Imperial supplies petroleum products to the motoring public through Esso and Mobil-branded sites and independent marketers. At the end of 2021, there were about 2,400 sites operating under a branded wholesaler model whereby Imperial supplies fuel to independent third parties who own and operate sites in alignment with Esso and Mobil brand standards. Results of operations 2021 Net income (loss) factor analysis millions of Canadian dollars
Margins – Higher margins increased net income by about $600 million, reflecting improved product demand. Other – All other items decreased net income by $258 million, primarily driven by unfavourable foreign exchange impacts of about $150 million and an unfavourable inventory adjustment of $74 million2, partially offset by lower operating expenses of about $50 million.
2020 Margins Other 20212020 Margins Other 2021
553 600 (258) 895

57
2020 Net income (loss) factor analysis millions of Canadian dollars
Margins – Results were negatively impacted by lower margins of about $710 million. Other – All other items increased net income by $302 million, primarily driven by lower operating expenses of about $190 million, lower turnaround impacts of about $190 million primarily related to reduced turnaround activity in the current year and improved reliability of about $180 million primarily due to the absence of the Sarnia fractionation tower incident which occurred in April 2019. These items were partially offset by lower sales volumes of about $290 million. Refinery utilization thousands of barrels per day (a) 2021 2020 2019
Total refinery throughput (b) 379 340 353 Rated capacity at December 31 (c) 428 428 423 Utilization of total refinery capacity (percent) 89 80 83 (a) Volume per day metrics are calculated by dividing the volume for the period by the number of calendar days in the period. (b) Refinery throughput is the volume of crude oil and feedstocks that is processed in the refinery atmospheric distillation units. (c) Rated capacities are based on definite specifications as to types of crude oil and feedstocks that are processed in the refinery
atmospheric distillation units, the products to be obtained and the refinery process, adjusted to include an estimated allowance for normal maintenance shutdowns. Accordingly, actual capacities may be higher or lower than rated capacities due to changes in refinery operation and the type of crude oil available for processing.
2021 Improved refinery throughput in 2021 primarily reflects reduced impacts associated with the COVID-19 pandemic, partially offset by a planned turnaround at Strathcona. 2020 Lower throughput was driven by reduced demand due to the COVID-19 pandemic, partially offset by lower refinery turnaround activity and reliability events, including impacts from the Sarnia fractionation tower incident which occurred in April 2019. Petroleum product sales thousands of barrels per day (a) 2021 2020 2019
Gasolines 224 215 249 Heating, diesel and jet fuels 160 146 167 Heavy fuel oils 27 20 21 Lube oils and other products 45 40 38
Net petroleum product sales 456 421 475
(a) Volume per day metrics are calculated by dividing the volume for the period by the number of calendar days in the period.
2021 Improved petroleum product sales in 2021 primarily reflects reduced impacts associated with the COVID-19 pandemic. 2020 Lower petroleum product sales were primarily driven by reduced demand due to the COVID-19 pandemic.
2020 Margins Other 20212019 Margins Other 2020
961 (710) 302 553
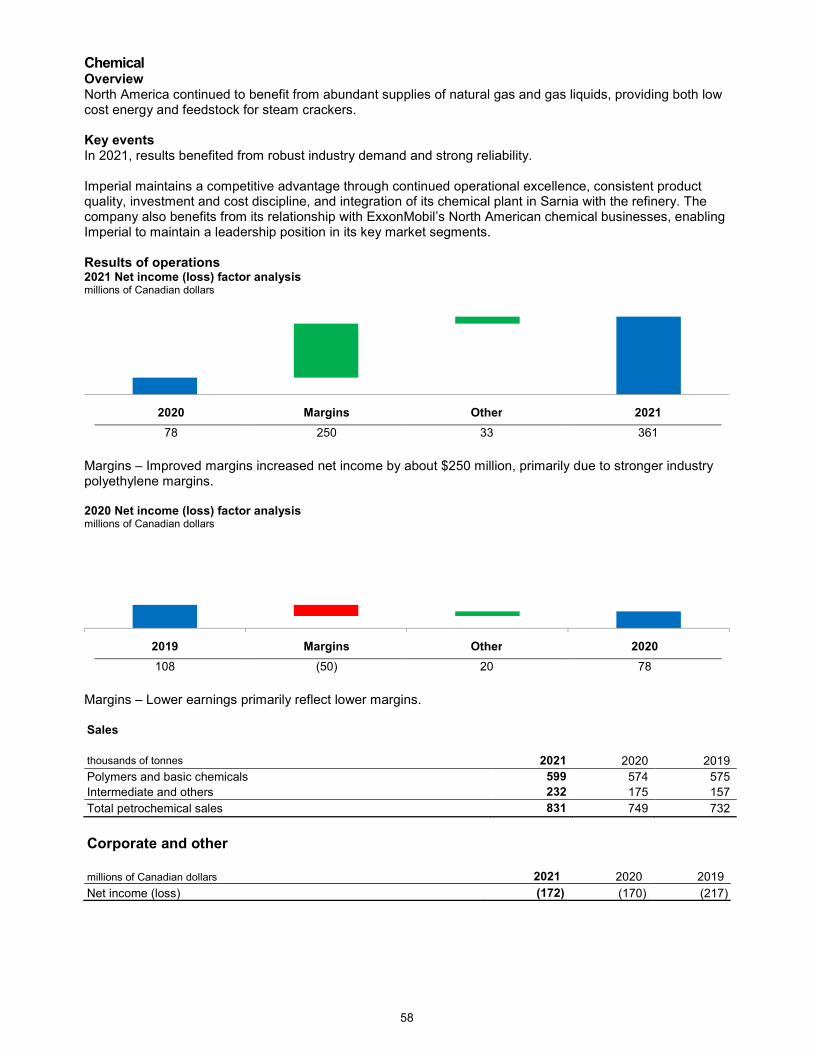
58
Chemical Overview North America continued to benefit from abundant supplies of natural gas and gas liquids, providing both low cost energy and feedstock for steam crackers. Key events In 2021, results benefited from robust industry demand and strong reliability. Imperial maintains a competitive advantage through continued operational excellence, consistent product quality, investment and cost discipline, and integration of its chemical plant in Sarnia with the refinery. The company also benefits from its relationship with ExxonMobil’s North American chemical businesses, enabling Imperial to maintain a leadership position in its key market segments. Results of operations 2021 Net income (loss) factor analysis millions of Canadian dollars
Margins – Improved margins increased net income by about $250 million, primarily due to stronger industry polyethylene margins. 2020 Net income (loss) factor analysis millions of Canadian dollars
Margins – Lower earnings primarily reflect lower margins. Sales thousands of tonnes 2021 2020 2019
Polymers and basic chemicals 599 574 575
Intermediate and others 232 175 157
Total petrochemical sales 831 749 732
Corporate and other
millions of Canadian dollars 2021 2020 2019
Net income (loss) (172) (170) (217)
2020 Margins Other 2021
2020 Margins Other 2021
2020 Margins Other 2021
78 250 33 361
2019 Margins Other 2020
108 (50) 20 78

59
Liquidity and capital resources Sources and uses of cash The company issues long-term debt from time to time and maintains a commercial paper program. However, internally generated funds cover the majority of its financial requirements. Cash that may be temporarily surplus to the company’s immediate needs is carefully managed through counterparty quality and investment guidelines to ensure that it is secure and readily available to meet the company’s cash requirements and to optimize returns. Cash flows from operating activities are highly dependent on crude oil and natural gas prices, as well as petroleum and chemical product margins. In addition, to provide for cash flow in future periods, the company needs to continually find and develop new resources, and continue to develop and apply new technologies to existing fields in order to maintain or increase production. The company’s financial strength enables it to make large, long-term capital expenditures. Imperial’s portfolio of development opportunities and the complementary nature of its business segments help mitigate the overall risks for the company and its cash flows. Further, due to its financial strength, debt capacity and portfolio of opportunities, the risk associated with delay of any single project would not have a significant impact on the company’s liquidity or ability to generate sufficient cash flows for its operations and fixed commitments. Funding of registered retirement plans complies with federal and provincial pension regulations, and the company makes contributions to the plans based on an independent actuarial valuation completed at least once every three years depending on funding status. The most recent valuation of the company’s registered retirement plans was completed as at December 31, 2019. The company contributed $164 million to the registered retirement plans in 2021. Future funding requirements are not expected to affect the company’s existing capital investment plans or its ability to pursue new investment opportunities. millions of Canadian dollars 2021 2020 2019
Cash provided by (used in)
Operating activities 5,476 798 4,429
Investing activities (1,012) (802) (1,704)
Financing activities (3,082) (943) (1,995)
Increase (decrease) in cash and cash equivalents 1,382 (947) 730
Cash and cash equivalents at end of year 2,153 771 1,718
Cash flow from operating activities 2021 Cash flow generated from operating activities primarily reflects higher Upstream realizations and stronger Downstream margins. 2020 Cash flow generated from operating activities primarily reflects lower realizations in the Upstream and unfavourable working capital impacts. Cash flow from investing activities 2021 Investing activities used net cash of $1,012 million in 2021, up from $802 million used in 2020, primarily reflecting higher additions to property, plant and equipment. 2020 Investing activities used net cash of $802 million in 2020, compared to $1,704 million used in 2019, primarily reflecting lower additions to property, plant and equipment.
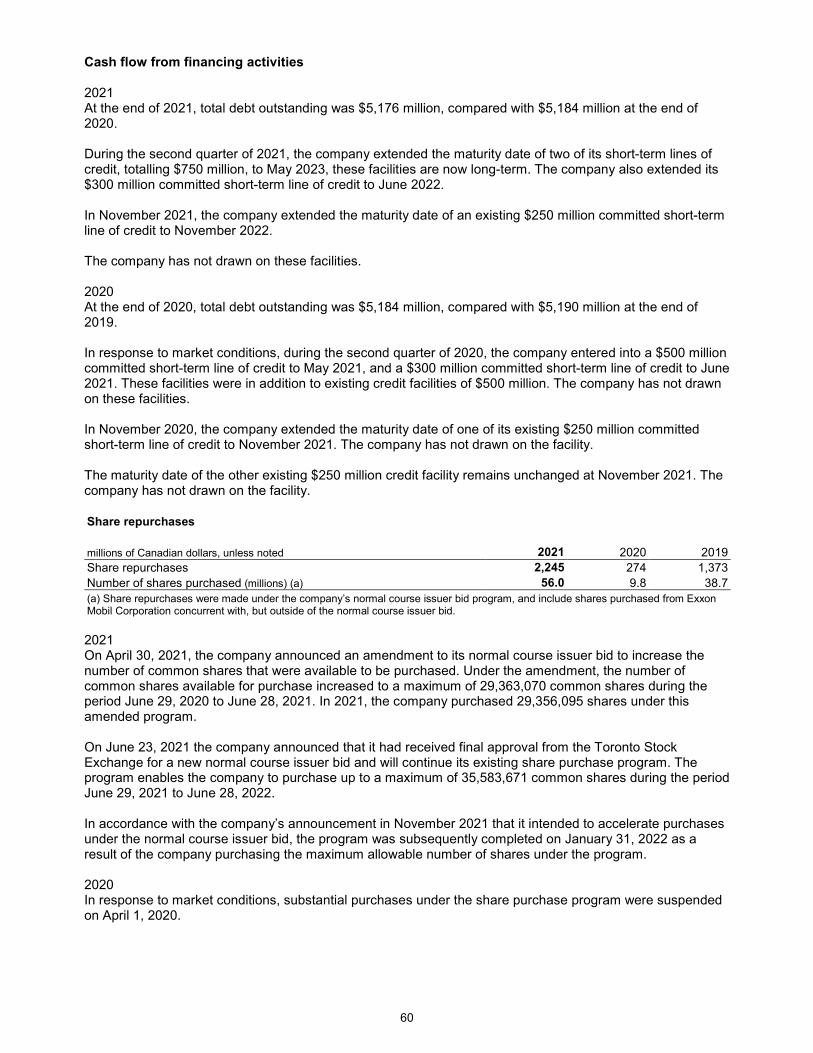
60
Cash flow from financing activities 2021 At the end of 2021, total debt outstanding was $5,176 million, compared with $5,184 million at the end of 2020. During the second quarter of 2021, the company extended the maturity date of two of its short-term lines of credit, totalling $750 million, to May 2023, these facilities are now long-term. The company also extended its $300 million committed short-term line of credit to June 2022.
In November 2021, the company extended the maturity date of an existing $250 million committed short-term line of credit to November 2022.
The company has not drawn on these facilities. 2020 At the end of 2020, total debt outstanding was $5,184 million, compared with $5,190 million at the end of 2019.
In response to market conditions, during the second quarter of 2020, the company entered into a $500 million committed short-term line of credit to May 2021, and a $300 million committed short-term line of credit to June 2021. These facilities were in addition to existing credit facilities of $500 million. The company has not drawn on these facilities. In November 2020, the company extended the maturity date of one of its existing $250 million committed short-term line of credit to November 2021. The company has not drawn on the facility. The maturity date of the other existing $250 million credit facility remains unchanged at November 2021. The company has not drawn on the facility. Share repurchases
millions of Canadian dollars, unless noted 2021 2020 2019
Share repurchases 2,245 274 1,373
Number of shares purchased (millions) (a) 56.0 9.8 38.7
(a) Share repurchases were made under the company’s normal course issuer bid program, and include shares purchased from Exxon Mobil Corporation concurrent with, but outside of the normal course issuer bid.
2021 On April 30, 2021, the company announced an amendment to its normal course issuer bid to increase the number of common shares that were available to be purchased. Under the amendment, the number of common shares available for purchase increased to a maximum of 29,363,070 common shares during the period June 29, 2020 to June 28, 2021. In 2021, the company purchased 29,356,095 shares under this amended program. On June 23, 2021 the company announced that it had received final approval from the Toronto Stock Exchange for a new normal course issuer bid and will continue its existing share purchase program. The program enables the company to purchase up to a maximum of 35,583,671 common shares during the period June 29, 2021 to June 28, 2022. In accordance with the company’s announcement in November 2021 that it intended to accelerate purchases under the normal course issuer bid, the program was subsequently completed on January 31, 2022 as a result of the company purchasing the maximum allowable number of shares under the program. 2020 In response to market conditions, substantial purchases under the share purchase program were suspended on April 1, 2020.

61
Dividends
millions of Canadian dollars, unless noted 2021 2020 2019
Dividends paid 706 649 631
Per share dividend paid (dollars) 0.98 0.88 0.82
Financial strength The table below shows Imperial’s consolidated debt-to-capital ratio. The data demonstrates the company’s creditworthiness: percent
At December 31 2021 2020 2019
Debt to capital (a) 19 19 18
(a) Debt, defined as the sum of “Notes and loans payable” and “Long-term debt” (page 77), divided by capital, defined as the sum of debt and “Total shareholders’ equity” (page 77).
Debt-related interest incurred in 2021, before capitalization of interest, was $63 million, compared with $102 million in 2020. The average effective interest rate on the company’s debt was 1.2 percent in 2021, compared with 2.0 percent in 2020. The company’s financial strength represents a competitive advantage of strategic importance providing it the opportunity to readily access capital markets across a range of market conditions and enables the company to take on large, long-term capital commitments in the pursuit of maximizing shareholder value. Contractual obligations The company has contractual obligations involving commitments to third parties that impact its liquidity and capital resource needs. These contractual obligations are primarily for leases, debt, asset retirement obligations, pension and other postretirement benefits, other long-term obligations, and firm capital commitments. Further information on this topic can be found in notes 4, 5, 13 and 14 to the consolidated financial statements. Other long-term purchase agreements are commitments that are non-cancelable, or cancelable only under certain conditions, as well as long-term commitments, other than unconditional purchase obligations. They include primarily transportation services agreements, raw material supply and community benefits agreements. The total obligation at year-end 2021 was $8.7 billion, of which $697 million is due in 2022, and $746 million is due in 2023. At March 31, 2021, due to the termination of transportation services agreements related to a third-party pipeline project, other long-term purchase agreements decreased by approximately $2.9 billion. The majority of these commitments related to years 2026 and beyond.

62
Litigation and other contingencies As discussed in note 9 to the consolidated financial statements on page 98, a variety of claims have been made against Imperial and its subsidiaries. Based on a consideration of all relevant facts and circumstances, the company does not believe the ultimate outcome of any currently pending lawsuits against the company will have a material adverse effect on the company’s operations, financial condition, or financial statements taken as a whole. Additionally, as discussed in note 9, Imperial was contingently liable at December 31, 2021, for guarantees relating to performance under contracts. These guarantees do not have a material effect on the company’s operations, financial condition, or financial statements taken as a whole. There are no events or uncertainties beyond those already included in reported financial information that would indicate a material change in future operating results or financial condition.
Capital and exploration expenditures Capital and exploration expenditures represent the combined total of additions at cost to property, plant and equipment, additions to finance leases, additional investments and acquisitions; exploration expenses on a before-tax basis from the Consolidated statement of income; and the company’s share of similar costs for equity companies. Capital and exploration expenditures exclude the purchase of carbon emission credits. While Imperial’s management is responsible for all investments and elements of net income, particular focus is placed on managing the controllable aspects of this group of expenditures. millions of Canadian dollars 2021 2020
Upstream (a) 632 561
Downstream 476 251
Chemical 8 21
Corporate and other 24 41
Total 1,140 874
(a) Exploration expenses included.
For the Upstream segment, capital and exploration expenditures were primarily related to sustaining activity in support of the company’s in-situ and oil sands assets. For the Downstream segment, capital expenditures were primarily for enhancing the company’s distribution network as well as refinery projects to improve reliability, feedstock flexibility, energy efficiency and environmental performance. Total capital and exploration expenditures are expected to be approximately $1.4 billion in 2022. Expected capital and exploration expenditures for 2022 includes firm capital commitments of $290 million for the construction and purchase of fixed assets and other permanent investments. An additional $354 million of firm capital commitments have been made for years 2023 and beyond. Actual spending could vary depending on the progress of individual projects.
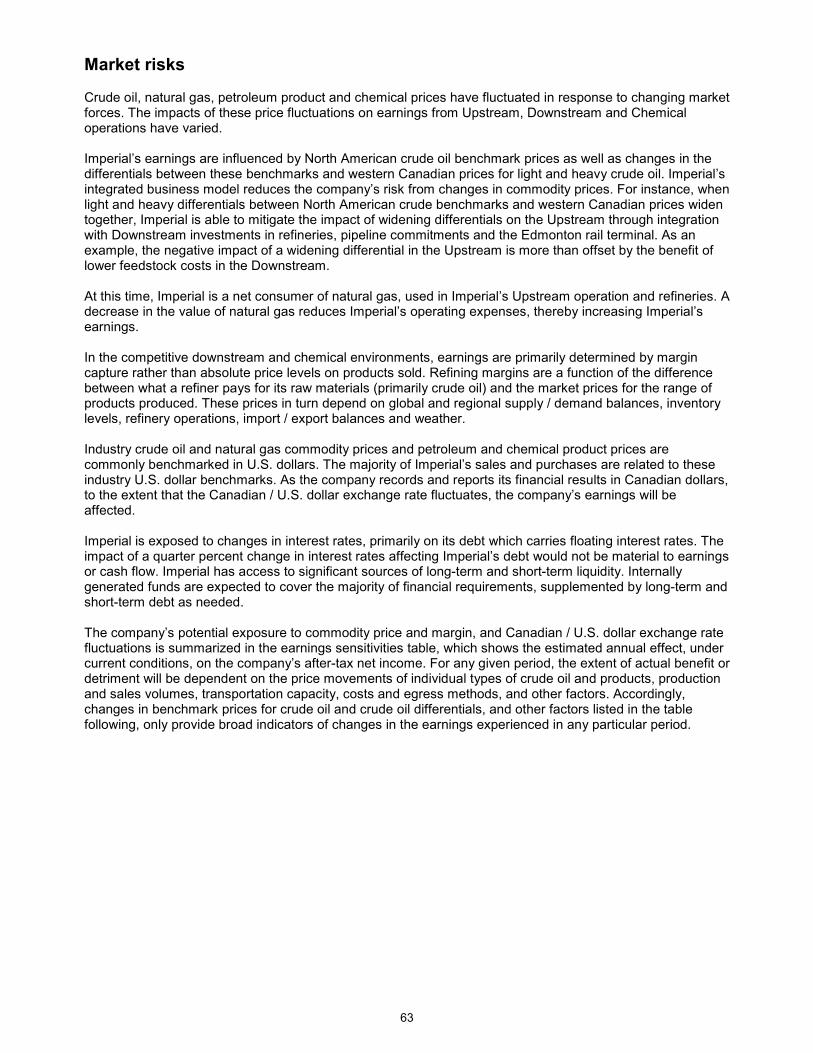
63
Market risks Crude oil, natural gas, petroleum product and chemical prices have fluctuated in response to changing market forces. The impacts of these price fluctuations on earnings from Upstream, Downstream and Chemical operations have varied. Imperial’s earnings are influenced by North American crude oil benchmark prices as well as changes in the differentials between these benchmarks and western Canadian prices for light and heavy crude oil. Imperial’s integrated business model reduces the company’s risk from changes in commodity prices. For instance, when light and heavy differentials between North American crude benchmarks and western Canadian prices widen together, Imperial is able to mitigate the impact of widening differentials on the Upstream through integration with Downstream investments in refineries, pipeline commitments and the Edmonton rail terminal. As an example, the negative impact of a widening differential in the Upstream is more than offset by the benefit of lower feedstock costs in the Downstream. At this time, Imperial is a net consumer of natural gas, used in Imperial’s Upstream operation and refineries. A decrease in the value of natural gas reduces Imperial’s operating expenses, thereby increasing Imperial’s earnings. In the competitive downstream and chemical environments, earnings are primarily determined by margin capture rather than absolute price levels on products sold. Refining margins are a function of the difference between what a refiner pays for its raw materials (primarily crude oil) and the market prices for the range of products produced. These prices in turn depend on global and regional supply / demand balances, inventory levels, refinery operations, import / export balances and weather. Industry crude oil and natural gas commodity prices and petroleum and chemical product prices are commonly benchmarked in U.S. dollars. The majority of Imperial’s sales and purchases are related to these industry U.S. dollar benchmarks. As the company records and reports its financial results in Canadian dollars, to the extent that the Canadian / U.S. dollar exchange rate fluctuates, the company’s earnings will be affected. Imperial is exposed to changes in interest rates, primarily on its debt which carries floating interest rates. The impact of a quarter percent change in interest rates affecting Imperial’s debt would not be material to earnings or cash flow. Imperial has access to significant sources of long-term and short-term liquidity. Internally generated funds are expected to cover the majority of financial requirements, supplemented by long-term and short-term debt as needed. The company’s potential exposure to commodity price and margin, and Canadian / U.S. dollar exchange rate fluctuations is summarized in the earnings sensitivities table, which shows the estimated annual effect, under current conditions, on the company’s after-tax net income. For any given period, the extent of actual benefit or detriment will be dependent on the price movements of individual types of crude oil and products, production and sales volumes, transportation capacity, costs and egress methods, and other factors. Accordingly, changes in benchmark prices for crude oil and crude oil differentials, and other factors listed in the table following, only provide broad indicators of changes in the earnings experienced in any particular period.
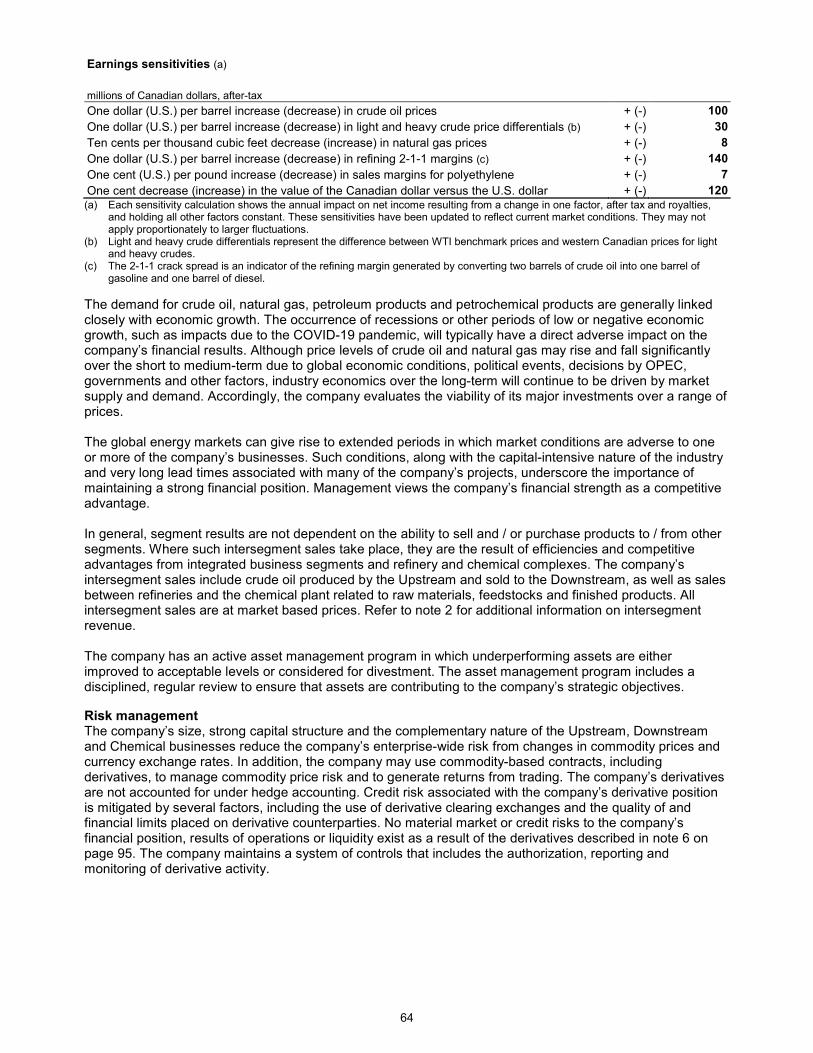
64
Earnings sensitivities (a)
millions of Canadian dollars, after-tax
One dollar (U.S.) per barrel increase (decrease) in crude oil prices + (-) 100
One dollar (U.S.) per barrel increase (decrease) in light and heavy crude price differentials (b) + (-) 30
Ten cents per thousand cubic feet decrease (increase) in natural gas prices + (-) 8
One dollar (U.S.) per barrel increase (decrease) in refining 2-1-1 margins (c) + (-) 140
One cent (U.S.) per pound increase (decrease) in sales margins for polyethylene + (-) 7
One cent decrease (increase) in the value of the Canadian dollar versus the U.S. dollar + (-) 120 (a) Each sensitivity calculation shows the annual impact on net income resulting from a change in one factor, after tax and royalties,
and holding all other factors constant. These sensitivities have been updated to reflect current market conditions. They may not apply proportionately to larger fluctuations.
(b) Light and heavy crude differentials represent the difference between WTI benchmark prices and western Canadian prices for light and heavy crudes.
(c) The 2-1-1 crack spread is an indicator of the refining margin generated by converting two barrels of crude oil into one barrel of gasoline and one barrel of diesel.
The demand for crude oil, natural gas, petroleum products and petrochemical products are generally linked closely with economic growth. The occurrence of recessions or other periods of low or negative economic growth, such as impacts due to the COVID-19 pandemic, will typically have a direct adverse impact on the company’s financial results. Although price levels of crude oil and natural gas may rise and fall significantly over the short to medium-term due to global economic conditions, political events, decisions by OPEC, governments and other factors, industry economics over the long-term will continue to be driven by market supply and demand. Accordingly, the company evaluates the viability of its major investments over a range of prices. The global energy markets can give rise to extended periods in which market conditions are adverse to one or more of the company’s businesses. Such conditions, along with the capital-intensive nature of the industry and very long lead times associated with many of the company’s projects, underscore the importance of maintaining a strong financial position. Management views the company’s financial strength as a competitive advantage. In general, segment results are not dependent on the ability to sell and / or purchase products to / from other segments. Where such intersegment sales take place, they are the result of efficiencies and competitive advantages from integrated business segments and refinery and chemical complexes. The company’s intersegment sales include crude oil produced by the Upstream and sold to the Downstream, as well as sales between refineries and the chemical plant related to raw materials, feedstocks and finished products. All intersegment sales are at market based prices. Refer to note 2 for additional information on intersegment revenue. The company has an active asset management program in which underperforming assets are either improved to acceptable levels or considered for divestment. The asset management program includes a disciplined, regular review to ensure that assets are contributing to the company’s strategic objectives.
Risk management The company’s size, strong capital structure and the complementary nature of the Upstream, Downstream and Chemical businesses reduce the company’s enterprise-wide risk from changes in commodity prices and currency exchange rates. In addition, the company may use commodity-based contracts, including derivatives, to manage commodity price risk and to generate returns from trading. The company’s derivatives are not accounted for under hedge accounting. Credit risk associated with the company’s derivative position is mitigated by several factors, including the use of derivative clearing exchanges and the quality of and financial limits placed on derivative counterparties. No material market or credit risks to the company’s financial position, results of operations or liquidity exist as a result of the derivatives described in note 6 on page 95. The company maintains a system of controls that includes the authorization, reporting and monitoring of derivative activity.

65
Critical accounting estimates The company’s financial statements have been prepared in accordance with United States Generally Accepted Accounting Principles (U.S. GAAP). U.S. GAAP requires management to make estimates and judgments that affect the reported amounts of assets, liabilities, revenues and expenses, and the disclosure of contingent assets and liabilities. The company’s accounting and financial reporting fairly reflect its business model involving exploration for, and production of, crude oil and natural gas; manufacture, trade, transport and sale of crude oil, natural gas, petroleum products, petrochemicals and a variety of specialty products; and pursuit of lower-emission business opportunities, including carbon capture and storage, and biofuels. Imperial does not use financing structures for the purpose of altering accounting outcomes or removing debt from the balance sheet. The company’s significant accounting policies are summarized in note 1 to the consolidated financial statements on page 80. Oil and natural gas reserves Evaluations of oil and natural gas reserves are important to the effective management of upstream assets. They are an integral part of investment decisions about oil and gas properties such as whether development should proceed. The estimation of proved reserve volumes, which is based on the requirement of reasonable certainty, is an ongoing process based on rigorous technical evaluations, commercial and market assessments, detailed analysis of well information such as flow rates and reservoir pressures, and development and production costs, and other factors. The estimation of proved reserves is controlled by the company through long-standing approval guidelines. Reserves changes are made within a well-established, disciplined process driven by qualified geoscience and engineering professionals, assisted by the reserves management group which has significant technical experience, culminating in reviews with and approval by senior management and the company’s board of directors. Notably, the company does not use specific quantitative reserves targets to determine compensation. Key features of the reserves estimation process are covered in “Disclosure of reserves” in Item 1. Oil and natural gas reserves include both proved and unproved reserves.
Proved oil and natural gas reserves are determined in accordance with U.S. Securities and Exchange Commission (SEC) requirements. Proved reserves are those quantities of oil and natural gas which, by analysis of geoscience and engineering data, can be estimated with reasonable certainty to be economically producible under existing economic and operating conditions and government regulations. Proved reserves are determined using the average of first-day-of-the-month oil and natural gas prices during the reporting year.
Proved reserves can be further subdivided into developed and undeveloped reserves. Proved developed reserves include amounts which are expected to be recovered through existing wells and facilities with existing equipment and operating methods. Proved undeveloped reserves include amounts expected to be recovered from new wells on undrilled proved acreage or from existing wells where a relatively major expenditure is required for completion. Proved undeveloped reserves are recognized only if a development plan has been adopted indicating that the reserves are scheduled to be drilled within five years, unless specific circumstances support a longer period of time. The company is reasonably certain that proved reserves will be produced. However, the timing and amount recovered can be affected by a number of factors including completion and optimization of development projects, reservoir performance, regulatory approvals, government policies, consumer preferences, royalty frameworks and significant changes in oil and natural gas price levels.
Unproved reserves are quantities of oil and natural gas with less than reasonable certainty of
recoverability and include probable reserves. Probable reserves are reserves that, together with proved reserves, are as likely as not to be recovered.
Revisions in previously estimated volumes of proved reserves for existing fields can occur due to the evaluation or re-evaluation of already available geologic, reservoir or production data; new geologic, reservoir or production data; or changes in the average of first-day-of-the-month oil and natural gas prices and / or costs that are used in the estimation of reserves. Revisions can also result from significant changes in either development strategy or production equipment / facility capacity.

66
In 2019, downward revisions to proved bitumen reserves were driven by technical and development plan updates at Kearl, resulting in a decrease of 0.2 billion barrels, partially offset by an increase of 0.1 billion barrels at Cold Lake associated with an end of field life change driven by pricing. Downward revisions to proved synthetic oil reserves were a result of higher royalty obligations at Syncrude driven by pricing. Changes to liquids and natural gas proved reserves were the result of updated development plans at the Montney and Duvernay unconventional assets and the divestment of conventional properties. In 2020, downward revisions of proved bitumen reserves were a result of low prices. The 2.2 billion barrels of bitumen at Kearl and 0.6 billion barrels of bitumen at Cold Lake no longer qualified as proved reserves under the U.S. Securities and Exchange Commission definition of proved reserves. Downward revisions to proved synthetic oil reserves were a result of lower prices, offset by the addition of proved undeveloped reserves associated with future development at Syncrude. Changes to the liquids and natural gas proved reserves were the result of updated development plans at the Montney and Duvernay unconventional assets and the divestment of conventional properties. In 2021, upward revisions of proved bitumen reserves were a result of improved prices. The 1.7 billion barrels of bitumen at Kearl and 0.5 billion barrels of bitumen at Cold Lake qualified as proved reserves under the U.S. Securities and Exchange Commission definition of proved reserves. Upward revisions to proved synthetic oil reserves were a result of improved prices. Changes to the liquids and natural gas proved reserves were the result of updated development plans and divestments at the Montney and Duvernay unconventional assets. Under the terms of certain contractual arrangements or government royalty regimes, lower prices can also increase proved reserves attributable to Imperial. The company’s operating decisions and its outlook for future production volumes are not impacted by proved reserves as disclosed under the U.S. Securities and Exchange Commission (SEC) definition. Unit-of-production depreciation Oil and natural gas reserve volumes are used as the basis to calculate unit-of-production depreciation rates for most upstream assets. Depreciation is calculated by taking the ratio of asset cost to total proved reserves or proved developed reserves applied to actual production. The volumes produced and asset cost are known, while proved reserves are based on estimates that are subject to some variability. In the event that the unit-of-production method does not result in an equitable allocation of cost over the economic life of an upstream asset, an alternative method is used. The straight-line method is used in limited situations where the expected life of the asset does not reasonably correlate with that of the underlying reserves. For example, certain assets used in the production of oil and natural gas have a shorter life than the reserves, and as such, the company uses straight-line depreciation to ensure the asset is fully depreciated by the end of its useful life. To the extent that proved reserves for a property are substantially de-booked and that property continues to produce such that the resulting depreciation charge does not result in an equitable allocation of cost over the expected life, assets will be depreciated using a unit-of-production method based on reserves determined at the most recent SEC price which results in a more meaningful quantity of proved reserves, appropriately adjusted for production and technical changes. This approach was applied in 2021, with the corresponding effect on depreciation expense being immaterial compared to prior periods. For 2022, all properties have sufficient reserves at current SEC prices which will enable equitable allocation of cost over the economic lives of the Upstream assets.

67
Impact of oil and gas reserves and prices and margins on testing for impairment The company tests assets or groups of assets for recoverability on an ongoing basis whenever events or changes in circumstances indicate that the carrying amounts may not be recoverable. The company has a robust process to monitor for indicators of potential impairment across its asset groups throughout the year. This process is aligned with the requirements of ASC 360 and ASC 932 and relies, in part, on the company’s planning and budgeting cycle. Because the lifespans of the vast majority of the company’s major assets are measured in decades, the future cash flows of these assets are predominantly based on long-term oil and natural gas commodity prices, industry margins, and development and production costs. Significant reductions in the company’s view of oil or natural gas commodity prices or margin ranges, especially the longer-term prices and margins, and changes in the development plans, including decisions to defer, reduce or eliminate planned capital spending, can be an indicator of potential impairment. Other events or changes in circumstances, including indicators outlined in ASC 360 can be indicators of potential impairment as well. In general, Imperial does not view temporarily low prices or margins as an indication of impairment. Management believes that prices over the long term must be sufficient to generate investments in energy supply to meet global demand. Although prices will occasionally drop significantly, industry prices over the long term will continue to be driven by market supply and demand fundamentals. On the supply side, industry production from mature fields is declining. This is being offset by investments to generate production from new discoveries, field developments, and technology and efficiency advancements. OPEC investment activities and production policies also have an impact on world oil supplies. The demand side is largely a function of general economic activities, alternative energy sources and levels of prosperity. During the lifespan of its major assets, the company expects that oil and gas prices and industry margins will experience significant volatility, and consequently, these assets will experience periods of higher earnings and periods of lower earnings, or even losses. In assessing whether events or changes in circumstances indicate the carrying value of an asset may not be recoverable, the company considers recent periods of operating losses in the context of its longer-term view of prices and margins. Energy Outlook and cash flow assessment The annual planning and budgeting process, known as the company plan, is the mechanism by which resources (capital, operating expenses and people) are allocated across the company. The foundation for the energy supply and demand assumptions supporting the company plan begins with Exxon Mobil Corporation’s Outlook for Energy (the Outlook), which contains demand and supply projections based on its assessment of current trends in technology, government policies, consumer preferences, geopolitics, and economic development. Reflective of the existing global policy environment, the Outlook does not project the degree of required future policy and technology advancement and deployment for the world or the company, to meet net-zero by 2050. As future policies and technology advancements emerge, they will be incorporated into the Outlook, and consequently, the company’s business plans will be updated accordingly.

68
If events or changes in circumstances indicate that the carrying value of an asset may not be recoverable, the company estimates the future undiscounted cash flows of the affected properties to judge the recoverability of carrying amounts. Cash flows used in recoverability assessments are based on the assumptions developed in the company plan, which is reviewed and approved by the board of directors, and are consistent with the criteria management uses to evaluate investment opportunities. These evaluations make use of the company’s assumptions of future capital allocations, crude oil and natural gas commodity prices including price differentials, refining and chemical margins, volumes, development and operating costs, including greenhouse gas emissions prices, and foreign currency exchange rates. Volumes are based on projected field and facility production profiles, throughput, or sales. Management’s estimate of upstream production volumes used for projected cash flows makes use of proved reserve quantities and may include risk-adjusted unproved reserve quantities. The greenhouse gas emission prices reflect existing or anticipated policy actions of applicable provincial and federal governments. While third-party scenarios, such as the International Energy Agency Net Zero Emissions by 2050, may be used to test the resiliency of company’s businesses or strategies, they are not used as a basis for developing future cash flows for impairment assessments. Fair value of impaired assets An asset group is impaired if its estimated future undiscounted cash flows are less than the asset group’s carrying value. Impairments are measured by the amount by which the carrying value exceeds fair value. The assessment of fair value is based on the views of a likely market participant. The principal parameters used to establish fair value include estimates of acreage values and flowing production metrics from comparable market transactions, market-based estimates of historical cash flow multiples, and discounted cash flows. Inputs and assumptions used in discounted cash flow models include estimates of future production volumes, throughput and product sales volumes, commodity prices which are consistent with the average of third-party industry experts and government agencies, drilling and development costs, operating costs, and discount rates which are reflective of the characteristics of the asset group. Other impairment estimates Unproved properties are assessed periodically to determine whether they have been impaired. Significant unproved properties are assessed for impairment individually, and valuation allowances against the capitalized costs are recorded based on the company’s future development plans, the estimated economic chance of success and the length of time that the company expects to hold the properties. Properties that are not individually significant are aggregated by groups and amortized based on development risk and average holding period. Long-lived assets that are held for sale are evaluated for possible impairment by comparing the carrying value of the asset with its fair value less the cost to sell. If the net book value exceeds the fair value less cost to sell, the assets are considered impaired and adjusted to the lower value. Judgment is required to determine if assets are held for sale, and to determine the fair value less cost to sell. Investments in equity companies are assessed for possible impairment when events or changes in circumstances indicate that the carrying value of an investment may not be recoverable. Examples of key indicators include a history of operating losses, negative earnings and cash flow outlook, significant downward revisions to oil and gas reserves, and the financial condition and prospects for the investee’s business segment or geographic region. If the decline in value of the investment is other than temporary, the carrying value of the investment is written down to fair value. In the absence of market prices for the investment, discounted cash flows are used to assess fair value, which requires significant judgment. Gains on sales of proved and unproved properties are only recognized when there is neither uncertainty about the recovery of costs applicable to any interest retained nor any substantial obligation for future performance by the company. Losses on properties sold are recognized when incurred or when the properties are held for sale and the fair value of the properties is less than the carrying value.
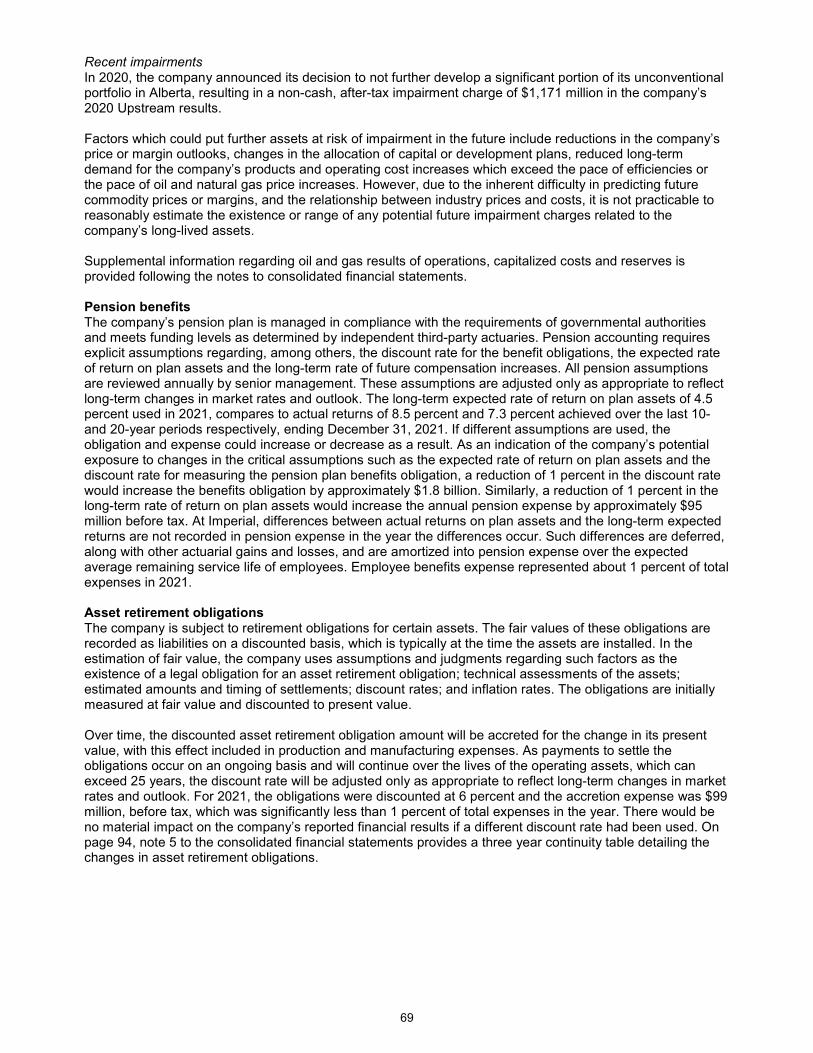
69
Recent impairments In 2020, the company announced its decision to not further develop a significant portion of its unconventional portfolio in Alberta, resulting in a non-cash, after-tax impairment charge of $1,171 million in the company’s 2020 Upstream results. Factors which could put further assets at risk of impairment in the future include reductions in the company’s price or margin outlooks, changes in the allocation of capital or development plans, reduced long-term demand for the company’s products and operating cost increases which exceed the pace of efficiencies or the pace of oil and natural gas price increases. However, due to the inherent difficulty in predicting future commodity prices or margins, and the relationship between industry prices and costs, it is not practicable to reasonably estimate the existence or range of any potential future impairment charges related to the company’s long-lived assets. Supplemental information regarding oil and gas results of operations, capitalized costs and reserves is provided following the notes to consolidated financial statements. Pension benefits The company’s pension plan is managed in compliance with the requirements of governmental authorities and meets funding levels as determined by independent third-party actuaries. Pension accounting requires explicit assumptions regarding, among others, the discount rate for the benefit obligations, the expected rate of return on plan assets and the long-term rate of future compensation increases. All pension assumptions are reviewed annually by senior management. These assumptions are adjusted only as appropriate to reflect long-term changes in market rates and outlook. The long-term expected rate of return on plan assets of 4.5 percent used in 2021, compares to actual returns of 8.5 percent and 7.3 percent achieved over the last 10- and 20-year periods respectively, ending December 31, 2021. If different assumptions are used, the obligation and expense could increase or decrease as a result. As an indication of the company’s potential exposure to changes in the critical assumptions such as the expected rate of return on plan assets and the discount rate for measuring the pension plan benefits obligation, a reduction of 1 percent in the discount rate would increase the benefits obligation by approximately $1.8 billion. Similarly, a reduction of 1 percent in the long-term rate of return on plan assets would increase the annual pension expense by approximately $95 million before tax. At Imperial, differences between actual returns on plan assets and the long-term expected returns are not recorded in pension expense in the year the differences occur. Such differences are deferred, along with other actuarial gains and losses, and are amortized into pension expense over the expected average remaining service life of employees. Employee benefits expense represented about 1 percent of total expenses in 2021. Asset retirement obligations The company is subject to retirement obligations for certain assets. The fair values of these obligations are recorded as liabilities on a discounted basis, which is typically at the time the assets are installed. In the estimation of fair value, the company uses assumptions and judgments regarding such factors as the existence of a legal obligation for an asset retirement obligation; technical assessments of the assets; estimated amounts and timing of settlements; discount rates; and inflation rates. The obligations are initially measured at fair value and discounted to present value. Over time, the discounted asset retirement obligation amount will be accreted for the change in its present value, with this effect included in production and manufacturing expenses. As payments to settle the obligations occur on an ongoing basis and will continue over the lives of the operating assets, which can exceed 25 years, the discount rate will be adjusted only as appropriate to reflect long-term changes in market rates and outlook. For 2021, the obligations were discounted at 6 percent and the accretion expense was $99 million, before tax, which was significantly less than 1 percent of total expenses in the year. There would be no material impact on the company’s reported financial results if a different discount rate had been used. On page 94, note 5 to the consolidated financial statements provides a three year continuity table detailing the changes in asset retirement obligations.
70
Suspended exploratory well costs The company continues capitalization of exploratory well costs when it has found a sufficient quantity of reserves to justify its completion as a producing well and the company is making sufficient progress assessing the reserves and the economic and operating viability of the project. Exploratory well costs not meeting these criteria are charged to expense. Assessing whether the company is making sufficient progress on a project requires careful consideration of the facts and circumstances. The facts and circumstances that support continued capitalization of suspended wells at year-end are disclosed in note 15 to the consolidated financial statements on page 104. Tax contingencies The operations of the company are complex, and related tax interpretations, regulations and legislation are continually changing. Significant management judgment is required in the accounting for income tax contingencies and tax disputes because the outcomes are often difficult to predict. The benefits of uncertain tax positions that the company has taken or expects to take in its income tax returns are recognized in the financial statements if management concludes that it is more likely than not that the position will be sustained with the tax authorities. For a position that is likely to be sustained, the benefit recognized in the financial statements is measured at the largest amount that is greater than 50 percent likely of being realized. Significant management judgment is required in the accounting for income tax contingencies and tax disputes because the outcomes are often difficult to predict. The company’s unrecognized tax benefits and a description of open tax years are summarized in note 3 to the consolidated financial statements.

71
Management’s report on internal control over financial reporting Management, including the company’s chief executive officer and principal accounting officer and principal financial officer, is responsible for establishing and maintaining adequate internal control over the company’s financial reporting. Management conducted an evaluation of the effectiveness of internal control over financial reporting based on criteria established in Internal Control – Integrated Framework (2013) issued by the Committee of Sponsoring Organizations of the Treadway Commission. Based on this evaluation, management concluded that Imperial Oil Limited’s internal control over financial reporting was effective as of December 31, 2021. PricewaterhouseCoopers LLP, an independent registered public accounting firm, audited the effectiveness of the company’s internal control over financial reporting as of December 31, 2021, as stated in their report which is included herein. /s/ Bradley W. Corson B.W. Corson Chairman, president and chief executive officer (Principal executive officer) /s/ Daniel E. Lyons D.E. Lyons Senior vice-president, finance and administration, and controller (Principal accounting officer and principal financial officer) February 23, 2022

72
Report of Independent Registered Public Accounting Firm
To the Board of Directors and Shareholders of Imperial Oil Limited
Opinions on the Financial Statements and Internal Control over Financial Reporting
We have audited the accompanying consolidated balance sheets of Imperial Oil Limited and its subsidiaries (together, the Company) as of December 31, 2021 and 2020, and the related consolidated statements of income, comprehensive income, shareholders’ equity and cash flows for each of the three years in the period ended December 31, 2021, including the related notes (collectively referred to as the consolidated financial statements). We also have audited the Company's internal control over financial reporting as of December 31, 2021, based on criteria established in Internal Control – Integrated Framework (2013) issued by the Committee of Sponsoring Organizations of the Treadway Commission (COSO).
In our opinion, the consolidated financial statements referred to above present fairly, in all material respects, the financial position of the Company as of December 31, 2021 and 2020, and the results of its operations and its cash flows for each of the three years in the period ended December 31, 2021 in conformity with accounting principles generally accepted in the United States of America. Also in our opinion, the Company maintained, in all material respects, effective internal control over financial reporting as of December 31, 2021, based on criteria established in Internal Control – Integrated Framework (2013) issued by the COSO.
Basis for Opinions
The Company's management is responsible for these consolidated financial statements, for maintaining effective internal control over financial reporting, and for its assessment of the effectiveness of internal control over financial reporting, included in the accompanying Management’s report on internal control over financial reporting. Our responsibility is to express opinions on the Company’s consolidated financial statements and on the Company's internal control over financial reporting based on our audits. We are a public accounting firm registered with the Public Company Accounting Oversight Board (United States) (PCAOB) and are required to be independent with respect to the Company in accordance with the U.S. federal securities laws and the applicable rules and regulations of the Securities and Exchange Commission and the PCAOB.
We conducted our audits in accordance with the standards of the PCAOB. Those standards require that we plan and perform the audits to obtain reasonable assurance about whether the consolidated financial statements are free of material misstatement, whether due to error or fraud, and whether effective internal control over financial reporting was maintained in all material respects.
Our audits of the consolidated financial statements included performing procedures to assess the risks of material misstatement of the consolidated financial statements, whether due to error or fraud, and performing procedures that respond to those risks. Such procedures included examining, on a test basis, evidence regarding the amounts and disclosures in the consolidated financial statements. Our audits also included evaluating the accounting principles used and significant estimates made by management, as well as evaluating the overall presentation of the consolidated financial statements. Our audit of internal control over financial reporting included obtaining an understanding of internal control over financial reporting, assessing the risk that a material weakness exists, and testing and evaluating the design and operating effectiveness of internal control based on the assessed risk. Our audits also included performing such other procedures as we considered necessary in the circumstances. We believe that our audits provide a reasonable basis for our opinions.

73
Definition and Limitations of Internal Control over Financial Reporting
A company’s internal control over financial reporting is a process designed to provide reasonable assurance regarding the reliability of financial reporting and the preparation of financial statements for external purposes in accordance with generally accepted accounting principles. A company’s internal control over financial reporting includes those policies and procedures that (i) pertain to the maintenance of records that, in reasonable detail, accurately and fairly reflect the transactions and dispositions of the assets of the company; (ii) provide reasonable assurance that transactions are recorded as necessary to permit preparation of financial statements in accordance with generally accepted accounting principles, and that receipts and expenditures of the company are being made only in accordance with authorizations of management and directors of the company; and (iii) provide reasonable assurance regarding prevention or timely detection of unauthorized acquisition, use, or disposition of the company’s assets that could have a material effect on the financial statements.
Because of its inherent limitations, internal control over financial reporting may not prevent or detect misstatements. Also, projections of any evaluation of effectiveness to future periods are subject to the risk that controls may become inadequate because of changes in conditions, or that the degree of compliance with the policies or procedures may deteriorate.
Critical Audit Matters
The critical audit matter communicated below is a matter arising from the current period audit of the consolidated financial statements that was communicated or required to be communicated to the audit committee and that (i) relates to accounts or disclosures that are material to the consolidated financial statements and (ii) involved our especially challenging, subjective, or complex judgments. The communication of critical audit matters does not alter in any way our opinion on the consolidated financial statements, taken as a whole, and we are not, by communicating the critical audit matter below, providing a separate opinion on the critical audit matter or on the accounts or disclosures to which it relates.
The Impact of Proved Oil and Natural Gas Reserves on Upstream Property, Plant and Equipment, Net
As described in Notes 1 and 2 to the consolidated financial statements, the Company’s upstream property, plant and equipment (PP&E), net balance was $27,811 million as of December 31, 2021, and the related depreciation and depletion expense for the year ended December 31, 2021 was $1,775 million. Management uses the successful efforts method to account for its exploration and production activities. Costs incurred to purchase, lease, or otherwise acquire a property (whether unproved or proved) are capitalized when incurred. As disclosed by management, proved oil and natural gas reserve volumes are used as the basis to calculate unit-of-production depreciation rates for most upstream assets. The estimation of proved oil and natural gas reserve volumes is an ongoing process based on technical evaluations, commercial and market assessments, detailed analysis of well information such as flow rates and reservoir pressures, and development and production costs, among other factors. As further disclosed by management, reserves changes are made within a well-established, disciplined process driven by qualified geoscience and engineering professionals, assisted by the reserves management group (together “management’s specialists”).
The principal considerations for our determination that performing procedures relating to the impact of proved oil and natural gas reserves on upstream PP&E, net is a critical audit matter are (i) the significant judgment by management, including the use of management’s specialists, when developing the estimates of proved oil and natural gas reserve volumes, which in turn led to (ii) a high degree of auditor judgment, subjectivity, and effort in performing procedures and evaluating the audit evidence related to the data, methods, and assumptions used by management and its specialists in developing the estimates of proved oil and natural gas reserve volumes and the assumptions related to development and production costs, as applicable.

74
Addressing the matter involved performing procedures and evaluating audit evidence in connection with forming our overall opinion on the consolidated financial statements. These procedures included testing the effectiveness of controls relating to management's estimates of proved oil and natural gas reserve volumes. The work of management's specialists was used in performing the procedures to evaluate the reasonableness of estimates of proved oil and natural gas reserve volumes. As a basis for using this work, management’s specialists' qualifications were understood and the Company's relationship with management’s specialists was assessed. The procedures performed also included evaluation of the methods and assumptions used by management’s specialists, tests of the data used by management’s specialists, and an evaluation of management’s specialists' findings. These procedures also included, among others, testing the completeness and accuracy of the data related to future development and production costs. Additionally, these procedures included evaluating whether the assumptions related to development and production costs were reasonable considering the past performance of the Company and its business and strategic plan, as applicable.
/s/ PricewaterhouseCoopers LLP
Chartered Professional Accountants
Calgary, Canada February 23, 2022
We have served as the Company’s auditor since 1934
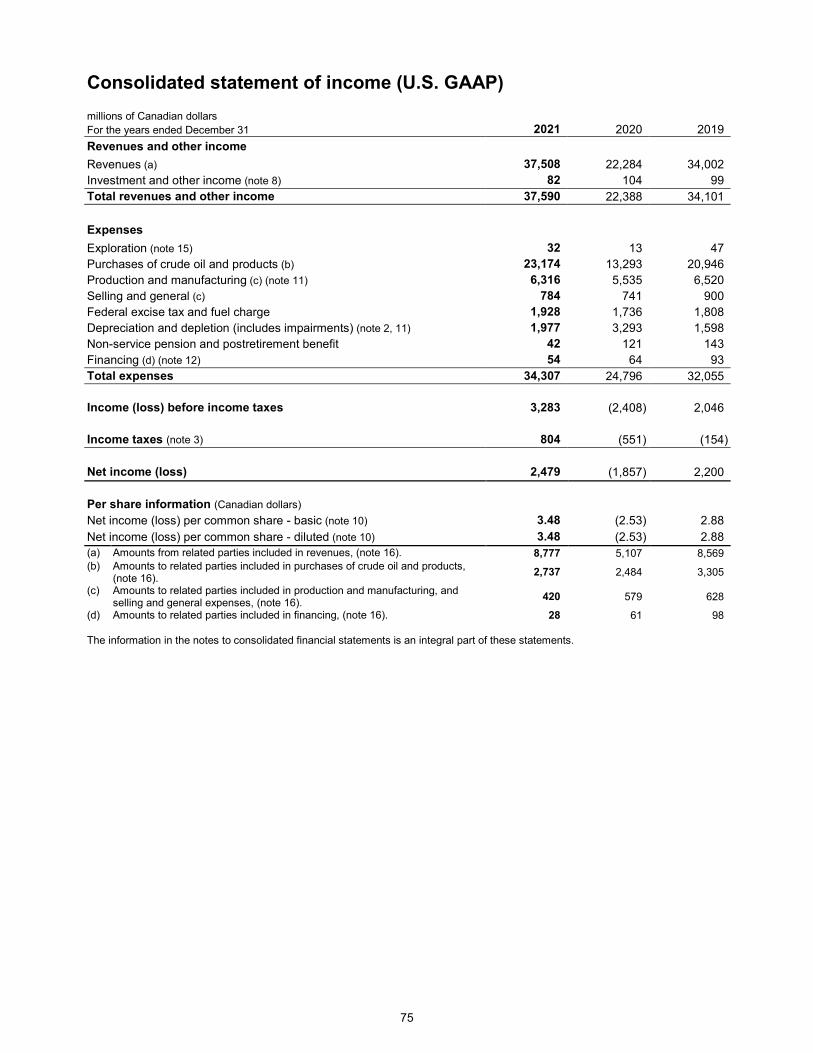
75
Consolidated statement of income (U.S. GAAP) millions of Canadian dollars
For the years ended December 31 2021 2020 2019
Revenues and other income
Revenues (a) 37,508 22,284 34,002
Investment and other income (note 8) 82 104 99
Total revenues and other income 37,590 22,388 34,101
Expenses
Exploration (note 15) 32 13 47
Purchases of crude oil and products (b) 23,174 13,293 20,946
Production and manufacturing (c) (note 11) 6,316 5,535 6,520
Selling and general (c) 784 741 900
Federal excise tax and fuel charge 1,928 1,736 1,808
Depreciation and depletion (includes impairments) (note 2, 11) 1,977 3,293 1,598
Non-service pension and postretirement benefit 42 121 143
Financing (d) (note 12) 54 64 93
Total expenses 34,307 24,796 32,055
Income (loss) before income taxes 3,283 (2,408) 2,046
Income taxes (note 3) 804 (551) (154)
Net income (loss) 2,479 (1,857) 2,200
Per share information (Canadian dollars)
Net income (loss) per common share - basic (note 10) 3.48 (2.53) 2.88
Net income (loss) per common share - diluted (note 10) 3.48 (2.53) 2.88
(a) Amounts from related parties included in revenues, (note 16). 8,777 5,107 8,569 (b) Amounts to related parties included in purchases of crude oil and products,
(note 16). 2,737 2,484 3,305
(c) Amounts to related parties included in production and manufacturing, and selling and general expenses, (note 16).
420 579 628
(d) Amounts to related parties included in financing, (note 16). 28 61 98 The information in the notes to consolidated financial statements is an integral part of these statements.

76
Consolidated statement of comprehensive income (U.S. GAAP) millions of Canadian dollars For the years ended December 31 2021 2020 2019
Net income (loss) 2,479 (1,857) 2,200
Other comprehensive income (loss), net of income taxes
Postretirement benefits liability adjustment
(excluding amortization) 679 (212) (505) Amortization of postretirement benefits liability adjustment
included in net periodic benefit costs 133 134 111
Total other comprehensive income (loss) 812 (78) (394)
Comprehensive income (loss) 3,291 (1,935) 1,806
The information in the notes to consolidated financial statements is an integral part of these statements.
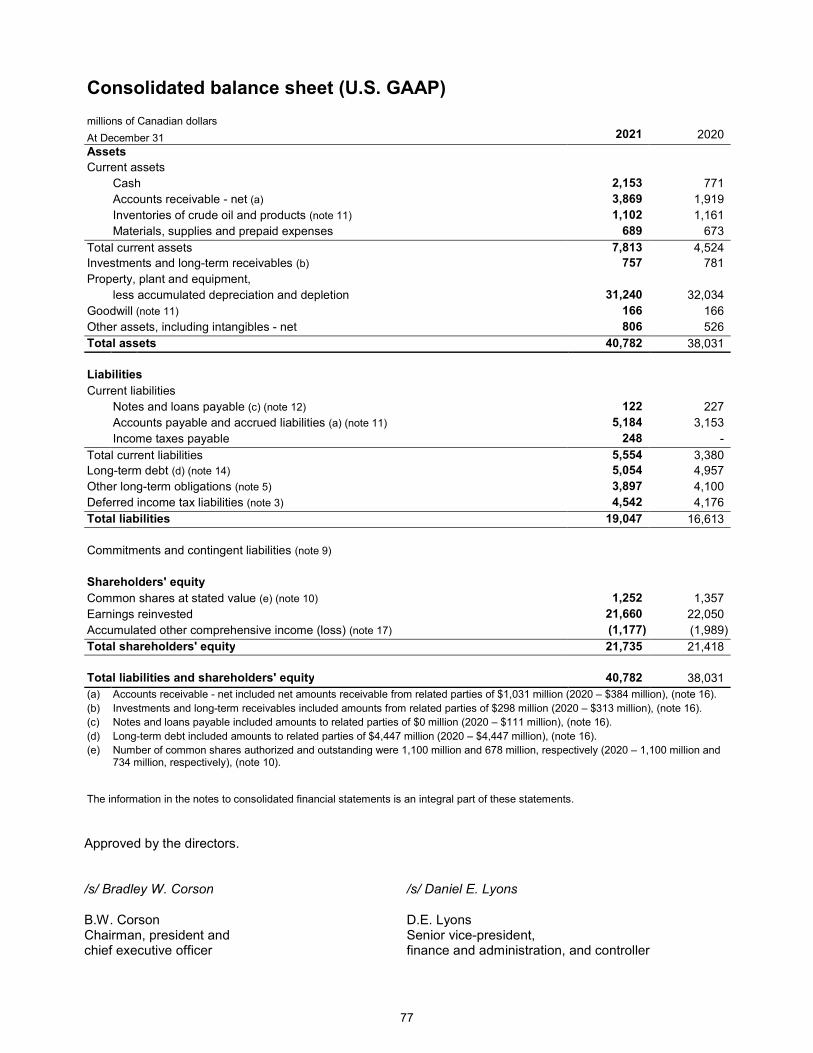
77
Consolidated balance sheet (U.S. GAAP)
millions of Canadian dollars
At December 31 2021 2020
Assets
Current assets
Cash 2,153 771
Accounts receivable - net (a) 3,869 1,919
Inventories of crude oil and products (note 11) 1,102 1,161
Materials, supplies and prepaid expenses 689 673
Total current assets 7,813 4,524
Investments and long-term receivables (b) 757 781
Property, plant and equipment,
less accumulated depreciation and depletion 31,240 32,034
Goodwill (note 11) 166 166
Other assets, including intangibles - net 806 526
Total assets 40,782 38,031
Liabilities
Current liabilities
Notes and loans payable (c) (note 12) 122 227
Accounts payable and accrued liabilities (a) (note 11) 5,184 3,153
Income taxes payable 248 -
Total current liabilities 5,554 3,380
Long-term debt (d) (note 14) 5,054 4,957
Other long-term obligations (note 5) 3,897 4,100
Deferred income tax liabilities (note 3) 4,542 4,176
Total liabilities 19,047 16,613
Commitments and contingent liabilities (note 9)
Shareholders' equity
Common shares at stated value (e) (note 10) 1,252 1,357
Earnings reinvested 21,660 22,050
Accumulated other comprehensive income (loss) (note 17) (1,177) (1,989)
Total shareholders' equity 21,735 21,418
Total liabilities and shareholders' equity 40,782 38,031
(a) Accounts receivable - net included net amounts receivable from related parties of $1,031 million (2020 – $384 million), (note 16).
(b) Investments and long-term receivables included amounts from related parties of $298 million (2020 – $313 million), (note 16).
(c) Notes and loans payable included amounts to related parties of $0 million (2020 – $111 million), (note 16).
(d) Long-term debt included amounts to related parties of $4,447 million (2020 – $4,447 million), (note 16).
(e) Number of common shares authorized and outstanding were 1,100 million and 678 million, respectively (2020 – 1,100 million and 734 million, respectively), (note 10).
The information in the notes to consolidated financial statements is an integral part of these statements.
Approved by the directors. /s/ Bradley W. Corson B.W. Corson Chairman, president and chief executive officer
/s/ Daniel E. Lyons D.E. Lyons Senior vice-president, finance and administration, and controller

78
Consolidated statement of shareholders' equity (U.S. GAAP) millions of Canadian dollars At December 31 2021 2020 2019
Common shares at stated value (note 10)
At beginning of year 1,357 1,375 1,446
Share purchases at stated value (105) (18) (71)
At end of year 1,252 1,357 1,375
Earnings reinvested
At beginning of year 22,050 24,812 24,560
Net income (loss) for the year 2,479 (1,857) 2,200
Share purchases in excess of stated value (2,140) (256) (1,302)
Dividends declared (729) (647) (646)
Cumulative effect of accounting change - (2) -
At end of year 21,660 22,050 24,812
Accumulated other comprehensive income (loss) (note 17)
At beginning of year (1,989) (1,911) (1,517)
Other comprehensive income (loss) 812 (78) (394)
At end of year (1,177) (1,989) (1,911)
Shareholders' equity at end of year 21,735 21,418 24,276
The information in the notes to consolidated financial statements is an integral part of these statements.
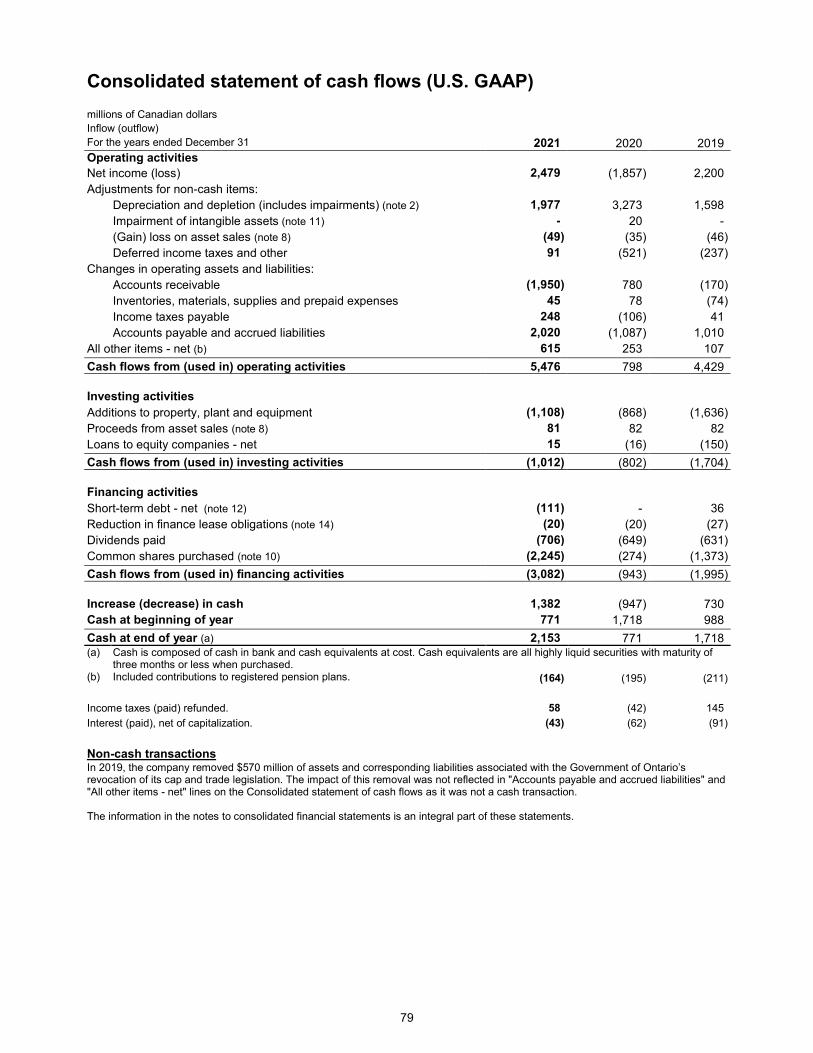
79
Consolidated statement of cash flows (U.S. GAAP) millions of Canadian dollars Inflow (outflow) For the years ended December 31 2021 2020 2019 Operating activities
Net income (loss) 2,479 (1,857) 2,200
Adjustments for non-cash items:
Depreciation and depletion (includes impairments) (note 2) 1,977 3,273 1,598
Impairment of intangible assets (note 11) - 20 -
(Gain) loss on asset sales (note 8) (49) (35) (46)
Deferred income taxes and other 91 (521) (237)
Changes in operating assets and liabilities:
Accounts receivable (1,950) 780 (170)
Inventories, materials, supplies and prepaid expenses 45 78 (74)
Income taxes payable 248 (106) 41
Accounts payable and accrued liabilities 2,020 (1,087) 1,010
All other items - net (b) 615 253 107
Cash flows from (used in) operating activities 5,476 798 4,429
Investing activities
Additions to property, plant and equipment (1,108) (868) (1,636)
Proceeds from asset sales (note 8) 81 82 82
Loans to equity companies - net 15 (16) (150)
Cash flows from (used in) investing activities (1,012) (802) (1,704)
Financing activities
Short-term debt - net (note 12) (111) - 36
Reduction in finance lease obligations (note 14) (20) (20) (27)
Dividends paid (706) (649) (631)
Common shares purchased (note 10) (2,245) (274) (1,373)
Cash flows from (used in) financing activities (3,082) (943) (1,995)
Increase (decrease) in cash 1,382 (947) 730
Cash at beginning of year 771 1,718 988
Cash at end of year (a) 2,153 771 1,718 (a) Cash is composed of cash in bank and cash equivalents at cost. Cash equivalents are all highly liquid securities with maturity of
three months or less when purchased. (b) Included contributions to registered pension plans. (164) (195) (211)
Income taxes (paid) refunded. 58 (42) 145
Interest (paid), net of capitalization. (43) (62) (91)
Non-cash transactions In 2019, the company removed $570 million of assets and corresponding liabilities associated with the Government of Ontario’s revocation of its cap and trade legislation. The impact of this removal was not reflected in "Accounts payable and accrued liabilities" and "All other items - net" lines on the Consolidated statement of cash flows as it was not a cash transaction. The information in the notes to consolidated financial statements is an integral part of these statements.
80
Notes to consolidated financial statements The accompanying consolidated financial statements and the supporting and supplemental material are the responsibility of the management of Imperial Oil Limited. The company's principal business involves exploration for, and production of, crude oil and natural gas; manufacture, trade, transport and sale of crude oil, natural gas, petroleum products, petrochemicals and a variety of specialty products; and pursuit of lower-emission business opportunities including carbon capture and storage, and biofuels. The consolidated financial statements have been prepared in accordance with United States Generally Accepted Accounting Principles (U.S. GAAP), which requires management to make estimates and judgments that affect the reported amounts of assets, liabilities, revenues and expenses, and the disclosure of contingent assets and liabilities. Actual results could differ from these estimates. Prior years’ data have been reclassified in certain cases to conform to the 2021 presentation basis. All amounts are in Canadian dollars unless otherwise indicated.
1. Summary of significant accounting policies Principles of consolidation The consolidated financial statements include the accounts of subsidiaries the company controls. Intercompany accounts and transactions are eliminated. Subsidiaries include those companies in which Imperial has both an equity interest and the continuing ability to unilaterally determine strategic, operating, investing and financing policies. Imperial Oil Resources Limited and Canada Imperial Oil Limited are significant subsidiaries included in the consolidated financial statements and are wholly owned by Imperial Oil Limited. The consolidated financial statements also include the company’s share of the undivided interest in certain upstream assets, liabilities, revenues and expenses, including its 70.96 percent interest in the Kearl joint venture and its 25 percent interest in the Syncrude joint venture. Revenues Imperial generally sells crude oil, natural gas and petroleum and chemical products under short-term agreements at prevailing market prices. In some cases, products may be sold under long-term agreements, with periodic price adjustments to reflect market conditions. Revenue is recognized at the amount the company expects to receive when the customer has taken control, which is typically when title transfers and the customer has assumed the risks and rewards of ownership. The prices of certain sales are based on price indices that are sometimes not available until the next period. In such cases, estimated realizations are accrued when the sale is recognized, and are finalized when final information is available. Such adjustments to revenue from performance obligations satisfied in previous periods are not significant. Payment for revenue transactions is typically due within 30 days. Revenues include amounts billed to customers for shipping and handling. Shipping and handling costs incurred up to the point of final storage prior to delivery to a customer are included in “Purchases of crude oil and products” in the Consolidated statement of income. Delivery costs from final storage to customer are recorded as a marketing expense in "Selling and general" expenses. The company does not enter into ongoing arrangements whereby it is required to repurchase its products, nor does the company provide the customer with a right of return. Future volume delivery obligations that are unsatisfied at the end of the period are expected to be fulfilled through ordinary production or purchases. These performance obligations are based on market prices at the time of the transaction and are fully constrained due to market price volatility. Purchases and sales of inventory with the same counterparty that are entered into in contemplation of one another are combined and recorded as exchanges measured at the book value of the item sold. “Revenues” and “Accounts receivable - net” primarily arise from contracts with customers. Long-term receivables are primarily from non-customers. Contract assets are mainly from marketing assistance programs and are not significant. Contract liabilities are mainly customer prepayments, loyalty programs and accruals of expected volume discounts, and are not significant.
81
Consumer taxes Taxes levied on the consumer and collected by the company are excluded from the Consolidated statement of income. These are primarily provincial taxes on motor fuels, the federal goods and services tax and the federal / provincial harmonized sales tax. Derivative instruments Imperial may use derivative instruments for trading purposes and to offset exposures associated with commodity prices, currency exchange rates and interest rates that arise from existing assets, liabilities, firm commitments and forecasted transactions. All derivative instruments, except those designated as normal purchase and normal sale, are recorded at fair value. Derivative assets and liabilities with the same counterparty are netted if the right of offset exists and certain other criteria are met. Collateral payables or receivables are netted against derivative assets and derivative liabilities respectively. Recognition and classification of the gain or loss that results from adjusting a derivative to fair value depends on the purpose for the derivative. The gains and losses resulting from changes in the fair value of derivatives are recorded under “Revenues” or “Purchases of crude oil and products” in the Consolidated statement of income. Fair value Fair value is the price that would be received to sell an asset or paid to transfer a liability in an orderly transaction between market participants. Hierarchy levels 1, 2 and 3 are terms for the priority of inputs to valuation techniques used to measure fair value. Hierarchy level 1 inputs are quoted prices in active markets for identical assets or liabilities. Hierarchy level 2 inputs are inputs other than quoted prices included within level 1 that are directly or indirectly observable for the asset or liability. Hierarchy level 3 inputs are inputs that are not observable in the market. Inventories Inventories are recorded at the lower of current market value or cost. The cost of crude oil and products is determined primarily using the last-in, first-out (LIFO) method. LIFO was selected over the alternative first-in, first-out and average cost methods because it provides a better matching of current costs with the revenues generated in the period. Inventory costs include expenditures and other charges (including depreciation), directly or indirectly incurred in bringing the inventory to its existing condition and location. Selling and general expenses are reported as period costs and excluded from inventory costs. Inventories of materials and supplies are valued at cost or less. Investments The company’s interests in the underlying net assets of affiliates it does not control, but over which it exercises significant influence, are accounted for using the equity method. They are recorded at the original cost of the investment plus Imperial’s share of earnings since the investment was made, less dividends received. Imperial’s share of the after-tax earnings of these investments is included in “Investment and other income” in the Consolidated statement of income. Investments in equity securities, other than consolidated subsidiaries and equity method investments, are measured at fair value, with changes in the fair value recognized in net income. The company uses a modified approach for equity securities that do not have a readily determinable fair value. This modified approach measures investments at cost minus impairment, if any, plus or minus changes resulting from observable price changes in orderly transactions in similar investment of the same issuer. Dividends from these investments are included in “Investment and other income”. These investments represent interests in non-publicly traded pipeline companies and a rail loading joint venture that facilitate the sale and purchase of liquids in the conduct of company operations. Other parties who also have an equity interest in these investments share in the risks and rewards according to their percentage of ownership. Imperial does not invest in these investments in order to remove liabilities from its balance sheet.
82
Property, plant and equipment Cost basis Imperial uses the “successful efforts” method to account for its exploration and production activities. Under this method, costs are accumulated on a field-by-field basis. Costs incurred to purchase, lease, or otherwise acquire a property (whether unproved or proved) are capitalized when incurred. Exploratory well costs are carried as an asset when the well has found a sufficient quantity of reserves to justify its completion as a producing well and where the company is making sufficient progress assessing the reserves and the economic and operating viability of the project. Exploratory well costs not meeting these criteria are charged to expense. Other exploratory expenditures, including geophysical costs and annual lease rentals, are expensed as incurred. Development costs, including costs of productive wells and development dry holes, are capitalized. Maintenance and repair costs, including planned major maintenance, are expensed as incurred. Improvements that increase or prolong the service life or capacity of an asset are capitalized. Depreciation, depletion and amortization Depreciation, depletion and amortization are primarily determined under either the unit-of-production method or the straight-line method, which is based on estimated asset service life taking obsolescence into consideration. Depreciation and depletion for assets associated with producing properties begin at the time when production commences on a regular basis. Depreciation for other assets begins when the asset is in place and ready for its intended use. Assets under construction are not depreciated or depleted. Acquisition costs of proved properties are amortized using a unit-of-production method, computed on the basis of total proved oil and natural gas reserve volumes. Capitalized exploratory drilling and development costs associated with productive depletable extractive properties are amortized using the unit-of-production rates based on the amount of proved developed reserves of oil and gas that are estimated to be recoverable from existing facilities using current operating methods. Under the unit-of-production method, oil and natural gas volumes are considered produced once they have been measured through meters at custody transfer or sales transaction points at the outlet valve on the lease or field storage tank. In the event that the unit-of-production method does not result in an equitable allocation of cost over the economic life of an upstream asset, an alternative method is used. The straight-line method is used in limited situations where the expected life of the asset does not reasonably correlate with that of the underlying reserves. For example, certain assets used in the production of oil and natural gas have a shorter life than the reserves, and as such, the company uses straight-line depreciation to ensure the asset is fully depreciated by the end of its useful life. Investments in mining heavy equipment and certain ore processing plant assets at oil sands mining properties are depreciated on a straight-line basis over a maximum of 15 years and 50 years respectively. Depreciation of other plant and equipment is calculated using the straight-line method, based on the estimated service life of the asset. To the extent that proved reserves for a property are substantially de-booked and that property continues to produce such that the resulting depreciation charge does not result in an equitable allocation of cost over the expected life, assets will be depreciated using a unit-of-production method based on reserves determined at the most recent SEC price which results in a more meaningful quantity of proved reserves, appropriately adjusted for production and technical changes. This approach was applied in 2021, with the corresponding effect on depreciation expense being immaterial compared to prior periods. For 2022, all properties have sufficient reserves at current SEC prices which will enable equitable allocation of cost over the economic lives of the Upstream assets. Investments in refinery and chemical process manufacturing equipment are generally depreciated on a straight-line basis over a 25-year life. Maintenance and repairs, including planned major maintenance, are expensed as incurred. Major renewals and improvements are capitalized and the assets replaced are retired.
83
Impairment assessment The company tests assets or groups of assets for recoverability on an ongoing basis whenever events or changes in circumstances indicate that the carrying amounts may not be recoverable. Among the events or changes in circumstances which could indicate that the carrying value of an asset or asset group may not be recoverable are the following:
a significant decrease in the market price of a long-lived asset; a significant adverse change in the extent or manner in which an asset is being used or in its physical
condition including a significant decrease in current and projected reserve volumes; a significant adverse change in legal factors or in the business climate that could affect the value,
including an adverse action or assessment by a regulator; an accumulation of project costs significantly in excess of the amount originally expected; a current-period operating loss combined with a history and forecast of operating or cash flow losses;
and
a current expectation that, more likely than not, a long-lived asset will be sold or otherwise disposed of significantly before the end of its previously estimated useful life.
The company has a robust process to monitor for indicators of potential impairment across its asset groups throughout the year. This process is aligned with the requirements of ASC 360 and ASC 932 and relies, in part, on the company’s planning and budgeting cycle. Asset valuation analysis, profitability reviews and other periodic control processes assist the company in assessing whether events or changes in circumstances indicate the carrying amounts of any of its assets may not be recoverable. Because the lifespans of the vast majority of the company’s major assets are measured in decades, the future cash flows of these assets are predominantly based on long-term oil and natural gas commodity prices, industry margins, and development and production costs. Significant reductions in the company’s view of oil or natural gas commodity prices or margin ranges, especially the longer-term prices and margins, and changes in the development plans, including decisions to defer, reduce or eliminate planned capital spending, can be an indicator of potential impairment. Other events or changes in circumstances, including indicators outlined in ASC 360 can be indicators of potential impairment as well. In general, Imperial does not view temporarily low prices or margins as an indication of impairment. Management believes that prices over the long term must be sufficient to generate investments in energy supply to meet global demand. Although prices will occasionally drop significantly, industry prices over the long term will continue to be driven by market supply and demand fundamentals. On the supply side, industry production from mature fields is declining. This is being offset by investments to generate production from new discoveries, field developments, and technology and efficiency advancements. OPEC investment activities and production policies also have an impact on world oil supplies. The demand side is largely a function of general economic activities, alternative energy sources and levels of prosperity. During the lifespan of its major assets, the company expects that oil and gas prices and industry margins will experience significant volatility, and consequently, these assets will experience periods of higher earnings and periods of lower earnings, or even losses. In assessing whether events or changes in circumstances indicate the carrying value of an asset may not be recoverable, the company considers recent periods of operating losses in the context of its longer-term view of prices and margins. In the Upstream, the standardized measure of discounted cash flows included in the “Supplemental information on oil and gas exploration and production activities” is required to use prices based on the average of first-day-of-month prices in the year. These prices represent discrete points in time and could be higher or lower than the company’s price assumptions which are used for impairment assessments. The company believes the standardized measure does not provide a reliable estimate of the expected future cash flows to be obtained from the development and production of its oil and gas properties or of the value of its oil and gas reserves and therefore does not consider it relevant in determining whether events or changes in circumstances indicate the need for an impairment assessment.

84
Energy Outlook and cash flow assessment The annual planning and budgeting process, known as the company plan, is the mechanism by which resources (capital, operating expenses and people) are allocated across the company. The foundation for the energy supply and demand assumptions supporting the company plan begins with Exxon Mobil Corporation’s Outlook for Energy (the Outlook), which contains demand and supply projections based on its assessment of current trends in technology, government policies, consumer preferences, geopolitics, and economic development. Reflective of the existing global policy environment, the Outlook does not project the degree of required future policy and technology advancement and deployment for the world or the company, to meet net-zero by 2050. As future policies and technology advancements emerge, they will be incorporated into the Outlook, and consequently, the company’s business plans will be updated accordingly. If events or changes in circumstances indicate that the carrying value of an asset may not be recoverable, the company estimates the future undiscounted cash flows of the affected properties to judge the recoverability of carrying amounts. Cash flows used in recoverability assessments are based on the assumptions developed in the company plan, which is reviewed and approved by the board of directors, and are consistent with the criteria management uses to evaluate investment opportunities. These evaluations make use of the company’s assumptions of future capital allocations, crude oil and natural gas commodity prices including price differentials, refining and chemical margins, volumes, development and operating costs, including greenhouse gas emissions prices, and foreign currency exchange rates. Volumes are based on projected field and facility production profiles, throughput, or sales. Management’s estimate of upstream production volumes used for projected cash flows makes use of proved reserve quantities and may include risk-adjusted unproved reserve quantities. The greenhouse gas emission prices reflect existing or anticipated policy actions of applicable provincial and federal governments. Fair value of impaired assets An asset group is impaired if its estimated future undiscounted cash flows are less than the asset group’s carrying value. Impairments are measured by the amount by which the carrying value exceeds fair value. The assessment of fair value is based on the views of a likely market participant. The principal parameters used to establish fair value include estimates of acreage values and flowing production metrics from comparable market transactions, market-based estimates of historical cash flow multiples, and discounted cash flows. Inputs and assumptions used in discounted cash flow models include estimates of future production volumes, throughput and product sales volumes, commodity prices which are consistent with the average of third-party industry experts and government agencies, drilling and development costs, operating costs, and discount rates which are reflective of the characteristics of the asset group. Other impairment estimates Unproved properties are assessed periodically to determine whether they have been impaired. Significant unproved properties are assessed for impairment individually, and valuation allowances against the capitalized costs are recorded based on the company’s future development plans, the estimated economic chance of success and the length of time that the company expects to hold the properties. Properties that are not individually significant are aggregated by groups and amortized based on development risk and average holding period. Long-lived assets that are held for sale are evaluated for possible impairment by comparing the carrying value of the asset with its fair value less the cost to sell. If the net book value exceeds the fair value less cost to sell, the assets are considered impaired and adjusted to the lower value. Gains on sales of proved and unproved properties are only recognized when there is neither uncertainty about the recovery of costs applicable to any interest retained nor any substantial obligation for future performance by the company. Losses on properties sold are recognized when incurred or when the properties are held for sale and the fair value of the properties is less than the carrying value. Interest capitalization Interest costs incurred to finance expenditures during the construction phase of projects are capitalized as part of the historical cost of acquiring the constructed assets. The project construction phase commences with the development of the detailed engineering design and ends when the constructed assets are ready for their intended use. Capitalized interest costs are included in property, plant and equipment and are depreciated over the service life of the related assets.

85
Asset retirement obligations and other environmental liabilities The company incurs retirement obligations for certain assets. The fair values of these obligations are recorded as liabilities on a discounted basis, which is typically at the time the assets are installed. In the estimation of fair value, the company uses assumptions and judgments regarding such factors as the existence of a legal obligation for an asset retirement obligation, technical assessments of the assets, estimated amounts and timing of settlements, discount rates and inflation rates. Asset retirement obligations incurred in the current period were level 3 fair value measurements. The costs associated with these liabilities are capitalized as part of the related assets and depreciated as the reserves are produced. Over time, the liabilities are accreted for the change in their present value. Asset retirement obligations for downstream and chemical facilities generally become firm at the time the facilities are permanently shut down and dismantled. These obligations may include the costs of asset disposal and additional soil remediation. However, these sites have indeterminate lives based on plans for continued operations, and as such, the fair value of the conditional legal obligations cannot be measured, since it is impossible to estimate the future settlement dates of such obligations. The company accrues environmental liabilities when it is probable that obligations have been incurred and the amount can be reasonably estimated. Provisions for environmental liabilities are determined based on engineering estimated costs, taking into account the anticipated method and extent of remediation consistent with legal requirements, current technology and the possible use of the location. These provisions are not reduced by possible recoveries from third parties and projected cash expenditures are not discounted. Foreign-currency translation Monetary assets and liabilities in foreign currencies have been translated at the rates of exchange prevailing on December 31. Any exchange gains or losses are recognized in income.

86
2. Business segments The company operates its business in Canada. The Upstream, Downstream and Chemical functions best define the operating segments of the business that are reported separately. The factors used to identify these reportable segments are based on the nature of the operations that are undertaken by each segment and the structure of the company's internal organization. The Upstream segment is organized and operates to explore for and ultimately produce crude oil and its equivalent, and natural gas. The Downstream segment is organized and operates to refine crude oil into petroleum products and to distribute and market these products. The Chemical segment is organized and operates to manufacture and market hydrocarbon-based chemicals and chemical products. The above segmentation has been the long-standing practice of the company and is broadly understood across the petroleum and petrochemical industries. These functions have been defined as the operating segments of the company because they are the segments (a) that engage in business activities from which revenues are earned and expenses are incurred; (b) whose operating results are regularly reviewed by the company's chief operating decision maker to make decisions about resources to be allocated to each segment and assess its performance; and (c) for which discrete financial information is available. Corporate and other includes assets and liabilities that do not specifically relate to business segments – primarily cash, capitalized interest costs, short-term borrowings, long-term debt and liabilities associated with incentive compensation, pension and other postretirement benefit liabilities. Net earnings effects under Corporate and other activities primarily include debt-related financing, corporate governance costs, non-service pension and postretirement benefit costs, share-based incentive compensation expenses and interest income. Segment accounting policies are the same as those described in the summary of significant accounting policies. Upstream, Downstream and Chemical expenses include amounts allocated from Corporate and other activities. The allocation is based on proportional segment expenses. Transfers of assets between segments are recorded at book amounts. Intersegment sales are made essentially at prevailing market prices. Assets and liabilities that are not identifiable by segment are allocated.
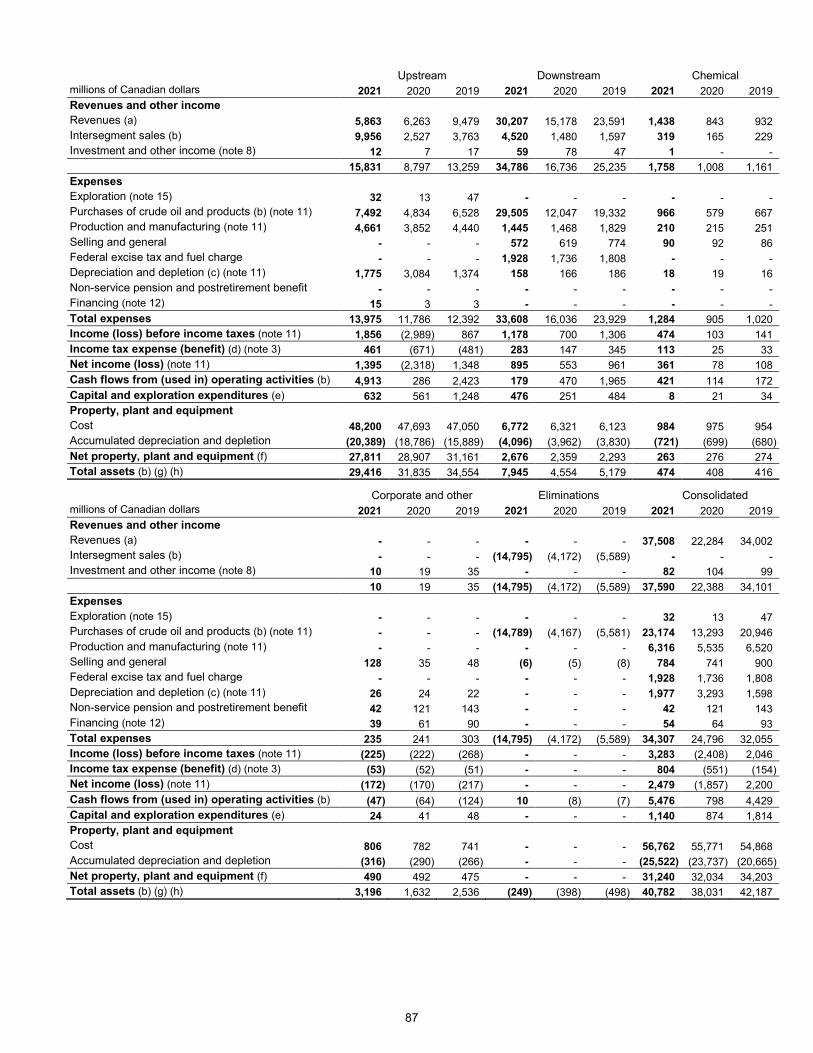
87
Upstream Downstream Chemical millions of Canadian dollars 2021 2020 2019 2021 2020 2019 2021 2020 2019
Revenues and other income
Revenues (a) 5,863 6,263 9,479 30,207 15,178 23,591 1,438 843 932
Intersegment sales (b) 9,956 2,527 3,763 4,520 1,480 1,597 319 165 229
Investment and other income (note 8) 12 7 17 59 78 47 1 - -
15,831 8,797 13,259 34,786 16,736 25,235 1,758 1,008 1,161
Expenses
Exploration (note 15) 32 13 47 - - - - - -
Purchases of crude oil and products (b) (note 11) 7,492 4,834 6,528 29,505 12,047 19,332 966 579 667
Production and manufacturing (note 11) 4,661 3,852 4,440 1,445 1,468 1,829 210 215 251
Selling and general - - - 572 619 774 90 92 86
Federal excise tax and fuel charge - - - 1,928 1,736 1,808 - - -
Depreciation and depletion (c) (note 11) 1,775 3,084 1,374 158 166 186 18 19 16
Non-service pension and postretirement benefit - - - - - - - - -
Financing (note 12) 15 3 3 - - - - - -
Total expenses 13,975 11,786 12,392 33,608 16,036 23,929 1,284 905 1,020
Income (loss) before income taxes (note 11) 1,856 (2,989) 867 1,178 700 1,306 474 103 141
Income tax expense (benefit) (d) (note 3) 461 (671) (481) 283 147 345 113 25 33
Net income (loss) (note 11) 1,395 (2,318) 1,348 895 553 961 361 78 108
Cash flows from (used in) operating activities (b) 4,913 286 2,423 179 470 1,965 421 114 172
Capital and exploration expenditures (e) 632 561 1,248 476 251 484 8 21 34
Property, plant and equipment
Cost 48,200 47,693 47,050 6,772 6,321 6,123 984 975 954
Accumulated depreciation and depletion (20,389) (18,786) (15,889) (4,096) (3,962) (3,830) (721) (699) (680)
Net property, plant and equipment (f) 27,811 28,907 31,161 2,676 2,359 2,293 263 276 274
Total assets (b) (g) (h) 29,416 31,835 34,554 7,945 4,554 5,179 474 408 416
Corporate and other Eliminations Consolidated
millions of Canadian dollars 2021 2020 2019 2021 2020 2019 2021 2020 2019
Revenues and other income
Revenues (a) - - - - - - 37,508 22,284 34,002
Intersegment sales (b) - - - (14,795) (4,172) (5,589) - - -
Investment and other income (note 8) 10 19 35 - - - 82 104 99
10 19 35 (14,795) (4,172) (5,589) 37,590 22,388 34,101
Expenses
Exploration (note 15) - - - - - - 32 13 47
Purchases of crude oil and products (b) (note 11) - - - (14,789) (4,167) (5,581) 23,174 13,293 20,946
Production and manufacturing (note 11) - - - - - - 6,316 5,535 6,520
Selling and general 128 35 48 (6) (5) (8) 784 741 900
Federal excise tax and fuel charge - - - - - - 1,928 1,736 1,808
Depreciation and depletion (c) (note 11) 26 24 22 - - - 1,977 3,293 1,598
Non-service pension and postretirement benefit 42 121 143 - - - 42 121 143
Financing (note 12) 39 61 90 - - - 54 64 93
Total expenses 235 241 303 (14,795) (4,172) (5,589) 34,307 24,796 32,055
Income (loss) before income taxes (note 11) (225) (222) (268) - - - 3,283 (2,408) 2,046
Income tax expense (benefit) (d) (note 3) (53) (52) (51) - - - 804 (551) (154)
Net income (loss) (note 11) (172) (170) (217) - - - 2,479 (1,857) 2,200
Cash flows from (used in) operating activities (b) (47) (64) (124) 10 (8) (7) 5,476 798 4,429
Capital and exploration expenditures (e) 24 41 48 - - - 1,140 874 1,814
Property, plant and equipment
Cost 806 782 741 - - - 56,762 55,771 54,868
Accumulated depreciation and depletion (316) (290) (266) - - - (25,522) (23,737) (20,665)
Net property, plant and equipment (f) 490 492 475 - - - 31,240 32,034 34,203
Total assets (b) (g) (h) 3,196 1,632 2,536 (249) (398) (498) 40,782 38,031 42,187

88
(a) Includes export sales to the United States of $7,228 million (2020 - $4,614 million, 2019 - $7,190 million). Export sales to the United States were recorded in all operating segments, with the largest effects in the Upstream segment.
(b) In 2021, the Downstream segment acquired a portion of Upstream crude inventory for $444 million. There was no earnings impact and the effects of this transaction have been eliminated for consolidation purposes.
(c) In 2020, the Upstream segment included a non-cash impairment charge of $1,531 million, before-tax, related to the company's decision not to further develop a significant portion of its unconventional portfolio.
(d) Segment results in 2019 include a largely non-cash favourable impact of $662 million associated with the Alberta corporate income tax rate decrease, with the largest impact in the Upstream segment.
(e) Capital and exploration expenditures (CAPEX) include exploration expenses, additions to property, plant and equipment, additions to finance leases, additional investments and acquisitions and the company’s share of similar costs for equity companies. CAPEX excludes the purchase of carbon emission credits.
(f) Includes property, plant and equipment under construction of $2,348 million (2020 - $1,874 million, 2019 - $2,149 million). (g) Effective January 1, 2019, Imperial adopted the Financial Accounting Standards Board’s standard, Leases (Topic 842), as
amended. As at December 31, 2021, Total assets include operating lease right of use assets of $245 million (2020 - $188 million, 2019 - $260 million). An election was made not to restate prior periods. See note 13 for additional details.
(h) In 2019, the company removed $570 million from Total assets and corresponding liabilities in the Downstream segment associated with the Government of Ontario’s revocation of its cap and trade legislation.
3. Income taxes millions of Canadian dollars 2021 2020 2019
Current income tax expense (benefit) (a) 711 (27) 140
Deferred income tax expense (benefit) (a) 93 (524) (294)
Total income tax expense (benefit) (a) 804 (551) (154)
Statutory corporate tax rate (percent) 24.0 25.0 26.0
Increase (decrease) resulting from:
Enacted tax rate change (a) - 0.1 (31.9)
Other (b) 0.5 (2.2) (1.6)
Effective income tax rate (percent) 24.5 22.9 (7.5)
(a) On June 28, 2019 the Alberta government enacted a 4 percent decrease in the provincial tax rate, from 12 percent to 8 percent by 2022. On December 9, 2020 the Alberta government enacted an accelerated decrease in the province’s general corporate income tax rate from 10 percent to 8 percent, effective July 1, 2020. The cumulative effect of the 2020 legislative tax changes on the company’s financial statements were immaterial.
(b) Other primarily relates to prior year adjustments, re-assessments and disposals.
Deferred income taxes are based on differences between the accounting and tax values of assets and liabilities. These differences in value are re-measured at each year-end using the tax rates and tax laws expected to apply when those differences are realized or settled in the future. Components of deferred income tax liabilities and assets as at December 31 were: millions of Canadian dollars 2021 2020 2019
Depreciation and amortization 5,284 5,319 5,164
Successful drilling and land acquisitions 331 363 750
Pension and benefits (303) (534) (469)
Asset retirement obligation (418) (403) (336)
Capitalized interest 120 120 117
LIFO inventory valuation (413) (150) (276)
Tax loss carryforwards (42) (460) (141)
Other (101) (154) (161)
Net deferred income tax liabilities 4,458 4,101 4,648

89
Unrecognized tax benefits Unrecognized tax benefits reflect the difference between positions taken or expected to be taken on income tax returns and the amounts recognized in the financial statements. The following table summarizes the movement in unrecognized tax benefits: millions of Canadian dollars 2021 2020 2019
Balance as of January 1 36 35 36
Additions based on current year's tax position 16 2 -
Additions for prior years' tax positions - - 1
Settlements with tax authorities (5) (1) (2)
Balance as of December 31 47 36 35
The unrecognized tax benefit balances shown above are predominately related to tax positions that would reduce the company's effective tax rate if the positions are favourably resolved. Unfavourable resolution of these tax positions generally would not increase the effective tax rate. The 2021, 2020 and 2019 changes in unrecognized tax benefits did not have a material effect on the company's net income or cash flow. The company's tax filings from 2017 to 2021 are subject to examination by the tax authorities. Tax filings from 2007 to 2016 have open objections and therefore are also subject to examination by the tax authorities. The Canada Revenue Agency has made certain adjustments to the company's filings. Management has evaluated these adjustments and is formally disputing those matters to which the company disagrees. Many of these outstanding matters will not be resolved until after 2022. The impact on unrecognized tax benefits and the company's effective income tax rate from these matters is not expected to be material. Resolution of the related tax positions could take many years to complete. It is difficult to predict the timing of resolution for tax positions since such timing is not entirely within the control of the company. The company classifies interest on income tax related balances as interest expense or interest income and classifies tax related penalties as operating expense. Unrecognized tax benefits are not classified as future commitments because the company does not expect there will be any cash impact from the final settlements as sufficient funds have been deposited with the Canada Revenue Agency.
4. Employee retirement benefits Retirement benefits, which cover almost all retired employees and their surviving spouses, include pension income and certain health care and life insurance benefits. They are met through funded registered retirement plans and through unfunded supplementary benefits that are paid directly to recipients. Pension income benefits consist mainly of company-paid defined benefit plans that are based on years of service and final average earnings. The company shares in the cost of health care and life insurance benefits. The company's benefit obligations are based on the projected benefit method of valuation that includes employee service to date and present compensation levels, as well as a projection of salaries to retirement. The expense and obligations for both funded and unfunded benefits are determined in accordance with accepted actuarial practices and U.S. GAAP. The process for determining retirement-income expense and related obligations includes making certain long-term assumptions regarding the discount rate, rate of return on plan assets and rate of compensation increases. The obligation and pension expense can vary significantly with changes in the assumptions used to estimate the obligation and the expected return on plan assets.
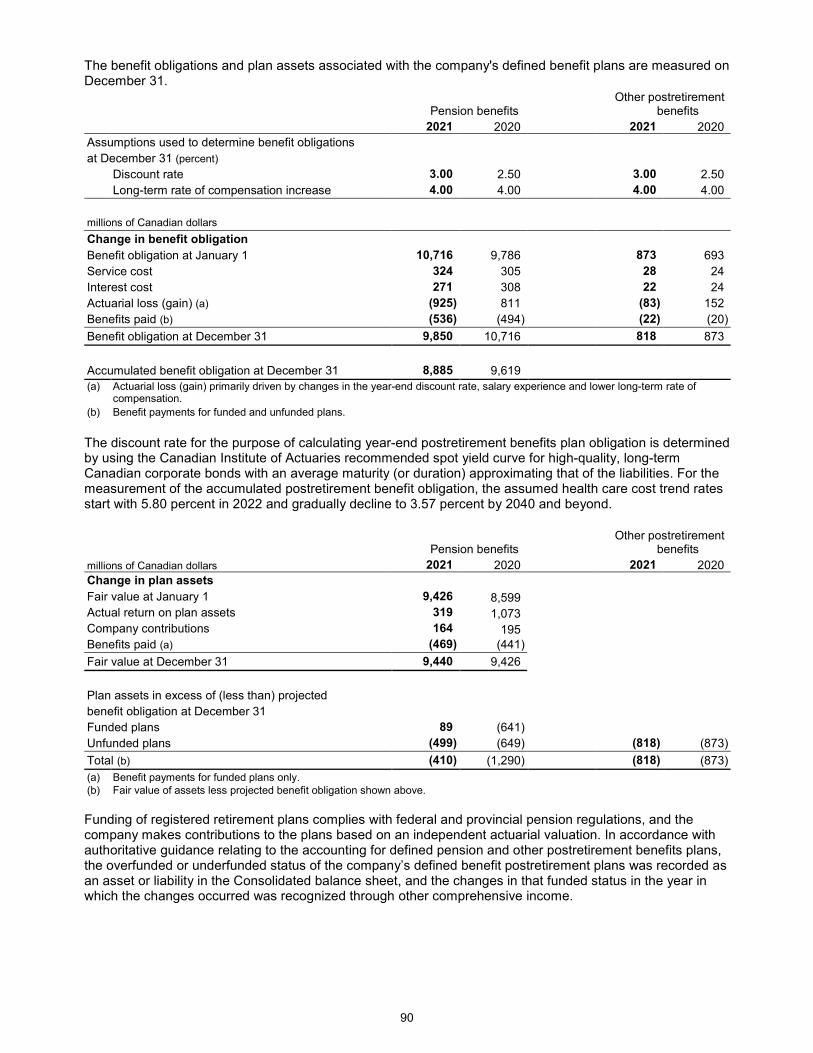
90
The benefit obligations and plan assets associated with the company's defined benefit plans are measured on December 31.
Pension benefits
Other postretirement benefits
2021 2020 2021 2020
Assumptions used to determine benefit obligations
at December 31 (percent)
Discount rate 3.00 2.50 3.00 2.50
Long-term rate of compensation increase 4.00 4.00 4.00 4.00
millions of Canadian dollars
Change in benefit obligation
Benefit obligation at January 1 10,716 9,786 873 693
Service cost 324 305 28 24
Interest cost 271 308 22 24
Actuarial loss (gain) (a) (925) 811 (83) 152
Benefits paid (b) (536) (494) (22) (20)
Benefit obligation at December 31 9,850 10,716 818 873
Accumulated benefit obligation at December 31 8,885 9,619 (a) Actuarial loss (gain) primarily driven by changes in the year-end discount rate, salary experience and lower long-term rate of
compensation.
(b) Benefit payments for funded and unfunded plans.
The discount rate for the purpose of calculating year-end postretirement benefits plan obligation is determined by using the Canadian Institute of Actuaries recommended spot yield curve for high-quality, long-term Canadian corporate bonds with an average maturity (or duration) approximating that of the liabilities. For the measurement of the accumulated postretirement benefit obligation, the assumed health care cost trend rates start with 5.80 percent in 2022 and gradually decline to 3.57 percent by 2040 and beyond.
Pension benefits
Other postretirement benefits
millions of Canadian dollars 2021 2020 2021 2020
Change in plan assets
Fair value at January 1 9,426 8,599
Actual return on plan assets 319 1,073
Company contributions 164 195
Benefits paid (a) (469) (441)
Fair value at December 31 9,440 9,426
Plan assets in excess of (less than) projected
benefit obligation at December 31
Funded plans 89 (641)
Unfunded plans (499) (649) (818) (873)
Total (b) (410) (1,290) (818) (873)
(a) Benefit payments for funded plans only. (b) Fair value of assets less projected benefit obligation shown above.
Funding of registered retirement plans complies with federal and provincial pension regulations, and the company makes contributions to the plans based on an independent actuarial valuation. In accordance with authoritative guidance relating to the accounting for defined pension and other postretirement benefits plans, the overfunded or underfunded status of the company’s defined benefit postretirement plans was recorded as an asset or liability in the Consolidated balance sheet, and the changes in that funded status in the year in which the changes occurred was recognized through other comprehensive income.

91
Pension benefits
Other postretirement benefits
millions of Canadian dollars 2021 2020 2021 2020
Amounts recorded in the Consolidated balance sheet consist of:
Other assets, including intangibles - net 190 - - -
Current liabilities (26) (27) (30) (31)
Other long-term obligations (574) (1,263) (788) (842)
Total recorded (410) (1,290) (818) (873)
Amounts recorded in accumulated other
comprehensive income consist of:
Net actuarial loss (gain) 1,272 2,232 173 272
Prior service cost 252 269 - -
Total recorded in accumulated other comprehensive income, before-tax 1,524 2,501 173 272
The company establishes the long-term expected rate of return on plan assets by developing a forward-looking long-term return assumption for each asset class, taking into account factors such as the expected real return for the specific asset class and inflation. A single, long-term rate of return is then calculated as the weighted average of the target asset allocation percentages and the long-term return assumption for each asset class. The 2021 long-term expected return of 4.5 percent used in the calculations of pension expense compares to an actual rate of return of 8.5 percent and 7.3 percent over the last 10- and 20-year periods respectively, ending December 31, 2021.
Pension benefits Other postretirement
benefits
2021 2020 2019 2021 2020 2019
Assumptions used to determine net periodic benefit cost for years ended December 31 (percent)
Discount rate 2.50 3.10 3.90 2.50 3.10 3.90
Long-term rate of return on funded assets 4.50 4.50 4.50 - - -
Long-term rate of compensation increase 4.00 4.50 4.50 4.00 4.50 4.50
millions of Canadian dollars Components of net periodic benefit cost Service cost 324 305 228 28 24 16 Interest cost 271 308 324 22 24 20 Expected return on plan assets (427) (391) (349) - - - Amortization of prior service cost 17 14 - - - - Amortization of actuarial loss (gain) 143 153 149 16 13 (1)
Net periodic benefit cost 328 389 352 66 61 35 Changes in amounts recorded in accumulated
other comprehensive income Net actuarial loss (gain) (817) 129 288 (83) 152 99 Amortization of net actuarial (loss) gain included in
net periodic benefit cost (143) (153) (149) (16) (13) 1
Prior service cost - - 283 - - - Amortization of prior service cost included in net
periodic benefit cost (17) (14) - - - -
Total recorded in other comprehensive income (977) (38) 422 (99) 139 100 Total recorded in net periodic benefit cost and
other comprehensive income, before-tax (649) 351 774 (33) 200 135
Costs for defined contribution plans, primarily the employee savings plan, were $47 million in 2021 (2020 - $47 million, 2019 - $43 million).
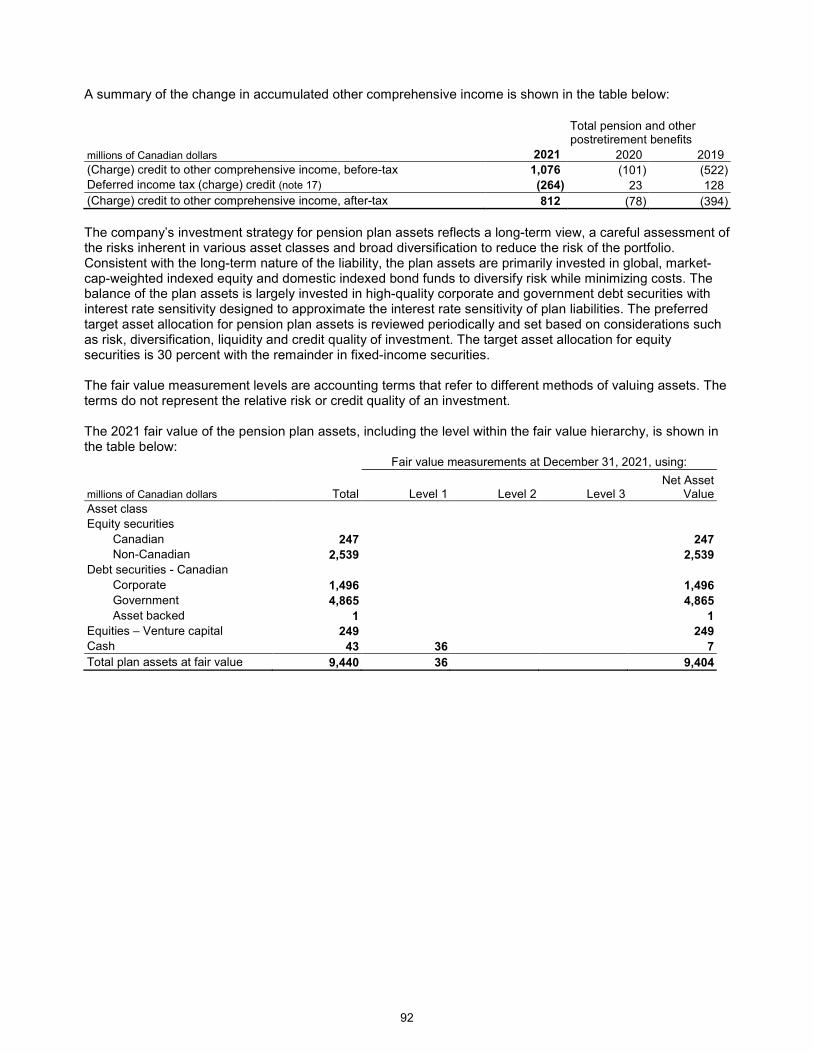
92
A summary of the change in accumulated other comprehensive income is shown in the table below:
Total pension and other postretirement benefits
millions of Canadian dollars 2021 2020 2019
(Charge) credit to other comprehensive income, before-tax 1,076 (101) (522) Deferred income tax (charge) credit (note 17) (264) 23 128
(Charge) credit to other comprehensive income, after-tax 812 (78) (394)
The company’s investment strategy for pension plan assets reflects a long-term view, a careful assessment of the risks inherent in various asset classes and broad diversification to reduce the risk of the portfolio. Consistent with the long-term nature of the liability, the plan assets are primarily invested in global, market-cap-weighted indexed equity and domestic indexed bond funds to diversify risk while minimizing costs. The balance of the plan assets is largely invested in high-quality corporate and government debt securities with interest rate sensitivity designed to approximate the interest rate sensitivity of plan liabilities. The preferred target asset allocation for pension plan assets is reviewed periodically and set based on considerations such as risk, diversification, liquidity and credit quality of investment. The target asset allocation for equity securities is 30 percent with the remainder in fixed-income securities. The fair value measurement levels are accounting terms that refer to different methods of valuing assets. The terms do not represent the relative risk or credit quality of an investment. The 2021 fair value of the pension plan assets, including the level within the fair value hierarchy, is shown in the table below: Fair value measurements at December 31, 2021, using:
millions of Canadian dollars Total Level 1 Level 2 Level 3 Net Asset
Value
Asset class
Equity securities
Canadian 247 247
Non-Canadian 2,539 2,539
Debt securities - Canadian
Corporate 1,496 1,496
Government 4,865 4,865
Asset backed 1 1
Equities – Venture capital 249 249
Cash 43 36 7
Total plan assets at fair value 9,440 36 9,404
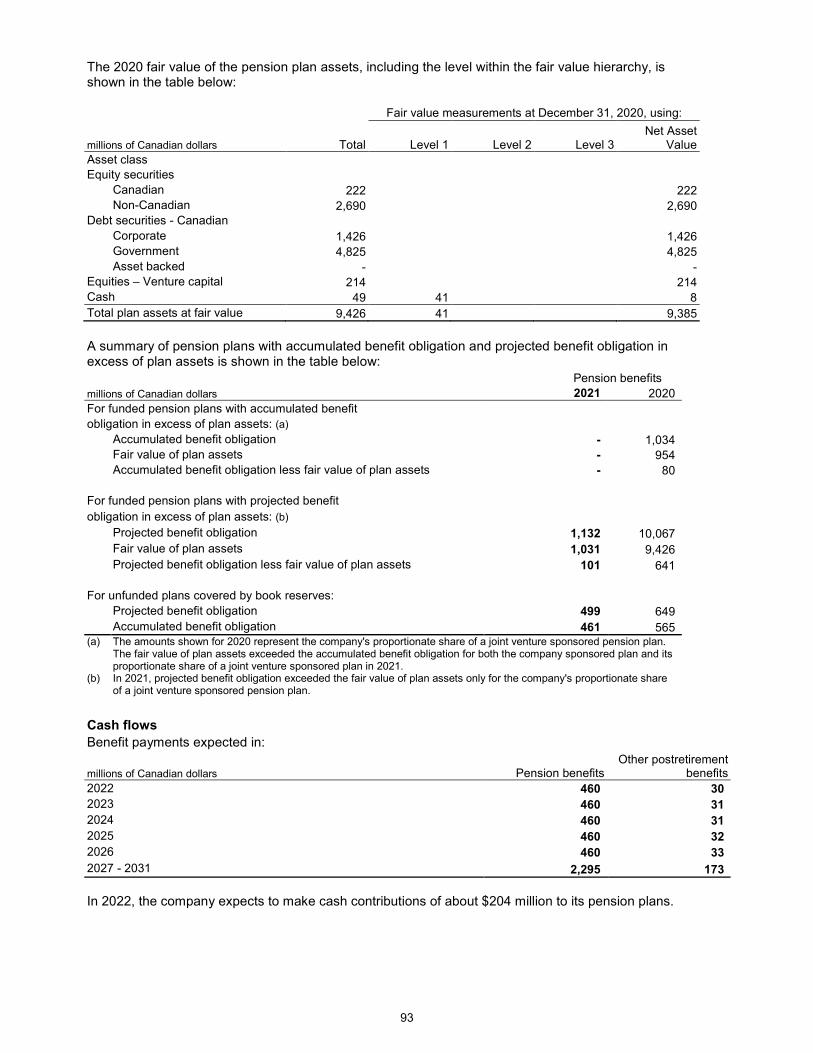
93
The 2020 fair value of the pension plan assets, including the level within the fair value hierarchy, is shown in the table below:
Fair value measurements at December 31, 2020, using:
millions of Canadian dollars Total Level 1 Level 2 Level 3 Net Asset
Value
Asset class Equity securities
Canadian 222 222
Non-Canadian 2,690 2,690 Debt securities - Canadian
Corporate 1,426 1,426
Government 4,825 4,825
Asset backed - - Equities – Venture capital 214 214 Cash 49 41 8
Total plan assets at fair value 9,426 41 9,385
A summary of pension plans with accumulated benefit obligation and projected benefit obligation in excess of plan assets is shown in the table below: Pension benefits
millions of Canadian dollars 2021 2020
For funded pension plans with accumulated benefit obligation in excess of plan assets: (a)
Accumulated benefit obligation - 1,034
Fair value of plan assets - 954
Accumulated benefit obligation less fair value of plan assets - 80
For funded pension plans with projected benefit
obligation in excess of plan assets: (b)
Projected benefit obligation 1,132 10,067
Fair value of plan assets 1,031 9,426
Projected benefit obligation less fair value of plan assets 101 641 For unfunded plans covered by book reserves:
Projected benefit obligation 499 649
Accumulated benefit obligation 461 565 (a) The amounts shown for 2020 represent the company's proportionate share of a joint venture sponsored pension plan.
The fair value of plan assets exceeded the accumulated benefit obligation for both the company sponsored plan and its proportionate share of a joint venture sponsored plan in 2021.
(b) In 2021, projected benefit obligation exceeded the fair value of plan assets only for the company's proportionate share of a joint venture sponsored pension plan.
Cash flows
Benefit payments expected in:
millions of Canadian dollars Pension benefits Other postretirement
benefits
2022 460 30
2023 460 31
2024 460 31
2025 460 32
2026 460 33
2027 - 2031 2,295 173
In 2022, the company expects to make cash contributions of about $204 million to its pension plans.

94
5. Other long-term obligations millions of Canadian dollars 2021 2020
Employee retirement benefits (a) (note 4) 1,362 2,105
Asset retirement obligations and other environmental liabilities (b) (c) 1,713 1,676
Share-based incentive compensation liabilities (note 7) 79 45
Operating lease liability (note 13) 147 95
Other obligations 596 179
Total other long-term obligations 3,897 4,100
(a) Total recorded employee retirement benefits obligations also included $56 million in current liabilities (2020 – $58 million).
(b) Total asset retirement obligations and other environmental liabilities also included $102 million in current liabilities (2020 – $100 million).
(c) For 2021, the asset retirement obligations were discounted at 6 percent (2020 - 6 percent). Asset retirement obligations incurred in the current period were level 3 fair value measurements.
The following table summarizes the activity in the liability for asset retirement obligations:
millions of Canadian dollars 2021 2020 2019
Balance as at January 1 1,674 1,400 1,417
Additions (deductions) 6 265 (23)
Accretion 99 82 80
Settlement (58) (73) (74)
Balance as at December 31 1,721 1,674 1,400
Estimated cash payments for asset retirement obligations are $77 million in 2022 and $64 million in 2023.

95
6. Financial and derivative instruments Financial instruments The fair value of the company’s financial instruments is determined by reference to various market data and other appropriate valuation techniques. There are no material differences between the fair value of the company’s financial instruments and the recorded carrying value. At December 31, 2021 and December 31, 2020, the fair value of long-term debt ($4,447 million, excluding finance lease obligations) was primarily a level 2 measurement. Derivative instruments The company’s size, strong capital structure and the complementary nature of the Upstream, Downstream and Chemical businesses reduce the company’s enterprise-wide risk from changes in commodity prices and currency exchange rates. In addition, the company uses commodity-based contracts, including derivative instruments to manage commodity price risk and for trading purposes. Commodity contracts held for trading purposes are presented in the Consolidated statement of income on a net basis in the line “Revenues”. The company does not designate derivative instruments as a hedge for hedge accounting purposes. Credit risk associated with the company’s derivative position is mitigated by several factors, including the use of derivative clearing exchanges and the quality of and financial limits placed on derivative counterparties. The company maintains a system of controls that includes the authorization, reporting and monitoring of derivative activity. At December 31, the net notional long / (short) position of derivative instruments was:
thousands of barrels 2021 2020
Crude 7,390 (800)
Products (560) (390)
Realized and unrealized gain or (loss) on derivative instruments recognized in the Consolidated statement of income is included in the following lines on a before-tax basis:
millions of Canadian dollars 2021 2020 2019
Revenues (46) (13) (3)
Purchases of crude oil and products (33) (21) (7)
Total (79) (34) (10)
The estimated fair value of derivative instruments, and the related hierarchy level for the fair value measurement is as follows:
At December 31, 2021
millions of Canadian dollars
Fair value Effect of Effect of Net
counterparty collateral carrying
Level 1 Level 2 Level 3 Total netting netting value
Assets
Derivative assets (a) 24 17 - 41 (31) - 10
Liabilities
Derivative liabilities (b) 31 12 - 43 (31) (7) 5 (a) Included in the Consolidated balance sheet line: "Materials, supplies and prepaid expenses", "Accounts receivable - net" and "Other
assets, including intangibles - net".
(b) Included in the Consolidated balance sheet line: "Accounts payable and accrued liabilities" and "Other long-term obligations".
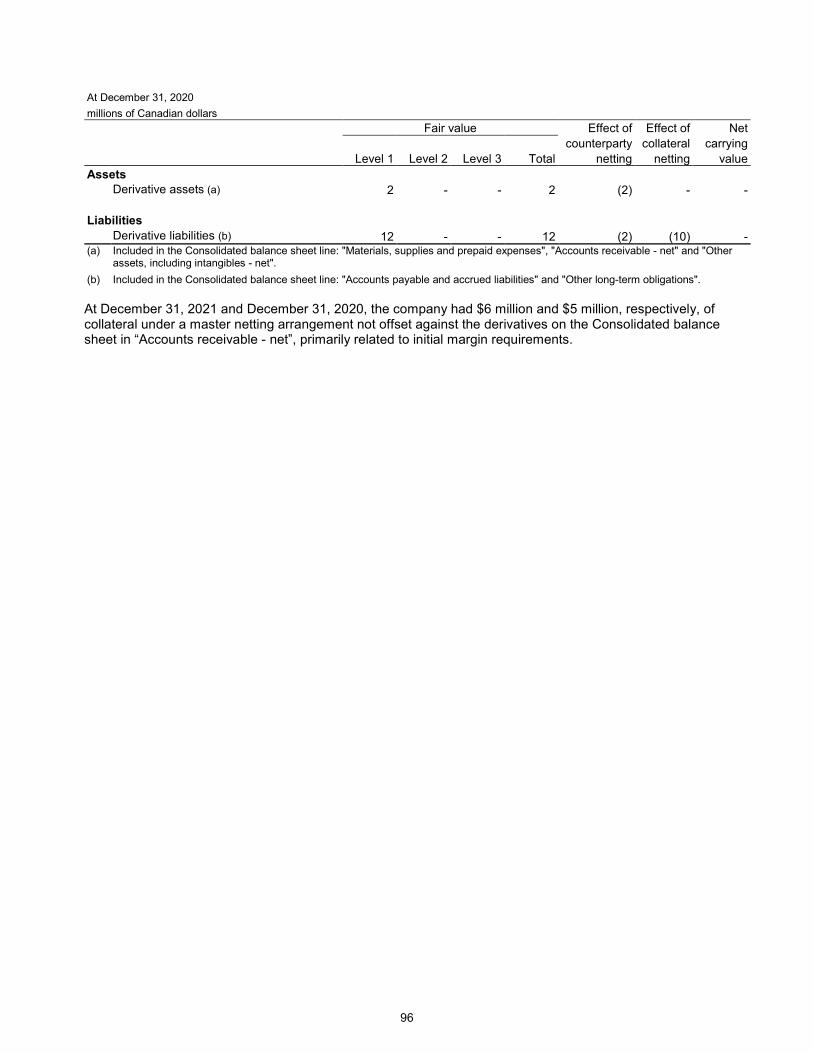
96
At December 31, 2020
millions of Canadian dollars
Fair value Effect of Effect of Net
counterparty collateral carrying
Level 1 Level 2 Level 3 Total netting netting value
Assets
Derivative assets (a) 2 - - 2 (2) - -
Liabilities
Derivative liabilities (b) 12 - - 12 (2) (10) - (a) Included in the Consolidated balance sheet line: "Materials, supplies and prepaid expenses", "Accounts receivable - net" and "Other
assets, including intangibles - net".
(b) Included in the Consolidated balance sheet line: "Accounts payable and accrued liabilities" and "Other long-term obligations".
At December 31, 2021 and December 31, 2020, the company had $6 million and $5 million, respectively, of collateral under a master netting arrangement not offset against the derivatives on the Consolidated balance sheet in “Accounts receivable - net”, primarily related to initial margin requirements.

97
7. Share-based incentive compensation programs Share-based incentive compensation programs are designed to retain selected employees, reward them for high performance and promote individual contribution to sustained improvement in the company’s future business performance and shareholder value over the long-term. The nonemployee directors also participate in share-based incentive compensation programs. Restricted stock units and deferred share units Under the restricted stock unit plan, each unit entitles the recipient to the conditional right to receive from the company, upon vesting, an amount equal to the value of one common share of the company, based on the five-day average of the closing price of the company’s common shares on the Toronto Stock Exchange on and immediately prior to the vesting dates. For the majority of the units, fifty percent of the units vest on the third anniversary of the grant date, and the remainder vest on the seventh anniversary of the grant date. The company may also issue units to the chairman, president and chief executive officer where 50 percent of the units vest on the fifth anniversary of the grant date and the remainder vest on the tenth anniversary of the grant date, except that for awards granted prior to 2021, the vesting of the tenth anniversary portion is delayed until retirement if later than 10 years. The deferred share unit plan is made available to nonemployee directors. The nonemployee directors can elect to receive all or part of their eligible directors’ fees in units. The number of units granted is determined at the end of each calendar quarter by dividing the dollar amount of the nonemployee director's fees for that calendar quarter elected to be received as deferred share units by the average closing price of the company’s shares for the five consecutive trading days (“average closing price”) immediately prior to the last day of the calendar quarter. Additional units are granted to represent dividends on unexercised units, and are calculated by dividing the cash dividend payable on the company’s shares by the average closing price immediately prior to the payment date for that dividend and multiplying the resulting number by the number of deferred share units held by the recipient, as adjusted for any share splits. Deferred share units cannot be exercised until after termination of service as a director, including termination due to death, and must be exercised in their entirety in one election no later than December 31 of the year following the year of termination of service. On the exercise date, the cash value to be received for the units is determined based on the company’s average closing price immediately prior to the date of exercise, as adjusted for any share splits. All units require settlement by cash payments with the following exceptions. The restricted stock unit program provides that, for units granted to Canadian residents, the recipient may receive one common share of the company per unit or elect to receive the cash payment for the units that vest on the seventh year anniversary of the grant date. For units where 50 percent vest on the fifth anniversary of the grant date and the remainder vest on the tenth anniversary of grant, the recipient may receive one common share of the company per unit or elect to receive cash payment for all that vest. The company accounts for all units by using the fair-value-based method. The fair value of awards in the form of restricted stock and deferred share units is the market price of the company's stock. Under this method, compensation expense related to the units of these programs is measured each reporting period based on the company's current stock price and is recorded in the Consolidated statement of income over the requisite service period of each award. The following table summarizes information about these units for the year ended December 31, 2021: Restricted Deferred
stock units share units
Outstanding at January 1, 2021 4,463,320 147,405
Granted 681,520 19,260
Vested / Exercised (1,021,865) -
Forfeited and cancelled (172,360) -
Outstanding at December 31, 2021 3,950,615 166,665
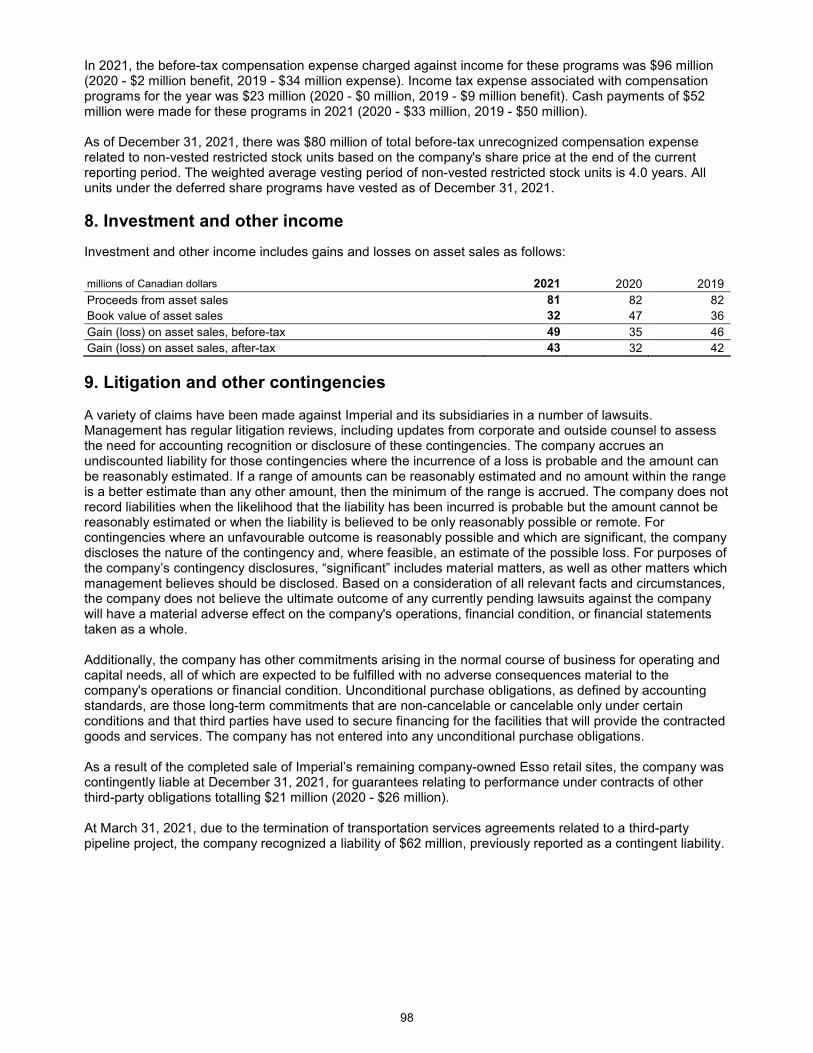
98
In 2021, the before-tax compensation expense charged against income for these programs was $96 million (2020 - $2 million benefit, 2019 - $34 million expense). Income tax expense associated with compensation programs for the year was $23 million (2020 - $0 million, 2019 - $9 million benefit). Cash payments of $52 million were made for these programs in 2021 (2020 - $33 million, 2019 - $50 million). As of December 31, 2021, there was $80 million of total before-tax unrecognized compensation expense related to non-vested restricted stock units based on the company's share price at the end of the current reporting period. The weighted average vesting period of non-vested restricted stock units is 4.0 years. All units under the deferred share programs have vested as of December 31, 2021.
8. Investment and other income
Investment and other income includes gains and losses on asset sales as follows: millions of Canadian dollars 2021 2020 2019
Proceeds from asset sales 81 82 82
Book value of asset sales 32 47 36
Gain (loss) on asset sales, before-tax 49 35 46
Gain (loss) on asset sales, after-tax 43 32 42
9. Litigation and other contingencies A variety of claims have been made against Imperial and its subsidiaries in a number of lawsuits. Management has regular litigation reviews, including updates from corporate and outside counsel to assess the need for accounting recognition or disclosure of these contingencies. The company accrues an undiscounted liability for those contingencies where the incurrence of a loss is probable and the amount can be reasonably estimated. If a range of amounts can be reasonably estimated and no amount within the range is a better estimate than any other amount, then the minimum of the range is accrued. The company does not record liabilities when the likelihood that the liability has been incurred is probable but the amount cannot be reasonably estimated or when the liability is believed to be only reasonably possible or remote. For contingencies where an unfavourable outcome is reasonably possible and which are significant, the company discloses the nature of the contingency and, where feasible, an estimate of the possible loss. For purposes of the company’s contingency disclosures, “significant” includes material matters, as well as other matters which management believes should be disclosed. Based on a consideration of all relevant facts and circumstances, the company does not believe the ultimate outcome of any currently pending lawsuits against the company will have a material adverse effect on the company's operations, financial condition, or financial statements taken as a whole. Additionally, the company has other commitments arising in the normal course of business for operating and capital needs, all of which are expected to be fulfilled with no adverse consequences material to the company's operations or financial condition. Unconditional purchase obligations, as defined by accounting standards, are those long-term commitments that are non-cancelable or cancelable only under certain conditions and that third parties have used to secure financing for the facilities that will provide the contracted goods and services. The company has not entered into any unconditional purchase obligations. As a result of the completed sale of Imperial’s remaining company-owned Esso retail sites, the company was contingently liable at December 31, 2021, for guarantees relating to performance under contracts of other third-party obligations totalling $21 million (2020 - $26 million). At March 31, 2021, due to the termination of transportation services agreements related to a third-party pipeline project, the company recognized a liability of $62 million, previously reported as a contingent liability.

99
10. Common shares At December 31 thousands of shares 2021
2020
Authorized 1,100,000 1,100,000
Common shares outstanding 678,080 734,077
The most recent 12-month normal course issuer bid program came into effect June 29, 2021, under which Imperial continued its existing share purchase program. The program enabled the company to purchase up to a maximum of 35,583,671 common shares (5 percent of the total shares on June 15, 2021) which included shares purchased under the normal course issuer bid and from Exxon Mobil Corporation concurrent with, but outside of the normal course issuer bid. As in the past, Exxon Mobil Corporation advised the company that it intended to participate to maintain its ownership percentage at approximately 69.6 percent. Subsequent to December 31, 2021, the program completed on January 31, 2022 as a result of the company purchasing the maximum allowable number of shares under the program. The excess of the purchase cost over the stated value of shares purchased has been recorded as a distribution of earnings reinvested. The company’s common share activities are summarized below: Thousands of Millions of
shares dollars
Balance as at January 1, 2019 782,565 1,446
Issued under employee share-based awards 1 -
Purchases at stated value (38,664) (71)
Balance as at December 31, 2019 743,902 1,375
Issued under employee share-based awards 7 -
Purchases at stated value (9,832) (18)
Balance as at December 31, 2020 734,077 1,357
Issued under employee share-based awards 7 -
Purchases at stated value (56,004) (105)
Balance as at December 31, 2021 678,080 1,252
The following table provides the calculation of basic and diluted earnings per common share and the dividends declared by the company on its outstanding common shares:
2021 2020 2019
Net income (loss) per common share – basic
Net income (loss) (millions of Canadian dollars) 2,479 (1,857) 2,200
Weighted average number of common shares outstanding (millions of shares) 711.6 735.3 762.7
Net income (loss) per common share (dollars) 3.48 (2.53) 2.88
Net income (loss) per common share – diluted
Net income (loss) (millions of Canadian dollars) 2,479 (1,857) 2,200
Weighted average number of common shares outstanding (millions of shares) 711.6 735.3 762.7
Effect of employee share-based awards (millions of shares) (a) 1.6 - 2.3
Weighted average number of common shares outstanding,
assuming dilution (millions of shares) 713.2 735.3 765.0
Net income (loss) per common share (dollars) 3.48 (2.53) 2.88
Dividends per common share – declared (dollars) 1.03 0.88 0.85 (a) For 2020, the Net income (loss) per common share – diluted excludes the effect of 1.9 million employee share-based awards.
Share-based awards have the potential to dilute basic earnings per share in the future.

100
11. Miscellaneous financial information In 2021, net income included an after-tax loss of $13 million (2020 – $19 million loss, 2019 – $22 million loss) attributable to the effect of changes in last-in, first-out (LIFO) inventories. The replacement cost of inventories was estimated to exceed their LIFO carrying values at December 31, 2021 by about $1.8 billion (2020 – $0.8 billion). Inventories of crude oil and products at year-end consisted of the following: millions of Canadian dollars 2021 2020
Crude oil 674 630
Petroleum products 310 403
Chemical products 73 55
Other 45 73
Total 1,102 1,161
In 2021, the company recorded an unfavourable $74 million ($82 million, before tax) inventory adjustment (including the proportionate share of LIFO changes) related to reconciliations of additives and products inventory at equity and third-party terminals. The out-of-period impact of $57 million ($63 million, before tax) occurred over a number of years, and has been resolved.
The company has determined that the adjustment is not material to the consolidated financial statements for the year ended December 31, 2021, or any of the prior periods related to the adjustment. Accordingly, comparative periods presented in the consolidated financial statements have not been restated. Research expenditures are mainly spent on developing technologies to improve bitumen recovery, reduce costs and reduce the environmental impact of upstream operations, including technologies to reduce greenhouse gas emissions intensity, supporting environmental and process improvements in the refineries, as well as accessing ExxonMobil's research worldwide. The company has scientific research agreements with affiliates of ExxonMobil, which provide for technical and engineering work to be performed by all parties, the exchange of technical information and the assignment and licencing of patents, and patent rights. These agreements provide mutual access to scientific and operating data related to nearly every phase of the petroleum and petrochemical operations of the parties. Net research and development costs charged to expenses in 2021 were $89 million (2020 – $105 million, 2019 – $133 million). These costs are included in expenses due to the uncertainty of future benefits. “Accounts payable and accrued liabilities” included accrued taxes other than income taxes of $415 million at December 31, 2021 (2020 – $344 million). The company has received subsidies as part of the Government of Canada’s COVID-19 Economic Response Plan, which included the company's proportionate share of a joint venture. It was recognized as a reduction to expense (2020 – $155 million before tax) and was included in the Consolidated statement of income, primarily as part of “Production and manufacturing”. In the first quarter of 2020, with the change in economic conditions and the reduction in the company’s market capitalization, the company assessed its goodwill balances for impairment and recognized a non-cash goodwill impairment charge of $20 million in the company’s Upstream segment. The goodwill impairment is reflected in “Depreciation and depletion” on the Consolidated statement of income and “Goodwill” on the Consolidated balance sheet. The remaining balance of goodwill is associated with the Downstream segment.
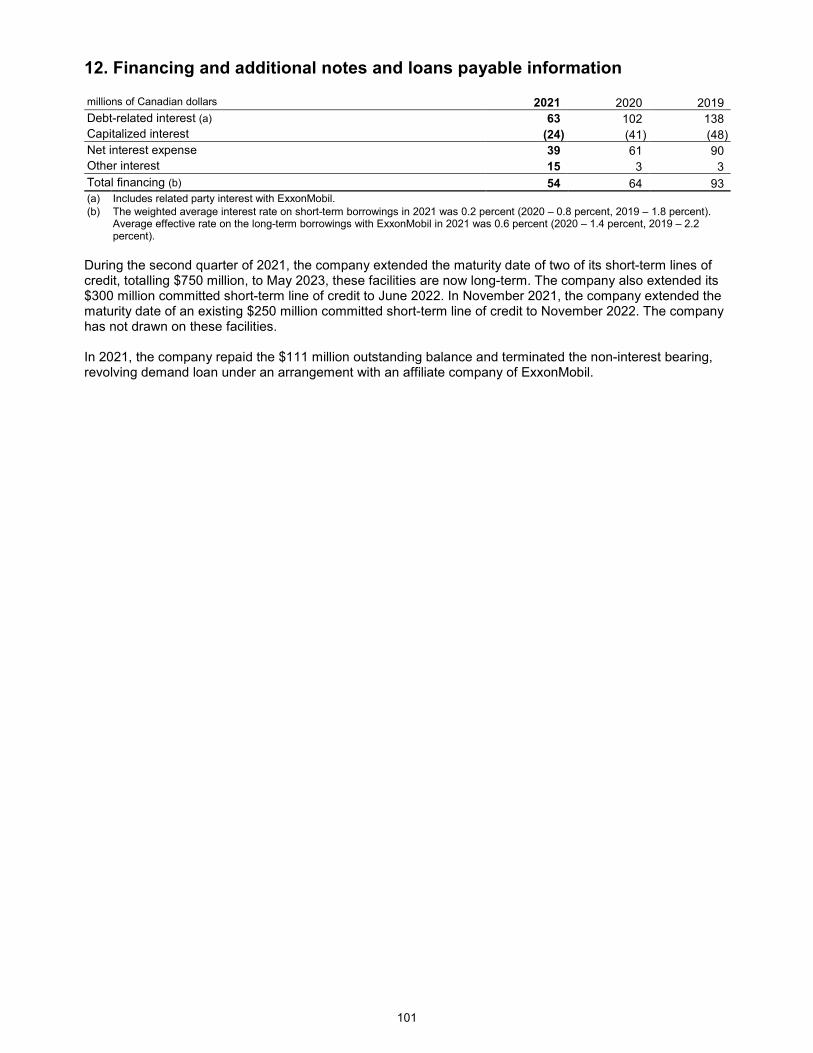
101
12. Financing and additional notes and loans payable information
millions of Canadian dollars 2021 2020 2019
Debt-related interest (a) 63 102 138
Capitalized interest (24) (41) (48)
Net interest expense 39 61 90
Other interest 15 3 3
Total financing (b) 54 64 93 (a) Includes related party interest with ExxonMobil. (b) The weighted average interest rate on short-term borrowings in 2021 was 0.2 percent (2020 – 0.8 percent, 2019 – 1.8 percent).
Average effective rate on the long-term borrowings with ExxonMobil in 2021 was 0.6 percent (2020 – 1.4 percent, 2019 – 2.2 percent).
During the second quarter of 2021, the company extended the maturity date of two of its short-term lines of credit, totalling $750 million, to May 2023, these facilities are now long-term. The company also extended its $300 million committed short-term line of credit to June 2022. In November 2021, the company extended the maturity date of an existing $250 million committed short-term line of credit to November 2022. The company has not drawn on these facilities. In 2021, the company repaid the $111 million outstanding balance and terminated the non-interest bearing, revolving demand loan under an arrangement with an affiliate company of ExxonMobil.

102
13. Leases The company generally purchases the property, plant and equipment used in operations, but there are situations where assets are leased, primarily storage tanks, rail cars, marine vessels and transportation facilities. Right of use assets and lease liabilities are established on the balance sheet for leases with an expected term greater than one year, by discounting the amounts fixed in the lease agreement for the duration of the lease which is reasonably certain, considering the probability of exercising any early termination and extension options. The portion of the fixed payment related to service costs for tankers and finance leases is excluded from the calculation of right of use assets and lease liabilities. Usually, assets are leased only for a portion of their useful lives and are accounted for as operating leases. In limited situations, assets are leased for nearly all of their useful lives and are accounted for as finance leases. In general, leases are capitalized using the company’s incremental borrowing rate. Variable payments under these lease agreements are not significant. Residual value guarantees, restrictions, or covenants related to leases, and transactions with related parties are also not significant. The company’s activities as a lessor are not material. The table below summarizes the total lease cost incurred: 2021 2020 2019
millions of Canadian dollars
Operating leases
Finance leases
Operating leases
Finance leases
Operating leases
Finance leases
Operating lease cost 123 157 151
Short-term and other (net of sublease rental income) 19 40 76
Amortization of right of use assets 17 29 55
Interest on lease liabilities 33 38 40
Total lease cost 142 50 197 67 227 95
The following table summarizes the amounts related to operating leases and finance leases recorded on the Consolidated balance sheet, weighted average remaining lease term and weighted average discount rates applied at December 31:
2021 2020
millions of Canadian dollars
Operating leases
Finance leases (a)
Operating leases
Finance leases
Right of use assets
Included in Other assets, including intangibles - net 245 188
Included in Property, plant and equipment, less accumulated depreciation and depletion
637 532
Total right of use assets 245 637 188 532
Lease liability due within one year
Included in Accounts payable and accrued liabilities 102 - 97 -
Included in Notes and loans payable 22 16
Long-term lease liability
Included in Other long-term obligations 147 - 95 -
Included in Long-term debt 607 510
Total lease liability 249 629 192 526
Weighted average remaining lease term (years) 4 38 4 38
Weighted average discount rate (percent) 1.2 4.8 2.5 7.3
(a) The change in finance leases was due to a finance lease modification and re-measurement.

103
The maturity analysis of the company's lease liabilities as at December 31 are summarized below: 2020 2021
millions of Canadian dollars
Operating leases
Finance leases
Operating leases
Finance leases
Maturity analysis of lease liabilities
2022 104 52
2023 65 50
2024 44 49
2025 6 46
2026 5 44
2027 and beyond 36 942
Total lease payments 260 1,183
Discount to present value (11) (554)
Total lease liability 249 629
In addition to the operating lease liabilities in the table immediately above, at December 31, 2021, additional undiscounted commitments for leases not yet commenced totalled $5 million (2020 - $27 million).
Estimated cash payments for operating and finance leases not yet commenced are $2 million in both 2022 and 2023. The table below summarizes the cash paid for amounts included in the measurement of lease liabilities and the right of use assets obtained in exchange for new lease liabilities:
2021 2020 2019
millions of Canadian dollars
Operating leases
Finance leases
Operating leases
Finance leases
Operating leases
Finance leases
Cash paid for amounts included in the measurement of lease liabilities
Cash flows from operating activities 122 - 136 15 147 45
Cash flows from financing activities 20 20 27
Non-cash right of use assets recorded for lease liabilities
For January 1 adoption of Leases (Topic 842) 298
In exchange for lease liabilities during the year 176 123 63 14 104 -

104
14. Long-term debt At December 31
millions of Canadian dollars 2021 2020
Long-term debt (a) 4,447 4,447
Finance leases (b) 607 510
Total long-term debt 5,054 4,957
(a) Borrowed under an existing agreement with an affiliated company of ExxonMobil that provides for a long-term, variable-rate, Canadian dollar loan from ExxonMobil to the company of up to $7.75 billion at interest equivalent to Canadian market rates. The agreement is effective until June 30, 2025, cancelable if ExxonMobil provides at least 370 days advance written notice.
(b) Finance leases are primarily associated with transportation facilities and services agreements. The average imputed rate was 4.8 percent in 2021 (2020 – 7.3 percent). Total finance lease obligations also include $22 million in current liabilities (2020 - $16 million). Principal payments on finance leases of approximately $20 million on average per year are due in each of the next four years after December 31, 2022.
15. Accounting for suspended exploratory well costs The company continues capitalization of exploratory well costs when the well has found a sufficient quantity of reserves to justify its completion as a producing well and the company is making sufficient progress assessing the reserves and the economic and operating viability of the project. The term “project” as used in this report can refer to a variety of different activities and does not necessarily have the same meaning as in any government payment transparency reports. At December 31, 2021 the company had no capitalized suspended exploratory well costs (2020 - $0 million, 2019 - $0 million). Exploration activity often involves drilling multiple wells, over a number of years, to fully evaluate a project. At December 31, 2021 the company had no projects with exploratory wells costs capitalized (2020 - 0, 2019 - 0).

105
16. Transactions with related parties Revenues and expenses of the company also include the results of transactions with affiliated companies of ExxonMobil in the normal course of operations. These were conducted on terms comparable to those which would have been conducted with unrelated parties and primarily consisted of the purchase and sale of crude oil, natural gas, petroleum and chemical products, as well as technical, engineering and research and development costs. Transactions with ExxonMobil also included amounts paid and received in connection with the company’s participation in a number of upstream activities conducted jointly in Canada. In addition, the company has existing agreements with ExxonMobil:
a) To provide computer and customer support services to the company and to share common business and operational support services that allow the companies to consolidate duplicate work and systems;
b) To operate certain western Canada production properties owned by ExxonMobil, as well as provide for the delivery of management, business and technical services to ExxonMobil in Canada. These agreements are designed to provide organizational efficiencies and to reduce costs. No separate legal entities were created from these arrangements. Separate books of account continue to be maintained for the company and ExxonMobil. The company and ExxonMobil retain ownership of their respective assets, and there is no impact on operations or reserves;
c) To provide for the option of equal participation in new upstream opportunities; and
d) To enter into derivative agreements on each other’s behalf.
The company had an existing agreement with ExxonMobil to provide for the delivery of management, business and technical services to Syncrude Canada Ltd. by ExxonMobil, which was terminated in connection with the transfer of operatorship of Syncrude on September 30, 2021. Certain charges from ExxonMobil have been capitalized; they are not material in the aggregate. The amounts of purchases and revenues by Imperial in 2021, with ExxonMobil, were $2,669 million and $8,777 million respectively (2020 - $2,424 million and $5,101 million respectively). As at December 31, 2021, the company had outstanding long-term loans of $4,447 million (2020 – $4,447 million) and short-term loans of $0 million (2020 – $111 million) from ExxonMobil (see note 14, Long-term debt, on page 104 and note 12, Financing and additional notes and loans payable information, on page 101 for further details). The amount of financing costs with ExxonMobil were $28 million (2020 - $61 million). Imperial has other related party transactions not detailed above in note 16, as they are not significant.

106
17. Other comprehensive income (loss) information Changes in accumulated other comprehensive income (loss):
millions of Canadian dollars 2021 2020 2019
Balance at January 1 (1,989) (1,911) (1,517)
Postretirement benefits liability adjustment:
Current period change excluding amounts reclassified from accumulated other comprehensive income 679 (212) (505)
Amounts reclassified from accumulated other comprehensive income 133 134 111
Balance at December 31 (1,177) (1,989) (1,911)
Amounts reclassified out of accumulated other comprehensive income (loss) - before-tax income (expense):
millions of Canadian dollars 2021 2020 2019
Amortization of postretirement benefits liability adjustment
included in net periodic benefit cost (a) (176) (180) (148) (a) This accumulated other comprehensive income component is included in the computation of net periodic benefit cost (note 4).
Income tax expense (credit) for components of other comprehensive income (loss):
millions of Canadian dollars 2021 2020 2019
Postretirement benefits liability adjustments:
Postretirement benefits liability adjustment (excluding amortization) 221 (69) (165)
Amortization of postretirement benefits liability adjustment
included in net periodic benefit cost 43 46 37
Total 264 (23) (128)
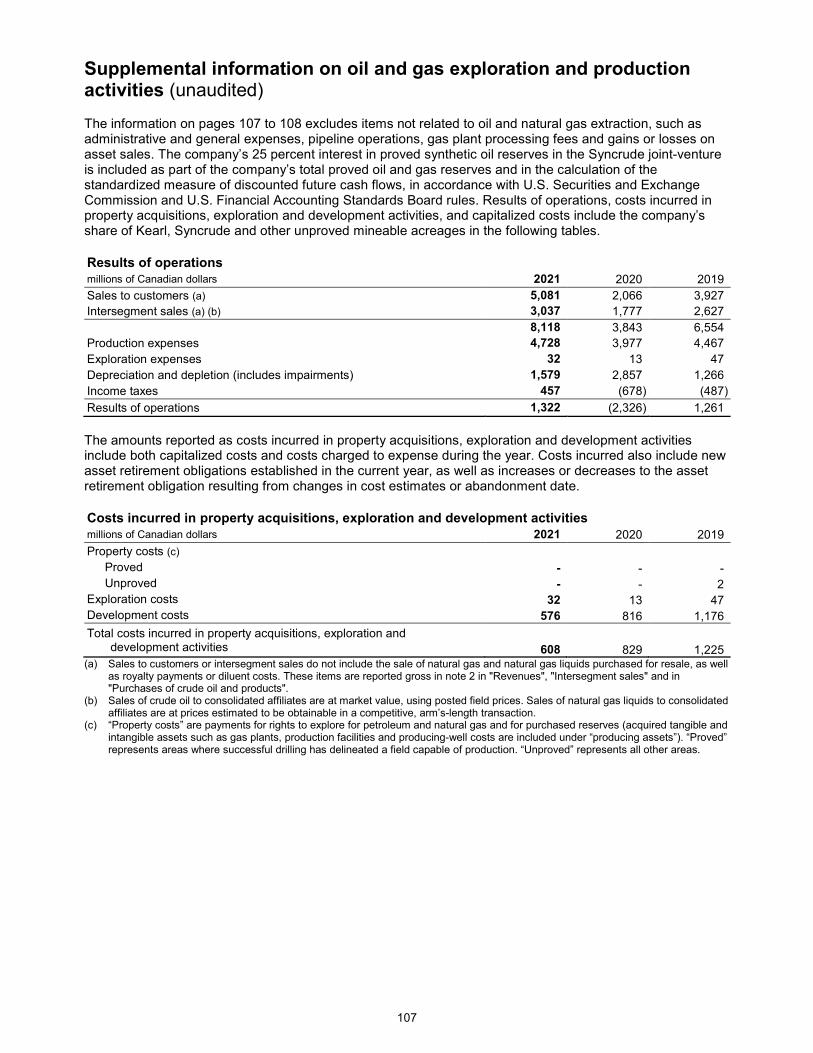
107
Supplemental information on oil and gas exploration and production activities (unaudited) The information on pages 107 to 108 excludes items not related to oil and natural gas extraction, such as administrative and general expenses, pipeline operations, gas plant processing fees and gains or losses on asset sales. The company’s 25 percent interest in proved synthetic oil reserves in the Syncrude joint-venture is included as part of the company’s total proved oil and gas reserves and in the calculation of the standardized measure of discounted future cash flows, in accordance with U.S. Securities and Exchange Commission and U.S. Financial Accounting Standards Board rules. Results of operations, costs incurred in property acquisitions, exploration and development activities, and capitalized costs include the company’s share of Kearl, Syncrude and other unproved mineable acreages in the following tables.
Results of operations millions of Canadian dollars 2021 2020 2019
Sales to customers (a) 5,081 2,066 3,927
Intersegment sales (a) (b) 3,037 1,777 2,627
8,118 3,843 6,554
Production expenses 4,728 3,977 4,467
Exploration expenses 32 13 47
Depreciation and depletion (includes impairments) 1,579 2,857 1,266
Income taxes 457 (678) (487)
Results of operations 1,322 (2,326) 1,261
The amounts reported as costs incurred in property acquisitions, exploration and development activities include both capitalized costs and costs charged to expense during the year. Costs incurred also include new asset retirement obligations established in the current year, as well as increases or decreases to the asset retirement obligation resulting from changes in cost estimates or abandonment date.
Costs incurred in property acquisitions, exploration and development activities millions of Canadian dollars 2021 2020 2019
Property costs (c)
Proved - - -
Unproved - - 2
Exploration costs 32 13 47
Development costs 576 816 1,176
Total costs incurred in property acquisitions, exploration and development activities 608 829 1,225 (a) Sales to customers or intersegment sales do not include the sale of natural gas and natural gas liquids purchased for resale, as well
as royalty payments or diluent costs. These items are reported gross in note 2 in "Revenues", "Intersegment sales" and in "Purchases of crude oil and products".
(b) Sales of crude oil to consolidated affiliates are at market value, using posted field prices. Sales of natural gas liquids to consolidated affiliates are at prices estimated to be obtainable in a competitive, arm’s-length transaction.
(c) “Property costs” are payments for rights to explore for petroleum and natural gas and for purchased reserves (acquired tangible and intangible assets such as gas plants, production facilities and producing-well costs are included under “producing assets”). “Proved” represents areas where successful drilling has delineated a field capable of production. “Unproved” represents all other areas.
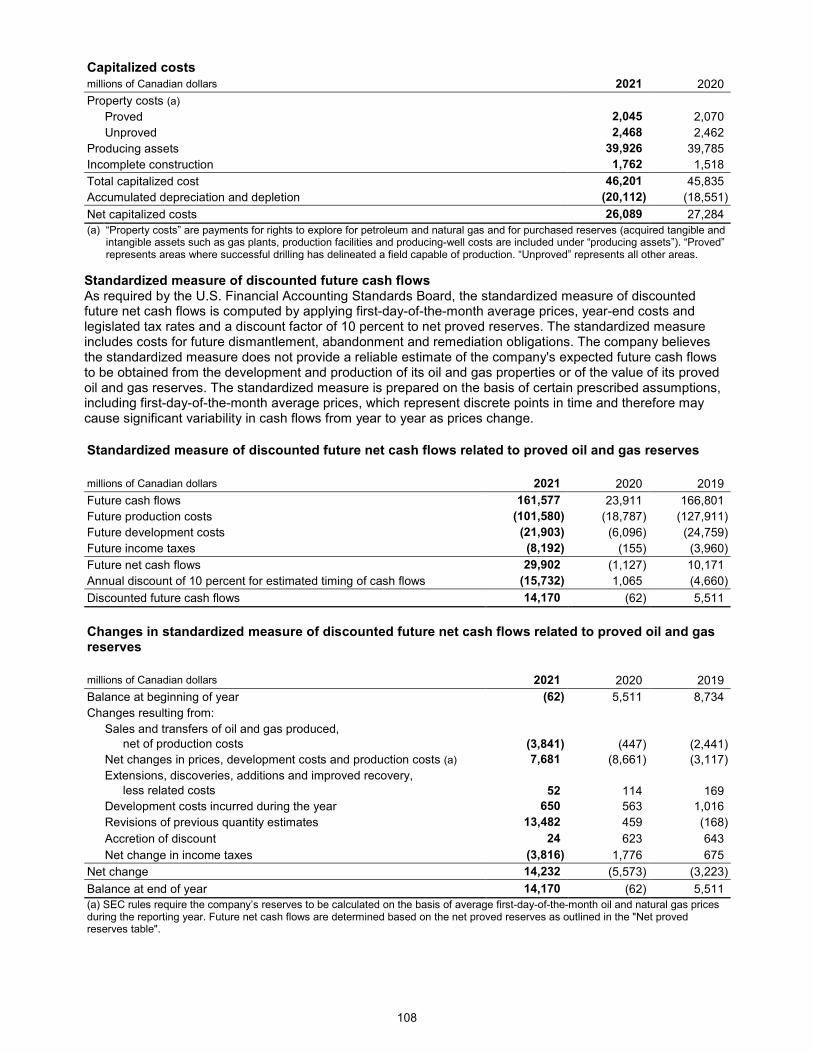
108
Capitalized costs millions of Canadian dollars 2021 2020
Property costs (a)
Proved 2,045 2,070
Unproved 2,468 2,462
Producing assets 39,926 39,785
Incomplete construction 1,762 1,518
Total capitalized cost 46,201 45,835
Accumulated depreciation and depletion (20,112) (18,551)
Net capitalized costs 26,089 27,284
(a) “Property costs” are payments for rights to explore for petroleum and natural gas and for purchased reserves (acquired tangible and intangible assets such as gas plants, production facilities and producing-well costs are included under “producing assets”). “Proved” represents areas where successful drilling has delineated a field capable of production. “Unproved” represents all other areas.
Standardized measure of discounted future cash flows As required by the U.S. Financial Accounting Standards Board, the standardized measure of discounted future net cash flows is computed by applying first-day-of-the-month average prices, year-end costs and legislated tax rates and a discount factor of 10 percent to net proved reserves. The standardized measure includes costs for future dismantlement, abandonment and remediation obligations. The company believes the standardized measure does not provide a reliable estimate of the company's expected future cash flows to be obtained from the development and production of its oil and gas properties or of the value of its proved oil and gas reserves. The standardized measure is prepared on the basis of certain prescribed assumptions, including first-day-of-the-month average prices, which represent discrete points in time and therefore may cause significant variability in cash flows from year to year as prices change.
Standardized measure of discounted future net cash flows related to proved oil and gas reserves
millions of Canadian dollars 2021 2020 2019
Future cash flows 161,577 23,911 166,801
Future production costs (101,580) (18,787) (127,911)
Future development costs (21,903) (6,096) (24,759)
Future income taxes (8,192) (155) (3,960)
Future net cash flows 29,902 (1,127) 10,171
Annual discount of 10 percent for estimated timing of cash flows (15,732) 1,065 (4,660)
Discounted future cash flows 14,170 (62) 5,511
Changes in standardized measure of discounted future net cash flows related to proved oil and gas reserves
millions of Canadian dollars 2021 2020 2019
Balance at beginning of year (62) 5,511 8,734
Changes resulting from:
Sales and transfers of oil and gas produced, net of production costs (3,841) (447) (2,441)
Net changes in prices, development costs and production costs (a) 7,681 (8,661) (3,117)
Extensions, discoveries, additions and improved recovery, less related costs 52 114 169
Development costs incurred during the year 650 563 1,016
Revisions of previous quantity estimates 13,482 459 (168)
Accretion of discount 24 623 643
Net change in income taxes (3,816) 1,776 675
Net change 14,232 (5,573) (3,223)
Balance at end of year 14,170 (62) 5,511
(a) SEC rules require the company’s reserves to be calculated on the basis of average first-day-of-the-month oil and natural gas prices during the reporting year. Future net cash flows are determined based on the net proved reserves as outlined in the "Net proved reserves table".

109
Net proved reserves (a)
Liquids (b) Natural gas Synthetic oil Bitumen
Total oil-equivalent
basis (c)
millions of
barrels billions of cubic feet
millions of barrels
millions of barrels
millions of barrels
Beginning of year 2019 62 639 466 3,166 3,800
Revisions (20) (33) (27) (134) (187)
Improved recovery - - - - -
(Sale) purchase of reserves in place - (24) - - (4)
Discoveries and extensions 4 51 - - 13
Production (5) (52) (24) (93) (130)
End of year 2019 41 581 415 2,939 3,492
Revisions (29) (348) (79) (2,757) (2,923)
Improved recovery - - - - -
(Sale) purchase of reserves in place - (10) - - (2)
Discoveries and extensions - - 133 1 134
Production (5) (55) (25) (102) (141)
End of year 2020 7 168 444 81 560
Revisions 13 165 17 2,239 2,297 Improved recovery - - - 2 2
(Sale) purchase of reserves in place - (10) - - (2)
Discoveries and extensions - - - - -
Production (4) (42) (23) (106) (140)
End of year 2021 16 281 438 2,216 2,717
Net proved developed reserves included above, as of
January 1, 2019 24 273 466 2,861 3,396
December 31, 2019 22 291 415 2,609 3,095
December 31, 2020 7 167 311 76 422 December 31, 2021 14 205 326 1,957 2,331
Net proved undeveloped reserves included above, as of
January 1, 2019 38 366 - 305 404
December 31, 2019 19 290 - 330 397
December 31, 2020 - 1 133 5 138
December 31, 2021 2 76 112 259 386 (a) Net reserves are the company’s share of reserves after deducting the shares of mineral owners or governments or both. All
reported reserves are located in Canada. Reserves of natural gas are calculated at a pressure of 14.73 pounds per square inch at 60°F.
(b) Liquids include crude, condensate and natural gas liquids (NGLs). NGL proved reserves are not material and are therefore included under liquids.
(c) Gas converted to oil-equivalent at six million cubic feet per one thousand barrels.
The information above describes changes during the years and balances of proved oil and gas reserves at year-end 2019, 2020 and 2021. The definitions used are in accordance with the U.S. Securities and Exchange Commission’s Rule 4-10 (a) of Regulation S-X. Proved oil and natural gas reserves are those quantities of oil and gas, which, by analysis of geoscience and engineering data, can be estimated with reasonable certainty to be economically producible – from a given date forward, from known reservoirs, and under existing economic conditions, operating methods and government regulations – prior to the time at which contracts providing the right to operate expire. In some cases, substantial new investments in additional wells and other facilities will be required to recover these proved reserves.
110
In accordance with SEC rules, the year-end reserves volumes, as well as the reserves change categories shown in the proved reserves tables are required to be calculated on the basis of average prices during the 12-month period prior to the ending date of the period covered by the report, determined as an unweighted arithmetic average of the first-day-of-the-month price for each month within such period. These reserves quantities were also used in calculating unit-of-production depreciation rates and in calculating the standardized measure of discounted net cash flow. Revisions in previously estimated volumes of proved reserves for existing fields can occur due to the evaluation or re-evaluation of already available geologic, reservoir or production data; new geologic, reservoir or production data; or changes in the average of first-day-of-the-month oil and natural gas prices and / or costs that are used in the estimation of reserves. Revisions can also result from significant changes in either development strategy or production equipment / facility capacity. In 2019, downward revisions to proved bitumen reserves were driven by technical and development plan updates at Kearl, resulting in a decrease of 0.2 billion barrels, partially offset by an increase of 0.1 billion barrels at Cold Lake associated with an end of field life change driven by pricing. Downward revisions to proved synthetic oil reserves were a result of higher royalty obligations at Syncrude driven by pricing. Changes to liquids and natural gas proved reserves were the result of updated development plans at the Montney and Duvernay unconventional assets and the divestment of conventional properties. In 2020, downward revisions of proved bitumen reserves were a result of low prices. The 2.2 billion barrels of bitumen at Kearl and 0.6 billion barrels of bitumen at Cold Lake no longer qualified as proved reserves under the U.S. Securities and Exchange Commission definition of proved reserves. Downward revisions to proved synthetic oil reserves were a result of lower prices, offset by the addition of proved undeveloped reserves associated with future development at Syncrude. Changes to the liquids and natural gas proved reserves were the result of updated development plans at the Montney and Duvernay unconventional assets and the divestment of conventional properties. In 2021, upward revisions of proved bitumen reserves were a result of improved prices. The 1.7 billion barrels of bitumen at Kearl and 0.5 billion barrels of bitumen at Cold Lake qualified as proved reserves under the U.S. Securities and Exchange Commission definition of proved reserves. Upward revisions to proved synthetic oil reserves were a result of improved prices. Changes to the liquids and natural gas proved reserves were the result of updated development plans and divestments at the Montney and Duvernay unconventional assets. Under the terms of certain contractual arrangements or government royalty regimes, lower prices can also increase proved reserves attributable to Imperial. The company’s operating decisions and its outlook for future production volumes are not impacted by proved reserves as disclosed under the U.S. Securities and Exchange Commission (SEC) definition. Net proved reserves are determined by deducting the estimated future share of mineral owners or governments or both. For liquids and natural gas, net proved reserves are based on estimated future royalty rates as of the date the estimate is made incorporating the applicable governments’ oil and gas royalty regimes. For bitumen, net proved reserves are based on the company’s best estimate of average royalty rates over the remaining life of each of the Cold Lake and Kearl fields, and they incorporate the Alberta government's oil sands royalty regime. For synthetic oil, net proved reserves are based on the company’s best estimate of average royalty rates over the remaining life of the project, and they incorporate the Alberta government’s oil sands royalty regime. In all cases, actual future royalty rates may vary with production, price and costs. Net proved developed reserves are those volumes that are expected to be recovered through existing wells and facilities with existing equipment and operating methods or in which the cost of the required equipment is relatively minor compared to the cost of a new well or facility. Net proved undeveloped reserves are those volumes that are expected to be recovered as a result of future investments to drill new wells, to recomplete existing wells and / or to install facilities to collect and deliver the production from existing and future wells and facilities.

111
Proxy information section Table of contents Page
Nominees for director .................................................................................................................................................... 112 Director nominee tables .............................................................................................................................................. 112 Majority voting policy ................................................................................................................................................... 116
Corporate governance disclosure ................................................................................................................................ 117 Corporate governance disclosure at a glance ............................................................................................................. 117 Statement of corporate governance practice............................................................................................................... 118
Composition of our board nominees................................................................................................................... 118 Tenure of our board nominees ........................................................................................................................... 119 Skills and experience of our board members and nominees .............................................................................. 120 Independence of our board members and nominees ......................................................................................... 121 Committee membership of our board ................................................................................................................. 122 Number of meetings ........................................................................................................................................... 122 Attendance of our board members in 2021 ........................................................................................................ 123 Other public company directorships of our board members and nominees ........................................................ 124 Interlocking directorships of our board members ............................................................................................... 124 Director qualification and selection process ....................................................................................................... 125 Director orientation, education and development ............................................................................................... 126 Board performance assessment ........................................................................................................................ 127 Board and committee structure .......................................................................................................................... 127 Director compensation ....................................................................................................................................... 137 Share ownership guidelines of independent directors and chairman, president and chief executive officer ...... 144 Ethical business conduct .................................................................................................................................... 145 Restrictions on insider trading ............................................................................................................................ 146 Diversity ............................................................................................................................................................. 146 Shareholder engagement ................................................................................................................................... 148 Largest shareholder ........................................................................................................................................... 149 Transactions with Exxon Mobil Corporation ....................................................................................................... 149
Company executives and executive compensation .................................................................................................... 151 Named executive officers of the company .................................................................................................................. 151 Other executive officers of the company ..................................................................................................................... 152 Letter to shareholders from the executive resources committee on executive compensation ..................................... 154 Compensation discussion and analysis ...................................................................................................................... 156
Overview ............................................................................................................................................................ 157 Compensation program ...................................................................................................................................... 161 Compensation decision making process and considerations for named executive officers ............................... 167 Executive compensation tables and narratives .................................................................................................. 172
Appendix ......................................................................................................................................................................... 179 Appendix A – Board of director and committee charters .................................................................................... 179

112
Nominees for director The director nominee tables on the following pages provide information on the seven nominees proposed for election to the board of directors of the company. All of the nominees are now directors and have been since the dates indicated. Included in these tables is information relating to the director nominees' biographies, independence status, expertise, standing committee memberships, attendance, public board memberships and shareholdings in the company. The information is as of February 15, 2022, the effective date of this circular, unless otherwise indicated. For more information on our director nominees, please see the Statement of corporate governance practice starting on page 118.
Director nominee tables
David W. Cornhill Calgary, Alberta, Canada
Mr. Cornhill is a director of AltaGas Ltd., and is the chairman of the board of directors of TriSummit Utilities Inc. (formerly AltaGas Canada Inc.), a privately owned corporation. Mr. Cornhill is a founding shareholder of AltaGas (and its predecessors). He was chief
executive officer of AltaGas from 1994 to 2016 and served as interim co-chief executive officer from July to December 2018. Prior to forming AltaGas, Mr. Cornhill served in various capacities with Alberta and Southern Gas Co. Ltd, including vice-president, finance and administration, treasurer and president and chief executive officer. Mr. Cornhill is an experienced leader in the business community and is a strong supporter of communities and community collaboration, investment and enhancement. He is a member of the Ivey Advisory Board at Western University. Mr. Cornhill holds a BSc (Hons.) degree and a MBA degree from Western University, and he was awarded an honorary Doctor of Laws degree by the University in 2015.
Imperial Oil Limited Ownership and Value of Equity (a) (b) (c) (d)
IMO Common
Shares (% of class)
IMO Deferred Share Units
(DSU)
Total Vested Equity Holdings (Common + DSU)
Restricted Stock Units
(RSU)
Total Holdings *
(Common + DSU + RSU)
Holdings as at February 15, 2022 (#) 12,500 (<0.01%)
10,953 23,453 14,900 38,353
Total market value as at February 15, 2022 ($) 697,500 611,177 1,308,677 831,420 2,140,097
Year over year change (#) 0 2,769 2,769 3,300 6,069
*Meets the necessary share ownership requirements
Board and Standing Committee Membership Meeting Attendance 2021
Public Company Directorships in the Past Five Years*
Imperial Oil Limited board Audit committee Executive resources committee Public policy and corporate responsibility committee Nominations and corporate governance committee (Chair) Community collaboration and engagement committee
10 of 10 (100%) 5 of 5 (100%) 6 of 6 (100%) 3 of 3 (100%) 7 of 7 (100%)
1 of 1 (100%)
- AltaGas Ltd. (2010 – present) - AltaGas Canada Inc. (2018 – 2020) - Alterra Power Corp. (2008 – 2018) - Painted Pony Energy Ltd. (2015 – 2017) *no public board interlocks
Voting Results of 2021 Annual General Meeting: Other Positions in the Past Five Years: (position, date office held, and status of employer)
Votes in Favour: 649,845,433 (96.37%)
Votes Withheld: 24,498,796 (3.63%)
- AltaGas Ltd., Chairman of the board (1994 – 2019)
- AltaGas Ltd., Interim co-CEO (July to December 2018)
Nonemployee director (independent) Age: 68 Director since: November 29, 2017 Skills and experience: Leadership of large organizations, Operations/technical, Project management, Strategy development, Audit committee financial expert, Financial expertise, Executive compensation, Environment and sustainability, Risk management
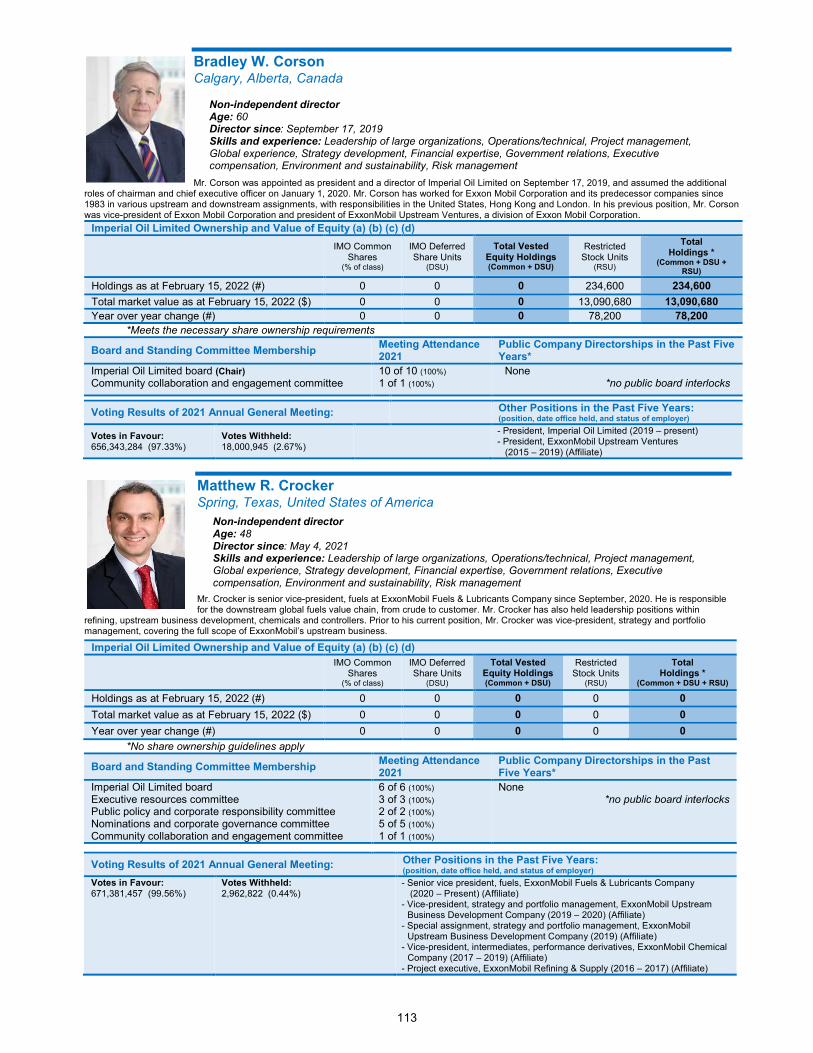
113
Bradley W. Corson Calgary, Alberta, Canada
Mr. Corson was appointed as president and a director of Imperial Oil Limited on September 17, 2019, and assumed the additional
roles of chairman and chief executive officer on January 1, 2020. Mr. Corson has worked for Exxon Mobil Corporation and its predecessor companies since 1983 in various upstream and downstream assignments, with responsibilities in the United States, Hong Kong and London. In his previous position, Mr. Corson was vice-president of Exxon Mobil Corporation and president of ExxonMobil Upstream Ventures, a division of Exxon Mobil Corporation.
Imperial Oil Limited Ownership and Value of Equity (a) (b) (c) (d)
IMO Common
Shares (% of class)
IMO Deferred Share Units
(DSU)
Total Vested Equity Holdings (Common + DSU)
Restricted Stock Units
(RSU)
Total Holdings *
(Common + DSU + RSU)
Holdings as at February 15, 2022 (#) 0 0 0 234,600 234,600
Total market value as at February 15, 2022 ($) 0 0 0 13,090,680 13,090,680
Year over year change (#) 0 0 0 78,200 78,200
*Meets the necessary share ownership requirements
Board and Standing Committee Membership Meeting Attendance 2021
Public Company Directorships in the Past Five Years*
Imperial Oil Limited board (Chair) Community collaboration and engagement committee
10 of 10 (100%) 1 of 1 (100%)
None *no public board interlocks
Voting Results of 2021 Annual General Meeting: Other Positions in the Past Five Years: (position, date office held, and status of employer)
Votes in Favour: 656,343,284 (97.33%)
Votes Withheld: 18,000,945 (2.67%)
- President, Imperial Oil Limited (2019 – present) - President, ExxonMobil Upstream Ventures (2015 – 2019) (Affiliate)
Matthew R. Crocker Spring, Texas, United States of America
Mr. Crocker is senior vice-president, fuels at ExxonMobil Fuels & Lubricants Company since September, 2020. He is responsible for the downstream global fuels value chain, from crude to customer. Mr. Crocker has also held leadership positions within
refining, upstream business development, chemicals and controllers. Prior to his current position, Mr. Crocker was vice-president, strategy and portfolio management, covering the full scope of ExxonMobil’s upstream business.
Imperial Oil Limited Ownership and Value of Equity (a) (b) (c) (d)
IMO Common
Shares (% of class)
IMO Deferred Share Units
(DSU)
Total Vested Equity Holdings (Common + DSU)
Restricted Stock Units
(RSU)
Total Holdings *
(Common + DSU + RSU)
Holdings as at February 15, 2022 (#) 0 0 0 0 0
Total market value as at February 15, 2022 ($) 0 0 0 0 0
Year over year change (#) 0 0 0 0 0
*No share ownership guidelines apply
Board and Standing Committee Membership Meeting Attendance 2021
Public Company Directorships in the Past Five Years*
Imperial Oil Limited board Executive resources committee Public policy and corporate responsibility committee Nominations and corporate governance committee Community collaboration and engagement committee
6 of 6 (100%) 3 of 3 (100%) 2 of 2 (100%) 5 of 5 (100%)
1 of 1 (100%)
None *no public board interlocks
Voting Results of 2021 Annual General Meeting: Other Positions in the Past Five Years: (position, date office held, and status of employer)
Votes in Favour: 671,381,457 (99.56%)
Votes Withheld: 2,962,822 (0.44%)
- Senior vice president, fuels, ExxonMobil Fuels & Lubricants Company (2020 – Present) (Affiliate)
- Vice-president, strategy and portfolio management, ExxonMobil Upstream Business Development Company (2019 – 2020) (Affiliate)
- Special assignment, strategy and portfolio management, ExxonMobil Upstream Business Development Company (2019) (Affiliate)
- Vice-president, intermediates, performance derivatives, ExxonMobil Chemical Company (2017 – 2019) (Affiliate)
- Project executive, ExxonMobil Refining & Supply (2016 – 2017) (Affiliate)
Non-independent director Age: 60 Director since: September 17, 2019 Skills and experience: Leadership of large organizations, Operations/technical, Project management, Global experience, Strategy development, Financial expertise, Government relations, Executive compensation, Environment and sustainability, Risk management
Non-independent director Age: 48 Director since: May 4, 2021 Skills and experience: Leadership of large organizations, Operations/technical, Project management, Global experience, Strategy development, Financial expertise, Government relations, Executive compensation, Environment and sustainability, Risk management
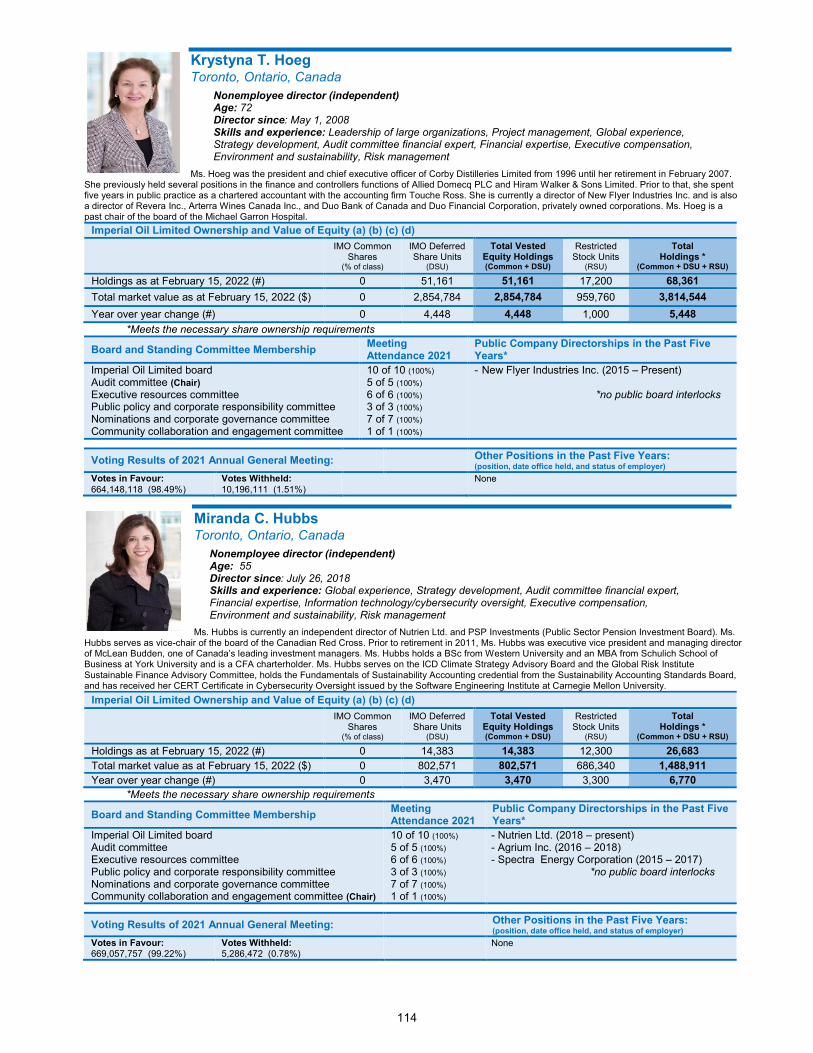
114
Krystyna T. Hoeg Toronto, Ontario, Canada
Ms. Hoeg was the president and chief executive officer of Corby Distilleries Limited from 1996 until her retirement in February 2007.
She previously held several positions in the finance and controllers functions of Allied Domecq PLC and Hiram Walker & Sons Limited. Prior to that, she spent five years in public practice as a chartered accountant with the accounting firm Touche Ross. She is currently a director of New Flyer Industries Inc. and is also a director of Revera Inc., Arterra Wines Canada Inc., and Duo Bank of Canada and Duo Financial Corporation, privately owned corporations. Ms. Hoeg is a past chair of the board of the Michael Garron Hospital.
Imperial Oil Limited Ownership and Value of Equity (a) (b) (c) (d)
IMO Common
Shares (% of class)
IMO Deferred Share Units
(DSU)
Total Vested Equity Holdings (Common + DSU)
Restricted Stock Units
(RSU)
Total Holdings *
(Common + DSU + RSU)
Holdings as at February 15, 2022 (#) 0 51,161 51,161 17,200 68,361
Total market value as at February 15, 2022 ($) 0 2,854,784 2,854,784 959,760 3,814,544
Year over year change (#) 0 4,448 4,448 1,000 5,448
*Meets the necessary share ownership requirements
Board and Standing Committee Membership Meeting Attendance 2021
Public Company Directorships in the Past Five Years*
Imperial Oil Limited board Audit committee (Chair) Executive resources committee Public policy and corporate responsibility committee Nominations and corporate governance committee Community collaboration and engagement committee
10 of 10 (100%) 5 of 5 (100%) 6 of 6 (100%) 3 of 3 (100%) 7 of 7 (100%)
1 of 1 (100%)
- New Flyer Industries Inc. (2015 – Present) *no public board interlocks
Voting Results of 2021 Annual General Meeting: Other Positions in the Past Five Years: (position, date office held, and status of employer)
Votes in Favour: 664,148,118 (98.49%)
Votes Withheld: 10,196,111 (1.51%)
None
Miranda C. Hubbs Toronto, Ontario, Canada
Ms. Hubbs is currently an independent director of Nutrien Ltd. and PSP Investments (Public Sector Pension Investment Board). Ms. Hubbs serves as vice-chair of the board of the Canadian Red Cross. Prior to retirement in 2011, Ms. Hubbs was executive vice president and managing director of McLean Budden, one of Canada’s leading investment managers. Ms. Hubbs holds a BSc from Western University and an MBA from Schulich School of Business at York University and is a CFA charterholder. Ms. Hubbs serves on the ICD Climate Strategy Advisory Board and the Global Risk Institute Sustainable Finance Advisory Committee, holds the Fundamentals of Sustainability Accounting credential from the Sustainability Accounting Standards Board, and has received her CERT Certificate in Cybersecurity Oversight issued by the Software Engineering Institute at Carnegie Mellon University.
Imperial Oil Limited Ownership and Value of Equity (a) (b) (c) (d)
IMO Common
Shares (% of class)
IMO Deferred Share Units
(DSU)
Total Vested Equity Holdings (Common + DSU)
Restricted Stock Units
(RSU)
Total Holdings *
(Common + DSU + RSU)
Holdings as at February 15, 2022 (#) 0 14,383 14,383 12,300 26,683
Total market value as at February 15, 2022 ($) 0 802,571 802,571 686,340 1,488,911
Year over year change (#) 0 3,470 3,470 3,300 6,770
*Meets the necessary share ownership requirements
Board and Standing Committee Membership Meeting Attendance 2021
Public Company Directorships in the Past Five Years*
Imperial Oil Limited board Audit committee Executive resources committee Public policy and corporate responsibility committee Nominations and corporate governance committee Community collaboration and engagement committee (Chair)
10 of 10 (100%) 5 of 5 (100%) 6 of 6 (100%) 3 of 3 (100%) 7 of 7 (100%)
1 of 1 (100%)
- Nutrien Ltd. (2018 – present) - Agrium Inc. (2016 – 2018) - Spectra Energy Corporation (2015 – 2017) *no public board interlocks
Voting Results of 2021 Annual General Meeting: Other Positions in the Past Five Years: (position, date office held, and status of employer)
Votes in Favour: 669,057,757 (99.22%)
Votes Withheld: 5,286,472 (0.78%)
None
Nonemployee director (independent) Age: 72 Director since: May 1, 2008 Skills and experience: Leadership of large organizations, Project management, Global experience, Strategy development, Audit committee financial expert, Financial expertise, Executive compensation, Environment and sustainability, Risk management
Nonemployee director (independent) Age: 55 Director since: July 26, 2018 Skills and experience: Global experience, Strategy development, Audit committee financial expert, Financial expertise, Information technology/cybersecurity oversight, Executive compensation, Environment and sustainability, Risk management
115
Jack M. Mintz Calgary, Alberta, Canada
Dr. Mintz is currently the President’s Fellow at the University of Calgary’s School of Public Policy, a position he has held since July 2015. Dr. Mintz also serves on the board of Alberta Health Services and is the Senior Fellow at the C.D. Howe Institute,
Distinguished Fellow at the MacDonald-Laurier Institute and Research Fellow at the International Tax and Investment Center (Washington D.C.). From 2006 to 2015, Dr. Mintz was the founding Director and Palmer Chair in Public Policy for the University of Calgary, and from 1999 to 2006, he was the president and chief executive officer of the C.D. Howe Institute. Prior to 2007, he also held professor positions at Queen's University and the Joseph L. Rotman School of Management at the University of Toronto. Dr. Mintz also has published widely in the fields of public economics and fiscal federalism, has been an advisor to governments on fiscal matters, and has frequently published articles in national newspapers and magazines. Dr. Mintz received the Order of Canada in 2015.
Imperial Oil Limited Ownership and Value of Equity (a) (b) (c) (d)
IMO Common
Shares (% of class)
IMO Deferred Share Units
(DSU)
Total Vested Equity Holdings (Common + DSU)
Restricted Stock Units
(RSU)
Total Holdings *
(Common + DSU + RSU)
Holdings as at February 15, 2022 (#) 1,000 (<0.01%) 46,530 47,530 17,200 64,730
Total market value as at February 15, 2022 ($) 55,800 2,596,374 2,652,174 959,760 3,611,934
Year over year change (#) 0 4,325 4,325 1,000 5,325
*Meets the necessary share ownership requirements
Board and Standing Committee Membership Meeting Attendance 2021
Public Company Directorships in the Past Five Years*
Imperial Oil Limited board Audit committee Executive resources committee Public policy and corporate responsibility committee (Chair) Nominations and corporate governance committee Community collaboration and engagement committee
10 of 10 (100%) 5 of 5 (100%) 6 of 6 (100%) 3 of 3 (100%) 7 of 7 (100%)
1 of 1 (100%)
- Morneau Shepell Inc. (2010 – 2020) *no public board interlocks
Voting Results of 2021 Annual General Meeting: Other Positions in the Past Five Years: (position, date office held, and status of employer)
Votes in Favour: 643,739,018 (95.46%)
Votes Withheld: 30,605,211 (4.54%)
None
David S. Sutherland Scottsdale, Arizona, United States of America
In July 2007, Mr. Sutherland retired as president and chief executive officer of the former IPSCO, Inc. after spending 30 years with the company and more than five years as president and chief executive officer. Mr. Sutherland is the chairman of the board of United States Steel Corporation and director of GATX Corporation. Mr. Sutherland is also chairman of Graham Group Ltd., an employee owned corporation. Mr. Sutherland is a former chairman of the American Iron and Steel Institute and served as a member of the board of directors of the Steel Manufacturers Association, the International Iron and Steel Institute, the Canadian Steel Producers Association and the National Association of Manufacturers.
Imperial Oil Limited Ownership and Value of Equity (a) (b) (c) (d)
IMO Common
Shares (% of class)
IMO Deferred Share Units
(DSU)
Total Vested Equity Holdings (Common + DSU)
Restricted Stock Units
(RSU)
Total Holdings *
(Common + DSU + RSU)
Holdings as at February 15, 2022 (#) 55,000 (<0.01%) 43,636 98,636 17,200 115,836
Total market value as at February 15, 2022 ($) 3,069,000 2,434,889 5,503,889 959,760 6,463,649
Year over year change (#) 0 4,248 4,248 1,000 5,248
*Meets the necessary share ownership requirements
Board and Standing Committee Membership Meeting Attendance 2021
Public Company Directorships in the Past Five Years*
Imperial Oil Limited board Audit committee Executive resources committee (Chair) Public policy and corporate responsibility committee Nominations and corporate governance committee Community collaboration and engagement committee
10 of 10 (100%) 5 of 5 (100%) 6 of 6 (100%) 3 of 3 (100%) 7 of 7 (100%)
1 of 1 (100%)
- GATX Corporation (2007 – Present) - United States Steel Corporation (2008 – Present) *no public board interlocks
Voting Results of 2021 Annual General Meeting: Other Positions in the Past Five Years: (position, date office held, and status of employer)
Votes in Favour: 658,802,073 (97.70%)
Votes Withheld: 15,542,156 (2.30%)
None
Nonemployee director (independent) Age: 70 Director since: April 21, 2005 Skills and experience: Global experience, Strategy development, Financial expertise, Government relations, Academic/research, Executive compensation, Environment and sustainability, Risk management
Nonemployee director (independent) Age: 72 Director since: April 29, 2010 Skills and experience: Leadership of large organizations, Operations/technical, Global experience, Strategy development, Audit committee financial expert, Financial expertise, Government relations, Executive compensation, Environment and sustainability, Risk management

116
Footnotes to director nominee tables on pages 112 through 115:
(a) The information includes the beneficial ownership of common shares of Imperial Oil Limited, which information not being within the knowledge of the company has been provided by the nominees individually.
(b) The company's plan for restricted stock units for nonemployee directors is described on page 140. The company's plan for deferred share units for nonemployee directors is described on page 139. The company's plan for restricted stock units for selected employees is described on page 163.
(c) The numbers for the company's restricted stock units represent the total of the outstanding restricted stock units received in 2015 through 2021 and deferred share units received since directors’ appointment.
(d) The value for Imperial Oil Limited common shares, deferred share units and restricted stock units is based on the closing price for Imperial Oil Limited common shares on the Toronto Stock Exchange of $55.80 on February 15, 2022.
Director and nominee holdings in Exxon Mobil Corporation (a)
Director XOM Common
Shares (#)
XOM Restricted Stock
(#) (b)
Total Common Shares and
Restricted Stock (#)
Total Market Value of Common Shares and
Restricted Stock ($) (c)
B.W. Corson 114,686 88,000 202,686 20,140,312
M.R. Crocker 15,938 102,250 118,188 11,743,994
D.S. Sutherland 5,730 - 5,730 569,373
(a) Holdings as at February 15, 2022. The information includes the beneficial ownership of common shares of Exxon Mobil Corporation, which information not being within the knowledge of the company has been provided by the nominees and directors individually. None of these individuals own more than 0.01 percent of the outstanding shares of Exxon Mobil Corporation. D.W. Cornhill, K.T. Hoeg, M.C. Hubbs and J.M. Mintz do not own common shares or hold restricted stock of Exxon Mobil Corporation.
(b) The numbers for Exxon Mobil Corporation restricted stock include outstanding restricted stock and restricted stock units granted under its restricted stock plan which is similar to the company's restricted stock unit plan.
(c) The value for Exxon Mobil Corporation common shares and restricted stock is based on the closing price for Exxon Mobil Corporation common shares on the New York Stock Exchange of $77.99 U.S., which is converted to Canadian dollars at the daily rate of exchange of $1.2741 provided by the Bank of Canada for February 15, 2022.
Majority voting policy In order to better align with the Canadian Coalition for Good Governance’s policy, “Governance Differences of Equity Controlled Corporations”, in 2012, the board of directors of the company passed a resolution adopting a majority voting policy. As of the date of this circular, Exxon Mobil Corporation holds 69.6 percent of the company’s shares. If Exxon Mobil Corporation’s shareholdings were ever to fall below 50 percent, the company’s policy provides that for any non-contested election of directors, any director nominee who receives a greater number of votes "withheld" from his or her election than votes "for" in such election shall tender his or her resignation. Within 90 days after certification of the election results, the board of directors will decide, through a process managed by the nominations and corporate governance committee and excluding the nominee in question, whether to accept the resignation. Absent a compelling reason for the director to remain on the board, the board shall accept the resignation. The board will promptly disclose its decision and, if applicable, the reasons for rejecting the tendered resignation.

117
Corporate governance disclosure
Corporate governance at a glance
Controlled company Yes
Size of board 7
Number of independent directors 5
Women on board 2
Average attendance of directors at board and committee meetings 100%
Independent chair of the executive sessions Yes
In camera sessions of independent directors at every board meeting Yes
Independent status of audit committee 100%
Audit committee members financially literate All
Independent status of executive resources committee 83%
Independent status of nominations and corporate governance committee 83%
Majority of independent directors on all committees Yes
Individual director elections Yes
Average tenure of director nominees (approximate) 8 years
Average age of director nominees (approximate) 64 years
Mandatory retirement age 72 years
Majority voting policy Yes
Separate board chair and CEO No
Number of board interlocks None
No director serves on more than two boards of another reporting issuer Yes
Share ownership requirements for independent directors Yes
Share ownership requirements for chairman and chief executive officer Yes
Board orientation and education program Yes
Code of business conduct and ethics Yes
Board and committee charters Yes
Position descriptions for the chairman and chief executive officer and the chair of each committee Yes
Skills matrix for directors Yes
Annual board evaluation process Yes
Annual advisory vote on executive compensation No
Dual-class shares No
Change of control agreements No

118
Statement of corporate governance practice
This section provides information pertaining to our board, the committees of the board, ethics, diversity and shareholder engagement. The company is committed to high corporate governance standards and best practices. The company’s corporate governance policies and practices comply with and in most cases exceed the requirements of National Instrument 52-110 Audit Committees (NI 52-110), National Policy 58-201 Corporate Governance Guidelines (NP 58-201) and National Instrument 58-101 Disclosure of Corporate Governance Practices (NI 58-101). The company’s common shares trade on the Toronto Stock Exchange and the NYSE American LLC and our corporate governance practices reflect the standards of these exchanges. In accordance with NYSE American LLC requirements for non-U.S. companies, the company is in compliance with NYSE American standards in all significant respects except as described on the company’s website at www.imperialoil.ca.
Composition of our board nominees
More information on diversity, including on the board and among executive officers of the company, can be found at page 146.
71%
29%
Gender
Men
Women
71%
29%
Independence
Independent
Not Independent
30%
40%
30%
Regional association
Eastern Canada
Western Canada
United States71%
29%
Public company board experience
Public boardexperience
No public boardexperience
43%
57%
Energy industry experience
Energy industryexperience
Non-energy industryexperience
57%
43%
CEO experience
CEO experience
No CEO experience
The company continually reviews its governance practices and monitors regulatory changes.

119
Tenure of our board nominees The board charter provides that incumbent directors will not be re-nominated if they have attained the age of 72, except under exceptional circumstances and at the request of the chairman. K.T. Hoeg and D.S. Sutherland have reached the company’s mandatory retirement age for directors in 2022. However, the ongoing COVID-19 pandemic has given rise to a rapidly evolving business environment, has created new challenges in relation to health, safety, and operational integrity, and has impacted the timing and progress of the board’s director recruitment process. Given these exceptional circumstances, the board recognizes the value of stability and continuity as these challenges continue to evolve. Therefore, at the request of the chairman and in accordance with the board charter, the nominations and corporate governance committee supported, and the board approved, Ms. Hoeg and Mr. Sutherland’s nomination for re-election for one further year. Following the annual meeting of shareholders, the company will continue its director recruitment process and any announcements of new directors will be made as they are available. The company does not have term limits for independent directors because it values the comprehensive knowledge of the company that long serving directors possess and independent directors are expected to remain qualified to serve for a minimum of five years. The following chart shows the current years of service of the nominees for the board of directors and the year they would normally be expected to retire from the board.
Name of director nominee Years of service on the board Year of expected retirement from
the board for independent directors
D.W. Cornhill 4 years 2026
B.W. Corson 2 years -
M.R. Crocker 1 year -
K.T. Hoeg 14 years 2023
M.C. Hubbs 3 years 2039
J.M. Mintz 17 years 2023
D.S. Sutherland 12 years 2023

120
Skills and experience of our board members and nominees
The current directors and director nominees collectively have the experience and expertise required to ensure effective oversight, stewardship and governance of the company. The key areas of experience and skills for each of the nominees for election as directors can also be found in each of the nominees tables on pages 112 through 115 of this circular.
The table below sets out the diverse skill set required of the board and identifies the particular experience, qualifications, attributes, and skills of each director and nominee that led the board to conclude that such person should serve as a director of the company.
D.W.
Cornhill B.W.
Corson M.R.
Crocker K.T.
Hoeg M.C.
Hubbs J.M.
Mintz D.S.
Sutherland
Leadership of large organizations
■ ■ ■ ■ ■
Operations / technical ■ ■ ■ ■
Project management ■ ■ ■ ■
Global experience ■ ■ ■ ■ ■ ■
Strategy development ■ ■ ■ ■ ■ ■ ■
Environment and sustainability
■ ■ ■ ■ ■ ■ ■
Audit committee financial expert
■ ■ ■ ■
Financial expertise ■ ■ ■ ■ ■ ■ ■
Government relations ■ ■ ■ ■
Academic / research ■
Information technology / cybersecurity oversight
■
Executive compensation ■ ■ ■ ■ ■ ■ ■
Risk management ■ ■ ■ ■ ■ ■ ■
Our directors bring a wide range of skills, diversity and experience.

121
Independence of our board members and nominees
The board is currently composed of seven directors, all of whom will be standing for re-election at the annual meeting of shareholders on May 3, 2022. The majority of the board and nominees (five out of seven) are independent. The independent directors are not employees of the company. The board determines independence on the basis of the standards specified by National Instrument 52-110 Audit Committees (NI 52-110), the U.S. Securities and Exchange Commission rules and the listing standards of the NYSE American LLC. The board has reviewed relevant relationships between the company and each nonemployee director and director nominee to determine compliance with these standards.
Based on the directors’ responses to an annual questionnaire, the board determined that none of the independent directors has any interest, business or other relationship that could or could reasonably be perceived to constitute a material relationship with the company. B.W. Corson is a director and chairman, president and chief executive officer of the company and not considered to be independent. The board believes that Mr. Corson’s extensive knowledge of the business of the company and Exxon Mobil Corporation is beneficial to the other directors and his participation enhances the effectiveness of the board.
M.R. Crocker is also a non-independent director as he is an employee of Exxon Mobil Corporation. The company believes that Mr. Crocker, although deemed non-independent under the relevant standards by virtue of his employment, can be viewed as independent of the company's management and that his ability to reflect the perspective of the company’s shareholders enhances the effectiveness of the board.
Name of director (a)
Management Independent Not
independent Reason for non-independent status
D.W. Cornhill ■
B.W. Corson ■ ■ B.W. Corson is a director and chairman, president and
chief executive officer of Imperial Oil Limited.
M.R. Crocker ■ M.R. Crocker is an employee of Exxon Mobil Corporation.
K.T. Hoeg ■
M.C. Hubbs ■
J.M. Mintz ■
D.S. Sutherland ■
(a) D.C. Brownell did not stand for re-election in 2021 and resigned from the board and its committees on May 4, 2021, and was not
independent during his tenure in 2021.
Five out of seven of the director nominees are independent.

122
Committee membership of our board
The chart below shows the company's current standing committee memberships and the chair of each committee.
Director
Nominations and corporate governance committee
Audit committee
(b)
Public policy and corporate responsibility
committee
Executive resources committee
Community collaboration
and engagement committee
D.W. Cornhill (c) ■
Chair ■ ■ ■ ■
B.W. Corson (a) - - - - ■
M.R. Crocker (a) ■ - ■ ■ ■
K.T. Hoeg (c) ■ ■
Chair ■ ■ ■
M.C. Hubbs (c) ■ ■ ■ ■ ■
Chair
J.M. Mintz ■ ■ ■
Chair ■ ■
D.S. Sutherland (c) ■ ■ ■ ■
Chair ■
(a) Not independent directors. (b) All members of the audit committee are independent and financially literate within the meaning of National Instrument 52-
110 Audit Committees and the listing standards of the NYSE American LLC. (c) Audit committee financial experts under U.S. regulatory requirements.
In addition to its standing committees, the board may establish ad hoc committees or special committees from time to time. On September 30, 2021, a special committee of independent directors was created for the purposes of considering certain matters. The special committee is chaired by D.W. Cornhill and consists of the five independent directors.
Number of meetings The chart below shows the number of board and standing committee meetings held in 2021. This includes seven regular meetings and three additional special meetings of the board. Due to public health recommendations and restrictions related to COVID-19 and for the health and safety of our directors and employees, all meetings in 2021 were conducted virtually. More information on the board’s activities in relation to COVID-19 can be found in the Risk oversight section starting on page 129. Meetings of the board and standing committees in 2021:
Board 10
Audit committee
5
Executive resources
committee
6
Public policy and corporate
responsibility committee
3
Nominations and corporate
governance committee
7
Community collaboration and
engagement committee
1
Each standing committee is chaired by a different independent director and
all of the independent directors are members of each committee.
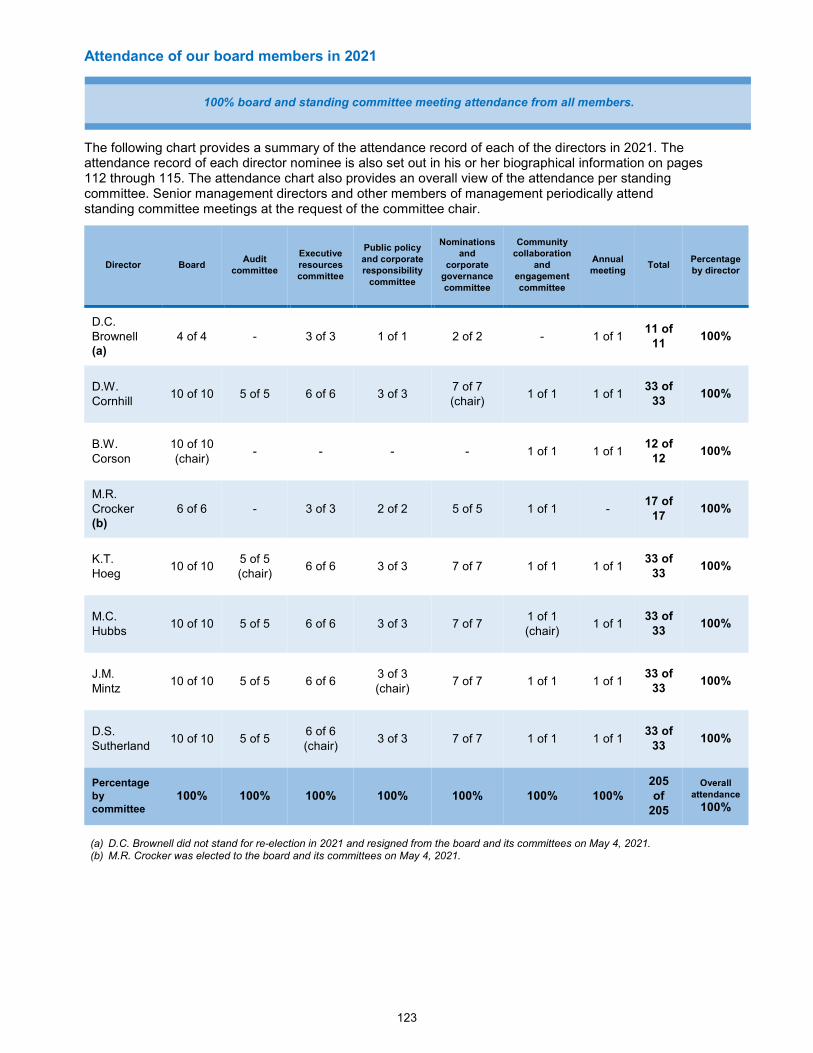
123
Attendance of our board members in 2021
The following chart provides a summary of the attendance record of each of the directors in 2021. The attendance record of each director nominee is also set out in his or her biographical information on pages 112 through 115. The attendance chart also provides an overall view of the attendance per standing committee. Senior management directors and other members of management periodically attend standing committee meetings at the request of the committee chair.
Director Board Audit
committee
Executive
resources committee
Public policy
and corporate responsibility
committee
Nominations and
corporate governance
committee
Community collaboration
and engagement
committee
Annual meeting
Total Percentage by director
D.C. Brownell (a)
4 of 4 - 3 of 3 1 of 1 2 of 2 - 1 of 1 11 of
11 100%
D.W. Cornhill
10 of 10 5 of 5 6 of 6 3 of 3 7 of 7 (chair)
1 of 1 1 of 1 33 of
33 100%
B.W. Corson
10 of 10 (chair)
- - - - 1 of 1 1 of 1 12 of
12 100%
M.R. Crocker (b)
6 of 6 - 3 of 3 2 of 2 5 of 5 1 of 1 - 17 of
17 100%
K.T. Hoeg
10 of 10 5 of 5 (chair)
6 of 6 3 of 3 7 of 7 1 of 1 1 of 1 33 of
33 100%
M.C. Hubbs
10 of 10 5 of 5 6 of 6 3 of 3 7 of 7 1 of 1 (chair)
1 of 1 33 of
33 100%
J.M. Mintz
10 of 10 5 of 5 6 of 6 3 of 3 (chair)
7 of 7 1 of 1 1 of 1 33 of
33 100%
D.S. Sutherland
10 of 10 5 of 5 6 of 6 (chair)
3 of 3 7 of 7 1 of 1 1 of 1 33 of
33 100%
Percentage by committee
100% 100% 100% 100% 100% 100% 100% 205 of
205
Overall
attendance
100%
(a) D.C. Brownell did not stand for re-election in 2021 and resigned from the board and its committees on May 4, 2021. (b) M.R. Crocker was elected to the board and its committees on May 4, 2021.
100% board and standing committee meeting attendance from all members.

124
Other public company directorships of our board members and nominees
The following table shows which directors and nominees serve on the boards of other reporting issuers and the committee memberships in those companies.
Name of director
Other reporting issuers of which director or nominee is also a director
Type of company Stock symbol: Exchange
Committee appointments
D.W. Cornhill
AltaGas Ltd. Diversified energy company
ALA:TSX No committees
B.W. Corson
- - - -
M.R. Crocker
- - - -
K.T. Hoeg
New Flyer Industries Inc. Manufacturer of heavy duty transit buses
NFI:TSX Audit committee
M.C. Hubbs
Nutrien Ltd. Fertilizer manufacturing NTR:TSX, NYSE
Corporate governance and nominating committee and Safety and sustainability committee (chair)
J.M. Mintz
- - - -
D.S. Sutherland
GATX Corporation Commercial rail vehicles and aircraft engines – shipping
GMT:NYSE Compensation committee (chair) and Governance committee
United States Steel Corporation
Iron and steel X:NYSE Chairman of the board
Interlocking directorships of our board members As of the date of this proxy circular, there are no interlocking public company directorships among the directors listed in this circular.
No director or nominee serves on more than two boards of another reporting issuer.

125
Director qualification and selection process The nominations and corporate governance committee is responsible for identifying and recommending new candidates for board nomination. The committee identifies candidates from a number of sources, including executive search firms and referrals from existing directors. The process for selection is described in paragraph 10 (a) of the Board of Directors Charter found in Appendix A of this circular. The committee will consider potential future candidates as required. In considering the qualifications of potential nominees for election as directors, the nominations and corporate governance committee considers the work experience and other areas of expertise of the potential nominees, with the objective of providing for diversity among the nonemployee directors. The following key criteria are considered to be relevant to the work of the board of directors and its committees:
Work experience Experience in leadership of businesses or other large organizations (Leadership of large
organizations) Operations/technical experience (Operations / technical) Project management experience (Project management) Experience in working in a global work environment (Global experience) Experience in development of business strategy (Strategy development) Experience with environmental, health, community relations and/or safety policy, practices and
management (Environment and sustainability)
Other expertise Audit committee financial expert (also see the financial expert section in the audit committee table
starting on page 133) Expertise in financial matters (Financial expertise) Expertise in managing relations with government (Government relations) Experience in academia or in research (Academic / research) Expertise in information technology and cybersecurity oversight (Information technology /
cybersecurity oversight) Expertise in executive compensation policies and practices (Executive compensation) Expertise in oversight of risk management policies and practices (Risk management)
The nominations and corporate governance committee may consider the following additional factors in assessing potential nominees:
possessing expertise in any of the following areas: law, science, marketing, administration, social/political environment or community and civic affairs;
individual competencies in business and other areas of endeavour in contributing to the collective experience of the directors; and
providing diversity of age, regional association, gender and other diversity elements (including Aboriginal peoples, persons with disabilities and members of visible minorities).
The nominations and corporate governance committee assesses the work experience and other expertise each existing director possesses and whether the candidate is able to fill any gaps in such experience, expertise and diversity of age, regional association, gender and other diversity elements. Consideration is also given to whether candidates possess the ability to contribute to the broad range of issues with which the board and its committees must deal, are able to devote the necessary amount of time to prepare for and attend board and committee meetings and are free of any potential legal impediment or conflict of interest.
Candidates are expected to remain qualified to serve for a minimum of five years and independent directors are expected to achieve ownership of no less than 16,500 common shares, deferred share units and restricted share units within five years of becoming an independent director. When the committee is recommending candidates for re-nomination, it assesses such candidates against the criteria for re-nomination as set out in paragraph 10 (b) of the Board of Directors Charter found in Appendix A of this circular. Candidates for re-nomination are expected not to change their principal position, the thrust of their involvement or their regional association in a way that would significantly detract from their value as a director of the corporation. They are also expected to continue to be compatible with the criteria that led to their selection as nominees. Under exceptional circumstances, the nominations and

126
corporate governance committee, on the request of the chairman, may continue to support the nomination of a director who has attained the mandatory retirement age. K.T. Hoeg and D.S. Sutherland have reached the company’s mandatory retirement age for directors in 2022. As a result, the committee did initiate a director recruitment process in 2021, however, the ongoing COVID-19 pandemic has given rise to a rapidly evolving business environment, it has created new challenges in relation to health, safety, and operational integrity, and it has impacted the timing and progress of the director recruitment process. In light of these considerations, the committee and the board recognize the value of stability and continuity as these challenges continue to evolve. Therefore, in accordance with the board charter, the committee supported, and the board approved, Ms. Hoeg and Mr. Sutherland’s nomination for re-election for one further year. Following the annual meeting of shareholders, the committee will continue its director recruitment process and any announcements of new directors will be made as they are available.
Director orientation, education and development
The corporate secretary organizes an orientation program for all new directors. In a series of meetings over several days, new directors are briefed by staff and functional managers on all significant areas of the company's operations, industry specific topics, risk oversight and regulatory issues. New directors are also briefed on significant company policies, organizational structure, security, information technology management and on critical planning and reserves processes. They also receive key governance and disclosure documents and a comprehensive board manual which contains a record of historical information about the company, by-laws, company policies, the charters of the board and its committees, other relevant company business information, information on directors’ duties and additional board related activities and calendars. Continuing education is provided to board and committee members through regular presentations by management, which focus on providing more in-depth information about key aspects of the business. Subject to exceptional circumstances, each year the board has an extended meeting that focuses on a particular area of the company's operations and includes a visit to one or more of the company's operating sites or a site of relevance. Due to public health recommendations and restrictions related to COVID-19, a site visit was not possible in 2021. The board continued to engage with management on pandemic specific topics such as response and mitigation plans and actions, health and safety initiatives, site-specific issues and strategic financial and business actions in response to the pandemic. More information on the board’s activities in relation to COVID-19 can be found in the Risk oversight section starting on page 129. Further, with strengthening market conditions throughout the year, the board focused on strategic direction, operational priorities, capital allocation and enhancing shareholder returns. The board also reviewed and discussed the company’s various environmental, social and governance initiatives, including the company’s founding membership in the Oil Sands Pathways to Net Zero initiative. Throughout 2021, the board and its committees received regular presentations and updates that focused on performance, strategy and opportunities for the business. Some of these presentations included ongoing reviews of upstream and downstream performance and plans, numerous environmental reviews including Canada climate policy updates, sustainability report and disclosure and emissions performance reviews, safety performance reviews, internal audit reviews, a pension management review, a review of harassment in workplace policy stewardship, community engagement strategy, a competition and anti-corruption review and an upstream research review. The board was also provided an information technology and cybersecurity update including strategic cybersecurity priorities, key security initiatives and mitigation efforts and system improvements throughout the year.
The company regularly provides in-depth presentations to the directors on relevant
and emerging issues and encourages continuing education opportunities.

127
Members of ExxonMobil’s management also provide reviews of various aspects of ExxonMobil’s global business. In 2021, the directors received a presentation on ExxonMobil’s cybersecurity update, as well as an overview of ExxonMobil’s research and development efforts. Members of the board also receive an extensive package of materials prior to each board meeting that provides a comprehensive summary on each agenda item to be discussed. Similarly, the committee members also receive a comprehensive summary on each agenda item to be discussed by that particular committee. Informational communications and other written publications or reports of interest to the directors are also forwarded routinely. The board members are canvassed as to whether there are any additional topics relevant to the board or to a specific committee that they would like to see addressed, and management schedules presentations covering these areas. In addition, at every meeting the board receives an extensive update from the chairman, president and chief executive officer on business environment trends, relevant geopolitical activities, federal government priorities, key provincial issues and competitor activities, as appropriate. Directors are encouraged to participate in other continuing education programs and events to ensure their skills and knowledge remain current.
Board performance assessment The board and its committees, as well as the performance of the directors, are assessed on an annual basis. For 2021, the directors engaged in a performance assessment with the chairman, president and chief executive officer, which includes discussion and evaluation of the board and each committee’s effectiveness in various areas. The chairman, president and chief executive officer also meets regularly with directors individually to discuss any outstanding issues. The nominations and corporate governance committee discuss a summary of these assessment outcomes in the first quarter of each year.
Board and committee structure Leadership structure The company has chosen to combine the positions of chairman, president and chief executive officer. The board believes the interests of all shareholders are best served at the present time through a leadership model with a combined chairman and chief executive officer position. Through more than 38 years of experience with ExxonMobil and Imperial, the current chief executive officer possesses an in-depth knowledge of the evolving energy industry supply and demand fundamentals and the array of challenges to be faced by the company. The board believes that the extensive experience and other insights put the chief executive officer in the best position to provide broad leadership for the board as it considers strategy and exercises its fiduciary responsibilities. Further, the board has demonstrated its commitment and ability to provide independent oversight of management. The company does not have a lead director. While the chairman of the board is not an independent director, K.T. Hoeg, chair of the executive sessions of the board, provides leadership for the independent directors. The duties of the chair of the executive sessions include presiding at executive sessions, reviewing and modifying, if necessary, the agenda of the meetings of the board in advance to ensure that the board may successfully carry out its duties, and acting as a liaison with the chairman of the board, including the provision of feedback, as appropriate, from the executive sessions. The position description of the chair of the executive sessions, as well as the purpose of those executive sessions, are fully described in paragraphs 9 (c) and (d) of the Board of Directors Charter attached as Appendix A.
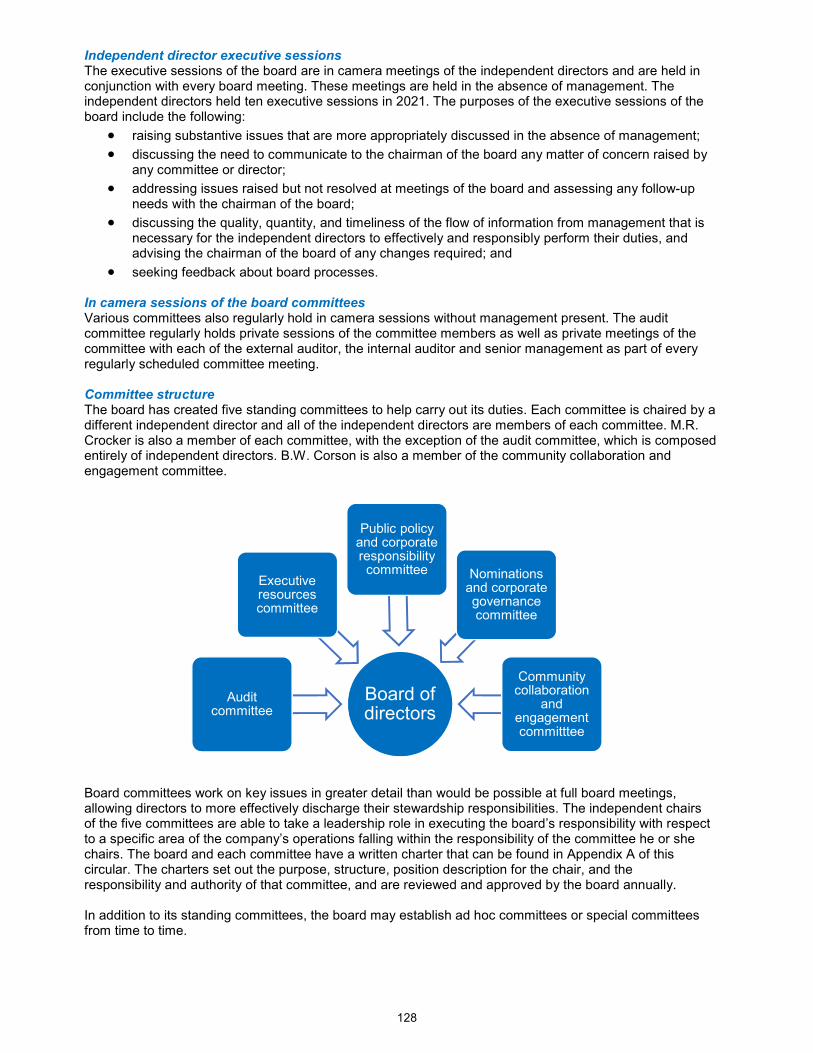
128
Independent director executive sessions The executive sessions of the board are in camera meetings of the independent directors and are held in conjunction with every board meeting. These meetings are held in the absence of management. The independent directors held ten executive sessions in 2021. The purposes of the executive sessions of the board include the following:
raising substantive issues that are more appropriately discussed in the absence of management;
discussing the need to communicate to the chairman of the board any matter of concern raised by any committee or director;
addressing issues raised but not resolved at meetings of the board and assessing any follow-up needs with the chairman of the board;
discussing the quality, quantity, and timeliness of the flow of information from management that is necessary for the independent directors to effectively and responsibly perform their duties, and advising the chairman of the board of any changes required; and
seeking feedback about board processes. In camera sessions of the board committees Various committees also regularly hold in camera sessions without management present. The audit committee regularly holds private sessions of the committee members as well as private meetings of the committee with each of the external auditor, the internal auditor and senior management as part of every regularly scheduled committee meeting. Committee structure The board has created five standing committees to help carry out its duties. Each committee is chaired by a different independent director and all of the independent directors are members of each committee. M.R. Crocker is also a member of each committee, with the exception of the audit committee, which is composed entirely of independent directors. B.W. Corson is also a member of the community collaboration and engagement committee.
Board committees work on key issues in greater detail than would be possible at full board meetings, allowing directors to more effectively discharge their stewardship responsibilities. The independent chairs of the five committees are able to take a leadership role in executing the board’s responsibility with respect to a specific area of the company’s operations falling within the responsibility of the committee he or she chairs. The board and each committee have a written charter that can be found in Appendix A of this circular. The charters set out the purpose, structure, position description for the chair, and the responsibility and authority of that committee, and are reviewed and approved by the board annually. In addition to its standing committees, the board may establish ad hoc committees or special committees from time to time.
Board of directors
Audit committee
Executive resources committee
Public policy and corporate responsibility committee Nominations
and corporate governance committee
Community collaboration
and engagement committtee
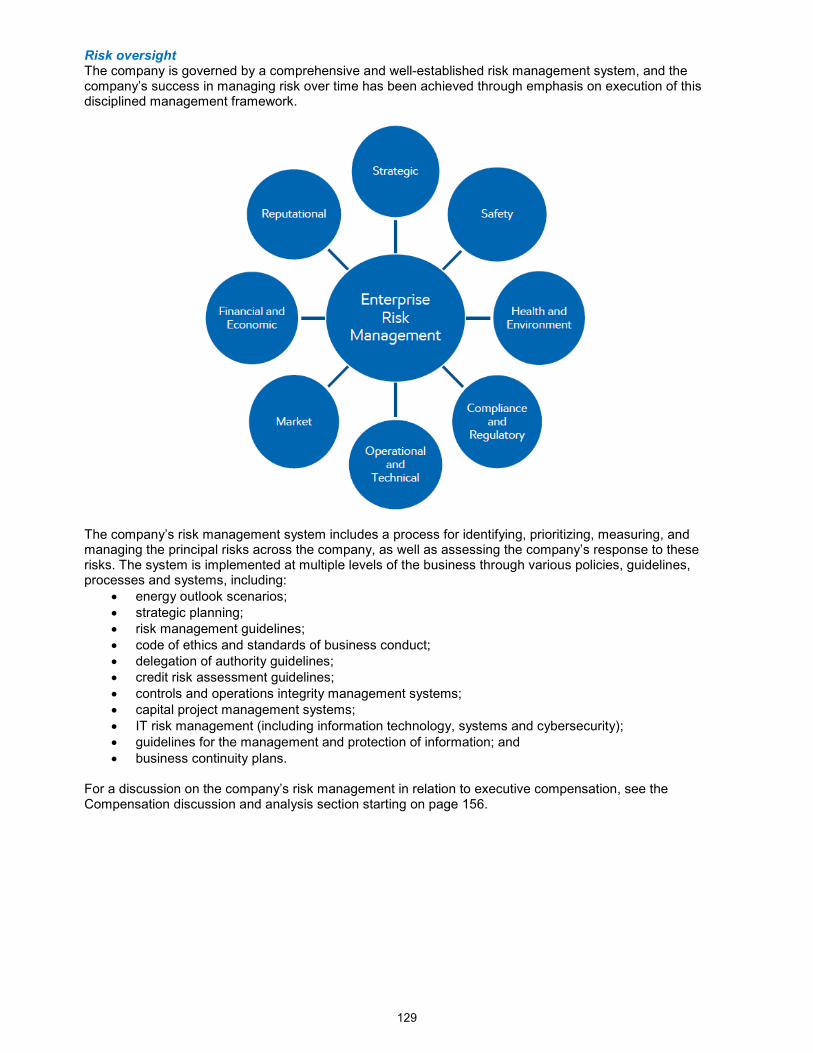
129
Risk oversight The company is governed by a comprehensive and well-established risk management system, and the company’s success in managing risk over time has been achieved through emphasis on execution of this disciplined management framework.
The company’s risk management system includes a process for identifying, prioritizing, measuring, and managing the principal risks across the company, as well as assessing the company’s response to these risks. The system is implemented at multiple levels of the business through various policies, guidelines, processes and systems, including:
energy outlook scenarios; strategic planning; risk management guidelines; code of ethics and standards of business conduct; delegation of authority guidelines; credit risk assessment guidelines; controls and operations integrity management systems; capital project management systems; IT risk management (including information technology, systems and cybersecurity); guidelines for the management and protection of information; and business continuity plans.
For a discussion on the company’s risk management in relation to executive compensation, see the Compensation discussion and analysis section starting on page 156.

130
Risk management oversight
The chairman, president and chief executive officer is charged with identifying the company’s principal risks and ensuring appropriate systems are in place to manage these risks. The board of directors is responsible for reviewing the principal risks and overseeing the implementation of the risk management system, with the various committees assisting in risk oversight for issues that fall under their responsibility. This integrated risk management approach facilitates recognition and oversight of risk. For example, the audit committee oversees the company’s system of internal accounting and financial controls, and the executive resources committee oversees the compensation programs and practices in relation to risk management.
The public policy and corporate responsibility committee oversees the policies and practices that manage environment, health, safety and security risk. This includes reviews of compliance with legislation and the assessment of public policy impacts on corporate performance, health and safety systems and performance, and the risks, actions and disclosure associated with climate change. As part of this assessment, the committee reviews the company’s commitments to environmental sustainability priorities such as progressive reclamation, decommissioning and remediation, water conservation and use, air quality improvement, waste management and land use and biodiversity. Additionally, the board of directors evaluates climate change risk in the context of overall enterprise risk, including other operational, strategic, and financial risks. The company considers the interactions among these factors as it pursues a strategy that is resilient to a wide range of potential pathways for society’s energy transition while continuing to grow shareholder value. The board and its committees carry out their risk oversight responsibility through regular reviews and assessments. Topic-specific assessments, such as for compliance programs, controls, stewardship of business performance, regulatory changes, the company’s energy outlook, and climate risk and sustainability are conducted regularly and as necessary. The board carefully considers various factors and risks in connection with specific proposals for capital expenditures, budget additions and strategic initiatives, as well as in evaluating strategic plans.

131
In the annual planning process, consideration is given to a diverse set of risks and other factors that may influence future energy supply and demand trends, including technological advancements, regulation and government policies, climate change, greenhouse gas restrictions, and other general economic conditions. It also takes into account emerging industry and economic conditions and market and government policy uncertainties in developing its strategic plans and longer-term price views. Further, the board is responsible for ensuring the company’s strategic planning process is effective, and in doing so regularly reviews the process, key issues and various alternatives for future strategy development to inform updates. Business plans and strategies are reviewed on an annual basis and approved by the board. Members of the board ask questions of management to ensure risks are identified, assessed, mitigated, and monitored. Each typical year, the board also visits one or more of the company’s operating sites or locations of importance for the company to better understand issues associated with the company’s business. However, a site visit was not possible in 2021 due to public health recommendations and restrictions related to COVID-19. COVID-19 in 2021 The COVID-19 pandemic and market conditions within the energy industry starting in 2020 has placed a significant emphasis on the board’s role in risk oversight. Throughout 2021, the board remained fully engaged on the company’s extensive business and emergency response plans and health and safety protocols in response to COVID-19. The board continuously reviewed and discussed with management the impact of COVID-19 and market conditions on performance, business strategies, employees and the community. The board also guided the company through improving market conditions while maintaining focus on the health and safety of the company’s employees, contract partners, customers and communities. Each committee continued to support the board by holding reviews and discussions of COVID-19 topics specific to their responsibilities. For example, the community collaboration and engagement committee oversaw numerous initiatives to support the community through this challenging period, including the second round of a free fuel promotion for healthcare workers and an initiative to promote mental health across Canada, among other initiatives. The table on the following pages provides additional oversight and other information about the board and its five standing committees:

132
Board of directors The board of directors is responsible for the stewardship of the corporation. The stewardship process is carried out by the board directly or through one or more of the committees of the board. The formal mandate of the board can be found within the Board of Directors Charter in Appendix A of this circular.
Directors
B.W. Corson (chair)
D.W. Cornhill M.R. Crocker K.T. Hoeg
M.C. Hubbs J.M. Mintz D.S. Sutherland
Number of
meetings
Ten meetings of the board of directors were held in 2021, which included three special meeting of the board. The independent directors hold executive sessions of the board in conjunction with every board meeting. These meetings are held in the absence of management. The independent directors held ten executive sessions in 2021.
Board
highlights in
2021
Regularly discussed industry activity, market updates and company initiatives.
Regularly discussed operational and project updates.
Regularly discussed risk management and business controls environment.
Regularly reviewed information technology, systems and cybersecurity strategies (including trends, risks, preparedness, mitigation, response, system improvements and business continuity strategies) to assess the security and integrity of the company’s information, systems and assets.
Discussed comprehensive company strategy for all business lines, including a focus on capital allocation and discipline.
Approved various avenues for enhancing shareholder returns such as increasing dividends and amending, renewing and accelerating the company’s normal course issuer bid programs.
Provided oversight in support of safety, environmental performance and sustainability.
Regularly discussed climate change policies, risks and Imperial’s climate strategy, including the company’s founding partnership in the Oil Sands Pathways to Net Zero initiative.
Reviewed various stages of key projects such as Strathcona’s renewable diesel project, Sarnia products pipeline and Kearl’s in pit tailings project.
Provided oversight of the company’s response to the COVID-19 pandemic.
Role in risk
oversight
The company’s financial, execution and operational risk rests with management and the company is governed by well-established risk management systems. The board of directors are responsible for reviewing the company’s principal risks and overseeing the implementation of the appropriate systems to manage these risks. The board carefully considers these risks in evaluating the company’s strategic plans and specific proposals for capital expenditures and budget additions. It also approves and monitors compliance with the code of ethics and business conduct, and ensures that executive officers create a culture of integrity throughout the company. The board reviews the company’s information technology, systems and cybersecurity to ensure they adequately protect corporate information and assets. In 2021, the board’s role in risk oversight included the company’s continued response to the COVID-19 pandemic, with a focus on the health and safety of the company’s employees, contract partners, customers and communities.
Disclosure
policy
The company is committed to full, true and plain public disclosure of all material information in a timely manner, in order to keep security holders and the investing public informed about the company’s operations. The full details of the corporate disclosure policy can be found on the company’s internet site at www.imperialoil.ca.
Independence The current board of directors is composed of seven directors, the majority of whom (five of seven) are independent. The five independent directors are not employees of the company.

133
Audit committee The role of the audit committee includes selecting and overseeing the independent auditor, reviewing the scope and results of the audit conducted by the independent auditor, and assisting the board in overseeing the integrity of the company’s financial statements. In addition, the committee’s role includes overseeing the company’s compliance with legal and regulatory requirements and the quality and effectiveness of internal controls, approving any changes in accounting principles and practices, and reviewing the results of monitoring activity under the company’s business ethics compliance program. The formal mandate of the committee can be found within the Audit Committee Charter in Appendix A of this circular.
Committee
members
K.T. Hoeg (chair) M.C. Hubbs (vice-chair) D.W. Cornhill
J.M. Mintz D.S. Sutherland
Number of
meetings
Five meetings of the audit committee were held in 2021. The committee members met in camera without management present and separately with the internal auditor and the external auditor at all regularly scheduled meetings. A pre-audit meeting also occurs prior to every regularly scheduled audit committee meeting with the chair of the audit committee and the chief financial officer and both the internal and external auditors.
Committee
highlights in
2021
Reviewed and recommended for approval the interim and full year financial and operating results.
Reviewed and assessed the company’s system of internal controls and auditing procedures, and the results of the internal auditor’s audit program.
Reviewed and assessed the external auditor plan, performance and fees.
Reviewed evolving regulations and reporting obligations.
Reviewed the committee’s mandate and completed the committee self-assessment.
Performed external auditor performance evaluation.
Ensured the effectiveness of controls and procedures and integrity of financial statements was maintained while continuing to respond to the COVID-19 pandemic.
Financial
expertise
The company’s board of directors has determined that D.W. Cornhill, K.T. Hoeg, M.C. Hubbs and D.S. Sutherland meet the definition of “audit committee financial expert”. The U.S. Securities and Exchange Commission has indicated that the designation of an audit committee financial expert does not make that person an expert for any purpose, or impose any duties, obligations or liability on that person that are greater than those imposed on members of the audit committee and board of directors in the absence of such designation or identification. All members of the audit committee are financially literate within the meaning of National Instrument 52-110 Audit Committees and the listing
standards of the NYSE American LLC.
Role in risk
oversight
The audit committee also has an important role in risk oversight. The audit committee oversees risks associated with financial and accounting matters, including compliance with legal and regulatory requirements, and the company’s financial reporting and internal controls systems. In addition, it reviews the scope of PricewaterhouseCoopers’ audit in light of risks associated with the energy industry, the regulatory environment and company-specific financial audit risks. The committee also reviews financial statements and internal and external audit results, and any changes proposed to accounting principles and practices. With respect to the COVID-19 pandemic, the audit committee is also responsible for ensuring the reporting and internal controls are maintained as the company implements various response measures, including work from home arrangements.
Independence
The audit committee is composed entirely of independent directors. All members met board approved independence standards, as that term is defined in National Instrument 52-110 Audit Committees, the
U.S. Securities and Exchange Commission rules and the listing standards of the NYSE American LLC.
134
Executive resources committee The executive resources committee is responsible for corporate policy on compensation and for specific decisions on the compensation of the chief executive officer and key senior executives and officers reporting directly to that position. In addition to compensation matters, the committee is also responsible for succession plans and appointments to senior executive and officer positions, including the chief executive officer. The formal mandate of the committee can be found within the Executive Resources Committee Charter in Appendix A of this circular.
Committee
members
D.S. Sutherland (chair)
D.W. Cornhill (vice-chair) M.R. Crocker
K.T. Hoeg M.C. Hubbs J.M. Mintz
None of the members of the executive resources committee currently serves as a chief executive officer of another company.
Number of
meetings Six meetings of the executive resources committee were held in 2021.
Committee
highlights in
2021
Reviewed executive compensation program and principles.
Reviewed strategic work planning and talent strategy plans.
Reviewed workforce and organizational changes.
Reviewed harassment policy and process outcomes.
Continued focus on succession planning for senior management positions.
Appointed a senior vice-president and general auditor as part of normal succession.
Committee
members
relevant skills
and
experience
D.W. Cornhill, K.T. Hoeg, M.C. Hubbs and D.S. Sutherland had extensive and lengthy experience in managing and implementing their respective companies’ compensation policies and practices in their past role as chief executive officers or members of senior management. Mr. Cornhill, Ms. Hoeg, Dr. Mintz and Mr. Sutherland serve or have served on compensation committees of one or more public companies. Accordingly, committee members are able to use this experience and knowledge derived from their roles with other companies in judging the suitability of the company’s compensation policies and practices.
Role in risk
oversight The executive resources committee oversees the compensation programs and practices that are designed to encourage appropriate risk assessment and risk management.
Independence
The members of the executive resources committee are independent, with the exception of M.R. Crocker, who is not considered to be independent under the rules of the U.S. Securities and Exchange Commission, Canadian securities rules and the rules of the NYSE American LLC due to his employment with Exxon Mobil Corporation. However, the Canadian Coalition for Good Governance’s policy, “Governance Differences of Equity Controlled Corporations”, views Mr. Crocker as a related director and independent of management and who may participate as a member of the company’s executive resources committee. Mr. Crocker’s participation helps to ensure an objective process for determining compensation of the company’s officers and directors and assists the deliberations of this committee by bringing the views and perspectives of the majority shareholder.

135
Public policy and corporate responsibility committee The role of the public policy and corporate responsibility committee is to review and monitor the company’s policies and practices in matters of the environment, health, safety, security and sustainability. The committee monitors the company’s compliance with legislative, regulatory and corporate standards in these areas, and reviews trends and current and emerging public policy. It also assesses the potential impacts of public policy on corporate performance. The committee reviews safety and environmental performance, incidents and trends on a regular basis to ensure the company’s focus on the safety of its employees, contractors and stakeholders and on operating in an environmentally responsible manner. It also provides oversight over sustainability and climate risk, including regular reviews and assessment of sustainability performance and initiatives, as well as climate risk within the company’s risk management system and the strategies to address these risks. The formal mandate of the committee can be found within the Public Policy and Corporate Responsibility Committee Charter in Appendix A of this circular.
Committee
members
J.M. Mintz (chair) D.S. Sutherland (vice-chair)
D.W. Cornhill
M.R. Crocker K.T. Hoeg M.C. Hubbs
Number of
meetings Three meetings of the public policy and corporate responsibility committee were held in 2021.
Committee
highlights in
2021
Personnel and process safety systems, performance and incident review. Environmental performance review (greenhouse gas, other air emissions, water consumption). Updates on Canadian policy, regulatory change, potential impacts and Imperial’s advocacy strategies
(air quality, plastics, UN Declaration on the Rights of Indigenous Peoples). Review of climate change policies, risks, potential impacts and Imperial’s advocacy and climate
strategies. Review of Imperial’s Sustainability Report and related environmental, social and corporate
governance disclosures and Imperial’s disclosure strategy and plans.
Role in risk
oversight
The public policy and corporate responsibility committee reviews and monitors the company's policies and practices in matters of environment, health, personnel and process safety and security, which policies and practices are intended to mitigate and manage risk in these areas. This includes specific reviews with respect to climate risk and the company’s strategies to address these risks. It also includes pandemic and emergency response and continuity planning, which is a significant focus of reviews and discussions in relation to the COVID-19 pandemic. The committee receives regular reports from management on these matters.
Independence The members of the public policy and corporate responsibility committee are independent, with the exception of M.R. Crocker.
Nominations and corporate governance committee The role of the nominations and corporate governance committee is to oversee issues of corporate governance as they apply to the company, including the overall performance of the board, review potential nominees for directorship and review the charters of the board and any of its committees. The formal mandate of the committee can be found within the Nominations and Corporate Governance Committee Charter in Appendix A of this circular.
Committee
members
D.W. Cornhill (chair) J.M. Mintz (vice-chair) M.R. Crocker
K.T. Hoeg M.C. Hubbs D.S. Sutherland

136
Number of
meetings Seven meetings of the nominations and corporate governance committee were held in 2021.
Committee
highlights in
2021
Approval of the statement of corporate governance practices.
Engagement in board and committee self-assessment.
Recommendation of director compensation and increase to share ownership requirements.
Initiation and oversight of director recruitment process.
Role in risk
oversight The nominations and corporate governance committee oversees risk by implementing an effective program for corporate governance, including board composition and succession planning.
Independence
The members of the nominations and corporate governance committee are independent, with the exception of M.R. Crocker, who is not considered to be independent under the rules of the U.S. Securities and Exchange Commission, Canadian securities rules and the rules of the NYSE American LLC due to his employment with Exxon Mobil Corporation. However, the Canadian Coalition for Good Governance’s policy, “Governance Differences of Equity Controlled Corporations”, views Mr. Crocker as a related director and independent of management and who may participate as a member of the company’s nominations and corporate governance committee. Mr. Crocker’s participation helps to ensure an objective nominations process and assists the deliberations of this committee by bringing the views and perspectives of the majority shareholder.
Community collaboration and engagement committee The role of the community collaboration and engagement committee is to oversee all of the company’s community investment activities, including charitable donations. The formal mandate of the committee can be found within the Community Collaboration and Engagement Committee Charter in Appendix A of this circular.
Committee
members
M.C. Hubbs (chair)
K.T. Hoeg (vice-chair)
D.W. Cornhill B.W. Corson
M.R. Crocker J.M. Mintz D.S. Sutherland
Number of
meetings One meeting of the community collaboration and engagement committee was held in 2021.
Committee
highlights in
2021
Imperial invested more than $11M in Canadian communities in 2020 as reported using the London Benchmark Group model – a global standard for measuring and reporting community investment.
In 2021, Imperial paid more than $18.5M through community benefit agreements to Indigenous communities (2020:$17.5M).
Recognized by the Canadian Council for Aboriginal Business with Silver level Progressive Aboriginal Relations (PAR) certification.
Showed up for our communities in 2021 as COVID-19 continued.
Increased engagement with employee giving and volunteer matching ImpACT program – $600,000 given to 900 charities and non-profits across Canada.
Provided $2.5M in free fuel vouchers to 100,000 front-line healthcare workers in Healthcare Heroes 2.0 campaign.
Donated $200,000 to Canadian Mental Health Association branches across operating areas in Fuel What Matters 2.0 campaign.
Donated $150,000 towards vaccine education in Athabasca, Cold Lake and Southern Ontario.
Raised $2.9M in United Way campaign from employee/annuitant and corporate donations.
Independence The majority of the members of the community collaboration and engagement committee are independent (five out of seven) with the exception of B.W. Corson and M.R. Crocker.
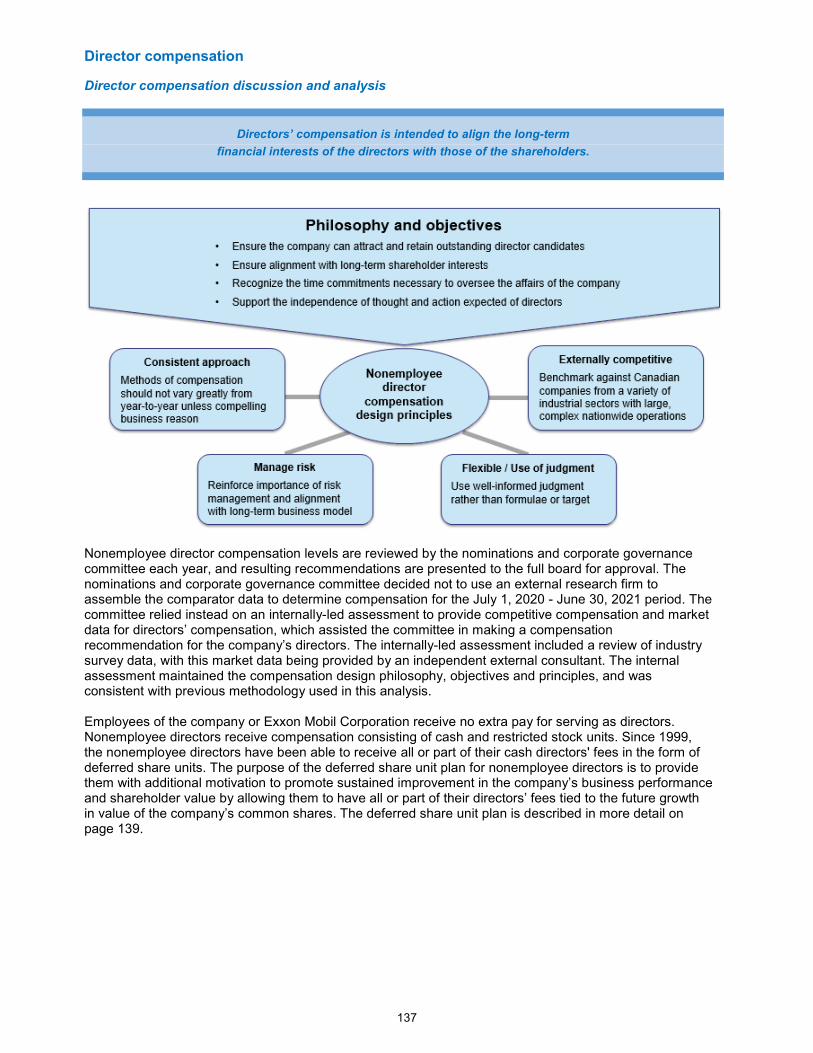
137
Director compensation
Director compensation discussion and analysis
Nonemployee director compensation levels are reviewed by the nominations and corporate governance committee each year, and resulting recommendations are presented to the full board for approval. The nominations and corporate governance committee decided not to use an external research firm to assemble the comparator data to determine compensation for the July 1, 2020 - June 30, 2021 period. The committee relied instead on an internally-led assessment to provide competitive compensation and market data for directors’ compensation, which assisted the committee in making a compensation recommendation for the company’s directors. The internally-led assessment included a review of industry survey data, with this market data being provided by an independent external consultant. The internal assessment maintained the compensation design philosophy, objectives and principles, and was consistent with previous methodology used in this analysis. Employees of the company or Exxon Mobil Corporation receive no extra pay for serving as directors. Nonemployee directors receive compensation consisting of cash and restricted stock units. Since 1999, the nonemployee directors have been able to receive all or part of their cash directors' fees in the form of deferred share units. The purpose of the deferred share unit plan for nonemployee directors is to provide them with additional motivation to promote sustained improvement in the company’s business performance and shareholder value by allowing them to have all or part of their directors’ fees tied to the future growth in value of the company’s common shares. The deferred share unit plan is described in more detail on page 139.
Directors’ compensation is intended to align the long-term
financial interests of the directors with those of the shareholders.

138
Compensation decision making process and considerations The nominations and corporate governance committee relies on market comparisons with a group of major Canadian companies with national and international scope and complexity. The company draws its nonemployee directors from a wide variety of industrial sectors and, as such, a broad sample is appropriate for this purpose. The nominations and corporate governance committee does not target any specific percentile among comparator companies at which to align compensation for this group. The comparator companies included in the benchmark sample are as follows:
Energy Non-energy
Canadian Natural Resources Limited Air Canada
Cenovus Energy Inc. Bank of Nova Scotia
Enbridge Inc. BCE Inc.
Ovintiv Inc. Canadian National Railway Company
Parkland Fuel Corporation Nutrien Ltd.
Suncor Energy Inc. Royal Bank of Canada
TC Energy Corporation Sun Life Financial Inc.
Teck Resources Limited
TELUS Corporation
Thomson Reuters Corporation
The Toronto-Dominion Bank
Hedging policy Company policy prohibits all employees, including executives, and directors, from being a party to derivative or similar financial instruments, including puts, calls, or other options, future or forward contracts, or equity swaps or collars, with respect to the company or Exxon Mobil Corporation stock. For a discussion on the process by which the compensation of the company’s executive officers is determined, see the Compensation discussion and analysis section starting on page 156.
Compensation details Board retainer The compensation of the nonemployee directors is assessed annually. Effective 2018, the nonemployee directors received an annual retainer for board membership of $110,000 per year, the retainer for each standing committee chaired was eliminated, and the grant of restricted stock units was increased from 2,600 to 3,000. There were no changes to nonemployee director compensation from 2018 to 2021. In 2021, the nominations and corporate governance committee reviewed and recommended a change to the compensation paid to the nonemployee directors. Effective July 1, 2021, the grant of restricted stock units was increased from 3,000 to 3,300, with the annual retainer for board membership remaining at $110,000 per year. The board subsequently approved this recommendation.
139
The following table summarizes the compensation terms for the nonemployee directors in 2021:
Director compensation
Annual retainer terms: (a) From July 1, 2020 to June 30, 2021
Effective July 1, 2021
Cash retainer:
Board membership $110,000 annually $110,000 annually
Committee chair None None
Equity based compensation:
Restricted stock units 3,000 units (which vest on the 5th and 10th anniversary of date of grant)
3,300 units (which vest on the 5th and 10th anniversary of date of grant)
(a) The nonemployee directors may elect to take all or a portion of the cash retainer in the form of deferred share units.
Nonemployee directors who are appointed to the board during any given year receive the full restricted stock unit grant and a prorated cash retainer based on the date of appointment.
In addition to compensation for board membership, the board determines the compensation for special committee membership when the committee is established. For the special committee established on September 30, 2021, the board approved a 2021 cash retainer of $15,000 for the chair and $10,000 for members. Equity based compensation Deferred share units In 1999, an additional form of long-term incentive compensation (“deferred share units”) was made available to nonemployee directors. Nonemployee directors may elect to receive all or a portion of their cash compensation in the form of deferred share units. The following table shows the portion of the retainer each nonemployee director elected to receive in cash and deferred share units in 2021.
Director Election for 2021 director’s fees
in cash (%)
Election for 2021 director’s fees in deferred share units
(%)
D.W. Cornhill 22 78
K.T. Hoeg 0 100
M.C. Hubbs 0 100
J.M. Mintz 0 100
D.S. Sutherland 0 100
The number of deferred share units granted to a nonemployee director is determined at the end of each calendar quarter for that year, according to the following calculation:
(i) the dollar amount of the nonemployee director's fees for that calendar quarter that the director elected to receive as deferred share units;
divided by (ii) the average of the closing price of the company's shares on the Toronto Stock
Exchange for the five consecutive trading days ("average closing price") immediately prior to the last day of that calendar quarter.
140
Those deferred share units are granted effective the last day of that calendar quarter. A nonemployee director is also granted additional deferred share units to represent dividends on unexercised deferred share units. These additional units are granted on the dividend payment dates for the company’s common shares, according to the following calculation:
(i) the cash dividend payable for a common share of the company divided by the average closing price immediately prior to the payment date for that dividend;
multiplied by (ii) the number of unexercised deferred share units held by the nonemployee directors on
the dividend record date.
A nonemployee director may only exercise deferred share units by the end of the calendar year following the year of termination of service as a director of the company, including termination of service due to death. No deferred share units may be exercised unless all of the deferred share units are exercised on the same date. On the exercise date, the cash value to be received for the units is determined based on the company’s average closing price immediately prior to the date of exercise.
Restricted stock units In addition to the cash fees described above, the company pays a significant portion of director compensation in restricted stock units to align director compensation with the long-term interests of shareholders. The restricted stock unit plan is described in more detail beginning on page 163. In 2016, the number of restricted stock units granted annually was increased from 2,000 units to 2,600 units, and in 2018 was increased to 3,000 units. In 2021, the number of restricted stock units granted annually was increased to 3,300 units. Up until 2015, the vesting period for restricted stock units was 50 percent vesting on the third anniversary of the grant date (received in cash) and the remaining 50 percent vesting on the seventh anniversary of the grant date (with an option to receive in cash or common shares). In 2016, in order to better align the long-term financial interests of the directors with those of the shareholders, the vesting period was increased such that 50 percent vests on the fifth anniversary of the grant date and the remaining 50 percent vests on the tenth anniversary of the grant date. For all the units to be vested, directors may elect to receive one common share for each unit or a cash payment for the units. The vesting periods are not accelerated upon separation or retirement from the board, except in the event of death.
In contrast to the forfeiture provisions for restricted stock units held by employees of the company, the restricted stock units awarded to nonemployee directors are not subject to risk of forfeiture at the time a director leaves the company’s board. This provision is designed to reinforce the independence of these board members. However, while on the board and for a 24-month period after leaving the company’s board, restricted stock units may be forfeited if the nonemployee director engages in direct competition with the company or otherwise engages in any activity detrimental to the company. The board agreed that the word “detrimental” shall not include any actions taken by a nonemployee director or former nonemployee director who acted in good faith and in the best interest of the company. Prior to vesting of the restricted stock units, the nonemployee directors receive amounts equivalent to the cash dividends paid to holders of common shares. The amount is determined for each cash dividend payment date by the following calculation:
(i) the cash dividend payable for a common share divided by the average closing price immediately prior to the payment date for that dividend;
multiplied by (ii) the number of unvested restricted stock units held by the nonemployee directors on
the dividend record date. Other reimbursement Nonemployee directors are also reimbursed for travel and other expenses incurred for attendance at board and committee meetings.

141
Components of director compensation The following table sets out the details of compensation paid to the nonemployee directors in 2021.
Director (a)
Annual retainer for
board membership and special committee
($) (b)
Restricted
stock units (RSU)
(#)
Total fees
paid in cash ($) (c)
Total value of deferred share units
(DSU) ($) (d)
Total value
of restricted stock units
(RSU) ($) (e)
All other compen-
sation ($) (f)
Total
compensation ($)
D.W. Cornhill
125,000 3,300 27,500 97,500 145,464 20,209 290,673
K.T. Hoeg
120,000 3,300 0 120,000 145,464 65,389 330,853
M.C. Hubbs
120,000 3,300 0 120,000 145,464 20,829 286,293
J.M. Mintz
120,000 3,300 0 120,000 145,464 60,695 326,159
D.S. Sutherland
120,000 3,300 0 120,000 145,464 57,760 323,224
(a) As directors employed by the company or Exxon Mobil Corporation in 2021, B.W. Corson, D.C. Brownell and M.R. Crocker did not
receive compensation for acting as directors. (b) D.W. Cornhill is chair of the special committee. (c) “Total fees paid in cash” is the portion of the “Annual retainer for board membership and special committee” that the director elected
to receive as cash. This amount is reported as “Fees earned” in the Director compensation table on page 142. (d) “Total value of deferred share units” is the portion of the “Annual retainer for board membership and special committee” that the
director elected to receive as deferred share units, as set out in the previous table on page 139. This amount plus the “Total value of restricted stock units” amount is shown as “Share-based awards” in the Director compensation table on page 142.
(e) The values of the restricted stock units shown are the number of units multiplied by the closing price of the company's shares on the date of grant, December 6, 2021 ($44.08).
(f) Amounts under “All other compensation” consist of dividend equivalent payments on unvested restricted stock units and the value of additional deferred share units granted in lieu of dividends on unvested deferred share units. In 2021, D.W. Cornhill received $10,708 in dividend equivalent payments on restricted stock units and additional deferred share units valued at $9,501 in lieu of dividends on deferred share units. K.T. Hoeg received $15,436 in dividend equivalent payments on restricted stock units and additional deferred share units valued at $49,953 in lieu of dividends on deferred share units. M.C. Hubbs received $8,160 in dividend equivalent payments on restricted stock units and additional deferred share units valued at $12,669 in lieu of dividends on deferred share units. J.M. Mintz received $15,436 in dividend equivalent payments on restricted stock units and additional deferred share units valued at $45,259 in lieu of dividends on deferred share units. D.S. Sutherland received $15,436 in dividend equivalent payments on restricted stock units and additional deferred share units valued at $42,324 in lieu of dividends on deferred share units.

142
Director compensation table The following table summarizes the compensation paid, payable, awarded or granted for 2021 to each of the nonemployee directors of the company.
Name (a)
Fees earned ($)(b)
Share-based awards ($) (c)
Option-based awards
($)
Non-equity incentive plan compensation
($)
Pension value
($)
All other compensation
($) (d)
Total ($)
D.W. Cornhill 27,500 242,964 - - - 20,209 290,673
K.T. Hoeg 0 265,464 - - - 65,389 330,853
M.C. Hubbs 0 265,464 - - - 20,829 286,293
J.M. Mintz 0 265,464 - - - 60,695 326,159
D.S. Sutherland 0 265,464 - - - 57,760 323,224
(a) As directors employed by the company or Exxon Mobil Corporation in 2021, B.W. Corson, D.C. Brownell and M.R. Crocker did
not receive compensation for acting as directors. (b) Represents all fees awarded, earned, paid or payable in cash for services as a director. The nonemployee directors are able to
receive all or part of their directors' fees in the form of deferred share units. (c) Represents the value of the restricted stock units (calculated by multiplying the number of units by the closing price of the
company's shares on the date of grant), plus the value of deferred share units (calculated by the portion of the “Annual retainer for board membership and special committee” that the director elected to receive as deferred share units as noted on page 139).
(d) Amounts under “All other compensation” consist of dividend equivalent payments on unvested restricted stock units and the value of additional deferred share units granted in lieu of dividends on unvested deferred share units. In 2021, D.W. Cornhill received $10,708 in dividend equivalent payments on restricted stock units and additional deferred share units valued at $9,501 in lieu of dividends on deferred share units. K.T. Hoeg received $15,436 in dividend equivalent payments on restricted stock units and additional deferred share units valued at $49,953 in lieu of dividends on deferred share units. M.C. Hubbs received $8,160 in dividend equivalent payments on restricted stock units and additional deferred share units valued at $12,669 in lieu of dividends on deferred share units. J.M. Mintz received $15,436 in dividend equivalent payments on restricted stock units and additional deferred share units valued at $45,259 in lieu of dividends on deferred share units. D.S. Sutherland received $15,436 in dividend equivalent payments on restricted stock units and additional deferred share units valued at $42,324 in lieu of dividends on deferred share units.
Five-year look back at total compensation paid to nonemployee directors
Year Amount
($)
2017 1,351,454
2018 1,500,739
2019 1,251,395
2020 1,073,527
2021 1,557,202

143
Outstanding share-based awards and option-based awards for directors The following table sets forth all outstanding awards held by nonemployee directors of the company as at December 31, 2021 and does not include common shares owned by the director.
Option-based awards Share-based awards
Name (a)
Number of securities underlying
unexercised options
(#)
Option exercise
price ($)
Option expiration
date
Value of unexercised
in-the-money options
($)
Number of shares or units of shares that
have not vested (#) (b)
Market or payout value
of share-based awards that
have not vested ($) (c)
D.W. Cornhill - - - - 25,853 1,179,429
K.T. Hoeg - - - - 68,361 3,118,644
M.C. Hubbs - - - - 26,683 1,217,292
J.M. Mintz - - - - 63,730 2,907,383
D.S. Sutherland - - - - 60,836 2,775,346
(a) As directors employed by the company or Exxon Mobil Corporation in 2021, B.W. Corson, D.C. Brownell and M.R. Crocker did
not receive compensation for acting as directors. (b) Represents restricted stock units and deferred share units held as of December 31, 2021. (c) Value is based on the closing price of the company’s shares on December 31, 2021 ($45.62).
Incentive plan awards for directors – Value vested or earned during the year The following table sets forth the value of the awards that vested or were earned by each nonemployee director of the company in 2021.
Name
(a)
Option-based awards –
Value vested during the year
($)
Share-based awards – Value
vested during the year ($) (b)
Non-equity incentive plan
compensation – Value earned during the year
($)
D.W. Cornhill - - -
K.T. Hoeg - 98,545 -
M.C. Hubbs - - -
J.M. Mintz - 98,545 -
D.S. Sutherland - 98,545 -
(a) As directors employed by the company or Exxon Mobil Corporation in 2021, B.W. Corson, D.C. Brownell and M.R. Crocker did
not receive compensation for acting as directors. (b) Represents restricted stock units granted in 2014 and 2016, which vested in 2021. Value is based on the average of the
weighted average price (as determined by the Toronto Stock Exchange) of common shares of the company on the vesting date and the four consecutive trading days immediately prior to the vesting date.
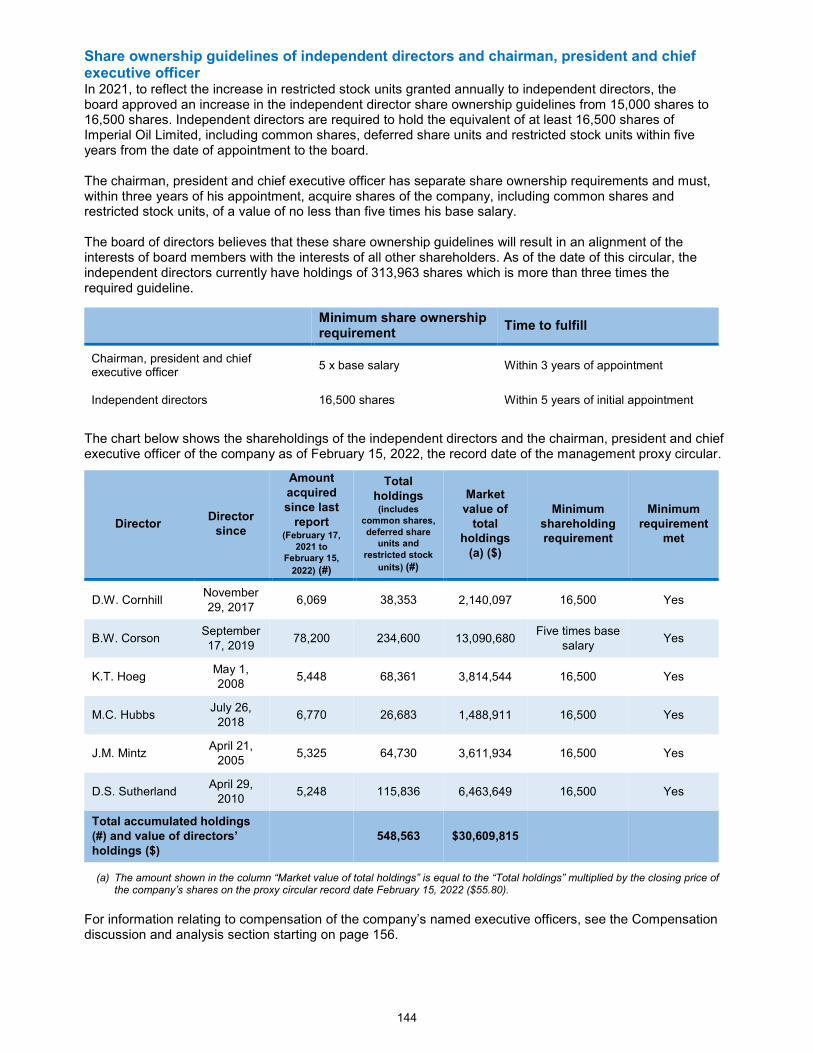
144
Share ownership guidelines of independent directors and chairman, president and chief executive officer In 2021, to reflect the increase in restricted stock units granted annually to independent directors, the board approved an increase in the independent director share ownership guidelines from 15,000 shares to 16,500 shares. Independent directors are required to hold the equivalent of at least 16,500 shares of Imperial Oil Limited, including common shares, deferred share units and restricted stock units within five years from the date of appointment to the board. The chairman, president and chief executive officer has separate share ownership requirements and must, within three years of his appointment, acquire shares of the company, including common shares and restricted stock units, of a value of no less than five times his base salary. The board of directors believes that these share ownership guidelines will result in an alignment of the interests of board members with the interests of all other shareholders. As of the date of this circular, the independent directors currently have holdings of 313,963 shares which is more than three times the required guideline.
Minimum share ownership requirement
Time to fulfill
Chairman, president and chief executive officer
5 x base salary Within 3 years of appointment
Independent directors 16,500 shares Within 5 years of initial appointment
The chart below shows the shareholdings of the independent directors and the chairman, president and chief executive officer of the company as of February 15, 2022, the record date of the management proxy circular.
Director Director
since
Amount acquired since last
report (February 17,
2021 to February 15,
2022) (#)
Total holdings (includes
common shares,
deferred share units and
restricted stock
units) (#)
Market value of
total holdings
(a) ($)
Minimum shareholding requirement
Minimum requirement
met
D.W. Cornhill November 29, 2017
6,069 38,353 2,140,097 16,500 Yes
B.W. Corson September 17, 2019
78,200 234,600 13,090,680 Five times base
salary Yes
K.T. Hoeg May 1, 2008
5,448 68,361 3,814,544 16,500 Yes
M.C. Hubbs July 26,
2018 6,770 26,683 1,488,911 16,500 Yes
J.M. Mintz April 21,
2005 5,325 64,730 3,611,934 16,500 Yes
D.S. Sutherland April 29,
2010 5,248 115,836 6,463,649 16,500 Yes
Total accumulated holdings (#) and value of directors’ holdings ($)
548,563 $30,609,815
(a) The amount shown in the column “Market value of total holdings” is equal to the “Total holdings” multiplied by the closing price of the company’s shares on the proxy circular record date February 15, 2022 ($55.80).
For information relating to compensation of the company’s named executive officers, see the Compensation discussion and analysis section starting on page 156.

145
Ethical business conduct
The company’s directors, officers and employees are responsible for developing, approving and implementing plans and actions designed to achieve corporate objectives. In doing so, they are expected to observe the highest standards of integrity in the conduct of the company’s business, with the methods employed to attain results being as important as the results themselves.
The board has adopted a written code of ethics and business conduct (the "Code") which can be found on the company’s website at www.imperialoil.ca/en-CA/Investors/Investor-relations, including any applicable amendments. The Code applies to each of the company’s directors, officers and employees, and consists of the ethics policy, the conflicts of interest policy, the corporate assets policy, the directorships policy and the procedures and open door communication. No person in the company has the authority to make exceptions or grant waivers with respect to its foundational policies. There have been no material change reports filed in the past 12 months pertaining to conduct of a director or executive officer that constitute a departure from the Code. In addition, the directors of the company must comply with the conflict of interest provisions of the Canada Business Corporations Act, as well as the relevant securities regulatory instruments, in order to ensure that the directors exercise independent judgment in considering transactions and agreements in respect of which such director has a material interest.
Under the company's procedures and open door communication, employees are encouraged and expected to refer suspected violations of the law, company policy or internal controls and procedures by various means, including to their supervisors or the company’s ethics advisor, controller or general auditor. Imperial also has an ethics “hotline” that is operated by a third-party service provider and offers confidential, anonymous reporting 24 hours a day, seven days a week. Suspected violations involving a director or executive officer, as well as any concern regarding questionable accounting or auditing matters are to be referred directly to the internal auditor. The audit committee initially reviews all issues involving directors or executive officers, and then refers all issues to the board of directors. In the alternative, employees may also address concerns to individual nonemployee directors or to nonemployee directors as a group. No action may be taken or threatened against employees for asking questions, voicing concerns, or making complaints or suggestions in good faith.
Management provides the board of directors with a review of corporate ethics and conflicts of interest on an annual basis. The company’s internal auditors audit each business line’s compliance with the program and report to the audit committee. Directors, officers and employees review the company’s standards of business conduct (which includes the Code) on an annual basis, with independent directors and all employees being required to sign a declaration card confirming that they have read and are familiar with the standards of business conduct. In addition, every four years a business practices review is conducted in which managers review the standards of business conduct with all employees in their respective work units.
The board, through its audit committee, examines the effectiveness of the company's internal control processes and management information systems. The board consults with the external auditor, the internal auditor and the management of the company to ensure the integrity of the systems.
There are a number of structures and processes in place to facilitate the functioning of the board independently of management. The board has a majority of independent directors. Each committee is chaired by a different independent director and all of the independent directors are members of each committee. The audit committee is composed entirely of independent directors. Each other committee (except the community collaboration and engagement committee) is composed entirely of the independent directors and M.R. Crocker, who is an employee of Exxon Mobil Corporation and although deemed non-independent under the relevant standards by virtue of his employment, is viewed as independent of the company’s management. The agendas of each of the board and its committees are not set by management alone, but by the board as a whole and by each committee. A significant number of agenda items are mandatory and recurring. Board meetings are scheduled at least one full year in advance. Any director may call a meeting of the board or a meeting of a committee of which the director
The company is committed to high ethical standards through its policies and practices.

146
is a member. There is a board-prescribed flow of financial, operating and other corporate information to all directors. The board may also utilize ad hoc or special committees when considering various matters.
The independent directors conduct executive sessions in the absence of members of management. These meetings are chaired by K.T. Hoeg, the independent director designated by the independent directors to chair and lead these discussions. Ten executive sessions were held in 2021. The company's delegation of authority guide provides that certain matters of the company are reviewed by functional contacts within ExxonMobil. The company’s employees are regularly reminded that they are expected to act in the best interests of the company, and are reminded of their obligation to identify any instances where the company's general interest may not be consistent with ExxonMobil's priorities. If such situations ever occurred, employees are expected to escalate such issues with successive levels of the company's management. Final resolution of any such issues is made by the company's chairman, president and chief executive officer.
Restrictions on insider trading
Structures and processes are in place to caution, track and monitor reporting insiders, nonemployee directors and key employees with access to sensitive information with respect to personal trading in the company’s shares. The company has guidelines regarding insider trading prohibitions and trading bans that are applicable to all directors, officers and employees. Nonemployee directors are required to pre-clear any trades in the company’s shares. Reporting insiders are required to give advance notice to the company of any sale of the company’s shares and advise the company within five days of any purchase of the company’s shares. Reporting insiders are required, under securities regulations, to publically disclose all transactions in the company’s shares on the System for Electronic Disclosure by Insiders (SEDI).
From time to time, the company advises its directors and officers, and those of Exxon Mobil Corporation, and employees in certain positions not to trade in the company’s shares. Trading bans occur in connection with the directors’ pending consideration of the financial statements of the company, including the unaudited financial statements for each quarter, and in connection with undisclosed pending events that constitute material information about the business affairs of the company.
Diversity
Board diversity The company has a longstanding commitment to diversity amongst its directors, and has had at least one woman on its board continuously since 1977. The company does not have a formal written policy relating to the identification and nomination of directors who are women, Aboriginal peoples, persons with disabilities or members of visible minorities (the “designated groups”, as defined under the Canada Business Corporations Regulations, 2001), and has not adopted a target regarding members of the designated groups on its board. With the objective of fostering a diversity of expertise, viewpoint and competencies, the board charter provides that the nominations and corporate governance committee may consider a number of factors, including membership in a designated group, in assessing potential nominees. The nominations and corporate governance committee assesses the work experience, other expertise, individual competencies and diversity of age, regional association and the designated groups that each existing director possesses and whether each nominee is able to fill any gaps amongst the existing directors. Additionally, the committee may consider any other factors that it believes to be relevant. The company does not believe that any one of these dimensions should be
Commitment to stringent safeguards with trading restrictions and reporting for company insiders.
The company has a long history of valuing diversity on the board and in its executive management.

147
considered in isolation and without due regard to all of the other factors, in determining the ability of potential directors to contribute to the work of the board of directors. As of the date of this proxy circular, the number and percentage of directors and nominees who are members of the designated groups are:
Designated group (a) Number Percent
(%)
Women 2 of 7 (board and nominees) 2 of 5 (independent directors)
29 40
Aboriginal peoples 0 of 7 0
Persons with disabilities 0 of 7 0
Members of visible minorities 0 of 7 0
(a) Defined under the Employment Equity Act (Canada)
The above diversity disclosure relies on voluntary self-identification by directors and nominees, and therefore only represents the information of individuals who have chosen to self-identify. The information has not been independently verified by the company. The board nominee composition charts on page 118 show the diversity of our board nominees with respect to gender, experience and regional association, but do not reflect membership in other designated groups. Executive officer diversity The company believes inclusion and diversity are key competitive strengths that are critical to maintaining the company’s position as an industry leader. To ensure commitment at all levels of the company, inclusion and diversity, anti-harassment and equal employment opportunity performance is stewarded annually to the company’s senior management. There is an in-depth succession planning process, which includes the consideration of various aspects of diversity as well as plans to address gaps, if any, for key positions. The company’s internal training programs emphasize the value of collaboration, appreciating differences and sustaining an inclusive work environment, keeping inclusion and diversity top-of-mind with all employees. Imperial also values external perspective and expertise, and collaborates with leading diversity organizations to help shape our future inclusion and diversity plans. The company supports educational development and recruiting practices that facilitate the employment of Indigenous peoples, and in 2021 achieved Silver Certification in the Progressive Aboriginal Relations (PAR) program managed by the Canadian Council for Aboriginal Business. Imperial maintains a supportive work environment though a range of development and networking programs, including employee-led diversity networks that are focused on common interests. These programs continued in a virtual format in 2021 as a result of the COVID-19 pandemic. In considering potential nominees for executive officer appointments, the executive resources committee considers diversity of gender and the other designated groups, work experience, other expertise, individual competencies and other dimensions of diversity in addition to the other factors described on page 160. The company has not adopted a target regarding members of the designated groups in executive officer positions. The company does not believe that any one of these dimensions should be considered, without due regard to all of these other factors, in determining the ability of potential nominees to fill executive officers positions.
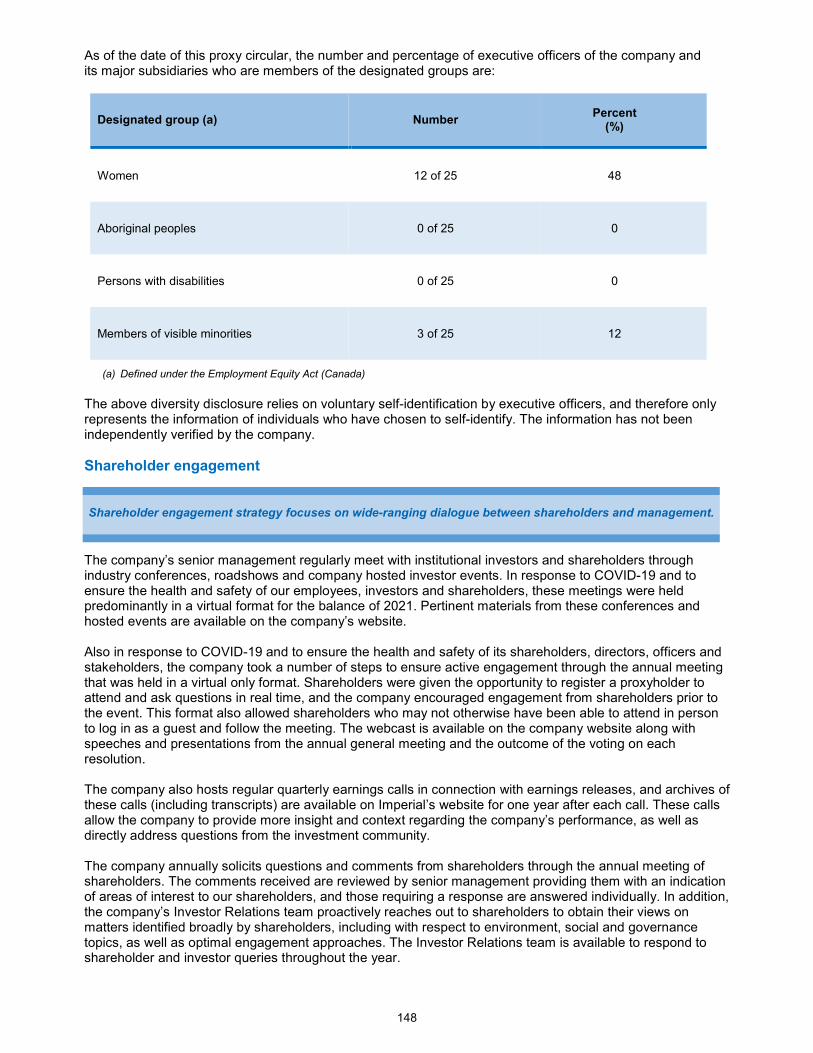
148
As of the date of this proxy circular, the number and percentage of executive officers of the company and its major subsidiaries who are members of the designated groups are:
Designated group (a) Number Percent
(%)
Women 12 of 25 48
Aboriginal peoples 0 of 25 0
Persons with disabilities 0 of 25 0
Members of visible minorities 3 of 25 12
(a) Defined under the Employment Equity Act (Canada)
The above diversity disclosure relies on voluntary self-identification by executive officers, and therefore only represents the information of individuals who have chosen to self-identify. The information has not been independently verified by the company.
Shareholder engagement
The company’s senior management regularly meet with institutional investors and shareholders through industry conferences, roadshows and company hosted investor events. In response to COVID-19 and to ensure the health and safety of our employees, investors and shareholders, these meetings were held predominantly in a virtual format for the balance of 2021. Pertinent materials from these conferences and hosted events are available on the company’s website. Also in response to COVID-19 and to ensure the health and safety of its shareholders, directors, officers and stakeholders, the company took a number of steps to ensure active engagement through the annual meeting that was held in a virtual only format. Shareholders were given the opportunity to register a proxyholder to attend and ask questions in real time, and the company encouraged engagement from shareholders prior to the event. This format also allowed shareholders who may not otherwise have been able to attend in person to log in as a guest and follow the meeting. The webcast is available on the company website along with speeches and presentations from the annual general meeting and the outcome of the voting on each resolution. The company also hosts regular quarterly earnings calls in connection with earnings releases, and archives of these calls (including transcripts) are available on Imperial’s website for one year after each call. These calls allow the company to provide more insight and context regarding the company’s performance, as well as directly address questions from the investment community. The company annually solicits questions and comments from shareholders through the annual meeting of shareholders. The comments received are reviewed by senior management providing them with an indication of areas of interest to our shareholders, and those requiring a response are answered individually. In addition, the company’s Investor Relations team proactively reaches out to shareholders to obtain their views on matters identified broadly by shareholders, including with respect to environment, social and governance topics, as well as optimal engagement approaches. The Investor Relations team is available to respond to shareholder and investor queries throughout the year.
Shareholder engagement strategy focuses on wide-ranging dialogue between shareholders and management.
149
Largest shareholder
To the knowledge of the directors and executive officers of the company, the only shareholder who, as of February 15, 2022, owned beneficially, or exercised control or direction over, directly or indirectly, more than five percent of the outstanding common shares of the company is Exxon Mobil Corporation, 5959 Las Colinas Boulevard, Irving, Texas 75039-2298, which owns beneficially 465,723,543 common shares, representing approximately 69.6 percent of the outstanding voting shares of the company. As a consequence, the company is a “controlled company” for purposes of the listing standards of the NYSE American LLC and a “majority controlled company” for purposes of the TSX Company Manual.
Transactions with Exxon Mobil Corporation The company has written procedures and controls that require any transactions between the company and ExxonMobil and its subsidiaries to be reviewed by controllers, tax, treasurers and legal to ensure that each agreement meets the company’s policies and procedures, is fair, and complies with legal and tax requirements. These agreements may also be subject to review by the chairman, president, and chief executive officer. Annual training is provided for key individuals to ensure awareness of the requirements for identifying related party transactions, and procedures are in place to ensure reporting of these transactions is complete and accurate. Related party transactions with ExxonMobil and its subsidiaries are analyzed and reviewed by management on a quarterly basis to understand any significant variances from period to period, and reviewed with the board of directors on an annual basis.
On June 29, 2020, the company implemented a limited 12-month “normal course” share purchase program, primarily to eliminate dilution from shares issued in conjunction with its restricted stock unit plan. On April 30, 2021, in response to improving market conditions, the company announced an amendment to the program to increase the number of common shares it could purchase. This amendment increased the program from 50,000 shares to a maximum of 29,363,070 shares, or up to four percent of the outstanding shares as of June 15, 2020. Between June 29, 2020 and June 28, 2021, the company purchased 8,931,249 common shares on the open market and a corresponding 20,431,821 common shares from ExxonMobil concurrent with, but outside of the program to maintain its shareholding at approximately 69.6 percent. On June 29, 2021, a further 12-month normal course share purchase program was implemented, allowing the company to purchase up to five percent of its outstanding common shares as of June 15, 2021, or a maximum of 35,583,671 shares. In accordance with the company’s announcement on November 12, 2021 that it intended to accelerate purchases under the program, the program subsequently ended on January 31, 2022 upon the company purchasing the maximum allowable number of shares. As of February 15, 2022, the company purchased 10,822,142 common shares on the open market and 24,761,529 from ExxonMobil concurrent with, but outside of this program to maintain its shareholding at approximately 69.6 percent. The amounts of purchases and revenues by the company and its subsidiaries for other transactions in 2021 with ExxonMobil and its affiliates were $2,669 million and $8,777 million, respectively. These transactions were conducted on terms as favourable as they would have been with unrelated parties, and primarily consisted of the purchase and sale of crude oil, natural gas, petroleum and chemical products, as well as technical, engineering and research and development costs. Transactions with ExxonMobil also included amounts paid and received in connection with the company’s participation in a number of upstream activities conducted jointly in Canada. In addition, the company has existing agreements with affiliates of ExxonMobil to provide information technology and customer support services to the company and to share common business and operational support services to allow the companies to consolidate duplicate work and systems. The company has a contractual agreement with an affiliate of ExxonMobil in Canada to operate certain western Canada production properties owned by ExxonMobil. There are no asset ownership changes. The company and that affiliate also have a contractual agreement to provide for equal participation in new upstream opportunities. The company had an existing agreement with ExxonMobil to provide for the delivery of management, business and technical services to Syncrude Canada Ltd. by ExxonMobil, which was terminated in connection with the transfer of operatorship of Syncrude on September 30, 2021.
Exxon Mobil Corporation is the majority shareholder of the company, holding 69.6% of the company’s shares.

150
As at December 31, 2021, the company had an outstanding loan of $4,447 million under an existing agreement with an affiliated company of ExxonMobil that provides for a long term, variable rate loan from ExxonMobil to the company of up to $7.75 billion (Canadian) at market interest rates. The agreement is effective until June 30, 2025, cancellable if ExxonMobil provides at least 370 days advance written notice. Additionally, in 2021 the company repaid the outstanding balance of the short term loan of $111 million borrowed under an arrangement with ExxonMobil, and terminated the associated loan agreement. This short term loan provided for a non-interest bearing, revolving demand loan of up to $150 million, and represented ExxonMobil’s share of a working capital facility required to support purchasing, marketing, transportation and derivative arrangements for crude oil and diluent products undertaken by the company on behalf of ExxonMobil.

151
Company executives and executive compensation
Named executive officers of the company The named executive officers of the company at year end 2021 are listed below, all of whom remain in their positions as of February 15, 2022.
Bradley W. Corson, 60 Calgary, Alberta, Canada
Daniel E. Lyons, 59 Calgary, Alberta, Canada
Simon P. Younger, 46 Calgary, Alberta, Canada
Bruce A. Jolly, 54 Calgary, Alberta, Canada
Jonathan R. Wetmore, 49 Calgary, Alberta, Canada
Position held at the end of 2021 (date office held): Assistant controller (2019 – Present)
Other positions in the past five years (position, date office held and status of employer): Upstream controller (2018 – 2019) Controller, United States upstream production, Exxon Mobil Corporation (2016 – 2018) (Affiliate)
Position held at the end of 2021 (date office held): Senior vice-president, upstream (2020 – Present)
Other positions in the past five years (position, date office held and status of employer): Vice-president, production, upstream (2019 – 2020)
Senior planning advisor, corporate strategic planning, upstream, Exxon Mobil Corporation (2017 – 2019) (Affiliate)
Vice-president, production and joint interest manager, ExxonMobil Qatar Limited (2015 – 2017) (Affiliate)
Position held at the end of 2021 (date office held): Chairman, president and chief executive officer (2020 – Present)
Other positions in the past five years (position, date office held and status of employer): President (2019 – Present)
President, ExxonMobil Upstream Ventures (2015 – 2019) (Affiliate)
Position held (date office held): Vice-president, downstream and Western Canada fuels manager (2018 – Present)
Other positions in the past five years (position, date office held and status of employer): Manager, supply and manufacturing (June 2017 – December 2017)
Refinery manager, Fawley UK, UK Esso Petroleum Company Ltd (2013 – 2017) (Affiliate)
Position held at the end of 2021 (date office held): Senior vice-president, finance and administration, and controller (2018 – Present)
Other positions in the past five years (position, date office held and status of employer): Vice-president, downstream business services and downstream treasurer, Exxon Mobil Corporation (2015 – 2018) (Affiliate)

152
Other executive officers of the company In addition to the named executive officers listed on the previous page, the following individuals are executive officers of the company as of February 15, 2022.
Sherri L. Evers, 45 Calgary, Alberta, Canada
Kitty Lee, 45 Calgary, Alberta, Canada
Kristi L. Desjardins, 48 Calgary, Alberta, Canada
Constance D. Gemmell, 55 Calgary, Alberta, Canada
Position held (date office held): Vice-president, human resources (2020 – Present)
Other positions in the past five years (position, date office held and status of employer):
Human resources services manager, global human resources operations, Exxon Mobil Corporation (2018 – 2020) (Affiliate) Manager, human resources services (2017 – 2018) Manager, human resources services, operations (2014 – 2017)
Position held (date office held): Director, corporate tax (2018 – Present)
Other positions in the past five years (position, date office held and status of employer):
Manager, income tax planning and advice (2013 – 2018)
Position held (date office held): Vice-president, commercial and corporate development (2021 – Present)
Other positions in the past five years (position, date office held and status of employer): Fuels manager, Central and Eastern Canada, fuels and lubricants (2018 – 2020)
Product exchange and analysis manager, refining and supply, Exxon Mobil Corporation (2016 – 2018) (Affiliate)
Position held (date office held): Treasurer (2020 – Present)
Other positions in the past five years (position, date office held and status of employer): Financial advisor, treasurer’s, Exxon Mobil Corporation (2019 – 2020) (Affiliate) Benefits finance manager, treasurer’s, Exxon Mobil Corporation (2018 – 2019) (Affiliate) Global coordination manager, controller’s, Exxon Mobil Corporation (2016 – 2018) (Affiliate)

153
Kimberly J. Haas, 48 Sarnia, Ontario, Canada
Ian R. Laing, 48 Calgary, Alberta, Canada
Position held (date office held): Vice-president, general counsel and corporate secretary (2020 – Present)
Other positions in the past five years (position, date office held and status of employer): Assistant general counsel, downstream and corporate departments and corporate secretary (2019 – 2020) Assistant general counsel, upstream (2017 – 2018)
Position held (date office held): Vice-president, chemicals and Sarnia chemical plant manager (2020 – Present)
Other positions in the past five years (position, date office held and status of employer): Project executive, chemicals, global operations, Exxon Mobil Chemical Company (2020) (Affiliate) Process manager, Baytown olefins plant, Exxon Mobil Chemical Company, (2016 – 2020) (Affiliate)

154
Letter to shareholders from the executive resources committee on executive compensation Dear fellow shareholders:
The executive resources committee (“committee”) would like to outline for you the role of the committee in ensuring good governance in the management of executive compensation within the company.
Compensation governance The committee is responsible for corporate policy on compensation and for specific decisions on the compensation of the chief executive officer, key senior executives, and officers of the company. In exercising this responsibility, the committee views long-term orientation and the management of risk as integral elements of the compensation policies and practices of the company. These policies and practices are designed to keep management, including named executive officers, focused on the strategic objectives of the company over the long-term and to effectively assess and mitigate risk in the execution of these objectives. The committee exercises oversight of a compensation program that supports the company’s objective to attract, develop, and retain key talent needed to achieve its strategic objectives.
The compensation discussion and analysis (“CD&A”) section that follows describes the compensation program for the company’s named executive officers and how the program supports the business goals of the company. The company’s compensation program is designed to:
align the interests of its executives with long-term shareholder interests; encourage executives to manage risk and take a long-term view when making investments
and managing the assets of the business; reinforce the company’s philosophy that the experience, skill, and motivation of the company's
executives are significant determinants of future business success; and promote career orientation and strong individual performance.
The compensation program design is aligned with the core elements of the majority shareholder’s compensation program, including linkage to near term aspects of incentive pay, long vesting periods, risk of forfeiture, and alignment with the shareholder experience.
We execute our oversight responsibilities in this regard by ensuring the company’s program is built on sound principles of compensation design, including an annual assessment of comparator companies to evaluate market competitiveness, appropriate risk assessment, and risk management practices, sound governance principles, and support of the company’s business model. In exercising our oversight and decision making roles, the committee balances many factors each year in terms of impact on compensation decisions relative to the company’s performance. The committee considers both business results and individual performance in its decisions. The business environment in 2020 presented the company and the broader industry with extreme challenges and these challenges continued to some extent into 2021. The COVID-19 pandemic has continued to have an impact on our organization and employees, presenting unique management and operational challenges for the company. In this difficult environment, Imperial remained focused on delivering long-term shareholder value and positioning the company for the ongoing recovery in demand and prices. Demand for petroleum and petrochemical products has continued to recover, with the company’s financial results benefiting from stronger commodity prices and structurally lower operating and capital expenditures. For more information on the 2021 key business results see page 168.
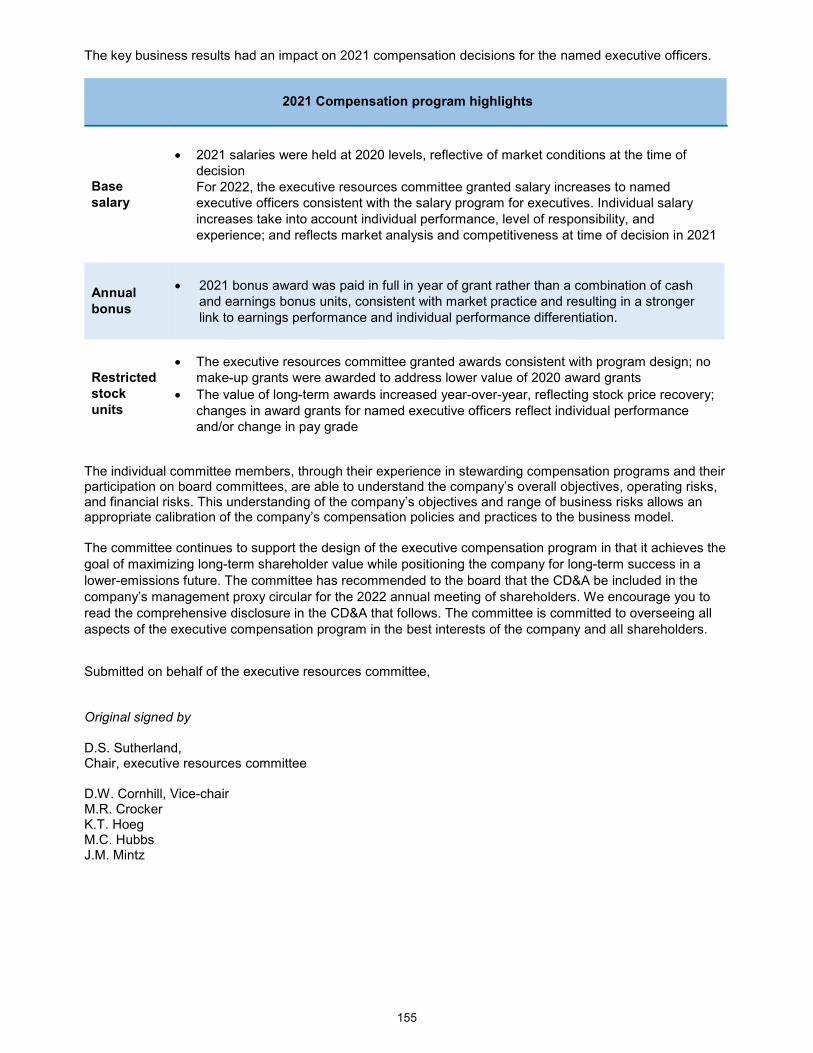
155
The key business results had an impact on 2021 compensation decisions for the named executive officers.
2021 Compensation program highlights
Base salary
2021 salaries were held at 2020 levels, reflective of market conditions at the time of decision For 2022, the executive resources committee granted salary increases to named executive officers consistent with the salary program for executives. Individual salary increases take into account individual performance, level of responsibility, and experience; and reflects market analysis and competitiveness at time of decision in 2021
Annual bonus
2021 bonus award was paid in full in year of grant rather than a combination of cash and earnings bonus units, consistent with market practice and resulting in a stronger link to earnings performance and individual performance differentiation.
Restricted stock units
The executive resources committee granted awards consistent with program design; no make-up grants were awarded to address lower value of 2020 award grants
The value of long-term awards increased year-over-year, reflecting stock price recovery; changes in award grants for named executive officers reflect individual performance and/or change in pay grade
The individual committee members, through their experience in stewarding compensation programs and their participation on board committees, are able to understand the company’s overall objectives, operating risks, and financial risks. This understanding of the company’s objectives and range of business risks allows an appropriate calibration of the company’s compensation policies and practices to the business model. The committee continues to support the design of the executive compensation program in that it achieves the goal of maximizing long-term shareholder value while positioning the company for long-term success in a
lower-emissions future. The committee has recommended to the board that the CD&A be included in the company’s management proxy circular for the 2022 annual meeting of shareholders. We encourage you to read the comprehensive disclosure in the CD&A that follows. The committee is committed to overseeing all aspects of the executive compensation program in the best interests of the company and all shareholders.
Submitted on behalf of the executive resources committee, Original signed by D.S. Sutherland, Chair, executive resources committee D.W. Cornhill, Vice-chair M.R. Crocker K.T. Hoeg M.C. Hubbs J.M. Mintz

156
Compensation discussion and analysis Table of contents
Overview................................................................................................................................... 157
Canadian business environment ............................................................................................................ 157 Business model ...................................................................................................................................... 157 Key business strategies .......................................................................................................................... 157 Key elements of the compensation program .......................................................................................... 158 Management of risk ................................................................................................................................ 158 Other supporting compensation and staffing practices .......................................................................... 159 Hedging policy ........................................................................................................................................ 160 Business performance and basis for compensation ............................................................................... 160 Succession planning ............................................................................................................................... 160
Compensation program .......................................................................................................... 161
Career orientation ................................................................................................................................... 161 Base salary ............................................................................................................................................. 161 Annual bonus .......................................................................................................................................... 162 Restricted stock units .............................................................................................................................. 163 Vesting of restricted stock units ....................................................................................................... 164 Amendments to the restricted stock unit plan ................................................................................. 165 Retirement benefits ................................................................................................................................. 165 Pension plan benefits ....................................................................................................................... 165 Savings plan benefits ........................................................................................................................ 166
Compensation considerations ................................................................................................ 167
Benchmarking ......................................................................................................................................... 167 Comparator companies .......................................................................................................................... 167 2021 named executive officer compensation assessment ..................................................................... 167
Key business results ............................................................................................................................... 168
2021 chief executive officer compensation assessment ........................................................................ 169 Pay awarded to other named executive officers..................................................................................... 170 Independent consultant .......................................................................................................................... 170 Performance graph ................................................................................................................................. 170
Frequently used terms ............................................................................................................................ 171
Executive compensation tables and narratives ..................................................................... 172
Summary compensation table ................................................................................................................ 172 Outstanding share-based awards and option-based awards for named executive officers ................... 174 Incentive plan awards for named executive officers – Value vested during the year............................. 175 Equity compensation plan information .................................................................................................... 176 Restricted stock units as a percentage of outstanding shares ............................................................... 176 Annual burn rate ..................................................................................................................................... 177 Status of prior long-term incentive compensation plans ......................................................................... 177 Pension plan benefits ........................................................................................................................... 177
157
Overview
Our objective is to meet society’s needs with the products that are essential for modern life while playing a key role in addressing the challenges of climate change. The company takes a long-term view in managing its business rather than reacting to short-term business cycles. The company’s strategies provide the framework to deliver on its commitments, create shareholder value throughout the commodity price cycle, and address the dual challenge of meeting growing energy demand while reducing environmental impacts. As such, the compensation program design aligns with the long-term sustainability of the business and supports key business strategies as outlined below:
Canadian business environment
Large, accessible upstream resources;
Mature, competitive downstream markets;
Evolving environmental, fiscal, and energy policies impacting global competitiveness; and
Market access limitations and uncertainties.
Business model
Long-life, competitively advantaged assets;
Disciplined investment and cost management;
Value-chain integration and synergies;
High-impact technologies and innovation; and
Operational excellence and responsible growth.
Key business strategies
Deliver industry-leading performance in safety, emissions reductions, environmental performance and reliability;
Grow profitable production and sales volumes; Disciplined and long-term focus on improving the productivity of the company’s asset mix; and Best-in-class cost structure to support industry-leading returns on capital and superior cash flow.
These key business strategies are the primary focus and support long-term growth in shareholder value.
The company takes a long-term view to managing its business.

158
Key elements of the compensation program The key elements of the company’s compensation program that align with the business model and support key business strategies are:
Element Base salary Annual bonus Restricted stock units
Percent of total direct compensation (a)
Approximately 30 percent
Approximately 10 to 20 percent
Approximately 50 percent or more
Intent Provide competitive
base pay
Link pay to annual company earnings performance
Provide near-term performance payment
Link pay to returns of long-term shareholders
Encourages long-term view through commodity price cycle
Key design features
Increase determined by individual performance, level of responsibility, experience, and pay grade
Ties directly to long-term benefits (pension & savings plans)
Paid in year of grant
Bonus award pool shifts in line with year-over-year earnings
Individual award determined by performance and pay grade
Full award subject to clawback
Granted in the form of stock units
CEO: 50 percent vests in 5 years from grant date; 50 percent in 10 years
All other executives and employees: 50 percent vests in 3 years from grant date; 50 percent in 7 years
Long restriction periods
Significant portion of pay at risk of forfeiture
Pay at risk Fixed pay Variable pay at risk Variable pay at risk
(a) Total direct compensation includes salary, the annual bonus, and the grant date fair value of the restricted stock unit award which is
equal to the price of the company’s common shares on the date of grant.
The above programs are underpinned by our pension and savings plans which provides for financial security after employment. Management of risk The company is governed by a comprehensive and well-established risk management system, and the company’s success in managing risk over time has been achieved through emphasis on execution of this disciplined management framework. The company operates in an industry in which effective risk management is critical. The company’s risk management framework includes a process for identifying, prioritizing, measuring, and managing the principal risks across the company, as well as assessing the company’s response to these risks. This framework establishes common expectations for addressing risks inherent in our business and takes priority over other business and financial objectives. For further discussion on the company’s risk management system and oversight, see “Risk oversight” within the “Statement of corporate governance practice” on page 129. The company’s long-term orientation and compensation program design encourage the highest performance standards and discourage inappropriate risk taking. The compensation program components described below are designed to incent effective management of all operating and financial risks associated with the company’s business, including risks related to climate change, in order to:
protect the safety and security of our employees, the communities, and the environment in which we operate;
manage risk and operate the business with effective business controls;
create sustainable value for company shareholders by increasing shareholder return, net income, and return on average capital employed*; and
advance the long-term strategic direction of the company. Due to the long vesting periods of restricted stock units and the linkage of compensation to overall company performance, including all aspects of risk management, executive compensation is designed to support the sustainability of our operations and management of risk. *non-GAAP financial measure – see Frequently used terms section on page 171 for definition and reconciliation.

159
Compensation components To manage risk, a substantial portion of total compensation (excluding compensatory pension value) to senior executives is in the form of an annual bonus and restricted stock units. In the judgment of the committee, the mix of near-term and long-term incentives strikes an appropriate balance aligning the interests of senior executives with business priorities and the long-term sustainable growth of the company to create value for shareholder. Ongoing reviews of our compensation program, including incentives, ensure continued relevance of this mix and applicability for the company.
The table below outlines the risk management elements of our compensation programs:
Compensation components
Risk management
Common programs
All executives employed by the company, including the named executive officers, participate in common programs (the same salary, incentive, and retirement programs). Similar compensation design features and allocation of awards within the programs discourage inappropriate risk taking. The compensation of executives is differentiated based on individual performance assessment, level of responsibility, and individual experience.
All executives on assignment from an affiliate of the company, including the named executive officers on assignment from Exxon Mobil Corporation and Esso Australia Pty Ltd., also participate in common programs that are administered by Exxon Mobil Corporation or such affiliates. The named executive officers on assignment receive the company’s restricted stock units.
The executive resources committee reviews and approves compensation recommendations for each named executive officer prior to implementation.
Annual bonus
Recoupment (“claw-back”) and forfeiture – The entire annual bonus is subject to claw-back and any delayed portion of the annual bonus is subject to forfeiture in the event of material negative restatement of the company’s reported financial or operating results. This reinforces the importance of the company’s financial controls and compliance programs. Claw-back and forfeiture provisions also apply if an executive resigns or engages in detrimental activity.
Restricted stock units
Long holding periods – To further reinforce the importance of risk management and a long-term investment orientation, senior executives are required to hold a substantial portion of their equity incentive award for periods that far exceed the typical holding periods of comparator stock programs. The lengthy holding periods are tailored to the company’s business model.
Risk of forfeiture – During these long holding periods, the restricted stock units are at risk of forfeiture for resignation or detrimental activity. The long vesting periods on restricted stock units and the risk of forfeiture together support an appropriate risk/reward profile that reinforces the long-term orientation expected of senior executives.
Pension
The company’s defined benefit pension plan and supplemental pension arrangements are highly dependent on executives remaining with the company for a career and performing at the highest levels until retirement. This dimension of total compensation encourages executives to take a long-term view when making business decisions and to focus on achieving sustainable growth for shareholders.
For more details about the aforementioned compensation components, see the “Compensation program” section.
Other supporting compensation and staffing practices
A long established program of management development and succession planning is in place to reinforce a career orientation and ensure continuity of leadership;
The use of perquisites at the company is very limited, and mainly composed of financial planning for senior executives and the selective use of club memberships which are largely tied to building business relationships; and
Tax assistance is provided for employees on expatriate assignment. This assistance consists primarily of a tax equalization component designed to maintain the employees’ overall income tax burden at approximately the same level it would have otherwise been, had they remained in their home country. The expatriate relocation program is broad-based and applies to all executive, management, professional and technical transferred employees.

160
Hedging policy Company policy prohibits all employees, including executives, and directors, from being a party to derivative or similar financial instruments, including puts, calls, or other options, future or forward contracts, or equity swaps or collars, with respect to the company or Exxon Mobil Corporation stock. Business performance and basis for compensation The assessment of employee performance is conducted through the company's annual performance assessment program. The process assesses performance against relevant business performance measures and objectives, including the means by which performance is achieved. These business performance measures may include:
safety, health, and environmental performance;
risk management;
total shareholder return;
net income;
return on average capital employed*;
cash flow from operations and asset sales*;
operating performance of the upstream, downstream, and chemical segments; and
progress on advancing government relations and long-term strategic interests. *non-GAAP financial measure – see Frequently used terms section on page 171 for definition and reconciliation.
The performance assessment program includes a comparative assessment of employee performance using a standard approach throughout the organization and at all levels. It is integrated with the compensation program, which results in significant pay differentiation between higher and lower performers. The performance assessment program is also integrated with the executive development process. Both have been in place for many years and are the basis for planning individual development and succession for management positions. Decision-making with respect to compensation requires judgment, taking into account business and individual performance, and responsibility. Quantitative targets or formulae are not used to assess individual performance or determine the amount of compensation. Succession planning The succession planning process fosters the company’s approach to a career orientation and promotion from within. This approach strengthens continuity of leadership and supports ongoing alignment with our long-term business model. This process helps to assess the competence and readiness of individuals for senior executive positions. The executive resources committee is responsible for approving specific succession plans for the position of chairman, president and chief executive officer, and key senior executive positions, including all officers of the company.
The executive resources committee regularly reviews the company's succession plans for key senior executive positions. It considers candidates for these positions from within the company and certain candidates from Exxon Mobil Corporation and its affiliates. This is an in-depth review of succession plans, which includes the consideration of various aspects of diversity as well as plans to address gaps, if any, for key executives. The company has a long-standing practice to regularly review with senior management the progress of women, Indigenous people, persons with disabilities, and visible minorities, including topics such as recruitment, attrition, training and development. For more information regarding executive officer diversity see page 146. The chairman, president and chief executive officer also discusses the strengths, progress, and development needs of key succession candidates regularly. This provides the board an opportunity to confirm a pipeline of key and diverse talent exists to enable achievement of long-term strategic objectives. The executive resources committee makes recommendations to the board of directors for selection of all officers of the company, as well as other key senior executive positions reporting to the chairman, president and chief executive officer.

161
Compensation program
Career orientation The company’s objective is to attract, develop, and retain over a career the best talent available. It takes a long period of time and significant investment to develop the experienced executive talent necessary to succeed in the company’s business. Senior executives must have experience with all phases of the business cycle to be effective leaders. The company’s compensation program elements are designed to encourage a career orientation among employees at all levels of the company. Career orientation among a dedicated and highly skilled workforce, combined with the highest performance standards, contributes to the company’s leadership in the industry and serves the interests of shareholders in the long term. The average service of the named executive officers is 31 years which reflects this on-going career orientation strategy.
The compensation program emphasizes individual experience and performance; executives holding similar positions may receive substantially different levels of compensation. Consistent with the company’s long-term career orientation, high-performing executives typically earn substantially higher levels of compensation in the later years of their careers. This pay practice reinforces the importance of a long-term focus on making decisions that are key to business success.
The company's executive compensation program is composed of base salaries, as well as near-term cash bonus and long-term incentive compensation. The company does not have written employment contracts or any other agreement with its named executive officers providing for payments on change of control or termination of employment. Base salary Base salary represents approximately 30 percent of total direct compensation, and is intended to provide competitive base pay. It also directly affects the level of retirement benefits, as salary is included in the retirement benefits calculation. The size of the company’s overall salary program is determined by annual benchmarking. Individual salary increases are the result of individual performance, level of responsibility, experience, and changes to pay grade, and reflects market analysis and competitiveness at the time of the decision. 2021 decisions
2021 salaries were held at 2020 levels, reflective of market conditions at the time of decision. For 2022, the executive resources committee granted salary increases to named executive officers
consistent with the salary program for executives.
The company’s compensation program is designed to reward performance,
promote retention, and encourage long-term business decisions.
162
Annual bonus The company’s annual bonus program represents 10 to 20 percent of total direct compensation, and is intended to link executive pay to annual company earnings performance. The bonus program is established annually by the executive resources committee based on earnings, and can be highly variable depending on these results. In establishing the annual bonus program, the executive resources committee:
considers input from the chairman, president and chief executive officer on performance of the company and from the company’s internal compensation advisors regarding compensation trends as obtained from external consultants;
considers the linkage to the majority shareholder’s bonus program given the company’s working interest is included in Exxon Mobil Corporation earnings;
considers annual net income of the company; and uses judgment to manage the overall size of the annual bonus program taking into consideration the
cyclical nature and long-term orientation of the business. 2021 decisions
2021 bonus award was paid in full in year of grant rather than a combination of cash and earnings bonus units, consistent with market practice and resulting in a stronger link to earnings performance and individual performance differentiation.
This resulted in 49 executives receiving an annual bonus in 2021, compared to no executives who received an annual bonus in 2020. The cost of the 2021 annual bonus program was $4.2 million versus $0 in 2020 and $3.2 million in 2019.
While no earnings bonus units were granted in 2021, the company’s executives, including the named executive officers, have outstanding earnings bonus units that have not vested.
Earnings bonus units are cash awards that are tied to future cumulative earnings per share.
Earnings bonus units pay out when a specified level of cumulative earnings per share (or trigger) is achieved or in three years at a reduced level. The trigger is intentionally set at a level that is expected to be achieved within the three-year period and reinforces the company’s principle of sustained improvement in the company’s business performance and aligns the interests of executives with those of long-term shareholders; and
If cumulative earnings per share do not reach the trigger within three years, the payment with respect to the earnings bonus units will be reduced to an amount equal to the number of units multiplied by the actual cumulative earnings per share over the three-year period. The amount of the award, once vested, will never exceed the original grant value. The delayed payout of the earnings bonus units puts part of the annual bonus at risk of forfeiture and thus reinforces the performance basis of the annual bonus grant.
The annual bonus, including earnings bonus units, are subject to forfeiture and claw-back if:
An executive retires before normal retirement time. The company has indicated its intention not to forfeit outstanding awards of employees who
retire at age 65. In other circumstances, where a recipient retires before age 65, the company may determine that awards shall not be forfeited.
An executive’s employment with the company terminates (for any reason, whether at initiative of employee, the company or otherwise) the company may determine that awards shall not be forfeited.
An executive, without the consent of the company, engages in any activity, during employment or after retirement or termination of employment, which is detrimental to the company, including working for a competitor; or
There is a material negative restatement of the company’s reported financial or operating results. For executive officers of the company, some or all of any unvested earnings bonus units granted in the three years prior to the restatement are subject to forfeiture. In addition, any cash amounts received from bonus or earnings bonus units that were paid out up to five years prior to the restatement are subject to claw-back.
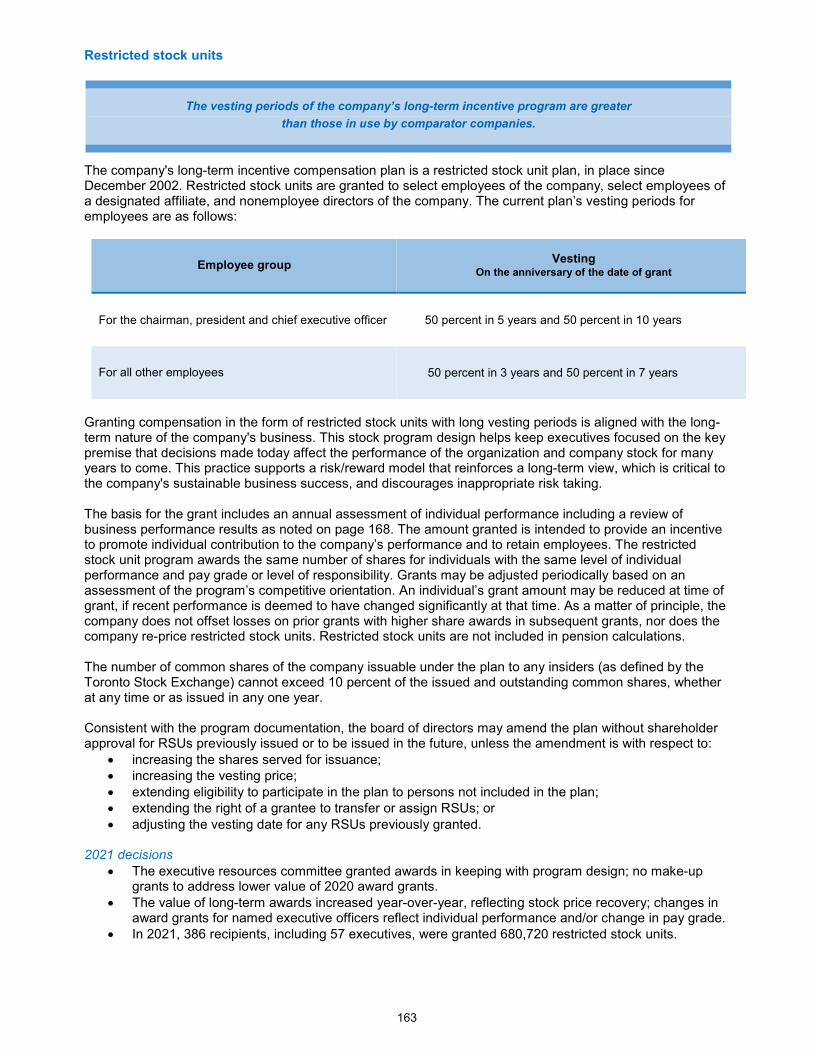
163
Restricted stock units
The company's long-term incentive compensation plan is a restricted stock unit plan, in place since December 2002. Restricted stock units are granted to select employees of the company, select employees of a designated affiliate, and nonemployee directors of the company. The current plan’s vesting periods for employees are as follows:
Employee group Vesting
On the anniversary of the date of grant
For the chairman, president and chief executive officer 50 percent in 5 years and 50 percent in 10 years
For all other employees 50 percent in 3 years and 50 percent in 7 years
Granting compensation in the form of restricted stock units with long vesting periods is aligned with the long-term nature of the company's business. This stock program design helps keep executives focused on the key premise that decisions made today affect the performance of the organization and company stock for many years to come. This practice supports a risk/reward model that reinforces a long-term view, which is critical to the company's sustainable business success, and discourages inappropriate risk taking. The basis for the grant includes an annual assessment of individual performance including a review of business performance results as noted on page 168. The amount granted is intended to provide an incentive to promote individual contribution to the company’s performance and to retain employees. The restricted stock unit program awards the same number of shares for individuals with the same level of individual performance and pay grade or level of responsibility. Grants may be adjusted periodically based on an assessment of the program’s competitive orientation. An individual’s grant amount may be reduced at time of grant, if recent performance is deemed to have changed significantly at that time. As a matter of principle, the company does not offset losses on prior grants with higher share awards in subsequent grants, nor does the company re-price restricted stock units. Restricted stock units are not included in pension calculations. The number of common shares of the company issuable under the plan to any insiders (as defined by the Toronto Stock Exchange) cannot exceed 10 percent of the issued and outstanding common shares, whether at any time or as issued in any one year. Consistent with the program documentation, the board of directors may amend the plan without shareholder approval for RSUs previously issued or to be issued in the future, unless the amendment is with respect to:
increasing the shares served for issuance; increasing the vesting price; extending eligibility to participate in the plan to persons not included in the plan; extending the right of a grantee to transfer or assign RSUs; or adjusting the vesting date for any RSUs previously granted.
2021 decisions
The executive resources committee granted awards in keeping with program design; no make-up grants to address lower value of 2020 award grants.
The value of long-term awards increased year-over-year, reflecting stock price recovery; changes in award grants for named executive officers reflect individual performance and/or change in pay grade.
In 2021, 386 recipients, including 57 executives, were granted 680,720 restricted stock units.
The vesting periods of the company’s long-term incentive program are greater
than those in use by comparator companies.
164
Vesting of restricted stock units The vesting periods, which are typically greater than those in use by other companies, reinforce the company’s focus on growing shareholder value over the long term by linking a large percentage of executive compensation and the shareholding net worth of executives to the value of the company’s stock. The long vesting periods ensure that a substantial portion of the compensation received by the chairman, president and chief executive officer, as well as other key senior executives, will be received after retirement. The value of this compensation is at risk in the event that their decisions prior to retirement negatively impact share market value after retirement. The objective of these aforementioned vesting periods is to hold senior executives accountable for many years into the future, and even into retirement, for investment and operating decisions made today. This type of compensation design removes employee discretion in the timing of exercising restricted stock units, reinforces retention objectives, and supports alignment with the long-term interests of shareholders. Restricted stock units cannot be assigned. The vesting period for restricted stock unit awards is not subject to acceleration, except in the case of death.
Upon vesting, each restricted stock unit entitles the recipient the right to receive an amount equal to the value of one common share of the company, based on the five day average closing price of the company’s shares on the vesting date and the four preceding trading days. For units granted to senior executives other than the chairman, president and chief executive officer, 50 percent of the units vest as a cash payment on the third and seventh anniversary of the grant date, except that for units vesting on the seventh anniversary that were granted to Canadian residents, the recipient may receive one common share per unit or elect to receive a cash payment for the units. For all units granted to the chairman, president and chief executive officer, upon vesting, the recipient may receive one common share of the company per unit or elect to receive a cash payment for the units. During the restricted period, the recipient will also receive cash payments equivalent to the cash dividends paid to holders of regular common stock.
The company’s directors and officers as a group hold approximately 13 percent of the unvested restricted stock units that give the recipient the right to receive common shares that represent about 0.03 percent of the company’s outstanding common shares. Currently, the maximum number of common shares that any one person may receive from the vesting of restricted stock units is 394,750 common shares, which is about 0.06 percent of the outstanding common shares. In the case of any subdivision, consolidation, or reclassification of the shares of the company or other relevant change in the capitalization of the company, the company, in its discretion, may make appropriate adjustments in the number of common shares to be issued and the calculation of the cash amount payable per restricted stock unit.
Exxon Mobil Corporation has a plan similar to the company’s restricted stock unit plan, under which grantees may receive restricted stock or restricted stock units, both of which are referred to herein as Exxon Mobil Corporation restricted stock. B.W. Corson holds Exxon Mobil Corporation restricted stock granted in 2018 and previous years, as well as the company’s restricted stock units granted since 2019. D.E. Lyons holds Exxon Mobil Corporation restricted stock granted in 2017 and previous years, as well as the company’s restricted stock units granted since 2018. S.P. Younger holds Exxon Mobil Corporation restricted stock granted in 2019 and previous years, as well as the company’s restricted stock units granted in 2020. Restricted stock units are subject to forfeiture and claw-back if:
A recipient retires before normal retirement time. The company has indicated its intention not to forfeit restricted stock units of employees who
retire at age 65. In other circumstances where a recipient retires before age 65, the company may determine that restricted stock units shall not be forfeited.
A recipient’s employment with the company terminates (for any reason, whether at initiative of employee, the company or otherwise) the company may determine that restricted stock units shall not be forfeited.
A recipient, without the consent of the company, engages in any activity, during employment or after retirement or termination of employment, which is detrimental to the company, including working for a competitor. With respect to executives, at any time prior to vesting of the outstanding awards. With respect to all other employees, for a period of up to three years after retirement or the
termination of employment.
165
Amendments to the restricted stock unit plan In 2011, the restricted stock unit plan was amended to include language confirming the long-standing practice of not forfeiting any restricted stock units in the event that the grantee’s continued employment terminates on or after the date the grantee reaches the age of 65 in circumstances where the grantee becomes entitled to an annuity under the company’s retirement plan.
In 2016, the restricted stock unit plan was amended to update provisions regarding forfeiture of restricted stock units in the event of detrimental activity, extending the period from two years to the current periods noted above. Further, the amendments provided a new vesting option in addition to the existing vesting options previously described, such that the second 50 percent of the restricted stock units may vest on the tenth anniversary following the grant date.
In 2020, the restricted stock unit plan was amended to update provisions regarding the vesting periods for the units granted in 2020 and onwards to the chairman, president and chief executive officer such that 50 percent of restricted stock units vest on the fifth anniversary and remaining 50 percent on the tenth anniversary. For awards granted prior to 2020, the vesting of the tenth anniversary portion of the award is delayed until retirement if later than 10 years. Retirement benefits Named executive officers participate in the same pension plan, including supplemental pension arrangements outside the registered plan, as other employees, except for B.W. Corson, D.E. Lyons and S.P. Younger who participate in Exxon Mobil Corporation or respective affiliates’ pension plans. Pension plan benefits The company has provided defined benefit pension plans to its employees since 1919. The current pension plan provides a 1.5 percent accrual formula to all employees hired on and after September 1, 2015. All plan participants employed prior to the date of the change will continue to accrue pension benefits based on accrual formulae in place prior to September 1, 2015. The pension plan provides for pension benefits accrual only until December 1st in the year the employee reaches the age of 71. The company’s non-registered supplemental pension arrangements address any portions of the defined benefit that cannot be paid from the registered plan due to income tax regulations that impose limits on the amounts that can be paid from a registered plan. Any pension amounts paid to an eligible employee are subject to the employee meeting the terms of the registered pension plan, and if applicable, the criteria of the supplemental pension arrangements. No supplemental pension amounts are payable if an employee resigns before reaching retirement eligibility. For executive officers who receive an annual bonus, the company’s supplemental pension arrangements can also provide an annual benefit of either 1.5 percent or 1.6 percent of final average bonus earnings multiplied by years of service depending on the plan in which they participate. Final average bonus earnings include the average annual bonus for the three highest grants of the last five bonus years awarded prior to retirement for eligible executives, but do not include restricted stock units. Limiting the final average bonus earnings to the awards granted in the five bonus years prior to retirement provides a strong incentive for executives to continue to perform at a high level. Annual bonus could include the cash amounts that are paid at grant and the maximum settlement value of any earnings bonus units received, as described starting on page 162. The value of the earnings bonus units are expected to pay out, subject to forfeiture provisions, and are therefore included for supplemental pension arrangement purposes in the year of grant rather than the year of payment. The estimated benefits that would be payable upon retirement to each named executive officer under the company’s pension plan and the supplemental pension arrangements can be found in the pension plan benefits table starting on page 177. The company does not grant additional pension service credit. B.A. Jolly and J.R. Wetmore participate in the previous 1.6 percent provision of the company’s plan that was
closed to new participants at the end of 1997. Key features of this historic plan include:
An annual benefit equal to 1.6 percent multiplied by final average earnings multiplied by years of service, with a partial offset for applicable government pension benefits. Final average earnings consists of base salary over the highest 36 consecutive months in the 10 years of service prior to retirement.
An option to forego a portion of the company’s matching contributions to the savings plan in order to receive an additional 0.4 percent of final average earnings.

166
B.W. Corson, D.E. Lyons and S.P. Younger are not participants in the company’s pension plan, but are participants in the Exxon Mobil Corporation or respective affiliates’ pension plans:
Mr. Corson and Mr. Lyons participate in the Exxon Mobil Corporation defined benefit plan. Under this plan, the pension is payable in U.S. dollars and is calculated based on final average base salary over the highest 36 consecutive months in the 10 years of service prior to retirement, and the average annual bonus for the three highest grants of the last five awarded prior to retirement, but do not include restricted stock units.
Mr. Younger participates in the Esso Australia Pty Ltd. defined benefit plan. Under this plan, the pension is payable in Australian dollars and is calculated based on final average base salary over the highest 12 consecutive months in the 10 years of service prior to retirement.
Savings plan benefits The company maintains a savings plan into which career employees with more than one year of service may contribute between 1 and 30 percent of normal earnings. The company provides contributions which vary depending on the amount of employee contributions and which defined benefit pension arrangement the employee participates. All named executive officers are eligible to receive a company matching contribution of up to 6 percent, except for B.W. Corson, D.E. Lyons, and S.P. Younger, who participate in their respective affiliates’ savings plan, where applicable. Employee and company contributions can be allocated in any combination to a non-registered (tax-paid) account, or a registered (tax-deferred) group retirement savings plan (RRSP). Employee contributions can be redirected from the tax-paid account to a tax-free savings account (TFSA). Both the RRSP and TFSA accounts are subject to contribution limits under the Income Tax Act. Available investment options include cash savings, a money market mutual fund, a suite of four index-based equity or bond mutual funds, and company shares. Assets in the RRSP account and company contributions to the tax-paid account may only be withdrawn upon retirement or termination of employment, reinforcing the company’s long-term approach to total compensation. Income tax regulations require RRSPs to be converted into an eligible form of retirement income by the end of the calendar year in which the individual reaches age 71.

167
Compensation decision making process and considerations for named executive officers Benchmarking In addition to the assessment of business performance, individual performance and level of responsibility, the executive resources committee relies on market comparisons to a group of major Canadian companies. Comparator companies The following criteria are used to select comparator companies:
Canadian companies or Canadian affiliates;
large operating scope and complexity;
capital intensive; and
proven sustainability. List of comparator companies:
Energy: Canadian Natural Resources Limited, Cenovus Energy Inc., Chevron Canada Ltd., China National Offshore Oil Corporation, ConocoPhillips Canada, Enbridge Inc., Irving Oil Ltd., NOVA Chemicals Corporation, Nutrien Ltd., Ovintiv Inc., Repsol Oil & Gas Canada Inc., Shell Canada Limited, Suncor Energy Inc., TC Energy Corporation, Valero Energy
Non-energy: BCE Inc., Canadian Pacific Railway Limited, Canadian Tire Corporation, Limited, General Electric Canada, IBM Canada Ltd., Proctor & Gamble Inc., Royal Bank of Canada
The company is a national employer drawing from a wide range of disciplines. It is important to understand its competitive orientation relative to a variety of energy and non-energy employers. Compensation trends across industries, based on survey data, are prepared annually by an independent external consultant with additional analysis and recommendation provided by the company’s internal compensation advisors. Consistent with the executive resources committee’s practice of using well-informed judgment rather than formulae to determine executive compensation, the committee does not target any specific percentile among comparator companies to align compensation. The focus is on a broader and more flexible orientation, generally a range around the median of the comparator energy companies’ compensation. This approach applies to salaries and the annual incentive program that includes annual bonus and restricted stock units. As a secondary source of data, the executive resources committee also considers a comparison with the majority shareholder when it determines the annual bonus program. For the restricted stock unit program, the executive resources committee may review a summary of comparator company data provided by the same external consultant in order to assist in assessing total value of long-term compensation grants. As a result, grant level guidelines may be adjusted periodically to maintain the program’s competitive orientation. As a matter of principle, the company does not offset losses on prior grants with higher share awards in subsequent grants, nor does the company re-price restricted stock units. This overall approach provides the company with the ability to:
better respond to changing business conditions; manage salaries based on a career orientation; minimize potential for automatic increasing of salaries, which could occur with an inflexible and
narrow target among benchmarked companies; and differentiate executives’ salaries based on performance and experience levels.
The elements of Exxon Mobil Corporation and respective affiliates’ compensation programs for B.W. Corson, D.E. Lyons and S.P. Younger, including salary, annual bonus and restricted stock units (long-term) compensation considerations, are generally similar to those of the company. 2021 named executive officer compensation assessment When determining the annual compensation for the named executive officers, the executive resources committee has reflected on the following business performance result indicators in its determination of 2021 salary and incentive compensation.
168
Business performance results for consideration The operating and financial performance results listed below and the company's continued maintenance of sound business controls and a strong corporate governance environment formed the basis for the salary and incentive award decisions made by the executive resources committee in 2021. The executive resources committee considered the results over multiple years, relative to the company’s proven business model and strategies, to deliver long-term shareholder value.
2021 Key business results
Continued to protect our workforce during the pandemic and delivered strong safety performance and effective enterprise risk management.
Recognized as one of Canada’s best employers by Forbes and one of Canada’s top employers by Mediacorp Canada Inc.
Demonstrated clear commitment to sustainability: Published Imperial’s Corporate Sustainability Report. Announced the launch of the Oil Sands Pathways to Net Zero industry alliance. In January 2022, announced plans for further greenhouse gas emissions intensity reductions at the
company’s operated oil sands facilities, anticipating a 30 percent reduction by 2030, compared to 2016 levels in support of its goal to achieve net zero emissions in its operated oil sands assets by 2050.
Awarded silver level of certification with Progressive Aboriginal Relations. Strong financial performance:
Positioned Imperial to take advantage of higher commodity prices by structurally lowering operating and capital expenditures.
Net income of $2,479 million, driven by attractive market conditions, structural cost reductions, and reliable operations.
Generated about $5.5 billion in cash flow from operating activities and with disciplined capital spending achieved about $4.5 billion in free cash flow*.
Increased quarterly dividend to $0.27 per share starting in the second quarter of 2021, increasing the annual dividend paid for the 27th consecutive year while maintaining stable debt levels.
Record shareholder returns of nearly $3 billion; including dividends of about $0.7 billion and share repurchases of about $2.2 billion under its normal course issuer bid.
Strong Upstream operational performance: 428,000 gross oil-equivalent barrels per day of full-year upstream production; the highest in over 30
years driven by reliability improvements, production recovery and capacity enhancements, and continued focused, high return investment.
Highest ever annual total gross production at Kearl of 263,000 barrels per day. Following implementation of a multi-year plan, successfully transitioned Kearl to a single annual
turnaround, one year ahead of schedule. Successful startup of first Kearl Boiler flue gas unit reducing both operating expenses and greenhouse
gas emissions. Increased year-over-year production at Cold Lake driven by higher reliability and production
enhancement initiatives including field optimizations and drilling. Successfully started the Liquid Addition to Steam for Enhanced Recovery (LASER) Project at Cold
Lake's Mahkeses plant. This latest deployment of Imperial’s enhanced recovery solvent technology improves productivity and is expected to enable up to a 25 percent greenhouse gas intensity reduction for the associated production.
Syncrude operatorship successfully transferred from Syncrude Canada to Suncor; in an effort to maximize profitability and improve reliability for the asset.
Strong Downstream and Chemical operational performance: Refinery capacity utilization for 2021 increased by nine percent to 89 percent despite a significant
turnaround at Strathcona. Progressed Sarnia Products Pipeline project to increase capacity, improve reliability of supply, and
structurally lower logistics costs and increase sales in the high-value Toronto market. Announced plans to construct a world-class renewable diesel complex at Strathcona refinery; a final
investment decision is expected in the fourth quarter of 2022 and will be based on several factors. Record diluent production at Strathcona and record asphalt production at Nanticoke.
Strong polyethylene margins and asset reliability led to highest full-year Chemicals net income in over 30 years of $361 million.
*non-GAAP financial measure – see Frequently used terms section on page 171 for definition and reconciliation.

169
Performance assessment considerations
The preceding results form the context in which the committee assesses the individual performance of each senior executive, taking into account experience and level of responsibility. Annually, the chairman, president,
and chief executive officer reviews the performance of the senior executives in achieving business results and individual development needs. The same long-term key business strategies noted on page 157 and the company’s business performance results are key elements in the assessment of the chairman, president, and chief executive officer's performance by the executive resources committee. The performance of all named executive officers is also assessed by the board of directors throughout the year during specific business reviews and board committee meetings that provide information on strategy development, operating and financial results, safety, health, and environmental results, business controls, and other areas pertinent to the general performance of the company. The executive resources committee does not use quantitative targets or formulae to assess individual executive performance or determine compensation. The executive resources committee does not assign weights to the factors considered. Formula-based performance assessments and compensation typically require emphasis on two or three business metrics. For the company to be an industry leader and effectively manage the technical complexity and integrated scope of its operations, most senior executives must advance multiple strategies and objectives in parallel, versus emphasizing one or two at the expense of others that require equal attention. Senior executives and officers are expected to perform at the highest level or they are replaced. If it is determined that another executive is ready and would make a stronger contribution than one of the current incumbents, a replacement plan is implemented. 2021 chief executive officer compensation assessment B.W. Corson was appointed to the board and as president of the company on September 17, 2019 and assumed the additional roles of chairman and chief executive officer on January 1, 2020. Mr. Corson worked for Exxon Mobil Corporation and its predecessor companies since 1983. His level of salary in 2021 was determined by the executive resources committee based on his individual performance and to align with that of his peers in ExxonMobil, and was held at 2020 levels reflective of market conditions at the time of decision. It was also the objective of the executive resources committee to ensure appropriate internal alignment with senior management in the company. For 2022, the committee approved a salary increase of $31,000 U.S. to $804,000 U.S. effective January 1, 2022. Mr. Corson’s 2021 annual bonus was based on his performance as assessed by the executive resources committee since his appointment to the position of chairman, president, and chief executive officer. His long-term incentive award was granted in the form of company restricted stock units, not Exxon Mobil Corporation restricted stock, to reinforce alignment of his interests with that of the company’s shareholders. His company restricted stock units are subject to vesting periods longer than those applied by most companies. 50 percent of the restricted stock units awarded vest in five years and the other 50 percent vest in ten years from the date of grant. The purpose of these long vesting periods is to reinforce the long investment lead times in the business and to link a substantial portion of Mr. Corson’s shareholding net worth to the performance of the company. As such, the payout value of the long-term incentive grants may differ from the amounts shown in the summary compensation table, depending on how the company actually performs at time of future vesting. During these vesting periods, the awards are subject to risk of forfeiture based on detrimental activity even after retirement. The executive resources committee has determined that the total compensation of Mr. Corson was appropriate based on the company's financial and operating performance, and its assessment of his effectiveness in leading the organization relative to the business performance measures outlined on page 160. Taking all factors into consideration, the committee's decisions on compensation of the chief executive officer reflect judgment, rather than the application of formulae or targets.

170
Pay awarded to other named executive officers Within the context of the compensation program structure and performance assessment processes previously described, the value of 2021 incentive awards and salary adjustments align with:
performance of the company;
individual performance;
long-term strategic plan of the business; and
annual compensation of comparator companies.
Taking all factors into consideration, the executive resources committee's decisions on pay awarded to other named executive officers reflect judgment, rather than the application of formulae or targets. The executive resources committee approved the individual elements of compensation and the total compensation as shown in the summary compensation table on page 172. Independent consultant In fulfilling its responsibilities during 2021, the executive resources committee did not retain an independent consultant or advisor in determining compensation for any of the company’s officers or any other senior executives. The company’s management retained an independent consultant to provide an assessment of competitive compensation and market data for all salaried levels of employees of the company. While providing this data, they did not provide individual compensation recommendations or advice for the compensation of the chairman, president and chief executive officer or other senior executives. Performance graph The following graph shows changes over the past 5 years in the value of $100 invested in (i) Imperial Oil Limited common shares, (ii) the S&P/TSX Composite Index, and (iii) the S&P/TSX Composite Energy Index. The S&P/TSX Composite Energy Index is currently made up of share performance data for 32 oil and gas companies including integrated oil companies, oil and gas producers, and oil and gas service companies.
The year-end values in the graph represent appreciation in share price and the value of dividends paid and reinvested. The calculations exclude trading commissions and taxes. Total shareholder returns from each investment, whether measured in dollars or percent, can be calculated from the year-end investment values shown beneath the graph.
During the past 5 years, the company's cumulative total shareholder return was 11 percent, for an average annual return of 2.1 percent. Total direct compensation for named executive officers generally reflects the trend in total shareholder returns as the largest single component of executive compensation is awarded in the form of restricted stock units with long holding periods. This design reinforces the long-term linkage between executive compensation and the shareholding net worth of executives to the return on the company’s stock realized by shareholders. Total direct compensation includes salary, the annual bonus grant, and the grant date fair value of the restricted stock unit award which is equal to the price of the company’s common shares on the date of grant.

171
Frequently used terms The term total direct compensation is compensation granted during the year, including salary, the annual bonus, and the grant date fair value of the restricted stock unit award which is equal to the price of the company’s common shares on the date of grant. The following definitions are used in the compensation discussion and analysis as several of Imperial’s business and financial performance measures. These measures are not prescribed by U.S. Generally Accepted Accounting Principles (GAAP). These measures constitute “non-GAAP financial measures” under Securities and Exchange Commission Regulation G, and “specified financial measures” under National Instrument 52-112 Non-GAAP and Other Financial Measures Disclosure of the Canadian Securities Administrators. Non-GAAP financial measures and specified financial measures are not standardized financial measures under GAAP and do not have standardized definitions. As such, these measures may not be directly comparable to measures presented by other companies, and should not be considered a substitute for GAAP financial measures. For additional information and reconciliation with respect to the terms, see the “Frequently used terms” section of the company’s most recent Annual Report on Form 10-K.
Cash flow from operating activities and asset sales is a non-GAAP financial measure that is the sum of the net cash provided by operating activities and proceeds from asset sales reported in the consolidated statement of cash flows.
Return on average capital employed is a non-GAAP financial measure that is a measure of
capital productivity, and equals net income excluding the after-tax cost of financing divided by total average capital employed. Capital employed is property, plant and equipment, and other assets, less liabilities, excluding both short-term and long-term debt, plus the company’s share of equity company debt.
Free cash flow is a non-GAAP financial measure that is cash flows from operating activities less additions to property, plant and equipment and equity company investments plus proceeds from asset sales. The most directly comparable financial measure that is disclosed in the financial statements is cash flows from (used in) operating activities within the company’s consolidated statement of cash flows. This measure is used to evaluate cash available for financing activities (including but not limited to dividends and share purchases) after investment in the business.
Reconciliation of free cash flow
millions of Canadian dollars 2021
From Imperial's Consolidated statement of cash flows
Cash flows from (used in) operating activities 5,476
Cash flows from (used in) investing activities
Additions to property, plant and equipment (1,108)
Proceeds from asset sales 81
Loans to equity companies - net 15
Free cash flow 4,464

172
Executive compensation tables and narratives
Summary compensation table The following table shows the compensation for the chairman and chief executive officer; the senior vice-president, finance and administration, and controller; and the three other most highly compensated executive officers of the company who were serving as of the end of 2021. B.W. Corson was appointed to the board and as president of the company on September 17, 2019 and assumed the additional roles of chairman and chief executive officer on January 1, 2020. The information in the Summary compensation table includes the Canadian dollar value of base salaries, cash bonus awards and earnings bonus unit payments, long-term incentive compensation and certain other compensation. Amounts in the table pertain to the named executive officers’ respective periods of assignment with the company.
Name and principal
position at the end of 2021
Year
Salary
($) (c)
Share-based
awards ($)
(d)
Option-based
awards ($)
(e)
Non-equity incentive plan compensation
($) Pension
value
($) (h)
All other
compensation
($) (i)
Total
compensation
($) (j)
Annual
incentive plans
(f)
Long-term
incentive plans
(g)
B.W. Corson (b) Chairman, president and chief executive officer (since September 17, 2019)
2021 968,956 3,447,056 - 956,421 0 1,200,091 2,178,025 8,750,549
2020
996,734 1,897,132 - - 0 (340,046) 1,945,980 4,499,800
2019 (a)
187,070 2,532,116 - 376,176 317,791 (63,715) 151,909 3,501,347
D.E. Lyons (b)
Senior vice-president, finance and
administration, and controller (since
May 1, 2018)
2021 646,806 1,163,712 - 439,979 0 463,757 784,104 3,498,358
2020 689,307 553,128 - - 0 (207,474) 1,516,702 2,551,663
2019
665,551 621,696 - 135,344 135,341 (150,729) 545,109 1,952,312
S.P. Younger (b)
Senior vice-president, upstream (since July 1, 2019)
2021 545,996 714,096 - 250,449 0 81,762 415,505 2,007,808
2020 527,126 393,012 - - 0 (299,441) 555,097 1,175,794
2019 (a)
249,870 674,962 - 79,747 81,927 64,157 385,445 1,536,108
B.A. Jolly
Assistant controller
(since August 1, 2019)
2021 450,000 749,360 - 237,332 0 268,900 91,487 1,797,079
2020 444,500 393,012 - - 0 23,300 76,767 937,579
2019 413,333 427,416 - 63,300 75,954 (118,700) 70,093 931,396
J.R. Wetmore
Vice-president, downstream and Western Canada fuels manager (since January 1, 2018)
2021 432,100 581,856 - 157,555 0 56,200 59,028 1,286,739
2020 427,100 320,232 - - 0 87,500 50,885 885,717
2019 405,600 382,084 - 47,000 60,032 184,300 47,073 1,126,089

173
Footnotes to the Summary compensation table for named executive officers (a) The compensation for B.W. Corson and S.P. Younger for the first year of their assignment has been prorated based on the start of
their assignment. Mr. Corson was appointed as president of the company effective September 17, 2019. Mr. Corson’s expatriate assignment from Exxon Mobil Corporation, an affiliate in the U.S., formally started November 1, 2019 reflecting a transition period from his previous role. The company incurred costs related to Mr. Corson’s compensation from November 1, 2019 onwards, and a portion of his compensation between his appointment on September 17 and formal assignment on November 1, for service he provided to the company during this period. Mr. Younger has been on expatriate assignment from Esso Australia Pty Ltd., an affiliate in Australia, since July 1, 2019.
(b) The compensation for B.W. Corson, D.E. Lyons, and S.P. Younger is paid directly by Exxon Mobil Corporation and respective affiliates, with the exception of the compensation related to the vesting of the company’s restricted stock units and dividend equivalents on outstanding restricted stock units. They also receive employee benefits under their respective affiliates’ employee benefit plans, and not under the company’s employee benefit plans. The company reimburses the respective affiliates for applicable compensation paid and employee benefits provided to them. The company does not reimburse Exxon Mobil Corporation for the cost of incentive awards granted by Exxon Mobil Corporation.
(c) 2021 salaries were held at 2020 levels, reflective of market conditions at the time of the decision. The 2019 and 2020 salary increases were granted to all executives including the named executive officers throughout the calendar year rather than being granted on January 1. The amounts listed in the “Salary” column for each named executive officer on expatriate assignment (B.W. Corson, D.E. Lyons and S.P. Younger) are paid in their local currency, but disclosed in Canadian dollars. Mr. Corson’s and Mr. Lyons’ salaries are paid in U.S. dollars and were converted to Canadian dollars at the average 2021 exchange rate of 1.2535. In 2020 and 2019, the average exchange rate was 1.3415 and 1.3269 respectively. Mr. Younger’s salary is paid in Australian dollars and was converted to Canadian dollars at the average 2021 exchange rate 0.9421. In 2020 and 2019, the average exchange rate was 0.9247 and 0.9228. Differences between the 2020 and 2021 salaries are due to the interval of salary increases in 2020 and the variation on the exchange rates.
(d) The grant date fair value equals the number of restricted stock units multiplied by the closing price of the company’s shares on the date of grant. The closing price of the company’s shares on the grant date in 2021 was $44.08, which is the same as the accounting fair value for the restricted stock units on the date of grant. The closing price of the company’s shares on the grant date in 2020 was $24.26 and in 2019 was $32.38, which is the same as the accounting fair value for the restricted stock units on the date of grant. The company chose this method of valuation as it believes it results in the most accurate representation of fair value.
(e) The company has not granted stock options since 2002. The stock option plan expired in 2012. (f) The amounts listed in the “Annual incentive plans” column for each named executive officer represent their 2021 cash bonus. In
2021, the bonus award was paid in full as a cash bonus in the year of grant rather than a combination of cash and earnings bonus units. In 2020, the company suspended the annual cash bonus program, and therefore no cash payment was made. B.W. Corson, D.E. Lyons, and S.P. Younger participate in Exxon Mobil Corporation’s annual cash bonus program, which is similar to the company’s plan, and is paid in U.S. dollars, but disclosed in Canadian dollars. In 2021, Exxon Mobil Corporation’s bonus award was also paid in full as a cash bonus in the year of grant rather than a combination of cash and earnings bonus units. In 2020, Exxon Mobil Corporation’s annual bonus program was also suspended. For amounts paid in 2021 and 2019 in U.S. dollars, they were converted to Canadian dollars at the average exchange rate of 1.2535 and 1.3269 respectively.
(g) The amounts listed in the “Long-term incentive plans” column represent earnings bonus units related to prior year grants that paid out in year. In 2021 and 2020, the maximum settlement value (trigger) or cumulative earnings per share was not achieved, therefore no payments were made. B.W. Corson, D.E. Lyons, and S.P. Younger participate in Exxon Mobil Corporation’s program, which is similar to the company’s program, and is paid in U.S. dollars, but disclosed in Canadian dollars. Under the Exxon Mobil Corporation’s program, the maximum settlement value (trigger) or cumulative earnings per share was not achieved, therefore no payments were made in 2021 and 2020. For amounts paid in 2019 in U.S. dollars, they were converted to Canadian dollars at the average exchange rate of 1.3269.
(h) “Pension value” is the "Compensatory change" in pensions as of December 31, 2021 as set out in the "Pension plan benefits" table on page 177.
(i) The amounts listed in the “All other compensation” column include dividend equivalent payments on restricted stock units granted, savings plans contributions, expatriate assignment costs, parking and the cost of perquisites including financial planning and business club memberships, as well as security costs and costs associated with participation in Exxon Mobil Corporation’s executive life insurance benefit plan, as applicable. For B.W. Corson and D.E. Lyons, Exxon Mobil Corporation suspended its company contributions to saving plans effective October 1, 2020 and reinstated its company contributions on October 1, 2021.
For each named executive officer, the aggregate value of perquisites received in 2021 was not greater than $50,000 or 10 percent of the named executive officer's base salary.
It is noted that in 2021, the actual dividend equivalent payments on the company restricted stock units were $136,068 for B.W. Corson, $54,960 for D.E. Lyons, $12,312 for S.P. Younger, $60,419 for B.A. Jolly, and $52,245 for J.R. Wetmore. The dividend equivalent payments on Exxon Mobil Corporation’s restricted stock were $507,904 for Mr. Corson, $85,526 for Mr. Lyons and $112,868 for Mr. Younger; these amounts were paid in U.S. dollars and converted to Canadian dollars at the average 2021 exchange rate of 1.2535.
For the named executive officers on expatriate assignment (B.W. Corson, D.E. Lyons and S.P. Younger), “All other compensation” also includes expatriate assignment costs which consist of expatriate allowances and the net effect of tax equalization costs in the year. Tax equalization costs include the net effect of taxes paid by the companies to local taxing authorities on behalf of the named executive officer offset by a withholding from their income that approximates the amount of tax they would pay if they had not gone on expatriate assignment. Tax equalization is an integral part of the expatriate relocation program and is designed to maintain an individual’s overall tax burden at approximately the same level it would have otherwise been, had they remained in their home country. Tax equalization amounts vary from one year to the next and the net impact may be positive or negative in the year.
(j) “Total compensation" consists of the total dollar value of “Salary”, “Share-based awards”, “Option-based awards”, “Non-equity incentive plan compensation”, “Pension value” and “All other compensation”.
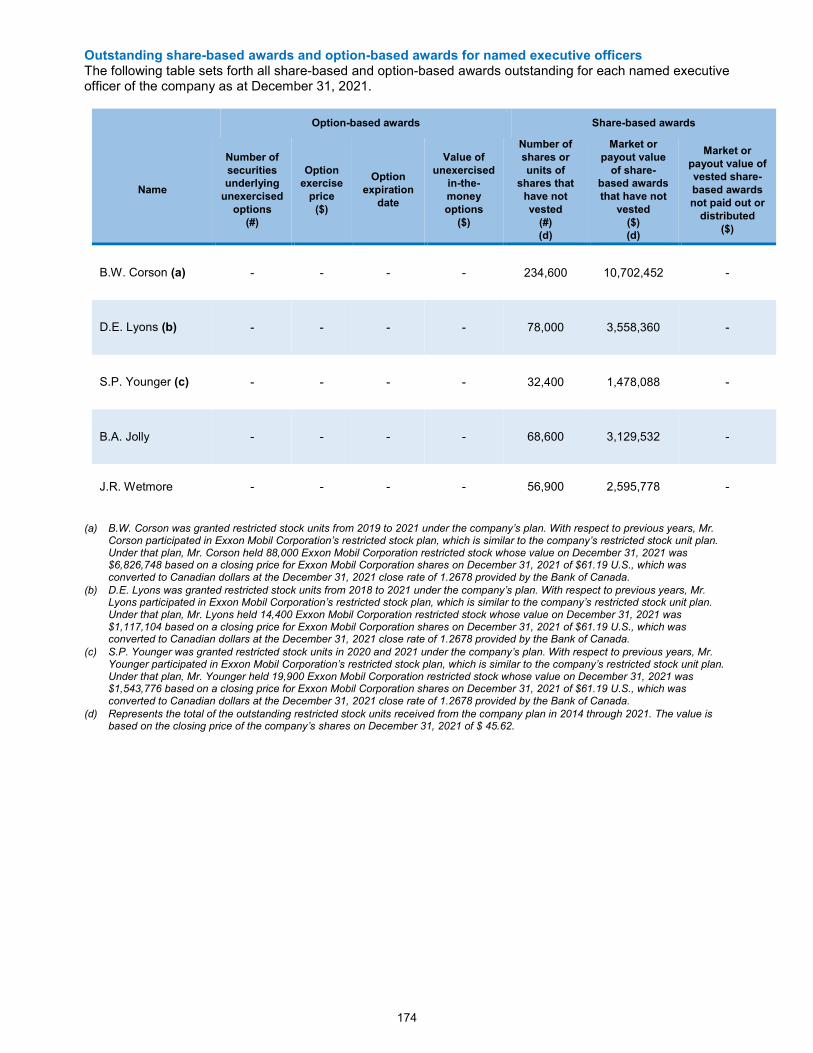
174
Outstanding share-based awards and option-based awards for named executive officers The following table sets forth all share-based and option-based awards outstanding for each named executive officer of the company as at December 31, 2021.
Option-based awards Share-based awards
Name
Number of securities underlying
unexercised options
(#)
Option exercise
price ($)
Option expiration
date
Value of unexercised
in-the-money options
($)
Number of shares or units of
shares that have not vested
(#) (d)
Market or payout value
of share-based awards that have not
vested ($) (d)
Market or payout value of vested share-based awards not paid out or
distributed ($)
B.W. Corson (a) - - - - 234,600 10,702,452 -
D.E. Lyons (b) - - - - 78,000 3,558,360 -
S.P. Younger (c) - - - - 32,400 1,478,088 -
B.A. Jolly - - - - 68,600 3,129,532 -
J.R. Wetmore - - - - 56,900 2,595,778 -
(a) B.W. Corson was granted restricted stock units from 2019 to 2021 under the company’s plan. With respect to previous years, Mr.
Corson participated in Exxon Mobil Corporation’s restricted stock plan, which is similar to the company’s restricted stock unit plan. Under that plan, Mr. Corson held 88,000 Exxon Mobil Corporation restricted stock whose value on December 31, 2021 was $6,826,748 based on a closing price for Exxon Mobil Corporation shares on December 31, 2021 of $61.19 U.S., which was converted to Canadian dollars at the December 31, 2021 close rate of 1.2678 provided by the Bank of Canada.
(b) D.E. Lyons was granted restricted stock units from 2018 to 2021 under the company’s plan. With respect to previous years, Mr. Lyons participated in Exxon Mobil Corporation’s restricted stock plan, which is similar to the company’s restricted stock unit plan. Under that plan, Mr. Lyons held 14,400 Exxon Mobil Corporation restricted stock whose value on December 31, 2021 was $1,117,104 based on a closing price for Exxon Mobil Corporation shares on December 31, 2021 of $61.19 U.S., which was converted to Canadian dollars at the December 31, 2021 close rate of 1.2678 provided by the Bank of Canada.
(c) S.P. Younger was granted restricted stock units in 2020 and 2021 under the company’s plan. With respect to previous years, Mr. Younger participated in Exxon Mobil Corporation’s restricted stock plan, which is similar to the company’s restricted stock unit plan. Under that plan, Mr. Younger held 19,900 Exxon Mobil Corporation restricted stock whose value on December 31, 2021 was $1,543,776 based on a closing price for Exxon Mobil Corporation shares on December 31, 2021 of $61.19 U.S., which was converted to Canadian dollars at the December 31, 2021 close rate of 1.2678 provided by the Bank of Canada.
(d) Represents the total of the outstanding restricted stock units received from the company plan in 2014 through 2021. The value is based on the closing price of the company’s shares on December 31, 2021 of $ 45.62.
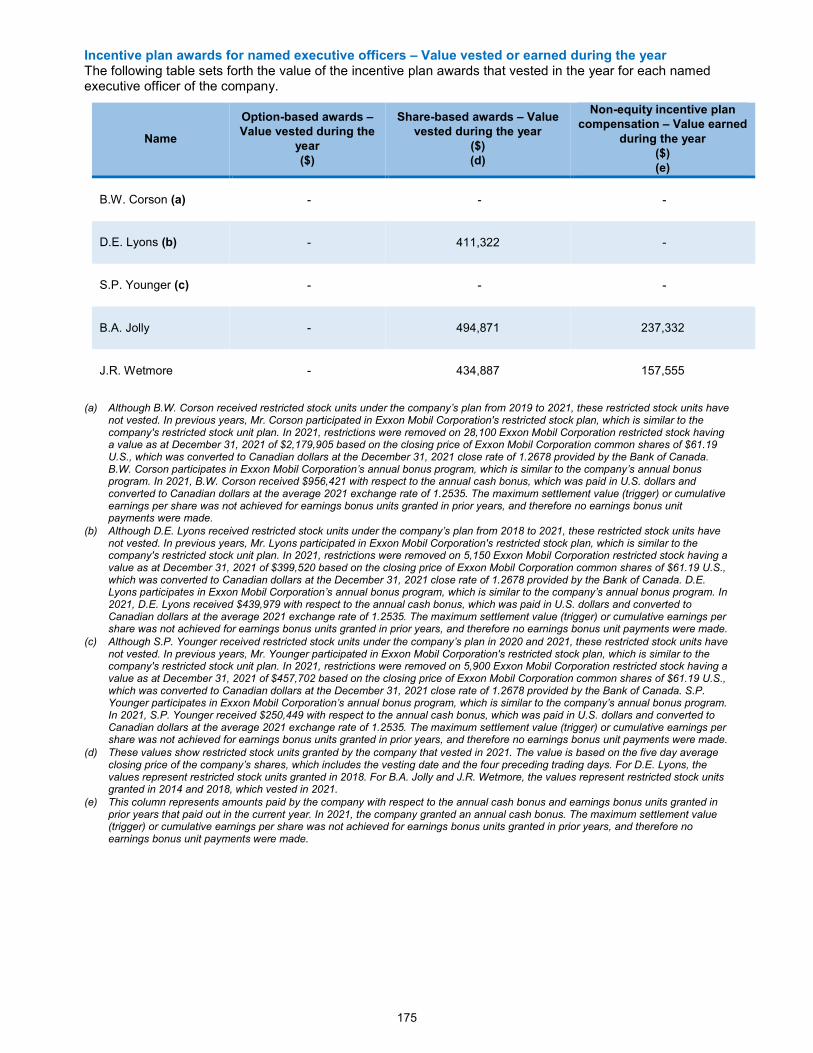
175
Incentive plan awards for named executive officers – Value vested or earned during the year The following table sets forth the value of the incentive plan awards that vested in the year for each named executive officer of the company.
Name
Option-based awards – Value vested during the
year ($)
Share-based awards – Value vested during the year
($) (d)
Non-equity incentive plan compensation – Value earned
during the year ($) (e)
B.W. Corson (a) - - -
D.E. Lyons (b) - 411,322 -
S.P. Younger (c) - - -
B.A. Jolly - 494,871 237,332
J.R. Wetmore - 434,887 157,555
(a) Although B.W. Corson received restricted stock units under the company’s plan from 2019 to 2021, these restricted stock units have not vested. In previous years, Mr. Corson participated in Exxon Mobil Corporation's restricted stock plan, which is similar to the company's restricted stock unit plan. In 2021, restrictions were removed on 28,100 Exxon Mobil Corporation restricted stock having a value as at December 31, 2021 of $2,179,905 based on the closing price of Exxon Mobil Corporation common shares of $61.19 U.S., which was converted to Canadian dollars at the December 31, 2021 close rate of 1.2678 provided by the Bank of Canada. B.W. Corson participates in Exxon Mobil Corporation’s annual bonus program, which is similar to the company’s annual bonus program. In 2021, B.W. Corson received $956,421 with respect to the annual cash bonus, which was paid in U.S. dollars and converted to Canadian dollars at the average 2021 exchange rate of 1.2535. The maximum settlement value (trigger) or cumulative earnings per share was not achieved for earnings bonus units granted in prior years, and therefore no earnings bonus unit payments were made.
(b) Although D.E. Lyons received restricted stock units under the company’s plan from 2018 to 2021, these restricted stock units have not vested. In previous years, Mr. Lyons participated in Exxon Mobil Corporation's restricted stock plan, which is similar to the company's restricted stock unit plan. In 2021, restrictions were removed on 5,150 Exxon Mobil Corporation restricted stock having a value as at December 31, 2021 of $399,520 based on the closing price of Exxon Mobil Corporation common shares of $61.19 U.S., which was converted to Canadian dollars at the December 31, 2021 close rate of 1.2678 provided by the Bank of Canada. D.E. Lyons participates in Exxon Mobil Corporation’s annual bonus program, which is similar to the company’s annual bonus program. In 2021, D.E. Lyons received $439,979 with respect to the annual cash bonus, which was paid in U.S. dollars and converted to Canadian dollars at the average 2021 exchange rate of 1.2535. The maximum settlement value (trigger) or cumulative earnings per share was not achieved for earnings bonus units granted in prior years, and therefore no earnings bonus unit payments were made.
(c) Although S.P. Younger received restricted stock units under the company’s plan in 2020 and 2021, these restricted stock units have not vested. In previous years, Mr. Younger participated in Exxon Mobil Corporation's restricted stock plan, which is similar to the company's restricted stock unit plan. In 2021, restrictions were removed on 5,900 Exxon Mobil Corporation restricted stock having a value as at December 31, 2021 of $457,702 based on the closing price of Exxon Mobil Corporation common shares of $61.19 U.S., which was converted to Canadian dollars at the December 31, 2021 close rate of 1.2678 provided by the Bank of Canada. S.P. Younger participates in Exxon Mobil Corporation’s annual bonus program, which is similar to the company’s annual bonus program. In 2021, S.P. Younger received $250,449 with respect to the annual cash bonus, which was paid in U.S. dollars and converted to Canadian dollars at the average 2021 exchange rate of 1.2535. The maximum settlement value (trigger) or cumulative earnings per share was not achieved for earnings bonus units granted in prior years, and therefore no earnings bonus unit payments were made.
(d) These values show restricted stock units granted by the company that vested in 2021. The value is based on the five day average closing price of the company’s shares, which includes the vesting date and the four preceding trading days. For D.E. Lyons, the values represent restricted stock units granted in 2018. For B.A. Jolly and J.R. Wetmore, the values represent restricted stock units granted in 2014 and 2018, which vested in 2021.
(e) This column represents amounts paid by the company with respect to the annual cash bonus and earnings bonus units granted in prior years that paid out in the current year. In 2021, the company granted an annual cash bonus. The maximum settlement value (trigger) or cumulative earnings per share was not achieved for earnings bonus units granted in prior years, and therefore no earnings bonus unit payments were made.

176
Equity compensation plan information The following table provides information on the common shares of the company that may be issued as of the end of 2021 pursuant to compensation plans of the company.
Plan category
Number of securities to be issued upon exercise of outstanding options,
warrants and rights (#) (c)
Weighted average exercise price of
outstanding options, warrants and rights
($)
Number of securities remaining available for future issuance under equity compensation plans (excluding securities
reflected in the first column) (#) (c)
Equity compensation plans approved by security holders (a)
- - -
Equity compensation plans not approved by security holders (b)
1,743,315 - 8,724,347
Total 1,743,315 - 8,724,347
(a) The company’s stock option plan expired in 2012. (b) This is a restricted stock unit plan, which is described starting on page 163. (c) The Number of securities to be issued represents the total number of restricted stock units issued since 2011 and still outstanding
(3,950,615) minus the outstanding restricted stock units that are only eligible for cash (and not common shares) upon vesting (2,207,300). The Number of securities remaining available for future issuance represents the restricted stock units not yet granted (6,517,047) plus the number of outstanding restricted stock units that are only eligible for cash (and not common shares) upon vesting (2,207,300).
Restricted stock units as a percentage of outstanding shares The following table provides information on the restricted stock unit plan, expressed as a number and as a percentage of the common shares of the company as of the end of 2021.
Maximum number of restricted stock units
issuable under the plan (#) (b)
Total number of restricted stock units
awarded and outstanding
(#)
Total number of restricted stock units available for grant
(#)
Number 10,468,037 3,950,615 6,517,422
Percent of outstanding common shares (a)
1.54% 0.58% 0.96%
(a) As of December 31, 2021, the number of common shares outstanding was 678,079,864. (b) The maximum number of restricted stock units issuable under the company plan is the number as of December 31, 2020
(10,474,762) minus the common shares issued in 2021 pursuant to the vesting of restricted stock units under the plan (6,725 common shares).

177
Annual burn rate The following table provides the annual burn rate associated with the restricted stock unit plan for each of the company’s three most recent fiscal years. The annual burn rate is the number of restricted stock units granted as a percentage of the weighted average number of outstanding shares of the company, which provides a measure of how quickly a company is using its available shares for incentive purposes.
Number of restricted stock units granted
under the plan (#) (a)
Weighted average number of securities
outstanding (#) (b)
Annual burn rate (%) (c)
2021 680,720 711,602,150 0.10%
2020 747,040 735,285,422 0.10%
2019 854,800 762,680,114 0.11%
(a) The number of restricted stock units granted under the plan in the applicable fiscal year. (b) The weighted average number of securities outstanding during the period is the number of securities outstanding at the beginning of
the period, adjusted by the number of securities bought back or issued during the period multiplied by a time-weighting factor. (c) The annual burn rate percent is calculated as the number of restricted stock units granted under the plan divided by the weighted
average number of securities outstanding.
Status of prior long-term incentive compensation plans The company’s only long-term incentive compensation plan is the restricted stock unit plan described starting on page 163. There are no units outstanding for any historical plan. Pension plan benefits The following table provides information for each named executive officer of the company participating in a defined benefit pension plan. Information for named executive officers on assignment from affiliates of the company who participate in a plan provided by such affiliates is disclosed in the footnotes.
Name
Number of years credited service
(as of December
31, 2021) (#) (a)
Annual benefits payable
($)
Opening present value of defined benefit
obligation ($) (d)
Compensatory change
($) (e)
Non-compensatory
change ($) (f)
Closing present value of defined benefit
obligation ($) (d)
At year- end (b)
At age 65 (c)
B.W. Corson - - - - - - -
D.E. Lyons - - - - - - -
S.P. Younger (g) - - - - - - -
B.A. Jolly 30.5 267,700 364,600 5,546,900 268,900 (68,300) 5,747,500
J.R. Wetmore 27.5 239,200 394,100 5,092,200 56,200 (111,500) 5,036,900

178
Footnotes to the Pension plan benefits table for named executive officers (a) B.W. Corson and D.E. Lyons participate in the Exxon Mobil Corporation defined benefit pension plan including tax-qualified and
non-qualified plans. Benefits under this plan are payable in U.S. dollars and have been converted to Canadian dollars at the average 2021 exchange rate of 1.2535. Under this plan, Mr. Corson had 38.5 years of credited service and Mr. Lyons had 31.5 years of credited service. S.P. Younger participates in the Esso Australia Pty Ltd. defined benefit and defined contribution pension plans. Benefits under these plans are payable in Australian dollars and have been converted to Canadian dollars at the average 2021 exchange rate of 0.9421. Under these plans, Mr. Younger had 24.8 years of credited service.
(b) For members of the company’s pension plan, the annual benefits include the amount of the accrued annual lifetime pension from the company’s registered pension plan and supplemental pension arrangement. Benefits under the supplemental pension arrangement can be paid as a lump-sum equivalent upon retirement. For members of the Exxon Mobil Corporation’s pension plan, the annual benefits include the accrued annual lifetime pension from the tax-qualified and the annual amount calculated under the non-qualified plans. For B.W. Corson, this value was $1,044,457. For D.E. Lyons, this value was $477,008. Non-qualified plan benefits are payable only as a lump-sum equivalent upon retirement. For members of the Esso Australia Pty Ltd. defined benefit plan, benefits are payable as lump-sum equivalent or annual lifetime pension upon retirement for participants age 55 and older. For S.P. Younger, this is not applicable as his age is under 55 years, and therefore he is not currently entitled to pension if leaving service.
(c) For members of the company’s pension plan, the annual benefits include the amount of the accrued annual lifetime pension from the company’s registered pension plan and supplemental pension arrangement that would be earned to age 65 assuming final average earnings as at December 31, 2021. Benefits under the supplemental pension arrangement can be paid as a lump-sum equivalent upon retirement. For members of the Exxon Mobil Corporation’s pension plan, the annual benefits include the annual lifetime pension from the tax-qualified and the annual amount calculated under the non-qualified plans that would be earned to age 65 assuming final average earnings as at December 31, 2021. For B.W. Corson, this value was $1,177,635. For D.E. Lyons, this value was $565,710. Non-qualified plan benefits are payable only as a lump-sum equivalent upon retirement. For members of the Esso Australia Pty. Ltd. defined benefit plan, benefits are payable as an annual lifetime pension or a lump-sum equivalent upon retirement or a combination of both, as elected by the participant upon leaving service. For S.P. Younger, the lump-sum value that would be earned to age 65, assuming final average earnings as of December 31, 2021 was $354,950.
(d) For members of the company’s pension plan, the opening and closing defined benefit obligation is defined under U.S. Generally Accepted Accounting Principles (GAAP) and values are calculated on a basis that is consistent with the valuation that was performed for accounting purposes for the company’s plans. The value is calculated based on estimated earnings eligible for pension as described previously and Yearly Maximum Pensionable Earnings (YMPE) as defined by the Canada Revenue Agency, projected to retirement and pro-rated on service to the date of valuation. The calculations assume that the Canada Pension Plan offset is based on the annual maximum benefit at retirement and the Old Age Security (OAS) offset is based on the OAS benefit at the date of valuation, projected to retirement. For members of the Exxon Mobil Corporation and Esso Australia Pty Ltd. pension plan respectively, the opening and closing defined benefit obligation is defined under GAAP and values are consistent with the valuation performed for accounting purposes for the applicable affiliate plan. The values are calculated based on estimated earnings eligible for pension as described previously. For B.W. Corson, the opening value was $12,805,868 and the closing value was $15,421,128. For D.E. Lyons, the opening value was $5,991,390 and the closing value was $7,186,059. For S.P. Younger, the opening value was $3,231,521 and the closing value was $3,109,701.
(e) The value for “Compensatory change” includes service cost for 2021 and the impact of change in earnings on the projected benefit obligation. For members of the company’s plan, these values are calculated using the individual’s additional pensionable service in 2021 and the actual salary and bonus received in 2021. For members of the Exxon Mobil Corporation and Esso Australia Pty Ltd. pension plans, these values are calculated using the individual’s additional pensionable service in 2021 and earnings as described previously. For B.W. Corson, this value was ($1,200,091). For D.E. Lyons, this value was ($463,757). For S.P. Younger, this value was ($74,865).
(f) The value for “Non-compensatory change” includes the impact of experience not related to earnings, benefit payments and change in measurement assumptions. With respect to the company’s pension plan, the discount rate used to determine the closing present value of defined benefit obligation at the end of 2021 increased to 3.0 percent, from 2.5 percent at the end of 2020, which had a negative impact on the non-compensatory change element. For members of the Exxon Mobil Corporation and Esso Australia Pty Ltd., the value for "Non-compensatory change" includes the impact of experience not related to earnings or service. For the Exxon Mobil Corporation’s plan, this includes the effect of interest based on a discount rate of 3.0 percent at the end of 2021, up from 2.8 percent at the end of 2020. For the Esso Australia Pty Ltd. Plan, this includes the effect of interest based on a discount rate of 3.0 percent at the end of 2021, up from 2.1 percent at the end of 2020. For B.W. Corson, this value was $1,415,169. For D.E. Lyons, this value was $730,912. For S.P. Younger, this value was ($196,685).
(g) S.P. Younger participates in the Esso Australia Pty Ltd. defined contribution plan. Contribution limits under this plan have been reached. The “Accumulated value at start of year” was $40,983, the “Compensatory value” was $6,897 reflecting affiliate contribution and investment earnings, and the “Accumulated value at year-end” was $47,880.

179
Appendix A – Board of director and committee charters
The structure, process and responsibilities of the board of directors of the corporation shall include the following items and matters: 1. Responsibility
The directors shall be responsible for the stewardship of the corporation. 2. Duty of care
The directors, in exercising their powers and discharging their duties, shall:
(a) act honestly and in good faith with a view to the best interests of the corporation; and
(b) exercise the care, diligence and skill that a reasonably prudent person would exercise in comparable circumstances.
3. Stewardship process
In order to carry out their responsibility for stewardship within their duty of care, the directors shall, directly or through one or more committees of directors,
(a) contribute to the formulation of and approve strategic plans on at least an annual basis;
(b) identify the principal risks of the corporation's business where identifiable and oversee the implementation of appropriate systems to manage such risks;
(c) oversee succession planning for senior management, including the appointing, training and monitoring thereof;
(d) approve the corporate disclosure guidelines and monitor the external communications of the corporation;
(e) monitor the integrity of the corporation's internal control and management information systems;
(f) monitor the integrity of the corporation's information technology and systems to ensure the security and integrity of the corporation’s electronic information, systems and assets;
(g) consider management's recommendations regarding major corporation decisions and actions, which have significant societal implications;
(h) monitor compliance with major corporate policies;
(i) charge the chief executive officer of the corporation with the general management and direction of the business and affairs of the corporation;
(j) monitor the performance of the chief executive officer;
(k) satisfy itself as to the integrity of the chief executive officer and other executive officers and ensure that the chief executive officer and the other executive officers create a culture of integrity throughout the company;
(l) annually review and approve the corporation's code of ethics and business conduct;
(m) monitor compliance with the code of ethics and business conduct, provided that any waivers from the code that are granted for the benefit of the issuer's directors or executive officers should be granted by the board only;
(n) determine appropriate measures are in place for receiving feedback from stakeholders;
Board of Directors Charter

180
(o) by appropriate charter resolutions, establish the audit, executive resources, nominations and corporate governance, public policy and corporate responsibility and community collaboration and engagement committees of the board with specific duties defined and the corporation provide each board committee with sufficient funds to discharge its responsibilities in accordance with its charter;
(p) determine membership of each committee, including its chair and vice-chair, after receiving the recommendation of the nominations and corporate governance committee;
(q) direct the distribution to the board by management of information that will enhance their familiarity with the corporation's activities and the environment in which it operates, as set out in section 5;
(r) review the corporation’s process in respect of employee conflicts of interest and directorships in non-affiliated commercial, financial and industrial organizations and the disclosures thereof;
(s) review the mandates of the board and of the committees and their effectiveness at least annually; and
(t) undertake such additional activities within the scope of its responsibilities as it may deem appropriate. 4. Range of items to be considered by the board
The following categories and specific items shall be referred to the board for information or decision on a regularly scheduled basis, to the extent appropriate:
Organization/legal
fixing of the number of directors director appointments to fill interim vacancies director slate for election by the shareholders officer appointments
board governance processes by-laws and administrative resolutions changes in fundamental structure of the corporation shareholder meeting notice and materials non-employee director compensation policies adopted by the board investigations and litigation of a material nature
Financial
equity or debt financing dividend declarations financial statements and the related management discussion and analysis, annual and
quarterly
status of the corporation's retirement plan and employee savings plan Strategic/investment/operating plans/performance
near-term and long-range outlooks capital, lease, loan and contributions budgets annually budget additions over $250 million individually quarterly updates of actual and projected capital expenditures capital expenditures or dispositions in excess of $250 million individually entering into any venture that is outside of the corporation's existing businesses financial and operating results quarterly
Canadian and world economic outlooks regional socio-economic reviews corporate reputation reviews risk management reviews environment and sustainability reviews personnel and process safety systems and performance reviews information technology, systems and cybersecurity

181
In addition to the items which are specific to the categories identified above, the chief executive officer shall refer to the board for information or decision all other items of corporate significance; and any member of the board may request a review of any such item. Items to be referred to the committees of the board are specified in their respective charters.
5. Information to be received by the board
Material shall be distributed to directors through the office of the corporate secretary. Corporate policies, board calendars, contact information and other company processes, are updated on the board portal site and accessible to all directors.
Material under the following general headings, including the specific items listed below and only other similar items, shall be distributed to directors on a regular basis:
Organization/legal
articles of incorporation, by-laws and administrative resolutions corporate policies corporate data board and management processes financial and operating report organization outline
Social/political/economic environment
public issues updates economic outlook external communications packages information technology, systems and cybersecurity updates
Major announcements
press releases speeches by management organization changes
Communications to shareholders Other significant submissions, studies and reports
6. Meetings of the board
(a) The board normally holds seven (7) regular meetings per year. Additional meetings may be scheduled as required to consider the range of items charged for consideration by the board.
(b) An agenda for each board meeting and briefing materials will, to the extent practicable in light of the timing of matters that require board attention, be distributed to each director approximately five to seven days prior to each meeting. The chairman, in consultation with the chair of the executive sessions will normally set the agenda for board meetings. Any director may request the inclusion of specific items.
(c) It is expected that each director will make every effort to attend each board meeting and each meeting of any committee on which he or she serves. Attendance in person is preferred but attendance by teleconference is permitted if necessary.
(d) Each director should be familiar with the agenda for each meeting, have carefully reviewed all other materials distributed in advance of the meeting, and be prepared to participate meaningfully in the meeting, and to discuss all scheduled items of business.
(e) The proceedings and deliberations of the board and its committees are confidential. Each director will maintain the confidentiality of information received in connection with his or her service as a director, and the chief executive officer, or those whom he or she has designated, will speak for the corporation.

182
7. Independent directors
(a) The board shall be composed of a majority of independent directors. The board may also include one or more directors who are not independent, but who, as officers of the majority shareholder, may be viewed as independent of the company’s management.
(b) In respect of each director to be appointed to fill a vacancy and each director to be nominated for election or re-election by the shareholders, the board shall make an express determination as to whether he or she is an independent director and, for a director who may become a member of the audit committee, whether he or she is an audit committee financial expert or financially literate.
(c) The term "independent", shall have the meaning as set out in applicable law, including on the basis of the standards specified by National Instrument 52-110 Audit Committees, the US. Securities and Exchange Commission rules and the listing standards of the NYSE American LLC.
(d) Independent directors will have full access to senior management of the corporation and other employees on request to discuss the business and affairs of the corporation. The board expects that there will be regular opportunities for directors to meet with the chief executive officer, and other members of management in board and committee meetings and in other formal or informal settings.
(e) Compensation for independent directors will be determined by the board on the recommendation of the nominations and corporate governance committee and will be reviewed annually. Non-employee director compensation will be set at a level that is consistent with market practice, taking into account the size and scope of the corporation’s business and the responsibilities of its directors. A substantial portion of the compensation paid to independent directors for service on the board will be paid in restricted stock units of the corporation.
8. Independent legal or other advice
It is normally expected that information regarding the corporation’s business and affairs will be provided to the board by the corporation’s management and staff and by its independent auditors. However, the board and, with the approval of the board, any director, may engage independent counsel and other advisors at the expense of the corporation. The fees and expenses of any such advisor will be paid by the corporation. 9. Meetings of the independent directors in the absence of members of management
(a) Meetings of the independent directors ("executive sessions of the board") shall be held in conjunction with all board meetings including unscheduled telephonic board meetings. Additional executive sessions may be convened by the chair or the executive sessions at his or her discretion and will be convened if requested by any other director. Any independent director may raise issues for discussion at an executive session.
(b) The chair of the executive sessions of the board shall be chosen by the independent directors. (c) The chair of the executive sessions of the board, or in the chair's absence an independent director
chosen by the independent directors, shall (i) preside at executive sessions of the board; (ii) ensure that meetings of the independent directors are held in accordance with this charter; (iii) review, and modify if necessary the agenda of the meetings of the board in advance to ensure
that the board may successfully carry out its duties; and (iv) act as a liaison with the chairman, including providing feedback from the executive sessions to
the chairman, provided that each director will also be afforded direct and complete access to the chairman at any time as such director deems necessary or appropriate.

183
(d) The purposes of the executive sessions of the board shall include the following: (i) to raise substantive issues that are more appropriately discussed in the absence of
management; (ii) to discuss the need to communicate to the chairman of the board any matter of concern raised
by any committee or any director; (iii) to address issues raised but not resolved at meetings of the board and assess any follow-up
needs with the chairman of the board; (iv) to discuss the quality, quantity, and timeliness of the flow of information from management
that is necessary for the independent directors to effectively and responsibly perform their duties, and advise the chairman of the board of any changes required; and
(v) to seek feedback about board processes.
10. Selection and tenure of directors
The nominations and corporate governance committee shall recommend to the board a slate of director candidates for election at each annual meeting of shareholders and shall recommend to the board directors to fill vacancies, including vacancies created as a result of any increase of the size of the board. The guidelines for selection and tenure of directors shall be as follows:
(a) Selection In considering the qualifications of potential nominees for election as directors, the nominations and corporate governance committee considers the work experience and other areas of expertise of the potential nominees with the objective of providing for diversity among non-employee directors. The following key criteria are considered to be relevant to the work of the board of directors and its committees:
Work Experience
Experience in leadership of businesses or other large organizations (Leadership of large organizations)
Operations/technical experience (Operations / technical) Project management experience (Project management) Experience in working in a global work environment (Global experience) Experience in development of business strategy (Strategy development) Experience with environmental, health, community relations and/or safety policy, practices and
management (Environment and sustainability)
Other Expertise
Audit committee financial expert Expertise in financial matters (Financial expertise) Expertise in managing relations with government (Government relations) Experience in academia or in research (Academic / research) Expertise in information technology and cybersecurity oversight (Information technology /
Cybersecurity oversight)
Expertise in executive compensation policies and practices (Executive compensation) Expertise in oversight of risk management policies and practices (Risk management)
In addition, the nominations and corporate governance committee may consider the following additional factors:
possessing expertise in any of the following areas: law, science, marketing, administration, social/political environment or community and civic affairs;
individual competencies in business and other areas of endeavour in contributing to the collective experience of the directors; and
providing diversity in age, regional association, gender and other diversity elements (including Aboriginal peoples, persons with disabilities and members of visible minorities).
184
The nominations and corporate governance committee shall then assess what work experience and other expertise each existing director possesses. The nominations and corporate governance committee shall identify individuals qualified to become new board members and recommend to the board the new director nominees. In making its recommendations, the nominations and corporate governance committee shall consider the work experience and other expertise that the board considers each existing director to possess and which each new nominee will bring. The nominations and corporate governance committee may also consider the additional factors noted above and any other factors which it believes to be relevant. A candidate may be nominated for directorship after consideration has been given as to his or her degree of compatibility with the following criteria, i.e., as to whether he or she:
will not adversely affect the requirements with respect to citizenship and residency for the directors imposed by the Canada Business Corporations Act;
will not adversely affect the corporation’s status as a foreign private issuer under U.S. securities
legislation;
possesses the ability to contribute to the broad range of issues with which the directors and any one or all of the committees of directors must deal;
will serve on the boards of other public companies only to the extent that such services do not detract from the director’s ability to devote the necessary time and attention as a director;
is able to devote the necessary amount of time to prepare for and attend all meetings of the
directors and committees of directors, and to keep abreast of significant corporate developments; is free of any present or apparent potential legal impediment or conflict of interest, such as:
o serving as an employee or principal of any organization presently providing a significant level of service to the corporation or which might so provide to the corporation, for example, institutions engaged in commercial banking, underwriting, law, management consulting, insurance, or trust companies; or of any substantial customer or supplier of the corporation;
o serving as an employee or director of a competitor of the corporation, such as petroleum
or chemical businesses, or of a significant competitor of corporations represented by a director of this corporation;
o serving as the chief executive officer or a top administrator of an organization that has the
chief executive officer or a top administrator of this corporation serving as director;
is expected to remain qualified to serve for a minimum of five years;
will not, at the time that he or she stands for election or appointment, have attained the age of 72;
if an independent director, is, or will become within a period of five years of becoming a director, the beneficial owner, directly or indirectly, of not less than 16,500 common shares, deferred share units or restricted stock units of the corporation.
(b) Tenure
(i) Re-nomination An incumbent director shall be supported for re-nomination as long as he or she:
does not suffer from any disability that would prevent the effective discharge of his or her responsibilities as a director;
makes a positive contribution to the effective performance of the directors;
regularly attends directors’ and committee meetings;

185
has not made a change with respect to principal position or thrust of involvement or regional association that would significantly detract from his or her value as a director of the corporation;
is not otherwise, to a significant degree, incompatible with the criteria established for use in the selection process;
in a situation where it is known that a director will become incompatible with the criteria
established for use in the selection process within a three-month period of election, such as retirement from principal position at age 65, this information would be included in the management proxy circular, and where possible, information regarding the proposed replacement would also be included;
will not, at the time that he or she stands for re-election, have attained the age of 72; however, under exceptional circumstances, at the request of the chairman, the nominations and corporate governance committee may continue to support the nomination.
(ii) Resignation An incumbent director will resign in the event that he or she:
experiences a change in circumstances such as a change in his or her principal occupation, including an officer of the corporation ceasing to hold that position, but not merely a change in geographic location;
displays a change in the exercise of his or her powers and in the discharge of duties that, in the opinion of at least 75 percent of the directors, is incompatible with the duty of care of a director as defined in the Canada Business Corporations Act;
has made a change in citizenship or residency that will adversely affect the requirements for directors with respect to those areas imposed by the Canada Business Corporations Act;
has made a change in citizenship or residency that adversely affects the corporation’s status as a foreign private issuer under U.S. securities legislation;
develops a conflict of interest, such as o assuming a position as an employee or principal with any organization providing a
significant level of service to the corporation, for example, institutions engaged in commercial banking, underwriting, law, management consulting, insurance, or trust companies; or with any substantial customer or supplier of the corporation;
o assuming a position as an employee or director of any competitor of the corporation, such
as petroleum or chemical businesses, or of a competitor of corporations represented by a director of this corporation;
o assuming the position of chief executive officer or a top administrator of an organization that
has the chief executive officer or a top administrator of this corporation serving as a director; o becomes unable to devote the necessary amount of time to prepare for and regularly attend
meetings of the directors and committees of directors, and to keep abreast of significant corporate developments,
and the nominations and corporate governance committee will make a recommendation to the board as to whether to accept or reject such resignation.

186
11. Election of Directors
All directors will stand for election at the annual meeting of shareholders. If the majority shareholder’s holdings were ever to fall below 50% for any non-contested elections of directors, any director nominee who receives a greater number of votes “withheld” from his or her election than votes “for” in such election shall tender his or her resignation. Within 90 days after certification of the election results, the board will decide, through a process managed by the nominations and corporate governance committee and excluding the nominee in question, whether to accept the resignation. Absent a compelling reason for the director to remain on the board, the board shall accept the resignation. The board will promptly disclose and, if applicable, the reasons for rejecting the tendered resignation. 12. Director Orientation and Continuing Education
(a) Orientation New non-employee directors will receive a comprehensive orientation from appropriate executives regarding the corporation’s business and affairs. (b) Continuing Education Reviews of aspects of the corporation’s operations will be presented by appropriate employees from time to time as part of the agenda of regular board meetings. The board will also normally conduct an on-site visit to a location other than the corporation’s headquarters in conjunction with one or more regular board meetings every year.
13. Chairman and chief executive officer
The board currently believes that it is appropriate and efficient for the corporation’s chief executive officer to also act as chairman of the board. However, the board retains the authority to separate those functions if it deems such action appropriate in the future.
(a) Position description The chairman and chief executive officer shall:
plan and organize all activities of the board of directors; ensure that the board receives sufficient, timely information on all material aspects of the
corporation's operations and financial affairs; chair annual and special meetings of the shareholders; conduct the general management and direction of the business and affairs of the
corporation; recommend to the board of directors a strategic plan for the corporation's business and,
when approved by the board of directors, implement this strategic plan and report to the board of directors on the implementation of this strategic plan;
develop and implement operational policies to guide the corporation within the limits prescribed by the corporation's by-laws and the directions adopted by the board of directors;
identify, for review with the board of directors, the principal risks of the corporation's business, where identifiable, and develop appropriate systems to manage such risks;
under the oversight of the board of directors, develop plans for succession planning for senior management, including the appointing, training and monitoring thereof, and implement those plans;
ensure compliance with the corporation's code of ethics and business conduct so as to foster a culture of integrity throughout the company; and
ensure effective internal controls and management information systems are in place.
(b) Minimum shareholding requirements The chairman and chief executive officer shall hold, or shall, within three years after his appointment as chairman and chief executive officer, acquire shares of the corporation, including common shares and restricted stock units, of a value no less than five times his base salary.

187
1. Purpose of the Committee
The primary purpose of the audit committee (the "committee") is oversight. The committee shall assist the board of directors (the "board") in fulfilling its responsibility to oversee:
management's conduct of the corporation's financial reporting process,
the integrity of the financial statements and other financial information provided by the corporation to Canadian securities regulators, the United States Securities and Exchange Commission (the "SEC") and the public,
the corporation's system of internal accounting and financial controls,
the corporation's compliance with legal and regulatory requirements,
the performance of the corporation's internal audit function,
the independent auditors' qualifications, performance, and independence, and
the annual independent audit of the corporation's financial statements.
The corporation's management is responsible for preparing the corporation's financial statements. The independent auditors are responsible for auditing those financial statements. Management, including the internal audit function, and the independent auditors, have more time, knowledge, and detailed information about the corporation than do committee members. Consequently, in carrying out its oversight responsibilities, the committee is not providing any expert or special assurance as to the corporation's financial statements, or any professional certification as to the independent auditors' work, including with respect to auditor independence. Each member of the committee shall be entitled to rely on the integrity of people and organizations from whom the committee receives information and the accuracy of such information, including representations by management and the independent auditors regarding non-audit services provided by the independent auditors.
2. Committee Membership
The committee shall consist of no fewer than three members. Committee members shall be appointed by the board from among its independent members who shall serve at the pleasure of the board, but only so long as he or she continues to be a director of the corporation and is independent. Each member of the committee must satisfy such criteria of independence as the board may establish and such additional regulatory or listing requirements as the board may determine to be applicable or appropriate. Each member of the committee shall serve only so long as he or she continues to be a director of the corporation and is independent. The actual number of members shall be determined from time to time by resolution of the board. Accordingly, each member of the committee shall be financially literate within a reasonable period of time after appointment to the committee; must be "independent" as defined in the board charter; and may not serve on more than two other public company audit committees unless the board determines that such simultaneous service would not impair the ability of the member to serve effectively on the committee. In addition, at least one member of the committee shall be an "audit committee financial expert" as defined by applicable laws.
3. Committee Structure and Operation
The chair and vice-chair of the committee shall be designated by the board from among the members of the committee. The committee shall fix its own rules of procedure and shall meet where and as provided by such rules or by resolution of the committee. In addition to the regular meeting schedule established by the committee, the chair of the committee may call a special meeting at any time.
Audit Committee Charter

188
The chair, or in that person's absence, the vice-chair or in the vice-chair's absence, an alternate designated by the committee, shall:
(a) preside at committee meetings;
(b) ensure that meetings of the committee are held in accordance with this charter; and
(c) review, and modify if necessary the agenda of the meetings of this committee in advance to ensure that the committee may effectively carry out its duties.
A majority of the members of the committee shall constitute a quorum thereof. Every question shall be decided by a majority of the votes cast on the question and in the case of an equality of votes, the chair of the meeting shall be entitled to a second or casting vote.
The committee shall designate its secretary.
Meetings of the committee may be called by any member or by the external auditors of the corporation, and notice of every meeting shall be given to the external auditors.
The external auditors and the internal auditor of the corporation shall report directly to the audit committee.
The committee shall act only on the affirmative vote of a majority of the members at a meeting or by unanimous written consent.
The committee may establish sub-committees to carry out such duties as the committee may assign.
4. Committee Activities
The following shall be the common recurring activities of the committee in carrying out its purposes. These activities are set forth as a guide with the understanding that the committee may diverge from this guide as appropriate given the circumstances.
The committee shall:
(a) recommend the external auditors to be appointed by the shareholders, review and recommend their remuneration to the board, approve advances on such remuneration, which shall be paid by the corporation, and oversee their work, including the resolution of disagreements between management and the external auditor regarding financial reporting.
(b) approve the proposed current year audit program of the external auditors and assess the results of the program after the end of the program period.
(c) approve in advance any non-audit services that are permitted by applicable law to be performed by the external auditors after considering the effect of such services on their independence.
(d) receive from the external auditors a formal written statement delineating all relationships between
the external auditor and the corporation consistent with Independence Standards Board Standard 1, and shall actively engage in a dialogue with the external auditor with respect to any disclosed relationships or services that may impact the objectivity and independence of the external auditor and shall recommend that the board take any appropriate action to oversee the independence of the external auditor.
(e) maintain hiring policies for employees and former employees of the independent auditors.
(f) establish procedures for the receipt, retention and treatment of complaints received by the corporation regarding accounting, internal accounting controls, or auditing matters and the confidential, anonymous submission by employees of the corporation of concerns regarding questionable accounting or auditing matters.
189
(g) approve the proposed current year audit program of the internal auditors and assess the results of the program after the end of each quarter.
(h) review the adequacy of the corporation's system of internal controls and auditing procedures.
(i) review the accounting and financial reporting processes of the corporation.
(j) approve changes proposed by management in accounting principles and practices, and review changes proposed by the accounting profession or other regulatory bodies which impact directly on such principles and practices.
(k) review the quarterly news release of financial and operating results, the annual and quarterly financial statements of the corporation, any accounting items affecting the statements and the overall format and content of the statements, and the related management discussion and analysis, prior to approval of such news release and financial statements by the board of directors.
(l) review the results of the corporation's business ethics compliance program.
(m) review annually a summary of senior management expense accounts.
(n) evaluate, along with the other members of the board, management, the controller, and the general auditor, the qualifications, performance and independence of the independent auditors, including the performance of the lead audit partner.
(o) require attendances at its meetings by members of management, as the committee may direct.
(p) undertake such additional activities within the scope of its responsibilities as it may deem appropriate.
5. Committee Evaluation
The committee will annually complete a self-evaluation of the committee's own performance and effectiveness and will consider whether any changes to the committee’s charter are appropriate.
6. Resources and Authority of the Committee
The committee has exclusive authority with respect to the retention of the independent auditors described in section 4 of this charter. In discharging its oversight role, the committee is empowered to investigate any matter brought to its attention with full access to all books, records, facilities, and personnel of the corporation. The committee also has the authority to retain outside advisors, including legal counsel, auditors, or other experts, as it deems appropriate; to approve the fees and expenses of such advisors; and to incur such other ordinary administrative expenses as are necessary or appropriate in carrying out its duties.
1. Purpose of the Committee The primary purpose of the public policy and corporate responsibility committee (the 'committee') is to review and provide advice, as the committee deems appropriate, regarding the corporation's policies, programs and practices on public issues of significance including their effects on safety, security, health and the environment. This includes environmental, health, personnel and process safety, security and sustainability risks and performance, including the risks associated with climate change. It also includes compliance with legislation and the assessment of long term impacts of public policy, climate change and sustainable business practices on corporate performance.
Public Policy and Corporate Responsibility Committee Charter

190
2. Committee Membership
The committee shall consist of no fewer than three members, to be appointed by the board of directors from among (a) the independent directors; and (b) the non-independent directors who are not members of the corporation's management, who shall serve at the pleasure of the board, but only so long as he or she continues to be a director of the corporation. The actual number of members shall be determined from time to time by resolution of the board. Members of the committee should be suitably knowledgeable in matters pertaining to public issues.
3. Committee Structure and Operation
The chair and vice-chair of the committee shall be designated by the board from among the members of the committee. The committee shall fix its own rules of procedure and shall meet where and as provided by such rules or by resolution of the committee. The chair, or in that person's absence, the vice-chair or in the vice-chair's absence, an alternate designated by the committee, shall:
(a) preside at committee meetings; (b) ensure that meetings of the committee are held in accordance with this charter; and
(c) review, and modify if necessary the agenda of the meetings of this committee in advance to ensure
that the committee may effectively carry out its duties. A majority of the members of the committee shall constitute a quorum thereof. Every question shall be decided by a majority of the votes cast on the question and in the case of an equality of votes, the chair of the meeting shall be entitled to a second or casting vote. The committee shall designate its secretary. Meetings of the committee may be called by any member. The committee shall act only on the affirmative vote of a majority of the members at a meeting or by unanimous written consent. The committee may establish subcommittees consisting of one or more members to carry out such duties as the committee may delegate. 4. Committee Activities
The following shall be the common recurring activities of the committee in carrying out its purpose. These activities are set forth as a guide with the understanding that the committee may diverge from this guide as appropriate given the circumstances.
The committee shall:
(a) review and monitor the effectiveness of the corporation's policies, programs and practices on environment, health, safety, security and sustainability, including the impact, risks and disclosure associated with climate change and greenhouse gas emissions, and make such recommendations to the board with respect thereto as it may deem advisable.
(b) monitor the corporation's compliance with legislative, regulatory and corporation standards for environmental, health, safety, security and sustainability practices and matters, including the impact, risks and disclosure associated with climate change and greenhouse gas emissions, and advise the directors on the results and adequacy thereof.
(c) monitor trends and review current and emerging public policy issues relating to matters of significance to the corporation, including environment, health, safety, security and sustainability issues and the impact, risks and disclosure associated with climate change and greenhouse gas emissions, as they may impact the corporation's operations.

191
(d) review the impact of proposed legislation relating to matters of significance to the corporation, including the impact of the environment, health, safety and security on the operations of the corporation and to advise the directors and management as to the appropriate response of the corporation thereto.
(e) recommend to the directors and management desirable policies and actions arising from its review and monitoring activity.
(f) require attendances at its meetings by members of management, as the committee may direct.
(g) undertake such additional activities within the scope of its responsibilities as it may deem appropriate.
5. Committee Evaluation
The committee will annually complete a self-evaluation of the committee's own performance and effectiveness and will consider whether any changes to the committee’s charter are appropriate.
6. Resources and Authority of the Committee
The committee has the authority to retain such outside advisors, including legal counsel or other experts, as it deems appropriate, and to approve the fees and expenses of such advisors.
1. Purpose of the Committee
The primary purpose of the executive resources committee (the “committee”) is to discharge the board of directors' (the “board”) responsibilities relating to the evaluation and compensation of the corporation's chief executive officer (the “CEO”) and certain other key senior executive management positions reporting directly to the CEO, including all officers of the corporation, and to discharge the responsibilities of the committee under applicable rules and regulations. The committee also makes recommendations to the board regarding succession planning and development for senior executives and positions as needed.
2. Committee Membership
The committee shall consist of no fewer than three members, to be appointed by the board of directors from among (a) the independent directors; and (b) the non-independent directors who are not members of the corporation's management, who shall serve at the pleasure of the board, but only so long as he or she continues to be a director of the corporation. The actual number of members shall be determined from time to time by resolution of the board. Members of the committee should be suitably knowledgeable in matters pertaining to executive compensation.
3. Committee Structure and Operation
The chair and vice-chair of the committee shall be designated by the board from among the members of the committee. The committee shall fix its own rules of procedure and shall meet where and as provided by such rules or by resolution of the committee.
The chair, or in that person's absence, the vice-chair or in the vice-chair's absence, an alternate designated by the committee, shall:
(a) preside at committee meetings;
(b) ensure that meetings of the committee are held in accordance with this charter; and
(c) review, and modify if necessary the agenda of the meetings of this committee in advance to ensure that the committee may effectively carry out its duties.
Executive Resources Committee Charter

192
A majority of the members of the committee shall constitute a quorum thereof. Every question shall be decided by a majority of the votes cast on the question and in the case of an equality of votes, the chair of the meeting shall be entitled to a second or casting vote.
The committee shall designate its secretary.
Meetings of the committee may be called by any member.
The committee shall act only on the affirmative vote of a majority of the members at a meeting or by unanimous written consent.
The committee may establish subcommittees consisting of one or more members to carry out such duties as the committee may delegate.
4. Committee Activities
The following shall be the common recurring activities of the committee in carrying out its purposes. These
activities are set forth as a guide with the understanding that the committee may diverge from this guide as
appropriate given the circumstances.
The committee shall:
(a) review and approve the corporate goals and objectives relevant to the compensation of the CEO.
(b) review data on competitive compensation practices and review and evaluate policies and programs through which the corporation compensates its employees.
(c) at least annually evaluate the CEO's performance as measured against the goals and objectives outlined above.
(d) approve salaries and other compensation (including supplemental compensation such as cash bonuses and incentive bonus units, long-term incentive compensation such as restricted stock units, and any other payments for service), for the CEO and other key senior executive management positions reporting directly to the CEO, including all officers of the corporation.
(e) at least annually review succession planning and development strategies for the CEO and key senior executive management positions reporting directly to the CEO, including all officers of the corporation.
(f) review the executive development system to ensure that it foresees the corporation’s senior management requirements and provides for early identification and development of key resources.
(g) review and approve an annual report on compensation for inclusion in the corporation’s management proxy circular in accordance with applicable legal requirements.
(h) make recommendations to the board with respect to incentive compensation plans and equity-based plans.
(i) review proposed terms of any new incentive program and any major amendment of an existing program, and make such recommendations to the board with respect thereto as it may deem advisable.
(j) review and report on risks arising from the corporation's compensation policies and practices for employees as required by Canadian securities regulators and stock exchanges on which the corporation’s stock trades.
(k) consider factors that could affect the independence or represent a conflict of interest on the part of any compensation consultant, independent legal counsel, or other adviser the committee may retain and report thereon as required by Canadian securities regulators and stock exchanges on which the corporation’s stock trades.
(l) require attendances at its meetings by members of management, as the committee may direct.
(m) undertake such additional activities within the scope of its responsibilities as it may deem appropriate.

193
5. Committee Evaluation
The committee will annually complete a self-evaluation of the committee's own performance and effectiveness and will consider whether any changes to the committee’s charter are appropriate.
6. Resources and Authority of the Committee
The committee and, with the approval of the committee, any member, may engage independent counsel, compensation consultants or other advisors at the expense of the corporation. The committee shall be directly responsible for the appointment, compensation and oversight of the work of any independent legal counsel, compensation consultant or other advisor retained by the committee. The committee may select outside legal counsel, a compensation consultant or other advisor (an “Advisor”) to the committee only after taking into consideration all factors relevant to the Advisor’s independence from management, including the following:
the provision of other services to the corporation by the person that employs the Advisor;
the amount of fees received from the corporation by the person that employs the Advisor as a percentage of such that person’s total revenue;
the policies and procedures of the person that employs the Advisor that are designed to prevent conflicts of interest;
any business or personal relationship of the Advisor with a member of the committee;
any stock of the corporation owned by the Advisor; and
any business or personal relationship of the Advisor or the person employing the Advisor with an executive officer of the corporation.
1. Purpose of the Committee
The primary purpose of the nominations and corporate governance committee (the 'committee') is to monitor
compliance with good corporate governance standards; to identify individuals qualified to become board members; to recommend to the board director nominees for election at the annual meeting of shareholders or
for election by the board to fill open seats between annual meetings; to recommend to the board committee appointments for directors, including appointments as chair and vice chair of such committees; to review and
make recommendations to the board regarding non-employee director compensation; and to develop and
recommend to the board corporate governance guidelines applicable to the corporation.
2. Committee Membership
The committee shall consist of no fewer than three members, to be appointed by the board of directors from among (a) the independent directors; and (b) the non-independent directors who are not members of the corporation's management, who shall serve at the pleasure of the board, but only so long as he or she continues to be a director of the corporation. The actual number of members shall be determined from time to time by resolution of the board. Members of the committee should be suitably knowledgeable in matters pertaining to corporate governance.
Nominations and Corporate Governance Committee Charter
194
3. Committee Structure and Operation
The chair and vice-chair of the committee shall be designated by the board from among the members of the committee. The committee shall fix its own rules of procedure and shall meet where and as provided by such rules or by resolution of the committee.
The chair, or in that person's absence, the vice-chair or in the vice-chair's absence, an alternate designated by the committee, shall:
(a) preside at committee meetings;
(b) ensure that meetings of the committee are held in accordance with this charter; and
(c) review, and modify if necessary the agenda of the meetings of this committee in advance to ensure that the committee may effectively carry out its duties.
A majority of the members of the committee shall constitute a quorum thereof. Every question shall be decided by a majority of the votes cast on the question and in the case of an equality of votes, the chair of the meeting shall be entitled to a second or casting vote.
The committee shall designate its secretary.
Meetings of the committee may be called by any member.
The committee shall act only on the affirmative vote of a majority of the members at a meeting or by unanimous written consent.
The committee may establish subcommittees consisting of one or more members to carry out such duties as the committee may delegate.
4. Committee Activities
The following shall be the common recurring activities of the committee in carrying out its purpose. These activities are set forth as a guide with the understanding that the committee may diverge from this guide as appropriate given the circumstances.
The committee shall:
(a) oversee issues of corporate governance as they apply to the corporation, including the
effectiveness of the system of corporate governance, and the board's relationship with management, and report to the board on such matters.
(b) oversee the annual assessment of the effectiveness and contribution of the board, its committees and each individual director.
(c) make recommendations to the board as to the appropriate size of the board with a view to facilitating effective decision-making.
(d) review and recommend to the board of directors any modifications to the charters of the board or any of its committees.
(e) review qualifications of existing directors and individuals suggested as potential candidates for director of the corporation, including candidates suggested by shareholders, and consider for nomination any of such individuals who are deemed qualified pursuant to the provisions of the board charter.
(f) recommend to the board the nominees to be proposed by the board for election as directors of the corporation at the annual meeting of shareholders.
(g) recommend to the board candidates for election as directors of the corporation to fill open seats on the board between annual meetings, including vacancies created by an increase in the authorized number of directors.
195
(h) consider resignations tendered by directors in the event of:
(i) the majority shareholder’s holdings falling below 50%, for any non-contested election of directors in the event a nominee standing for election by shareholders in a non-contested election receives a greater number of votes withheld from his or her election than votes for such election and, in any such case, refer the matter to the board with the committee's recommendation whether such resignation should be accepted, or
(ii) a change of circumstance as described in section 10(b)(ii) of the board charter.
(i) review the remuneration of independent directors and make such recommendations to the board with respect thereto as it may deem advisable.
(j) review present plans, programs or arrangements, and any proposed terms of any new plans, programs or arrangements, for the benefit of independent directors, and make such recommendations to the board with respect thereto as it may deem advisable.
(k) review and recommend to the board guidelines to be adopted relating to tenure of independent directors.
(l) provide recommendations to the board concerning committee structure of the board, committee operations, committee member qualifications, and committee member appointment.
(m) review any allegation that an executive officer or director may have violated the corporation's Standards of Business Conduct and report its findings to the board and the general auditor.
(n) require attendances at its meetings by members of management, as the committee may direct.
(o) undertake such additional activities within the scope of its responsibilities as it may deem appropriate.
5. Committee Evaluation
The committee will annually complete a self-evaluation of the committee's own performance and effectiveness and will consider whether any changes to the committee’s charter are appropriate.
6. Resources and Authority of the Committee
The committee has the authority to retain such outside advisors, including legal counsel or other experts, as it deems appropriate, and to approve the fees and expenses of such advisors. Without limiting the foregoing, the committee will have sole authority to retain and terminate any search firm to be used by the committee to identify director candidates and any consultant used by the committee to evaluate non-employee director compensation.
1. Purpose of the Committee
The primary purpose of the community collaboration and engagement committee (the 'committee') is to review and provide advice on the corporation's guidelines, procedures and performance supporting public awareness and consultation efforts, government, community and Indigenous relations, and community partnership and investment programs.
2. Committee Membership
The committee shall consist of no fewer than three members to be appointed by the board from among its members who shall serve at the pleasure of the board, but only so long as he or she continues to be a director of the corporation. The actual number of members shall be determined from time to time by resolution of the board. Members of the committee should be suitably knowledgeable in matters pertaining to issues relating to corporate contributions and community investment.
Community Collaboration and Engagement Committee Charter
196
3. Committee Structure and Operation
The chair and vice-chair of the committee shall be designated by the board from among the members of the committee. The committee shall fix its own rules of procedure and shall meet where and as provided by such rules or by resolution of the committee. In addition to the regular meeting schedule established by the committee, the chair of the committee may call a special meeting at any time.
The chair, or in that person's absence, the vice-chair or in the vice-chair's absence, an alternate designated by the committee, shall:
(a) preside at committee meetings;
(b) ensure that meetings of the committee are held in accordance with this charter; and
(c) review, and modify if necessary the agenda of the meetings of this committee in advance to ensure that the committee may effectively carry out its duties.
A majority of the members of the committee shall constitute a quorum thereof. Every question shall be decided by a majority of the votes cast on the question and in the case of an equality of votes, the chair of the meeting shall be entitled to a second or casting vote.
The committee shall designate its secretary.
Meetings of the committee may be called by any member.
The committee shall act only on the affirmative vote of a majority of the members at a meeting or by unanimous written consent.
The committee may establish subcommittees consisting of one or more members to carry out such duties as the committee may delegate.
4. Committee Activities
The following shall be the common recurring activities of the committee in carrying out its purpose. These activities are set forth as a guide with the understanding that the committee may diverge from this guide as appropriate given the circumstances.
The committee shall:
(a) review and monitor the effectiveness of the corporation’s programs and practices supporting public awareness and consultation activities.
(b) monitor trends and review current and emerging issues related to government, stakeholder and
Indigenous relations.
(c) review and provide advice on the corporation’s overall community investment strategies and programs, which consists of:
(i) charitable contributions;
(ii) local community contributions by business units on community-serving projects that also benefit the corporation, which are charitable in nature;
(iii) funding for public policy groups;
(iv) university research awards;
(v) sponsorships whose primary purpose is to promote community support and corporate recognition; and
(vi) expenditures required under socio-economic agreements to support the development of mutually-beneficial long-term relationships.

197
(d) approve all grants or contributions for charitable contributions and local community contributions; as described in section 4(c)(i) above, in excess of $300,000.
(e) require attendances at its meetings by members of management, as the committee may direct.
(f) undertake such additional activities within the scope of its responsibilities as it may deem appropriate.
5. Committee Evaluation
The committee will annually complete a self-evaluation of the committee's own performance and effectiveness and will consider whether any changes to the committee’s charter are appropriate.
6. Resources and Authority of the Committee
The committee has the authority to retain such outside advisors, including legal counsel or other experts, as it deems appropriate, and to approve the fees and expenses of such advisors.
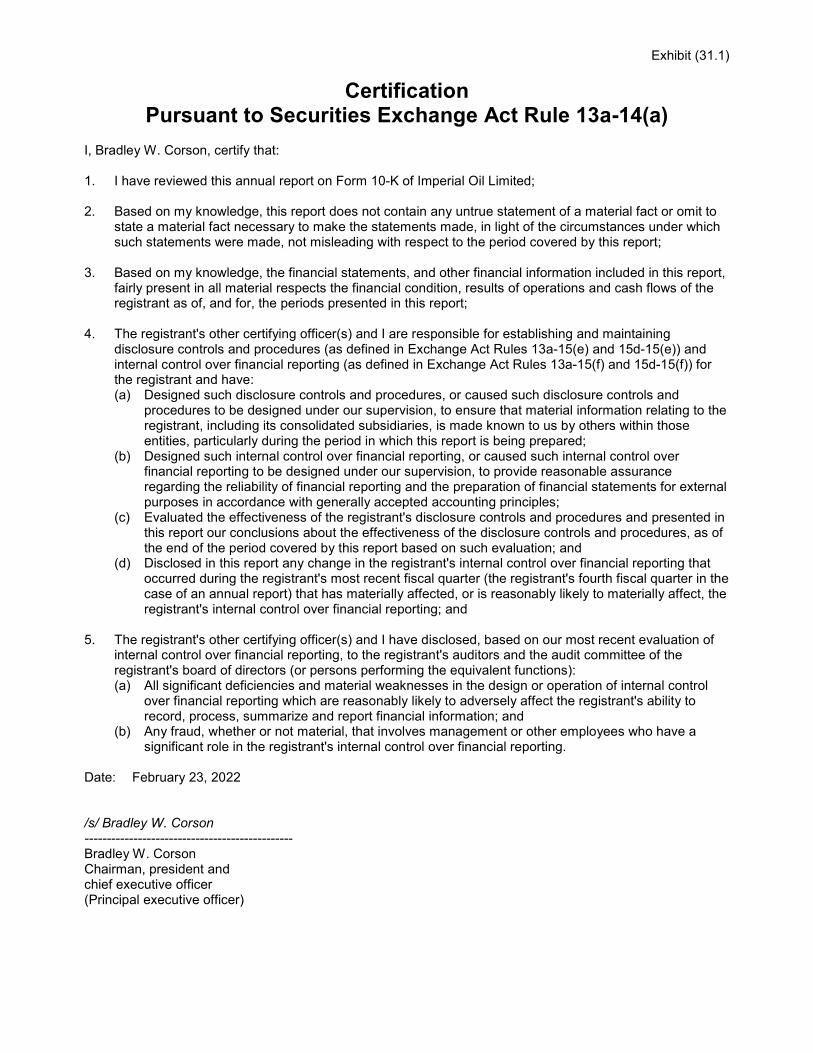
Exhibit (31.1)
Certification Pursuant to Securities Exchange Act Rule 13a-14(a)
I, Bradley W. Corson, certify that: 1. I have reviewed this annual report on Form 10-K of Imperial Oil Limited; 2. Based on my knowledge, this report does not contain any untrue statement of a material fact or omit to
state a material fact necessary to make the statements made, in light of the circumstances under which such statements were made, not misleading with respect to the period covered by this report;
3. Based on my knowledge, the financial statements, and other financial information included in this report,
fairly present in all material respects the financial condition, results of operations and cash flows of the registrant as of, and for, the periods presented in this report;
4. The registrant's other certifying officer(s) and I are responsible for establishing and maintaining
disclosure controls and procedures (as defined in Exchange Act Rules 13a-15(e) and 15d-15(e)) and internal control over financial reporting (as defined in Exchange Act Rules 13a-15(f) and 15d-15(f)) for the registrant and have: (a) Designed such disclosure controls and procedures, or caused such disclosure controls and
procedures to be designed under our supervision, to ensure that material information relating to the registrant, including its consolidated subsidiaries, is made known to us by others within those entities, particularly during the period in which this report is being prepared;
(b) Designed such internal control over financial reporting, or caused such internal control over financial reporting to be designed under our supervision, to provide reasonable assurance regarding the reliability of financial reporting and the preparation of financial statements for external purposes in accordance with generally accepted accounting principles;
(c) Evaluated the effectiveness of the registrant's disclosure controls and procedures and presented in this report our conclusions about the effectiveness of the disclosure controls and procedures, as of the end of the period covered by this report based on such evaluation; and
(d) Disclosed in this report any change in the registrant's internal control over financial reporting that occurred during the registrant's most recent fiscal quarter (the registrant's fourth fiscal quarter in the case of an annual report) that has materially affected, or is reasonably likely to materially affect, the registrant's internal control over financial reporting; and
5. The registrant's other certifying officer(s) and I have disclosed, based on our most recent evaluation of
internal control over financial reporting, to the registrant's auditors and the audit committee of the registrant's board of directors (or persons performing the equivalent functions): (a) All significant deficiencies and material weaknesses in the design or operation of internal control
over financial reporting which are reasonably likely to adversely affect the registrant's ability to record, process, summarize and report financial information; and
(b) Any fraud, whether or not material, that involves management or other employees who have a significant role in the registrant's internal control over financial reporting.
Date: February 23, 2022 /s/ Bradley W. Corson ----------------------------------------------- Bradley W. Corson Chairman, president and chief executive officer (Principal executive officer)

Exhibit (31.2)
Certification Pursuant to Securities Exchange Act Rule 13a-14(a) I, Daniel E. Lyons, certify that: 1. I have reviewed this annual report on Form 10-K of Imperial Oil Limited; 2. Based on my knowledge, this report does not contain any untrue statement of a material fact or omit to
state a material fact necessary to make the statements made, in light of the circumstances under which such statements were made, not misleading with respect to the period covered by this report;
3. Based on my knowledge, the financial statements, and other financial information included in this report,
fairly present in all material respects the financial condition, results of operations and cash flows of the registrant as of, and for, the periods presented in this report;
4. The registrant's other certifying officer(s) and I are responsible for establishing and maintaining
disclosure controls and procedures (as defined in Exchange Act Rules 13a-15(e) and 15d-15(e)) and internal control over financial reporting (as defined in Exchange Act Rules 13a-15(f) and 15d-15(f)) for the registrant and have: (a) Designed such disclosure controls and procedures, or caused such disclosure controls and
procedures to be designed under our supervision, to ensure that material information relating to the registrant, including its consolidated subsidiaries, is made known to us by others within those entities, particularly during the period in which this report is being prepared;
(b) Designed such internal control over financial reporting, or caused such internal control over financial reporting to be designed under our supervision, to provide reasonable assurance regarding the reliability of financial reporting and the preparation of financial statements for external purposes in accordance with generally accepted accounting principles;
(c) Evaluated the effectiveness of the registrant's disclosure controls and procedures and presented in this report our conclusions about the effectiveness of the disclosure controls and procedures, as of the end of the period covered by this report based on such evaluation; and
(d) Disclosed in this report any change in the registrant's internal control over financial reporting that occurred during the registrant's most recent fiscal quarter (the registrant's fourth fiscal quarter in the case of an annual report) that has materially affected, or is reasonably likely to materially affect, the registrant's internal control over financial reporting; and
5. The registrant's other certifying officer(s) and I have disclosed, based on our most recent evaluation of
internal control over financial reporting, to the registrant's auditors and the audit committee of the registrant's board of directors (or persons performing the equivalent functions): (a) All significant deficiencies and material weaknesses in the design or operation of internal control
over financial reporting which are reasonably likely to adversely affect the registrant's ability to record, process, summarize and report financial information; and
(b) Any fraud, whether or not material, that involves management or other employees who have a significant role in the registrant's internal control over financial reporting.
Date: February 23, 2022
/s/ Daniel E. Lyons -------------------------------------------------- Daniel E. Lyons Senior vice-president, finance and administration, and controller (Principal financial officer)

Exhibit (32.1)
Certification of Periodic Financial Report Pursuant to 18 U.S.C. Section 1350
For purposes of 18 U.S.C. Section 1350, as adopted pursuant to Section 906 of the Sarbanes-Oxley Act of 2002, the undersigned, Bradley W. Corson, the chief executive officer of Imperial Oil Limited (the "company"), hereby certifies that, to his knowledge: (i) the Annual Report on Form 10-K of the company for the year ended December 31, 2021 as filed
with the Securities and Exchange Commission (the "Report"), fully complies with the requirements of section 13(a) or 15(d) of the Securities Exchange Act of 1934; and
(ii) the information contained in the Report fairly presents, in all material respects, the financial condition
and results of operations of the company. Date: February 23, 2022
/s/ Bradley W. Corson --------------------------------------------------- Bradley W. Corson Chairman, president and chief executive officer (Principal executive officer)

Exhibit (32.2)
Certification of Periodic Financial Report Pursuant to 18 U.S.C. Section 1350
For purposes of 18 U.S.C. Section 1350, as adopted pursuant to Section 906 of the Sarbanes-Oxley Act of 2002, the undersigned, Daniel E. Lyons, the chief financial officer of Imperial Oil Limited (the "company"), hereby certifies that, to his knowledge: (i) the Annual Report on Form 10-K of the company for the year ended December 31, 2021 as filed
with the Securities and Exchange Commission (the "Report"), fully complies with the requirements of section 13(a) or 15(d) of the Securities Exchange Act of 1934; and
(ii) the information contained in the Report fairly presents, in all material respects, the financial condition
and results of operations of the company. Date: February 23, 2022 /s/ Daniel E. Lyons -------------------------------------------------- Daniel E. Lyons Senior vice-president, finance and administration, and controller (Chief financial officer)