37th International Symposium on Intensive ... - Critical Care

Original Research Manuscript Date of Submission: 01-07-2012
Date of Acceptance: 15-08-2011
Study of Impedance Cardiography (ICG ) in Hypertensive Patients
Dr. C V Parmar*, Dr. D L Prajapati, Dr. P A Gokhale, Dr. H B Mehta, Dr. C J Shah.
CardioVascular Lab., Dept. of Physiology, Govt. Medical College, Bhavnagar � 364001. Gujarat, India. Corresponding author�s E-mail: [email protected], Mob: +919825970922
ABSTRACT Introduction - Impedance cardiography ( ICG ) is latest non � invasive technique to measure blood flow in major vessels of heart. In this technique, electrical impedance ( Z ) of any vessel is measured by passing constant current ( 4 mA ) by 2 outer surface electrodes and resistance offered by blood flow is sensed by another 2 inner voltage sensing surface electrodes. Increased blood flow during systole will offer least resistant to current & that is recorded as positive wave in a graph in the form of dZ / dt waveform. As only heart rate & blood pressure is not sufficient to access a person�s haemodynamic status, CO & other haemodynamic parameters measured by this simple technique will help further to access heart�s functional status. Hypertension is one of the major burden in the society. So if ICG is found to be useful in prognosis & treatment of HT, then we can reduce morbidity & mortality associated with HT. Objective � To measure cardiac parameters noninvasively in healthy controls & hypertensives using ICG & observe the effect of HT on different haemodynamic parameters. Materials and Methods - Study had been done in 2 age groups : 1st group comprises of 40 healthy controls & the 2nd of 80 hypertensive patients taking antihypertensive drugs for more than 6 months. It was carried out on Nivomon Series computerized software in supine position at Govt. Medical College & Hospital, Bhavnagar by applying 8 surface stic on type of electrodes. Observations / Results � Haemodynamic Parameters measured were SV, SI, CO, CI, SVR & SVRI. Systolic BP was higher in HT group despite taking anti HT drugs. SVR, SVRI were higher & CO, CI were lower in HT group as compared to controls. Also weak positive correlation was found between BSA & CO , weak negative for BSA & SVR in patients. Conclusion - So high BP was mainly due to higher SVR, & CO was low secondary to higher SVR in hypertensives. All parameters were measured effectively & with ease. Thus ICG will have diagnostic, prognostic value in hypertensive subjects and therapeutic decision making on basis of haemodynamic parameters. Introduction
Impedance Cardiography ( ICG ) is based on the
principle of Impedance Plethysmography. It is one of
the latest, simple & non � invasive technique that
measures volume changes of blood in chest, calf or any
other region of the body by sensing electrical
resistance changes in respective area. It measures
blood flow in Arteries. Occlusive Impedance
Plethysmography ( OIP ) measures blood flow in Veins.
Impedance Cardiography ( ICG ) measures blood flow
in major vessels of Cardiac region from which Stroke
Volume is obtained. This study is carried out to
measure Cardiac Parameters like Stroke volume ( SV ),
Cardiac output ( CO ) , Stroke Volume Index ( SI ),
Cardiac Index ( CI ), Systemic Vascular Resistance
(SVR) & Systemic Vascular Resistance Index ( SVRI )
in hypertensive patients.
In short about Impedance, the symbol used is � Z �.
Impedance in vague term, means Electrical Resistance.
Resistance ( R ) means according to Ohm�s law, voltage
( V ) to constant current ( I ) ratio.
R = V / I
In this technique, the ELECTRICAL IMPEDANCE of
any part of the body is measured by constant current
method & variations in the impedance are recorded as
a function of time as a Graph. Since blood is a good
conductor of electricity, the amount of blood in a given
body segment is reflected inversely in the electrical
International Journal of Pharmaceutical Sciences INT.J.PH.SCI.,May-August,2012;4(2):-1916-1927
ISSN: 0975-4725
www.ijps.in
Int.J.Ph.Sci., May-August,2012;4(2)

impedance of the body segment. Pulsatile blood
volume by heart that is systemic blood circulation
causes proportional decrease in the electrical
impedance. Variation in the electrical impedance thus
gives adequate information about the blood circulation
in any part of the body, either Heart or any other Blood
Vessels [ 16 ].
Here constant current is passed through the body
segment of interest with the help of 2 surface
electrodes.Voltage signal devloped along the current
path is sensed with the help of another pair of
electrodes. The amplitude of the signal sensed is
directly propotional to the elecrical impedance of the
body segment. Amplification & detection of this signal
gives instantaneous electrical impedance Z of the body
segment. Difference between the instantaneous
electrical impedance & initial value of electrical
impedance ( Zo ) gives variation in the impedance as a
function of time, called the ∆Z ( t ) waveform &
indicates blood volume in that particular region. First
time derivative of the impedance ( dZ / dt ) is obtained
to give the rate of change of impedance [ 16 ]. Value of
rate of change of this impedance will give us different
measured cardiac parameters for blood volume
changes in thoracic major blood vessels, especially
aorta. With the help of dZ / dt, used in Kubicek�s
equation, stroke volume can be measured [8 , 9 ].
Hypertension is the commonest cardiovascular
disorder affecting about 20% adult populations
worldwide. It is an important risk factor for
cardiovascular mortality [ 22 ]. Reports suggest that
the prevalence of hypertension is rapidly increasing in
developing countries and is one of the leading causes of
death and disability in developing countries [ 23 ].
Cardiovascular diseases are projected to cause 4.6
million deaths in India by 2020 & Hypertension has
been reported to be responsible for 57 per cent of all
stroke deaths and 24 percent of all cardiovascular
deaths in East Asians [ 24 ]. Prevalence of hypertension
has been found to increase in rural populations
undergoing modernization. Recently, a study
conducted among labour population of Gujarat
reported prevalence of hypertension to be 16.9 % as per
WHO criteria [ 25 ]. Hypertension is becoming an
important public health problem worldwide. A recent
report on the global burden of hypertension indicates
that nearly 1 billion adults ( more than a quarter of the
world�s population ) had hypertension in 2000, and
this is predicted to increase to 1.56 billion by 2025 [ 23
]. Subjects with hypertension are known to have a two-
fold higher risk of developing coronary artery disease (
CAD ), four times higher risk of congestive heart failure
and seven times higher risk of cerebrovascular disease
and stroke compared to normotensive subjects [ 26 ].
Hypertension has been identified as one of the leading
risk factors for mortality, and is ranked third as a cause
of disability adjusted life � years [ 27 ]. Existing data
suggests that the prevalence of hypertension has
remained stable or has decreased in economically
developed countries during the past decade, while it
has increased in developing countries [ 28 ].
Hypertension is one of the modifiable major risk
factors contributing to premature mortality from
cardiovascular and cerebrovascular diseases. Given the
rising prevalence of hypertension in developing
Dr. C V Parmar et al: Study of Impedance Cardiography (ICG ) in Hypertensive Patients
Int.J.Ph.Sci., May-August,2012;4(2):-1917
countries undergoing epidemiological transition like
India, increased awareness, treatment, and control of
high blood pressure are critical to the reduction of
cardiovascular disease risk and prevention of the
associated burden of illness.
Further, In ICU or emergency set up, and at OPD for
patient coming with cardiovascular complaints, only
heart rate & blood pressure is not sufficient to access a
person�s haemodynamic status [ 1 ]. CO & other
hemodynamic parameters measured by Impedance
Cardiography were found to be helpful in many ways in
such patients. Hypertension is a hemodynamic related
disorder. BP rises as the result of increased systemic
vascular resistance ( SVR ), cardiac output ( CO ), fluid
volume, or a combination of these factors [ 29, 30 ].
Consequently, antihypertensive agents lower BP by
reducing SVR, CO, fluid volume, or combinations [ 31 ].
Previous authors hypothesized that hemodynamic
information could help tailor therapy and subsequently
improve BP control [ 32 ]. Invasive procedures for
hemodynamic profiling are not warranted in outpatient
clinics, and noninvasive procedures, such as
echocardiography, are costly and operator dependent [
33 ]. Impedance cardiography ( ICG ) has emerged as a
reliable noninvasive method to measure
hemodynamics in physician offices. In a randomized,
controlled trial, ICG - guided treatment
improved BP control rates in resistant hypertension
treated by hypertension specialists [ 34 ]. Because BP,
and specifically mean arterial pressure ( MAP ), is the
product of cardiac output ( CO ) and systemic vascular
resistance ( SVR ), antihypertensive medications exert
their effects by lowering CO, SVR or both. From a
hemodynamic standpoint, the ideal treatment regimen
for Hypertension ( HT ) should lower BP while
normalizing CO and SVR. Studies have shown that
when medications appropriately target the underlying
hemodynamic abnormalities in patients with HT, BP
control will be more effective [ 35 ].
Different parameters measured in this study are :
1. Stroke Volume ( SV ) is the amount of blood
ejected by each ventricle per beat.
2. Cardiac Output ( CO ) is the amount of blood
ejected by each ventricle per minute.
3. Stroke Volume Index ( SI ) is SV per Body Surface
Area ( BSA ) .
4. Cardiac Index (CI ) is CO per BSA .
5. Vascular resistance is a term used to define the
resistance to flow that must be overcome to
push blood through the circulatory system. The
resistance offered by the peripheral circulation is
known as the systemic vascular resistance ( SVR ).
6. Systemic Vascular Resistance Index ( SVRI ) is
SVR per BSA.
Purpose of our study is to measure & then compare all
above parameters between normal subjects &
hypertensive patients, & to see, what is the effect of HT
on above mentioned parameters. Also to see whether
these all haemodynamic parameters are useful or not
for suggesting change or modification of treatment or
life style modification.
Methods
After obtaining consent from IRB (
Institutional Review Board ) � Govt. Medical College,
Bhavnagar ; We carried out this study in two groups :
1st group comprises of 40 healthy controls & the 2nd of
80 hypertensive patients taking antihypertensive drugs
for more than 6 months. Mean duration of taking anti
� HT drugs was 7.15 + 6.65 yrs . 1st group was
containing 29 healthy male & 11 healthy female
volunteers. Mean age was 60.8 + 12.9 yrs. 2nd group
was containing 51 hypertensive male & 29 hypertensive
Dr. C V Parmar et al: Study of Impedance Cardiography (ICG ) in Hypertensive Patients
Int.J.Ph.Sci., May-August,2012;4(2):-1918
female patients. Mean age was 67.57 + 10.73 yrs. Total
14 subjects were excluded due to anticipatory
tachycardia. Study was carried out in supine position
after taking anthropometric data. It was done on
Nivomon Series Product computerised software by L &
T company at Govt. Medical college, Sir T. General
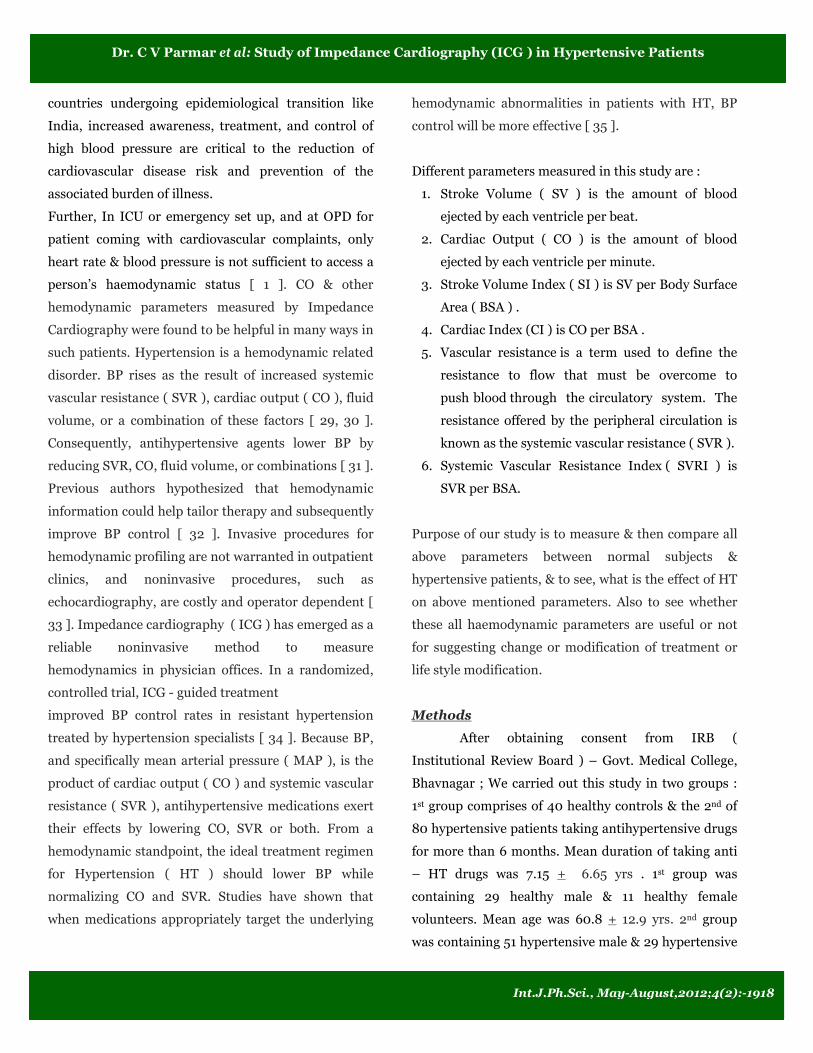
hospital & Old age home, Bhavnagar. Among 8 surface
electrodes used, four were current injecting electrodes (
I1, I2, I1', I2' ) and other four were voltage - sensing
electrodes ( V1, V2, V1',V2' ). The lower thoracic voltage
- sensing electrode ( V2, V2' ) were placed at the level
of the xiphisternum on each side at anterior axillary
line and cervical sensing electrodes ( V1, V1' ) were
positioned at the base of neck. The current injecting
electrodes delivering constant current 4 mA were
placed with two ( I1, I1' ) at top of the neck 5 cm above
the cervical sensing electrodes and the others ( I2, I2 ' )
5 cm below the thoracic voltage sensing electrode.
The Nivomon instrument estimated the stroke
volume ( SV ) from the impedance signal recorded
from the inner pair of electrodes using Kubicek�s
equation [ 8 , 9 ] as,
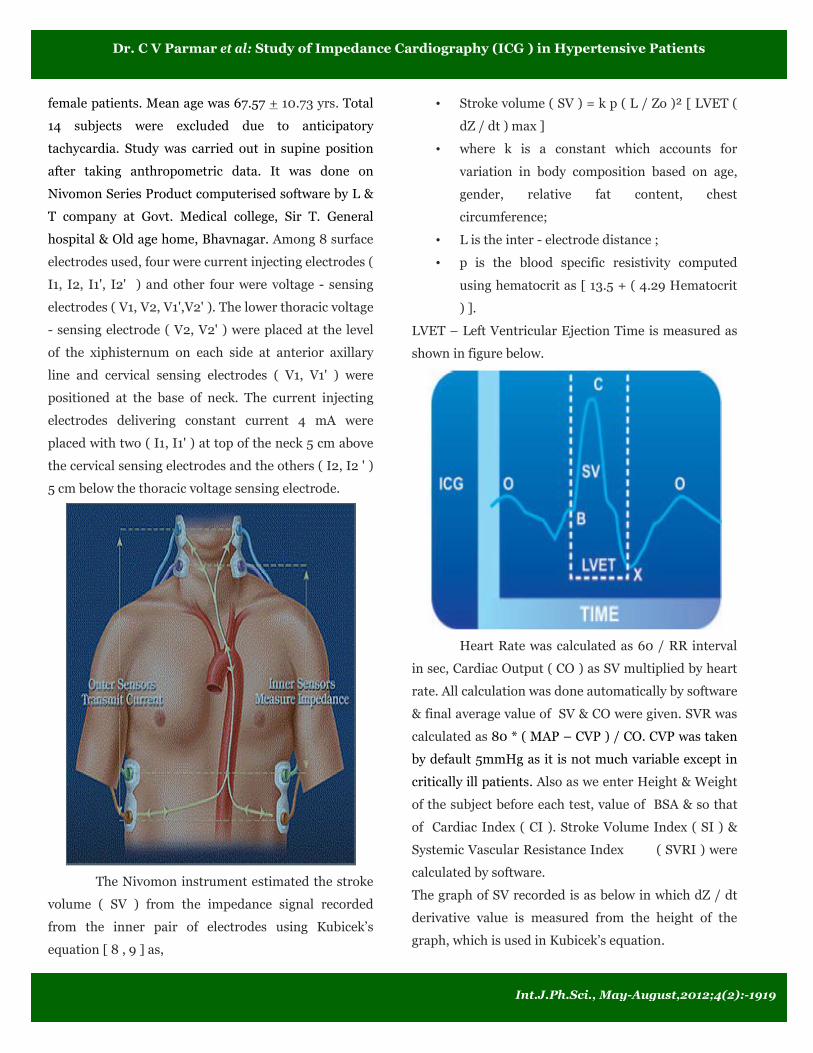
� Stroke volume ( SV ) = k p ( L / Zo )² [ LVET (
dZ / dt ) max ]
� where k is a constant which accounts for
variation in body composition based on age,
gender, relative fat content, chest
circumference;
� L is the inter - electrode distance ;
� p is the blood specific resistivity computed
using hematocrit as [ 13.5 + ( 4.29 Hematocrit
) ].
LVET � Left Ventricular Ejection Time is measured as
shown in figure below.
Heart Rate was calculated as 60 / RR interval
in sec, Cardiac Output ( CO ) as SV multiplied by heart
rate. All calculation was done automatically by software
& final average value of SV & CO were given. SVR was
calculated as 80 * ( MAP � CVP ) / CO. CVP was taken
by default 5mmHg as it is not much variable except in
critically ill patients. Also as we enter Height & Weight
of the subject before each test, value of BSA & so that
of Cardiac Index ( CI ). Stroke Volume Index ( SI ) &
Systemic Vascular Resistance Index ( SVRI ) were
calculated by software.
The graph of SV recorded is as below in which dZ / dt
derivative value is measured from the height of the
graph, which is used in Kubicek�s equation.
Dr. C V Parmar et al: Study of Impedance Cardiography (ICG ) in Hypertensive Patients
Int.J.Ph.Sci., May-August,2012;4(2):-1919
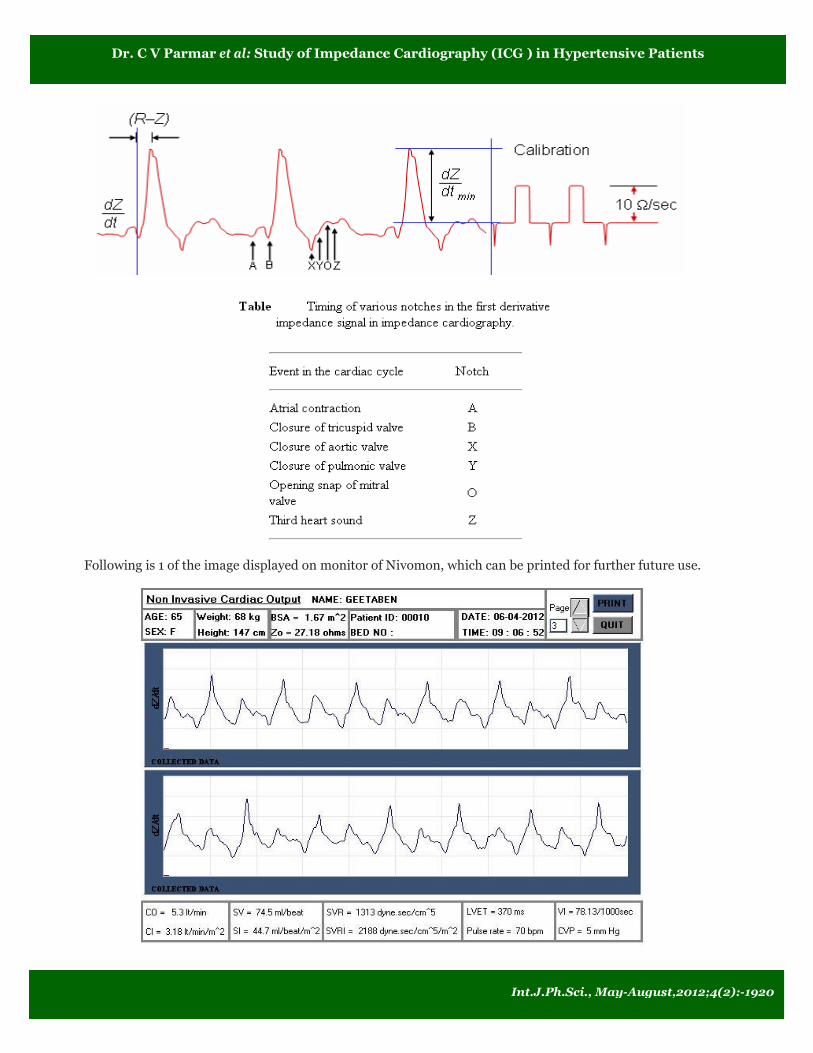
Following is 1 of the image displayed on monitor of Nivomon, which can be printed for further future use.
Dr. C V Parmar et al: Study of Impedance Cardiography (ICG ) in Hypertensive Patients
Int.J.Ph.Sci., May-August,2012;4(2):-1920
All datas were calculated & analysed by GraphPad
InStat � [DATASET1.ISD] Statistical software. Units of
all displayed parameters are [ AGE ( yrs ), HEIGHT (
cm ), WEIGHT ( kg ), Systolic BP ( mmHg ), Diastolic
BP ( mmHg ), Zo ( ohms ), Body Surface Area ( m² ),
Pulse Rate ( bpm ), Stroke Volume ( ml / beat ), Stroke
volume Index ( ml / beat / m² ), Cardiac Output ( lit. /
min ), Cardiac Index ( lit. / min / m² ), Left
Ventricular Ejection Time ( msecs ), Systemic Vascular
Resistance ( dyne·sec / cm�5 ), Systemic Vascular
Resistance Index ( dyne·sec / cm�5 / m² ) ].
Results
Unpaired t � test was used for comparison of
parameters between 2 groups or between males &
females. Mean + SD values of parameters in both
groups, p value & significance are shown next in Table
No. 1 :
Table No. 1:
Groups → Control Hypertensive t test Statistical
Parameters
↓ ( n = 40 ) ( n = 80 )
p
value Significance
SBP 131 ± 14.12 141.15 ± 13.27 0.0003 Extreme
DBP 82.15 ± 7.85 85.25 ± 9.02 0.0558 Not quite
Zo 29.75 ±
4.67 31.14 ± 4.73 0.1299 Not
BSA 1.71 ± 0.16 1.68 ± 0.17 0.3459 Not
PR 78.55 ± 11.8 74.2 ± 13.33 0.0719 Not quite
SV 66.4 ± 14.67 62.18 ± 16.17 0.155 Not
SI 38.65 ± 7.6 36.63 ± 7.43 0.1708 Not
CO 5.3 ± 1.03 4.6 ± 1.22 0.0014 Very
CI 3.08 ± 0.46 2.76 ± 0.64 0.0022 Very
SVR 1466.25 ±
316.15
1840.76 ±
511.87
<
0.0001 Extreme
SVRI 2482.17 ±
461.03
3055.21 ±
765.44
<
0.0001 Extreme
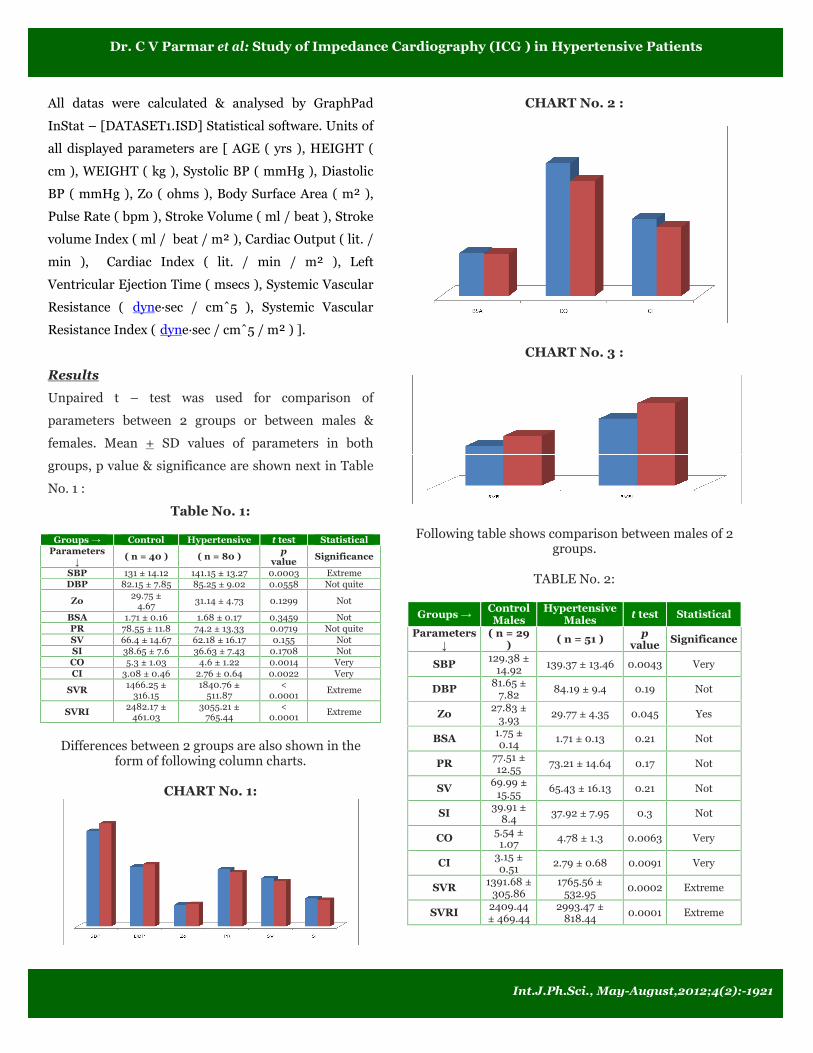
Differences between 2 groups are also shown in the
form of following column charts.
CHART No. 1:
CHART No. 2 :
CHART No. 3 :
Following table shows comparison between males of 2
groups.
TABLE No. 2:
Groups → Control
Males
Hypertensive
Males t test Statistical
Parameters
↓
( n = 29 )
( n = 51 ) p
value Significance
SBP 129.38 ±
14.92 139.37 ± 13.46 0.0043 Very
DBP 81.65 ±
7.82 84.19 ± 9.4 0.19 Not
Zo 27.83 ±
3.93 29.77 ± 4.35 0.045 Yes
BSA 1.75 ± 0.14
1.71 ± 0.13 0.21 Not
PR 77.51 ±
12.55 73.21 ± 14.64 0.17 Not
SV 69.99 ±
15.55 65.43 ± 16.13 0.21 Not
SI 39.91 ±
8.4 37.92 ± 7.95 0.3 Not
CO 5.54 ±
1.07 4.78 ± 1.3 0.0063 Very
CI 3.15 ±
0.51 2.79 ± 0.68 0.0091 Very
SVR 1391.68 ±
305.86 1765.56 ±
532.95 0.0002 Extreme
SVRI 2409.44
± 469.44
2993.47 ±
818.44 0.0001 Extreme
Dr. C V Parmar et al: Study of Impedance Cardiography (ICG ) in Hypertensive Patients
Int.J.Ph.Sci., May-August,2012;4(2):-1921

Following table shows comparison between females of
2 groups.
TABLE No. 3:
Groups → Control
Females
Hypertensive
Females t test Statistical
Parameters
↓ ( n = 11 ) ( n = 29 )
p
value Significance
SBP 135.27 ±
11.21 144.27 ± 12.54 0.004 Yes
DBP 83.45 ±
8.15 87.1 ± 8.11 0.22 Not
Zo 34.8 ± 1.74 33.54 ± 4.47 0.2 Not
BSA 1.62 ± 0.15 1.71 ± 0.13 > 0.99 Not
PR 81.27 ±
9.51 75.93 ± 10.67 0.14 Not
SV 56.94 ±
5.09 56.46 ± 14.82 0.87 Not
SI 35.34 ±
3.35 34.38 ± 5.86 0.52 Not
CO 4.66 ± 0.55 4.3 ± 1.01 0.16 Not
CI 2.88 ± 0.19 2.7 ± 0.56 0.13 Not
SVR 1662.81 ±
263.14 1973 ± 451.25 0.011 Yes
SVRI 2673.9 ±
395.12 3163.79 ± 661.63 0.0076 Very
To see correlation between 2 parameters, correlation
coefficient r was calculated as follows.
TABLE No. 4:
BSA & → SV CO SVR
Controls + 0.47 + 0.62 - 0.52
Hypertensive + 0.69 + 0.51 - 0.45
Significanct YES YES YES
Discussion
In India, in the year 1978, the first Impedance
Plethysmograph System was developed at Electronics
Division, BARC ( Bhabha Atomic Research Centre ). It
was then taken to Department of Surgery, Seth G.S.
Medical College & K.E.M. Hospital and Department of
Medicine, Grant Medical College & J.J. Hospital,
Mumbai. It was used for the assessment of central and
peripheral blood flow in the human body [ 10 ].
In present study, we compared different cardiac
parameters between healthy controls & hypertensive
patients to see the effect of HT, & also anti �
hypertensive drugs. Table No. 1 & Chart No. 1
indicate that although there is no significant difference
for diastolic BP, systolic BP is significantly higher in
hypertensives despite taking anti � HT drugs. Further
it shows that, there is no difference for basal
impedance Zo & Body Surface Area ( BSA ). So we can
say, groups are appropriate for comparison. Also there
is no significant differences for Heart rate, SV & SI.
Table No. 1 & Chart No. 2 show that both CO & CI
were significantly lower in hypertensive group than
those of controls. Also same table & Chart No. 3
show that, SVR & SVRI were significantly higher in
hypertensive group. So we can say that BP values were
higher due to increased SVR. Looking at the mean age
& as we excluded other disease patients like Diabetecs,
smokers & alcoholics ; increased SVR could mostly be
due to atherosclerosis secondary to hyperlipidemia. As
heart has to work, has to pump blood against increased
peripheral resistance ( after load ), both CO & CI were
found lower in hypertensives. One can easily
understand this by reconsidering one of the forms of
Ohm�s law, as expressed CO = BP / SVR. The meaning
of this formula is simply the following : Any time the
long-term level of total peripheral resistance changes (
but no other functions of the circulation change ), the
cardiac output changes quantitatively in exactly the
opposite direction [ 36 ]. Any factor that decreases the
heart�s ability to pump blood causes hypoeffectivity.
Some of the factors that can do this are the following :
Coronary artery blockage, causing a � heart attack �,
Inhibition of nervous excitation of the heart,
Pathological factors that cause abnormal heart rhythm
or rate of heartbeat, Valvular heart disease, Increased
arterial pressure against which the heart must pump,
such as in hypertension, Congenital heart disease,
Myocarditis, Cardiac hypoxia, cardiac tamponade &
cardiac metabolic derangements . Anything that
interferes with venous return also can lead to
decreased cardiac output. Some of these factors are the
following : 1. Decreased blood volume. 2. Acute venous
dilation. 3. Obstruction of the large veins. 4.
Decreased tissue mass, especially decreased skeletal
Dr. C V Parmar et al: Study of Impedance Cardiography (ICG ) in Hypertensive Patients
Int.J.Ph.Sci., May-August,2012;4(2):-1922

muscle mass. With normal aging or with prolonged
periods of physical inactivity, there is usually a
reduction in the size of the skeletal muscles. This, in
turn, decreases the total oxygen consumption and
blood flow needs of the muscles, resulting in decreases
in skeletal muscle blood flow and cardiac output.
Regardless of the cause of low cardiac output, whether
it be a peripheral factor or a cardiac factor, if ever the
cardiac output falls below that level required for
adequate nutrition of the tissues, the person is said to
suffer circulatory shock [ 36 ]. And CI is one of the
important parameter, that is used during the
management of shock.
Table No. 2 is showing comparison between males of
two groups. It stats that, SBP is significantly higher in
hypertensives. Zo is also significantly higher in them.
As Zo is mainly due to fat [ 37 ], we can say that fat
proportion is more in HT group & so itself one of the
contributing factor for causing atherosclerosis & so on.
SVR, SVRI were higher in hypertensives & so there
were low CO, CI in them. Table No. 3 is showing
comparison between females. Again SBP was higher in
hypertensives. There was no other significant
difference except that, SVR & SVRI were higher in HT
group. CO was somewhat maintained within range as
that of control group. Most of our results are consistent
with earlier almost same study [ 42 ].
Cardiac output increases approximately in proportion
to the surface area of the body [ 36 ]. Table No. 4 is
showing the same. There was significant positive r for
correlation between BSA with SV, CO in both groups.
Significant negative correlation was there for BSA with
SVR. So SVR was decreased as BSA increased.
Although r value was high in HT group for SV, it was
low for CO. It again indicates that CO was negatively
affected by increased SVR in HT group. Also SVR
decreased as BSA increased in both groups but less in
HT group supporting earlier significant higher values
of SVR in HT group.
Earlier studies [32, 38, 39, 40, 41 ] showed that,
antihypertensive drug treatment can be individualised
on the basis of haemodynamic parameters measured
by Impedance Cardiography. It also showed better
control of BP then empirical treatment. This technique
was found to be useful with better outcome &
prognosis in HT patients. With better control of not
only BP but also other haemodynamic parameters, all
complications associated with high BP like stroke,
heart attack, renal damage, retinal damage & many
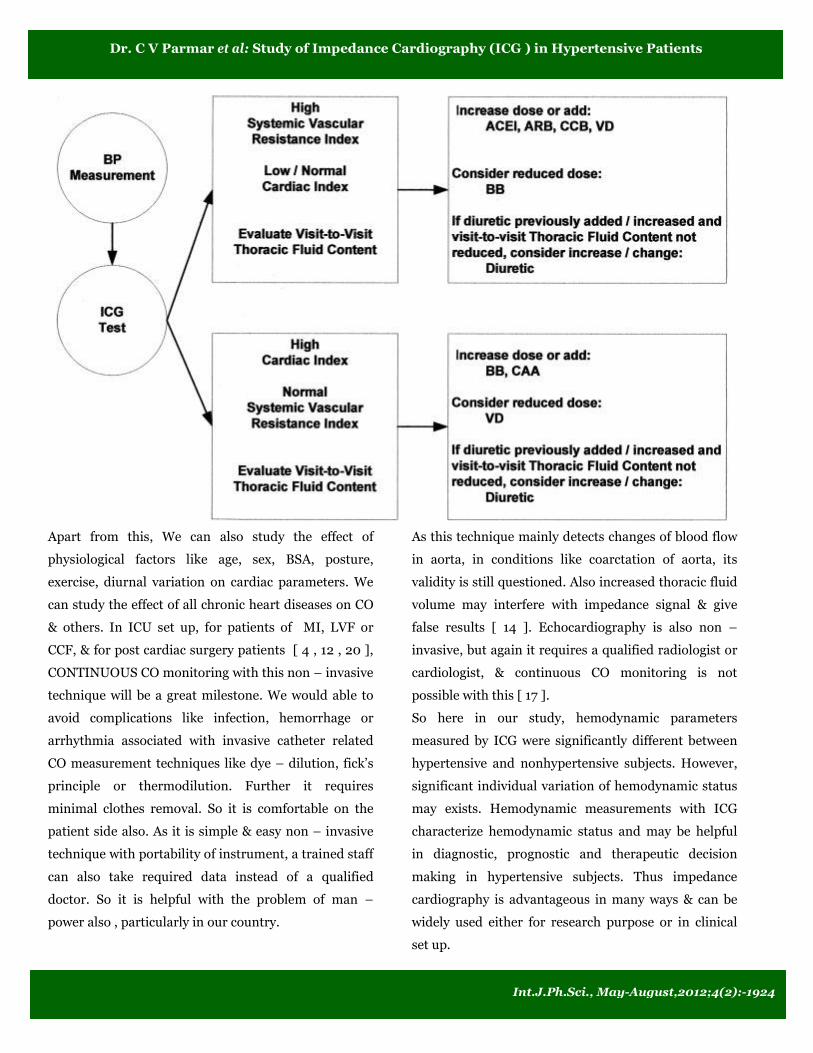
others can be avoided. Guidelines applied in earlier
studies are as follows according to different mechanism
of actions of different drugs.
Where, BB indicates â blocker ; CAA, central acting
agent ; VD, vasodilator ; ACEI, angiotensin converting
enzyme inhibitor ; ARB, angiotensin receptor blocker ;
CCB, calcium channel blocker.
TFC ( Thoracic Fluid Content ) can also be
measured by Impedance cardiography as 1000 / Zo [
19 ]. So in our study, we can suggest adding or
increasing dose of mixed dilators like ACE inhibitors,
AT1 antagonists or calcium channel blockers to reduce
SVRI. And for low CI, beta blockers should be stopped
or doses should be reduced. So with the help of a
physian, long follow up study can be done in our group
to see whether BP is controlled or not & that also for
only short term or long term. An integrative project can
be done with a pharmacologist to study effect of a
particular drug or group of drugs affecting cardiac
parameters & so ultimately heart function. Clonidine
was found to reduce BP by reducing vascular resistance
& CO [ 43 ].
Dr. C V Parmar et al: Study of Impedance Cardiography (ICG ) in Hypertensive Patients
Int.J.Ph.Sci., May-August,2012;4(2):-1923
Apart from this, We can also study the effect of
physiological factors like age, sex, BSA, posture,
exercise, diurnal variation on cardiac parameters. We
can study the effect of all chronic heart diseases on CO
& others. In ICU set up, for patients of MI, LVF or
CCF, & for post cardiac surgery patients [ 4 , 12 , 20 ],
CONTINUOUS CO monitoring with this non � invasive
technique will be a great milestone. We would able to
avoid complications like infection, hemorrhage or
arrhythmia associated with invasive catheter related
CO measurement techniques like dye � dilution, fick�s
principle or thermodilution. Further it requires
minimal clothes removal. So it is comfortable on the
patient side also. As it is simple & easy non � invasive
technique with portability of instrument, a trained staff
can also take required data instead of a qualified
doctor. So it is helpful with the problem of man �
power also , particularly in our country.
As this technique mainly detects changes of blood flow
in aorta, in conditions like coarctation of aorta, its
validity is still questioned. Also increased thoracic fluid
volume may interfere with impedance signal & give
false results [ 14 ]. Echocardiography is also non �
invasive, but again it requires a qualified radiologist or
cardiologist, & continuous CO monitoring is not
possible with this [ 17 ].
So here in our study, hemodynamic parameters
measured by ICG were significantly different between
hypertensive and nonhypertensive subjects. However,
significant individual variation of hemodynamic status
may exists. Hemodynamic measurements with ICG
characterize hemodynamic status and may be helpful
in diagnostic, prognostic and therapeutic decision
making in hypertensive subjects. Thus impedance
cardiography is advantageous in many ways & can be
widely used either for research purpose or in clinical
set up.
Dr. C V Parmar et al: Study of Impedance Cardiography (ICG ) in Hypertensive Patients
Int.J.Ph.Sci., May-August,2012;4(2):-1924
Acknowledgements
We are thankful to our Dean Dr. B. D. Parmar Sir & entire
Physiology Department for their kind support. We are also
very thankful to our subjects for taking part in our study,
without whom, this study could not have been possible. We
are also very thankful to Director of Medical Education &
Research, Gandhinagar, Gujarat state for
their encouragement & financial support in the form of
research grant.
References
1) PRADIP B. BARDE, GHANSHYAM D. JINDAL,
RAJVIR SINGH AND KISHORE K. DEEPAK. NEW
METHOD OF ELECTRODE PLACEMENT FOR
DETERMINATION OF CARDIAC OUTPUT USING
IMPEDANCE CARDIOGRAPHY. Indian J Physiol
Pharmacol 2006; 50 (3) : 234�240.
2) Arunodaya R. Gujjar, MBBS, DM, K. Muralidhar, MD,
Sanjay Banakal, MD, Ratan Gupta, MD, Talakad N.
Sathyaprabha, MD and P. S. Jairaj, MD, FRACS.
NON-INVASIVE CARDIAC OUTPUT BY
TRANSTHORACIC ELECTRICAL BIOIMPEDENCE
IN POST-CARDIAC SURGERY PATIENTS:
COMPARISON WITH THERMODILUTION
METHOD. Journal of Clinical Monitoring and
Computing 2008.
3) Liang-Yu Shyu* Chia-Yin Chiang Chun-Peng Liu Wei-
Chih Hu. Portable Impedance Cardiography System
for Real-Time Noninvasive Cardiac Output
Measurement. Journal of Medical and Biological
Engineering, 20(4): 193-202 2000 193.
4) Sullivan PJ, Martrieau RJ, Hull KA, Miller DR.
Comparison of bio impedance and thermodilution
measurement of cardiac output during aortic surgery.
Can J Anaest 1990; 37(4 pt 2): S78.
5) Shoemaker WC, Wo CCJ, Bishop MH, Appel PL, Van
de Water JM, Harrington GR, et al. Multicenter trial
of a new thoracic electrical bioimpedance device for
cardiac output estimation. Crit Care Med 1994; 23: 1�
6.
6) Deshpande AK, Jindal JD, Jagasia PM, Murali KVS,
Bhardwaj PR, Tahilkar KI, Paraulkar GB. Impedance
plethysmography of thoracic region: impedance
cardiography. J Postgrad Med 1990; 36: 207�12.
7) Nyboer J. Regional pulse volume and perfusion flow
measurements: electrical impedance
plethysmography. Arch In Med 1960; 105: 264.
8) Kubicek WG. Development and evaluation of an
impedance cardiac output system. Aerosp Med 1966;
12: 1208�1212.
9) Kubicek WG, Kotte Fj, Ramos MU, Patterson RP,
Witsoe DA, Labree JW et al. The Minnesota.
Impedance cardiograph: Theory and applications.
Biomed Eng 1974; 9: 410�416.
10) Jindal JD, Anantkrishan TS, Kataria SK, Jain RK,
Mandlic SA, Deepak KK et. al. Twenty-five years of
impedance plethysmography. BARC News Letter
2003; 236: 1�10.
11) Belardini R, Cimpani N, Costani C, Blandini A,
Purcara A. Comparison of impedance cardiography
with thermodilution and direct Pick methods for non-
invasive measurement of cardiac output during
incremental exercise in patients with ischemic
cardiomyopathy. Am J Cardiol 1996; 77: 1293�1301.
12) S. GABRIEL, J.-H. ATTERHOG, L. OR6 & L.-G.
EKELUND. Measurement of Cardiac Output by
Impedance Cardiography in Patients with Myocardial
Infarction. Comparative Evaluation of Impedance and
Dye Dilution Methods. Scand. J. clin. Lab. Invest.,
Vol. 36, 1976.
13) Neil Treister, Kevin Wagner, and Paul R. Jansen.
Reproducibility of Impedance Cardiography
Parameters in Outpatients With Clinically Stable
Coronary Artery Disease. AJH 2005; 18:44S�50S.
14) Lailu Mathews, Kalyan RK Singh. Cardiac output
monitoring. Annals of cardiac anaesthesia. Volume 11
� issue 1 � January � June 2008.
15) AK Deshpande, GD Jindal, PM Jagasia, KV Murali,
PA Bharadwaj, KI Tahilkar, GB Parulkar. Impedance
plethysmography of thoracic region: impedance
cardiography. J Postgrad Med Year : 1990 | Volume
: 36 | Issue : 4 | Page : 207-12.
16) Babu JP, Jindal GD, Bhuta AC, Parulkar
GB*.Impedance plethysmography � basic principles. J
Postgrad Med 1990 ; 36 ( 2 ) : 57 � 63.
Dr. C V Parmar et al: Study of Impedance Cardiography (ICG ) in Hypertensive Patients
Int.J.Ph.Sci., May-August,2012;4(2):-1925

17) David B Northridge, Iain N Findlay, John Wilson,
Esther Henderson, Henry J Dargie. Non-invasive
determination of cardiac output by Doppler
echocardiography and electrical bioimpedance. Br
Heart J 1990;63:93-7.
18) H. W. K. NG, T. WALLEY, Y. TSAO & A. M.
BRECKENRIDGE. Comparison and reproducibility of
transthoracic bioimpedance and dual beam Doppler
ultrasound measurement of cardiac function in
healthy volunteers. Br. J. clin. Pharmac. (1991), 32,
275-282.
19) Milton Packer, MD, FACC, William T. Abraham, MD,
FACC, Mandeep R. Mehra, MD, FACC, Clyde W.
Yancy, MD, FACC, Christine E. Lawless, MD, FACC,
Judith E. Mitchell, MD, FACC, Frank W. Smart, MD,
FACC, Rachel Bijou, MD, FACC, Christopher M.
O�Connor, MD, FACC, Barry M. Massie, MD, FACC,
Ileana L. Pina, MD, FACC, Barry H. Greenberg, MD,
FACC, James B. Young, MD, FACC, Daniel P.
Fishbein, MD, FACC, Paul J. Hauptman, MD, FACC,
Robert C. Bourge, MD, FACC, John E. Strobeck, MD,
PHD, FACC, Srinvivas Murali, MD, FACC, Douglas
Schocken, MD, FACC, John R. Teerlink, MD, FACC,
Wayne C. Levy, MD, FACC, Robin J. Trupp, MSN, RN,
Marc A. Silver, MD, FACC. Utility of Impedance
Cardiography for the Identification of Short-Term
Risk of Clinical Decompensation in Stable Patients
With Chronic Heart Failure. Journal of the American
College of Cardiology Vol. 47, No. 11, 2006.
20) Seppo Kaukinen, MD, PhD, Tiit Ko¨ o¨ bi, MD, PhD,
YanBin Bi, MD, and Va¨ ino¨ M.H. Turjanmaa, MD,
PhD. Cardiac Output Measurement After Coronary
Artery Bypass Grafting Using Bolus Thermodilution,
Continuous Thermodilution, and Whole-Body
Impedance Cardiography. Journal of Cardiothoracic
and Vascular Anesthesia, Vol 17, No 2 (April), 2003:
pp 199-203.
21) Velmahos GC, Wo CC, Demetriades D, Bishop MH,
Shoemaker WC. Invasive and Noninvasive
Hemodynamic Monitoring of Patients With
Cerebrovascular Accidents. West J Med 1998; 169:1 7-
22).
22) Hypertension control. Technical Report Series: World
Health Organization; 1996. Report No.: 862.
23) Kearney PM, Whelton M, Reynolds K, Muntner P,
Whelton PK, He J. Global burden of hypertension :
analysis of worldwide data. Lancet 2005; 365: 217-23.
24) Rodgers A, Lawes C, MacMahon S. Reducing the
global burden of blood pressure related
cardiovascular disease. J Hypertens 2000; 18 : S3 - 6.
25) Tiwari RR. Hypertension and epidemiological factors
among tribal labour population in Gujarat. Indian
Journal of Public Health 2008; 52(3):144-146.
26) Stamler J. Blood pressure and high blood pressure :
Aspects of risk. Hypertension 1991;18 (suppl.):I.95�
I.107.
27) Ezzati M, Lopez AD, Rodgers A, Vander Hoorn S,
Murray CJ. Selected major risk factors and global and
regional burden of disease. Lancet 2002;360:1347-60.
28) Kearney PM, Whelton M, Reynolds K, Whelton PK,
He J. Worldwide prevalence of hypertension: a
systematic review. J Hypertens 2004;22:11�19.
29) Ferrario CM, Page IH. Current views concerning
cardiac output in the genesis of experimental
hypertension. Circ Res. 1978;43:821� 831.
30) Davidson RC, Ahmad S. Hemodynamic profiles in
essential and secondary hypertension. In : Izzo JL,
Black HR, eds. Hypertension Primer. 3rd ed. Dallas,
TX: Council on High Blood Pressure Research,
American Heart Association; 2003:349 �351.
31) Sullivan JM, Schoeneberger TE, Ratts ET, Palmer ET,
Samaha JK, Mance CJ, Muirhead EE. Short-term
therapy of severe hypertension. Hemodynamic
correlates of the antihypertensive response in man.
Arch Intern Med. 1979;139:1233�1239.
32) Egan B, Schmouder R. The importance of
hemodynamic considerations in essential
hypertension. Am Heart J. 1988;116:594 �599.
33) Northridge DB, Findlay IN, Wilson J, Henderson E,
Dargie HJ. Noninvasive determination of cardiac
output by Doppler echocardiography and electrical
bioimpedance. Br Heart J. 1990;63:93�97.
34) Taler SJ, Textor SC, Augustine JE. Resistant
hypertension: Comparing hemodynamic
Dr. C V Parmar et al: Study of Impedance Cardiography (ICG ) in Hypertensive Patients
Int.J.Ph.Sci., May-August,2012;4(2):-1926

35) management to specialist care. Hypertension.
2002;39:982�988.
36) Easterling TR, Benedetti TJ, Schmucker BC, Carlson
KL : Antihypertensive therapy in pregnancy directed
by noninvasive hemodynamic monitoring. Am J
Perinatol 1989;6:86�89.
37) Guyton & Hall. Textbook of medical physiology : 12th
edition.
38) Backer LE : Principles of impedance technique. IEEE
Eng Med Biol Mag 1989, 2:11�15.
39) Ronald D. Smith, Pavel Levy, Carlos M. Ferrario.
Value of Noninvasive Hemodynamics to Achieve
Blood Pressure Control in Hypertensive Subjects.
Hypertension. 2006;47:771-777.
40) Timothy Sanford, Neil Treister, and Celine Peters.
Use of Noninvasive Hemodynamics
41) in Hypertension Management. Am J Hypertens
2005;18:87S�91S.
42) Donald L. Sharman, MD; Cathy P. Gomes, NP; Jillian
P. Rutherford, PA. Improvement in Blood Pressure
Control With Impedance Cardiography-Guided
Pharmacologic Decision Making. CHF. 2004;10:54�
58.
43) Sandra J. Taler, Stephen C. Textor, Jo Ellen
Augustine. Resistant Hypertension. Comparing
Hemodynamic Management to Specialist Care.
Hypertension. 2002;39:982-988.
44) Abdelhammed AI, Smith RD, Levy P, Smits GJ,
Ferrario CM. Noninvasive hemodynamic profiles in
hypertensive subjects. Am J Hypertens. 2005
Feb;18(2 Pt 2):51S-59S.
45) Anna Mitchell, Sandra Bu¨ hrmann, Anabelle Opazo
Saez, Uljana Rushentsova, Rafael F. Sch ¨ afers,
Thomas Philipp, and Jens Nu¨ rnberger. Clonidine
Lowers Blood Pressure by Reducing Vascular
Resistance and Cardiac Output in Young, Healthy
Males. Cardiovascular Drugs and Therapy 19 49�55
2005.
Dr. C V Parmar et al: Study of Impedance Cardiography (ICG ) in Hypertensive Patients
Int.J.Ph.Sci., May-August,2012;4(2):-1927
Copyright © 2022 FDOKUMEN