Impedimetric Detection of Histamine in Bowel Fluids Using Synthetic Receptors with pH-Optimized...
9
Impedimetric Detection of Histamine in Bowel Fluids Using Synthetic Receptors with pH-Optimized Binding Characteristics Marloes Peeters,* ,† Freddy J. Troost, ‡ Roel H.G. Mingels, † Tina Welsch, § Bart van Grinsven, † Tom Vranken, † Sven Ingebrandt, § Ronald Thoelen, †,⊥ Thomas Jan Cleij, † and Patrick Wagner †,¶ † Institute for Materials Research, Hasselt University, Wetenschapspark 1, 3590 Diepenbeek, Belgium ‡ Department of Internal Medicine, div. of Gastroenterology−Hepatology, Maastricht University Medical Center, Minderbroedersberg 4-6, 6211 LK Maastricht, The Netherlands § Fachhochschule Kaiserslautern, University of Applied Sciences, Amerikastraße 1, 66482 Zweibrü cken, Germany ⊥ XIOS University College Limburg, Agoralaan - Building H, 3590 Diepenbeek, Belgium ¶ IMEC vzw, division IMOMEC, Wetenschapspark 1, 3590 Diepenbeek, Belgium * S Supporting Information ABSTRACT: Histamine is a biogenic amine that is indispensable in the efficient functioning of various physio- logical systems. In previous work, a molecularly imprinted polymer (MIP) based sensor platform with impedimetric read- out was presented which could rapidly and at low cost determine histamine concentrations in buffer solutions within pH 7−9. 1,2 For diagnostic applications, histamine should be detectable in a wider pH range as it mostly occurs in mildly acidic environments. To understand this pH-dependent response of the MIP sensor, we propose a statistical binding analysis model. Within this model, we predict the theoretical performance of MIP based on acrylic acid in the required pH range and verify these results experimentally by UV−vis spectroscopy, microgravimetry, and impedance spectroscopy. Using impedimetric read-out, specific and selective detection of histamine in the physiologically relevant nanomolar concentration range is possible in neutral and mildly acidic phosphate buffer. Finally, this sensor platform was used to analyze the histamine concentration of mildly acidic bowel fluid samples of several test persons. We show that this sensor provides reliable data in the relevant concentration regime, which was validated independently by enzyme-linked immuno sorbent assay (ELISA) tests. H istamine is an organic nitrogen compound which was first described in 1910 by Henry H. Dale and P. P. Laidlaw 3 (Figure S-1, Supporting Information). It is produced from the decarboxylation of the amino acid histidine by the enzyme histidine decarboxylase. This reaction takes place in the mast cells and basophils 4,5 where histamine is detained in intra- cellular granules. 6 In mast cells isolated from the lung, skin, and the small intestine, approximately 3−8 pg histamine/cell is found. 7 When the mast cells are exposed to allergens, histamine is released and the local concentration is increased resulting in an allergic reaction. 8 Another important site of histamine storage and release are the enterochromaffin-like cells in the stomach and intestines. There, histamine is involved in regulating the physiological function of the gut. 6 Furthermore, a high concentration of histamine (1−6 μmol/kg) is present in the brain where it acts as a neurotransmitter. 9 Histamine is naturally present in many fruits, vegetables, beer, red wine, cheese, and fish. 10 The concentration is relatively low; however, when food is spoiled, the amount can increase to toxic levels up to 50 mg per 100 g of product, causing food poisoning. 10 Histamine detection is therefore of great importance for the food industry and food safety. Another area of substantial interest is biomedical research since histamine plays a pivotal role in the irritable bowel syndrome (IBS), 11,12 allergies, 8 asthma, 13 rheumatoid arthritis, and related diseases. 14 For these type of medical applications, the detection limit should be considerably lower than in the case of food analysis: in, e.g., blood, the normal physiological concentration ranges from 200 to 600 nM. 15 The most common techniques to detect histamine are high- performance liquid chromatography (HPLC), 16 gas chroma- tography (GC), 17 or enzyme-linked immuno sorbent assay (ELISA), 18 all of which are laborious and expensive. Electro- chemical techniques are inexpensive; however, the use of these techniques is limited due to the high oxidation potential (∼1.2 V) of histamine. 19 In phosphate buffer of pH 7.1, a detection limit of 20 μM was established with a diamond electrode using amperometric detection. 20 This concentration is well above the Received: September 11, 2012 Accepted: December 18, 2012 Published: December 18, 2012 Article pubs.acs.org/ac © 2012 American Chemical Society 1475 dx.doi.org/10.1021/ac3026288 | Anal. Chem. 2013, 85, 1475−1483
Transcript of Impedimetric Detection of Histamine in Bowel Fluids Using Synthetic Receptors with pH-Optimized...

Impedimetric Detection of Histamine in Bowel Fluids Using SyntheticReceptors with pH-Optimized Binding CharacteristicsMarloes Peeters,*,† Freddy J. Troost,‡ Roel H.G. Mingels,† Tina Welsch,§ Bart van Grinsven,†
Tom Vranken,† Sven Ingebrandt,§ Ronald Thoelen,†,⊥ Thomas Jan Cleij,† and Patrick Wagner†,¶
†Institute for Materials Research, Hasselt University, Wetenschapspark 1, 3590 Diepenbeek, Belgium‡Department of Internal Medicine, div. of Gastroenterology−Hepatology, Maastricht University Medical Center, Minderbroedersberg4-6, 6211 LK Maastricht, The Netherlands§Fachhochschule Kaiserslautern, University of Applied Sciences, Amerikastraße 1, 66482 Zweibrucken, Germany⊥XIOS University College Limburg, Agoralaan - Building H, 3590 Diepenbeek, Belgium¶IMEC vzw, division IMOMEC, Wetenschapspark 1, 3590 Diepenbeek, Belgium
*S Supporting Information
ABSTRACT: Histamine is a biogenic amine that isindispensable in the efficient functioning of various physio-logical systems. In previous work, a molecularly imprintedpolymer (MIP) based sensor platform with impedimetric read-out was presented which could rapidly and at low costdetermine histamine concentrations in buffer solutions withinpH 7−9.1,2 For diagnostic applications, histamine should bedetectable in a wider pH range as it mostly occurs in mildlyacidic environments. To understand this pH-dependentresponse of the MIP sensor, we propose a statistical bindinganalysis model. Within this model, we predict the theoreticalperformance of MIP based on acrylic acid in the required pH range and verify these results experimentally by UV−visspectroscopy, microgravimetry, and impedance spectroscopy. Using impedimetric read-out, specific and selective detection ofhistamine in the physiologically relevant nanomolar concentration range is possible in neutral and mildly acidic phosphate buffer.Finally, this sensor platform was used to analyze the histamine concentration of mildly acidic bowel fluid samples of several testpersons. We show that this sensor provides reliable data in the relevant concentration regime, which was validated independentlyby enzyme-linked immuno sorbent assay (ELISA) tests.
Histamine is an organic nitrogen compound which was firstdescribed in 1910 by Henry H. Dale and P. P. Laidlaw3
(Figure S-1, Supporting Information). It is produced from thedecarboxylation of the amino acid histidine by the enzymehistidine decarboxylase. This reaction takes place in the mastcells and basophils4,5 where histamine is detained in intra-cellular granules.6 In mast cells isolated from the lung, skin, andthe small intestine, approximately 3−8 pg histamine/cell isfound.7 When the mast cells are exposed to allergens, histamineis released and the local concentration is increased resulting inan allergic reaction.8 Another important site of histaminestorage and release are the enterochromaffin-like cells in thestomach and intestines. There, histamine is involved inregulating the physiological function of the gut.6 Furthermore,a high concentration of histamine (1−6 μmol/kg) is present inthe brain where it acts as a neurotransmitter.9
Histamine is naturally present in many fruits, vegetables,beer, red wine, cheese, and fish.10 The concentration isrelatively low; however, when food is spoiled, the amount canincrease to toxic levels up to 50 mg per 100 g of product,causing food poisoning.10 Histamine detection is therefore of
great importance for the food industry and food safety. Anotherarea of substantial interest is biomedical research sincehistamine plays a pivotal role in the irritable bowel syndrome(IBS),11,12 allergies,8 asthma,13 rheumatoid arthritis, and relateddiseases.14 For these type of medical applications, the detectionlimit should be considerably lower than in the case of foodanalysis: in, e.g., blood, the normal physiological concentrationranges from 200 to 600 nM.15
The most common techniques to detect histamine are high-performance liquid chromatography (HPLC),16 gas chroma-tography (GC),17 or enzyme-linked immuno sorbent assay(ELISA),18 all of which are laborious and expensive. Electro-chemical techniques are inexpensive; however, the use of thesetechniques is limited due to the high oxidation potential (∼1.2V) of histamine.19 In phosphate buffer of pH 7.1, a detectionlimit of 20 μM was established with a diamond electrode usingamperometric detection.20 This concentration is well above the
Received: September 11, 2012Accepted: December 18, 2012Published: December 18, 2012
Article
pubs.acs.org/ac
© 2012 American Chemical Society 1475 dx.doi.org/10.1021/ac3026288 | Anal. Chem. 2013, 85, 1475−1483

physiologically relevant concentration, and further on, no testswere performed yet in biological samples.In vitro measurements were performed by Bitziou et al,20,21
who used boron-doped diamond microelectrodes in ampero-metric mode to detect histamine release from ECL cells andfrom gastric mucosa of the guinea pig stomach. The sensor wasproven to be stable, and the signal was not influenced by otherelectroactive components such as serotonin, which makes itsuitable for qualitatitve measurements in vitro. However,quantitative measurements were not performed yet. So far,first attempts to an in vivo measurement of histamine weremade by Mochizuki et al. and Itoh et al.22,23 They could makean estimate of the histamine release in the hypothalamus ofanesthetized rats by in vivo microdialysis coupled to HPLCequipment with a fluorescence detector. Upon administrationof histamine agonists, an increase in the release rate wasobserved. However, this technique cannot be directly trans-ferred to measurement in vivo in humans, and furthermore, noreference tests with analogous molecules were performed todemonstrate the selectivity of the sensor platform.Molecularly imprinted polymers (MIPs) present an interest-
ing alternative to these more traditional techniques of histaminedetection. MIPs are synthetic receptors with imprintednanocavities that are able to rebind their target molecule asspecific and selective as an enzyme.24−26 Their use offers severalbenefits: First, MIPs can be synthesized at a rather low cost viaestablished polymer−chemical routes.27,28 Second, MIPs arerobust and can withstand extremes of heat and pH.29,30 Third,MIPs prepared according to the noncovalent approach have thepotential of being regenerated.31 Until now, there are only a
few reports in the literature about MIPs for histaminerecognition; Tong et al. reported on a MIP based sensorwhere zinc(II)-protoporphyrin (ZnPP) was used as afluorescent monomer and detection was in the millimolarrange.32 Allender et al. studied various MIPs for pharmaceuticalapplications, including MIPs for histamine. A histamine MIPwas prepared with the monomer methacrylic acid, anddetection was subsequently performed with HPLC columns.33
Pietrzyk et al. synthesized a MIP by electropolymerizingpolypyrrole, and a detection limit of 20 μM was reached inphosphate buffer with an amperometric sensor.34 The first MIPsensor setup capable of measuring the physiologically relevantnanomolar concentration range has been developed recently byBongaers et al. and Horemans et al.1,2 These measurementswere all performed in buffer solutions, and for futureapplications, biological samples are considerably more interest-ing. The MIP used in these publications was composed ofmethacrylic acid (MAA) as functional monomer, ethyleneglycol dimethacrylate (EGDM) as cross-linker, and dimethyl-sulfoxide (DMSO) as porogen. After bulk polymerization,particles were ground and fixated onto electrodes using apolymer adhesive. Subsequently, detection down to thenanomolar concentration range could be performed byimpedance spectroscopy. In the micromolar range, the quartzcrystal microbalance (QCM)35 proved to be most useful. Whilehistamine could be measured specifically and selectively at pH7, at mildly acidic pHs, no binding was observed which is due tothe protonation behavior of the target molecule and the MIP.This pH dependence was also reported by Trikka et al., whichused a histamine MIP with exactly the same composition, but as
Figure 1. Schematic representations of the protonation states of histamine (above) and of MIP conformations A−D (below) in pH range of 1−14.Within pH range 1−4, His +2 is the abundant form of histamine while this is MIP D for the MIP conformations. His+ dominates from pH 7 to 9. Athigher pHs, HisN will take over. The results for histamine were adopted from literature.1 For the MIPs, MIP A is the abundant species starting frompH 5.
Analytical Chemistry Article
dx.doi.org/10.1021/ac3026288 | Anal. Chem. 2013, 85, 1475−14831476
a detection method, a colorimetric assay was used.36 In the pHModel section, we will now propose a statistical binding modelto explain this pH-dependent sensor response.pH Model. We are interested in measuring histamine in the
gastro-intestinal tract, where the pH of the fluids varies between5 and 8.37 The functional monomer MAA, which was used byBongaers et al. and Horemans et al., is present in the neutral(COOH) and deprotonated form (COO−) depending on thepH of the solution.1,38 At pH 5, which is well below the pKa(6.5) of MAA, the acid occurs mostly in the neutral form.38 Thetarget, histamine, occurs in three natural forms; the neutralform (HisN), the single protonated state (His+), and thedouble protonated state (His+2). Up to a pH of 10, theprotonated states are abundant, at higher pH values, the neutralform will dominate. The relative abundances are illustrated inFigure 1.1
For the formation of a hydrogen bond, there should be ahydrogen bond donor and a hydrogen bond acceptor. In thecase of the functional monomer, the neutral methacrylic acid(COOH) form is a donor. The protonated histamine is also adonor, and as a result, no hydrogen bonds can be formed whichmakes binding to the target unlikely at a pH of 5. For bindingto occur, the monomer should be an acceptor, which is the casein the deprotonated (COO−) state. To obtain a functionalmonomer which is mostly in the deprotonated state at pH 5,the monomer should be more acidic than MAA and the pKavalue should be lower. Therefore, acrylic acid (AA) wasselected, which has a pKa value of approximately 4.5.39 With thefollowing calculations, we will demonstrate that MIPs based onAA monomers are able to bind histamine at mildly acidic pHswhich is not possible to achieve with MAA as monomer.Histamine contains two functional sites for hydrogen bond
formation, namely, the amine group and the nitrogen in thering next to the double bond. To correct for these two bindingsites, already during the synthesis, two times the amount ofmonomer compared to the target was used. The monomer canbe either in the neutral or the deprotonated state and, since pertarget molecule two monomers are available, this results intofour possible MIP conformations. They are labeled from A to D
(Figure 1). Situation A represents two functional monomers inthe deprotonated state, while for situation D both monomersare in the neutral form. In the cases of B and C, there is onemonomer in the neutral and the other in the deprotonatedstate. In total, the sum of situations A, B, C, and D is 100%. Therelative abundance of the states is determined by theHenderson−Hasselbach equation (eq 1):
= + −KpH p log[COOH][COO ]a
(1)
As derived from this formula, situations B and C can becalculated by multiplying the percentage of COOH present bythat of COO−. Directly resulting from this, A and D are equalto the squared percentage of COO− or COOH, respectively.For example, at pH 5, the percentage of COO− is 76% and thatof COOH is 24%. The occurrence of MIP A is then equal to76% squared, which is 58%. For the occurrence of MIP D, thiscorresponds to 6%. The other remaining 36% is equally dividedover MIP B and C; therefore, both are present at 18%. Theresults for pH 1−14 are shown in Figure 1 and in Table S-1 andTable S-2 of the Supporting Information.For histamine to bind to the MIP, at least one, but preferably
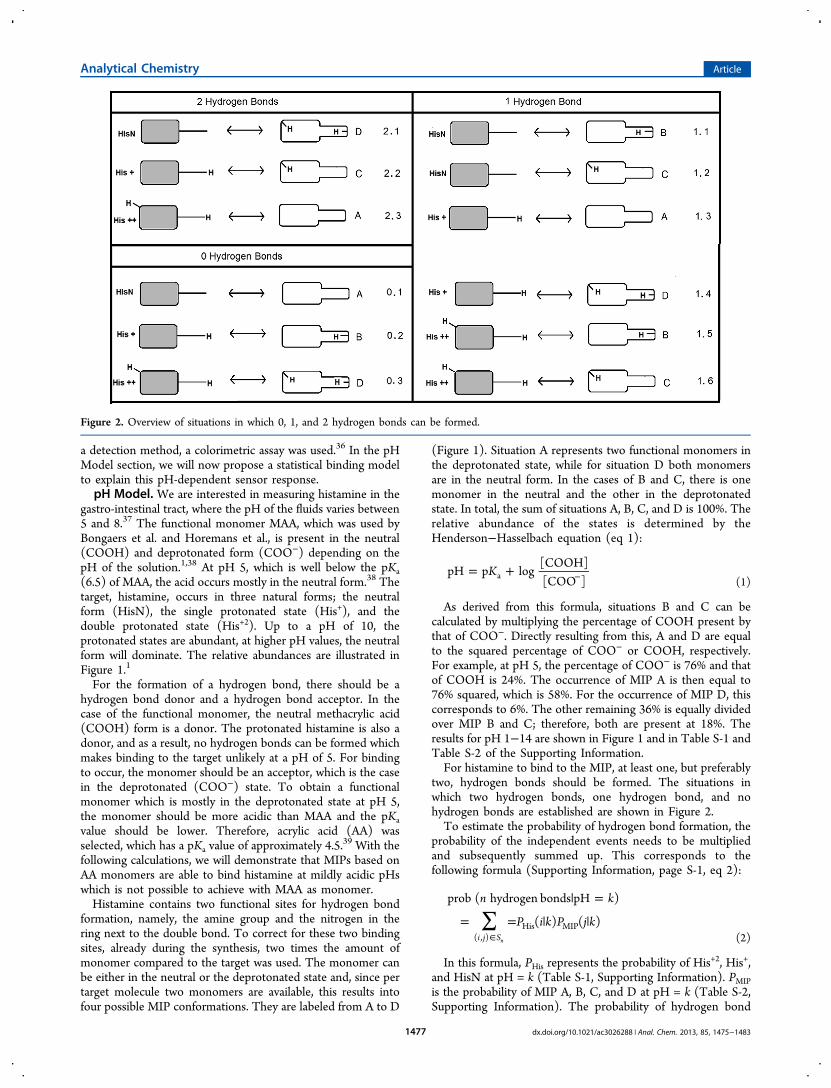
two, hydrogen bonds should be formed. The situations inwhich two hydrogen bonds, one hydrogen bond, and nohydrogen bonds are established are shown in Figure 2.To estimate the probability of hydrogen bond formation, the
probability of the independent events needs to be multipliedand subsequently summed up. This corresponds to thefollowing formula (Supporting Information, page S-1, eq 2):
∑| =
= = | |∈
n k
P i k P j k
prob ( hydrogen bonds pH )
( ) ( )i j S( , )
His MIPn (2)
In this formula, PHis represents the probability of His+2, His+,
and HisN at pH = k (Table S-1, Supporting Information). PMIPis the probability of MIP A, B, C, and D at pH = k (Table S-2,Supporting Information). The probability of hydrogen bond
Figure 2. Overview of situations in which 0, 1, and 2 hydrogen bonds can be formed.
Analytical Chemistry Article
dx.doi.org/10.1021/ac3026288 | Anal. Chem. 2013, 85, 1475−14831477

formation from pH 1 to 14 is shown in Table S-3, SupportingInformation. As an example, we calculate the probability of theformation of two hydrogen bonds at pH 6. At this pH,histamine is for 91% in the His +2 state and 9% in the His+ state,and HisN is not encountered. Therefore, options 2.1, 0.1, 1.1,and 1.2 (Figure 2) do not have to be taken into account. Theprobability of formation of 2 hydrogen bonds is equal to 2.2and 2.3 summed up. For option 2.2, the probability of His +
(9%) needs to be multiplied by the probability of MIP C (3%),resulting in a 0.3% probability. For option 2.3, His+2 (91%) ismultiplied by A (94%), which leads to 85.5% probability and, intotal, a probability of the formation of 2 hydrogen bonds of85.8%. Subsequently, the probability of 1 hydrogen bondformation is 13.9%, and the probability of 0 hydrogen bonds is0.3%.The probability of binding in the pH range of 1−14 was
calculated for the MIP with MAA monomers and for thedeveloped MIP based on AA monomers (Figure 3). The resultsof AA are shown in Table S-3 of the Supporting Information.
Figure 3 shows the probability of hydrogen bond formationfor the MAA and AA MIP in a broad pH range (pH 1−14).With these MIPs, it is not possible to perform measurements instrongly basic environments; however, this is outside the scopeof our research. Around neutral pH, both MIPs show a hightheoretical binding probability. As previously mentioned, theMAA MIP has a very low binding capacity at pH < 7 and istherefore not suitable for detection of histamine in acidicenvironments. In contrast to this, the newly developed MIPbased on AA has a theoretical binding probability of still 94% atpH 5, which is a significant improvement. We will now alsodemonstrate experimentally that histamine can be bound with ahigh affinity and selectivity at both neutral and mildly acidicpHs on the basis of the AA MIP. Furthermore, when combinedwith a refined sensor setup, we will show that it is possible todetect histamine in bowel fluids from the small intestines.
■ EXPERIMENTAL SECTIONChemical Reagents. Ethylene glycol dimethacrylate
(EGDM), methacrylic acid (MAA), acrylic acid (AA), and
dimethylsulfoxide (DMSO) were purchased from Acros (Geel,Belgium). Prior to polymerization, the stabilizers in the MAAand EGDM were removed by filtration over alumina.Azobusisobutyronitrile (AIBN) was purchased from Fluka(Buchs, Switzerland). The target molecule histamine wasobtained from Sigma Aldrich. Histidine, nicotine, serotonin,and betahistine, which are analogues of histamine and wereused to test the selectivity, were obtained from Fluka (Buchs,Switzerland). All solvents were of analytical grade. They werepurchased from Acros (Geel, Belgium) and used withoutfurther purification. The polyphenylenevinylene (PPV) deriv-ative, OC1C10-PPV, which served as the immobilization layeron the impedimetric sensor MIP and nonimprinted polymer(NIP) electrodes, was synthesized via the sulfinyl precursorroute.40 Besides MIP sensors, this PPV derivative can also beused for other bioanalytical applications, e.g., as an immobiliza-tion layer for antibodies.41 All chemical and physical propertiesof the conjugated polymer were in agreement with previouslyreported data. A homemade 1× phosphate buffered saline(PBS) solution was used for the impedance measurements. Thehuman histamine ELISA test was obtained from GentaurMolecular Products (Kampenhout, Belgium, product numberCSB E07042h).
MIP Synthesis. As mentioned in the introduction, it isnecessary to use a monomer with a lower pKa to detecthistamine in acidic environments. Therefore, acrylic acid (AA)with a pKa value of 4.5 was selected.39 The corresponding MIPwas synthesized according to the following procedure: First, amixture of AA (18 mmol), EGDM (72 mmol), and AIBN (0.61mmol) was dissolved in 7 mL of DMSO together with thetemplate molecule histamine (9.0 mmol). This solution wasdegassed with N2 and polymerized in a UV oven for 12 h. Afterpolymerization, the bulk polymer was ground and sieved toobtain microparticles with a size smaller than 25 μm. Finally,the histamine was removed from the MIP powders by Soxhletextraction with methanol (48 h), a mixture of acetic acid/acetonitrile (1/1) (48 h), and methanol again (12 h). Theextracted powders were dried in vacuum for 12 h at roomtemperature. A nonimprinted polymer (NIP) was synthesizedin the same way but without the presence of the targetmolecule. The selectivity of the MIP was tested by optical batchrebinding experiments using chemically similar structures ofhistamine, such as betahistine and histidine. Furthermore,serotonin and nicotine were used because they are similar insize. For the impedimetric measurements, a MIP imprintedwith betahistine was developed as an alternative test for theselectivity. The MIP was synthesized with the same procedureand same molar ratios, but instead of histamine, betahistine wasused as a template molecule. The MIP and NIP powdersmentioned here were used for all further batch-rebinding andimpedimetric measurements.
Preparation of Bowel Fluid and ELISA Test. Bowel fluidsamples from the duodenum were obtained from 3 healthyvolunteers, Persons 1, 2, and 3 and divided over 1 mLEppendorf tubes. After collection, the tubes were centrifugedwith 2000g to obtain a clear fluid. The samples were stored at−80 °C to prevent degradation. Prior to analysis, the sampleswere heated up to 37 °C and divided into different aliquots.One part remained unaltered, while from the other parts thenative histamine was removed by extraction. This was done byadding 10 mg of MIP powder to 3 mL of the bowel fluid. Thefluid mixture was shaken for 30 min to allow full absorption ofthe native histamine, followed by filtration to remove the MIP
Figure 3. Percentage of histamine bound by MIP synthesized fromMAA and AA monomers as calculated by the combinatorial affinitymodel. The gray area corresponds to the typical pH range in theintestinal tract (pH 5−8).37
Analytical Chemistry Article
dx.doi.org/10.1021/ac3026288 | Anal. Chem. 2013, 85, 1475−14831478

particles. The resulting extracted bowel fluid served as areference, and furthermore, upon addition of spiked concen-trations of 2.5, 5, 7.5, 25, and 50 μM, it was possible toconstruct a dose−response curve. Subsequently, the impedanceresponse of the unaltered sample was measured with freshlyprepared MIP and NIP electrodes. With the dose−responsecurve, the native histamine concentration could be calculated.With the unaltered samples, ELISA reference tests were
performed with the human histamine ELISA test from GentaurMolecular Products. All samples were measured in triplicate,and the histamine concentration was calculated by comparingthe optical density of the sample to that of the standard curve(Figure S-4, Supporting Information). For Person 1, thehistamine concentration was determined to be 870 nM ± 60.For Person 2, this was found to be 500 nM ± 50 nM, and forPerson 3, it was 460 ± 60 nM, respectively.Impedance-Spectroscopy Platforms. In previous work,
we have introduced a differential sensor-cell offering severaladvantages for biological measurements.42,43 With this setup,native serotonin plasma concentrations were measured withrelatively small uncertainties and the obtained results were infull agreement with HPLC reference tests.42 The flow-throughcell is made of PMMA and has an internal volume of 110 μL.During the measurements, the temperature was fixed to 37 ±0.02 °C using a homemade proportional-integral-derivative(PID) (P = 10, I = 5, D = 0.1) controller. The MIP- and NIP-coated electrodes (reference channel) were installed symmetri-cally with respect to a gold wire serving as a common counter
electrode. To construct the electrodes, 1 × 1 cm2 aluminumsubstrates were spincoated with conductive OC1C10-PPV.Equal amounts of the MIP and NIP powder were embeddedinto the layer by heating up the PPV above its glass transitiontemperature. The contact area of each electrode with the liquid(28 mm2) was defined by O-rings, and the distance to the goldcounter electrode was 1.7 mm. The impedance signals weremeasured with a homemade, portable system operating in afrequency range of 100 Hz to 100 kHz with 10 frequencies perdecade and a scanning speed of 5.7 s per sweep.42 Theamplitude of the AC voltage was fixed to 10 mV under opencircuit conditions.
■ RESULTS AND DISCUSSION
Optical Batch Rebinding Experiments. Batch rebindingexperiments were performed with a Varian Cary 500 UV−vis-NIR spectrophotometer (Leuven, Belgium). The performanceand selectivity of the synthesized MIPs were analyzed undervarious pH conditions. Furthermore, at pH 5, the selectivitywas evaluated with the analogues nicotine, serotonin, histidine,and betahistine (Figure S-1, Supporting Information).For the rebinding experiments, 20 mg of MIP or NIP powder
was added to 5 mL of aqueous histamine concentrations in therange between 0.1 and 1.0 mM. The pH of the aqueoussolutions was adjusted between pH 4 and 9 by the addition of ahydrochloric acid solution or a sodium hydroxide solution. Theresulting suspensions were shaken for 1 h on a rocking table at
Figure 4. Binding isotherms for the MIP (a) and NIP (b) at pH 4−9. To directly compare the MIP and NIP, the imprint factors (Sb MIP/Sb NIP) ata free concentration of 0.05 mM were calculated in the pH range of 4−9. (c). The data was fitted with an allometric function of the type y = axb (R2
= 0.95).
Analytical Chemistry Article
dx.doi.org/10.1021/ac3026288 | Anal. Chem. 2013, 85, 1475−14831479

room temperature. After filtration, the free concentration (Cf)of histamine was determined by UV−vis spectroscopy. Hereby,the amount of bound histamine per gram of MIP or NIP wascalculated (Sb), and the binding isotherms were constructed.The binding isotherms for the MIP and NIP of AA for pH 4−9are demonstrated in Figure 4a,b. Furthermore, the imprintfactor at a given concentration (0.05 mM) was calculated. Thisrefers to the amount of target molecules bound per gram of theMIP divided by that of the NIP and is a measure of thespecificity (Sb MIP/Sb NIP). The results in the pH range of 4−9 are plotted in Figure 4c.The binding isotherms of the MIP (Figure 4a) and NIP
(Figure 4b) show that at pH 4 the binding is mostly aspecific,while from pH 5 to 9 histamine can be detected selectively.This can be explained by the statistical binding analysis model.At pH 4, there is only a low probability (24%) of hydrogenbond formation. The theoretical probability of binding in thepH region of 5−9 is above 90%, which indicates that the MIPsare able to bind the target selectively as indeed is observed fromexperiments. This is confirmed by Figure 4c, which shows theimprint factor, which is significantly lower (1.5) than at pH 5−9 (∼4.5). The lower the imprint factor, the less selective is thebinding of histamine.There are several models to describe such binding isotherms.
The Langmuir model assumes that all the binding sites arehomogeneous, which is clearly not the case with MIPs as thereare aspecific and specific affinity sites. To correct for theseheterogeneous binding sites, the Langmuir−Freundlich orFreundlich model can be applied.44 These models resultedboth in a fit with a high linearity coefficient (R2 = 0.98).However, it was decided to show the results of the Freundlichmodel, as this uses one parameter less than the Langmuir−Freundlich model (Figure S-5, Supporting Information). Theseisotherms show the distribution of the affinity sites by plottingthe binding energy (Ki) versus that of the number of sitespresent (N(Ki)). The sites with a low binding affinitycorrespond to the aspecific binding, while the high affinitybinding sites represent the specific binding. The total numberof binding sites for the MIP was 114 ± 0.9 μmol/g, while thatfor the NIP is considerably lower with 21 ± 0.4 μmol/g (i.e., animprint factor of 5.4). Hereby, it is proven that the MIPsynthesized from acrylic acid, in contrast to the MIPsynthesized from methacrylic acid, can specifically detecthistamine at pH value as low as 5.To further test the selectivity, the binding of a number of
related molecules was investigated. Histidine was used as ananalogue in previous articles1,2 due to its biological relevance,being the natural precursor of histamine. In its chemicalstructure, however, there is a significant difference: Histidine isan acid while histamine acts as a base. Therefore, we studiedalso the response of betahistine, which is chemically moresimilar to histamine. The only difference is that the aminegroup of the histamine molecule is substituted by a methylgroup (S-1). The binding isotherms obtained with histamineand the analogues are presented in Figure S-2 of the SupportingInformation. From this graph, we can observe that the MIPsbind no more of the chosen analogues than the reference NIPbinds histamine, and therefore, the selectivity of the MIP isproven. Furthermore, as betahistine binds relatively the most tothe MIP, this was chosen as an analogue for the impedancemeasurements.Impedance Spectroscopy in PBS Buffer. Histamine
occurs mostly in acidic fluids, such as saliva, stomach fluid, and
gastric fluid. It is of clinical relevance to measure in gastric fluid,as an increase in concentration could be a possible marker ofirritable bowel syndrome (IBS).11,12 The normal histamineconcentration ranges from 500 to 1000 nM, which wasdetermined by ELISA tests (Preparation of Bowel Fluid andELISA Test). The pH lies between pH 5 and 7.5, meaning thatit can vary from slightly acidic to slightly basic.38 Before directlymeasuring biological fluid, the specificity and selectivity wastested in phosphate buffer solution. To cover the entire pHrange of bowel fluids, measurements were performed at pH 5and 7.MIP and corresponding NIP particles were immobilized onto
the aluminum electrodes with the procedure described by R.Thoelen et al.45 By optical microscopy in combination withimage processing (Image J software), the surface coverage wasdetermined to be 27% ± 2.0 for the MIP and 26% ± 3.0 for theNIP-loaded electrode. Therefore, the precondition for differ-ential measurements, having identical particle loadings, isfulfilled. Next, the flow-through cell was filled with PBS buffer.After stabilizing the cell with PBS (respectively pH 5 or 7) for45 min, increasing concentrations (50−1000 nM) of histaminewere added. The corresponding dose−response curves at afrequency of 316 Hz are shown in Figure 5. This frequency was
selected for two reasons. First, the signal was very stable withonly a standard deviation of 0.1% on the impedance. Thisensures a high signal-to-noise ratio, which is approximately 10at a concentration of 50 nM in PBS, pH 5. Additionally, we canmake an estimation of the detection limit. The limit ofdetection is commonly defined as three times this standarddeviation. Hereby, a detection limit of 15 nM is achieved inbuffer solution. This is well below the physiologically relevantconcentration, which is 500 nM or higher. Second, it waspreviously demonstrated that the effect upon binding is mainlycapacitive,38 and therefore, especially, the low frequency regimeshould be investigated.The impedance data for each concentration were normalized
with respect to a starting value of 100% pure PBS, prior toaddition of the target molecule. After the addition step, the
Figure 5. Dose−response curve for MIP and NIP exposed toincreasing concentrations of histamine in PBS. At pH 7, data points areshown as solid squares (MIP) and open squares (NIP). At pH 5, thedata points are shown are solid circles (MIP) and open circles (NIP).The error bars are indicated, but if applicable, they can be smaller thanthe symbol size. The used fit was allometric (y = axb, with R2 = 0.98).
Analytical Chemistry Article
dx.doi.org/10.1021/ac3026288 | Anal. Chem. 2013, 85, 1475−14831480
sensor was left to stabilize for 10 min. The response value wasthen obtained by averaging five data points with an interval of 1min. Hereby, the measuring time was not significantlyprolonged, and impedance data scattering was reduced to aminimum.The impedance results confirmed that the MIP based on AA
monomers can detect histamine at pH 5. In the 0−400 nMrange of histamine in PBS with a pH 5, the dose−responseresults can be represented well with a linear fit (R2 = 0.99). Forthe physiologically relevant concentration range (500−1000nM), the data is best represented with an allometric fit (R2 =0.98) which is due to an increasing occupation of the bindingsites. However, there is still a significant difference between theimpedance response at 500 nM (109.9% ± 0.2) compared to1000 nM (112.2% ± 0.1), which allows discrimination betweennormal and elevated values of histamine.To test the selectivity, impedance measurements were
performed within the same concentration range for betahistine(0−1000 nM) as was done for histamine. Additionally,histamine measurements in the presence of an excess of 1000times serotonin were performed, which did not significantlyalter the obtained results. To test the cross selectivity, a MIPwas synthesized using betahistine as the template molecule.The protocol was kept the same as for histamine; for the exactrecipe, we refer to MIP Synthesis. This MIP was alsoincorporated into the sensor setup, and subsequently,impedimetric measurements were performed with increasingbetahistine concentrations (0−750 nM). The obtained resultsat a frequency of 316 Hz are shown in Figure S-3 of theSupporting Information. As the binding is significantly less thanthat of the MIP, we can conclude that we can measurehistamine specifically and selectively in the desired pH range5−8
of biological samples. In the rare case that the pH of a patient’ssample is lower than 5, one can adjust the pH by NaOHaddition or by dilution in order to perform the analysis withinthe specified pH range of the sensor. For measurements inhighly acidic samples, one may also consider MIPs synthesizedfrom a monomer with a lower pKa value.Histamine in Bowel Fluid and ELISA Tests. As a final
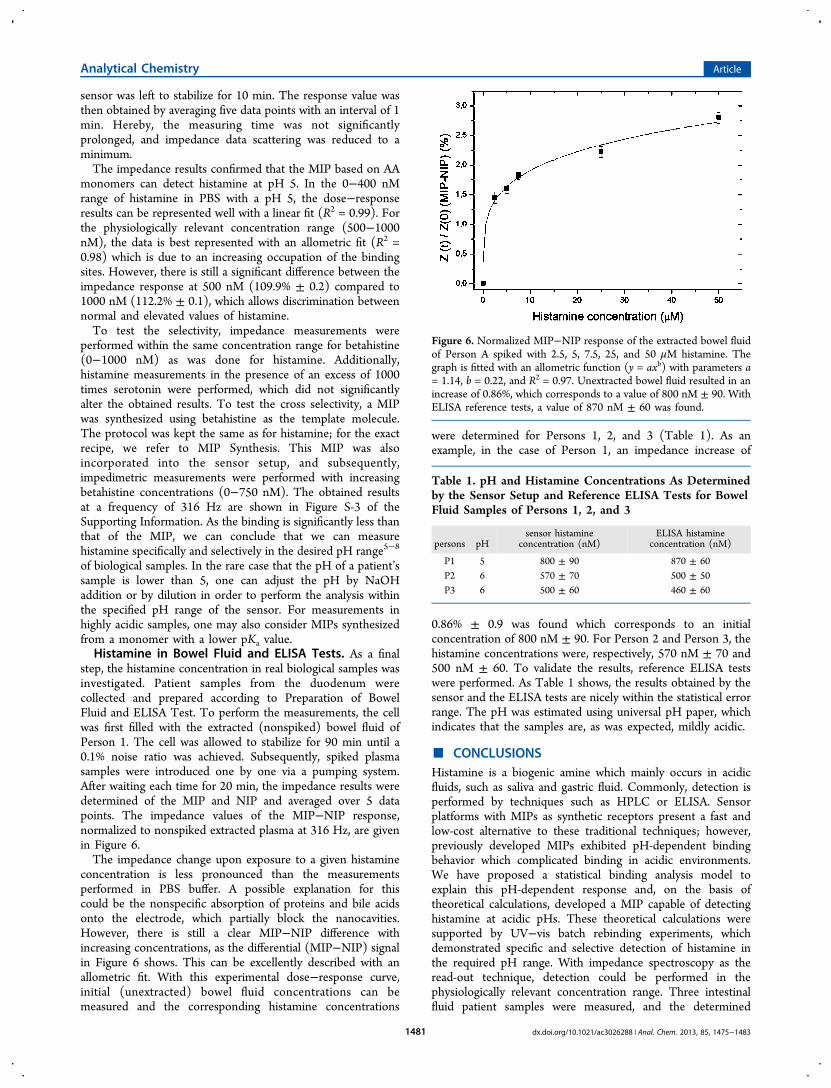
step, the histamine concentration in real biological samples wasinvestigated. Patient samples from the duodenum werecollected and prepared according to Preparation of BowelFluid and ELISA Test. To perform the measurements, the cellwas first filled with the extracted (nonspiked) bowel fluid ofPerson 1. The cell was allowed to stabilize for 90 min until a0.1% noise ratio was achieved. Subsequently, spiked plasmasamples were introduced one by one via a pumping system.After waiting each time for 20 min, the impedance results weredetermined of the MIP and NIP and averaged over 5 datapoints. The impedance values of the MIP−NIP response,normalized to nonspiked extracted plasma at 316 Hz, are givenin Figure 6.The impedance change upon exposure to a given histamine
concentration is less pronounced than the measurementsperformed in PBS buffer. A possible explanation for thiscould be the nonspecific absorption of proteins and bile acidsonto the electrode, which partially block the nanocavities.However, there is still a clear MIP−NIP difference withincreasing concentrations, as the differential (MIP−NIP) signalin Figure 6 shows. This can be excellently described with anallometric fit. With this experimental dose−response curve,initial (unextracted) bowel fluid concentrations can bemeasured and the corresponding histamine concentrations
were determined for Persons 1, 2, and 3 (Table 1). As anexample, in the case of Person 1, an impedance increase of
0.86% ± 0.9 was found which corresponds to an initialconcentration of 800 nM ± 90. For Person 2 and Person 3, thehistamine concentrations were, respectively, 570 nM ± 70 and500 nM ± 60. To validate the results, reference ELISA testswere performed. As Table 1 shows, the results obtained by thesensor and the ELISA tests are nicely within the statistical errorrange. The pH was estimated using universal pH paper, whichindicates that the samples are, as was expected, mildly acidic.
■ CONCLUSIONSHistamine is a biogenic amine which mainly occurs in acidicfluids, such as saliva and gastric fluid. Commonly, detection isperformed by techniques such as HPLC or ELISA. Sensorplatforms with MIPs as synthetic receptors present a fast andlow-cost alternative to these traditional techniques; however,previously developed MIPs exhibited pH-dependent bindingbehavior which complicated binding in acidic environments.We have proposed a statistical binding analysis model toexplain this pH-dependent response and, on the basis oftheoretical calculations, developed a MIP capable of detectinghistamine at acidic pHs. These theoretical calculations weresupported by UV−vis batch rebinding experiments, whichdemonstrated specific and selective detection of histamine inthe required pH range. With impedance spectroscopy as theread-out technique, detection could be performed in thephysiologically relevant concentration range. Three intestinalfluid patient samples were measured, and the determined
Figure 6. Normalized MIP−NIP response of the extracted bowel fluidof Person A spiked with 2.5, 5, 7.5, 25, and 50 μM histamine. Thegraph is fitted with an allometric function (y = axb) with parameters a= 1.14, b = 0.22, and R2 = 0.97. Unextracted bowel fluid resulted in anincrease of 0.86%, which corresponds to a value of 800 nM ± 90. WithELISA reference tests, a value of 870 nM ± 60 was found.
Table 1. pH and Histamine Concentrations As Determinedby the Sensor Setup and Reference ELISA Tests for BowelFluid Samples of Persons 1, 2, and 3
persons pHsensor histamine
concentration (nM)ELISA histamine
concentration (nM)
P1 5 800 ± 90 870 ± 60P2 6 570 ± 70 500 ± 50P3 6 500 ± 60 460 ± 60
Analytical Chemistry Article
dx.doi.org/10.1021/ac3026288 | Anal. Chem. 2013, 85, 1475−14831481

histamine concentrations were in nice agreement with ELISAreference tests. Summarizing, we have developed a fast and low-cost method to detect histamine selectively in bowel fluids withthe possibility of transferring the techniques to other analytes inan array format.
■ ASSOCIATED CONTENT*S Supporting InformationInformation about the statistical binding model and theselectivity of the used MIPs. This material is available free ofcharge via the Internet at http://pubs.acs.org.
■ AUTHOR INFORMATIONCorresponding Author*Address: Hasselt University, Institute for Materials ResearchIMO, Wetenschapspark 1, B-3590 Diepenbeek/Belgium.Phone: 0032-11-268876. Fax: 0032-11-268899. E-mail:[email protected] ContributionsThe manuscript was written through contributions of allauthors. All authors have given approval to the final version ofthe manuscript.NotesThe authors declare no competing financial interest.
■ ACKNOWLEDGMENTSThis work was supported by the Life-Science Initiative of theProvince of Limburg, the Special Research Funds BOF ofHasselt University, and the Erasmus Programme of theEuropean Union. The authors gratefully acknowledge technicalsupport by H. Penxten, J. Soogen, J. Baccus, H. Bove, M. Peters,M. De Meyer, and N. Tuyluoglu. Also, we appreciate B. Saldenfrom Maastricht University Medical Center for providing theintestinal fluid samples and Dr. L. Tolhuizen from PhilipsResearch, Eindhoven, The Netherlands, for his help on thestatistical binding model analysis.
■ REFERENCES(1) Bongaers, E.; Alenus, J.; Horemans, F.; Weustenraed, A.; Lutsen,L.; Vanderzande, D.; Cleij, T. J.; Troost, F. J.; Brummer, R.-J.; Wagner,P. Phys. Status Solidi A 2010, 207, 837−843.(2) Horemans, F.; Alenus, J.; Bongaers, E.; Weustenraed, A.;Thoelen, R.; Duchateau, J.; Lutsen, L.; Vanderzande, D. Sens.Actuators, B 2010, 148, 392−398.(3) Dale, H. H.; Laidlaw, P. P. J. Physiol. 1910, 41, 318−44.(4) Paul, W. Fundamental Immunology, 2nd ed.; Raven Press: NewYork, 1984; pp 716−720.(5) Metcalfe, D.; Baram, D.; Mekori, Y. Physiol. Rev. 1997, 77, 1033−79.(6) Rang, H.; Dale, M.; Ritter, J.; Gardner, P. Pharmacology, 3rd ed.;Churchill Livingstone: New York, 1995; pp 226−229.(7) Harsing, L. G., Jr.; Nagashima, H.; Duncalf, D.; Vizi, E. S.;Goldiner, P. L. Clin Chem. 1986, 32, 1823−1827.(8) Lin, R. Y.; Schwartz, L. B.; Curry, A.; Pesola, G. R.; Hee, H. S.;Bakalchuk, L.; Tenenbaum, C.; Westfal, R. E. J. Allergy Clin. Immunol.2000, 106, 65−71.(9) Schwartz, J. C.; Pollard, H.; Quach, T. T. J. Neurochem. 1980, 35,26−33.(10) Lehane, L.; Olley, J. Int. J. Food Microbiol. 2000, 58, 1−37.(11) Barbara, G.; Stanghellini, V.; De Giorgio, R.; Cremon, C.;Cottrell, G. S.; Santini, D.; Pasquinelli, G.; Morselli-Labate, A. M.;Grady, E.F.; Bunnett, N. W.; Collins, S. M.; Corinaldesi, R.Gastroenterology 2004, 126, 693−702.(12) Wood, J. D. Gut 2006, 55, 445−447.
(13) Chhabra, Y. Z.; Li, H.; Alkhouri, A. E.; Blake, Q.; Armour, C. L.;Hughes, J. M. Eur. Respir. J. 2007, 29, 861−870.(14) Adlesic, M.; Verdrengh, M.; Bokarewa, M.; Dahlberg, J.; Foster,S. J.; Tarkowski, A. Scand. J. Immunol. 2007, 65, 530−537.(15) Jackson, J. A.; Riordan, H. D.; Neathery, B. S. J. Orthomol.Psychiatry 1998, 13, 236−240.(16) Yoshitake, T.; Ichinose, F.; Yoshida, H.; Todoroki, K.; Kehr, J.;Inoue, O.; Nohta, H.; Yamaguchi, M. Biomed. Chromatogr. 2003, 17,509−516.(17) Keyzer, J. J.; Wolthers, B. G.; Muskiet, F. A.; Breukelman, H.;Kauffman, H. F.; De Vries, K. Anal. Biochem. 1984, 139, 474−481.(18) Ujike, A.; Ishikawa, Y.; Ono, M.; Yuasa, T.; Yoshino, T.;Fukumoto, M.; Ravetch, J. V.; Takai, T. J. Exp. Med. 1999, 10, 1573−1579.(19) Sarada, B. V.; Rao, T. N.; Tryk, D. A.; Fujishima, A. Anal. Chem.2000, 72, 1632−1638.(20) Bitziou, E.; O’Hare, D.; Patel, B. A. Anal. Chem. 2008, 80,8733−8740.(21) Bitziou, E.; Patel, B. A. Am. J. Physiol. Gastrointest. Liver Physiol.2012, 303, 396−403.(22) Mochizuki, T.; Yamatodani, A.; Okakura, M.; Takemura, M.;Inagaki, N.; Wada, H. Naunyn-Schmiedeberg’s Arch. Pharmacol. 1991,343, 190−195.(23) Itoh, Y.; Oishi, R.; Nishibori, M.; Saeki, K. J. Neurochem. 1991,56, 769−774.(24) Mosbach, K. Trends Biochem. Sci. 1994, 19, 9−14.(25) Piletsky, S. A.; Parhometz, Y. P.; Lavryk, N. V.; Panasyuk, T. L.;El’skaya, A. V. Sens. Actuators, B 1994, 19, 629−631.(26) Ramanavicius, A.; Finkelsteinas, A.; Cesiulis, H.; Ramanaviciene,A. Bioelectrochemistry 2010, 79, 11−16.(27) Wulff, G. Trends Biotechnol. 1993, 11, 85−87.(28) Arshady, R.; Mosbach, K. Chem. Phys. 1981, 182, 687−692.(29) Owens, K.; Karlsson, L.; Lutz, E. S. M.; Andersson, L. I. TrAC,Trends Anal. Chem. 1999, 18, 146−154.(30) Sellergren, B.; Allender, C. J. Adv. Drug Delivery Rev. 2005, 57,1733−1741.(31) Spivak, D. A. Adv. Drug Delivery Rev. 2005, 57, 1779−1794.(32) Tong, A.; Dong, H.; Li, L. Anal. Chim. Acta 2002, 466, 31−37.(33) Allender, C. J.; Richardson, C.; Woodhouse, B.; Heard, C. M.;Brain, K. R. Int. J. Pharm. 2000, 195, 39−43.(34) Pietrzyk, A. S.; Suriyanarayanan, S.; Kutner, W.; Chitta, R.;D’Souza, F. Anal. Chem. 2009, 81, 2633−2643.(35) Jenik, M.; Schirhagl, R.; Schirk, C.; Hayden, O.; Lieberzeit, P.;Blaas, D.; Paul, G.; Dickert, F. Anal. Chem. 2009, 81, 5320−5326.(36) Trikka, F.; Yoshimatsu, K.; Ye, L.; Kyriakidis, D. Amino Acids2012, DOI: 10.1007/s00726-012-1297-8.(37) Evans, D. F.; Pye, G.; Bramley, R.; Clark, A. G.; Dyson, T. J.;Hardcastle, J. D. Gut 1988, 29, 1035−1041.(38) Izumrudov, E. K.; Sukhishvili, S. A. Biomacromolecules 2005, 6,1782−1788.(39) Fujiwara, M.; Grubbs, R.; Baldeschwieler, J. D. J. Colloid InterfaceSci. 1997, 185, 210−216.(40) Louwet, D.; Vanderzande, J.; Gelan, A. Synth. Met. 1995, 69,509−510.(41) Cooreman, P.; Thoelen, R.; Manca, J.; vandeVen, M.;Vermeeren, V.; Michiels, L.; Ameloot, M.; Wagner, P. Biosens.Bioelectron. 2005, 10, 2151−2156.(42) Van Grinsven, B.; Vanden Bon, N.; Grieten, L.; Murib, M.;Janssens, S. D.; Haenen, K.; Schneider, E.; Ingebrandt, S.; Schoning,M. J.; Vermeeren, V.; Ameloot, M.; Michiels, L.; Thoelen, R.; DeCeuninck, W.; Wagner, P. Lab Chip 2011, 11, 1656−1663.(43) Peeters, M.; Troost, F. J.; Van Grinsven, B.; Horemans, F.;Alenus, J.; Murib, M. S.; Keszthelyi, D.; Ethirajan, A.; Thoelen, R.;Cleij, T. J.; Wagner, P. Sens. Actuators, B 2012, 171, 602−610.(44) Umpleby, R. J.; Baxter, S. C.; Rampey, A. M.; Rushton, G. T.;Chen, Y. Z.; Shimizu, K. D. J. Chromatogr., B: Anal. Technol. Biomed.Life Sci. B 2004, 804, 141−149.
Analytical Chemistry Article
dx.doi.org/10.1021/ac3026288 | Anal. Chem. 2013, 85, 1475−14831482

(45) Thoelen, R.; Vansweevelt, R.; Duchateau, J.; Horemans, F.;D’Haen, J.; Lutsen, L.; Vanderzande, D.; Ameloot, M.; vandeVen, M.;Cleij, T. J.; Wagner, P. Biosens. Bioelectron. 2008, 23, 913−918.
Analytical Chemistry Article
dx.doi.org/10.1021/ac3026288 | Anal. Chem. 2013, 85, 1475−14831483