Bioactive Hydrogel Layers on Microdisk Electrode Arrays: Impedimetric Characterization and...
10
Full Paper Bioactive Hydrogel Layers on Microdisk Electrode Arrays: Impedimetric Characterization and Equivalent Circuit Modeling Abdur Rub Abdur Rahman, a Gusphyl Justin, a Anthony Guiseppi-Elie a, b, c * a Center for Bioelectronics, Biosensors and Biochips (C3B), Clemson University, 100 Technology Drive, Anderson, South Carolina 29625, USA b Department of Chemical and Biomolecular Engineering, Clemson University, Clemson, South Carolina 29634, USA c Department of Bioengineering, Clemson University, Clemson, South Carolina 29634, USA *e-mail: [email protected] Received: November 8, 2008 Accepted: February 16, 2009 Abstract Microfabricated microdisk electrode arrays (MDEAs) of 50 mm (5184 disks), 100 mm (1296 disks) and 250 mm (207 disks) (d/r ¼ 4; A ¼ 0.1 cm 2 ) were coated with poly(hydroxyethylmethacrylate)-based hydrogel membranes and studied by electrochemical impedance spectroscopy (EIS) in 1.0 mM ferrocene monocarboxylic acid (FcCO 2 H). Equivalent circuit modeling showed an approximate three-fold increase in solution resistance, R sol , and an order of magnitude increase in charge transfer resistance, R ct, resulting from a reduction in apparent diffusivity of FcCO 2 H. Additionally, both resistive parameters decreased while the capacitance (Q) increased with decreasing microdisk diameter; consistent with an increase in effective electroactive area. The hydrogel layer did not compromise enhanced mass transport achieved by the MDEA and thus may be used to advantage in biosensors. Keywords: Hydrogels, Microdisk arrays, Biosensors, Electrochemical impedance spectroscopy, Modeling DOI: 10.1002/elan.200804540 1. Introduction The development of soft condensed bioactive and electro- active electrode interfaces for in vivo applications such as deep brain stimulation (DBS) electrodes [1, 2], implantable biosensors [3, 4], and electrostimulated drug release devices [5] is a rich and promising area of bioelectronics. Such interfaces are facilitated by the development of molecularly engineered hydrogels with built-in plural-functionality [6]. Within this group, the in vivo electrochemical biosensors are promising tools for clinical applications involving real time medical diagnostics linked to therapeutic intervention [7, 8]. A critical constraint in the design of implantable biotrans- ducers is that the overall electroactive area should be minimized while achieving maximum signal, maximum signal-to-noise, high sensitivity, low detection limit and wide dynamic range.[9] To accommodate these conflicting design constraints, innovative microelectrode geometries, as opposed to the single continuous electrode surface, have been designed and investigated [10]. It has been demon- strated that mass transport to microfabricated electrodes, and hence current densities, can be greatly enhanced by specific arrangements of disk electrodes [11, 12]. One such geometry that has been widely used in electrochemical sensing and shown to display enhanced mass transport is the microdisk electrode array (MDEA) [13, 14]. MDEAs comprise a collection of interconnected disks arrayed in cubic or hexagonal closed packed (HCP) fashion. The individual circular disk shape does not possess sharp corners and hence achieves a relatively uniform flux distribution compared to other disk geometries. Micro- electronic fabrication processes facilitate the production of MDEAs with a high density of disks [15]. The electro- chemical responses at microelectrodes differ from those seen at meso- and macroelectrodes due to the fact that, when operated on a time scale of seconds, the dimensions of the electrode are much smaller than the diffusion distance for molecules in solution. This leads to a steady-state current characteristic resulting from deviation from planar diffu- sion. Microelectrodes are also widely used in electroanalysis due to their reduced ohmic (IR) drop, increased spatial resolution, increased current densities due to enhanced mass transport (radial diffusion) and a favorable Faradaic to capacitive current ratio. All of these qualities allow for lower detection limits and greater sensitivities in comparison to macroelectrodes. The signal-to-noise ratio (SNR) is greatly improved by using an array of microdisks where single microdisks are effectively wired in parallel, and wherein each microdisk is capable of acting diffusionally independ- ent, generating a signal which may be thousands of times larger than single electrodes of equivalent area [16, 17]. The design and performance criteria of such devices when located within a tissue bed or when paired with a biorecog- nition membrane layer, however, continue to be unexplored and undeveloped. 1135 # 2009 Wiley-VCH Verlag GmbH&Co. KGaA, Weinheim Electroanalysis 2009, 21, No. 10, 1135 – 1144
-
Upload
independent -
Category
Documents
-
view
1 -
download
0
Transcript of Bioactive Hydrogel Layers on Microdisk Electrode Arrays: Impedimetric Characterization and...

Full Paper
Bioactive Hydrogel Layers on Microdisk Electrode Arrays:Impedimetric Characterization and Equivalent Circuit Modeling
Abdur Rub Abdur Rahman,a Gusphyl Justin,a Anthony Guiseppi-Eliea, b, c*a Center for Bioelectronics, Biosensors and Biochips (C3B), Clemson University, 100 Technology Drive, Anderson, South Carolina
29625, USAb Department of Chemical and Biomolecular Engineering, Clemson University, Clemson, South Carolina 29634, USAc Department of Bioengineering, Clemson University, Clemson, South Carolina 29634, USA*e-mail: [email protected]
Received: November 8, 2008Accepted: February 16, 2009
AbstractMicrofabricated microdisk electrode arrays (MDEAs) of 50 mm (5184 disks), 100 mm (1296 disks) and 250 mm (207disks) (d/r¼ 4; A¼0.1 cm2) were coated with poly(hydroxyethylmethacrylate)-based hydrogel membranes andstudied by electrochemical impedance spectroscopy (EIS) in 1.0 mM ferrocene monocarboxylic acid (FcCO2H).Equivalent circuit modeling showed an approximate three-fold increase in solution resistance, Rsol, and an order ofmagnitude increase in charge transfer resistance, Rct, resulting from a reduction in apparent diffusivity of FcCO2H.Additionally, both resistive parameters decreased while the capacitance (Q) increased with decreasing microdiskdiameter; consistent with an increase in effective electroactive area. The hydrogel layer did not compromise enhancedmass transport achieved by the MDEA and thus may be used to advantage in biosensors.
Keywords: Hydrogels, Microdisk arrays, Biosensors, Electrochemical impedance spectroscopy, Modeling
DOI: 10.1002/elan.200804540
1. Introduction
The development of soft condensed bioactive and electro-active electrode interfaces for in vivo applications such asdeep brain stimulation (DBS) electrodes [1, 2], implantablebiosensors [3, 4], and electrostimulated drug release devices[5] is a rich and promising area of bioelectronics. Suchinterfaces are facilitated by the development of molecularlyengineered hydrogels with built-in plural-functionality [6].Within this group, the in vivo electrochemical biosensors arepromising tools for clinical applications involving real timemedical diagnostics linked to therapeutic intervention [7, 8].A critical constraint in the design of implantable biotrans-ducers is that the overall electroactive area should beminimized while achieving maximum signal, maximumsignal-to-noise, high sensitivity, low detection limit andwide dynamic range.[9] To accommodate these conflictingdesign constraints, innovative microelectrode geometries, asopposed to the single continuous electrode surface, havebeen designed and investigated [10]. It has been demon-strated that mass transport to microfabricated electrodes,and hence current densities, can be greatly enhanced byspecific arrangements of disk electrodes [11, 12]. One suchgeometry that has been widely used in electrochemicalsensing and shown to display enhanced mass transport is themicrodisk electrode array (MDEA) [13, 14].
MDEAs comprise a collection of interconnected disksarrayed in cubic or hexagonal closed packed (HCP) fashion.
The individual circular disk shape does not possess sharpcorners and hence achieves a relatively uniform fluxdistribution compared to other disk geometries. Micro-electronic fabrication processes facilitate the production ofMDEAs with a high density of disks [15]. The electro-chemical responses at microelectrodes differ from thoseseen at meso- and macroelectrodes due to the fact that,when operated on a time scale of seconds, the dimensions ofthe electrode are much smaller than the diffusion distancefor molecules in solution. This leads to a steady-state currentcharacteristic resulting from deviation from planar diffu-sion. Microelectrodes are also widely used in electroanalysisdue to their reduced ohmic (IR) drop, increased spatialresolution, increased current densities due to enhancedmass transport (radial diffusion) and a favorable Faradaic tocapacitive current ratio. All of these qualities allow for lowerdetection limits and greater sensitivities in comparison tomacroelectrodes. The signal-to-noise ratio (SNR) is greatlyimproved by using an array of microdisks where singlemicrodisks are effectively wired in parallel, and whereineach microdisk is capable of acting diffusionally independ-ent, generating a signal which may be thousands of timeslarger than single electrodes of equivalent area [16, 17]. Thedesign and performance criteria of such devices whenlocated within a tissue bed or when paired with a biorecog-nition membrane layer, however, continue to be unexploredand undeveloped.
1135
� 2009 Wiley-VCH Verlag GmbH & Co. KGaA, Weinheim Electroanalysis 2009, 21, No. 10, 1135 – 1144

There is continued tremendous interest in the developmentof implantable micro glucose, lactate and glutamate mea-surement devices [18]. There are strong correlations betweenglucose levels in the blood and in the interstitial fluid and theliterature strongly indicates the feasibility and advantages oftissue values over systemic or blood values [19, 20]. However,there are considerable challenges in the development ofintramuscular bioanalytical devices that must be addressed inorder to make this feasible. Among these are; the long termforeign body response leading to device encapsulation [21],the tissue appropriate modulus of the device-tissue interface[22], the physical movement of the implanted device withinthe body [23], device insertion rates [24], and the associatedimplanted tissue trauma. The biocompatibility and implan-tation duration of the in vivo biosensor can be greatlyimproved by coating the electrode surface or encapsulatingthe device with a bioactive hydrogel layer. Such an hydrogellayer can potentially provide the highly hydrated milieu tosupport the three dimensional immobilization of biorecog-nition moieties such as enzymes, bioactive peptides andenzyme-mediator conjugates; and to do so with high stabilityand with little loss of bioactivity [9] [4]. Proper character-ization of ion and small molecule transport through thesehydrogel layers is vital to the in vivo performance of thesebioelectronic and bioanalytical devices.
In this work, three gold microdisk electrode arrays(MDEA) with the same (0.1 cm2) collective electrodearea, but possessing different diameters of individual disks;250, 100 and 50 mm, were electrochemically characterizedby electrochemical impedance spectroscopy (EIS) in thepresence and absence of fixed thickness hydrogel layers(60 mm). Using ferrocene monocarboxylic acid, a potentialredox mediator, as a probe, EIS was performed on thevarious MDEAs for electrochemical characterization. Withthese characterization experiments, we gain insight into thetransport characteristics of the MDEA transducers in thepresence and absence of a hydrogel layer and converge upondesign parameters when the MDEA carries a biorecogni-tion layer. With this understanding, an appropriate elec-trode array can be designed which possesses favorablecharacteristics for tissue implantation, such as, molecular-level biocompatibility, nano-topology and appropriate elas-tic modulus for favorable bioanalytical performance. Thedata obtained from these experiments will also provide thedesign criteria for electronic circuits to support ampero-metric, voltammetric and impedimetric transduction andmeasurement of electrochemical signals from implantedbiotransducers.
2. Experimental
2.1. Materials
2.1.1. Reagents
2-Hydroxyethyl methacrylate (HEMA), tetraethylenegly-col diacrylate (TEGDA, technical grade), N-[tris(hydroxy-
methyl)methyl]-acrylamide, (HMMA, 93%), 2,2-dime-thoxy-2-phenylacetophenone (DMPA, 99%), (3-aminopro-pyl)trimethoxysilane (g-APS, 97%), 3-mercapto-1-propa-nol (95%) were purchased from Sigma-Aldrich Co. (St.Louis, MO, USA). Poly(ethylene glycol)(200)monometha-crylate (PEG(200)MA) was purchased from PolySciences,(Warrington, PA, USA) and the heterobifunctional poly-ethylene glycol (PEG) derivative, acryloyl(polyethylene-glycol)-N-hydroxysuccinamide (MW � 3500) (Acryl-PEG(3500)-NHS), was purchased from Jenkem TechnologyUSA (Allen, TX, USA) or Nektar Therapeutics, (Hunts-ville, AL). Each of the diacyrlate or methacrylate reagentswas passed over inhibitor removal columns (Sigma-Aldrich,St. Louis, MO) (for removal of hydroquinone and mono-methyl ether hydroquinone polymerization inhibitors)before use. Ferrocene monocarboxylic acid (FcCO2H,97%, Sigma-Aldrich) was used as received. A 0.1 M Trisbuffer solution (adjusted to pH 7.2 using 1 M HCl) wasmade from tris(hydroxymethyl)aminomethane or Trizma(99.8þ%, A.C.S., Sigma-Aldrich). Trichloroethylene(spectrophotometric grade, �99.5% , Sigma-Aldrich), ace-tone (�99.9%, Sigma-Aldrich), 2-propanol (�99.8%, Sig-ma-Aldrich), ammonium hydroxide solution (ACS reagent,28.0 – 30.0% as NH3, Sigma-Aldrich), hydrogen peroxidesolution (ACS reagent, 30 wt.% in H2O, Sigma-Aldrich),ethanol (CHROMASOLV, Sigma-Aldrich) and toluene(anhydrous, 99.8%, Across) were used as received.
2.1.2. Microdisk Electrode Arrays (MDEAs)
In the MDEA configuration of electrodes, a single contin-uous sheet of electrode metal (100 nm of sputter depositedAu on 10 nm sputter deposited TiW) was overlaid with a
Fig. 1. A schematic of the hexagonal close packed array ofmicrodisk electrodes a) illustrating the HCP arrangement of themicrodisk array the associated hemispherical diffusion fields, b)photograph of manufactured MDEA 050, and c) high resolutionimage of single 50 mm disk.
1136 A. R. A. Rahman et al.
Electroanalysis 2009, 21, No. 10, 1135 – 1144 www.electroanalysis.wiley-vch.de � 2009 Wiley-VCH Verlag GmbH & Co. KGaA, Weinheim
layer of passivating (Silicon Nitride-500 nm thick) material.The passivating film was then photolithographically pat-terned and fluoroplasma etched to reveal areas of under-lying gold. The diameter of the exposed gold disks and theirspacing distinguishes the various MDEAs employed in thisresearch. The detailed fabrication procedure of the MDEAelectrodes is described elsewhere [9].
Figure 1a illustrates the HCP arrangement of the micro-disks and the diffusion domains of the individual disks. Theworking electrodes are thus hexagonal arrays of slightlyrecessed (0.5 mm) microdisks, fabricated by photolitho-graphic techniques [25], each with a 0.1 cm2 collectiveelectrode area. Each microdisk resides at the bottom of acylindrical cavity etched through the Si3N4 passivation layer.Figure 1b shows the high resolution digital image of asection of microlithographically fabricated MDEA 050transducer. Figure 1c is the high resolution image of a single50 mm diameter disk from the MDEA 050 microdisk array.Table 1 shows the specifications of the fabricated microdiskarrays, where r is a radius of the individual microelectrodeson the array, d, is the centre-to-centre distance betweenmicrodisk and N is the total number of microelectrodesmaking up the array.
2.2. Methods
2.2.1. MDEA Surface Cleaning
The unpackaged MDEA devices were cleaned by sequentialultrasonic washing in boiling trichloroethylene (3 min,86.7 8C), acetone (1 min; 56.2 8C), 2-propanol (1 min;82.4 8C) and then washed profusely in room temperature(RT) deionized water. To remove residual organic/ioniccontamination and to produce a uniform, reproducible layerof�OH groups on the surface of the Si3N4 (activation), theelectrodes were immersed in a (5 :1 : 1, v/v/v) 608 solution ofD. I. H2O : NH4OH: H2O2 (RCA Clean), held for 3 to 5seconds, quenched in DI water for 1 min and then washedprofusely with running DI water. To remove adventitiouschemisorbed organic residues, the MDEA 050-Au andMDEA 5037 devices were treated for 10 min in the UV-
Ozone cleaner (UV Clean, Boelkel Industries, PA, USA),washed by ultrasonication in 2-propanol and then washedprofusely in room temperature deionized water.
2.2.2. Functionalization of MDEA Devices
To achieve covalent attachment of water-swellable hydrogellayers to the MDEAs, the gold surface of the cleaned andactivated MDEA devices was chemically modified with0.01 M 3-mercapto-1-propanol (in anhydrous ethanol) andstored at room temperature overnight to introduce pendantalkylhydroxy surface functionalities. The pendant alkylhy-droxy of the gold recessed disks and surface�OH groups ofthe silicon nitride surface were subsequently functionalizedby treatment with 3-(aminopropyl)trimethoxysilane (g-APS; 0.01 M, in anhydrous toluene, RT, 2 h) in order tointroduce pendant alkylamino surface functionalities. TheMDEA devices were then cured at 40 8C for 20 min, at110 8C for 20 min, and finally at 40 8C for 20 min, for a totalof 1 h in a 0.22-m-filtered convection oven. For the finalfunctionalization and to establish a continuous path ofcovalent bonds between the device surfaces and the hydro-gel layer, the MDEA devices were incubated for 2 hours inAcrl-PEG-NHS (MW¼ 3500) solution (0.001 M) made upin 0.1 M HEPES buffer (pH 8.5). The modified devices weresubsequently rinsed by ultrasonic washing for 1 min in DIwater followed by immediate casting of the hydrogel layer.
2.2.3. Formulation of p(HEMA) Hydrogels
The hydrogel membrane was fashioned from a cocktailprepared by mixing HEMA, TEGDA, PEG(200)MA,HMMA and DMPA in a typical ratio 86 : 3 :5 :1:5 mol%.This mixture was then added to a 1 :1 (v/v) solution ofethylene glycol:water so that the mixed solvent comprised20 wt% of the cocktail. Under UV-free conditions, the finalhydrogel cocktail was sonicated, sparged with nitrogen gas,and 20 mL of the hydrogel cocktail was applied evenly to thesurface of the PEGylated (derivatized) MDEAs (to finalmembrane thickness of 60 m). The mixture was immediatelyirradiated with UV light (366 nm, 2.3 watts/cm2, 5 – 7 min) ina UV cross-linker (CX-2000 CROSSLINKER, UVP, Up-
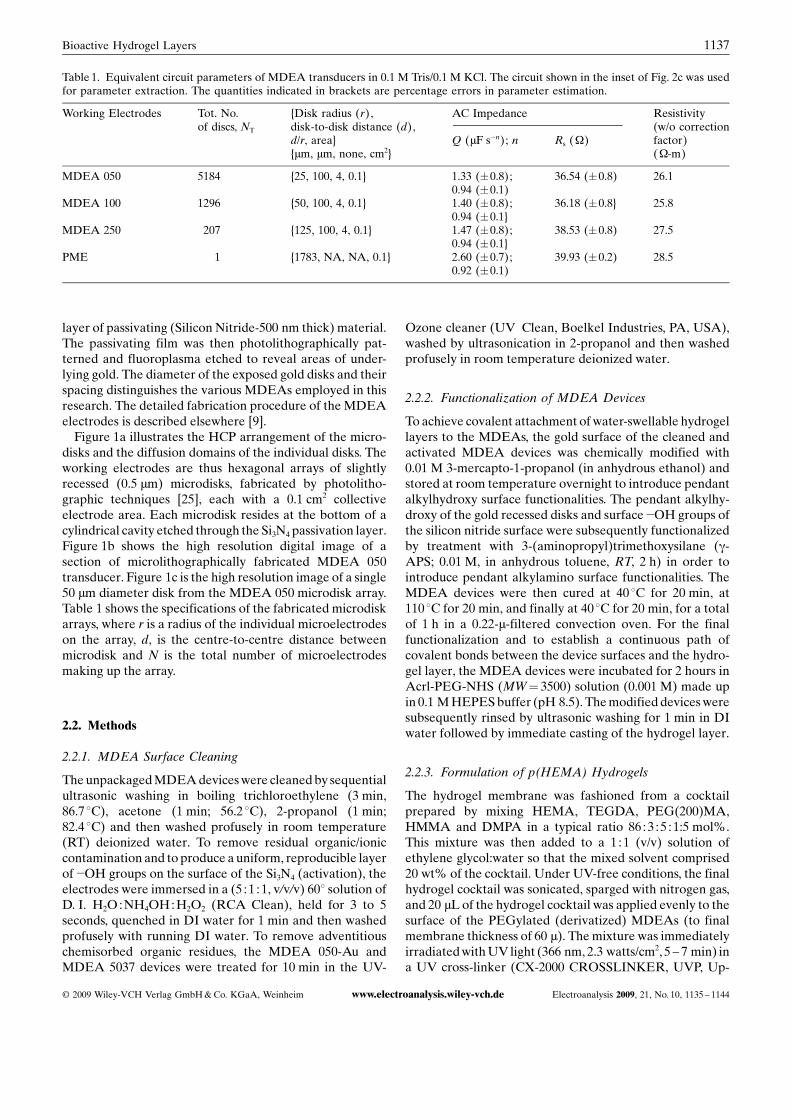
Table 1. Equivalent circuit parameters of MDEA transducers in 0.1 M Tris/0.1 M KCl. The circuit shown in the inset of Fig. 2c was usedfor parameter extraction. The quantities indicated in brackets are percentage errors in parameter estimation.
Working Electrodes Tot. No.of discs, NT
{Disk radius (r),disk-to-disk distance (d),d/r, area}
AC Impedance Resistivity(w/o correctionfactor)
{mm, mm, none, cm2}Q (mF s�n); n Rs (W)
(W-m)
MDEA 050 5184 {25, 100, 4, 0.1} 1.33 (�0.8);0.94 (�0.1)
36.54 (�0.8) 26.1
MDEA 100 1296 {50, 100, 4, 0.1} 1.40 (�0.8);0.94 (�0.1}
36.18 (�0.8} 25.8
MDEA 250 207 {125, 100, 4, 0.1} 1.47 (�0.8);0.94 (�0.1}
38.53 (�0.8) 27.5
PME 1 {1783, NA, NA, 0.1} 2.60 (�0.7);0.92 (�0.1)
39.93 (�0.2) 28.5
1137Bioactive Hydrogel Layers
� 2009 Wiley-VCH Verlag GmbH & Co. KGaA, Weinheim www.electroanalysis.wiley-vch.de Electroanalysis 2009, 21, No. 10, 1135 – 1144
land, CA, USA) under an inert nitrogen atmosphere toeffect polymerization of the hydrogel component. Finally,the electrodes were conditioned, hydrated and unreactedmonomer extracted by sequential immersion in ethanol:-deionized water mixtures (75 :25; 50 :50; 25 :75; 100% DIwater; v/v) for a minimum of 1 h each.
2.2.4. Electrochemical Impedance Spectroscopy
Three-electrode electrochemical impedance spectroscopywas performed using a Solartron Instruments Model 1260Frequency Response Analyzer (FRA; Solartron Analytical,Hampshire, U.K.) in conjunction with Princeton AppliedResearch M283 Potentiostat/Galvanostat. Measurementinstruments were controlled by ZPLOT impedance mea-surement software (Scribner Associates, Southern Pines,NC, USA). The impedance data was viewed in Zview(Scribner Associates, Southern Pines, NC, USA) impedanceplotting and visualization software. Impedance was mea-sured between the working electrode of the MDEAs and alarge surface area platinum gauze (3’’� 2’’) counter elec-trode (Alfa Aesar, USA). The AC sine-wave excitationvoltage amplitude was 10 mV, over the frequency range0.1 Hz to 1 MHz. The probing electroactive specie was1.0 mM FcCO2H in a supporting electrolyte of 0.1 M Trisbuffer/0.1 M KCl (pH 7.2) solution at 20 8C.
3. Results and Discussion
3.2. Impedance Parameters of MDEA in the Absence ofMediator
The designed electroactive surface area of all three MDEAtransducers used in this study was 0.1 cm2 (1� 107 mm2). Thecapacitance (C) of an electrical double layer is directlyproportional to the total surface area (A) of the electrifiedinterface and inversely proportional to the charge separa-tion distance (d). Based on the designed surface areas of theMDEA devices, the capacitance of all MDEAs is expectedto be the same under similar set of test conditions.
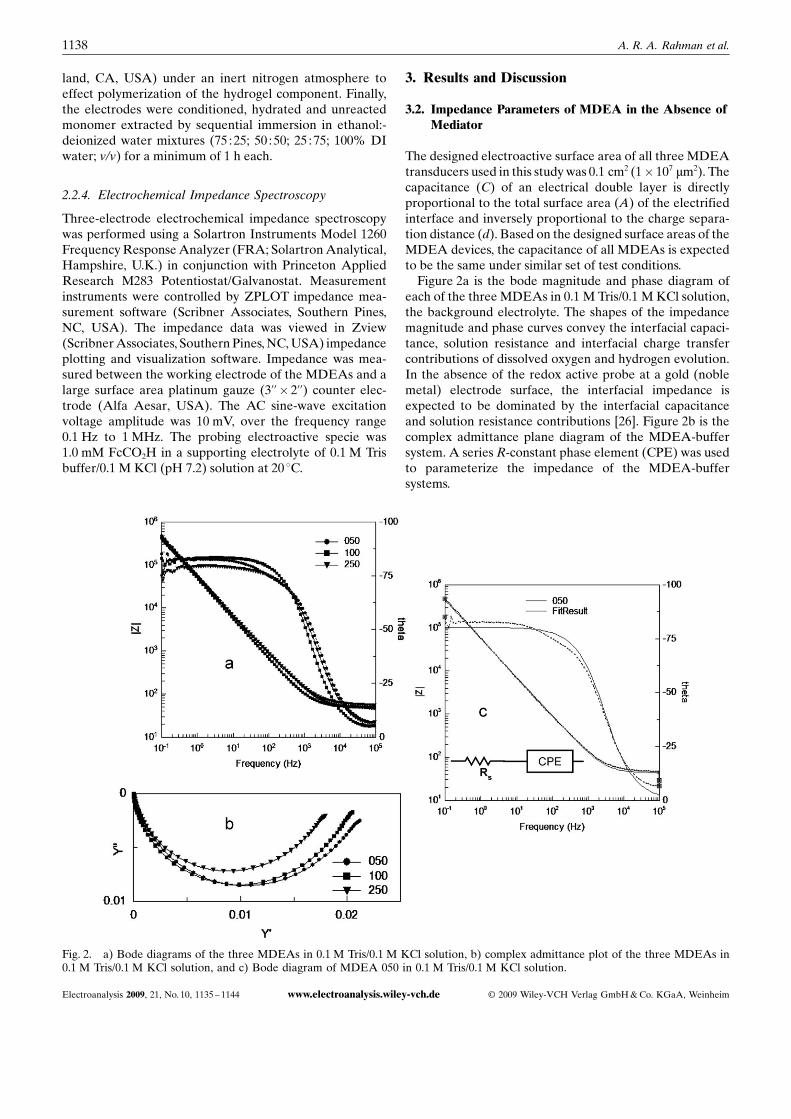
Figure 2a is the bode magnitude and phase diagram ofeach of the three MDEAs in 0.1 M Tris/0.1 M KCl solution,the background electrolyte. The shapes of the impedancemagnitude and phase curves convey the interfacial capaci-tance, solution resistance and interfacial charge transfercontributions of dissolved oxygen and hydrogen evolution.In the absence of the redox active probe at a gold (noblemetal) electrode surface, the interfacial impedance isexpected to be dominated by the interfacial capacitanceand solution resistance contributions [26]. Figure 2b is thecomplex admittance plane diagram of the MDEA-buffersystem. A series R-constant phase element (CPE) was usedto parameterize the impedance of the MDEA-buffersystems.
Fig. 2. a) Bode diagrams of the three MDEAs in 0.1 M Tris/0.1 M KCl solution, b) complex admittance plot of the three MDEAs in0.1 M Tris/0.1 M KCl solution, and c) Bode diagram of MDEA 050 in 0.1 M Tris/0.1 M KCl solution.
1138 A. R. A. Rahman et al.
Electroanalysis 2009, 21, No. 10, 1135 – 1144 www.electroanalysis.wiley-vch.de � 2009 Wiley-VCH Verlag GmbH & Co. KGaA, Weinheim
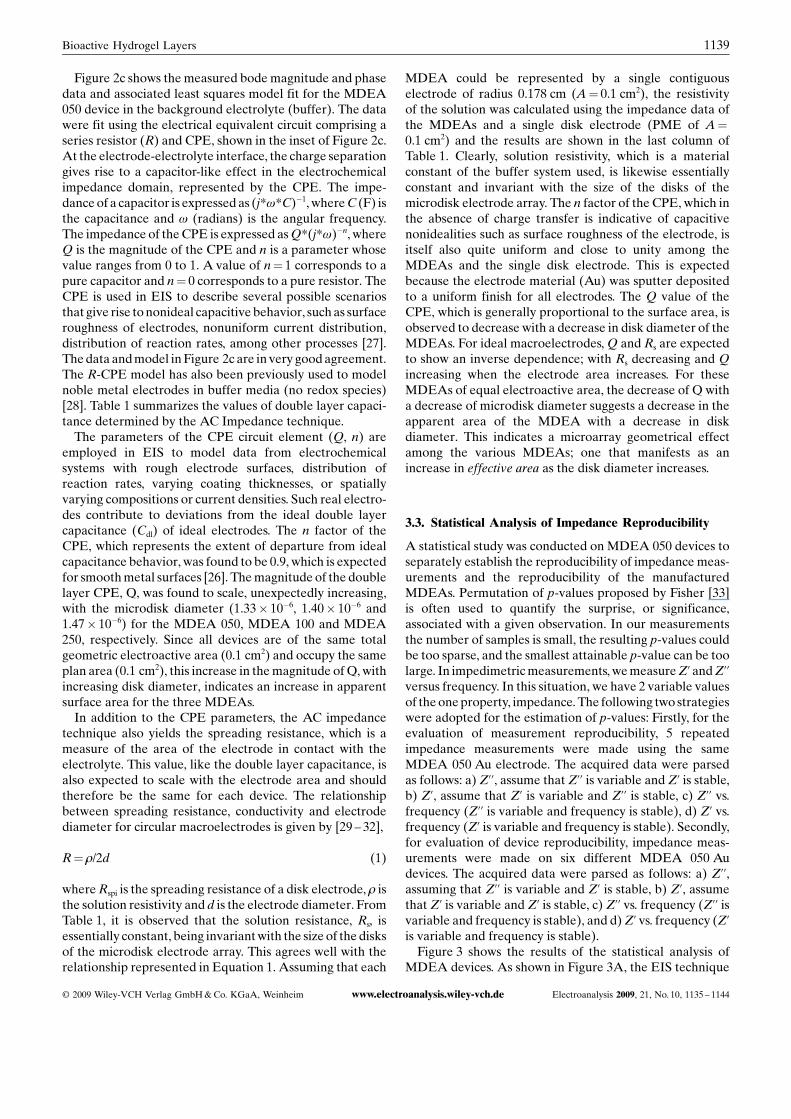
Figure 2c shows the measured bode magnitude and phasedata and associated least squares model fit for the MDEA050 device in the background electrolyte (buffer). The datawere fit using the electrical equivalent circuit comprising aseries resistor (R) and CPE, shown in the inset of Figure 2c.At the electrode-electrolyte interface, the charge separationgives rise to a capacitor-like effect in the electrochemicalimpedance domain, represented by the CPE. The impe-dance of a capacitor is expressed as (j*w*C)�1, where C (F) isthe capacitance and w (radians) is the angular frequency.The impedance of the CPE is expressed as Q*(j*w)�n, whereQ is the magnitude of the CPE and n is a parameter whosevalue ranges from 0 to 1. A value of n¼ 1 corresponds to apure capacitor and n¼ 0 corresponds to a pure resistor. TheCPE is used in EIS to describe several possible scenariosthat give rise to nonideal capacitive behavior, such as surfaceroughness of electrodes, nonuniform current distribution,distribution of reaction rates, among other processes [27].The data and model in Figure 2c are in very good agreement.The R-CPE model has also been previously used to modelnoble metal electrodes in buffer media (no redox species)[28]. Table 1 summarizes the values of double layer capaci-tance determined by the AC Impedance technique.
The parameters of the CPE circuit element (Q, n) areemployed in EIS to model data from electrochemicalsystems with rough electrode surfaces, distribution ofreaction rates, varying coating thicknesses, or spatiallyvarying compositions or current densities. Such real electro-des contribute to deviations from the ideal double layercapacitance (Cdl) of ideal electrodes. The n factor of theCPE, which represents the extent of departure from idealcapacitance behavior, was found to be 0.9, which is expectedfor smooth metal surfaces [26]. The magnitude of the doublelayer CPE, Q, was found to scale, unexpectedly increasing,with the microdisk diameter (1.33� 10�6, 1.40� 10�6 and1.47� 10�6) for the MDEA 050, MDEA 100 and MDEA250, respectively. Since all devices are of the same totalgeometric electroactive area (0.1 cm2) and occupy the sameplan area (0.1 cm2), this increase in the magnitude of Q, withincreasing disk diameter, indicates an increase in apparentsurface area for the three MDEAs.
In addition to the CPE parameters, the AC impedancetechnique also yields the spreading resistance, which is ameasure of the area of the electrode in contact with theelectrolyte. This value, like the double layer capacitance, isalso expected to scale with the electrode area and shouldtherefore be the same for each device. The relationshipbetween spreading resistance, conductivity and electrodediameter for circular macroelectrodes is given by [29 – 32],
R¼ 1/2d (1)
where Rspi is the spreading resistance of a disk electrode, 1 isthe solution resistivity and d is the electrode diameter. FromTable 1, it is observed that the solution resistance, Rs, isessentially constant, being invariant with the size of the disksof the microdisk electrode array. This agrees well with therelationship represented in Equation 1. Assuming that each
MDEA could be represented by a single contiguouselectrode of radius 0.178 cm (A¼ 0.1 cm2), the resistivityof the solution was calculated using the impedance data ofthe MDEAs and a single disk electrode (PME of A¼0.1 cm2) and the results are shown in the last column ofTable 1. Clearly, solution resistivity, which is a materialconstant of the buffer system used, is likewise essentiallyconstant and invariant with the size of the disks of themicrodisk electrode array. The n factor of the CPE, which inthe absence of charge transfer is indicative of capacitivenonidealities such as surface roughness of the electrode, isitself also quite uniform and close to unity among theMDEAs and the single disk electrode. This is expectedbecause the electrode material (Au) was sputter depositedto a uniform finish for all electrodes. The Q value of theCPE, which is generally proportional to the surface area, isobserved to decrease with a decrease in disk diameter of theMDEAs. For ideal macroelectrodes, Q and Rs are expectedto show an inverse dependence; with Rs decreasing and Qincreasing when the electrode area increases. For theseMDEAs of equal electroactive area, the decrease of Q witha decrease of microdisk diameter suggests a decrease in theapparent area of the MDEA with a decrease in diskdiameter. This indicates a microarray geometrical effectamong the various MDEAs; one that manifests as anincrease in effective area as the disk diameter increases.
3.3. Statistical Analysis of Impedance Reproducibility
A statistical study was conducted on MDEA 050 devices toseparately establish the reproducibility of impedance meas-urements and the reproducibility of the manufacturedMDEAs. Permutation of p-values proposed by Fisher [33]is often used to quantify the surprise, or significance,associated with a given observation. In our measurementsthe number of samples is small, the resulting p-values couldbe too sparse, and the smallest attainable p-value can be toolarge. In impedimetric measurements, we measure Z’ and Z’’versus frequency. In this situation, we have 2 variable valuesof the one property, impedance. The following two strategieswere adopted for the estimation of p-values: Firstly, for theevaluation of measurement reproducibility, 5 repeatedimpedance measurements were made using the sameMDEA 050 Au electrode. The acquired data were parsedas follows: a) Z’’, assume that Z’’ is variable and Z’ is stable,b) Z’, assume that Z’ is variable and Z’’ is stable, c) Z’’ vs.frequency (Z’’ is variable and frequency is stable), d) Z’ vs.frequency (Z’ is variable and frequency is stable). Secondly,for evaluation of device reproducibility, impedance meas-urements were made on six different MDEA 050 Audevices. The acquired data were parsed as follows: a) Z’’,assuming that Z’’ is variable and Z’ is stable, b) Z’, assumethat Z’ is variable and Z’ is stable, c) Z’’ vs. frequency (Z’’ isvariable and frequency is stable), and d) Z’ vs. frequency (Z’is variable and frequency is stable).
Figure 3 shows the results of the statistical analysis ofMDEA devices. As shown in Figure 3A, the EIS technique
1139Bioactive Hydrogel Layers
� 2009 Wiley-VCH Verlag GmbH & Co. KGaA, Weinheim www.electroanalysis.wiley-vch.de Electroanalysis 2009, 21, No. 10, 1135 – 1144
was found to provide highly reproducible results whenperformed on the same MDEA 050 device (Group 1).Statistical analysis resulting in p-values for device reprodu-cibility (Group 2) however revealed, as shown in Figure 3B,that for stable Z’ and variable Z’’, p-values were >0.05 forfrequencies over the range 60 kHz to100 kHz but were<0.05 for frequencies over the range 60 kHz to 0.1 Hz. Asshown in Figure 3C, for stable Z’’ and variable Z’, p-valueswere less than 0.05 over the whole range of frequencies(100 kHz – 0.1 Hz).
3.4. Impedance Parameters of MDEA 050 in the Presenceof Mediator
Figure 4 shows the effect of variations in the concentrationof the redox mediator, FcCO2H, on the impedance ofMDEA 050 transducer. Figure 4A and B are the Bodediagram and complex impedance diagram, respectively, ofMDEA 050 in the presence of 0 to 1.0 mM FcCO2H, steppedin increments of 0.25 mM. The impedance magnitude andphase angle show a clear trend with increasing FcCO2Hconcentration. The phase angle in particular shows a greaterlow frequency trend towards zero with increasing FcCO2H
Fig. 3. Complex impedance plots of the imaginary vs. the real impedance obtained for cleaned but otherwise un-modified MDEA 050Au electrodes in Tris buffer at room temperature. Parameters were 100 kHz to 0.1 Hz, steps/sweep interval was 100, and the ACamplitude was 10 mV. A) Repeat measurements of the same MDEA 50 electrode established reproducibility of the measurementtechnique. B) The mean values of Z’’ (red line) when Z’ is made stable, and C) the mean values of Z’ (red line) when Z’’ is made stable.The dark lines represent the 95% confidence limits (�2 standard errors) and reflect the reproducibility of the fabrication process.
1140 A. R. A. Rahman et al.
Electroanalysis 2009, 21, No. 10, 1135 – 1144 www.electroanalysis.wiley-vch.de � 2009 Wiley-VCH Verlag GmbH & Co. KGaA, Weinheim

concentration. Recall, a resistor has a phase angle of zero.The increasing tendency of MDEA 050 towards resistivephase angle behavior indicates a decrease in resistiveimpedance at low frequencies (approaching DC) as aconsequence of increasing concentration of the redox-activeFcCO2H. This is clearly due to an increased charge transferat the interface due to the increased availability of redoxspecies with increasing concentration. The increase incharge transfer reaches a saturation level at 0.75 mMFcCO2H concentration, beyond which further increase inconcentration does not manifest as a change in the phaseangle behavior. We hypothesize that this behavior is due tothe limit of radial diffusion at the MDEA 050 electrode,which reaches a saturation peak current with eitherincreased voltages applied to the electrode or increasedconcentrations at the electrode.
Table 2 lists the impedance parameters estimated byfitting the impedance data of MDEA 050 in variousconcentrations of FcCO2H using the equivalent circuitshown in the inset of Figure 4B. From Table 2, the solutionresistance, given by Rsol, is seen to decrease with increase in
FcCO2H concentration, which is attributed to the increasedionic conductivity of the solution. The charge transferresistance parameter, Rct, decreases with increasingFcCO2H concentration until 0.75 mM, beyond which itsaturates. This saturation is attributed to the radial diffusionprofile of the MDEA050 electrode, which gives rise to asteady state behavior with increasing voltage and concen-trations. The double layer CPE magnitude increases withincreasing concentration which is consistent with expect-ation [34].
3.5. Impedance Parameters of MDEA jHydrogel in thePresence of Mediator
Figure 5 is the Bode diagram of magnitude and phase of thethree MDEAs in 1.0 mM FcCO2H (aq) (made up in 0.1 MTris/0.1 M KCl solution) in the presence and absence of thehydrogel layer on the microdisks. In the absence of thehydrogel, the MDEAs show a charge transfer characteristic– associated with the presence of a redox active species in thesolution - indicated by the phase angle tending towardslower values at low frequencies. This tendency towardslower phase angle scales with the diameter of the disk andincreases with decreasing diameter (enhanced flux). This isconsistent with the voltammetric observations of highercurrent densities for lower disk diameters [35]. Uponaddition of hydrogel layers, the impedance magnitudeincreases and the phase angle maintains an almost constantvalue throughout the lower frequencies, which is indicativeof a predominantly CPE behavior. This can be interpreted asa reduction in current due to the reduction in the diffusioncoefficient arising from the reduced transport of speciesthrough the hydrogel layer and to the electrode. This hasbeen verified by both cyclic voltammetry (CV) experiments
Fig. 4. A) Bode diagram and B) complex impedance diagram of MDEA 050 in the presence of 0 to 1.0 mM FcCO2H.
Table 2. Equivalent circuit parameters of MDEA 050 transducerin various concentrations of FcCOOH in 0.1 M Tris/0.1 M KCl.The circuit shown in the inset of Fig. 4b was used for parameterextraction. The quantities indicated in brackets are percentageerrors in parameter estimation.
FcCO2H conc.(mM)
Rsol (W) Rct (M W) Q (mF s�n) n
0.10 40.6 (�0.6) 1.6 (�6.2) 2.8 (�0.7) 0.9 (�0.1)0.25 40.8 (�0.6) 0.6 (�6.6) 2.9 (�0.9) 0.9 (�0.1)0.50 39.9 (�0.8) 0.4 (�2.3) 3.3 (�0.9) 0.9 (�0.2)0.75 39.4 (�0.9) 0.3 (�1.9) 3.4 (�1.0) 0.9 (�0.2)1.00 38.8 (�0.8) 0.3 (�1.9) 3.4 (�1.0) 0.9 (�0.1)
1141Bioactive Hydrogel Layers
� 2009 Wiley-VCH Verlag GmbH & Co. KGaA, Weinheim www.electroanalysis.wiley-vch.de Electroanalysis 2009, 21, No. 10, 1135 – 1144

and finite element modeling (FEM) where it was observedthat the peak currents decrease by only one order ofmagnitude upon the addition of the hydrogel layer [35].
Figure 6 is the complex plane impedance plot of theMDEAs in 1.0 mM FcCO2H in the presence and absence ofthe hydrogel layer. The inset to Figure 6 is the complexadmittance plot of the impedance data of Figure 6. In theabsence of the hydrogel membrane, the impedance spectraresemble an arc tending towards the real axis; which istypical of charge transfer. The arc is more pronounced andhas a smaller diameter for decreasing microarray diskdiameters. In the complex admittance plane (Fig. 6, inset),the MDEAs display a semicircle in the presence andabsence of hydrogel. The plots of MDEA 050 and 100 areclosely associated whereas the MDEA 250 is substantiallydifferent from the other MDEAs. As reasoned in the lastparagraph of section 3.1, this is due to a more macro-electrode-like behavior of the MDEA 250 as compared tothe other two MDEAs.
Table 3 lists the estimated parameters of the equivalentcircuit in the inset of Figure 4b for non-hydrogel coated andhydrogel coated MDEAs (shaded region). The chargetransfer resistance, Rct, in the absence of the hydrogeldecreases with decreasing diameter of the microdisk. This isdue to the enhanced mass transport at the microelectrodes,which is made possible by radial diffusion and henceenhanced current densities at smaller microdisk diameters.The solution resistance, Rsol, now approximately 1.6 timeslarger than for the buffer, is nonetheless, as before, constantacross all MDEAs. The Q parameter of the CPEDL, which isproportional to the surface area, decreases from 5.3� 10�6 Fs�n for the MDEA 250 to 4.0� 10�6 F s�n for the MDEA 100and MDEA 050. This indicates that the effective surface
area of the MDEA 250 is larger than that of the MDEA 100and MDEA 050. This trend is consistent with that observedin the Tris/KCl buffer but nonetheless opposite to thatobserved by cyclic voltammetry [35]. The n factor of theCPE in the presence of the redox active species is now nolonger ideal but nonetheless uniform among the MDEAsand the single disk electrode.
When coated with a hydrogel membrane layer, theestimated parameters of the equivalent circuit that nowrepresent the MDEAs are shown in the hydrogel-coatedsection of Table 3. The solution resistance shows an almost3-fold increase relative to un-coated MDEAs but also nowclearly varies; decreasing with the diameter of the micro-disks. The larger values of Rsol arise from the resistivecontribution of the hydrogel membrane to ionic transportand are consistent with a reduction in the diffusioncoefficient of FcCO2H through the hydrogel membranelayer. The charge transfer resistance, Rct, is likewise seen tobe an order of magnitude larger, but similar to the trendobserved for the case of uncoated MDEAs, to decrease withthe diameter of the microdisks. The decrease in both Rsol andRct with a decrease in the microdisk diameter of MDEAs ofequal electroactive area confirms a microarray geometricaleffect among the various MDEAs; one that manifests as anincrease in effective area as the disk diameter decreases.This indicates that the electrodes have maintained thehemispherical diffusion profile, even though the hydrogelmembrane has contributed to a reduction in the diffusivityof the redox species. This explanation is consistent with theobservation that the magnitude, Q, of the double layer CPE,which is directly proportional to the surface area of theelectrode in contact with the electrolyte, increases with
Fig. 5. Bode magnitude and phase diagram of the three MDEAsin 1.0 mM FcCO2H in 0.1 M Tris/0.1 M KCl in the presence andabsence of hydrogel layer on the microdisks.
Fig. 6. Complex plane impedance plot of the MDEAs in 1mMFcCO2H in the presence and absence of hydrogel layer. Inset:Complex admittance plot of the impedance data of the currentfigure.
1142 A. R. A. Rahman et al.
Electroanalysis 2009, 21, No. 10, 1135 – 1144 www.electroanalysis.wiley-vch.de � 2009 Wiley-VCH Verlag GmbH & Co. KGaA, Weinheim
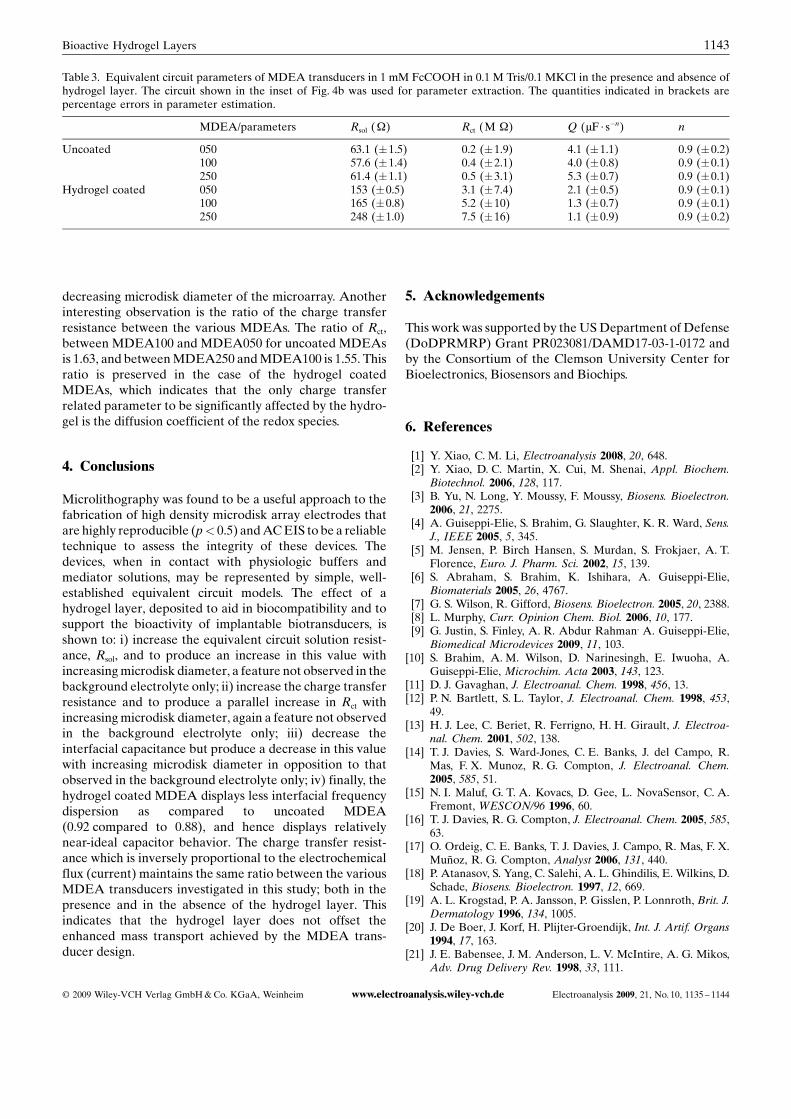
decreasing microdisk diameter of the microarray. Anotherinteresting observation is the ratio of the charge transferresistance between the various MDEAs. The ratio of Rct,between MDEA100 and MDEA050 for uncoated MDEAsis 1.63, and between MDEA250 and MDEA100 is 1.55. Thisratio is preserved in the case of the hydrogel coatedMDEAs, which indicates that the only charge transferrelated parameter to be significantly affected by the hydro-gel is the diffusion coefficient of the redox species.
4. Conclusions
Microlithography was found to be a useful approach to thefabrication of high density microdisk array electrodes thatare highly reproducible (p< 0.5) and AC EIS to be a reliabletechnique to assess the integrity of these devices. Thedevices, when in contact with physiologic buffers andmediator solutions, may be represented by simple, well-established equivalent circuit models. The effect of ahydrogel layer, deposited to aid in biocompatibility and tosupport the bioactivity of implantable biotransducers, isshown to: i) increase the equivalent circuit solution resist-ance, Rsol, and to produce an increase in this value withincreasing microdisk diameter, a feature not observed in thebackground electrolyte only; ii) increase the charge transferresistance and to produce a parallel increase in Rct withincreasing microdisk diameter, again a feature not observedin the background electrolyte only; iii) decrease theinterfacial capacitance but produce a decrease in this valuewith increasing microdisk diameter in opposition to thatobserved in the background electrolyte only; iv) finally, thehydrogel coated MDEA displays less interfacial frequencydispersion as compared to uncoated MDEA(0.92 compared to 0.88), and hence displays relativelynear-ideal capacitor behavior. The charge transfer resist-ance which is inversely proportional to the electrochemicalflux (current) maintains the same ratio between the variousMDEA transducers investigated in this study; both in thepresence and in the absence of the hydrogel layer. Thisindicates that the hydrogel layer does not offset theenhanced mass transport achieved by the MDEA trans-ducer design.
5. Acknowledgements
This work was supported by the US Department of Defense(DoDPRMRP) Grant PR023081/DAMD17-03-1-0172 andby the Consortium of the Clemson University Center forBioelectronics, Biosensors and Biochips.
6. References
[1] Y. Xiao, C. M. Li, Electroanalysis 2008, 20, 648.[2] Y. Xiao, D. C. Martin, X. Cui, M. Shenai, Appl. Biochem.
Biotechnol. 2006, 128, 117.[3] B. Yu, N. Long, Y. Moussy, F. Moussy, Biosens. Bioelectron.
2006, 21, 2275.[4] A. Guiseppi-Elie, S. Brahim, G. Slaughter, K. R. Ward, Sens.
J., IEEE 2005, 5, 345.[5] M. Jensen, P. Birch Hansen, S. Murdan, S. Frokjaer, A. T.
Florence, Euro. J. Pharm. Sci. 2002, 15, 139.[6] S. Abraham, S. Brahim, K. Ishihara, A. Guiseppi-Elie,
Biomaterials 2005, 26, 4767.[7] G. S. Wilson, R. Gifford, Biosens. Bioelectron. 2005, 20, 2388.[8] L. Murphy, Curr. Opinion Chem. Biol. 2006, 10, 177.[9] G. Justin, S. Finley, A. R. Abdur Rahman, A. Guiseppi-Elie,
Biomedical Microdevices 2009, 11, 103.[10] S. Brahim, A. M. Wilson, D. Narinesingh, E. Iwuoha, A.
Guiseppi-Elie, Microchim. Acta 2003, 143, 123.[11] D. J. Gavaghan, J. Electroanal. Chem. 1998, 456, 13.[12] P. N. Bartlett, S. L. Taylor, J. Electroanal. Chem. 1998, 453,
49.[13] H. J. Lee, C. Beriet, R. Ferrigno, H. H. Girault, J. Electroa-
nal. Chem. 2001, 502, 138.[14] T. J. Davies, S. Ward-Jones, C. E. Banks, J. del Campo, R.
Mas, F. X. Munoz, R. G. Compton, J. Electroanal. Chem.2005, 585, 51.
[15] N. I. Maluf, G. T. A. Kovacs, D. Gee, L. NovaSensor, C. A.Fremont, WESCON/96 1996, 60.
[16] T. J. Davies, R. G. Compton, J. Electroanal. Chem. 2005, 585,63.
[17] O. Ordeig, C. E. Banks, T. J. Davies, J. Campo, R. Mas, F. X.Munoz, R. G. Compton, Analyst 2006, 131, 440.
[18] P. Atanasov, S. Yang, C. Salehi, A. L. Ghindilis, E. Wilkins, D.Schade, Biosens. Bioelectron. 1997, 12, 669.
[19] A. L. Krogstad, P. A. Jansson, P. Gisslen, P. Lonnroth, Brit. J.Dermatology 1996, 134, 1005.
[20] J. De Boer, J. Korf, H. Plijter-Groendijk, Int. J. Artif. Organs1994, 17, 163.
[21] J. E. Babensee, J. M. Anderson, L. V. McIntire, A. G. Mikos,Adv. Drug Delivery Rev. 1998, 33, 111.
Table 3. Equivalent circuit parameters of MDEA transducers in 1 mM FcCOOH in 0.1 M Tris/0.1 MKCl in the presence and absence ofhydrogel layer. The circuit shown in the inset of Fig. 4b was used for parameter extraction. The quantities indicated in brackets arepercentage errors in parameter estimation.
MDEA/parameters Rsol (W) Rct (M W) Q (mF · s�n) n
Uncoated 050 63.1 (�1.5) 0.2 (�1.9) 4.1 (�1.1) 0.9 (�0.2)100 57.6 (�1.4) 0.4 (�2.1) 4.0 (�0.8) 0.9 (�0.1)250 61.4 (�1.1) 0.5 (�3.1) 5.3 (�0.7) 0.9 (�0.1)
Hydrogel coated 050 153 (�0.5) 3.1 (�7.4) 2.1 (�0.5) 0.9 (�0.1)100 165 (�0.8) 5.2 (�10) 1.3 (�0.7) 0.9 (�0.1)250 248 (�1.0) 7.5 (�16) 1.1 (�0.9) 0.9 (�0.2)
1143Bioactive Hydrogel Layers
� 2009 Wiley-VCH Verlag GmbH & Co. KGaA, Weinheim www.electroanalysis.wiley-vch.de Electroanalysis 2009, 21, No. 10, 1135 – 1144
[22] C. Sumi, A. Suzuki, K. Nakayama, IEEE Trans. Biomed.Eng. 1995, 42, 193.
[23] C. Maniatopoulos, R. M. Pilliar, D. C. Smith, J. Biomed.Mater. Res. 1986, 20, 1309.
[24] R. Parkash, A. Tang, G. Wells, J. Blackburn, I. Stiell, C.Simpson, P. Dorian, R. Yee, D. Cameron, S. Connolly, Can.Med. Ass. J. 2004, 171, 1053.
[25] P. Rai-Choudhury, Handbook of Microlithography, Micro-machining, and Microfabrication, SPIE Optical EngineeringPress, Bellingham, WA 1997, p. 768.
[26] A. R. Abdur Rahman, D. T. Price, S. Bhansali, Sens. Actua-tors B, Chem. 2007, 127, 89.
[27] U. Rammelt, G. Reinhard, Electrochim. Acta 1990, 35, 1045.
[28] J. Wegener, S. Zink, P. Rçsen, H. J. Galla, Pfl�gers ArchivEuro. J. Physiol. 1999, 437, 925.
[29] M. W. Denhoff, J. Phys. D, Appl. Phys. 2006, 39, 1761.[30] N. N. Polyakov, V. L. Kon�kov, Russ. Phys. J. 1970, 13, 1203.[31] J. Fleig, J. Maier, Solid State Ionics 1996, 85, 9.[32] S. Rodewald, J. Fleig, J. Maier, J. Euro. Ceram. Soc. 1999, 19,
797.[33] D. R. Cox, N. Reid, The Theory of the Design of Experiments,
Chapman & Hall/CRC, New York 2000.[34] P. Kern, D. Landolt, J. Electroanal. Chem. 2001, 500, 170.[35] G. Justin, A. Abdur Rahman, A. Guiseppi-Elie, Electro-
analysis 2009, 21, 1127.
1144 A. R. A. Rahman et al.
Electroanalysis 2009, 21, No. 10, 1135 – 1144 www.electroanalysis.wiley-vch.de � 2009 Wiley-VCH Verlag GmbH & Co. KGaA, Weinheim