Impacts of Transportation Investments on Turkish Regional Economies: Market Potential Analysis
30
Impacts of Transportation Investments on Turkish Regional Economies: Market Potential Analysis Background Paper 1 May 19, 2011 FINAL VERSION Kamil TAŞCI – [email protected] Mehmet Emin ÖZSAN – [email protected] Hakan ERTEN – [email protected]
Transcript of Impacts of Transportation Investments on Turkish Regional Economies: Market Potential Analysis
Impacts of Transportation Investments on Turkish
Regional Economies: Market Potential Analysis
Background Paper 1
May 19, 2011
FINAL VERSION
Kamil TAŞCI – [email protected] Mehmet Emin ÖZSAN – [email protected]
Hakan ERTEN – [email protected]

2
Contents
1. Introduction .......................................................................................................................................... 3
2. Mainstream Regional Development Theories ................................................................................. 4
2.1. Theories of Regional Economic Convergence ............................................................................ 4
2.2. Theories of Regional Economic Divergence ............................................................................... 4
3. Accessibility, Transportation and Regional Development ............................................................. 6
4. Market Potential Analysis for Turkish Regional Economies ......................................................... 8
4.1. GVA for NUTS II Regions ............................................................................................................ 9
4.2. Domestic Market Potential of Regions ...................................................................................... 10
4.3. Major Transportation Investments ............................................................................................. 11
4.3.1. Scenario 1: North - West to West-Cost .................................................................................. 11
4.3.2. Scenario 2: North - West to East Border (to Iran) ............................................................... 12
4.3.3. Scenario 3: Mid-West to South-East Border (to Iraq) ......................................................... 14
4.3.4. Scenario 4: North-East to South - East .................................................................................. 14
5. Main Results of Market Potential Analysis ..................................................................................... 16
6. Conclusion .......................................................................................................................................... 19

3
1. Introduction
The study aims at finding how transportation investments affect Turkish regional economies via
change in market potential. The two important variables employed in the study are regional
Gross Value Added (GVA) and distance among regions. It is certain that value added of regions
will be positively influenced from transportation investments and shortening distances will
contribute to the integration between northern and southern regions, western and eastern regions
of Turkey. In this respect, the main purpose of the report is to calculate the effects of
transportation investments on regional economic patterns.
Within this framework, the report is based on five sections. Mainstream regional development
policies will be discussed in the first part of the paper. Then, the link between accessibility and
regional development will be established. In the third part, regional GVAs and existing market
potentials of NUTS II regions are revealed. The fourth part will evaluate major transportation
investments envisaged to enhance time efficiency ratios. The fifth part will be dedicated to find
out how shortening distances and enhancing efficiencies through transportation investments
change regional economic environment.

4
2. Mainstream Regional Development Theories
Regional development has been understood as a multidimensional phenomenon having many
variables affecting it. This conception presumably gives scope for different approaches and
explanations of the subject. International trade dynamics, industry policies, transportation routes,
employment structure and available human capital are all significant factors in regional
development. Theories on regional development can be roughly examined under two mainstream
approaches as convergence and divergence.
2.1. Theories of Regional Economic Convergence
Theories of Regional Economic Convergence assert that under the assumption of perfect
mobility of factors of production, per capita income and wages will eventually be equalized. The
export base model, which is one of the early convergence theories, assumes that economic
development is based on the national and international demand for regional products. The model
separates sectoral production as basic and non-basic sectors. Basic sectors are the ones that
export other regions, whereas non-basic sectors produce just for local needs. The long-run
equilibrium condition will be attained when each region produces products that have the highest
comparative advantage over others. Specialization of regions on specific products would end up
with a perfect division of labor and capital among regions.
Neoclassical growth theory is another pro-convergence theory. It debates that capital
accumulation is the driving force of regional development. The output level in regional
economies depends on the aggregate capital stock under the assumptions that supply of labor and
technology levels are given. The output level is a function of capital1. The assumptions of
constant returns to scale and diminishing marginal returns provide that regional development
disparities would disappear in the long-run since capital flows will be through the poorer regions
due to the lower capital accumulation. In the same way, there will be an equilibrium condition in
the regional labor market until interregional labor flows ensure zero marginal productivity of
labor.
2.2. Theories of Regional Economic Divergence
Regional Divergence Theories mainly argue that there has been historically uneven pattern of
development among and within countries. The underlying reason is that agglomeration
economies would cause prosperous regions continue their advantageous position over poorer
1 Arbatli, Eren, ―The Neoclassical Model of Exogenous Growth‖, Brown University, 2006. pg. 1-4

5
ones. Increasing returns to scale provokes the volume of production and it determines the size of
regional markets
Cumulative causation theory, growth pole theory and New Economic Geography (NEG) are
prominent among divergence theories. Myrdal’s cumulative causation theory asserts that
developed regions are in a virtuous circle due to positive spread effects of agglomeration
economies. Underdeveloped regions are in a vicious circle stemming from low capital
accumulation, low industrial productivity levels and unskilled labor force2. Similar to Mrydal’s
approach, the founding father of growth pole theory, Perroux (1970) insists that growth appears
in different places with variable intensities and channels other regions with different processes
and phases. Disparities across core and periphery areas persist since core produces service sector
activities while periphery struggles to benefit from it.
The distinction between core and periphery areas originates from the writings of Von Thunen
who examined production patterns with respect to places where agricultural or industrial
production dominant. Core areas provide industry products to peripheral areas and they produce
agricultural crops to the center. Heavy or easily perishable products will be produced near core
regions while crops that have lower transportation costs will be produced in remote areas. Hence,
different production patterns will be created around core and periphery3.
Urbanization process is much related with product differentiation between these two. Central
places are economically dominant, highly institutionalized and have diversified sectoral structure,
whereas peripheral areas have lower productivity levels and institutional capacity compared to the
center. Hence, transportation linkages play an important role in connecting urban to rural. Poor
transportation infrastructure will cause lock-in effect both for core and periphery. The mobility
of goods, services and labor force is dependent to accessibility of regions.
2 Myrdal, G. ―Appendix 3 of American Dilemma - The Negro Problem and Modern Democracy‖, Harper & Bros, 1944. 3 Thünen, Von Johann Heinrich, Isolated State, an English edition of Der Isolierte Staat, translated by Carla M. Wartenberg. Edited with an introd. by Peter Hall, Oxford, New York, Pergamon Pres, 1966. pg. 8

6
3. Accessibility, Transportation and Regional Development
Economic activities in many parts of the world are concentrated in a small area of the country.
Some regions produce an important part of the national output while many other regions do not
contribute national development as few regions do. For example, Northeastern part of USA
contained 64 percent of manufacturing employment in the middle of 20th century.4 Similarly, 43
percent of national Gross Value Added (GVA) in Turkey was produced by the three largest cities,
Istanbul, Ankara and Izmir. Here, the question is: why geographical concentration is so important
in national economies?
Geographical concentration depends largely on the interaction between increasing returns,
transportation costs and demand externalities. Manufacturers tend to locate where the local
demand is large to minimize transportation costs. Areas where manufacturers locate are also
places for demanding agents since workers, as consumers, prefer to live where labor market is
strong and products are relatively cheaper due to low transportation costs.
Regions much benefit from the proximity advantages to big markets where manufacturing
industry is developed. The typical market potential function is used to measure the domestic
market potential of a single region with respect to the proximity of purchasing power of all other
regions. It should be noted that industrialized regions have also bigger market potential than
other regions where agricultural production is dominant in the economy5.
If trade barriers are eliminated, then demand externalities lose their importance and supply
determines regional production patterns. Transportation costs and other trade barriers cause both
demand and supply dynamics matter in the location of production. Transportation costs are
among the main reasons for national and international economies of production.6 Easily
accessible regions benefit both from interregional trade flows and increasing returns.
Better transportation infrastructure of regions and countries did not cause the dispersion of
economic activities to underdeveloped regions or countries. Instead, economic activities tend to
be located within few countries and their highly specialized cities. Lower transport costs gave
4 Krugman, Geography and Trade, Leuven University Press, Leuven, 1991, pg. 12 5 Fujita, Krugman and Veneblas, The Spatial Economy: Cities, Regions and International Trade, MIT Press, 2001, pg. 32-33. 6 Midelfart-Knarvik, Overman and Venables, ―Comparative Advantage and Economic Geography: Estimating The Location of Production in The EU‖, Center for Economic Policy Research, Discussion Paper Series No: 2618, London-UK.
7
producers the opportunity to produce in remote areas where increasing returns to scale and
agglomeration externalities can be exploited7.
In this sense, demand externalities can be considered under two phases; in the short and medium
term, demand externalities force firms to concentrate in several regions where firm level
externalities can be transferred to regional level. If centrifugal forces surpass demand
externalities, then, firms look for new investment areas where lower production costs override
transportation costs. The empirical study made for 108 EU regions has illustrated that demand-
side externalities are stronger than supply-side externalities which means that there is a strong
convergence tendency among EU regions8. Less developed regions in EU benefit from positive
spillovers from prosperous regions.
Significance of market access to the regional development has been an important subject in
empirical regional development studies, as well. There are two different approaches to the
subject. The first group assumes that accessibility is important for private investment decisions,
hence, regional growth. Studies of Keeble on European regions illustrated that highly accessible
regions, in Netherlands, Belgium and West Germany, have also higher market potentials.
Industrialization and urbanization are necessary historical processes for the basic pattern of
market potential. Those European regions which had a strong industrialization and urbanization
history are highly integrated and accessible regions9.
The second group, mainly NEG models, assumes that location of firms and consumers are
endogenous factors in production. Increasing returns in this framework arise due to
agglomeration economies, mainly originating from linkages between firms, workers, and
consumers based on Marshall’s backward and forward linkages.
Producers tend to locate near other producers in order to have access to input supplies
and/or to large markets.
At the same time large markets attract more producers, resulting in a circular dynamic.
Fujita, Krugman and Venables (2001) synthesize core features of NEG models. In general the
models include two sectors, agriculture and manufacturing, in which manufacturing operates
7 Veneblas, Anthony J., ―Geography and International Inequalities: The Impact of New Technologies‖, World Bank Annual Bank Conference on Development Economics, Washington May – 2001. 8 Vayá, Esther; Enrique López-Bazo; Manuel Artís, Growth, Convergence and (why not?) Regional Externalities, ―Anàlisi Quantitativa Regional‖ Research Group Dpt. of Econometrics, Statistics and Spanish Economy, University of Barcelona, pg. 2,3 and 14. 9 Niebuhr, Annekatrin, ―Market Access and Regional Disparities: New Economic Geography in Europe‖, Annals of Regional Science, 40:313–334, 2006, pg. 319.

8
under monopolistic competition conditions (i.e. there are increasing returns to scale) while
agriculture faces constant returns to scale (perfect competition). Labor is the only input of
production. Agricultural goods do not face transportation costs, while manufacturing goods face
iceberg transportation costs (the costs is a fraction of the good). Agricultural workers face the
same wage everywhere, while manufacturing workers face different wages. Workers move toward
the regions that offer higher real wages. The interaction between increasing returns to scale at the
level of the firm, transportation costs and labor mobility can produce an uneven pattern of
development—specifically a core-periphery pattern.
NEG models reveal that interregional trade volume will stay at low levels if transportation costs
are high. Wages will be determined at local labor market and will not be affected from other local
labor markets. In regions where transportation costs are low, interregional trade volume will
increase, and in turn, it will cause interregional labor mobility. Increasing trade volume and
decreasing unit costs will positively affect labor wages10. It is a necessary condition for regions to
better transportation facilities if it is desired to have higher trade volumes. In other words, higher
market opportunities can be achieved through better interregional linkages.
4. Market Potential Analysis for Turkish Regional Economies
Turkey has been a rapidly developing country in the last decade. While Gross National Product
(GNP) in 2000 was 202 billion dollars, it increased to 730 billion dollars in 2010. GDP per capita
with PPP has also shown a tremendous increase in this period. It was 6,734 dollars in 2000 and
doubled within 10 years. Turkey has also improved its foreign trade performance. In 2000, total
export revenues were 27.8 billion dollars; it quadrupled and reached 111 billion dollars level in
2010. Turkey does not only pass through a rapid economic development phase but promises a
big market potential for national and international investors with its growing population. Total
population was 67.4 million in 2000 and climbed up to 72.7 million in 2010.
The remaining part of the study will be dedicated to domestic market potential and
demonstrating how transportation investment will affect market potential of Turkish NUTS II
regions in the coming years.
10 Krugman, Paul, ―What’s New About the New Economic Geography‖, Oxford Review of Economic Policy, Vol. 14, No. 2, 1998. , pg: 12
9
4.1. GVA for NUTS II Regions
It is the Turkish Statistical Institute’s responsibility to calculate annual GVA and GDP values of
Turkish NUTS II Regions11. TSI declared 2004-2008 period GVA of regions but have not
calculated neither the last three years’ GVA nor 2004-2010 regional GDP values. The calculation
of GVA is based on the formula given below;
GVA = Wages and Salaries Paid + Profits, interest payments, + Capital depreciation (1)
to the Labor force rent revenues
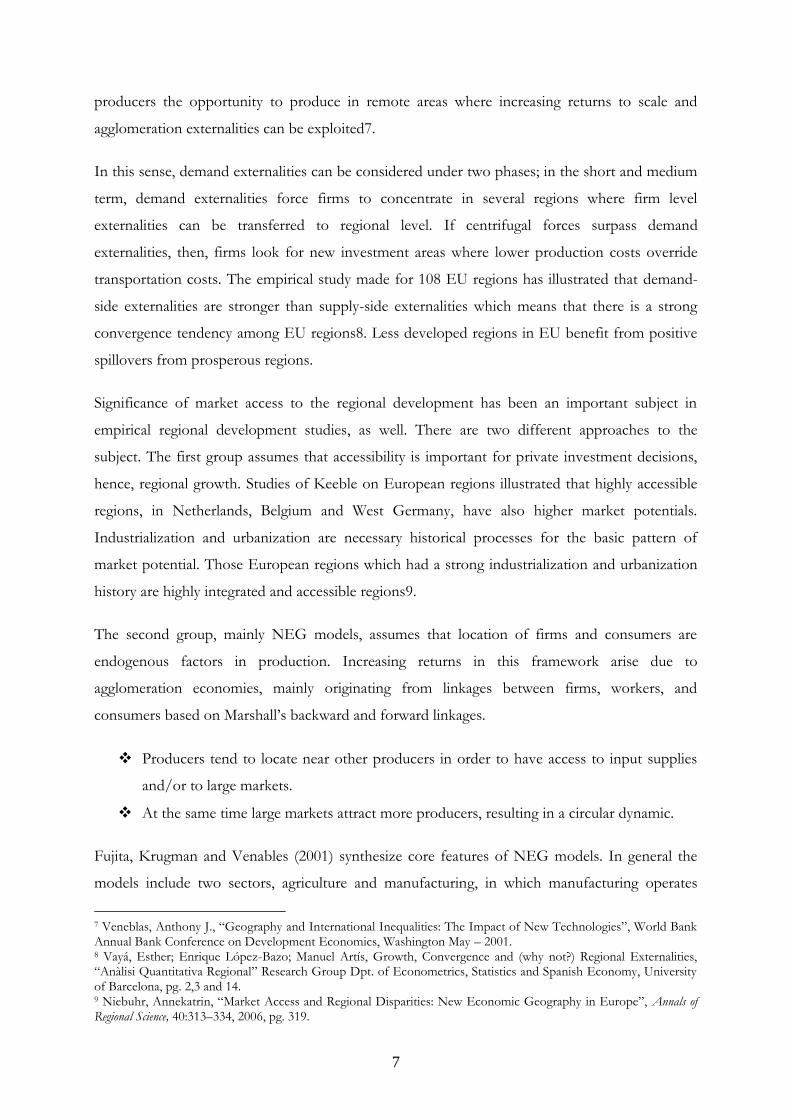
When 2004-2006 NUTS II Regions’ GVA numbers are analyzed, it is seen that the share of each
region is almost the same across three years. Annex-1 shows 2004-2006 GVAs for 26 NUTS II
Regions and their share in total GVA of Turkey. Istanbul has the biggest share in Turkish
economy. GVA of Istanbul in 2006 is approximately 184 billion dollars and its share in the total
economy is almost 28 percent during 2004-2006 period. The three largest metropolises, namely
Istanbul, Ankara and Izmir, have about 43 percent share of GVA in the same period. These three
metropolises are also the cities that form NUTS II Regions by themselves. In other words, TR10
(Istanbul), TR31 (Izmir) and TR51 (Ankara) NUTS II Regions have only one single city.
GVA Shares of Top 5 NUTS II Regions
(2006)
0
5
10
15
20
25
30
TR10 TR51 TR31 TR41 TR42
NUTS Codes
Sh
are
s (
%)
Behind these three regions, two important automotive manufacturing centers, TR41 (Bursa,
Bilecik, Eskişehir) and TR42 (Kocaeli, Sakarya, Düzce, Bolu, Yalova), occupy fourth and fifth
places. There are four regions that produce less than one percent of national GVA. Three of
11 The Nomenclature of Territorial Units for Statistics (NUTS II) is standard for the subdivision of countries for statistical purposes. NUTS division is developed and regulated by European Union and EU Funds are distributed on the basis of NUTS division. NUTS classification has three levels; NUTS III regions refer 81 provinces, NUTS II regions for 26 regions and NUTS I regions 12. NUTS II and I are simple aggregations of NUTS III regions.

10
them are located in the eastern part of the country. 81.5 percent of GVA was produced by the
western regions. Eastern part of the country was only able to generate just 18.5 percent of GVA.
It means that western geography is five time more productive than the eastern geography.
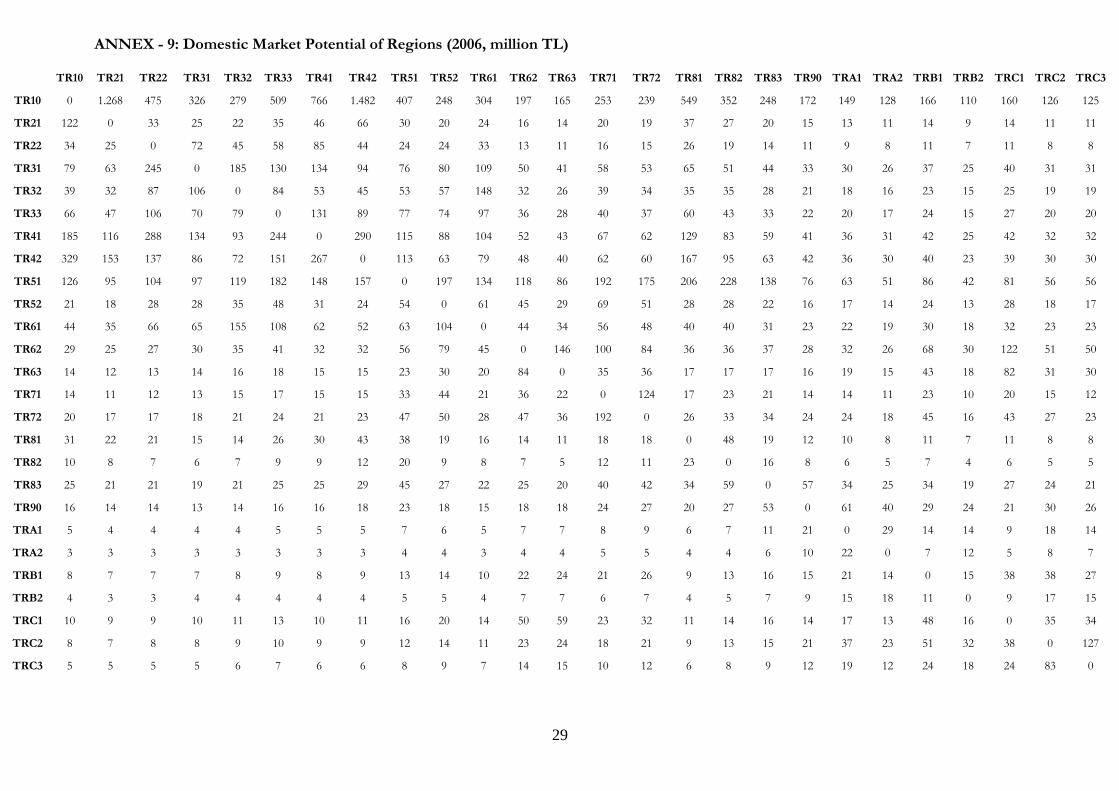
4.2. Domestic Market Potential of Regions
In this section, domestic market potentials of Turkish NUTS II regions will be measured. The
model that will be used is taken from Fujita, Veneblas and Krugman (1999). The idea is that
market potential of a region is related with two parameters: As the regional GDP increases,
market potential also increases and as the distance between two regions increases market
potential falls with the β square of distance.
Mathematical expression of the market potential formula is;
MPi = Σ(RGDPj) / (Dij)β (3)
MPi denotes market potential of region (i) in region (j), RGDPj is the regional GDP of (j) region
and Dij is the distance between region i and region j.
In order to determine market potentials of Turkish regions, regional GVAs will be used since
they include only production side of the economy and does not have taxes collected by the
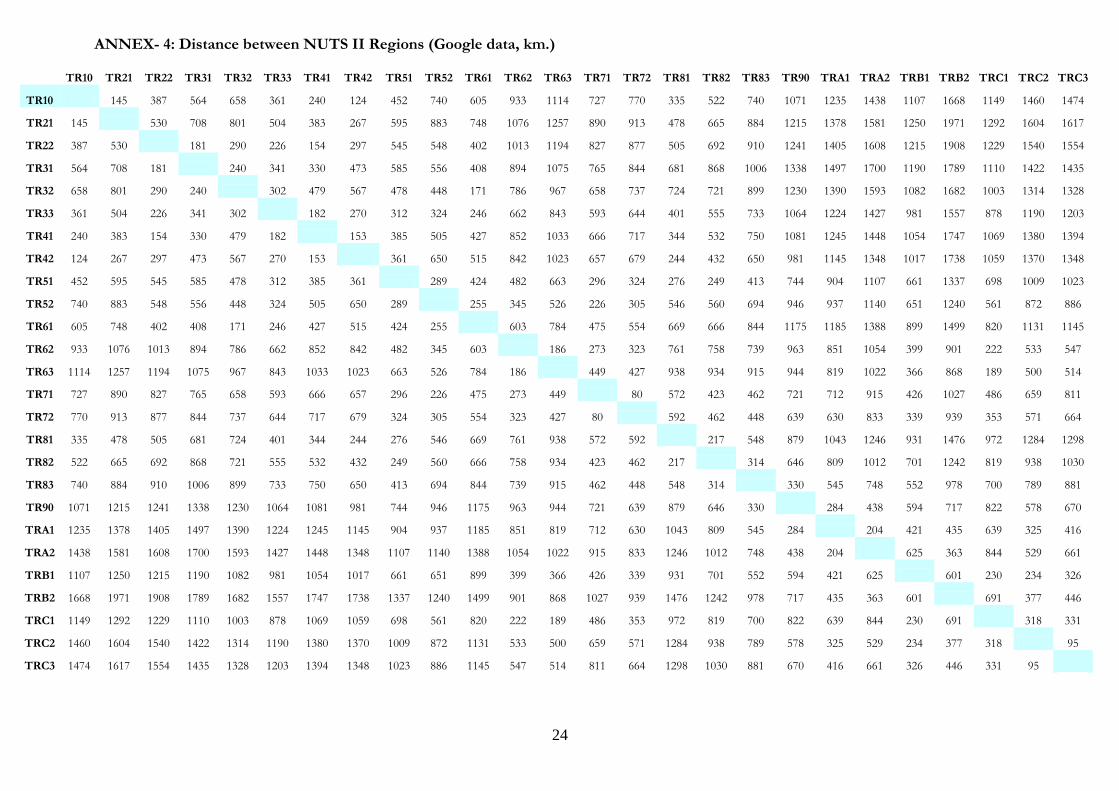
government. The distance between regions was based on Google measurements. Distance and
market potential of each region are presented between Annexes 4 to 10.

11
Regional market potentials have similar results with GVA values. Istanbul, Ankara and TR41
(Bursa, Eskişehir, Bilecik) NUTS II regions have the biggest market potential in Turkey. Again,
eastern regions have little market potential. It shows that eastern part of Turkey has neither
internal nor external demand potential to trigger economic development.
4.3. Major Transportation Investments
Improvement of Motorway Network Program is planned in order to meet Turkey’s 2023 targets.
Within the Program, 4773 km new additional motorway construction will be implemented. Due
to financial difficulties, build-operate-transfer model is adopted for 12 projects. In this study, 4
major projects have been chosen for policy scenarios. These projects are major transportation
projects that have the ability to affect regional market potentials.
North - West to West - Cost: Gebze - Izmir Highway Project,
North - West to East Border (to Iran): Istanbul – Bolu – Gerede – Merzifon – Erzincan –
Erzurum – Doğubayazit – Gürbulak,
Mid-West to South-East Border (to Iraq): Gerede – Ankara – Pozanti – Gaziantep –Şanliurfa
– Silopi - Habur
North-East to South-East: Trabzon – Gümüşhane – Aşkale – Erzurum – Bingol –
Diyarbakır – Mardin - Kızıltepe
4.3.1. Scenario 1: North - West to West-Cost
North - West to West-Cost: Gebze - İzmir Highway Project
Among the transportation investments, the first priority motorway project is Gebze – Orhangazi
– Izmir Motorway including Izmit Bay crossing and linking roads. The contracting process of this
project has been completed. The Izmit gulf passage and Bursa – Balikesir - Izmir highway starts
from Gebze, passes the gulf with a bridge and connects to Orhangazi (Bursa). The highway will
then continue from Bursa passing through Balikesir and finishes in Izmir.
The total length of the highway is projected to be approximately 421 km. Within the framework
of the project, 30 viaducts, 4 tunnels, 209 bridges, 18 booths, 5 highway maintenance - operation
centers, as well as 7 service and park areas will be constructed. The existing state highway will be
shortened by 140 km., travel period is expected to decrease from 8 - 10 hours to 3 - 4 hours.
Moreover, the second longest chain bridge of the world will be constructed in the north western
province of Izmit as part of the Project. The envisaged speed is 120 km/h.

12
Some regions will be directly affected, when the project is completed. Directly affected regions
with impact ratios are given below table;
Table 1: Directly Affected NUTS II Regions (Scenario I)
TR10 (Istanbul)
TR21 (Tekirdag, Edirne, Kirklareli)
TR22 (Balikesir, Canakkale)
TR31 (Izmir)
TR32 (Aydin, Denizli, Mugla)
TR33 (Kutahya, Afyon, Manisa, Usak)
TR41 (Kocaeli, Sakarya, Duzce, Bolu, Yalova)
TR42 (Bursa, Eskisehir, Bilecik)
TR81 (Zonguldak, Karabuk, Bartin)
It is assumed that the average speed will increase by 50 percent. Therefore, average speed values
from Gebze to Izmir will increase by 50 percent. Other regions will be affected within the range
of 15 and 40 percent. The impact matrix of the scenario 1 as follows:
Table 2: Impact Matrix of Scenario I TR10 TR21 TR22 TR31 TR32 TR33 TR41 TR42
TR10 0,00 1,00 1,35 1,50 1,45 1,40 1,40 1,15
TR21 1,00 0,00 1,00 1,25 1,25 1,10 1,15 1,15
TR22 1,35 1,00 0,00 1,40 1,30 1,10 1,00 1,25
TR31 1,50 1,25 1,40 0,00 1,00 1,15 1,50 1,50
TR32 1,45 1,25 1,30 1,00 0,00 1,00 1,15 0,15
TR33 1,40 1,10 1,10 1,15 1,00 0,00 1,15 1,20
TR41 1,40 1,15 1,00 1,50 1,15 1,15 0,00 1,50
TR42 1,15 1,15 1,25 1,50 0,15 1,20 1,50 0,00
4.3.2. Scenario 2: North - West to East Border (to Iran)
North - West to East Border (to Iran): Istanbul- Bolu – Gerede – Merzifon – Erzincan – Erzurum –
Doğubayazıt – Gürbulak
Total length of this axis is 1.493 kms. of which, 313 kms of motorway with 2x3 lanes, 277 kms of
dual carriageway with bituminous hot mixture, 381 kms of dual carriageway with surface
treatment, 321 kms of single carriageway with bituminous hot mixture and 201 kms of single
carriageway with surface treatment. The road section is located on E, TEM, TRACECA, HLG
(only some parts) and BSEC routes and is a continuation of Pan European Corridor IV.
Moreover, the route connects Europe to Caucasus and Asian countries. At the same time Samsun
Port is near to the route. Annual average traffic in Gurbulak Border Gate is 232.447
vehicles/year. The rates of passenger and freight carried on this road axis are 5.55 percent of total
13
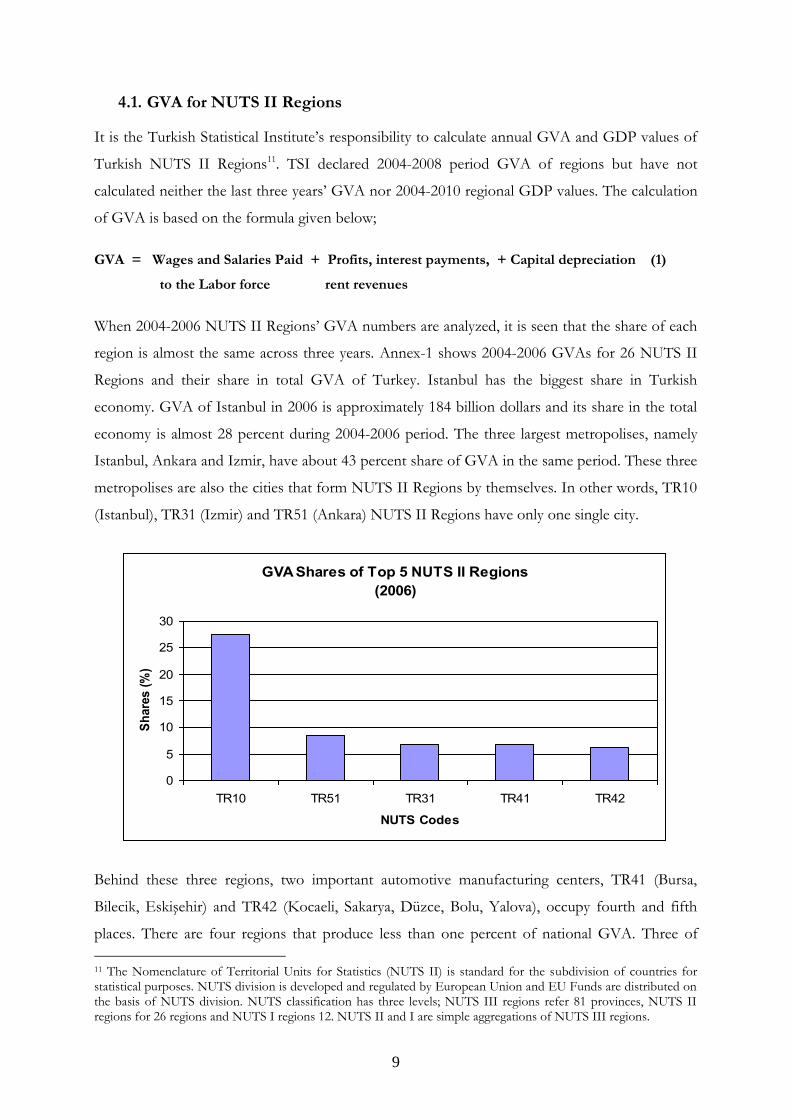
passenger transport and 8.81 percent of freight transport in Turkey. The design speed for the
project is 120 and 100 km/h. In our calculations, 110 km/h average speed is used.
When the project is completed, some regions will be directly affected. These directly affected
regions are given below table;
Table 3: Directly Affected NUTS II Regions (Scenario II)
TR10 (Istanbul) TR21 (Tekirdag, Edirne, Kirklareli) TR22 (Balikesir, Canakkale) TR31 (Izmir) TR32 (Aydin, Denizli, Mugla) TR33 (Kutahya, Afyon, Manisa, Usak) TR41 (Kocaeli, Sakarya, Duzce, Bolu, Yalova) TR42 (Bursa, Eskisehir, Bilecik) TR51 (Ankara) TR81 (Zonguldak, Karabuk, Bartin TR82 (Kastamonu, Cankiri, Sinop) TR83 (Samsun, Tokat, Corum, Amasya) TR90 (Trabzon, Ordu, Giresun, Rize, Artvin, Gumushane) TRA1 (Erzurum, Erzincan, Bayburt) TRA2 (Agri, Kars, Igdir, Ardahan) TRB2 (Van, Mus, Bitlis, Hakkari)
It is assumed that the average speed will increase by 30 percent. Therefore, average speed values
from Istanbul to Gürbulak Border will increase by 30 percent. Other regions will be affected
within the range of 5 percent and 25 percent. The impact matrix of the scenario 2 as follows:
Table 4: Impact Matrix of Scenario II TR10 TR21 TR22 TR41 TR42 TR51 TR81 TR82 TR83 TR90 TRA1 TRA2 TRB2
TR10 0,00 1,00 1,00 1,00 1,15 1,00 1,05 1,15 1,20 1,25 1,30 1,30 1,30
TR21 1,00 0,00 1,00 1,00 1,15 1,00 1,05 1,15 1,20 1,25 1,30 1,30 1,30
TR22 1,00 1,00 0,00 1,00 1,15 1,00 1,05 1,15 1,20 1,25 1,30 1,30 1,30
TR41 1,00 1,00 1,00 0,00 1,00 1,00 1,05 1,15 1,20 1,25 1,30 1,30 1,30
TR42 1,15 1,15 1,15 1,00 0,00 1,00 1,05 1,15 1,20 1,25 1,30 1,30 1,30
TR51 1,00 1,00 1,00 1,00 1,00 0,00 1,00 1,15 1,20 1,25 1,30 1,30 1,30
TR81 1,05 1,05 1,05 1,05 1,05 1,00 0,00 1,00 1,00 1,00 1,25 1,25 1,25
TR82 1,15 1,15 1,15 1,15 1,15 1,15 1,00 0,00 1,00 1,00 1,25 1,25 1,25
TR83 1,20 1,20 1,20 1,20 1,20 1,20 1,00 1,00 0,00 1,00 1,25 1,25 1,25
TR90 1,25 1,25 1,25 1,25 1,25 1,25 1,00 1,00 1,00 0,00 1,00 1,00 1,00
TRA1 1,30 1,30 1,30 1,30 1,30 1,30 1,25 1,25 1,25 1,00 0,00 1,05 1,00
TRA2 1,30 1,30 1,30 1,30 1,30 1,30 1,25 1,25 1,25 1,00 1,05 0,00 1,00
TRB2 1,30 1,30 1,30 1,30 1,30 1,30 1,25 1,25 1,25 1,00 1,00 1,00 0,00

14
4.3.3. Scenario 3: Mid-West to South-East Border (to Iraq)
Mid-West to South-East Border (to Iraq): Gerede – Ankara – Pozantı –Gaziantep - Sanliurfa -
Silopi - Habur Project
Total length of this axis is 1.312 kms, of which, 647 kms of motorway with 2x3 lanes, 373 kms of
dual carriageway with bituminous hot mixture, 87 kms of dual carriageway with surface treatment
and 205 kms of single carriageway with bituminous hot mixture. The road section is located on
E, TEM, TRACECA (only some parts), HLG (only some parts) and BSEC routes and is
continuation of Pan European Corridor IV. Moreover, the route connects Europe to Iraq,
Mediterranean and Middle-East countries.
At the same time, Mersin Port is near to the route. Annual average traffic in Habur Border Gate
is 879.023 vehicles per year. The rates of passenger and freight carried on this road axis are 5.87
percent of total passenger transport and 9.30 percent of total passenger transport in Turkey. The
design speed for the project is 120 and 100 km/h. In this study, 110 km/h is used as average
speed.
When the project is completed, the impact of Project on market potential of regions will not
change since there will be no difference between time efficiencies before and after the new road
constructed.
4.3.4. Scenario 4: North-East to South - East
North-East to South - East: Trabzon – Gumushane – Askale – Erzurum – Bingol – Diyarbakir –
Mardin – Kiziltepe Project
Total length of this axis is 720 kms, of which, 81 kms of dual carriage way with bituminous hot
mixture, 123 kms of dual carriageway with surface treatment and 64 kms of single carriageway
with bituminous hot mixture and 452 kms of single carriageway with surface treatment. Some
subsections of this route are located on E, TEM, BSEC and TRACECA routes. This road
segment connects Black Sea Ring Road and Caucasia to Middle East. The rates of passenger and
freight carried on this road axis are 2.29 percent of total passenger transport and 1.12 percent of
total freight transport in Turkey. The design speed for the project is 120 and 100 km/h. the
average speed is estimated to be 110 km/h.
Below table presents directly affected regions from the project.

15
Table 5: Directly Affected NUTS II Regions (Scenario IV)
TR90 (Trabzon, Ordu, Giresun, Rize, Artvin, Gumushane) TRA1 (Erzurum, Erzincan, Bayburt) TRA2 (Agri, Kars, Igdir, Ardahan) TRB1 (Malatya, Elazig, Tunceli, Bingol) TRC2 (Diyarbakir, Sanliurfa) TRC3 (Mardin, Batman, Sirnak, Siirt)
It is assumed that the average speed will increase 30 by percent. Therefore, average speed values
from Trabzon to Kiziltepe will increase by 30 percent. However, the time effectiveness between
Diyarbakir and Mardin will be doubled. Other regions will be affected within the range of 5
percent and 25 percent. The impact matrix of the scenario IV as follows:
Table 6: Impact Matrix of Scenario IV
TR90 TRA1 TRA2 TRB1 TRB2 TRC1 TRC2 TRC3
TR90 0,00 1,20 1,05 1,20 1,00 1,00 1,30 1,30
TRA1 1,20 0,00 1,00 1,20 1,00 1,00 1,30 1,30
TRA2 1,05 1,00 0,00 1,20 1,00 1,00 1,25 1,25
TRB1 1,20 1,20 1,20 0,00 1,00 1,00 1,20 1,20
TRB2 1,00 1,00 1,00 1,00 0,00 1,00 1,00 1,00
TRC1 1,00 1,00 1,00 1,00 1,00 0,00 1,00 1,00
TRC2 1,30 1,30 1,25 1,20 1,00 1,00 0,00 1,50
TRC3 1,30 1,30 1,25 1,20 1,00 1,00 1,50 0,00
16
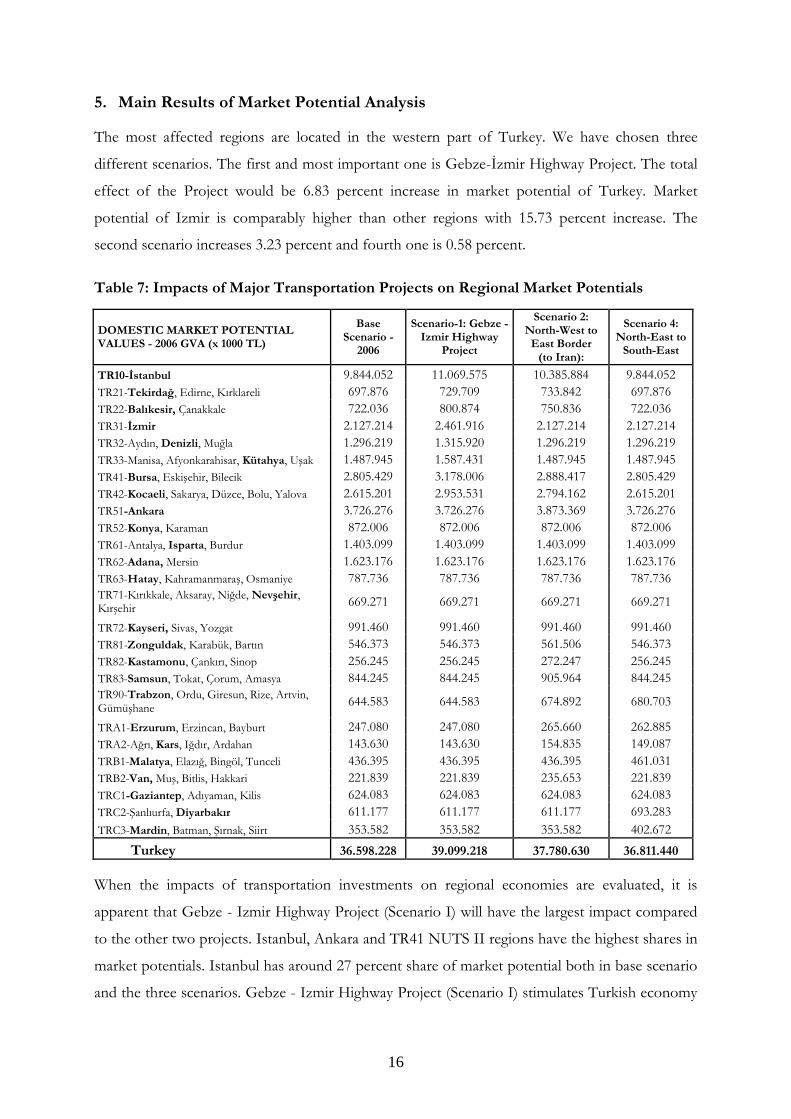
5. Main Results of Market Potential Analysis
The most affected regions are located in the western part of Turkey. We have chosen three
different scenarios. The first and most important one is Gebze-İzmir Highway Project. The total
effect of the Project would be 6.83 percent increase in market potential of Turkey. Market
potential of Izmir is comparably higher than other regions with 15.73 percent increase. The
second scenario increases 3.23 percent and fourth one is 0.58 percent.
Table 7: Impacts of Major Transportation Projects on Regional Market Potentials
DOMESTIC MARKET POTENTIAL VALUES - 2006 GVA (x 1000 TL)
Base Scenario -
2006
Scenario-1: Gebze - Izmir Highway
Project
Scenario 2: North-West to
East Border (to Iran):
Scenario 4: North-East to
South-East
TR10-İstanbul 9.844.052 11.069.575 10.385.884 9.844.052
TR21-Tekirdağ, Edirne, Kırklareli 697.876 729.709 733.842 697.876
TR22-Balıkesir, Çanakkale 722.036 800.874 750.836 722.036
TR31-İzmir 2.127.214 2.461.916 2.127.214 2.127.214
TR32-Aydın, Denizli, Muğla 1.296.219 1.315.920 1.296.219 1.296.219
TR33-Manisa, Afyonkarahisar, Kütahya, Uşak 1.487.945 1.587.431 1.487.945 1.487.945
TR41-Bursa, Eskişehir, Bilecik 2.805.429 3.178.006 2.888.417 2.805.429
TR42-Kocaeli, Sakarya, Düzce, Bolu, Yalova 2.615.201 2.953.531 2.794.162 2.615.201
TR51-Ankara 3.726.276 3.726.276 3.873.369 3.726.276
TR52-Konya, Karaman 872.006 872.006 872.006 872.006
TR61-Antalya, Isparta, Burdur 1.403.099 1.403.099 1.403.099 1.403.099
TR62-Adana, Mersin 1.623.176 1.623.176 1.623.176 1.623.176
TR63-Hatay, Kahramanmaraş, Osmaniye 787.736 787.736 787.736 787.736
TR71-Kırıkkale, Aksaray, Niğde, Nevşehir, Kırşehir
669.271 669.271 669.271 669.271
TR72-Kayseri, Sivas, Yozgat 991.460 991.460 991.460 991.460
TR81-Zonguldak, Karabük, Bartın 546.373 546.373 561.506 546.373
TR82-Kastamonu, Çankırı, Sinop 256.245 256.245 272.247 256.245
TR83-Samsun, Tokat, Çorum, Amasya 844.245 844.245 905.964 844.245
TR90-Trabzon, Ordu, Giresun, Rize, Artvin, Gümüşhane
644.583 644.583 674.892 680.703
TRA1-Erzurum, Erzincan, Bayburt 247.080 247.080 265.660 262.885
TRA2-Ağrı, Kars, Iğdır, Ardahan 143.630 143.630 154.835 149.087
TRB1-Malatya, Elazığ, Bingöl, Tunceli 436.395 436.395 436.395 461.031
TRB2-Van, Muş, Bitlis, Hakkari 221.839 221.839 235.653 221.839
TRC1-Gaziantep, Adıyaman, Kilis 624.083 624.083 624.083 624.083
TRC2-Şanlıurfa, Diyarbakır 611.177 611.177 611.177 693.283
TRC3-Mardin, Batman, Şırnak, Siirt 353.582 353.582 353.582 402.672
Turkey 36.598.228 39.099.218 37.780.630 36.811.440
When the impacts of transportation investments on regional economies are evaluated, it is
apparent that Gebze - Izmir Highway Project (Scenario I) will have the largest impact compared
to the other two projects. Istanbul, Ankara and TR41 NUTS II regions have the highest shares in
market potentials. Istanbul has around 27 percent share of market potential both in base scenario
and the three scenarios. Gebze - Izmir Highway Project (Scenario I) stimulates Turkish economy

17
by 2.5 billion TL while North-West to East Border (to Iran) has 1.2 billion TL effect and North-
East to South-East transportation project has only 0.2 billion TL additional impact on regional
economies, annually.
Shares of NUTS II regions do not change if base scenario continues, i.e. if major transportation
projects will not be actualized, or one of the three projects is completed. It illustrates that
implementation of transportation projects will positively affect regional economies but
interregional development disparities will remain stable after the projects are completed. If
Turkish regions are separated as developed and underdeveloped regions, around 82 percent of
increase in market potential will be captured by developed regions, while just 18 percent share of
underdeveloped regions remain the same. Below table illustrates the percentage shares of each
NUTS II region with respect to market potential scheme if projects are finished.
Table 8: Shares of NUTS II Regions in Market Potential
Base Scenario
- 2006
Scenario-1: Gebze - Izmir Highway
Project
Scenario 2: North-West to East Border
(to Iran):
Scenario 4: North-East to
South-East
TR10-İstanbul 27% 28% 27% 27%
TR21-Tekirdağ, Edirne, Kırklareli 2% 2% 2% 2%
TR22-Balıkesir, Çanakkale 2% 2% 2% 2%
TR31-İzmir 6% 6% 6% 6%
TR32-Aydın, Denizli, Muğla 4% 3% 3% 4%
TR33-Manisa, Afyonkarahisar, Kütahya, Uşak 4% 4% 4% 4%
TR41-Bursa, Eskişehir, Bilecik 8% 8% 8% 8%
TR42-Kocaeli, Sakarya, Düzce, Bolu, Yalova 7% 8% 7% 7%
TR51-Ankara 10% 10% 10% 10%
TR52-Konya, Karaman 2% 2% 2% 2%
TR61-Antalya, Isparta, Burdur 4% 4% 4% 4%
TR62-Adana, Mersin 4% 4% 4% 4%
TR63-Hatay, Kahramanmaraş, Osmaniye 2% 2% 2% 2%
TR71-Kırıkkale, Aksaray, Niğde, Nevşehir, Kırşehir 2% 2% 2% 2%
TR72-Kayseri, Sivas, Yozgat 3% 3% 3% 3%
TR81-Zonguldak, Karabük, Bartın 1% 1% 1% 1%
TR82-Kastamonu, Çankırı, Sinop 1% 1% 1% 1%
TR83-Samsun, Tokat, Çorum, Amasya 2% 2% 2% 2% TR90-Trabzon, Ordu, Giresun, Rize, Artvin, Gümüşhane
2% 2% 2% 2%
TRA1-Erzurum, Erzincan, Bayburt 1% 1% 1% 1%
TRA2-Ağrı, Kars, Iğdır, Ardahan 0% 0% 0% 0%
TRB1-Malatya, Elazığ, Bingöl, Tunceli 1% 1% 1% 1%
TRB2-Van, Muş, Bitlis, Hakkari 1% 1% 1% 1%
TRC1-Gaziantep, Adıyaman, Kilis 2% 2% 2% 2%
TRC2-Şanlıurfa, Diyarbakır 2% 2% 2% 2%
TRC3-Mardin, Batman, Şırnak, Siirt 1% 1% 1% 1%
Turkey 100% 100% 100% 100%

18
Table 9: Percentage Changes in Regional Market Potential
Scenario-1: %
Change Scenario-2: %
Change Scenario 4: %
Change
TR10-İstanbul 12,45% 5,50% 0,00%
TR21-Tekirdağ, Edirne, Kırklareli 4,56% 5,15% 0,00%
TR22-Balıkesir, Çanakkale 10,92% 3,99% 0,00%
TR31-İzmir 15,73% 0,00% 0,00%
TR32-Aydın, Denizli, Muğla 1,52% 0,00% 0,00%
TR33-Manisa, Afyonkarahisar, Kütahya, Uşak 6,69% 0,00% 0,00%
TR41-Bursa, Eskişehir, Bilecik 13,28% 2,96% 0,00%
TR42-Kocaeli, Sakarya, Düzce, Bolu, Yalova 12,94% 6,84% 0,00%
TR51-Ankara 0,00% 3,95% 0,00%
TR52-Konya, Karaman 0,00% 0,00% 0,00%
TR61-Antalya, Isparta, Burdur 0,00% 0,00% 0,00%
TR62-Adana, Mersin 0,00% 0,00% 0,00%
TR63-Hatay, Kahramanmaraş, Osmaniye 0,00% 0,00% 0,00%
TR71-Kırıkkale, Aksaray, Niğde, Nevşehir, Kırşehir 0,00% 0,00% 0,00%
TR72-Kayseri, Sivas, Yozgat 0,00% 0,00% 0,00%
TR81-Zonguldak, Karabük, Bartın 0,00% 2,77% 0,00%
TR82-Kastamonu, Çankırı, Sinop 0,00% 6,25% 0,00%
TR83-Samsun, Tokat, Çorum, Amasya 0,00% 7,31% 0,00%
TR90-Trabzon, Ordu, Giresun, Rize, Artvin, Gümüşhane 0,00% 4,70% 5,60%
TRA1-Erzurum, Erzincan, Bayburt 0,00% 7,52% 6,40%
TRA2-Ağrı, Kars, Iğdır, Ardahan 0,00% 7,80% 3,80%
TRB1-Malatya, Elazığ, Bingöl, Tunceli 0,00% 0,00% 5,65%
TRB2-Van, Muş, Bitlis, Hakkari 0,00% 6,23% 0,00%
TRC1-Gaziantep, Adıyaman, Kilis 0,00% 0,00% 0,00%
TRC2-Şanlıurfa, Diyarbakır 0,00% 0,00% 13,43%
TRC3-Mardin, Batman, Şırnak, Siirt 0,00% 0,00% 13,88%
Turkey 6,83% 3,23% 0,58%
With respect to the percentage change in regional market potentials, Izmir region will have the
largest benefit with 15.7 percent increase. North-East to South-East transportation project has
significant impacts on TRC2 (Şanlıurfa, Diyarbakır) and TRC3 (Mardin, Batman, Şırnak, Siirt)
regions. It is expected that this project will enhance connectivity of southeastern regions to the
inner regions of Turkey and Middle East. North-West to East Border (to Iran) transportation
project will connect northeastern part of Turkey to Iran and Caucasian Region. TRA1 (Erzurum,
Erzincan, Bayburt) and TRA2 (Ağrı, Kars, Iğdır, Ardahan) NUTS II regions will be affected by
around 8 percent increase in market potential when the project is completed. Scenario IV
promises little impact since the route will impact only six regions, all of which have small shares
in total economy. These six NUTS II regions have only 8.4 percent share in total GVA.

19
6. Conclusion
Current regional development theories give more attention to the accessibility and better
connectivity of regions within and across countries. Better transportation infrastructure enhance
investment climate, attract foreign investment and accelerate interregional trade flows. Cities
largely benefiting from agglomeration economies are able to generate opportunities from better
accessibility measures. On the other hand, remote regions will increase competitive power if they
are well integrated national and international markets.
Poor transportation connectivity between east and west, north and south resulted in persistence
development disparities in Turkish regions. Upcoming transportation investments are projected
to alleviate disparities in medium and long term. In this regard, the paper has shown that major
transportation projects will expand economic activities in Turkey.
Gebze - Izmir Highway Project will have comparably higher effect than other two projects.
Transportation project on Mid-West to South-East Border (to Iraq) will not alter time efficiencies
on this route, hence it will not alter market potential. North - West to East Border (to Iran)
Project and North-East to South – East Project have lower effects than Gebze - Izmir Highway
Project because they will connect relatively less developed regions. If these three transportation
projects have been come into operation, total effect would be 3.8 billion TL on Turkish
economy. This is a 10 percent increase in market potential of regions.
Although regional economies will enlarge their trade volumes, regional development disparities
are envisaged to remain stable since proportional increase in market potential will be equal among
regions. 4/5 of economic benefit will be seized by relatively developed regions; almost all of them
are located in the western part of the country. Less developed eastern regions require stronger
inner and outer transportation facilities even economic rate of return is much lower compared to
western regions.

20
References
ARBATLI, Eren, ―The Neoclassical Model of Exogenous Growth‖, Brown University, 2006.
FUJITA, P. KRUGMAN, A.VENEBLAS, The Spatial Economy: Cities, Regions and International Trade, MIT Press, 2001.
KRUGMAN, Geography and Trade, Leuven University Press, Leuven, 1991.
KRUGMAN, Paul, ―What’s New About the New Economic Geography‖, Oxford Review of Economic Policy, Vol. 14, No. 2, 1998.
MYRDAL, G. ―Appendix 3 of American Dilemma - The Negro Problem and Modern Democracy‖, Harper & Bros, 1944.
NIEBUHR, Annekatrin, ―Market Access and Regional Disparities: New Economic Geography in Europe‖, Annals of Regional Science, 40: 313–334, 2006.
MIDELFART-KNARVIK, OVERMAN, VENABLES, ―Comparative Advantage and Economic Geography: Estimating the Location of Production in the EU‖, Center for Economic Policy Research, Discussion Paper Series No: 2618, London-UK.
PERROUX, F, ―Note on the Concept of Growth Poles‖ in: McKee D, Dean RD, Leahy WH (eds) Regional Economics: Theory and Practice. The Free Press, New York, 1970.
THUNEN, Von Johann Heinrich, Isolated State, an English edition of Der Isolierte Staat, translated by Carla M. Wartenberg. Edited with an introd. by Peter Hall, Oxford, New York, Pergamon Pres, 1966.
VAYÁ, Esther; Enrique LÓPEZ-BAZO; Manuel ARTÍS, ―Growth, Convergence and (why not?) Regional Externalities‖, Anàlisi Quantitativa Regional Research Group Dpt. of Econometrics, Statistics and Spanish Economy, University of Barcelona,
VENEBLAS, Anthony J., ―Geography and International Inequalities: The Impact of New Technologies‖, World Bank Annual Bank Conference on Development Economics, Washington May – 2001.

21
ANNEX-1: Gross Value Added of NUTS II Regions in 2004-2006 Period
Regional GVA (current prices, billion TL) Share in Total GVA
Code Provinces in the NUTS II Region 2004 2005 2006 2004 2005 2006
TR10 İstanbul 137,4 156,7 183,8 27,77 27,42 27,5
TR21 Tekirdağ, Edirne, Kırklareli 12,4 14,9 17,7 2,51 2,6 2,65
TR22 Balıkesir, Çanakkale 10,1 11,7 13,1 2,05 2,06 1,96
TR31 İzmir 33,5 38,1 44,4 6,76 6,67 6,64
TR32 Aydın, Denizli, Muğla 19,0 21,4 25,3 3,83 3,74 3,79
TR33 Manisa, Afyon, Kütahya, Uşak 17,2 20,3 23,9 3,48 3,55 3,58
TR41 Bursa, Eskişehir, Bilecik 31,2 37,1 44,4 6,31 6,48 6,64
TR42 Kocaeli, Sakarya, Düzce, Bolu, Yalova 28,9 33,9 40,8 5,85 5,93 6,11
TR51 Ankara 41,7 47,6 56,8 8,43 8,32 8,5
TR52 Konya, Karaman 11,9 13,6 15,5 2,4 2,39 2,32
TR61 Antalya, Isparta, Burdur 19,4 22,8 26,5 3,93 3,99 3,97
TR62 Adana, Mersin 20,1 23,4 27,2 4,07 4,1 4,07
TR63 Hatay, Kahramanmaraş, Osmaniye 12,0 14,0 15,6 2,43 2,44 2,33
TR71 Kırıkkale, Aksaray, Niğde, Nevşehir, Kırşehir 7,7 8,8 9,9 1,55 1,54 1,48
TR72 Kayseri, Sivas, Yozgat 11,8 13,3 15,3 2,38 2,33 2,29
TR81 Zonguldak, Karabük, Bartın 7,5 9,0 10,4 1,52 1,57 1,55
TR82 Kastamonu, Çankırı, Sinop 4,3 4,6 5,0 0,87 0,8 0,76
TR83 Samsun, Tokat, Çorum, Amasya 13,9 16,0 18,7 2,81 2,8 2,79
TR90 Trabzon, Ordu, Giresun, Rize, Artvin, Gümüşhane 12,4 15,2 17,4 2,51 2,65 2,6
TRA1 Erzurum, Erzincan, Bayburt 4,7 5,1 5,9 0,96 0,89 0,89
TRA2 Ağrı, Kars, Iğdır, Ardahan 3,4 3,9 4,4 0,68 0,68 0,66
TRB1 Malatya, Elazığ, Bingöl, Tunceli 6,8 8,0 8,8 1,37 1,39 1,32
TRB2 Van, Muş, Bitlis, Hakkari 5,1 6,0 6,5 1,02 1,04 0,97
TRC1 Gaziantep, Adıyaman, Kilis 8,0 9,7 11,1 1,62 1,69 1,67
TRC2 Şanlıurfa, Diyarbakır 9,4 10,5 12,0 1,89 1,84 1,8
TRC3 Mardin, Batman, Şırnak, Siirt 5,0 6,3 7,8 1 1,1 1,17
TR Türkiye 494,9 571,7 668,4 100 100 100

22
ANNEX-2: Estimated Regional Gross Domestic Product for 2004-2010
Estimated Regional GDP (current prices, billion TL)
Code Provinces in the NUTS II Region 2004 2005 2006 2007 2008 2009 2010
TR10 İstanbul 155,2 177,9 208,6 230,1 258,1 257,4 267,7
TR21 Tekirdağ, Edirne, Kırklareli 14,0 16,9 20,1 23,0 26,6 27,3 29,2
TR22 Balıkesir, Çanakkale 11,5 13,4 14,9 16,3 17,9 17,6 17,9
TR31 İzmir 37,8 43,3 50,4 55,4 61,9 61,4 63,6
TR32 Aydın, Denizli, Muğla 21,4 24,3 28,7 31,6 35,4 35,3 36,7
TR33 Manisa, Afyon, Kütahya, Uşak 19,5 23,0 27,2 30,7 35,0 35,6 37,7
TR41 Bursa, Eskişehir, Bilecik 35,3 42,1 50,4 57,4 66,3 68,0 72,7
TR42 Kocaeli, Sakarya, Düzce, Bolu, Yalova 32,7 38,5 46,3 52,5 60,4 61,8 65,8
TR51 Ankara 47,1 54,0 64,5 71,6 81,0 81,5 85,5
TR52 Konya, Karaman 13,4 15,5 17,6 19,3 21,4 21,1 21,6
TR61 Antalya, Isparta, Burdur 22,0 25,9 30,1 33,8 38,2 38,5 40,5
TR62 Adana, Mersin 22,8 26,6 30,9 34,4 38,8 38,9 40,6
TR63 Hatay, Kahramanmaraş, Osmaniye 13,6 15,8 17,7 19,4 21,4 21,0 21,4
TR71 Kırıkkale, Aksaray, Niğde, Nevşehir, Kırşehir 8,7 10,0 11,2 12,3 13,5 13,2 13,4
TR72 Kayseri, Sivas, Yozgat 13,3 15,1 17,4 18,9 20,9 20,5 21,0
TR81 Zonguldak, Karabük, Bartın 8,5 10,2 11,8 13,3 15,1 15,3 16,1
TR82 Kastamonu, Çankırı, Sinop 4,9 5,2 5,8 5,9 6,1 5,6 5,3
TR83 Samsun, Tokat, Çorum, Amasya 15,7 18,2 21,2 23,4 26,3 26,3 27,4
TR90 Trabzon, Ordu, Giresun, Rize, Artvin, Gümüşhane 14,0 17,2 19,7 22,6 25,9 26,4 28,0
TRA1 Erzurum, Erzincan, Bayburt 5,4 5,8 6,7 7,1 7,7 7,4 7,4
TRA2 Ağrı, Kars, Iğdır, Ardahan 3,8 4,4 5,0 5,5 6,1 6,0 6,2
TRB1 Malatya, Elazığ, Bingöl, Tunceli 7,7 9,0 10,0 11,0 12,2 12,0 12,3
TRB2 Van, Muş, Bitlis, Hakkari 5,7 6,7 7,4 8,1 8,9 8,7 8,8
TRC1 Gaziantep, Adıyaman, Kilis 9,1 11,0 12,7 14,4 16,5 16,8 17,8
TRC2 Şanlıurfa, Diyarbakır 10,6 11,9 13,7 14,8 16,2 15,8 16,1
TRC3 Mardin, Batman, Şırnak, Siirt 5,6 7,1 8,9 10,6 12,8 13,6 15,1

23
ANNEX-3: Estimated Regional per capita GDP for 2004-2010
Estimated Regional per capita GDP (current prices, TL)
Code Provinces in the NUTS II Region 2007 2008 2009
TR10 İstanbul 18.302 20.331 19.933
TR21 Tekirdağ, Edirne, Kırklareli 15.767 17.694 18.062
TR22 Balıkesir, Çanakkale 10.224 11.183 10.854
TR31 İzmir 14.815 16.301 15.884
TR32 Aydın, Denizli, Muğla 12.056 13.244 13.040
TR33 Manisa, Afyon, Kütahya, Uşak 10.432 12.025 12.104
TR41 Bursa, Eskişehir, Bilecik 17.038 19.248 19.380
TR42 Kocaeli, Sakarya, Düzce, Bolu, Yalova 17.212 19.254 19.342
TR51 Ankara 16.020 17.807 17.527
TR52 Konya, Karaman 8.836 9.721 9.464
TR61 Antalya, Isparta, Burdur 13.720 15.211 14.860
TR62 Adana, Mersin 9.549 10.686 10.496
TR63 Hatay, Kahramanmaraş, Osmaniye 6.820 7.356 7.086
TR71 Kırıkkale, Aksaray, Niğde, Nevşehir, Kırşehir 8.273 9.031 8.757
TR72 Kayseri, Sivas, Yozgat 8.240 9.086 8.817
TR81 Zonguldak, Karabük, Bartın 13.079 14.822 14.906
TR82 Kastamonu, Çankırı, Sinop 8.054 8.315 7.534
TR83 Samsun, Tokat, Çorum, Amasya 8.592 9.680 9.598
TR90 Trabzon, Ordu, Giresun, Rize, Artvin, Gümüşhane 9.069 10.318 10.431
TRA1 Erzurum, Erzincan, Bayburt 6.614 7.240 6.936
TRA2 Ağrı, Kars, Iğdır, Ardahan 4.842 5.361 5.312
TRB1 Malatya, Elazığ, Bingöl, Tunceli 6.908 7.522 7.380
TRB2 Van, Muş, Bitlis, Hakkari 4.131 4.457 4.309
TRC1 Gaziantep, Adıyaman, Kilis 6.376 7.114 7.092
TRC2 Şanlıurfa, Diyarbakır 4.955 5.294 5.064
TRC3 Mardin, Batman, Şırnak, Siirt 5.517 6.505 6.915
24
ANNEX- 4: Distance between NUTS II Regions (Google data, km.)
TR10 TR21 TR22 TR31 TR32 TR33 TR41 TR42 TR51 TR52 TR61 TR62 TR63 TR71 TR72 TR81 TR82 TR83 TR90 TRA1 TRA2 TRB1 TRB2 TRC1 TRC2 TRC3
TR10 0 145 387 564 658 361 240 124 452 740 605 933 1114 727 770 335 522 740 1071 1235 1438 1107 1668 1149 1460 1474
TR21 145 530 708 801 504 383 267 595 883 748 1076 1257 890 913 478 665 884 1215 1378 1581 1250 1971 1292 1604 1617
TR22 387 530 181 290 226 154 297 545 548 402 1013 1194 827 877 505 692 910 1241 1405 1608 1215 1908 1229 1540 1554
TR31 564 708 181 240 341 330 473 585 556 408 894 1075 765 844 681 868 1006 1338 1497 1700 1190 1789 1110 1422 1435
TR32 658 801 290 240 302 479 567 478 448 171 786 967 658 737 724 721 899 1230 1390 1593 1082 1682 1003 1314 1328
TR33 361 504 226 341 302 182 270 312 324 246 662 843 593 644 401 555 733 1064 1224 1427 981 1557 878 1190 1203
TR41 240 383 154 330 479 182 153 385 505 427 852 1033 666 717 344 532 750 1081 1245 1448 1054 1747 1069 1380 1394
TR42 124 267 297 473 567 270 153 361 650 515 842 1023 657 679 244 432 650 981 1145 1348 1017 1738 1059 1370 1348
TR51 452 595 545 585 478 312 385 361 289 424 482 663 296 324 276 249 413 744 904 1107 661 1337 698 1009 1023
TR52 740 883 548 556 448 324 505 650 289 255 345 526 226 305 546 560 694 946 937 1140 651 1240 561 872 886
TR61 605 748 402 408 171 246 427 515 424 255 603 784 475 554 669 666 844 1175 1185 1388 899 1499 820 1131 1145
TR62 933 1076 1013 894 786 662 852 842 482 345 603 186 273 323 761 758 739 963 851 1054 399 901 222 533 547
TR63 1114 1257 1194 1075 967 843 1033 1023 663 526 784 186 449 427 938 934 915 944 819 1022 366 868 189 500 514
TR71 727 890 827 765 658 593 666 657 296 226 475 273 449 80 572 423 462 721 712 915 426 1027 486 659 811
TR72 770 913 877 844 737 644 717 679 324 305 554 323 427 80 592 462 448 639 630 833 339 939 353 571 664
TR81 335 478 505 681 724 401 344 244 276 546 669 761 938 572 592 217 548 879 1043 1246 931 1476 972 1284 1298
TR82 522 665 692 868 721 555 532 432 249 560 666 758 934 423 462 217 314 646 809 1012 701 1242 819 938 1030
TR83 740 884 910 1006 899 733 750 650 413 694 844 739 915 462 448 548 314 330 545 748 552 978 700 789 881
TR90 1071 1215 1241 1338 1230 1064 1081 981 744 946 1175 963 944 721 639 879 646 330 284 438 594 717 822 578 670
TRA1 1235 1378 1405 1497 1390 1224 1245 1145 904 937 1185 851 819 712 630 1043 809 545 284 204 421 435 639 325 416
TRA2 1438 1581 1608 1700 1593 1427 1448 1348 1107 1140 1388 1054 1022 915 833 1246 1012 748 438 204 625 363 844 529 661
TRB1 1107 1250 1215 1190 1082 981 1054 1017 661 651 899 399 366 426 339 931 701 552 594 421 625 601 230 234 326
TRB2 1668 1971 1908 1789 1682 1557 1747 1738 1337 1240 1499 901 868 1027 939 1476 1242 978 717 435 363 601 691 377 446
TRC1 1149 1292 1229 1110 1003 878 1069 1059 698 561 820 222 189 486 353 972 819 700 822 639 844 230 691 318 331
TRC2 1460 1604 1540 1422 1314 1190 1380 1370 1009 872 1131 533 500 659 571 1284 938 789 578 325 529 234 377 318 95
TRC3 1474 1617 1554 1435 1328 1203 1394 1348 1023 886 1145 547 514 811 664 1298 1030 881 670 416 661 326 446 331 95

25
ANNEX - 5: Average Speed between Regions (km/h)
TR10 TR21 TR22 TR31 TR32 TR33 TR41 TR42 TR51 TR52 TR61 TR62 TR63 TR71 TR72 TR81 TR82 TR83 TR90 TRA1 TRA2 TRB1 TRB2 TRC1 TRC2 TRC3 Average
TR10 0,0 45,3 64,0 67,3 70,9 67,7 57,1 52,8 79,1 74,1 69,3 81,2 81,8 77,3 77,6 62,6 73,5 75,8 72,0 72,2 69,6 74,5 73,5 83,6 83,7 80,1 68,7
TR21 45,3 0,0 60,9 64,2 67,1 63,1 55,9 53,4 71,1 69,9 65,7 76,1 77,3 73,9 72,6 59,8 68,2 71,2 69,4 69,7 67,8 71,4 78,8 78,8 79,8 76,8 65,7
TR22 64,0 60,9 0,0 70,5 64,0 53,6 70,0 69,3 78,8 62,4 56,5 81,0 81,5 79,4 78,0 69,3 76,6 77,8 73,9 73,8 71,2 75,1 81,0 83,1 83,3 80,0 69,8
TR31 67,3 64,2 70,5 0,0 72,4 63,9 73,1 71,5 70,5 68,4 72,2 70,6 72,6 67,4 70,0 70,9 76,4 72,5 70,5 73,0 70,8 67,9 75,4 74,2 74,9 73,2 68,2
TR32 70,9 67,1 64,0 72,4 0,0 74,3 73,9 74,8 73,9 71,1 67,9 72,6 74,5 69,3 68,9 74,9 72,0 74,6 71,7 74,4 71,6 69,0 76,9 76,6 78,2 74,8 69,6
TR33 67,7 63,1 53,6 63,9 74,3 0,0 68,7 72,3 77,0 68,0 68,3 71,2 73,6 78,5 76,8 68,0 73,2 76,1 72,2 75,3 72,0 73,7 76,5 75,8 77,9 74,1 68,9
TR41 57,1 55,9 70,0 73,1 73,9 68,7 0,0 60,0 76,2 71,0 72,0 80,0 80,7 77,7 76,4 63,3 74,1 76,1 72,3 69,7 69,8 73,6 80,5 82,8 83,0 79,4 69,9
TR42 52,8 53,4 69,3 71,5 74,8 72,3 60,0 0,0 88,8 78,0 72,7 85,6 85,4 84,8 82,0 65,9 79,3 80,1 74,2 74,0 70,9 77,0 83,3 87,5 86,7 80,5 72,7
TR51 79,1 71,1 78,8 70,5 73,9 77,0 76,2 88,8 0,0 64,5 72,3 80,8 81,7 76,2 71,5 73,0 61,7 71,4 68,4 72,8 69,3 69,8 78,6 84,8 84,4 79,4 72,2
TR52 74,1 69,9 62,4 68,4 71,1 68,0 71,0 78,0 64,5 0,0 58,8 72,1 75,9 63,1 63,5 68,3 67,1 70,0 65,8 70,5 67,7 66,7 78,3 79,4 81,0 75,6 67,3
TR61 69,3 65,7 56,5 72,2 67,9 68,3 72,0 72,7 72,3 58,8 0,0 68,1 71,3 63,1 63,4 73,7 70,7 73,7 71,0 68,8 66,8 65,6 75,3 73,7 76,2 72,5 66,5
TR62 81,2 76,1 81,0 70,6 72,6 71,2 80,0 85,6 80,8 72,1 68,1 0,0 77,0 74,5 72,9 79,4 76,4 69,7 68,7 70,5 67,4 67,4 79,7 87,6 85,3 76,1 72,8
TR63 81,8 77,3 81,5 72,6 74,5 73,6 80,7 85,4 81,7 75,9 71,3 77,0 0,0 78,1 65,4 80,3 77,7 72,0 63,6 66,0 64,0 58,7 74,6 65,9 76,1 68,5 70,9
TR71 77,3 73,9 79,4 67,4 69,3 78,5 77,7 84,8 76,2 63,1 63,1 74,5 78,1 0,0 62,3 77,3 65,8 64,6 66,3 72,8 68,6 68,0 70,5 83,6 69,4 77,5 69,6
TR72 77,6 72,6 78,0 70,0 68,9 76,8 76,4 82,0 71,5 63,5 63,4 72,9 65,4 62,3 0,0 74,9 66,6 65,1 63,8 70,5 66,7 65,6 69,6 67,9 67,8 67,3 67,2
TR81 62,6 59,8 69,3 70,9 74,9 68,0 63,3 65,9 73,0 68,3 73,7 79,4 80,3 77,3 74,9 0,0 56,4 71,5 68,9 69,5 67,1 72,1 71,7 82,4 82,8 78,9 68,6
TR82 73,5 68,2 76,6 76,4 72,0 73,2 74,1 79,3 61,7 67,1 70,7 76,4 77,7 65,8 66,6 56,4 0,0 68,8 66,8 67,9 65,4 61,9 71,0 68,3 64,3 64,2 66,7
TR83 75,8 71,2 77,8 72,5 74,6 76,1 76,1 80,1 71,4 70,0 73,7 69,7 72,0 64,6 65,1 71,5 68,8 0,0 62,7 60,9 59,8 58,7 67,4 60,1 62,4 62,5 66,4
TR90 72,0 69,4 73,9 70,5 71,7 72,2 72,3 74,2 68,4 65,8 71,0 68,7 63,6 66,3 63,8 68,9 66,8 62,7 0,0 60,2 54,9 58,4 69,7 61,0 57,9 58,6 64,0
TRA1 72,2 69,7 73,8 73,0 74,4 75,3 69,7 74,0 72,8 70,5 68,8 70,5 66,0 72,8 70,5 69,5 67,9 60,9 60,2 0,0 55,9 58,6 76,8 64,1 53,9 55,5 65,3
TRA2 69,6 67,8 71,2 70,8 71,6 72,0 69,8 70,9 69,3 67,7 66,8 67,4 64,0 68,6 66,7 67,1 65,4 59,8 54,9 55,9 0,0 58,4 62,6 62,7 55,5 61,7 63,0
TRB1 74,5 71,4 75,1 67,9 69,0 73,7 73,6 77,0 69,8 66,7 65,6 67,4 58,7 68,0 65,6 72,1 61,9 58,7 58,4 58,6 58,4 0,0 71,4 57,5 69,9 68,2 64,6
TRB2 73,5 78,8 81,0 75,4 76,9 76,5 80,5 83,3 78,6 78,3 75,3 79,7 74,6 70,5 69,6 71,7 71,0 67,4 69,7 76,8 62,6 71,4 0,0 75,0 71,4 72,5 71,6
TRC1 83,6 78,8 83,1 74,2 76,6 75,8 82,8 87,5 84,8 79,4 73,7 87,6 65,9 83,6 67,9 82,4 68,3 60,1 61,0 64,1 62,7 57,5 75,0 0,0 78,8 66,4 71,6
TRC2 83,7 79,8 83,3 74,9 78,2 77,9 83,0 86,7 84,4 81,0 76,2 85,3 76,1 69,4 67,8 82,8 64,3 62,4 57,9 53,9 55,5 69,9 71,4 78,8 0,0 46,3 70,4
TRC3 80,1 76,8 80,0 73,2 74,8 74,1 79,4 80,5 79,4 75,6 72,5 76,1 68,5 77,5 67,3 78,9 64,2 62,5 58,6 55,5 61,7 68,2 72,5 66,4 46,3 0,0 68,1

26
ANNEX - 6: Average Speed per km. between Regions
TR10 TR21 TR22 TR31 TR32 TR33 TR41 TR42 TR51 TR52 TR61 TR62 TR63 TR71 TR72 TR81 TR82 TR83 TR90 TRA1 TRA2 TRB1 TRB2 TRC1 TRC2 TRC3
TR10 0,00 1,32 0,94 0,89 0,85 0,89 1,05 1,14 0,76 0,81 0,87 0,74 0,73 0,78 0,77 0,96 0,82 0,79 0,83 0,83 0,86 0,80 0,82 0,72 0,72 0,75
TR21 1,32 0,00 0,98 0,94 0,89 0,95 1,07 1,12 0,84 0,86 0,91 0,79 0,78 0,81 0,83 1,00 0,88 0,84 0,87 0,86 0,88 0,84 0,76 0,76 0,75 0,78
TR22 0,94 0,98 0,00 0,85 0,94 1,12 0,86 0,87 0,76 0,96 1,06 0,74 0,74 0,76 0,77 0,87 0,78 0,77 0,81 0,81 0,84 0,80 0,74 0,72 0,72 0,75
TR31 0,89 0,94 0,85 0,00 0,83 0,94 0,82 0,84 0,85 0,88 0,83 0,85 0,83 0,89 0,86 0,85 0,79 0,83 0,85 0,82 0,85 0,88 0,80 0,81 0,80 0,82
TR32 0,85 0,89 0,94 0,83 0,00 0,81 0,81 0,80 0,81 0,84 0,88 0,83 0,81 0,87 0,87 0,80 0,83 0,80 0,84 0,81 0,84 0,87 0,78 0,78 0,77 0,80
TR33 0,89 0,95 1,12 0,94 0,81 0,00 0,87 0,83 0,78 0,88 0,88 0,84 0,81 0,76 0,78 0,88 0,82 0,79 0,83 0,80 0,83 0,81 0,78 0,79 0,77 0,81
TR41 1,05 1,07 0,86 0,82 0,81 0,87 0,00 1,00 0,79 0,85 0,83 0,75 0,74 0,77 0,79 0,95 0,81 0,79 0,83 0,86 0,86 0,81 0,75 0,72 0,72 0,76
TR42 1,14 1,12 0,87 0,84 0,80 0,83 1,00 0,00 0,68 0,77 0,83 0,70 0,70 0,71 0,73 0,91 0,76 0,75 0,81 0,81 0,85 0,78 0,72 0,69 0,69 0,75
TR51 0,76 0,84 0,76 0,85 0,81 0,78 0,79 0,68 0,00 0,93 0,83 0,74 0,73 0,79 0,84 0,82 0,97 0,84 0,88 0,82 0,87 0,86 0,76 0,71 0,71 0,76
TR52 0,81 0,86 0,96 0,88 0,84 0,88 0,85 0,77 0,93 0,00 1,02 0,83 0,79 0,95 0,94 0,88 0,89 0,86 0,91 0,85 0,89 0,90 0,77 0,76 0,74 0,79
TR61 0,87 0,91 1,06 0,83 0,88 0,88 0,83 0,83 0,83 1,02 0,00 0,88 0,84 0,95 0,95 0,81 0,85 0,81 0,85 0,87 0,90 0,91 0,80 0,81 0,79 0,83
TR62 0,74 0,79 0,74 0,85 0,83 0,84 0,75 0,70 0,74 0,83 0,88 0,00 0,78 0,81 0,82 0,76 0,78 0,86 0,87 0,85 0,89 0,89 0,75 0,68 0,70 0,79
TR63 0,73 0,78 0,74 0,83 0,81 0,81 0,74 0,70 0,73 0,79 0,84 0,78 0,00 0,77 0,92 0,75 0,77 0,83 0,94 0,91 0,94 1,02 0,80 0,91 0,79 0,88
TR71 0,78 0,81 0,76 0,89 0,87 0,76 0,77 0,71 0,79 0,95 0,95 0,81 0,77 0,00 0,96 0,78 0,91 0,93 0,90 0,82 0,87 0,88 0,85 0,72 0,86 0,77
TR72 0,77 0,83 0,77 0,86 0,87 0,78 0,79 0,73 0,84 0,94 0,95 0,82 0,92 0,96 0,00 0,80 0,90 0,92 0,94 0,85 0,90 0,91 0,86 0,88 0,88 0,89
TR81 0,96 1,00 0,87 0,85 0,80 0,88 0,95 0,91 0,82 0,88 0,81 0,76 0,75 0,78 0,80 0,00 1,06 0,84 0,87 0,86 0,89 0,83 0,84 0,73 0,72 0,76
TR82 0,82 0,88 0,78 0,79 0,83 0,82 0,81 0,76 0,97 0,89 0,85 0,78 0,77 0,91 0,90 1,06 0,00 0,87 0,90 0,88 0,92 0,97 0,84 0,88 0,93 0,93
TR83 0,79 0,84 0,77 0,83 0,80 0,79 0,79 0,75 0,84 0,86 0,81 0,86 0,83 0,93 0,92 0,84 0,87 0,00 0,96 0,99 1,00 1,02 0,89 1,00 0,96 0,96
TR90 0,83 0,87 0,81 0,85 0,84 0,83 0,83 0,81 0,88 0,91 0,85 0,87 0,94 0,90 0,94 0,87 0,90 0,96 0,00 1,00 1,09 1,03 0,86 0,98 1,04 1,02
TRA1 0,83 0,86 0,81 0,82 0,81 0,80 0,86 0,81 0,82 0,85 0,87 0,85 0,91 0,82 0,85 0,86 0,88 0,99 1,00 0,00 1,07 1,02 0,78 0,94 1,11 1,08
TRA2 0,86 0,88 0,84 0,85 0,84 0,83 0,86 0,85 0,87 0,89 0,90 0,89 0,94 0,87 0,90 0,89 0,92 1,00 1,09 1,07 0,00 1,03 0,96 0,96 1,08 0,97
TRB1 0,80 0,84 0,80 0,88 0,87 0,81 0,81 0,78 0,86 0,90 0,91 0,89 1,02 0,88 0,91 0,83 0,97 1,02 1,03 1,02 1,03 0,00 0,84 1,04 0,86 0,88
TRB2 0,82 0,76 0,74 0,80 0,78 0,78 0,75 0,72 0,76 0,77 0,80 0,75 0,80 0,85 0,86 0,84 0,84 0,89 0,86 0,78 0,96 0,84 0,00 0,80 0,84 0,83
TRC1 0,72 0,76 0,72 0,81 0,78 0,79 0,72 0,69 0,71 0,76 0,81 0,68 0,91 0,72 0,88 0,73 0,88 1,00 0,98 0,94 0,96 1,04 0,80 0,00 0,76 0,90
TRC2 0,72 0,75 0,72 0,80 0,77 0,77 0,72 0,69 0,71 0,74 0,79 0,70 0,79 0,86 0,88 0,72 0,93 0,96 1,04 1,11 1,08 0,86 0,84 0,76 0,00 1,29
TRC3 0,75 0,78 0,75 0,82 0,80 0,81 0,76 0,75 0,76 0,79 0,83 0,79 0,88 0,77 0,89 0,76 0,93 0,96 1,02 1,08 0,97 0,88 0,83 0,90 1,29 0,00

27
ANNEX - 7: Domestic Market Potential of Regions (2004, million TL)
TR10 TR21 TR22 TR31 TR32 TR33 TR41 TR42 TR51 TR52 TR61 TR62 TR63 TR71 TR72 TR81 TR82 TR83 TR90 TRA1 TRA2 TRB1 TRB2 TRC1 TRC2 TRC3
TR10 0 948 355 244 209 381 573 1.108 304 186 227 147 123 189 179 410 263 186 128 111 96 124 82 120 94 93
TR21 86 0 23 18 15 25 32 46 21 14 17 12 10 14 14 26 19 14 10 9 8 10 6 10 8 8
TR22 26 19 0 56 35 45 66 34 19 19 25 10 8 12 12 20 15 11 8 7 6 8 5 8 7 7
TR31 59 47 185 0 139 98 101 71 57 60 82 37 31 44 40 49 39 33 25 22 20 28 19 30 24 23
TR32 29 24 65 79 0 63 40 33 40 42 111 24 20 29 26 26 26 21 15 14 12 18 11 19 14 14
TR33 48 34 76 50 57 0 95 64 55 53 70 26 20 29 27 43 31 23 16 14 12 18 11 20 14 14
TR41 130 82 203 95 65 172 0 204 81 62 73 37 30 47 44 91 59 42 29 25 22 30 18 29 23 22
TR42 233 108 97 61 51 107 189 0 80 45 56 34 28 44 43 119 67 45 30 25 21 28 17 27 21 21
TR51 92 70 77 71 87 134 108 116 0 144 98 87 63 141 129 151 168 101 56 46 38 63 31 60 41 41
TR52 16 13 22 21 27 37 24 18 41 0 47 34 23 53 39 22 21 17 13 13 10 18 10 21 14 13
TR61 32 26 48 48 114 79 45 38 46 76 0 32 25 41 35 29 29 23 17 16 14 22 13 24 17 17
TR62 22 19 20 23 26 30 24 24 42 58 33 0 108 74 62 26 27 27 21 24 19 50 22 91 38 37
TR63 11 10 10 11 12 14 12 12 18 23 15 65 0 27 28 13 13 13 13 15 12 33 14 64 24 23
TR71 11 9 9 10 12 13 11 12 26 34 16 28 17 0 96 13 18 17 11 11 8 18 7 16 12 9
TR72 15 13 13 14 16 18 16 17 36 39 21 36 28 147 0 20 25 26 18 19 14 35 13 33 21 18
TR81 22 16 15 11 10 19 22 31 27 14 11 10 8 13 13 0 35 14 9 7 6 8 5 8 6 6
TR82 8 6 6 5 6 8 8 10 17 8 6 6 5 10 9 20 0 14 7 5 4 6 3 5 5 4
TR83 19 16 15 14 15 19 19 21 34 20 17 19 15 30 31 25 44 0 42 26 19 25 14 20 18 16
TR90 12 10 10 9 10 12 11 13 17 13 11 13 13 17 19 14 19 38 0 44 28 21 17 15 21 19
TRA1 4 3 3 3 3 4 4 4 5 5 4 6 6 7 8 5 6 9 17 0 23 11 11 7 15 11
TRA2 2 2 2 2 2 2 2 3 3 3 2 3 3 4 4 3 3 5 8 17 0 5 9 4 6 5
TRB1 6 5 6 6 6 7 6 7 10 10 8 17 18 16 20 7 10 12 11 16 11 0 11 29 29 21
TRB2 3 3 3 3 3 3 3 3 4 4 3 6 6 5 5 3 4 5 7 12 14 8 0 7 13 11
TRC1 7 6 7 7 8 9 8 8 12 14 10 36 43 17 23 8 10 11 10 13 10 35 12 0 25 24
TRC2 6 6 6 7 7 8 7 7 9 11 8 18 19 14 16 7 10 12 16 29 18 40 25 29 0 98
TRC3 3 3 3 3 4 4 4 4 5 6 4 9 10 6 7 4 5 6 7 12 7 15 11 15 52 0

28
ANNEX - 8: Domestic Market Potential of Regions (2005, million TL)
TR10 TR21 TR22 TR31 TR32 TR33 TR41 TR42 TR51 TR52 TR61 TR62 TR63 TR71 TR72 TR81 TR82 TR83 TR90 TRA1 TRA2 TRB1 TRB2 TRC1 TRC2 TRC3
TR10 0 1.081 405 278 238 434 653 1.264 347 212 259 168 141 216 204 468 300 212 146 127 109 142 94 136 107 106
TR21 102 0 28 21 19 29 39 56 25 17 20 14 12 17 16 31 22 17 12 11 9 12 8 11 9 9
TR22 30 22 0 65 41 52 76 40 22 21 29 12 10 14 13 23 17 13 9 8 7 10 6 10 8 8
TR31 68 54 211 0 159 112 116 81 65 69 93 43 35 50 45 56 44 38 28 25 22 32 21 34 27 27
TR32 33 27 74 89 0 71 45 38 45 48 125 27 22 33 29 30 30 24 17 15 13 20 13 21 16 16
TR33 56 40 90 60 67 0 111 75 65 63 82 31 24 34 32 51 37 28 19 17 14 21 13 23 17 17
TR41 154 97 241 112 77 204 0 242 96 73 87 43 36 56 52 108 70 49 34 30 26 35 21 35 27 27
TR42 273 127 114 72 60 125 221 0 94 52 66 40 33 52 50 139 78 52 35 30 25 33 19 32 25 25
TR51 105 80 87 81 99 152 124 132 0 165 112 99 72 161 147 172 191 115 64 53 43 72 36 68 47 46
TR52 18 15 25 25 30 42 27 21 47 0 54 40 26 60 45 25 24 20 14 15 12 21 11 24 16 15
TR61 38 30 57 56 133 93 53 44 54 89 0 38 29 48 41 34 34 27 19 19 16 25 15 28 20 20
TR62 25 22 23 26 30 35 27 28 49 68 39 0 126 86 72 31 31 32 24 28 22 59 26 105 44 43
TR63 13 11 12 13 14 17 14 14 21 27 18 75 0 31 33 15 15 15 15 17 14 38 16 74 28 27
TR71 12 10 11 11 13 15 13 13 30 39 19 32 20 0 110 15 21 19 12 12 10 21 9 18 13 11
TR72 17 15 15 16 18 21 19 20 41 44 24 41 31 167 0 23 29 30 21 21 16 39 14 38 23 20
TR81 27 19 18 13 12 22 26 37 32 16 13 12 10 16 15 0 41 16 10 9 7 10 6 9 7 7
TR82 9 7 7 5 6 8 9 11 18 8 7 6 5 11 10 21 0 14 7 6 4 6 4 6 5 4
TR83 22 18 18 16 18 22 21 25 39 23 19 22 18 35 36 29 51 0 49 29 21 29 16 23 20 18
TR90 14 12 12 11 12 14 14 15 20 16 13 16 16 21 24 17 23 46 0 53 35 26 21 18 26 23
TRA1 4 4 4 3 4 4 4 4 6 5 4 6 6 7 8 5 6 9 18 0 25 12 12 8 16 12
TRA2 3 2 2 2 2 3 3 3 4 3 3 4 4 4 5 3 4 5 9 19 0 6 11 5 7 6
TRB1 7 6 7 7 7 8 8 8 12 12 9 20 22 19 24 9 11 14 13 19 13 0 13 35 34 24
TRB2 4 3 3 3 4 4 3 3 4 5 4 7 7 6 6 4 5 6 8 14 16 10 0 9 16 13
TRC1 8 7 8 9 10 11 9 9 14 17 12 43 51 20 27 10 12 14 12 15 11 42 14 0 30 29
TRC2 7 7 7 7 8 9 8 8 10 12 9 20 21 16 18 8 11 13 18 32 20 45 28 33 0 111
TRC3 4 4 4 4 5 5 5 5 6 7 6 12 12 8 9 5 6 7 9 15 10 19 14 19 66 0
29
ANNEX - 9: Domestic Market Potential of Regions (2006, million TL)
TR10 TR21 TR22 TR31 TR32 TR33 TR41 TR42 TR51 TR52 TR61 TR62 TR63 TR71 TR72 TR81 TR82 TR83 TR90 TRA1 TRA2 TRB1 TRB2 TRC1 TRC2 TRC3
TR10 0 1.268 475 326 279 509 766 1.482 407 248 304 197 165 253 239 549 352 248 172 149 128 166 110 160 126 125
TR21 122 0 33 25 22 35 46 66 30 20 24 16 14 20 19 37 27 20 15 13 11 14 9 14 11 11
TR22 34 25 0 72 45 58 85 44 24 24 33 13 11 16 15 26 19 14 11 9 8 11 7 11 8 8
TR31 79 63 245 0 185 130 134 94 76 80 109 50 41 58 53 65 51 44 33 30 26 37 25 40 31 31
TR32 39 32 87 106 0 84 53 45 53 57 148 32 26 39 34 35 35 28 21 18 16 23 15 25 19 19
TR33 66 47 106 70 79 0 131 89 77 74 97 36 28 40 37 60 43 33 22 20 17 24 15 27 20 20
TR41 185 116 288 134 93 244 0 290 115 88 104 52 43 67 62 129 83 59 41 36 31 42 25 42 32 32
TR42 329 153 137 86 72 151 267 0 113 63 79 48 40 62 60 167 95 63 42 36 30 40 23 39 30 30
TR51 126 95 104 97 119 182 148 157 0 197 134 118 86 192 175 206 228 138 76 63 51 86 42 81 56 56
TR52 21 18 28 28 35 48 31 24 54 0 61 45 29 69 51 28 28 22 16 17 14 24 13 28 18 17
TR61 44 35 66 65 155 108 62 52 63 104 0 44 34 56 48 40 40 31 23 22 19 30 18 32 23 23
TR62 29 25 27 30 35 41 32 32 56 79 45 0 146 100 84 36 36 37 28 32 26 68 30 122 51 50
TR63 14 12 13 14 16 18 15 15 23 30 20 84 0 35 36 17 17 17 16 19 15 43 18 82 31 30
TR71 14 11 12 13 15 17 15 15 33 44 21 36 22 0 124 17 23 21 14 14 11 23 10 20 15 12
TR72 20 17 17 18 21 24 21 23 47 50 28 47 36 192 0 26 33 34 24 24 18 45 16 43 27 23
TR81 31 22 21 15 14 26 30 43 38 19 16 14 11 18 18 0 48 19 12 10 8 11 7 11 8 8
TR82 10 8 7 6 7 9 9 12 20 9 8 7 5 12 11 23 0 16 8 6 5 7 4 6 5 5
TR83 25 21 21 19 21 25 25 29 45 27 22 25 20 40 42 34 59 0 57 34 25 34 19 27 24 21
TR90 16 14 14 13 14 16 16 18 23 18 15 18 18 24 27 20 27 53 0 61 40 29 24 21 30 26
TRA1 5 4 4 4 4 5 5 5 7 6 5 7 7 8 9 6 7 11 21 0 29 14 14 9 18 14
TRA2 3 3 3 3 3 3 3 3 4 4 3 4 4 5 5 4 4 6 10 22 0 7 12 5 8 7
TRB1 8 7 7 7 8 9 8 9 13 14 10 22 24 21 26 9 13 16 15 21 14 0 15 38 38 27
TRB2 4 3 3 4 4 4 4 4 5 5 4 7 7 6 7 4 5 7 9 15 18 11 0 9 17 15
TRC1 10 9 9 10 11 13 10 11 16 20 14 50 59 23 32 11 14 16 14 17 13 48 16 0 35 34
TRC2 8 7 8 8 9 10 9 9 12 14 11 23 24 18 21 9 13 15 21 37 23 51 32 38 0 127
TRC3 5 5 5 5 6 7 6 6 8 9 7 14 15 10 12 6 8 9 12 19 12 24 18 24 83 0

30
ANNEX - 10: Total Market Potentials of NUTS II Regions (2004 -2006, million TL)
NUTS II Code Provinces Included 2004 2005 2006
TR10 İstanbul 6.881 7.847 9.202
TR21 Tekirdağ, Edirne, Kırklareli 473 566 674
TR22 Balıkesir, Çanakkale 489 566 629
TR31 İzmir 1.365 1.554 1.809
TR32 Aydın, Denizli, Muğla 814 919 1.089
TR33 Manisa, Afyon, Kütahya, Uşak 920 1.086 1.280
TR41 Bursa, Eskişehir, Bilecik 1.712 2.031 2.433
TR42 Kocaeli, Sakarya, Düzce, Bolu, Yalova 1.600 1.872 2.256
TR51 Ankara 2.213 2.522 3.014
TR52 Konya, Karaman 586 673 764
TR61 Antalya, Isparta, Burdur 905 1.062 1.237
TR62 Adana, Mersin 945 1.100 1.277
TR63 Hatay, Kahramanmaraş, Osmaniye 504 584 652
TR71 Kırıkkale, Aksaray, Niğde, Nevşehir, Kırşehir 443 508 573
TR72 Kayseri, Sivas, Yozgat 673 762 876
TR81 Zonguldak, Karabük, Bartın 345 411 476
TR82 Kastamonu, Çankırı,Sinop 192 203 226
TR83 Samsun, Tokat, Çorum, Amasya 553 636 741
TR90 Trabzon, Ordu, Giresun, Rize, Artvin, Gümüşhane 427 521 597
TRA1 Erzurum, Erzincan, Bayburt 183 197 229
TRA2 Ağrı, Kars, Iğdır, Ardahan 106 122 137
TRB1 Malatya, Elazığ, Bingöl, Tunceli 306 361 399
TRB2 Van, Muş, Bitlis, Hakkari 142 167 182
TRC1 Gaziantep, Adıyaman, Kilis 370 445 514
TRC2 Şanlıurfa, Diyarbakır 433 487 557
TRC3 Mardin, Batman, Şırnak, Siirt 210 267 332
TOTAL 23.790 27.473 32.157