EEG reveals the effect of fMRI scanner noise on noise-sensitive subjects
Upload
khangminh22Category
view
4download
0
HAL Id: tel-02099631https://tel.archives-ouvertes.fr/tel-02099631
Submitted on 15 Apr 2019
HAL is a multi-disciplinary open accessarchive for the deposit and dissemination of sci-entific research documents, whether they are pub-lished or not. The documents may come fromteaching and research institutions in France orabroad, or from public or private research centers.
L’archive ouverte pluridisciplinaire HAL, estdestinée au dépôt et à la diffusion de documentsscientifiques de niveau recherche, publiés ou non,émanant des établissements d’enseignement et derecherche français ou étrangers, des laboratoirespublics ou privés.
Impacts of anthropogenic noise on behaviour,development and fitness of fishes and invertebrates
Sophie Nedelec
To cite this version:Sophie Nedelec. Impacts of anthropogenic noise on behaviour, development and fitness of fishes andinvertebrates. Ecosystems. École pratique des hautes études - EPHE PARIS; University of Bristol,2015. English. �NNT : 2015EPHE3037�. �tel-02099631�

École Pratique des Hautes Études Mention « Systèmes intégrés, environnement et biodiversité »
École doctorale de l’École Pratique des Hautes Études
CRIOBE
Et Université de Bristol
Ecole doctorale
Bioacoustics and Behavioural Ecology
Etude des bruits anthropiques sur le
comportement, le développement et le fitness des poissons et des invertébrés
Par Sophie Nedelec
Thèse de doctorat de Océanologie biologique et environnement marin
Sous la direction de :
M. Andy Radford, Reader, University of Bristol et M. David Lecchini, Professeur, École Pratique des Hautes Études
Soutenue le 17 Aout 2015 Devant un jury composé de : Hans Slabbekoorn, Professor Innes Cuthill, Professor Andy Radford, Reader David Lecchini, Professeur

i
Resumé Certains bruits d'origine anthropique sont maintenant considérés comme polluant. Ainsi, le bruit
provenant des activités humaines telles que le transport, la construction et l'exploration peut avoir
un impact sur le comportement et la physiologie dans un large éventail de taxons. Cependant, peu
de recherches ont examiné les effets de ces sons répétés ou chroniques sur le développement ou sur
les conséquences de fitness. Les poissons et de nombreux invertébrés utilisent le son sous l'eau pour
les processus tels que l'orientation et de la communication, et sont donc vulnérables à la pollution
sonore anthropique. Les poissons et les invertébrés détectent la composante de mouvement de
particules du son. Dans la première partie de ma thèse, je fournis un programme informatique qui
permet aux utilisateurs de déterminer dans quelles circonstances ils doivent mesurer le mouvement
des particules. J’explique comment ces mesures peuvent être effectuées et fournissent un
programme pour analyser ce type de données. La partie principale de ma thèse comprend des
expériences portant sur l'impact de l'exposition répétée au bruit du trafic, la source anthropique la
plus courante de bruit dans l'environnement marin, sur les poissons et les invertébrés pendant leur
développement. Je démontre qu’une variété de comportements a été touchée par le bruit. J’ai aussi
trouvé que le bruit prévisible peut conduire à des impacts différents sur le développement par
rapport au bruit imprévisible, mais que certaines espèces de poissons peuvent être en mesure de
s'habituer au bruit du trafic, tandis que d'autres non. En outre, je trouve que le développement et la
survie des limaces de mer peuvent être impactés négativement par le bruit des bateaux. Les
poissons et les invertébrés constituent une source de nourriture vitale pour des millions de
personnes et constituent des liens essentiels dans de nombreux réseaux trophiques. L'étude de leur
comportement, de développement et de remise en forme peut nous donner un aperçu des impacts
de la population et le niveau de bruit de la communauté qui sont pertinents pour la survie des
espèces et l'évolution. Le développement de certaines des nouvelles idées et techniques abordées
dans cette thèse nous permettra de faire progresser ce domaine vital de la recherche.

ii
Impacts of anthropogenic noise on behaviour, development and fitness of fishes and invertebrates Some anthropogenic noise is now considered pollution. Evidence is building that noise from human
activities such as transportation, construction and exploration can impact behaviour and physiology
in a broad range of taxa. However, relatively little research has considered effects on development
or directly assessed fitness consequences, particularly with respect to repeated or chronic noise. All
fishes and many invertebrates use underwater sound for processes such as orientation and
communication, and are thus vulnerable to anthropogenic noise pollution. Fishes and invertebrates
detect the particle motion component of sound; this component has been neglected, but must be
understood alongside acoustic pressure if the potential impacts of noise are to be fully understood.
As the first part of my thesis (chapter two), I provide a computer program which allows users to
determine under what circumstances they should measure particle motion; I explain how these
measurements can be made and provide a program for analysing this type of data. The main part of
my thesis comprises experiments investigating the impact of repeated exposure to traffic noise, the
most common anthropogenic source of noise in the marine environment, on fishes and
invertebrates during development. In all three chapters involving experiments on fish in tanks and in
the field, I found that a variety of behaviours were impacted by traffic noise playback. I also found
that predictable noise can lead to different impacts on development from unpredictable noise, but
that some species of fish may be able to habituate to traffic noise, while others suffer lower survival.
Further, I found that the development and survival of seahares (Stylocheilus striatus) can be
negatively impacted by traffic-noise playback. Fishes and invertebrates provide a vital food source to
millions of people and form crucial links in many food webs; studying their behaviour, development
and fitness can give us an insight into population and community level impacts of noise that are
relevant to species survival and evolution. Developing some of the novel ideas and techniques
discussed in this thesis will enable us to advance this vital area of research.
Mots-clés : Poissons, invertébrés, bruit anthropique, comportement, développement, fitness
Keywords : Fish, invertebrates, anthropogenic noise, behaviour, development, fitness

iii
Acknowledgements “There is no such thing as a ‘self-made’ human. We are made up of thousands of others. Everyone
who has ever done a kind deed for us, or spoken one word of encouragement to us, has entered into
the make-up of our character and of our thoughts, as well as our success.” – George Matthew Adams
Many people have helped me to produce this thesis, not least those who are named as authors on
the papers we plan to publish; their academic contributions can be found under each chapter title. I
have been funded by a studentship from EPSRC, contributions from Subacoustech and an Eiffel grant
– Egide program – from Campus France. Research funding was provided via Suzanne Mills and David
Lecchini, funded by the Agence National de Recherche, ANR-11-JSV7-012-01 Live and Let Die and
Partnership University Fund of the French American Cultural Exchange (Ocean Bridges Program);
Stephen Simpson by a NERC Fellowship (NE/J500616/2); and Stephen Simpson and Andrew Radford
by a Defra grant (ME5207).
Geospectrum Technologies provided the calibrated accelerometer which I used throughout my
studies and spurred the acoustics chapter into being. Michael Ainslie provided invaluable help and
advice on acoustics analysis. Pete Theobald, Christ DeJong and Paul Lepper helped me to grasp how
the accelerometer functioned and was calibrated. Marc Holderied, Thorin Jonsson, Sally Wood and
Nathan Merchant assisted with advice on analysis in MATLAB.
I thank the staff at Ardtoe Marine Laboratories, Acharacle, Scotland, the CRIOBE research station,
Moorea, French Polynesia and the Lizard Island research station, Queensland, Australia for providing
the facilities and logistical support to carry out my experiments. Thanks also to Rogelio San Flores,
Ricardo Beldade, Daniel Holley, Stephen Murray, Hin Ano, Julius and Kate Piercy, Mark, Tim Atack,
Véronique Mocellin, Bridie Allen, Erica Morley, Leanne Pearl, Matty Jackson and Laurie Sebert for
field, laboratory and logistical assistance. David Lecchini helped me to find my field site in Moorea
and jump through all the French paperwork hoops. Thanks also to many people including Rick
Bruintjes, Irene Vœllmy, Errol Neo, James Campbell, Julius Piercy, Mardi Hastings, and Jen Miksis-
Olds, for insightful discussions. Sincere thanks to Innes Cuthill for statistical advice and to Innes and
Hans Slabbekoorn for helpful comments on the thesis.
Apart from three research stations I have lived a shifting existence with the shelter and support of
many wonderful, generous, fun and inspiring characters: Kate de Mattos-Shipley who serenaded us
on the piano in her dressing gown; Simon Lewis and his roof garden; Michel Samba and his trimaran;
Celia Duff-Farrier who always fixed me up when returning bedgraggled from the field; Kate, Donkin
and their dungeon; Emma and Duncan MacWalter; a particular yellow VW van; a Ford Falcon; a Fiat

iv
Panda; a hammock; Auntie Emilie who introduced me to stoopin’ in NYC; Suzie, Ricardo, Sofia and
Chloe who made the sun shine in Moorea; Andrea Cullen and Sam Donnovan; Laura Bates and
Russel-Russel-bo-Bussle; Jen and Charlie Nedelec and their alpacas; and Pip and Dom Organised-
Danger Carson.
My family Pauline, Jim and Frankie Holles, Helen Patterson, and Jen, Charlie Nedelec have all been
incredibly patient and supportive throughout and I am very grateful to them.
Brendan Nedelec has helped and supported me in so many ways throughout this work. As well as
being the very best research assistant he is particularly skilled at inventing and building contraptions
that allow me to bring harebrained ideas for experiments to fruition, and fixing equipment as fast as
I can break it! Although he hasn’t read a word he has watched this thesis emerge and has kept me
human through all the various stages (whether weeping or whooping). Number one underwater
electrician technician, worth marrying up a mountain! I look forward to many more adventures still
to come.
Special thanks to Suzie Mills and her pastis, good humour, tea, energy, ideas, comments on drafts
and general full-hearted commitment to making things happen. I am so lucky Suzie and her husband
Ricardo were there with friendship when I was in greatest need in Moorea.
Thank you Steve Simpson for your ideas, practical help, encouragement and opening of
opportunities to make the wildest ideas become reality. As well as other academic aspects Steve has
been especially helpful with preparing presentations of my results for conferences and other talks,
which formed the basis of much of my writing.
My lead supervisor Andy Radford deserves more thanks than I can possibly write for the time and
energy he has put into helping me complete this thesis. Throughout he has answered every question
at lightning speed and provided encouragement and every support possible to enable me to reach
my potential; pushing me when I needed it, pulling me back when I needed it. Andy has provided
tremendous help with every academic aspect from the big ideas to minute details but especially
experimental design, analysis of data, interpretation of results and everything writing-related.

v
Authors Declaration
I declare that the work in this dissertation was carried out in accordance with the requirements of
the University's Regulations and Code of Practice for Research Degree Programmes and that it has
not been submitted for any other academic award. Except where indicated by specific reference in
the text, the work is the candidate's own work. Work done in collaboration with, or with the
assistance of, others, is indicated as such. Any views expressed in the dissertation are those of the
author.
SIGNED: 24th July 2015

vi

vii
Table of Contents ABSTRACT (ENGLISH).......................................................................................................................................... i ABSTRACT (FRENCH)...........................................................................................................................................ii ACKNOWLEDGEMENTS...................................................................................................................................iii AUTHOR’S DECLARATION.............................................................................................................................. v TABLE OF CONTENTS..................................................................................................................................... vii LIST OF FIGURES............................................................................................................................................... ix LIST OF TABLES..................................................................................................................................................x
CHAPTER 1: CHRONIC EFFECTS OF UNDERWATER ANTHROPOGENIC NOISE ON DEVELOPMENTAL STAGES OF FISHES AND MARINE INVERTEBRATES ........................................................................................................ 1
1.1 UNDERWATER ANTHROPOGENIC NOISE: WHAT’S THERE, HOW TO MEASURE IT AND ATTEMPTS TO LEGISLATE ....................... 2 1.2 MARINE FISHES AND INVERTEBRATES ..................................................................................................................... 5 1.3 EFFECTS OF NOISE ON DEVELOPMENTAL STAGES OF FISHES AND MARINE INVERTEBRATES ............................................... 18 1.4 MY THESIS ..................................................................................................................................................... 20
CHAPTER 2: PARTICLE MOTION: THE MISSING LINK IN UNDERWATER ACOUSTIC ECOLOGY ...................... 23
2.1 INTRODUCTION ............................................................................................................................................... 24 2.2 PHYSICS OF PARTICLE MOTION ............................................................................................................................ 25 2.3 PHYSIOLOGY OF PARTICLE MOTION ...................................................................................................................... 28 2.4 INSTRUMENTATION .......................................................................................................................................... 29 2.5 DATA ANALYSIS ............................................................................................................................................... 31 2.6 DISCUSSION.................................................................................................................................................... 34
CHAPTER 3: IMPACTS OF PREDICTABLE AND UNPREDICTABLE NOISE ON THE BEHAVIOUR, GROWTH AND DEVELOPMENT OF LARVAL ATLANTIC COD (GADUS MORHUA) ..................................................................... 39
3.1 INTRODUCTION ............................................................................................................................................... 40 3.2 MATERIALS AND METHODS ............................................................................................................................... 41 3.3 RESULTS ........................................................................................................................................................ 50 3.4 DISCUSSION.................................................................................................................................................... 56
CHAPTER 4: INCREASED TOLERANCE TO ANTHROPOGENIC NOISE PLAYBACK IN A CORAL REEF FISH, THE THREESPOT DASCYLLUS (DASCYLLUS TRIMACULATUS) .................................................................................. 61
4.1 INTRODUCTION ............................................................................................................................................... 62 4.2 METHODS ...................................................................................................................................................... 63 4.3 RESULTS ........................................................................................................................................................ 69 4.4 DISCUSSION.................................................................................................................................................... 73
CHAPTER 5: BOAT-NOISE PLAYBACK IMPACTS PARENTAL BEHAVIOUR AND OFFSPRING SURVIVAL .......... 77
5.1 INTRODUCTION ............................................................................................................................................... 78 5.2 METHODS ...................................................................................................................................................... 79 5.3 RESULTS ........................................................................................................................................................ 83 5.4 DISCUSSION.................................................................................................................................................... 85
CHAPTER 6: ANTHROPOGENIC NOISE PLAYBACK IMPAIRS EMBRYONIC DEVELOPMENT AND INCREASES MORTALITY IN A MARINE INVERTEBRATE ...................................................................................................... 89
6.1 INTRODUCTION ............................................................................................................................................... 90

viii
6.2 METHODS ...................................................................................................................................................... 91 6.3 RESULTS ........................................................................................................................................................ 95 6.4 DISCUSSION.................................................................................................................................................... 96
CHAPTER 7: FINAL CONCLUSIONS AND FUTURE DIRECTIONS ..................................................................... 99
7.1 INTRODUCTION ............................................................................................................................................... 99 7.2 CHAPTER 2 ..................................................................................................................................................... 99 7.3 CHAPTER 3 ................................................................................................................................................... 100 7.4 CHAPTER 4 ................................................................................................................................................... 101 7.5 CHAPTER 5 ................................................................................................................................................... 102 7.6 CHAPTER 6 ................................................................................................................................................... 103 7.7 FINAL THOUGHTS ........................................................................................................................................... 104
REFERENCES ................................................................................................................................................. 107
APPENDIX 1: PARTICLE MOTION: THE MISSING LINK IN UNDERWATER ACOUSTIC ECOLOGY, PROGRAM INSTRUCTIONS....................................................................................................................................................121
APPENDIX 2: DASCYLLUS TRIMACULATUS BLOOD CORTISOL EIA KIT VALIDATION.................................... 129

ix
List of Figures FIGURE 2.1 WAVELENGTH AS A FUNCTION OF FREQUENCY. ............................................................................................. 27 FIGURE 2.2 CUT-OFF FREQUENCY AS A FUNCTION OF DEPTH ............................................................................................ 27 FIGURE 2.3 SENSITIVITY CURVE FOR ACCELEROMETER PROVIDED BY GEOSPECTRUM TECHNOLOGIES. ...................................... 30 FIGURE 2.4 SCHEMATIC OF A SINE WAVE SHOWING THE CONCEPTS OF PHASE, WAVELENGTH AND PEAK–PEAK AMPLITUDE. ......... 31 FIGURE 2.5 EXAMPLE SPECTROGRAM OUTPUT FROM A RECORDING OF DISTANT BOAT NOISE ................................................. 33 FIGURE 2.6 EXAMPLE POWER SPECTRAL DENSITY FIGURE ................................................................................................ 33 FIGURE 3.1 POWER SPECTRAL DENSITY OF (A) SOUND-PRESSURE LEVEL AND (B) MONOAXIAL PARTICLE ACCELERATION OF
RECORDINGS OF A SHIP (10S) AND AMBIENT NOISE (60S), PLUS THEIR PLAYBACK IN A REARING BIN ................................... 46 FIGURE 3.2 SOUND-PRESSURE LEVELS OF SHIP, OCEAN AMBIENT NOISE AND THEIR PLAYBACK IN THE STARTLE-RESPONSE
EXPERIMENTAL ARENA ........................................................................................................................................ 47 FIGURE 3.3 LANDMARKS DIGITISING YOLK SAC (1–4), BODY LENGTH (5–10) AND MYOTOME LENGTH (11–12). ...................... 48 FIGURE 3.4 SOUND-PRESSURE LEVELS OF A SHIP, OCEAN AMBIENT NOISE AND THEIR PLAYBACKS IN THE ANTI-PREDATOR
EXPERIMENTAL ARENA ........................................................................................................................................ 49 FIGURE 3.5 STARTLE RESPONSES OF LARVAL COD. MEDIAN NUMBER OF STARTLES DURING 2 MIN EXPOSURE TO AMBIENT AND
ADDITIONAL-NOISE PLAYBACKS REPRESENTED BY BLACK LINE. OTHER GREY LINES JOIN RESULTS FOR INDIVIDUAL FISH IN EACH
TREATMENT. N = 52. ........................................................................................................................................ 51 FIGURE 3.6 STARTLE RESPONSES OF LARVAL COD. ......................................................................................................... 51 FIGURE 3.7 YOLK SAC CENTROID SIZE AT 1 AND 2 DAYS POST-HATCHING. ........................................................................... 52 FIGURE 3.8 BODY LENGTH AT 1, 2 AND 16 DAYS POST-HATCHING. ................................................................................... 53 FIGURE 3.9 BODY WIDTH–LENGTH RATIO AT DAYS 1, 2 AND 16 POST-HATCHING ................................................................ 54 FIGURE 3.10 TIME TO CATCH FISH WITH A PIPETTE DEPENDING ON BODY WIDTH–LENGTH RATIO ............................................ 55 FIGURE 4.1 POWER SPECTRAL DENSITIES (PSD) OF (A) SOUND PRESSURE AND (B) MONOAXIAL PARTICLE ACCELERATION OF
ORIGINAL RECORDINGS OF BOATS AND BOAT PLAYBACKS AT EXPERIMENTAL SITE ALONG WITH AMBIENT NOISE AND AMBIENT
NOISE PLAYBACKS .............................................................................................................................................. 65 FIGURE 4.2 MAP OF SITES ........................................................................................................................................ 65 FIGURE 4.3 PROPORTION OF FISH HIDING PRE-, DURING AND POST-BOAT-NOISE PLAYBACK ................................................... 70 FIGURE 4.4 CHANGE IN VENTILATION RATE FROM BASELINE WHEN FISH THAT HAD BEEN EXPOSED TO LONG-TERM AMBIENT OR
BOAT-NOISE PLAYBACK WERE PLAYED A SHORT-TERM AMBIENT OR BOAT-NOISE TRACK ................................................... 71 FIGURE 4.5 BASELINE PLASMA CORTISOL CONCENTRATION IN FISH EXPOSED TO 18–21 DAYS OF EITHER AMBIENT- OR BOAT-NOISE
PLAYBACK. ....................................................................................................................................................... 72 FIGURE 5.1 POWER SPECTRAL DENSITY FOR A) PARTICLE ACCELERATION AND B) SOUND PRESSURE LEVELS OF ORIGINAL RECORDINGS
OF BOATS AND AMBIENT NOISE COMPARED WITH THEIR PLAYBACKS.. ........................................................................... 81 FIGURE 5.2 BEHAVIOURAL RESPONSES TO PLAYBACK OF BOAT NOISE COMPARED WITH AMBIENT NOISE: A) PARENTS MADE MORE
DEFENSIVE ACTS PER MIN; B) PARENTS SPENT LESS TIME SELF-FEEDING; C) GLANCING BEHAVIOUR WAS RARER. .................... 84 FIGURE 6.1 STYLOCHEILUS STRIATUS, PHOTOGRAPH COURTESY OF FABIEN MICHENET. ......................................................... 91 FIGURE 6.2 POWER SPECTRAL DENSITIES (PSD) OF (A) SOUND PRESSURE AND (B) MONOAXIAL PARTICLE ACCELERATION OF
ORIGINAL RECORDINGS OF BOATS AND BOAT PLAYBACKS AT EXPERIMENTAL SITE ALONG WITH AMBIENT NOISE AND AMBIENT
NOISE PLAYBACKS .............................................................................................................................................. 93 FIGURE 6.3 PERCENTAGE OF EGG CAPSULES THAT (A) FAILED TO DEVELOP (B) WERE UNHATCHED IN EACH TREATMENT AND (C)
NUMBER OF VELIGERS THAT DIED AS A PERCENTAGE OF EGG CAPSULES THAT HATCHED PER TREATMENT ............................. 95

x
List of Tables TABLE 1.1 SUMMARY OF UNDERWATER ANTHROPOGENIC NOISE........................................................................................ 3 TABLE 1.2 ASSESSMENT OF PAPERS THAT HAVE INVESTIGATED HEARING THRESHOLDS AND THEIR VALIDITY ............................... 11 TABLE 2.1 GLOSSARY .............................................................................................................................................. 35 TABLE 3.1 DETAILS OF SHIPS RECORDED FOR USE IN PLAYBACK EXPERIMENTS. ..................................................................... 44 TABLE 3.2 PLANNED CONTRASTS FOR POST-HOC TESTING OF THE EFFECT OF THE INTERACTION BETWEEN REARING NOISE TREATMENT
AND DAYS POST-HATCHING ON BODY LENGTH ......................................................................................................... 53 TABLE 3.3 PLANNED CONTRASTS FOR POST-HOC TESTING OF THE EFFECT OF THE INTERACTION BETWEEN REARING NOISE TREATMENT
AND DAYS POST-HATCHING ON BODY WIDTH–LENGTH RATIO ..................................................................................... 54 TABLE 4.1 PLANNED CONTRASTS FOR POST-HOC TESTING OF THE EFFECT OF THE INTERACTION BETWEEN LONG- AND SHORT-TERM
PLAYBACKS ON OPERCULAR BEAT RATE................................................................................................................... 72

xi

xii

1
Chapter 1: Chronic Effects of Underwater Anthropogenic Noise on Developmental Stages of Fishes and Marine Invertebrates

2
1.1 Underwater anthropogenic noise: What’s there, how to measure it and attempts to legislate Human invasion and alteration of natural habitat are the main contributors to the unprecedented
species extinctions occurring around the planet (Kearns, 2010). Pollutants such as heavy metals,
pharmaceuticals and agricultural nitrate introduced to the environment by humans can cause injury
and impact growth, development and behaviour (Nagajyoti et al., 2010; Bourke et al., 2015; Qin et
al., 2015). Natural patterns of resource use and information flow may also be disrupted by light
pollution, with downstream effects on the structure and function of ecosystems (Gaston et al.,
2013). Anthropogenic (man-made) acoustic noise is a more recently recognised, but far-reaching,
form of pollution (e.g. Barber et al., 2010; Slabbekoorn et al., 2010). Not all anthropogenic sound is
pollution, but here we use the term ‘noise’ to mean unwanted sound. In terrestrial environments,
man-made noise from road and air traffic, construction work, explosions and wind turbines impinges
on the acoustic perceptual space of animals (Rabin et al., 2006; Barber et al., 2010). However, in the
denser medium of aquatic environments, anthropogenic noise is likely to be even more invasive
because sound propagates further and faster than in air (Bradbury, 1998). Concerns about the
impacts of anthropogenic noise on marine life have risen to the level of international legislation (e.g.
European Commission Marine Strategy Framework Directive), yet we lack sufficient experimental
evidence for effective regulation.
1.1.1 What’s there Levels of underwater anthropogenic noise are increasing due to a range of sources (summarised in
Table 1.1). These include shipping, drilling, seismic exploration, energy production (hydroelectric or
offshore wind farms), tourism related activities (e.g. pleasure and speed boats, jet skis) and
aquaculture noise for captive animals. A great deal of concern has been raised over the loudest
sources of noise; sudden, high-intensity events such as pile driving, explosions and seismic surveys
(Slabbekoorn et al. 2010). But more concerning is the widespread issue of noise emanating from ship
and boat traffic (hereafter traffic), which is the primary source of man-made noise in the marine
environment according to the United States National Research Council (NRC, 1995), and is rapidly
increasing (Tournadre, 2014). For instance, ambient noise off the Californian coast increased by up
to 10 dB from the 1960s to the 1990s (Andrew et al., 2002), mostly due to an increase in ship traffic
(although the authors could not account for increases above 100 Hz). Global ship traffic also
increased fourfold between 1992 and 2012 (Tournadre, 2014). We must recognise there is always
ambient noise in the environment, but anthropogenic activity is causing increases in low frequency
(below 1 kHz) ambient noise, which is perturbing the natural frequency spectrum of the ocean. As
this low frequency component coincides with the best hearing range of fishes and invertebrates

3
Table 1.1 Summary of underwater anthropogenic noise (adapted from Table 1.2, Holles, 2010); rms = root mean squared.
Sound source Qualitative description of sound
Sound pressure level (SPL) (dB re 1 uPa)
Distance from source (m)
Peak frequency (Hz)
Frequency range (Hz)
Areas affected Duration Investigators
Pile driving Sharp broadband impulses
250 (peak to peak) 1 300 0–5,000; some energy up to 100,000
Discrete areas of offshore construction
Hours to months (Bailey et al., 2010)
Vibratory piling Quieter alternative to pile driving
166.6 (rms) 16 <100 0–5,000; some energy up to 100,000
Discrete areas of offshore construction
Hours to months (Dahl et al., 2015)
Seismic exploration
Airgun explosions 242–253 (peak to peak)
1 500 20–10,000 Discrete areas being explored
Hours to weeks (Popper et al., 2005; Thompson et al., 2013)
Sonar High, mid, low or sweeping pulses at high amplitude used for echo location
235 (rms) 1 Depends on user, e.g. 1,000–2,000, 6,000–7,000, 200,000
Depends on user, see previous column
Discrete areas of ocean navigated by navy ships/submarines
Minutes (Popper et al., 2007; Deng et al., 2014; Wensveen et al., 2015)
Acoustic thermometry of ocean climate (ATOC )
High amplitude, low frequency sounds with narrow bandwidth (e.g. 35 Hz)
145 (rms) 1 75 58–93 Various areas of ocean chosen to be tested
~30 minutes but may be repeated at different times
(Klimley and Beavers, 1998)
Drilling Broadband noise 190 (rms) 1 <1,000–2,000 0–10,000 Area within 38 km from drilling ship
Indefinite (Kyhn et al., 2014)
Offshore windfarm
Hum of turbines 90–142 (rms) 1 200 50–200 Area within 4 km of windfarm for hearing specialists
Continuous, varying with wind speed
(CEFAS, 2007)
Aquaculture noise
Motors, pumps, air bubbles
153 (3rd octave bands)
<4 25–250 0–10,000 Wherever fish are kept
Constant (Bart et al., 2001)
Research vessels Hull, propeller churning and cavitation, engineered to produce less acoustic noise than standard ships
130 (1 Hz band) 1 <200 0–5,000 Focused areas where research is being conducted
Highly variable (Ona et al., 2007)
Speedboat Propellar churning and cavitation
128 (instantaneous) 300 110 0 – 5 000 Widespread, concentrated in shallow water areas dense with tourists
Highly variable, 30 seconds to many hours
(Amoser et al., 2004)
Shipping Hull, propellar churning and cavitation
145 (1 Hz band) 1 < 200 0 – 5 000 Global Constant at a global scale, highly variable at a local scale
(Ona et al., 2007); (Southall and Scholik-Schlomer, 2008)

4
(Packard et al., 1990; Lovell et al., 2005a; Slabbekoorn et al., 2010, Section 1.2.1), underwater
anthropogenic noise is likely to be highly disturbing.
Anthropogenic noise has often been classified as either ‘acute’ (short-term, high-intensity;
e.g. pile driving, explosions, seismic blasts) or ‘chronic’ (long-term elevations of background noise;
e.g. due to windfarms or traffic) (Hawkins et al., 2015). Typically, impacts of acute noise are
supposed to be death or physical injury, while potential impacts of chronic noise are supposed to be
masking (failure to recognise the occurrence of one type of stimulus as a result of the interfering
presence of another stimulus – Fay, 1974), and long-term changes in physiology or behaviour
(Hawkins et al., 2015). Although apparently less immediately severe, the potential for impacts from
chronic noise, particularly traffic noise, is far more widespread in both space and time than that
from acute noises.
1.1.2 How to measure anthropogenic noise One reason for the division that has been made between acute or impulsive noise and chronic or
continuous noise is the way they are best characterised. Acute, loud or nearby impulsive noise (such
as that from pile driving and seismic airgun activity) is best characterised using all the energy in the
signal, because frequencies outside of the auditory range can still cause injuries such as barotrauma
and hair cell damage. How loud or how nearby this noise needs to be to cause injury is the subject of
much research (Popper et al., 2006; Halvorsen et al., 2012; Rodkin et al., 2012). Metrics used to
describe loud impulsive noise include peak level, 90% energy envelope, sound exposure level (SEL),
rise time, crest factor and repetition of the signal (Hawkins et al., 2015). Being quieter and unlikely
to cause injury, chronic or continuous noise is better characterised by assessing how much energy is
present at different frequencies on average over a specified time period, because animals with
different hearing bandwidths may have different susceptibilities. For example, the power spectral
density is suitable for broadband continuous sounds.
The focus on acute noise and classification of chronic noise as a less worrying elevation of
background noise was thus likely driven by the early thinking that injuries due to very loud sounds
were the most concerning impacts of underwater noise. Perhaps this arose because of widespread
public concern that large numbers of marine mammals were stranding due to military activity
(Simmonds and Lopezjurado, 1991). Alternatively, the focus on injury could stem from the desire of
industry and regulators for simple metrics to work with. In any case, chronic underwater noise has
received less attention. In fact, chronic noise is usually intermittent at some level; whether due to
ships passing or the stochastic nature of bubbles in aquaria systems (Clark et al., 2009; Voellmy et
al., in press). Thus, when using sound metrics that involve averaging across time, such as power

5
spectral density or root mean squared levels, it is important to pay attention to the frequency and
time range over which sound levels are reported (which could be influenced by equipment
capabilities), along with the hearing sensitivity of the species of interest.
1.1.3 Legislation Concern about the impacts of underwater anthropogenic noise has risen to the level of national and
international regulation in at least three cases. 1) The Marine Strategy Framework Directive (MSFD)
is a piece of European legislation which aims to establish and maintain ‘Good Environmental Status’
(GES) of European Waters by 2020. Anthropogenic noise is defined as one of the indicators of GES.
Although this was defined in 2010, and monitoring goals have been established, we still do not have
sufficient data to establish noise limits that are equivalent to GES (ec.europa.eu). 2) The United
States of America National Environmental Policy Act (NEPA) has long prohibited any human activity,
including anthropogenic noise, which may harass marine mammals (Richardson et al., 1995). 3) The
International Maritime Organisation (IMO) has also brought underwater noise to its agenda and
recently published recommended ship designs that can minimise noise introduced into the
environment (MEPC, 2013).
Although the MSFD mentions impacts on fishes and other animals, the main focus, as with
NEPA and IMO regulations, is to avoid impacts on marine mammals. More complex effects in
particular, such as downstream impacts of endocrine or cognitive responses, are only considered in
relation to marine mammals. This again is most likely due to the early public concern about mass
strandings. However, there is evidence that noise can induce stress responses such as increased
blood cortisol in fishes (Wysocki et al., 2006, but see Wysocki et al., 2007) and cognitive impacts
such as distraction in fish and invertebrates (Chan et al., 2010; Purser and Radford, 2011). The area
over which animals are likely to come into contact with noise that is loud enough to injure them is
relatively small compared to that over which they may be affected in more ‘subtle’ ways. The
number of species of fishes (>32,000) and marine invertebrates (>1,000, 000) compared to marine
mammals (ca. 120) and the roles they play in ecosystems (Dorit et al., 1991; Hoelzel, 2002) are also
out of proportion to the current attention they are warranted in legislation and in research.
1.2 Marine fishes and invertebrates Marine fishes and invertebrates provide an increasingly vital food source and income for millions of
people (Béné et al., 2007). In the past 40 years, the human population has doubled while average
per capita consumption of marine fauna has also nearly doubled; currently over 16% of animal
protein consumed by humans comes from species harvested from the sea, and human populations
and protein consumption continue to increase (Nomura, 2009). Fishes and invertebrates are also

6
vital to oceanic ecosystem functioning, having key roles in nutrient cycling and bioengineering of
habitats (Béné et al., 2007). However, many marine species are now threatened by a range of
human activities including those that create noise pollution.
One of the reasons that marine fishes and invertebrates are so important to food webs is
that their reproductive cycles are characterised by production of large numbers of offspring, few of
which survive to adulthood; mortality is high in eggs, larvae and juveniles due to starvation and
predation (Blaxter and Fuiman, 1990; Rumrill, 1990). Effects on survival during early life stages when
natural mortality is high can result in greater population fluctuations than impacts at the adult stage,
a theory supported by empirical data and modelling (Armsworth, 2002; Gagliano et al., 2007; Victor,
1983). Thus, anything which could impact predator avoidance, or resource acquisition and use, could
have broader scale population effects that are relevant to management and conservation of species.
1.2.1 How fishes and invertebrates hear Sound is propagating vibratory energy and hearing is the detection of sound (Gans, 1992). The main
difference between hearing and other types of mechanosensory perception, such as touch,
geocentric perception, proprioception and flow detection (wind or water movements in relation to
the body), is that the hair cells concerned with hearing detect vibrations at particular frequencies of
relevance to the animal. Hearing in fishes and invertebrates seems to be focused in the lower
frequencies; although some fishes can hear over 100 kHz, most have a peak sensitivity under 1.5 kHz
(Popper and Hastings, 2009). There are two components of a propagating sound wave that can be
detected by animals: the oscillatory motion of particles of the medium in which the sound travels
and the pressure fluctuations between particles. As humans, other mammals, birds and reptiles all
detect pressure fluctuations, particle motion is often overlooked. However, particle motion
detection is the more common method for hearing underwater. The bodies of fishes and aquatic
invertebrates, being composed mainly of water, are coupled directly to the medium (water). Thus,
the whole body vibrates as a sound wave passes through.
The inner ears of fishes comprise three semicircular canals with associated cristae (known as
the pars superior) and three otolithic end organs (the pars inferior) (Bleckmann, 2004; Lovell et al.,
2005b). The pars superior senses posture and movements of the body, while the pars inferior, made
up of the end organs ‘saccule’, ‘utricle’ and ‘lagena’, senses vestibular and acoustic stimuli (Lovell et
al., 2005b). The end organs have associated calcareous otoliths named the ‘saggita’, ‘lapilli’ and
‘asterisci’ respectively. These structures are remarkably similar to the tetrapod vertebrate inner ears
with which we are more familiar (Webster et al., 1992).
The otoliths are dense structures coupled to the sensory epithelia of the ear canals by a thin,
gelatinous membrane called the cupula (Bleckmann, 2004). The sensory epithelium lining each canal

7
and otolith has up to several thousand hair cells which are directional and arranged in groups of
similar orientations. As the otolith organs are denser and have higher impedance than the rest of the
body of the fish, they are not as easily moved by a propagating sound wave, causing the otolith
organs to move in relation to the sensory epithelia of the ear canals; this movement can be thought
of as harmonic oscillation and is what is detected by the epithelial hair cells (Sand and Karlsen, 2000;
Ladich, 2001; Bleckmann, 2004).
Gas bladders have a role in hearing in many species of fishes (Webster et al., 1992).
Fluctuations in pressure cause air-filled sacs to change volume and re-radiate sound to the inner ear
and lateral line, conveying an indirect method for detecting the pressure component of sound in
fishes possessing such organs. Hearing specialisations using gas bladders exist in many species to
increase hearing sensitivity, increase the upper frequency limit and reduce susceptibility to masking
(Ramcharitar et al., 2004; Popper and Fay, 2011). There are four hearing specialisations which have
evolved in fishes: Weberian ossicles in otophysans; air bubbles in the suprabranchial or pharyngeal
chamber in anabantoids; small tubes connecting the pterotic and prootic bullae close to the utricle
with the swimbladder in clupeids; and tympanic gas bladders in the head region of the weakly
electric mormyrids (Ladich, 1999; Yan et al., 2000). It is worth noting that several soniferous species
do not possess such hearing specialisations, while many fishes which do possess them are not vocal,
suggesting that accessory hearing structures have not evolved for the purpose of enhancing vocal
communication (Ladich and Yan, 1998; Ladich, 1999). This suggests that hearing specialisations
evolved for better detection of the auditory scene.
Swim bladders also aid sound source localisation. Particle motion is a vector quantity and
therefore has a directional component (Lu et al., 1996). As hair cells are also directional and the
otolithic endorgans are orientated in three different planes, theoretically a fish could determine the
direction of a sound source with only 180° ambiguity in three-dimensional space from its particle
motion component. Coffin et al. (2014) showed that plain fin midshipman fish (Poricthys notatus)
with deflated swim bladders could not localise 90 Hz tone, while those with partially inflated or full
gas bladders could. It is worth noting that swim-bladder pulsations exceed the free-field particle
motions only above a certain frequency (dependent on both swim bladder volume and depth),
implying that fishes will be insensitive to sound pressure in the infrasound range (Sand and Karlsen,
2000). Thus, fishes may be unable to resolve the 180° ambiguity of very low frequency sounds using
this method. The lateral line is, however, another organ whose innervation converges with that of
the inner ear, which senses low frequencies and may aid in sound-source localisation (Bleckmann,
2004).

8
Lateral line neuromasts detect local pressure changes at the surface of the fish which result
from water movements in relation to its body (Bleckmann and Zelick, 2009). This is normally within
the extreme near field (one to two body lengths) (Lu et al., 1996), but they can also detect sound
that is re-radiated from the swim bladder, enabling indirect detection of sounds from further away
(Bleckmann, 2004). The signals detected by the lateral line and inner ears of fishes overlap and their
innervation converges in the ocavolateralis system and the Mauthner cells (Bleckmann, 2004;
Mirjany et al., 2011). Experiments by Mirjany et al. (2011) showed the normal Mauthner cell-
controlled ‘C start’ escape response (in which fishes turn away from a sound source that startles
them, a 200 Hz tone in this case) could be inhibited by blocking information from the lateral line. By
contrast, Coffin et al. (2014) concluded that the lateral line was not required for sound-source
localisation in their blocking experiments because fish could localise the 90 Hz tone after ablation of
the lateral line cells. It seems the lateral line aids sound-source localisation up to at least 200 Hz and
the swim bladder does not play a role in the startle response via the Mauthner cells, but in shallow
water down to at least 90 Hz the swim bladder is able to aid sound-source localisation via the
octavolateralis system.
Relatively little is known about hearing in aquatic invertebrates, although it is clear that
many do also hear sound. The three known methods for hearing in marine invertebrates are external
sensory hair cells, chordontal organs and statocysts (Webster et al., 1992; Popper et al., 2001). The
first two methods of hearing are found in crustaceans; external sensory hair cells detect water
movements, which could include low frequency sound, and chordontal organs are found in the legs
of some crabs and allow detection of sounds propagating in the substrate (Popper et al., 2001).
Statocysts are found in crustaceans and molluscs and work much like otoliths; a fluid-filled chamber
is lined by sensory hair cells and contains one or more round calcareous structures (statoliths) which
move around inside the chamber (Webster et al., 1992). The statocyst has been thought to function
primarily for orientation, but as interest in the impacts of sounds increases, more and more species
have been found to detect sound using their statoctsts (Packard et al., 1990; Lovell et al., 2005a;
Kaifu et al., 2008). There may be other ways that marine invertebrates detect sound, as coral larvae
are known to swim towards reef sound yet we do not understand by what mechanism they are
detecting and processing this sound (Vermeij et al., 2010).
1.2.2 What fishes and invertebrates hear Many studies have investigated auditory thresholds of fishes and, more recently, marine
invertebrates. The standard methods are: training an animal to respond when it hears a sound or
observing startle responses to sounds (behavioural methods); or using electrodes to detect when a
signal is sent from an auditory structure to the brain (auditory evoked potential method).

9
Unfortunately, in many of the small tanks where such experiments have been carried out, the
particle motion component of the sounds presented has been unreported, or worse, unknown
(Hawkins et al., 2015). Table 1.3 shows auditory-threshold studies for fish alongside their methods,
the species tested, and whether the experiment could accurately report auditory thresholds. This
table reveals that while many studies have some comparative value (those coded in yellow),
accurate absolute thresholds have rarely been reported and useless data are rife. Even when they
have been accurately reported, thresholds are dependent on ambient, rearing and holding
conditions and there can be variation between individuals and life-history stages. These
methodological aspects must be borne in mind when considering what fishes and invertebrates can
hear.
In an ideal world, for conservation and regulation purposes, we would establish the
threshold sound levels for each of the different harmful effects in each species that could be
affected by each type of anthropogenic noise. Then we would include these thresholds in predictive
models which showed sound sources, sound propagation and species presence, to quantify the
potential impacts of anthropogenic noise and thus regulate noise to levels that minimised impact.
There are predictive models for the impacts of anthropogenic noise (e.g. Clark et al., 2009; Bruintjes
et al., 2014). However, from the perspective of fishes and invertebrates, there are still many
unknowns at the level of basic research. Thus, a preoccupation with accurate auditory-threshold
measurement could potentially distract us from discovering how fishes and invertebrates actually
use sound in the natural environment. As well as testing auditory thresholds, we must therefore also
test how known effects could impact development, survival and reproduction over realistic
timescales.
Some studies have revealed changes in the auditory ability of fishes during ontogeny,
although their methods for establishing absolute thresholds were inadequate. Sensitivity to pressure
has been found to increase with age in the labyrinth fish Trichopsis vittata (Wysocki and Ladich,
2001), the toadfish Halobatrachus didactylus (Vasconcelos and Ladich, 2008) and the squeaker
catfish (Synodontis schoutedeni) (Lechner et al., 2010) via auditory evoked potentials (AEP) using in-
air speakers. Other work suggested an expansion of the detectable frequency range in zebrafish with
age (Higgs et al., 2001; Higgs et al., 2003), while Sisneros and Bass (2005) also found increases in
sensitivity with age in the toadfish Porichthys notatus. Egner and Mann (2005) showed a slight
decrease in hearing sensitivity with age at lower frequencies in the sergeant major damselfish
(Abudefduf saxatilis). However, these studies used the AEP method (which gives highly variable
results depending on many aspects of the set-up) with an underwater speaker (producing particle

10
motion) and only measured pressure, meaning we have no idea of the sound levels to which the
fishes were responding.
Otoliths develop in embryos of fishes and evidence from zebrafish (Danio rerio) and
clownfish (Amphiprion ephippium and A. rubrocinctus) suggests that they can use them even at this
early stage (Simpson et al., 2005a; Lu and DeSmidt, 2013). Simpson et al. (2005a) were the first to
show that fish embryos could detect sound via observing changes in heart rate in response to tones
played through an in-air speaker. Lu and DeSmidt (2013) used microphonic potentials to show that
auditory sensitivity to particle displacements increased with development, in line with the addition
of hair cells to auditory epithelia. Kenyon et al. (1996) used electric shock classical conditioning in a
standing wave tube with an underwater speaker to reveal that the sensitivity of the damselfish
Stegastes paritus to sound pressure increased with fish length. The particle motion in their tube was
measured and levels corresponded well to those predicted by free-field values, but thresholds were
only presented in terms of pressure. Wright et al. (2011) document the ontogeny of auditory
thresholds in five species of fish larvae in particle acceleration as well as pressure; the sensitivity of
four of these species increased with age.
The development of hearing in marine invertebrates remains understudied, however it is
clear that many marine larvae do possess statocysts, which might be used to detect sound, for
example in the nudibranch Rostanga pulchra (Chia et al., 1981). Evidence from several species of
marine invertebrate shows that they do detect and use sound early in life. For example, coral larvae
(Montastraea faveolata) move towards reef sounds (Vermeij et al., 2010); Lillis et al. (2013) showed
that Eastern oyster (Crassostrea virginica) larvae are induced to settle by estuarine sounds; and
Stanley et al. (2010) found that natural ambient sound induced metamorphosis in megalopae of five
species of crab.

11
Table 1.2 Assessment of papers that have investigated hearing thresholds and their validity. Green = valid method and valid conclusions; yellow = at least partially invalid method, but some valid conclusions could be drawn; red = invalid method and meaningless conclusions.
Paper Species Situation Method (AEP/Behavioural)
Views
(Amoser and Ladich, 2003)
Goldfish Carassius auratus
Temporary threshold shift (TTS). In-air speaker, measured pressure
Auditory evoked potential (AEP)
Investigating sensitivity to pressure only. Dubious because fish anaesthatised
(Bhandiwad et al., 2013)
Zebrafish Danio rerio Shaker table and accelerometer, 96-well plate, pre-pulse inhibition method (first to use)
Behavioural (pre-pulse inhibition (PPI))
Presented particle acceleration thresholds, also tested for contribution of lateral line to thresholds
(Caiger et al., 2012)
Juvenile snapper Pagrus auratus
In tanks, aquaculture vs wild AEP Good because just making a comparison about holding conditions, but not suitable in an absolute sense. Suggest can hear from 36 km, but this is an invalid extrapolation because thresholds in pressure in a tank probably appear higher because of particle motion
(Casper and Mann, 2006)
Nurse shark Ginglymostoma cirratum, yellow stingray Urobatis jamaicensis
Cement lagoon 37 x 15 m with 15 x 2 m island in middle, depth 1.05 m, shark 0.5 m below surface and 1 m from speaker
AEP Presented in particle motion
(Casper and Mann, 2007a)
Horn shark Heterodontus, white-spotted bamboo shark Chiloscyllium plagiosum
First use of dipole stimulus (more similar to prey), 'large' tank 1.96 m x 0.95 m x 0.6 m (water depth 0.5 m), sharks 20 cm below surface.
AEP Presented in particle motion
(Casper and Mann, 2007b)
White-spotted bamboo shark Chilosyllium plagiosum, brown-banded bamboo shark C. Punctatum, goldfish Carassius aurtatus
Aluminium dish, 20.5 cm diameter, 5 cm deep, fish head 2 cm below surface, shakers, accelerometers
AEP Shaker table, presented particle motion, including directional sensitivity
(Chapman and Hawkins, 1973)
Atlantic cod Gadus morhua
Mid water in the sea (6 m from bottom, 15 m from surface, speaker 0.5–50 m away) fish in plastic net cage with PVC frame, critical ratios
Behavioural (electric shock conditioning causing suppression of respiration (ES))
Measured in the field, present particle displacement threshold based on calculations.

12
(Enger, 1973)
Goldfish Carassius auratus
In-air speaker, measured pressure with a hydrophone, fish held at surface of pipe 80 cm long, 30 cm diameter, fish brain cut open
Probes in the brain Investigating sensitivity to pressure only. Dubious because brain cut open
(Egner and Mann, 2005)
Sergeant major damselfish Abudefduf saxatilis
PVC pipe 1.2 m high, 30 cm diameter, 1.12 m water, fish 46 cm below surface, speaker at bottom of pipe
AEP Bad because underwater speaker, hydrophone, sound adjusted for pressure levels. Good because may have been able to detect some changes in ontogeny
(Fay, 1969) Goldfish Carassius auratus
21 x 15 x 11 cm tank. In-air speaker, fish held at surface Behavioural (ES) Wide variation for goldfish due to varying acoustic conditions, pressure sensitivity only
(Fay, 1970a) Goldfish Carassius auratus
21 x 15 x 11 cm tank. In-air speaker, fish held at surface Behavioural (ES) Pressure sensitivity only, measured frequency generalisation
(Fay, 1970b) Goldfish Carassius auratus
21 x 15 x 11 cm tank. In-air speaker, fish held at surface Behavioural (ES) Pressure sensitivity only, measured frequency discrimination
(Fay, 1972) Goldfish Carassius auratus
21 x 15 x 11 cm tank. In-air speaker, fish held at surface Behavioural (ES) Pressure sensitivity only, showed perception of amplitude modulated signals
(Fay, 1974) Goldfish Carassius auratus
Critical ratios. 21 x 15 x 11 cm tank. In-air speaker, fish held at surface
Behavioural (ES) Pressure sensitivity only, showed masking of tones by noise
(Fay et al., 1978)
Goldfish Carassius auratus
21 x 15 x 11 cm tank. In-air speaker, fish held at surface. Also another tank with in-air speaker, 19 cm diameter, 14 cm high, positioned over a speaker in air chamber full of rubber
Behavioural (ES) Pressure sensitivity only, showed masking of tones by noise including psychophysical tuning curves
(Fay, 1984) Goldfish Carassius auratus
Shaker table AEP Measured particle motion on a shaker table
(Fish and Offutt, 1972)
Toadfish Opsanus tau Tank, in-air speaker. Also speaker in the field Behavioural (Classical conditioning, shocks and heart rate. Also vocal responses in the field)
Bad in tank, OK in the field for pressure, assuming fish respond by suppressing their own vocalisations every time they hear a boatwhistle
(Gutscher et al., 2011)
Goldfish Carassius auratus
Effect of pond and aquarium noise on sensitivity. In-air speaker, measured pressure with a hydrophone. Same as Kenyon et al. 1998
AEP Pressure sensitivity only; in-air speaker and hydrophone

13
(Hawkins and Chapman, 1975)
Atlantic cod Gadus morhua
Masking critical bandwidths. In the sea, 20 m deep, 6 m from the bottom, speaker 2 m from fish
Cardiac conditioning
Good for masking, but still in near field and only measured pressure
(Hawkins and Johnstone, 1978)
Atlantic salmon Salmo salar
Tank (in-air vs in water speakers) and loch (speakers at different distances but same sound pressure level (spl)
Heart rate Works out masking critical ratio. Works out salmon are more sensitive to particle motion than pressure, but no direct evidence on particle motion
(Higgs et al., 2001)
Zebrafish Danio rerio At surface of 19 L bucket of water, 25 cm above an underwater speaker
AEP Bad as underwater speaker would produce particle motion but only pressure measured. Bad absolute method, but can show differences in ontogeny
(Higgs et al., 2003)
Zebrafish Danio rerio 5 cm below surface of 20 L bucket of water, 25 cm above an underwater speaker
AEP Bad as underwater speaker would produce particle motion but only pressure measured. Bad absolute method, but can show differences in ontogeny
(Higgs and Radford, 2013)
Goldfish Carassius auratus
PVC pipe 0.5 mm thick, 1.11 m long, diameter 0.25 m (same as Wright et al. 2005), underwater speaker
AEP Showed difference in auditory threshold at low frequencies when lateral line neuromasts oblated
(Kenyon, 1996)
Bicolor damselfish Pomacentrus partitus and P. variabilis
Standing wave tube during ontogeny. Same apparatus as Ha 1973 and Myrberg and Spires 1980
Behavioural (ES) Measured particle motion as well as pressure. Deliberately tested for far field pressure thresholds
(Kenyon et al., 1998)
Goldfish Carassius auratus, oscar Astronotus ocellatus
First use of auditory brainstem response method. In-air speaker, small bowl of water on air table in Faraday chamber. Fish anaesthatised
AEP Investigating sensitivity to pressure only
(Lechner et al., 2010)
Squeaker catfish Synodontis schoutedeni
During ontogeny. Small plastic bowl with gravel bottom (13 cm deep, 33 cm diameter). Speakers 50 cm above water surface. Fish anaesthatised. Following method developed by Kenyon et al. (1998), then modified by Wysocki & Ladich (2005a,b)
AEP Investigating sensitivity to pressure only
(Lu and DeSmidt, 2013)
Zebrafish Danio rerio Decreasing thresholds with increased hair cell development in embryos. Microphonic potentials
AEP First study of development of particle motion thresholds

14
(Lu et al., 1996)
Oscar Astronotus ocellatus
Shaker table. Modified from Fay (1984), same as Fay et al. (1994)
Behavioural (ES) Particle motion thresholds with a shaker table
(McKibben and Bass, 1999)
Plainfin midshipman fish Porichthyes notatus
30 cm diameter, 24 cm high tank, speaker in sand at bottom, fish ear 10 cm above speaker (tank similar to Fay 1990)
AEP Underwater speaker and hydrophone. Equalised for pressure
(Myrberg and Spires, 1980)
Six species of Pomacentrus
Standing wave tube ES Known acoustic conditions
(Popper et al., 2007)
Rainbow trout Onchorynchus mykiss
Low frequency sonar (200–500 Hz) 193 dB re 1 uPa, specially designed acoustic tank 35.6 cm diameter, 35.6 cm deep, underwater speaker on bottom
ABR Used relative hearing thresholds only to examine impacts of noise on hearing
(Schuijf et al., 1972)
Ballan wrasse Labrus berggylta
Mid water in the sea; water depth 34 m, depth in water 3.6 m, cage in PVC frame
Behavioural (choice conditioning)
Approximate free field conditions
(Schuijf, 1975)
Cod Gadus morhua Mid water in the sea; water depth 34 m, depth in water 3.6 m, cage in PVC frame
Behavioural (choice conditioning)
Approximate free field conditions
(Sisneros and Bass, 2005)
Plainfin midshipman fish Porichthyes notatus
Same as McKibben & Bass (1999) and Sisneros & Bass (2003); 30 cm diameter 24 cm high tank, speaker in sand at bottom, fish ear 10 cm above speaker
AEP Bad as underwater speaker, small tank, only measured pressure. However, claim pressure adequately characterises sound? See McKibben & Bass (1999) and Bass & Clark (2003). Disagree with them, their method is bad. Also adjusted level so that pressure levels were equal, but paid no attention to particle motion. A problem because particle motion and pressure can be out of phase (nodes/anti nodes). However, may have been able to detect differences in detection with ontogeny
(Tavolga, 1974)
Goldfish Carassius carassuis, pin fish Lagodon rhomboides, African mouth-breeder Tilapia macrocephela
Critical ratios, tank and in-air speaker Behavioural (ES) Only measured pressure thresholds

15
(Vasconcelos and Ladich, 2008)
Lusitanian toadfish Halobatrachus didactylus
Based on Kenyon (1998) and Wysocki & Ladich (2001) AEP Investigating sensitivity to pressure only (in-air speaker with hydrophone in water). However, may have been able to detect differences in pressure detection with ontogeny
(Wright et al., 2005)
Pomacentrus nagasakiensis
Consciously kept fish in quiet conditions, PVC pipe 0.5 mm thick, 1.11 m long, 0.25 m diameter
AEP Underwater speaker and hydrophone, claims to present absolute hearing threshold
(Wright et al., 2008)
Plectropomus leopardus
Tested fish immediately on capture, same set-up as Wright et al. (2005)
AEP Underwater speaker and hydrophone, claims to present absolute hearing threshold
(Wright et al., 2010)
Lutjanus carponotatus, Pomacentrus amboinensis, Elagatis bipinnulata, Gnathanodon speciosus
Same as Wright et al. (2005, 2008), underwater speaker 0.75 m from fish
AEP Underwater speaker and hydrophone, claims to present absolute hearing threshold
(Wright et al., 2011)
All of the above plus Epinephelus coioides, E. Fuscoguttatus, Eleutheronema tetrodactylum, Caranx ignobilis, Macquaria novemaculeata
Same as Wright et al. above, but this time used a hydrophone pair to calculate particle acceleration thresholds
AEP Presented particle motion thresholds
(Wysocki and Ladich, 2001)
Anabantoid Trichopsis vittata
As in Kenyon et al. (1998), 11 L plastic bowl, 33 cm diameter, 13 cm deep with 1 cm of sand at bottom
AEP Investigating sensitivity to pressure only (in-air speaker with hydrophone in water)
(Wysocki and Ladich, 2005a)
Goldfish Carassius auratus
As in Kenyon et al. (1998) AEP Investigating sensitivity to pressure only

16
(Wysocki and Ladich, 2005b)
Goldfish Carassius auratus, lined Raphael catfish Platydoras costatus, pumpkinseed sunfish Lepomis gibbosus
As in Kenyon et al. (1998) AEP Investigating sensitivity to pressure only
(Wysocki et al., 2009)
Red-mouthed goby Gobius cruentatus, Mediterranean damselfish Chromis chromis, brown meagre Sciaena umbra
As in Kenyon et al. (1998) AEP Measured and presented particle motion as well as pressure
(Yan, 1998) Blue gourami Trichogaster trichopterus, kissing gourami Helostoma temminckii, dwarf gourami Colisa lalia
Deflating the swim bladder reduces hearing sensitivity. Same method as Kenyon (1998)
AEP Investigating sensitivity to pressure only
(Zeddies and Fay, 2005)
Zebrafish Danio rerio 24-well plate on shaker table Startle responses Measured acceleration as well as pressure, unsure whether measured auditory threshold as response threshold was startles; possible that fish heard sounds but did not startle

17
1.2.3 Why fishes and invertebrates hear Fishes use their auditory abilities for a wide variety of functions. Avoiding predators or other threats
aids survival, for example herring (Clupea harengus) avoid the sounds of killer whale (Orcinus orca
feeding vocalisations (Doksæter et al., 2009) and goldfish (Carrasius auratus) startle away from
sudden loud sounds (Mirjany et al., 2011). Fishes also use sound to find food, for example sharks
swim towards low frequency sounds that signify prey (Nelson and Gruber, 1963), and urchins and
other invertebrate prey make feeding sounds that could be used by other fishes (Popper et al., 2001;
Radford et al., 2008). Many fishes also use vocal communication during agonistic behaviour such as
when threatened by a predator or competing for food or mates (Ghazali, 2012), or to self-advertise
during reproduction (Amorim and Vasconcelos, 2008).
Fay (2009) reviews the literature on soundscapes and fish hearing, exploring the question of
what non-vocal specialists listen to. He refers to the concept of ‘acoustic daylight’, referring to noise,
reflection, scattering and reverberation which could help to orient fishes. This concept is similar to
echolocation, but makes use of passive acoustics. It turns out the main driver for the evolution of
hearing is ambient noise, thus it is likely that the first and most important reason that fishes use
underwater sound is auditory scene analysis or perception of acoustic daylight (Fay, 2009).
Many species of larval fish certainly use sound to orientate and find suitable habitat
(Tolimieri et al., 2000; Simpson et al., 2005b). Embryos may even imprint on their native habitats to
aid self-recruitment (recruiting to the habitat where their parents spawned) (Simpson et al., 2005a).
The startle response to sound is present in developmental stages (Bhandiwad et al., 2013). Recent
evidence also reveals that larvae use sound for vocal communication (Staaterman et al., 2014).
However, our knowledge of how the developmental stages of fishes use sound is lagging behind that
of adults, as studies are rare.
Marine invertebrates are even less well studied than fishes, although the evidence we have
suggests they use their auditory abilities for a similar variety of functions. There is evidence of
predator avoidance in hermit crabs (Coenobita clypeatus), who retreat into their shells when a
person approaches them (Chan et al., 2010). Male ghost (Ocypode) and fiddler (Uca) crabs produce
sounds from their burrows which are presumed to attract females, a hypothesis that is yet unproven
but supported by what is known about hearing in these genera (Popper et al., 2001). Ghost and
fiddler crabs also intensify their ‘courtship’ sounds when they hear the calls of other males,
suggesting acoustic competition and/or threat of physical conflict (in a sexual context) (Popper et al.,
2001).
Developmental stages of marine invertebrates also use sound for finding suitable habitat, for
example many species of crab larvae swim towards reef sound (Stanley et al., 2010 and references

18
therein), and pelagic and nocturnally emergent crustacean species actively avoid reef sound,
presumably because it represents potential predators and habitat where they do not usually live
(Simpson et al., 2011b). Crabs and mussels also use sound as a developmental cue; being induced to
settle by particular habitat sounds (Stanley et al., 2010; Lillis et al., 2013). The varied use of sound by
developmental stages of marine fishes and invertebrates suggests that they are likely to be
vulnerable to noise pollution.
1.3 Effects of noise on developmental stages of fishes and marine invertebrates The impacts of anthropogenic noise on adult fishes and invertebrates (as well as other animals) are
extensively reviewed elsewhere (Popper and Hastings, 2009; Barber et al., 2010; Holles, 2010;
Slabbekoorn et al., 2010; Kight and Swaddle, 2011; Radford et al., 2012; Francis and Barber, 2013;
Morley et al., 2014; Shannon et al., 2015). Effects include death, tissue damage, auditory threshold
shifts, masking, physiological stress responses (such as increased blood cortisol, heart rate and
ventilation rate), and disrupted reproductive, feeding, anti-predator and swimming/schooling
behaviour. Some studies also show no impact of noise. Here I discuss the known impacts of
anthropogenic noise on developmental stages of fishes and marine invertebrates, which are likely to
be vulnerable to anthropogenic noise, yet are understudied.
1.3.1 Eggs/Embryos Although embryonic fish are able to hear (Section 1.1.2), there is very little research investigating
how anthropogenic noise might have an impact at this life-history stage. Reduced egg viability has
been observed in Cyprinodon variegatus but not Fundulus similis exposed to higher noise levels in
tanks (Banner and Hyatt, 1973). Increased mortality was also observed in marine fish eggs up to 20
m from a seismic source (Kostyuchenko, 1973). However, more recent experimental work failed to
find any effect of chronic noise on cichlid (Neolamprologus pulcher) embryonic development or
survival (Bruintjes and Radford, 2014). Simpson et al. (2005) found that embryonic clownfish
(Amphiprion ephippium and A. rubrocinctus) heart rates increased when noise was played through a
speaker. Increased heart rate in response to noise is likely to be due to the release of the hormone
adrenaline as part of the hypothalamic-pituitary-interrenal (HPI), or ‘stress response’ axis. If embryos
do not habituate to noise and they are exposed to repeated or long periods of noise, chronic
activation of the adrenal system and the consequent raised metabolic rate could use up finite
resources, diverting energy away from growth and development. There is no peer-reviewed
evidence for impacts of noise on marine invertebrate embryos.

19
1.3.2 Larvae There is also mixed evidence for impacts of anthropogenic noise on fish larvae. Banner and Hyatt
(1973) found reduced growth in C. variegatus and F. similis, while Bruintjes and Radford (2014)
found no impact of chronic noise on N. pulcher growth or survival. Some studies found that
underwater explosions caused mortality in larval fish of a range of species, and that smaller fish
were more vulnerable than larger fish (Yelverton et al., 1975; Govoni et al., 2008), yet Bolle et al.
(2012) found no impact of high sound levels on larval sole (Solea solea) survival. In terms of
behaviour, Jung and Swearer (2011) showed that boat sound did not stop larvae of several reef
fishes swimming towards reef sounds played at light traps. However, Holles et al. (2013) showed
that in choice chambers, more larval Apogon doryssa swam away from reef sound when boat sound
was played at the same time.
Some early evidence from scallops (Pecten novaezelandiae) suggests that marine
invertebrate larvae may also be impacted by anthropogenic noise—Aguilar de Soto et al. (2013)
found that exposure to loud impulsive noise caused delayed development and caused
malformations in scallop larvae—although their study was pseudoreplicated. The abnormalities
observed were comparable to those caused by chemical pollutants or water acidification, which
have a clear impact on larval survival (Hamdoun and Epel, 2007).
1.3.3 Juveniles In juvenile fishes, loud impulsive noises can cause injury (Halvorsen et al., 2012) and death
(Kvadsheim and Sevaldsen, 2005), while infrasound produces flight and avoidance responses
(Knudsen et al., 1992; Knudsen et al., 1997). Davidson et al. (2009) found that growth of rainbow
trout (Onochorynchus mykiss) was slower in noisy conditions during the first month, but caught up
afterwards and there was no difference from controls between 2 and 5 months. In addition, weight,
length, specific growth rates, condition and survival were no different from 1 to 5 months. This could
mean that rainbow trout are not affected in the long-term by chronic noise, however, catch-up
growth could lead to lower fitness due to oxidative stress, as has been previously shown in three-
spined sticklebacks (Gasterosteus aculeatus) (Lee et al., 2013). Other work with rainbow trout found
that hearing sensitivity, growth, survival, stress and disease susceptibility were not negatively
impacted by noise levels common to recirculating aquaculture systems between 92 days post-
hatching and 8 months (Wysocki et al., 2007).

20
1.3.4 Research gaps Most research on the impacts of anthropogenic noise on fishes and invertebrates (including that on
adults) has only considered the acoustic pressure component of the sound, whereas we know that
particle motion propagates differently and is heard by fishes and invertebrates (see Section 1.2). I
advocate that the particle motion component of sound should be considered of at least equal
importance to pressure.
There is also a lack of knowledge about how repeated or chronic exposures might affect
fishes and invertebrates, as responses could change with time (Bejder et al., 2009); most of the time
extrapolations are made from short-term responses (but see Wysocki et al., 2007; Davidson et al.,
2009; Anderson et al., 2011; Bruintjes and Radford, 2014 for exceptions). In addition, there are
known cognitive (such as distraction – Chan et al., 2010; Purser and Radford, 2011) and endocrine
(such as increased cortisol – Wysocki et al., 2006) responses to noise, which may seem to be subtle
effects but could affect short-term survival via impacts on predator avoidance (Chan et al., 2010;
Voellmy et al., 2014a; Simpson et al., 2015). Cognitive and endocrine effects could also impact
fitness in the long term via reduced condition, ability to reproduce successfully or ability to progress
through developmental stages fast enough to avoid predation. Evidence for these potential longer
term impacts is currently lacking.
Tank environments allow control over a range of factors which could influence experimental
data such as ambient temperature, background noise, lighting and water chemistry. However, tanks
create unnatural and unpredictable soundscapes due to near field effects, reflections and
reverberations (Parvulescu, 1967). Experimental manipulations in field settings are rare for logistical
reasons, but attempts to conduct experiments in field settings are required to complement data
from tank studies, to enable this field to move forward (Slabbekoorn, in press).
1.4 My Thesis In summary, the developmental stages of fishes and marine invertebrates use their auditory
systems, underwater anthropogenic noise is increasing at frequencies which are highly likely to be
disturbing, and there is a building body of evidence that noise can have negative impacts on fishes
and invertebrates. Of the sources of underwater anthropogenic noise, traffic noise is the most
pressing concern because it is the most widespread. However, there is a dearth of well-designed and
controlled studies on the effects of noise on the developmental stages of fishes and marine
invertebrates. Tank experiments are more common than field manipulations because conducting
well-replicated experimental manipulations in field settings is logistically challenging, however, this
is something I address in my thesis.
Impacts clearly depend on a variety of factors, including species, size, sound exposure and

21
context (Bruintjes and Radford, 2013; Radford et al., in press). Experimental manipulations with
suitable controls and replicates are required if the influence of noise is to be isolated; correlative and
pseudo-replicated studies do not allow confounding factors to be ruled out or strong conclusions to
be drawn (Slabbekoorn, 2013; Morley et al., 2014). Experiments also need to consider repeated or
chronic noise exposure because changes across time and cumulative effects may affect animal
responses (Bejder et al., 2009). Finally, experiments need to consider the particle motion component
in addition to the sound pressure of exposure. I will address each of these key elements in my thesis.
In Chapter 2, I focus on the importance of measuring particle motion in studies with fishes
and marine invertebrates that involve sound. I present computer code which is the result of a
collaboration with James Campbell (University of Leiden) and Nathan Merchant (Centre for
Environment Fisheries and Aquaculture Science), and allows a user to analyse tri-axial recordings of
particle acceleration. This is written for a biologist’s perspective and use.
In Chapter 3, I present the results of a study investigating how exposure to 16 days of regular
and irregular traffic noise impacts the behaviour, growth and development in Atlantic cod (Gadus
morhua) larvae. This work was limited to the less-than-ideal acoustic conditions in aquaria because
wild larval cod are challenging to find and follow. So, for Chapter 4, I worked in the natural
environment investigating the impacts of short and long-term traffic noise on juvenile threespot
dascyllus (Dascyllus trimaculatus), a damselfish species. Specifically, I considered noise-induced
changes in physiology (opercular beat rate), behaviour (hiding), stress (blood cortisol), growth and
condition. The fish in this experiment were caged to exclude natural predators, thus we could
establish whether starvation was a likely cause of death.
For Chapter 5, I again worked in the natural environment, but this time with uncaged
juvenile fish, so that we could determine whether predation rates were likely to be higher when fish
were exposed to traffic noise. I chose a species where the parents provide care to offspring at a nest,
making them good experimental units for investigating the impacts of traffic noise on offspring
survival over 12 days. In Chapter 6, I present the results of the first study of the impacts of traffic
noise on marine invertebrate embryonic development and survival.

22

23
Chapter 2: Particle motion: the missing link in underwater acoustic ecology
This chapter will be submitted to ‘Methods in Ecology and Evolution’ for publication, with the following list of authors:
Sophie L. Nedelec, James Campbell, Andrew N. Radford, Stephen D. Simpson, Nathan D. Merchant
Author contributions:
SLN, ANR and SDS conceived the paper; SLN obtained and tested the accelerometer before writing a preliminary version of the analysis program based on sound pressure analysis code provided by NDM; JC added many functions and wrote the final version of the analysis program with input from SLN; SLN wrote the manuscript with input from ANR and NDM; NDM checked accuracy of the manuscript and will add further detail to supplementary materials containing instructions for the program.

24
2.1 Introduction Aquatic habitats are awash with sensory stimuli: visual, auditory, olfactory, gustatory, magnetic,
electric, tactile, hydrostatic and geocentric. Of these, auditory cues are particularly effective since
sound travels relatively far and relatively fast in water (Bradbury, 1998). For this reason, a large
number of aquatic organisms have evolved ways of detecting and producing sound (Song et al.,
2015). Although aquatic bioacoustics has been an active field of study for many decades (Au and
Hastings, 2008), investigations of acoustic phenomena in aquatic systems have almost exclusively
considered only one component of the sound field: sound pressure. The particle motion component
has been relatively neglected.
From a biological perspective, we need to concern ourselves with understanding the particle
motion component of underwater sound for three main reasons. First, while marine mammals use
sound pressure, all fish and many invertebrates (i.e. most acoustically receptive aquatic organisms)
detect and use the particle motion component of sound (Popper et al., 2001; Bleckmann, 2004; Kaifu
et al., 2008). Second, fish and invertebrates are socio-economically important and form the basis of
many food webs (Béné et al., 2007). Thus understanding how fish and invertebrates use and are
affected by sound is important to our understanding of their ecology, which in turn will inform our
sustainable use of them as resources. Third, anthropogenic (man-made) sounds are becoming more
common and noise pollution is considered a global change which threatens biodiversity (Popper and
Hastings, 2009; Slabbekoorn et al., 2010). While there is building evidence and accompanying
legislation surrounding the impacts of anthropogenic noise on fishes and invertebrates, up until now
the focus has been on sound pressure, which is not the primary stimulus used by these animals.
In some cases, particle motion can be calculated from sound pressure. However, sound
pressure and particle motion are directly related only under specific conditions, which are not
generally met in the shelf seas and shallow waters which most aquatic life inhabit. To characterise
particle motion in these habitats, it is therefore necessary to make measurements using a particle
motion sensor. Instruments to measure particle motion have only recently become commercially
available, and their use in tank experiments and field studies is still in its infancy (Popper et al., 2014;
Merchant et al., 2015; Martin et al., in press). As the uptake of these novel sensor technologies
gathers pace, there is a growing need to provide user-friendly guidance on the methods,
instrumentation, and underlying physics of particle motion measurement to ensure broad
understanding of—and participation in—this research effort. The relevant audience extends from
researchers to consultants and environmental managers, who are beginning to address the rising
influence of anthropogenic noise on aquatic ecosystems. It is important that the significance of
particle motion measurement is clearly articulated for non-specialists.

25
Particle motion is also important in terrestrial bioacoustics for invertebrates; however its
measurement is better established (see Morley et al., 2014). Here, we provide a brief introduction to
underwater particle motion in an ecological context. We begin with an accessible overview of the
physics of particle motion and the detection of particle motion by fishes and invertebrates. To help
inform new studies, we offer practical guidance on instrumentation and data analysis techniques for
particle motion measurement, including software in MATLAB to analyse particle motion data. We
include a specific example of the collection and analysis of data from a particle motion detector.
Finally, we identify several key knowledge gaps related to particle motion in aquatic environments
which warrant further research.
2.2 Physics of particle motion Sound is propagated vibratory energy (Gans, 1992). A sound wave propagates because particles next
to a vibrating source are moved backwards and forwards by the source in an oscillatory motion;
these particles then move the particles next to them and so on. Thus, particles of the medium do not
travel with the propagating sound wave; rather they vibrate backwards and forwards and transmit
energy to their neighbours. Their oscillatory motion contains information about the direction of the
propagating wave. Particle motion can be expressed as velocity (m/s), acceleration (m/s2), or
displacement (m) of the particles. These three qualities are related to one another in a frequency-
dependent way (see Box 1).
Box 1: Relationships between particle velocity, particle acceleration and particle displacement
Particle velocity, acceleration and displacement are always linked by the following equations: Velocity and acceleration:
𝑎𝑎 = 𝑢𝑢𝑢𝑢, (equation 1.1)
where 𝑎𝑎 = acceleration (m/s2), 𝑢𝑢 = particle velocity (m/s) and 𝑢𝑢 = angular frequency (radians/s) = 2𝜋𝜋𝜋𝜋 (𝜋𝜋 = frequency in Hz). Velocity and displacement:
𝜉𝜉 = 𝑢𝑢𝜔𝜔
,
(equation 1.2)
where 𝜉𝜉 = displacement (m), 𝑢𝑢 = particle velocity (m/s) and 𝑢𝑢 = angular frequency (radians/s) = 2𝜋𝜋𝜋𝜋 (𝜋𝜋 = frequency in Hz).

26
Sound pressure is the pressure difference created by compression of the air between vibrating
particles. There is a very simple relationship between sound pressure and particle velocity when
sound is propagating as a plane wave (see Box 2, equation 2.2). Velocity can then be converted to
acceleration or displacement if desired (Box 1). A plane wave occurs where the wavefront can be
considered flat: far from the sound source (>1 wavelength, see Figure 2.1), far from boundaries
where reflections could influence the propagating wave (the definition of ‘far’ here requires
investigation) and in deep water (deeper than the ‘cut-off’, below which acoustic waves do not
propagate, see Figure 2.2). Sounds below the cut-off frequency will not propagate as plane waves
and particle motion cannot be calculated from pressure, thus particle motion should be measured.
The cut-off frequency (𝜋𝜋𝑐𝑐 ) is calculated using the equation
𝜋𝜋𝑐𝑐 = 𝜋𝜋 − 𝜌𝜌𝑠𝑠𝑠𝑠𝑠𝑠 𝜌𝜌𝑤𝑤⁄
2𝜋𝜋𝜋𝜋𝜋𝜋𝜋𝜋𝜓𝜓𝑐𝑐𝑐𝑐𝐻𝐻
where 𝜌𝜌𝑠𝑠𝑠𝑠𝑠𝑠= sediment density, 𝜌𝜌𝑤𝑤 = water density, 𝜓𝜓𝑐𝑐 = 𝑎𝑎𝑎𝑎𝑐𝑐𝑐𝑐𝑎𝑎𝜋𝜋 𝑐𝑐𝑐𝑐𝑠𝑠𝑠𝑠𝑠𝑠
, 𝑐𝑐 = sound speed in water, 𝑐𝑐𝑠𝑠𝑠𝑠𝑠𝑠
= water density and 𝐻𝐻 = water depth); see Glossary for further explanation of terms. Were the
conditions for plane waves are met, or at least allow a realistic approximation, we do not need to
measure particle motion directly but can calculate it from measurements of sound pressure.
Box 2: Calculating particle motion from sound pressure
In a plane wave, sound pressure is linked to particle velocity by a very simple equation: 𝑢𝑢 = 𝑃𝑃
𝜌𝜌𝑤𝑤𝑐𝑐,
(equation 2.1) where 𝑢𝑢 = particle velocity (m/s), 𝑃𝑃 is acoustic pressure (Pa), 𝜌𝜌𝑤𝑤 = density of the water (kg/m3), and 𝑐𝑐 = sound speed (m/s) (𝜌𝜌𝑐𝑐 is also known as characteristic acoustic impedance). This is only applicable in a plane wave or where a plane wave is a suitable approximation (i.e. in the free field). Particle acceleration or displacement can be calculated from velocity using equations in Box 1. In the near field of a monopole source, far from any boundaries which could lead to the wave not propagating due to the cut-off frequency, or reflections that could interfere with the propagating wave, the following equation can be used to calculate particle displacement from sound pressure:
𝜉𝜉 = 𝑝𝑝
2𝜋𝜋𝜌𝜌𝑤𝑤𝑐𝑐�1 + �
𝜆𝜆2𝜋𝜋𝑎𝑎
�2
�
12
(equation 2.2) where ξ = displacement (m), p = pressure (Pa), 𝜌𝜌𝑤𝑤 = density of the water (kg/m3), 𝑐𝑐 = sound speed (m/s), and r = distance to sound source (m). Particle acceleration or velocity can be calculated from displacement using equations in Box 1.

27
Figure 2.1 Wavelength as a function of frequency, calculated for an assumed sound speed in water of 1500 ms-1 using λ= 1500/f, where λ = wavelength and f = frequency in Hz.
Figure 2.2 Cut-off frequency as a function of depth, calculated for a coarse silt bottom with a sound speed of 1593 ms-1 and density of 1693 kgm-3, assuming sound speed in water is 1500 ms-1 and water density is 1026 kgm-3. The shape of this curve is similar to that in Figure 2.1 because both are distance (either to the source as in Figure 2.1, or to boundaries as here) and frequency dependent. These two figures highlight that it is near to a source or in shallow waters, at low frequencies that measuring particle motion is most relevant.

28
More complicated situations exist where particle motion can still be calculated from sound
pressure by modelling using more complex formulae. Models exist for the near field of a monopole
source, where reflections and the cut-off frequency (Figure 2.2) are not influencing the sound (see
equation 2.2); and within ¼ wavelength of a boundary where the incident wave is approximately
normal to the boundary (in this case we advise consulting a sound propagation modelling expert).
However, wherever these conditions are not met, particle motion should be measured.
The conditions where the plane wave approximation is inadequate and the other conditions
described above do not apply vary according to: 1) distance to the sound source; 2) size of the sound
source; 3) distance to any reflecting boundaries (e.g. surface or bottom); 4) water depth; 5)
frequency; 6) sound speed in the water; 7) density of the water; 8) sound speed in the sediment; and
9) density of the sediment. We provide a simple computer program in MATLAB where these
parameters can be entered and the user will be advised whether they should measure or can
calculate particle motion. For rules of thumb, distances less than one wavelength (Figure 2.1) of a
sound source that is not a monopole, require particle motion measurement, and at depths of less
than 100 m and frequencies less than 1 kHz, the cut-off frequency should be checked (see Figure
2.2). That is, in shallow water and at low frequency, which is exactly the habitat and frequency range
most used by fishes and invertebrates. Note that in tanks, resonant frequencies are likely to affect
the relationship between particle motion and pressure above the cut-off frequency, thus we
recommend that particle motion should always be measured in tanks, the best method for doing so
still needs further work.
2.3 Physiology of particle motion Hearing is the detection of propagated vibratory energy (Gans, 1992). All hearing is based on
mechanosenory hair cells transducing vibrations into electrical signals. Particle oscillations can either
be detected directly by hair cells that protrude into the medium (air or water), or they can be
coupled to a solid structure and detect relative motion between the body and the structure (Gans,
1992). The bodies of fishes and aquatic invertebrates, being composed mainly of water, are coupled
directly to the medium (water). Thus, the whole body vibrates as a sound wave passes through.
Denser calcareous structures such as the otoliths and statocysts, which are found in the inner ears,
lag behind the vibration of the body due to their impedance difference (being denser). Chordontal
organs are also found in the legs of some crabs and allow detection of sounds propagating in the
substrate by sensing leg movement (Popper et al., 2001). Hearing in fishes and invertebrates seems
to be focused in the lower frequencies; although some fish can hear up to over 100 kHz, most have a
peak sensitivity under 1.5 kHz (Popper and Hastings, 2009).

29
2.4 Instrumentation Although measuring particle motion has been possible for decades, the availability of commercially
produced instruments has only recently begun to make the measurement of particle motion a
possibility for non-experts. This is a very important development for biologists and regulators alike.
There are three main methods of measuring particle motion underwater: 1) calculating the pressure
gradient between two hydrophones; 2) measuring with velocity sensors; and 3) measuring with
accelerometers (Martin et al., in press). To calculate pressure gradients, it is necessary to calibrate
the phase response of the hydrophones accurately (phase needs to be known for the calculation of
velocity from pressure differential) (Zeddies et al., 2010). While this method has been used
successfully by other authors (e.g. Zeddies et al., 2010), it is accessible only to those with a)
expensive hydrophones which provide highly accurate phase information and b) the expertise for a
phase calibration. Velocity sensors (‘geophones’) typically have a very low resonance and are only
useful at 10s of Hz at most. Velocity sensors make better sensors for seismic measurements, but
acoustic measurements are better done with accelerometers. As frequency increases, acceleration
magnitude increases in relation to velocity magnitude, so signal-to-noise ratios will be better with an
acceleration-based sensor. We feel the accelerometer is the best compromise for measuring particle
motion levels in the range relevant to fishes and invertebrates.
Accelerometers work in a similar fashion to fish ears; the relative motion between the
device and a denser structure is measured. Thus, the coupling between the device and the water
must be understood if accurate measurements are to be made. Some suggest that the device needs
to be neutrally buoyant, meaning that it will behave in the same way as the vibrating water
molecules (e.g. Leslie et al., 1956). But, neutrally buoyant devices can be difficult to position and
orientate, as they move around with any water movement. Negatively buoyant devices can be easier
to use as they can be suspended either from the surface or some kind of frame. The effect of gravity
is consistently pulling the accelerometer down and can in fact simply be filtered out as a direct
current effect (i.e. as part of the instrument sensitivity calibration). We note that Sigray and
Andersson (2011) used a slightly positively buoyant sphere to house their accelerometer and did not
use the data from the vertical channel due to potential variable effects on the movement of the
sphere resulting from variable to clable lengths and coupling to the seabed. Thus the vertical
channel must be reliably calibrated prior to use.
Off-the-shelf accelerometers are now starting to become available and here we
demonstrate the use of a particular example: a tri-axial accelerometer from GeoSpectrum
Technologies, Canada; the M20L. The M20L has three separate outputs, one for each x–y–z axis of
motion. We used a 4-track recorder (Boss BR-800, Roland, Swansea, UK) to record the three

30
channels, and used the fourth channel for a hydrophone to measure pressure concurrently. Below
300 Hz, the accelerometer we used was calibrated in air on a vibration table (the most accurate
method). At lower frequencies, it is possible to couple the vibration table reliably to the
accelerometer for accurate calibration. At higher frequencies, coupling of the sensor to the table is
more difficult and mass and resonance of the table itself impact the calibration. Thus, between 300
and 3000 Hz, the accelerometer was calibrated underwater in the free field (where sounds
propagate as a plane wave) using pure tones against an already calibrated, pressure-sensitive
hydrophone. As stated above, in the free field, particle acceleration and velocity can be calculated
from sound pressure. Calibration of the instrument sensitivity was done for us by the manufacturers
GeospectrumTechnologies and provided as a sensitivity curve (see Figure 2.3).
Figure 2.3 Sensitivity curve for accelerometer provided by Geospectrum Technologies.
Changes in proper acceleration (‘g-force’ i.e. acceleration relative to free-fall) are transduced
by the accelerometer into current fluctuations, which are converted to voltage fluctuations before
being recorded by a digital device. The digital recorder must also be calibrated. This can be done by
recording a signal such as a sine wave (or ‘pure tone’) which has a known voltage played directly into
the recorder. The recorded voltage is then compared to the known voltage to establish the effect of
the device on the voltage. Step-by-step instructions for calibrating recorders can be found in the
Supplementary Materials (note that the same method can be used for recorders that are used with
0,0
10,0
20,0
30,0
40,0
50,0
60,0
70,0
80,0
90,0
0 500 1000 1500 2000 2500 3000
Part
icle
vel
ocity
leve
l (dB
re 1
v/(
m/s
))
Frequency (Hz)

31
hydrophones or microphones). Manufacturers of recorders should provide information on the
bandwidth over which a recorder has a flat frequency response. This is the range that a calibration of
a single tone will be valid, provided the tone lies within this bandwidth. It is advisable to calibrate
recorders at least once per field season, or once a year, whichever is shorter, because it is possible
that slight changes may occur with age, climate or travel.
2.5 Data analysis When making recordings from an accelerometer, digitally recorded voltage fluctuations represent
changes in particle acceleration that occur as a result of the particle motion in a sound wave. A plot
of these fluctuations is called a ‘waveform’; values exceed 0 when the wave is ‘pushing’ away from
the source (when the phase of the wave is between 0 and 180°) and are below 0 when the wave is
‘pulling’ towards the source (when the phase of the wave is between 180 and 360°) (see Figure 2.4).
When all equipment is calibrated, these voltage fluctuations can be represented as particle
acceleration. Various functions can be applied to waveforms to quantify the sounds they represent,
thus allowing us to summarise and compare sounds.
Impulsive and continuous sounds are typically quantified in different ways (Hawkins et al.,
2015). For impulsive sounds, the peak or peak–peak amplitude, 90% energy envelope, rise time,
crest factor and sound exposure level (SEL) are appropriate measures. For continuous sounds (or
sounds that are longer-lasting and thus better summarised using approximations to continuous
sounds), it is more useful to average amplitudes over time. The simple mean level from the
waveform would result in 0, thus the root-mean-squared (RMS) is used.
Figure 2.4 Schematic of a sine wave showing the concepts of phase, wavelength and peak–peak amplitude. Time is on the x-axis. The y-axis could apply to pressure (for sound pressure levels), particle velocity, particle acceleration, or particle displacement.

32
Impulsive sounds can be so loud that they can cause physical injury such as barotrauma in
fish (Halvorsen et al., 2012), although this is not always the case (Kane et al., 2010). Sound energy
from outside of the hearing range of the animal concerned can contribute to injuries. For this
reason, energy at all frequencies measured is included in loud impulse measurements (just how loud
is ‘loud’ is still the subject of much research (e.g. Halvorsen et al., 2012). It is thus important to pay
attention to the frequency response of equipment used to measure such sounds, because
conclusions could be compromised if recording equipment is not capable of detecting certain
frequencies.
For quieter sounds, the hearing range of the species of interest affects the frequencies that
are relevant. If the auditory abilities of the species of interest are known (rare, even in the pressure
domain, but see Casper and Mann, 2007a,b; Radford et al., 2012 for exceptions), irrelevant
frequencies can be filtered out before calculating impulse metrics or RMS levels. Another useful way
to account for the fact that different animals have different auditory abilities, and thus may be
attending to different parts of the same sound to be characterised, is to look at the energy present
in a range of bandwidths, for example 1 Hz bandwidths. This information can either be plotted over
time in a 3-D spectrogram (Figure 2.5), where amplitude is coded by colour, or averaged over time
by RMS and plotted on a 2-D power spectral density plot (Figure 2.6).
Internationally agreed standard units are not currently available for particle motion
measurement. However, based on expert advice (Ainslie, pers. comm.), we will use the following
until such standards are published: velocity (dB re 1 nm/s), acceleration (dB re 1 µm/s2),
displacement (dB re 1 pm). From a technical viewpoint, velocity, acceleration and displacement are
equally valid representations. All three have been used in peer-reviewed papers (e.g. Banner, 1968;
Fay and Popper, 1974; Radford et al., 2012), although published examples of measurements of
ambient underwater particle motion are rare (Banner, 1968; Lugli and Fine, 2007). We consider that
the acceleration is the most relevant as it is closest to the way that fish and invertebrate ears
function. The software provided as an electronic appendix to this chapter (which can be accessed at
https://www.dropbox.com/sh/havdd2wybvwi39c/AAArOY9vA59ZiPnsSu-FDRQja?dl=0) and
accompanying instructions found in Appendix 1 will allow a user to accomplish the analyses
discussed above.

33
Figure 2.5 Example acceleration spectrogram output from a recording of distant boat noise. Window length = fs (44100).
Figure 2.6 Example acceleration power spectral density figure created in Excel from spreadsheet output of mean values from recordings of ambient and boat noise. Window length = fs (44100), mean over 60 s.
0
10
20
30
40
50
60
70
80
90
100
0 500 1000 1500 2000 2500 3000
PSD
(dB
re 1
(µm
/s2 )
2 /Hz
)
Frequency (Hz)
Boat
Ambient

34
2.6 Discussion It has been known for decades that fish and invertebrates hear particle motion. However, until now,
most papers written about sound and fishes and/or invertebrates have reported pressure
measurements and written some kind of cautionary comment about particle motion (e.g. Wale et
al., 2013a; Neo et al., 2015; Simpson et al., 2015). The main thing holding researchers back from
reporting particle motion has been availability of equipment and knowledge about how to make
measurements with such equipment. We are just reaching a stage where commercially available
equipment means that non-specialists can measure this element of sound.
We have used the techniques detailed here to characterise underwater soundscapes for
experiments involving either playbacks or exposure to real anthropogenic noise for fish and
invertebrates (e.g. Nedelec et al., 2014). We foresee that measurements of underwater particle
motion will also improve eco-hydro-acoustic models for environmental impact assessments where
fish and invertebrates could be impacted by anthropogenic noise (e.g. Rossington et al., 2013;
Bruintjes et al., 2014). Further, that use of particle motion measurements for passive acoustic
monitoring (as discussed in greater detail in Merchant et al., 2015) would improve our
understanding of natural soundscapes and the animals within them; for example, sound cues such as
vocalisations are likely to be detectable at different ranges in particle motion compared with
pressure. Particle acceleration also contains a directional component. We do not quantify that here,
but it will be the subject of a future paper. We hope that the analysis program provided will help
researchers to understand underwater soundscapes better, particularly in shallow water
environments, and to increase the validity of experimental work.

35
Table 2.1 Glossary, key terms used in definitions are underlined.
Key Terms Definition References for further reading
Acoustic pressure (or sound pressure)
Force of sound on a causing deviation from the ambient static pressure, caused by a sound wave.
(Erbe, 2011)
Angular frequency Frequency expressed in radians per second (rad/s).To convert a frequency in hertz to an angular frequency multiply by 2·π For an oscillation with period T, the angular frequency ω = 2·π / T
http://www.acoustic-glossary.co.uk/definitions-a.htm
Cut-off frequency Frequency below which sound waves do not propagate and particle motion cannot be calculated from sound pressure.
dB scale A logarithmic scale used for quantifying sound levels because of large dynamic ranges. Unit-less, must be expressed with a reference level. E.g. for acceleration, dB levels are expressed relative to 1µm/s2.
(Erbe, 2011)
Discrete Fourier Transform (DFT)
Function used to transform waveform data from the time to the frequency domain. Basis for spectrograms, power spectrums or power spectral density plots. DFT length determines the number of frequency bins.
(Merchant et al., 2015)
Far field Outside of the near field. Free field Anywhere that near field effects and interference from
reflections or standing waves are not influencing the sound waves.
Frequency Measured in hertz (Hz), the number of oscillations per second.
Hearing Detection of propagated vibratory energy. (Gans, 1992) In phase Doing the same thing at the same time. Particles in a
wave are in phase if they are in the same part of their cyclical oscillation. Acoustic pressure and sound particle motion can also be in or out of phase due to interference.
Interference Interaction between sound waves. Means rms particle motion cannot be calculated from rms sound pressure using the simple equations in Box 1. Happens when two or more coherent sound waves propagate in the same space at the same time. The forces of the different waves can interact to create elliptical particle movements and particle motion that is out of phase with sound pressure.
(Kuttruff, 2006)
Near field Region close to sound source where sound waves from different areas of the source can interfere with one another, or if from a point source, the wavefront is too curved to be approximated by a plane wave. Particle motion levels are higher relative to sound pressure levels in the near field than in the far field. Rule of thumb is that the near field is anywhere within one wavelength of the source.
Phase The phase is the fraction of the cycle of oscillation that the particle is going through (all the particles in a sound

36
wave are vibrating backwards and forwards repetitively and passing that motion onto the particles adjacent to them). See Figure 2.4.
Plane wave Wave whose wavefronts are infinite parallel planes of constant amplitude normal to the phase velocity vector.
Point source Sound source that is a pulsating sphere approximated to take up zero space
Power spectral density
Plot of power vs frequency. Frequency bin width depends on DFT length but amplitude levels normalised to 1 Hz
(Merchant et al., 2015)
Power spectrum Plot of power vs frequency. Frequency bin width and amplitude levels depend on DFT length.
(Merchant et al., 2015)
RMS Root-mean-square, used to average sound pressure or particle motion in time or frequency.
Sampling frequency (fs) the number of times a recorder samples the fluctuating voltage of your instrument per second.
Sine wave Pure tone. Frequency (number of oscillations per second) and amplitude (strength of the signal) are constant.
Sound Propagated vibratory energy. Mechanical longitudinal wave that travels in its medium by oscillation of its particles creating alternating compressions and rarefactions.
(Erbe, 2011)
Sound particle motion
Oscillatory movement of particles associated with a sound wave. Can be expressed as displacement, velocity, or acceleration and has a directional or vector component. NB there are many other particle movements that are not related to sound.
Spectrogram Three-dimensional plot of the spread of sound energy across frequency and time bins.
(Merchant et al., 2015)
Standing wave Type of sound wave that occurs when oblique or right-angle incident waves are reflected from a surface and reflected waves interfere with incident waves. Creates a particular type of interference where the maximum of the velocity/acceleration coincides with a minimum of the sound pressure and vice versa.
(Kuttruff, 2006)
Waveform Plot of amplitude vs time, could be of uncalibrated voltages or calibrated sound pressure or particle motion values.
(Merchant et al., 2015)
Wavefront Area in space containing adjacent particles of a medium which are all in the same phase of a sound wave.
Wavelength Distance between two particles that are in the same phase of the wave, one full oscillation apart. Depends on frequency and density and temperature of the medium.

37

38

39
Chapter 3: Impacts of predictable and unpredictable noise on the behaviour, growth and development of larval Atlantic cod (Gadus morhua)
This chapter is in review in ‘Proceedings of the Royal Society of London B’, with the following list of authors:
Sophie L. Nedelec, Stephen D. Simpson, Erica L. Morley, Brendan Nedelec, Andrew N. Radford
Authors contributions
SLN, SDS and ANR designed the study; SLN, EM and BN made acoustic recordings; SLN and BN
collected the data; SLN analysed and interpreted data with ANR; SLN wrote the manuscript and SDS,
EM and ANR helped to edit the manuscript.

40
3.1 Introduction Some anthropogenic (man-made) noise, such as that arising from traffic, resource extraction and
construction, is now recognised as a form of pollution both in air and underwater (Barber et al.,
2010; Slabbekoorn et al., 2010). An increasing number of studies have demonstrated that, from
individual behaviour and physiology up to community structure, a wide variety of species are
affected by noise (Slabbekoorn and Halfwerk, 2009; Kaiser et al., 2011). However, the majority of
experiments have examined the impact of short-term exposure (Francis and Barber, 2013; Morley et
al., 2014). Repeated and/or chronic exposure could alter how terrestrial and aquatic animals
respond to noise as a consequence of changes across time and cumulative effects (Bejder et al.,
2009; Blickley et al., 2012; Wale et al., 2013b). Recent evidence using brief (30 min) exposures also
indicates that different temporal patterns of noise may impact animals in different ways (Neo et al.,
2014), but long-term studies of how different noise patterns or ‘regimes’ may affect animals
differently are needed for more effective regulation of this global pollutant.
When exposure to any stressor (physical, chemical, or perceived) is repeated, animals could
either habituate (where responses diminish with repeat exposures due to increased tolerance) or
sensitise (where responses augment due to reduced tolerance) (Bejder et al., 2009). Shifts in
tolerance may be dependent on the intensity, duration and interval time of stressors (reviewed in
Barton, 2002). In humans, unwanted repetitive sound can become annoying and disrupt task
performance, especially if noise is unpredictable (reviewed in Cohen and Spacapan, 1984).
Predictability of noise does not affect cognitive impairment in rats (Prior, 2002), but stress responses
in fish can be influenced by predictability in other contexts; for example, predictable confinement
leads to a reduced cortisol (stress) response compared with unpredictable confinement in the cichlid
Oreochromis mossambicus (Galhardo et al., 2011). Knowledge about the impacts of predictable
compared with unpredictable noise is important in the context of regulation, because patterns of
activity could be altered to minimize effects of anthropogenic noise.
We examine how repeated exposure to predictable and unpredictable acoustic disturbance
(playback of recordings of ship noise) during rearing affects behaviour, growth and body-shape
development in larval Atlantic cod (Gadus morhua). Previous studies on impacts of anthropogenic
noise on aquatic organisms have focussed on behaviour and physiology (e.g. Picciulin et al., 2010;
Holles et al., 2013; Wale et al., 2013a,b; Simpson et al., 2015) with changes during development
understudied. Young animals may be most vulnerable due to reduced ability to move away from
sources of noise. Noise has been shown to cause body malformations and delay development in
scallop embryos (Aguilar de Soto et al., 2013), impair survival of embryos and the growth of larvae in
fish (Banner and Hyatt, 1973), and compromise embryonic development and larval survival in sea

41
hares (Nedelec et al., 2014). Effects on survival during early life stages when natural mortality is high
can result in greater population fluctuations than impacts at the adult stage (Armsworth, 2002;
Gagliano et al., 2007; Victor, 1983), and survival through developmental stages is a key driver of
population dynamics.
Due to their socio-economic importance and the vulnerability of many species to
anthropogenic pressures such as overfishing and climate change (Harley et al., 2006; Simpson et al.,
2011a), fish are an important taxon to consider with respect to acoustic noise. All fish detect sound,
often possessing specialised auditory apparatus, and thus are exposed to underwater anthropogenic
noise including ships across the globe (Popper, 2003; Bleckmann, 2004). Mounting evidence shows
that at least some fish species can be negatively impacted by noise (e.g. Picciulin et al., 2010; Holles
et al., 2013; Hawkins, 2014; Simpson et al., 2015), but whether these effects persist with repeated
exposure is unknown. We studied Atlantic cod because of their auditory ability (Chapman and
Hawkins, 1973), high socioeconomic value, vulnerability to overfishing, and north Atlantic
distribution that overlaps with one of the busiest shipping areas in the world (Sobel, 1996; Kaluza et
al., 2010).
We reared cod from hatching in three different noise regimes: continuous playback of
ambient harbour noise; predictable additional noise (continuous playback of ambient harbour noise
plus recordings of ships passing through the harbour played back in a regular pattern); and
unpredictable additional noise (continuous playback of ambient harbour noise plus the same
recordings of ships played back in a random pattern). We predicted that exposure to additional
noise during rearing would reduce growth, increase yolk sac use and reduce body width–length ratio
(condition indicator), and that these responses would be lessened by habituation when noise
exposure during rearing was predictable but not when unpredictable. We also predicted that short-
term exposure to additional noise would lead to increased startles and reduced predator-avoidance
behaviour, with these behavioural responses lessened by habituation in fish that had been reared
while exposed to predictable additional noise compared with fish reared in control conditions.
3.2 Materials and Methods Work was carried at Ardtoe Marine Laboratories, Acharacle, West Highlands, Scotland. Twelve tanks
were allocated randomly across the three treatments (control ambient noise (‘A’), predictable
additional noise (‘P’), unpredictable additional noise (‘U’)). Hatching-stage eggs from four separate
batches obtained from broodstock were allocated to treatments in the most balanced way possible
(given a stocking density of 7000 eggs per tank): one batch was split between two treatments (A, P);
two batches were split between all three treatments (A, P, U); and the final batch was split between
42
the remaining four tanks (A, P, U, U). There were thus four replicate tanks for each of the three
rearing treatments.
3.2.1 Cod rearing protocol Egg collection and egg and larval rearing followed standard procedures adopted at the Viking Fish
Farms for cod. Fertilised eggs were collected in April 2012 from 10 female and six male adult Atlantic
cod (F2 hatchery-reared brood stock) that were housed at ambient temperature and photoperiod in
a cylindrical tank of diameter 5.3 m and depth 3 m, supplied with filtered sea water pumped from
the ocean. Eggs were collected at 15:00 each day and checked for developmental stage under the
microscope to ensure eggs were developing synchronously; cod generally spawn in the middle of the
night (Engen and Folstad, 1999), thus more than 98% of eggs collected were stage 2 (12–24 h post
fertilisation, with ‘many cells’). Eggs were disinfected with Sorgene-5 (2 ml per litre) for 45 s to
remove any pathogens accumulated in egg collectors before incubation. All eggs collected on a given
day were defined as one ‘batch’. Each batch was incubated in a separate 80 L conical tank with
gentle aeration and continuous water flow to maintain an even distribution of eggs in the water
column, as is common with pelagic marine fish egg aquaculture (Brown et al., 2003). Incubation
temperatures were 9.0–10.3°C (within the optimal range for survival – Brown et al., 2003); salinity
was 34–35 ppt (shown to give the highest hatching success – Brown et al., 2003); and eggs were
incubated in darkness.
Cod were not exposed to noise as part of the experiment until they hatched as larvae, but
each batch of eggs was measured throughout the egg phase to avoid potential differences due to
egg quality. The quality was measured immediately after collection as the total weight of all live
(floating) eggs, the ratio of live to dead (sinking) eggs, and egg size and fertilisation rate. Egg quality
was also monitored during incubation by the estimated weight of live eggs remaining, based on the
weight of dead eggs cleaned from the bottom of the tank each day. The highest quality batches of
eggs available at the time of stocking (as defined by large batches with the best survival, with
fertilized eggs of consistent large size) were selected for the rearing experiments. The
developmental stages of eggs were monitored by daily examination of a sub-sample under the
microscope. Eggs reached the final stage of embryonic development prior to hatching after 75
degree days (number of days post fertilisation x temperature in °C), at which point the number of
eggs was estimated from counting the number of eggs in five 60-ml sub-samples. Eggs were
disinfected for a second time with Sorgene-5 (2 ml per litre) for 45 s before dividing eggs into one of
12 100-L experimental tanks at 70 eggs per litre.

43
Once eggs were in the rearing tanks, water flow to bins was set at 0.1 litres per min, air flow
was stopped until all eggs had hatched (day 0 post-hatching) to allow eggs to float at the surface.
Eggs that did not hatch and died sank to the bottom of the tank and were siphoned out and
weighed. Approx. 50% of eggs in the same batch in all cases hatched overnight on the first night in
the bin, playback started the following morning; in all cases, the remaining 50% of eggs hatched or
died over the following 48 h. Once all eggs had hatched, water flow was reduced to 0.05 litres per
min and 500 ml of algae (Dunalliella sp.) was added to increase the opacity of the water and provide
a food source for the cod larvae and their rotifer prey (Sherwood, pers. comm.). This did not differ
between treatments. A 12:12 photoperiod was provided with an identical light source above each
bin. At day 1 post-hatching, ca. 1 million rotifers fed with commercially available enrichment
(Multigain or Ori green) were added to each bin. Following this, ca. 1 million rotifers and 500 ml of
algae were added to each bin daily. Aeration ensured a uniform distribution of prey, and skimmers
removed oil and debris from the surface of the water once the larvae were no longer floating at the
surface (between 2 and 5 days post-hatching). At day 10 post-hatching, water flow was increased to
0.1 litres per min. The temperature was 9.7–11.6°C and salinity was 34–35 ppt.
3.2.2 Ship and ambient noise recordings Recordings were made of 12 different ships, fishing vessels and a tug (hereafter referred to as
‘ships’) in Peterhead and Southampton, UK (see Table 3.1 for details). Recordings in Peterhead were
made using an accelerometer (M30, sensitivity frequency dependent between 0.1 and 3 kHz
(calibrated by manufacturers), Geospectrum Technologies, Dartmouth, Canada) and an
omnidirectional hydrophone (HTI-96-MIN, sensitivity -164.3 dB re 1 V/μPa; frequency range 0.002–
30 kHz, High Tech Inc., Gulfport MS) connected to a fully calibrated solid-state recorder (PCM-M10,
44.1 kHz sampling rate, Sony Corporation, Tokyo, Japan; recording level calibrated using pure sine
wave signals from a function generator with a measured voltage recorded in line with an
oscilloscope). The accelerometer and hydrophone were positioned at a depth of 5 m in water 10–12
m deep, close to the entrance to the harbour, where ships passed at 150–250 m at a speed of 9
knots. Recordings in Southampton were made using an omnidirectional hydrophone (Bruel & Kjaer
8103, sensitivity -174.0 dB re 1 V/μPa; frequency range: 0.01 – 180 kHz). The hydrophone was
positioned at a depth of 4–8 m in water 8–16 m deep, 20–40 m from the shore. Ships took 15 min to
pass, thus each ship recording contains an approach, pass and departure of a vessel where
maximum amplitude occurred around 7.5 min. Ambient noise was also recorded at each location
under the same recording conditions when no boats or ships were passing.

44
Table 3.1 Details of ships recorded for use in playback experiments.
Ship Date recorded
Port Location Weight (t)
Length
(m)
Breadth
(m)
Year built
Kyoto Express
04/04/08
Southampton 50° 54’ 11” N
1° 26' 23’’ W
103800 334 42 2005
Vega Stockholm
04/04/08 8306 129 21 2006
Verlaine 14/04/08 2893 114 13 1980
Bibby Topaz + Tug Blue Toon
31/03/12
Peterhead 57° 29’ 47” N
1° 46’ 32” W
5337 105 20 2007
Troms Capella
31/03/12 4800 88 19 2011
Grampian Talisman
31/03/12 3890 73 17 2007
Rockwater 1 + 2 fishing boats
01/04/12 1530 98 18 1983
Skandi Skansen
01/04/12 4982 109 24 2011
Northern Pioneer
31/03/12
UP Jasper 31/03/12 4900 87 19 2011
Aspen 01/04/12 3159 83 12 2000
Vest Viking (fishing boat)
01/04/12 63 13
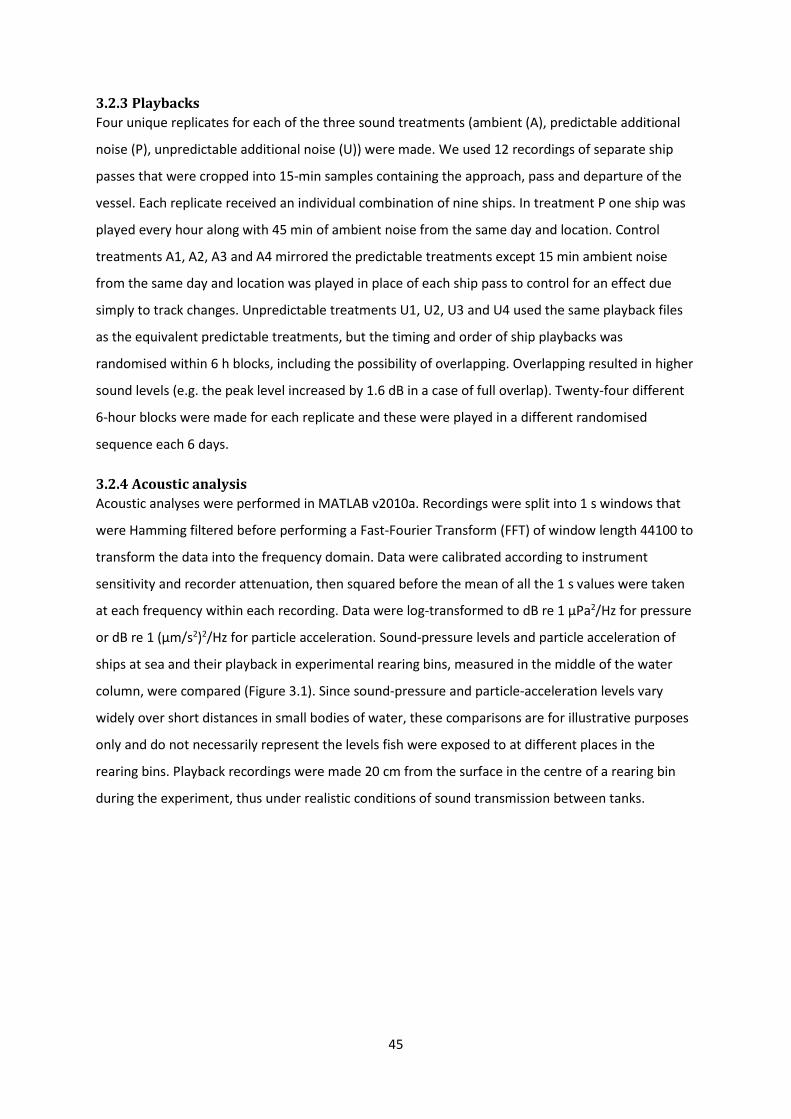
45
3.2.3 Playbacks Four unique replicates for each of the three sound treatments (ambient (A), predictable additional
noise (P), unpredictable additional noise (U)) were made. We used 12 recordings of separate ship
passes that were cropped into 15-min samples containing the approach, pass and departure of the
vessel. Each replicate received an individual combination of nine ships. In treatment P one ship was
played every hour along with 45 min of ambient noise from the same day and location. Control
treatments A1, A2, A3 and A4 mirrored the predictable treatments except 15 min ambient noise
from the same day and location was played in place of each ship pass to control for an effect due
simply to track changes. Unpredictable treatments U1, U2, U3 and U4 used the same playback files
as the equivalent predictable treatments, but the timing and order of ship playbacks was
randomised within 6 h blocks, including the possibility of overlapping. Overlapping resulted in higher
sound levels (e.g. the peak level increased by 1.6 dB in a case of full overlap). Twenty-four different
6-hour blocks were made for each replicate and these were played in a different randomised
sequence each 6 days.
3.2.4 Acoustic analysis Acoustic analyses were performed in MATLAB v2010a. Recordings were split into 1 s windows that
were Hamming filtered before performing a Fast-Fourier Transform (FFT) of window length 44100 to
transform the data into the frequency domain. Data were calibrated according to instrument
sensitivity and recorder attenuation, then squared before the mean of all the 1 s values were taken
at each frequency within each recording. Data were log-transformed to dB re 1 µPa2/Hz for pressure
or dB re 1 (µm/s2)2/Hz for particle acceleration. Sound-pressure levels and particle acceleration of
ships at sea and their playback in experimental rearing bins, measured in the middle of the water
column, were compared (Figure 3.1). Since sound-pressure and particle-acceleration levels vary
widely over short distances in small bodies of water, these comparisons are for illustrative purposes
only and do not necessarily represent the levels fish were exposed to at different places in the
rearing bins. Playback recordings were made 20 cm from the surface in the centre of a rearing bin
during the experiment, thus under realistic conditions of sound transmission between tanks.

46
Figure 3.1 Power spectral density of (a) sound-pressure level and (b) monoaxial particle acceleration of recordings of a ship (10s) and ambient noise (60s), plus their playback in a rearing bin. Window length = 44100. Sound pressure levels of ship and ambient playbacks match original recordings better than particle motion levels; particle motion levels increase with decreasing frequency in playbacks relative to original recordings due to near field effects. However, the most important thing to note is that ship noise playback is always louder than ambient noise playback, and that the difference in level between ship and ambient noise is maintained in playbacks. Some harmonic structure was present in some recordings; this is an artefact of recording via a laptop.
3.2.5 Experimental setup Experimental tanks were 100-L black plastic bins, diameter 42 cm at the base sloping to 50 cm at the
top. Bins were 80 cm tall and were filled with mechanically and UV filtered seawater at ambient
temperature to 60–65 cm. Bins were 81 cm apart within three rows of four, and rows were 134 cm
apart. Bins were stood on wooden stands on soundproof matting on a concrete floor to minimise
sound transmission into tanks (confirmed by sound recordings; Figure 3.1). Temperature was
monitored at least daily and maintained at 9.7–11.6°C with no bias between temperature and
treatment (in a two-way ANOVA including days and degree days as factors, effect of chronic noise
treatment: F2,30 = 0.8, p = 0.924). An underwater loudspeaker (UW-30, frequency response 0.1–10
kHz, University Sound, Whitehall, Ohio, USA) was mounted, facing upwards, in the bottom of each
bin. Playbacks were from mp3 players (Mini Clip, TopTechDirect, UK) via 40 W amplifiers (Kemo
Electronic, Germany).
Sound exposure began 6 h after all live eggs hatched (eggs from the same batch in all cases
hatched overnight within 12 h; playback started the following morning) and continued 24 h per day
until the end of the experiment (after sampling at 16 days post-hatching). We refer here to ‘playback
of ambient noise’ and ‘playback of ship noise’ to mean introduction of sound using acoustic
recordings of ambient noise and ship noise via loudspeakers. The sound exposures we used were:
ambient control (playback of ambient noise 24 h per day); predictable additional noise (playback of
ambient noise with one 15-min ship pass per hour); and unpredictable additional noise (playback of

47
ambient noise with six 15-min ship passes every 6 h at random times, allowing for overlapping). The
‘traffic exposure’ for predictable and unpredictable treatments was thus the same over any 6 h
period. Figure 3.1 shows example sound-pressure and particle-acceleration levels in rearing tanks.
Four different replicates of each sound treatment were used (one per tank).
3.2.6 Startle response at 12 h post-hatching Preliminary observations revealed that newly hatched fish were either still or startling (rapid
contractions of muscles causing body curvature) and that they ‘settled’ (when the startle responses
reached a stable baseline rate of 1–2 per min) within 2 min of disturbance (after introduction to the
arena and after acoustic disturbance). A repeated-measures experiment was conducted to test how
individual fish (six from each rearing tank) responded to short-term exposure to an additional-noise
track or a matching ambient-noise control track (originating from the same harbour). Each fish
(measuring ~ 5 mm) was introduced to the experimental arena (a Petri dish containing new water
for each trial, with opaque bottom and sides suspended 10 cm above a loudspeaker in a bucket of
water 25 cm deep), allowed to settle for 2 min, and then exposed to one of the playback tracks.
After 2 min re-settling time, the fish received the second playback track. During treatments, the
number of startles was counted. All observations were made by S.L.N. who was blind to the rearing
condition of fish. Five different additional-noise and control tracks were used and the order of
treatments was balanced. Sound-pressure levels of additional-noise and control playbacks were
measured (Figure 3.2); due to the size of the experimental arena, it was not possible to measure
particle acceleration.
Figure 3.2 Sound-pressure levels of ship, ocean ambient noise and their playback in the startle-response experimental arena. Window length = 44100.

48
3.2.7 Growth: use of yolk sac, size-at-age and body width–length ratio Photographs were taken of 10 fish from each rearing bin at 1 day post-hatching (dph; before first
feed), 2 dph (after first feed) and 16 dph, under a microscope with 10 mm graticule connected to a
digital camera. One bin from each treatment could not be sampled at day 16 due to low survival. It
was not possible to make measurements from all photographs due to difficulties positioning the
fragile larvae under the microscope; only photographs with good enough larval positioning were
used (at least 5 from each bin). The maximum length and width measures of the yolk sac were
digitised using four landmarks via TpsDig software (Rohlf, 2001). Yolk sac centroid size (a metric of
size calculated as the square-root of the sum of squared distances of individual landmarks from the
centroid of the landmark configuration – Bookstein, 1991) was determined using TpsRelw (Rohlf,
2010). Body length was digitised using six landmarks from the tip of the top lip to the base of the tail,
and myotome length was digitised in TpsDig and PAST (Rohlf, 2010) by two landmarks either side of
the myotome at the position of the anus (Figure 3.3). Myotome length is a measure of the amount of
muscle on the fish. Body width–length ratio was calculated as myotome length divided by body
length.
Figure 3.3 Landmarks digitising yolk sac (1–4), body length (5–10) and myotome length (11–12).
3.2.8 Anti-predator response at 16 days post-hatching We developed an independent-measures anti-predator response experiment, whereby flight
behaviour was assessed in response to attempts to catch the fish using a pipette (the same method
used for transferring fish). We used the same arena as for the startle-response experiment. Ten
individuals from each rearing tank were tested, and on transfer to the arena were initially allowed to
settle for 4 min during which time ‘flight responses’ (swimming rapidly in any direction) ceased in all
cases within the first 2 min. Fish were then exposed to 3-min playback of either a control (ambient
harbour) track or an additional-noise (ship recording) track, the order of which (between fish) was
randomised and controlled by an assistant. After 3 min of playback, the fish was approached with a 1
ml pipette from behind and chased until it was caught in the pipette. The response measure was
thus ‘time-to-catch’. All pipette manipulations were made by S.L.N. who was blind to the rearing

49
condition of the fish and “blind” to the test sound treatment due to masking by music through
earphones (see also Simpson et al., 2015). Sound-pressure levels of recordings of control and
additional-noise conditions in the experimental arena were measured (Figure 3.4).
Figure 3.4 Sound-pressure levels of a ship, ocean ambient noise and their playbacks in the anti-predator experimental arena. Window length = 44100.
3.2.9 Statistical methods General linear mixed effects models (LMM) fit by maximum likelihood (Laplace approximation) were
used, where distributions of data allowed sufficiently good model fit (after log transformation to
meet the assumption of normality where necessary), to test for the effects of noise treatment while
controlling for the random effects of rearing bin and batch. Any effects such as slight temperature
variations between bins were controlled for by the statistical models. The variance caused by and
standard deviation of the variance for each random effect are presented alongside the results of
models. To establish the best-fitting model, terms were eliminated one by one from a maximal
model. Simplified models were compared with more complex ones using maximum likelihood ratio
tests that employ chi-square statistics to establish whether a simpler model is significantly worse at
explaining the data than a more complex one. If a simpler model is not significantly worse when a
term is removed, the simpler model is better and thus the term is dropped. If a simpler model is
significantly worse, the term is maintained in the model (Meyer, 1991). The degrees of freedom
from maximum likelihood tests presented in the Results are the difference between the degrees of
freedom of the simpler and the more complex models. All potential interactions of fixed effects were
examined and are only presented where their exclusion from the model made the model
significantly worse at explaining the data at the level p < 0.10. In the case where interaction terms

50
were included in the best model, planned contrasts were conducted using Markov Chain Monte
Carlo methods. Z tests were used for post-hoc tests where the sample size was large (> 20); t tests
were used where the sample size was small (< 20). Effect sizes are given with standard errors.
Rearing noise treatment (A,P,U), short-term playback (control, additional noise) and days post-
hatching were included as fixed effects.
Startle response data were distributed in a way that precluded general or generalized linear
mixed effects models fitting the data well. In this case, a Wilcoxon signed ranks test was used to test
the effect of short-term playback on the number of startles made by an individual. An ANOVA was
used to test the effect of rearing noise treatment on the log transformed difference in the number of
startles in ambient versus ship-noise playback within individual fish. All statistics were performed in
R version 3.0.1.
3.3 Results
3.3.1 Startle response at 12 h post-hatching Cod larvae startled significantly more often (a median of 4.5 more startles in a 2 min period) when
exposed to short-term additional noise compared to a control playback (Wilcoxon test: W = 758.5, n
= 52, p < 0.001; Figure 3.5). The startle responses began at the onset of experimental additional
noise and continued intermittently throughout the 2 min of playback. There was no significant effect
of rearing noise treatment on the difference between the number of startles in the two short-term
playback trials (ANOVA: F2,49 = 1.49, p = 0.235; Figure 3.6).
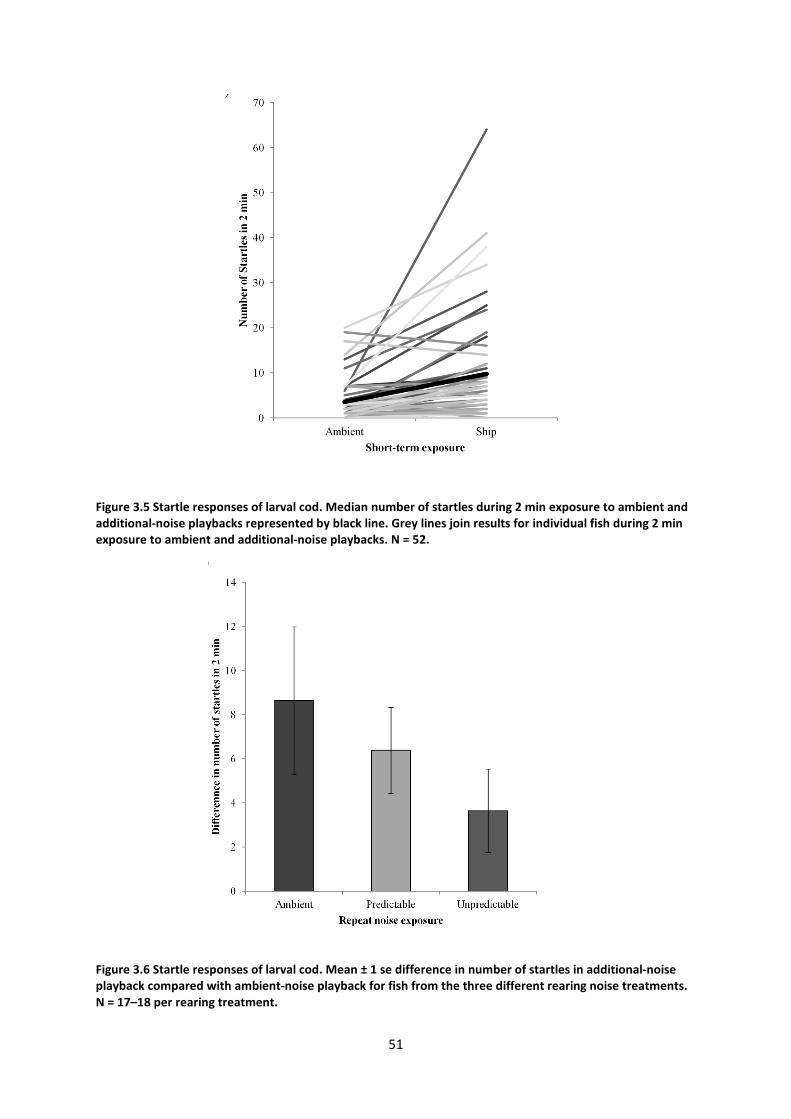
51
Figure 3.5 Startle responses of larval cod. Median number of startles during 2 min exposure to ambient and additional-noise playbacks represented by black line. Grey lines join results for individual fish during 2 min exposure to ambient and additional-noise playbacks. N = 52.
Figure 3.6 Startle responses of larval cod. Mean ± 1 se difference in number of startles in additional-noise playback compared with ambient-noise playback for fish from the three different rearing noise treatments. N = 17–18 per rearing treatment.

52
3.3.2 Use of yolk sac After controlling for effects of rearing bin (LMM: variance = 0.002, standard deviation = 0.048) and
batch (variance = 0.004, standard deviation = 0.059), yolk sac centroid size was significantly affected
by the interaction between rearing noise treatment and days post-hatching (dph) (χ22 = 31.40, p <
0.001; rearing noise treatment: χ21 = 3.27, p = 0.195; dph: χ2
1 = 179.14, p < 0.001; N = 25–35 per
treatment/day combination; Figure 3.7). Overall, yolk sacs decreased in size between days 1 and 2
by 0.128 ± 0.022, but fish reared with predictable additional noise had yolk sacs at day 2 that were
smaller than those in the control (t test: t232 = 3.53, p = 0.001; effect size = 0.148, standard error (se)
= 0.042) and unpredictable (t232 = 2.31, p = 0.021; effect size = 0.094, se = 0.041) treatments; yolk
sacs in unpredictable and control treatments were not significantly different in size at day 2 (t232 =
1.30, p = 0.194; effect size = 0.054, se = 0.041).
Figure 3.7 Mean ± 1 se yolk sac centroid size (unitless measure) at 1 and 2 days post-hatching.

53
3.3.3 Size-at-age After controlling for bin (LMM: variance < 0.001, standard deviation < 0.001) and batch (variance <
0.001, standard deviation < 0.001), there was a significant interaction between rearing noise
treatment and dph on size-at-age (χ24 = 10.56, p = 0.032; rearing noise treatment: χ2
2 = 4.86, p =
0.089; dph: χ22 = 51.30, p < 0.01; N = 19–35 per treatment/day combination). Fish from all three
rearing conditions grew during the 16-day experiment (Figure 3.8), but at 2 dph, fish from the
control treatment were longer than those from both predictable and unpredictable noise
treatments, which did not differ significantly from one another (Table 3.2). There was no significant
difference between lengths of fish from different rearing noise treatments at day 16 (Table 3.2).
Figure 3.8 Mean ± 1 se body length at 1, 2 and 16 days post-hatching.
Table 3.2 Planned contrasts for post-hoc testing of the effect of the interaction between rearing noise treatment and days post-hatching on body length. A = Control, P = Predictable, U = Unpredictable. Significant results are shown in bold.
Days Post-hatching
Rearing Noise Treatments Estimate
Standard Error t value
Degrees of Freedom p
1 A x P -0.07 0.21 -0.32 250 0.746 1 A x U 0.09 0.21 0.41 250 0.680 1 P x U 0.15 0.20 0.76 250 0.447 2 A x P 0.00 0.20 0.01 250 0.990 2 A x U 0.54 0.20 2.68 250 0.008 2 P x U 0.54 0.20 2.68 250 0.008
16 A x P 0.01 0.22 0.04 250 0.972 16 A x U 0.35 0.22 1.58 250 0.114 16 P x U 0.34 0.22 1.55 250 0.123

54
3.3.4 Body width–length ratio After controlling for bin (LMM: variance < 0.001, standard deviation = 0.002) and batch (variance <
0.001, standard deviation = 0.001), there was a non-significant trend for an effect of the interaction
between rearing noise treatment and dph on body width–length ratio (χ24 = 7.83, p = 0.098; rearing
noise treatment: χ22 = 0.22, p = 0.898; dph: χ2
2 = 87.15, p < 0.001; N = 21–35 per treatment/day
combination; Figure 3.9). Overall, width–length ratio declined during the course of the experiment,
but the greatest decline was in fish from the predictable noise treatment at 16 dph (t265 = -1.98, p =
0.049; Table 3.3). There was no significant difference in width–length ratio between fish from
different rearing noise treatments at day 2 (Table 3.3).
Figure 3.9 Mean ± 1 se body width–length ratio (myotome length/body length) at days 1, 2 and 16 post-hatching. N = 19–35 per treatment/day combination.
Table 3.3 Planned contrasts for post-hoc testing of the effect of the interaction between rearing noise treatment and days post-hatching on body width–length ratio. A = Control, P = Predictable, U = Unpredictable. Significant results are shown in bold.
Days Post-hatching
Rearing Noise Treatments Estimate
Standard Error t value
Degrees of Freedom p
1 A x P -2.59 x 10⁻⁴ 1.97 x 10⁻³ -0.13 265 0.895 1 A x U 5.41 x 10⁻⁴ 2.01 x 10⁻³ 0.27 265 0.788 1 P x U 8.00 x 10⁻⁴ 2.01 x 10⁻³ 0.40 265 0.691 2 A x P 1.47 x 10⁻³ 1.99 x 10⁻³ 0.74 265 0.459 2 A x U 9.89 x 10⁻⁴ 2.00 x 10⁻³ 0.49 265 0.621 2 P x U -4.84 x 10⁻⁴ 1.99 x 10⁻³ -0.24 265 0.808
16 A x P -4.35 x 10⁻³ 2.20 x 10⁻³ -1.98 265 0.049 16 A x U -3.04 x 10⁻³ 2.25 x 10⁻³ -1.35 265 0.178 16 P x U 1.31 x 10⁻³ 2.18 x 10⁻³ 0.60 265 0.547

55
3.3.5 Anti-predator response at 16 days post-hatching After controlling for bin (LMM: variance = 0, standard deviation = 0) and batch (variance = 0.005,
standard deviation = 0.070), there was a strong, but non-significant, trend towards an effect of
short-term noise exposure on time to catch (χ21 = 3.40, p = 0.065; Figure 3.10). Fish took 0.17 ± 0.09 s
longer to be caught during additional-noise playback compared to ambient-noise playback. Rearing
noise treatment did not significantly affect time to capture (χ22 = 0.65, p = 0.724). We investigated
the relationship between noise, morphology and behaviour post-hoc and found that width–length
ratio had a significant effect on time to catch (χ21 = 14.05, p < 0.001, N = 13–17 per rearing
treatment/short-term noise treatment combination; Figure 3.10). An increase in width–length ratio
of 0.1 meant fish took 0.9 ± 0.8 s longer to be caught.
Figure 3.10 Time to catch fish with a pipette depending on body width–length ratio. Data points are coded according to rearing noise treatment (shape) and short-term noise exposure (colour). N = 13–17 per rearing treatment/short-term noise treatment combination.
All data are available at doi:10.5061/dryad.qq7mr.

56
3.4 Discussion Exposure to additional acoustic noise affected larval cod behaviour, growth and development. Short-
term exposure caused startle responses in newly hatched larvae from all three rearing conditions.
Two days of additional noise of both predictable and unpredictable regimes reduced growth, while
predictable noise led to faster yolk sac use compared to ambient-noise or unpredictable-noise-
reared fish. After 16 days, growth of fish from all three rearing conditions converged, although fish
exposed to predictable noise had lower body width–length ratios. Larvae that had a lower body
width–length ratio were easier to catch in a predator-avoidance experiment. Although noise regime
during rearing did not directly affect the behaviours measured, predictable noise could impact larval
cod survival via an indirect effect on body development. Other studies have found mixed results on
effects of noise on growth in fish (Banner and Hyatt, 1973; Wysocki et al., 2007; Davidson et al.,
2009; Bruintjes and Radford, 2014). We provide the first evidence of an effect of anthropogenic
noise on larval yolk sac use. Moreover, we demonstrate that noise regime can affect impacts (see
also Neo et al., 2014). Our results were contrary to our hypothesis that an unpredictable regime
would be worse than a predictable one, as was found in relation to other stressors in fish (Galhardo
et al., 2011); rather, predictable noise was more disturbing than unpredictable noise.
Newly hatched fish startled more often during additional noise than controls in the short-
term. Noise-induced startle responses have been reported in adult fish by other researchers (e.g.
Kastelein et al., 2008; Purser and Radford, 2011). Six hours prior exposure to predictable or
unpredictable noise did not affect the tolerance of larvae to noise in the short-term experiment,
suggesting neither habituation nor sensitisation. As noise is not a direct threat of predation, startling
during noise with failure to habituate may incur energetic costs to larvae without any associated
fitness benefits.
Larvae exposed to predictable and unpredictable noise grew less between days one and two
than ambient controls but growth caught up by day 16. Banner and Hyatt (1973) found that fish
larvae exposed to higher noise levels grew less in the first 12 days post-hatching, while Bruintjes and
Radford (2014) found that noise did not impact larval fish length or weight after four weeks post-
hatch. Similarly, Davidson et al. (2009) found that higher noise levels reduced juvenile growth in the
first month followed by catch-up growth, resulting in no difference after five months. Stunted initial
growth could be an indicator that noise is a stressor (Barton, 2002). Subsequent catch-up growth
could lead to lower lifetime fitness due to oxidative stress, as has been previously shown in fish (Lee
et al., 2013).

57
Larvae exposed to predictable noise used their yolk sacs faster after two days of exposure
and had a lower body width–length ratio after 16 days post-hatching compared to those raised in
ambient or unpredictable noise. Lower body width–length ratio suggests less muscle per body size.
Predictable noise may lead to a shift in resource allocation from maintenance of reserves to chronic
activation of the adrenal system, incurring an allostatic load (McEwen and Stellar, 1993).
Alternatively, larvae may have perceived additional noise as a source of risk, diverting attention
towards risk detection and avoidance, reducing foraging efficiency (Purser and Radford, 2011). After
exposure to a source of risk, animals are likely to return gradually, rather than immediately, to a
situation where the risk is no longer perceived as relevant (Higginson et al., 2012). While immediate
behavioural responses such as startles may quickly return to baseline levels, foraging behaviour is
likely to have a longer latency for recovery. It is therefore possible that the time intervals between
predictable additional-noise events (45 min) did not allow sufficient time for recovery of foraging
behaviour to compensate for the energetic costs when foraging was disrupted. This may have led to
a cumulative stress response (Schreck, 2000).
There was a trend towards short-term playback of additional noise leading to fish taking
longer to catch, which contrasts previous results showing the impacts of noise on predator
avoidance behaviour in eels (Simpson et al., 2015). Simpson et al. (2015) found that eels were caught
twice as quickly by a ‘pursuit predator’ (handnet) when exposed to playbacks of ship noise compared
to playbacks of ambient harbour noise. However, this effect was less strong than the effect of body
width-length ratio. Larvae with lower body width–length ratios were caught faster in the predator-
avoidance experiment. We did not find a direct effect of rearing noise treatment on time-to-catch,
but our results suggest that predictable noise exposure could indirectly affect survival via an effect
on body width–length ratio. An effect on survival at this early life-history stage, even if subtle, may
have consequences for population dynamics because high mortality of the early stages means that
small changes in selective mortality have a substantial influence on population fluctuations
(Armsworth, 2002; Gagliano et al., 2007; Victor, 1983).
Fish larvae in our experiment were exposed to the same number of additional acoustic noise
incidences on average (six every 6 h), but the predictable regime had a stronger effect than the
unpredictable regime. The unpredictable treatment included both shorter and longer time intervals
than the predictable disturbance. We hypothesise that shorter time intervals during the
unpredictable disturbance had no further impact, while longer time intervals during unpredictable
disturbance allowed compensation and/or habituation (many species of fish show their highest
plasma cortisol levels within 0.5-1 h after a stressful disturbance – Barton, 2002). It is also possible

58
that the greater intensity of sound occurring when two additional-noise incidences overlapped in
time had no further impact, while the reduction in total time of additional-noise exposure brought
about by such overlaps contributed to the longer time intervals allowing compensation and/or
habituation. Therefore, further work could potentially reveal that predictable disturbance with
longer time intervals between exposures than in this experiment may result in reduced effects on
yolk sac use, growth and development.
We used underwater loudspeakers to expose the larvae to noise in tanks and this is not fully
representative of anthropogenic noise in natural settings; due to proximity to the sound source, the
particle motion component of the sound was higher than would be expected for comparable
pressures in natural conditions where ships were passing. Interference of sound waves due to
reflections from tank boundaries and the frequency response of speakers also meant that some
frequencies were comparatively louder or quieter than would be expected of real ship or ambient
harbour noise. It should also be noted that the acoustic conditions in the Petri dish experiments
would be different from those in rearing tanks (for instance, particle motion would be higher). The
importance of our experiments is that they demonstrate the potential for predictable and
unpredictable acoustic disturbances to have different effects, even when the number of ship passes
in playbacks was carefully controlled. Thus, the use of laboratory conditions allowed us to test for
specific effects of disturbance predictability by controlling for potential confounding factors
(Simpson et al., 2015); future work will need to examine how wild fish respond to real-world noise
sources in natural conditions. Taken together, our findings reveal that noise can have effects on fish
that extend beyond immediate impacts and are dependent on exposure regime. These results
therefore have important wider implications for research on the impacts of anthropogenic
disturbances on animals.

59

60

61
Chapter 4: Increased tolerance to anthropogenic noise playback in a coral reef fish, the threespot Dascyllus (Dascyllus trimaculatus)
A modified version of this chapter will be submitted to ‘Ecology’ for publication.

62
4.1 Introduction Anthropogenic (man-made) noise is now a globally recognised pollutant. As well as featuring in
national and international legislation (e.g. the European Commission Marine Strategy Framework
Directive and the United States National Environmental Policy Act), mounting evidence shows that
anthropogenic noise can impact behaviour and physiology in a broad range of taxa (Barber et al.,
2010; Slabbekoorn et al., 2010; Morley et al., 2014). However, response variables in the majority of
studies are only measured once and only after relatively short-term noise exposure. There is some
evidence that on-going exposure to anthropogenic noise can impact animals (Barber et al., 2010;
Blickley et al., 2012; Crino et al., 2013), yet there are few studies that investigate how responses may
change over time (although see, for exception, Wale et al., 2013b). This is an important
consideration in the context of regulation, because human disturbance of natural habitats is
becoming more frequent and the pervasive nature of anthropogenic noise means that animals are
likely to be exposed multiple times during their lifetime.
Research in other fields reveals that animal responses to various stimuli can change over
time with repeat exposures (Bejder et al., 2009). Responses may be heightened (reduced tolerance);
one explanation for which could be sensitisation (Richardson et al., 1995). For example, yellow-eyed
penguins (Megadyptes antipodes) from areas of greater human disturbance show higher baseline
corticosterone levels (Ellenberg et al., 2007). Alternatively, responses could be attenuated (increased
tolerance); one explanation for which could be habituation (Thorpe, 1963). For example, male white-
crowned sparrows (Zonotrichia leucophrys) in breeding pairs decreased several behavioural
responses (song and flight) with repetition of playbacks of conspecifics (Petrinovich and Patterson,
1979). If animals continue to respond to stimuli they could become chronically stressed (Cyr and
Romero, 2009), with potential downstream effects on growth and condition (Anderson et al., 2011).
If an animal habituates fully to a stressor, baseline cortisol concentration, behaviour and health will
be the same as unstressed animals (Cyr and Romero, 2009). Experimental data with repeat measures
from the same individuals over time are lacking in field studies of anthropogenic noise, so whether
animals are able to habituate to anthropogenic noise is unknown.
We used a field-based experiment on a coral reef fish to investigate the effects of repeated
exposure to playback of motorboat noise over three weeks. Fish are socio-economically important
yet many species are vulnerable to anthropogenic pressures such as overfishing and climate change
(Harley et al., 2006; Simpson et al., 2011a). All fish detect sound, often possessing specialised
auditory apparatus, and are exposed to underwater noise across the globe (Popper, 2003;
Bleckmann, 2004). There is increasing evidence that at least some fish species can be affected by
anthropogenic noise, including behavioural changes such as foraging, nest caring and predator

63
avoidance (Picciulin et al., 2010; Bruintjes and Radford, 2013; Simpson et al., 2015), and
physiological changes such as increases in plasma cortisol concentrations, oxygen consumption and
ventilation (opercular beat rate) (Wysocki et al., 2006; Anderson et al., 2011; Simpson et al., 2015).
However, the majority of studies on the impacts of noise have focused on short-term responses. The
few that have conducted longer term experiments have been conducted in tanks (Davidson et al.,
2009; Anderson et al., 2011; Bruintjes and Radford, 2014).
While tanks offer certain benefits, such as greater control over environmental variables, the
acoustics of small tanks mean that relevant sound exposure levels are very difficult to measure and
control (Parvulescu, 1967). Ideally, therefore, studies on the impacts of anthropogenic noise on fish
should be conducted in field conditions. Coral reefs are also socio-economically important yet
vulnerable to anthropogenic change (Wilkinson, 1996). Moreover, they offer ideal opportunities for
detailed studies of fish in their natural environment because many species in such habitats occupy
permanent, small territories in shallow water with high visibility. Wherever humans inhabit coastal
waters, small boats provide a ubiquitous source of anthropogenic disturbance, including generation
of additional noise (Whitfield and Becker, 2014).
In this study, we exposed juvenile coral reef fish to playbacks of motorboat noise. Dascyllus
trimaculatus is a site-attached damselfish which is easily observed in shallow waters (Bernardi et al.,
2012). As juveniles, D. trimaculatus associates closely with anemones and schools can be relocated
successfully to different anemones to create independent experimental units. We relocated 24
schools of D. trimaculatus to anemones that surrounded loudspeakers playing either motorboat
noise or ambient noise in the lagoon of Moorea, French Polynesia to: 1) test for a short-term
response to boat noise; 2) investigate whether tolerance of anthropogenic noise may change over
several days of exposure; and 3) investigate whether anthropogenic noise results in chronic stress.
Specifically, we tested whether hiding behaviour and opercular beat rate responses to boat-noise
playback differed after repeat exposure. We predicted that if fish tolerance to playbacks decreased,
these responses would be heightened, and if tolerance increased these responses would attenuate.
We also measured size, condition and baseline plasma cortisol concentrations to test the longer
term consequences of any change in tolerance to repeated playback of anthropogenic noise.
4.2 Methods Work was conducted from the CRIOBE research station, Moorea, French Polynesia. Approval was
granted from the animal ethics committee of le Centre National de la Recherche Scientifique (CNRS),
for sacrificing and subsequently dissecting fish (Permit Number: 006725). None of the fish species
are on the endangered species list and no specific authorization was required from the French

64
Polynesian government for collection.
4.2.1 Sound recordings and playback design We made boat recordings during the day (on 4/11/2010 and 5/11/2010) at 2 m depth in a deep bay
in the lagoon on the east coast of Moorea using a hydrophone (HiTech HTI-96-MIN with inbuilt
preamplifier; sensitivity 2165 dB re 1 V/mPa; frequency range 2 Hz–30 kHz; High Tech Inc., Gulfport
MS) and a solid-state recorder (Edirol R-09HR 16-bit recorder; sampling rate 44.1 kHz; Roland
Systems Group, Bellingham WA). The recorder was fully calibrated using pure sine wave signals
generated in SAS Lab (Avisoft, Germany), played on an mp3 player, measured in line with an
oscilloscope. We made 36 recordings of passes made by two typical outboard motor boats with 25
horse power Yamaha engines; one boat was used per recording. Boats started 50 m from the
hydrophone and drove past in a straight line for 100 m; passing the hydrophone at a closest distance
of 10 m. We also made 12 ambient-noise recordings (without boats) on location each day.
We clipped boat recordings to 45 s samples that each contained one pass; ambient noise
recordings were clipped into 64 s samples. We then constructed two 12-h replicate playback tracks
for each sound treatment using different mixtures of boat and ambient-noise samples selected at
random. Boat-noise playback tracks (‘Boat’ treatment) included one boat and four ambient-noise
samples each 5 min, to give a regular rate of boat passes; ambient-noise tracks (‘Ambient’
treatment) included no boat-noise samples. A chosen 12-h track was played between the hours of
06:00 and 18:00 (during daylight hours when boats normally moved around the island). All fish
therefore received ambient sound from the environment (e.g. from the nearby reef), in addition to
that included in the playback of recordings taken from another location. Only fish in the Boat
treatment received the added effect of boat noise for 45 s every 5 min, totalling 144 boat passes per
day.
Playbacks were from underwater loudspeakers (UW-30, frequency response 0.1–10 kHz,
University Sound, Columbus, USA) connected to mp3 players (Sansa Clip1, SanDisk, Milpitas, CA,
USA). Loudspeakers were fixed facing upwards to the sandy bottom of experimental sites. We
measured both sound pressure and particle acceleration (using the hydrophone described above
and an M20L accelerometer, sensitivity 0–3 kHz, manufactured and calibrated by GeoSpectrum
Technologies, Dartmouth, Canada; recorded on a laptop via a USB soundcard, MAYA44, ESI
Audiotechnik GmbH, Leonberg, Germany) to compare playbacks of boat passes with real boat
passes. Playbacks were recorded at 1 m from the speaker, at the location of the experiment with
experimental apparatus in place. Real boat passes for the comparison were recorded with the same
hydrophone and accelerometer using the same boats making passes at 10 m at a nearby lagoon
location (Figure 4.1). Acoustic analyses were performed in MATLAB v2010a: Fast-Fourier Transforms

65
transformed time domain recordings into the frequency domain before power spectral density was
calculated to allow comparison of sound levels for each treatment across the frequency range 100–
3000 Hz.
Figure 4.1 Power spectral densities (PSD) of (a) sound pressure and (b) monoaxial particle acceleration of original recordings of boats and boat playbacks at experimental site along with ambient noise and ambient noise playbacks. Window length = 1024. Playbacks were affected by near field effects and speaker performance meaning some frequencies were louder and other s quieter, but boats were louder than ambient noise and boat playbacks were louder than ambient noise playbacks. Some recordings contained harmonic noise at 50 Hz intervals, this was an artefact of recording via a laptop.
4.2.2 Experimental sites and design We used two sites, one for each sound treatment (Boat and Ambient) in each of two replicate trials
(Figure 4.2). Treatment allocation to sites was alternated between temporal replicates to control for
unknown site differences; sites were similar in depth (1.3–1.8 m), water turbidity, prevailing
currents, proximity to reef (~10 m) and nearest boat channel (~60 m). We allocated replicate 12-h
playbacks to sites and temporal replicates in a Latin-square design. Sites were 100 m apart and
playbacks at one site could not be heard above local ambient noise levels from the other (verified
with sound pressure and particle acceleration recordings – the recordings shown in Figure 4.1 of
playbacks at each site were taken while playbacks were ongoing at the alternate site. Sound travel
between the two sites may have been limited due to the sandy bottom with occasional coral
bommies and coral rubble and the fact that between the two sites there is a large area where the
depth reduces to 40 cm, cutting off low frequencies.)
Figure 4.2 Map showing the arrangement of sites used for the experiment. Site 1 was used for Boat treatment in the first temporal replicate and Ambient treatment in the second, vice versa for Site 2.

66
Juvenile Dascyllus trimaculatus (threespot dascyllus) were collected using clove oil and hand
nets from anemones around the north coast of Moorea and introduced to one of 12 experimental
anemones (6 per site). Anemones had been relocated to the two experimental sites to surround
speakers so that each anemone was 1 m from a speaker and 1 m from neighbouring anemones on
either side. Anemones were 20–40 cm in diameter and were attached to dead coral which rested on
the sand. D. trimaculatus took shelter in the anemone within seconds of being introduced. Each
anemone received a school of 12 fish; 10 fish with standard length <20 mm (‘focal fish’) and two fish
with standard length 35–45 mm (for aiding settlement and measuring blood cortisol concentration).
Fish on the same anemone were introduced on the same day; fish on different anemones could be
introduced on different days. Each anemone was surrounded by a cage to exclude predators. Cages
were 50 cm diameter, 1 m high cylinders made from 6 mm-square metal mesh. Cages were fixed to
the sandy bottom of the lagoon flat using 1 m metal pegs hammered into the sand.
4.2.3 Hiding behaviour A video camera (GoPro Hero 2) was placed on the top of each cage to film down through an opening
for 20 min (during the period of four boat passes in the Boat treatment) between 15:00 and 18:00
on the second day of playback exposure. Filming was also targeted for 10 min between 06:00 and
10:00 after 1 week (7–9 days) and 2 weeks (14–18 days) of playback exposure. Videos were watched
without sound by an observer that was blind to experimental treatment. The first 5 min were
discarded as preliminary observations revealed that behaviour stabilised 5 min after the start of the
video (when schools were disturbed by the presence of someone setting up the camera). We then
focused on the 50 s prior to a boat pass (‘pre’), the 45 s of the boat pass (‘during’) and the 50 s
following a boat pass (‘post’) in Boat replicates. Scan samples of fish behaviour were performed
every 10 s during pre-, during- and post-exposure periods. Scans in matched periods were also made
of Ambient replicates. In each scan, each focal fish was recorded as hiding or not hiding. Fish were
defined as hiding in the protection of the anemone if all or part of their body was within anemone
tentacles or if they were within one body length of the rim of the anemone (the underside of the
anemone where there are no tentacles). In each video, the mean number of focal fish hiding in pre-,
during- or post-exposure periods were used for statistical analysis (thus the sample size was
determined by the number of schools).
4.2.4 Ventilation rate: Opercular beat rate (OBR) Four randomly selected focal fish were caught from each cage between 6:00 and 9:00 after 1 week
and 2 weeks of playback exposure. Fish were introduced one at a time to the experimental arena, a
20 x 20 x 15 cm plastic tub suspended mid-water on the same sand flat (100 m from experimental
cages). The arena was 1 m from a loudspeaker that was placed on the sandy bottom facing upwards

67
(sound exposure thus matched that in the cages). Fish were observed for 1 min settling time,
followed by 1 min during playback of ambient noise where OBR was counted to establish a
‘baseline’, followed by 1 min during playback of either a different ambient-noise track or boat-noise
track while OBR was counted. Boat-noise playbacks were composed of loops of the loudest 2 s of
boat passes with a 10 s ramp-up. Four replicate playbacks of each sound treatment were used. Fish
were randomly allocated to short-term sound treatment and the observer was blind to the long-
term treatment when possible (dependent on whether fish from both Boat and Ambient schools
were available on the same day; ca. 50% of the time). After the experiment, fish were taken back to
the CRIOBE research station.
4.2.5 Size, weight and body condition The standard length of each fish was measured before entering the experiment, and lengths did not
differ between sound treatments (independent samples t test: t282.7 = 0.07, p = 0.944). Fish that were
taken back to the research station after week 1 and week 2 were sacrificed using an overdose of
MS222 before standard length (using a ruler, to 1 mm) and wet weight (using a balance, to 0.001 g)
were measured. These were used to calculate condition factor using the following formula:
𝐾𝐾 = 105𝑊𝑊𝐿𝐿3
where:
K is the Condition Factor, W is the wet weight of the fish in grams (g) and L is the standard length of
the fish in millimetres (mm) (Nash et al., 2006).
4.2.6 Blood cortisol concentration After 18–21 days, the fish that were remaining in each cage were caught and a blood sample was
taken to investigate the impact of long-term boat-noise playback on baseline plasma cortisol levels.
Samples were obtained from 12 fish across eight different anemones in the Ambient treatment and
14 fish across nine different anemones in the Boat treatment. Fish were decapitated and bled from
the caudal vein within 0:22–4:23 min (mean = 1:40 min) of the start of capture attempts. Time to
bleed (independent samples t test: t23.7 = 0.05, p = 0.960), standard length of fish bled (t23.9 = 0.53, p
= 0.599) and number of days fish had spent in the cage (t23.9 = 0.54, p = 0.596) did not differ
significantly between sound treatments. Blood was collected in a heparinised capillary tube primed
with 2 µl of enzyme immunoassay (EIA) buffer. After the sample was taken, a further 18 µl of the EIA
buffer was added to the capillary tube. Samples were kept on ice until they were centrifuged for 10
min at 10 000 rpm, to separate red blood cells from plasma and buffer to determine haematocrit.
Plasma cortisol concentrations were measured using a Cortisol EIA Kit (No. 500360, Cayman

68
Chemicals, SPI BIO, France) as described in (Mills et al., 2010) and validated for this species
(Appendix 2). A high degree of accuracy and precision was achieved with samples from D.
trimaculatus using the cortisol kit, as determined from intra- (4.4%; n = 14) and inter-assay (7.6%; n
= 4) variability respectively (Appendix 2).
4.2.7 Statistics Where there were sufficient data, we used general linear mixed effects models to test for impacts of
boat-noise playback. Linear mixed-effects models with normal errors were used to analyse the effect
of short and long-term playback exposure on the change in OBR from baseline and the effect of long-
term noise treatment on baseline OBR, size, weight and condition. Number of days exposure was
included in the models as a fixed effect and anemone was included as a random effect which was
specific to temporal replicate. The minimal model was obtained by sequential deletion of fixed
effects and their interactions where they were found to be non-significant. Significance was tested
by likelihood ratio model comparisons of the maximal model with the nested model where an effect
in question was dropped. Chi-squared statistics and p-values for fixed effects were obtained by
likelihood ratio tests comparing the minimal model with a model excluding the effect where it was
included in the minimal model, or including the effect where it was not. The degrees of freedom
given are the difference in degrees of freedom for the two models compared and the degrees of
freedom for the minimal model. The variance and standard deviation for the random effect of school
and the size of any effects with standard error (se) are given.
Elsewhere, we used paired t tests or Wilcoxon signed-ranks tests on the mean per school
(selected after checking relevant assumptions of normality and heterogeneity of variances). To
establish whether the noise of boat passes affected hiding behaviour, the mean number of fish
hiding in schools was compared for pre–during, during–post and pre–post comparisons in a
repeated-measures design (within-schools comparison). Mean cortisol concentration for each Boat
school was compared with mean cortisol concentrations in Ambient schools in an independent-
measures design (between-schools comparison).

69
4.3 Results
4.3.1 Hiding behaviour On day 2, a significantly greater proportion of focal fish in Boat schools were found hiding in the
anemone during boat-noise playback compared with pre-noise (paired t test: t7 = 2.38, p = 0.049).
On average, 0.83 more fish were found hiding during than pre-boat noise (95% CIs: 0.0059–1.6618;
Figure 4.3). In the 50 s post-boat-noise exposure, the number of fish hiding declined slightly but was
not significantly different to the number during boat noise (t7 = 0.63, p = 0.546, mean difference =
0.71, 95% CIs = -1.94–3.36). The post-exposure number of focal fish hiding did not differ significantly
from the pre-exposure number (t7 = 0.43, p = 0.679, mean difference = 0.11, 95% CIs = -0.52–0.76).
There were no significant differences in the number of fish hiding in the anemone between any pair
of equal time points in Ambient schools (N = 5, t test p-values > 0.1). Nor were there significant
differences in the number of fish hiding in the anemone when comparing pre–during, during–post
and pre–post periods at weeks 1 and 2 (N Boat week 1 = 9, N Boat week 2 = 11, N Ambient week 1 =
10, N Ambient week 2 = 7, paired t tests or Wilcoxon signed ranks tests p-values > 0.1; Figure 4.3).

70
Figure 4.3 Proportion of the total number of focal fish in the school hiding during three periods of playback (pre-, during and post-boat-noise playback periods; in Ambient schools, ‘during’ refers to the matching time points in videos when Boat schools received b oat playbacks, when Ambient schools continued to receive ambient-noise playback). Grey lines represent the mean proportion within schools; thick black lines represent means across all schools. a) Boat day 2; b) Boat week 1; c) Boat week 2; d) Ambient day 2; e) Ambient week 1; f) Ambient week 2.

71
4.3.2 Opercular beat rate The interaction between long-term and short-term noise exposure affected the change in OBR from
baseline (LMM: χ23 = 81.80, p < 0.001; long-term noise: χ2
1 = 6.84, p = 0.009; short-term noise: χ21 =
48.41, p < 0.001; Figure 4.4), after controlling for school (variance = 27.57, standard deviation =
5.25). Number of days of long-term noise exposure had no significant effect on the change in OBR
(χ21 = 1.39, p = 0.239). Table 4.1 shows the results of post-hoc tests for planned contrasts.
Figure 4.4 Mean ± 1 se change in ventilation rate (opercular beat rate: OBR) from baseline when fish that had been exposed to long-term ambient or boat-noise playback were played a short-term ambient or boat-noise track. Long-term Ambient Short-term Ambient: N = 40; Long-term Ambient Short-term Boat: N = 43; Long-term Boat Short-term Ambient: N = 44; Long-term Boat Short-term Ambient N = 45.

72
Table 4.1 Planned contrasts for post-hoc testing of the effect of the interaction between long- and short-term playbacks on opercular beat rate. A = Ambient, B = Boat. Significant results are shown in bold.
Long-term : Short-term treatment combination Estimate
Standard Error t value
Degrees of Freedom p
A:A x A:B 31.42 3.66 8.59 141 <0.001 A:A x B:B -21.72 5.07 -4.28 141 <0.001 A:B x B:B 19.84 4.27 4.65 141 <0.001 A:B x B:A 21.72 5.07 4.28 141 <0.001 B:B x B:A -9.69 3.52 -2.76 141 0.007 A:A x B:A -1.88 4.39 -0.43 141 0.668
4.3.3 Size, weight and body condition After controlling for the effects of school, although there was a significant effect of days in the cage,
there was no significant effect of long-term noise on standard length (LMM: χ21 = 0.11, p = 0.745;
days in cage: χ21 = 20.26, p < 0.001; school variance = 0.71, standard deviation = 0.84), wet weight
(χ21 = 0.16, p = 0.694; days in cage: χ2
1 = 15.79, p < 0.001; school variance = 0.03, standard deviation
= 0.16) or body condition (χ21 = 0.30, p = 0.582; days in cage: χ2
1 = 5.90, p = 0.015; school variance =
0.00, standard deviation = 0.06) (Ambient: N = 82; Boat: N = 93).
4.3.4 Blood cortisol concentration Long-term playback had no significant effect on the baseline cortisol concentration (independent
samples t test: t15 = 1.8, p = 0.091; Figure 4.5).
Figure 4.5 Mean ± 1 se baseline plasma cortisol concentration in fish exposed to 18–21 days of either ambient- or boat-noise playback.
1
10
100
Ambient Boat
Plas
ma
cort
isol
con
cent
ratio
n (n
g/m
l)
Playback treatment

73
4.4 Discussion We found a behavioural and a physiological response to boat-noise playback in the short term: after
two days of exposure, Dascyllus trimaculatus were more likely to hide in the anemones they
associated with during the 45 s of a boat pass playback than in the 50 s before, and naïve fish also
showed an increased ventilation rate (Opercular Beat Rate: OBR) in response to noise in the short
term (1 min exposure). Our results concur with other studies that have found short-term
behavioural and physiological effects of anthropogenic noise in fish (Wysocki et al., 2006; Picciulin et
al., 2010; Simpson et al., 2015). However, we also found evidence that in the longer term, boat-noise
playback did not cause chronic stress responses: size, weight, condition and baseline cortisol levels
were not significantly different from ambient-noise exposed controls after up to 21 days. We also
found evidence for behavioural attenuation: after 1 week of boat-noise exposure, hiding responses
were no longer observed during boat passes in repeat measures of the same fish. In addition, after 1
week of boat-noise exposure, OBR increased less in response to boat-noise playback.
Typical interpretations of how increases in hiding behaviour and OBR could impact fitness
are that less time is available for foraging, or that the animal was exhibiting a stress response.
Reduced resource acquisition could lead to reduced growth, body condition and ultimately either
starvation, reduced ability to escape predators, or fewer or poorer quality offspring (e.g. Picciulin et
al., 2010). Stress responses are associated with increases in cortisol which can have ‘detrimental
effects on growth, sexual maturation and reproduction, immunological function and survival’
(Wysocki et al., 2006 and references therein). Our data show that after one week of exposure, hiding
and OBR responses are attenuated, calling into question such extrapolations from short-term
responses (see also Bejder et al., 2006). Attenuated responses remained consistent into the second
week of noise exposure and were accompanied by no significant differences in size, weight,
condition or baseline plasma cortisol concentration between fish exposed to ambient- or boat-noise
playback. Changes in weight and baseline plasma cortisol are usually seen when animals are under
chronic stress (Dickens and Romero, 2013).
Possible explanations for the increased tolerance that we observed are hearing threshold
shifts or other physiological impairment, or habituation. We designed our noise exposure to be
below the level likely to cause hearing loss based on the limited knowledge we have from auditory
abilities in other species (Amoser and Ladich, 2003; Ramcharitar and Popper, 2004; Smith et al.,
2004). We also measured size, weight, condition and baseline cortisol, finding that fish did not seem
to be otherwise physiologically impaired. As we caged fish, emigration of more sensitive individuals
could not explain the increased tolerance of schools. Thus, habituation is the most likely explanation
for our results. Habituation entails learning by animals that a stimulus does not represent a threat; in

74
order to show habituation the same individuals must be tested over time and a diminished response
must be observed. Habituation has previously been studied in other contexts (e.g. the siphon
withdrawal reflex to a jet of seawater wanes with repeat stimulation in Aplysia – Carew and Kandel,
1973, as does the mobbing of predators in chaffinches if the stimulus is prolonged or repeated –
Hinde, 1954). We provide the first evidence of this kind from a field-based experimental
manipulation involving anthropogenic noise using hiding behaviour.
Although non-significant, there was a trend towards a decrease in baseline plasma cortisol
levels in D. trimaculatus after 3 weeks of exposure. Although rarer than increases in baseline plasma
cortisol, a decrease can also be a sign of chronic stress (Dickens and Romero, 2013). Taken together
with incomplete attenuation of the ventilation-rate response, an alternative explanation is that D.
trimaculatus were mildly chronically stressed by boat-noise playback. Again, there is therefore the
possibility that growth, condition, survival and reproduction could be impacted beyond the duration
of our study.
Care must be taken when extrapolating these results to real-world noise sources, other
species, other timescales, or animals that are not protected from predation by cages such as in our
experiment. Care must also be taken when interpreting our findings because we used underwater
loudspeakers instead of real boats. The regime of sound exposure in our experiment was highly
regular; one boat playback every 5 min during daylight hours. Although areas of regular disturbance
exist, in many cases exposure to boat noise might be less predictable. Nedelec et al. (in review)
showed that in Atlantic cod (Gadus morhua), chronic predictable noise led to reduction in body
condition when compared to unpredictable noise, however different species may respond
differently. We also caged fish to exclude predators and prevent emigration; Simpson et al. (2015)
found that predator avoidance behaviour in European eels (Anguilla anguilla) was negatively
impacted by exposure to ship-noise playbacks, thus there is the possibility that our experimental
subjects were cognitively impaired but the exclusion of predators protected them. Further work
should investigate whether uncaged fish are impacted by anthropogenic noise. Finally, while we do
believe that all our evidence points to fish becoming habituated to boat-noise playback, it should be
considered that habituation does not necessarily link with better welfare or chances of survival. Fish
that are habituated to boat noise may be more likely to be exposed to predation risk (from fishing)
or exposure to disease (Bejder et al., 2009).

75

76

77
Chapter 5: Boat-noise playback impacts parental behaviour and offspring survival
This chapter will be submitted to ‘Ecology Letters’ for publication, with the following list of authors:
Sophie L. Nedelec, Andrew N. Radford, Leanne Pearl, Brendan Nedelec, Mark I. McCormick, Mark
G. Meekan, Stephen D. Simpson
Author contributions:
SLN, ANR, MIM and MGM designed the study; SLN, LP and BN collected the data; SLN analysed and interpreted data with ANR and MIM; SLN wrote the manuscript and ANR, MIM, MGM and SDS helped to edit the manuscript.

78
5.1 Introduction A major challenge in the 21st Century is mitigating the wide range of human impacts on the
environment. There is growing awareness about the influence of human activities on whole
ecosystems, and specific concern about global pollutants as we head into the sixth mass extinction
(Pimm et al., 2014). Evidence that the pervasive pollutant, anthropogenic noise, has detrimental
effects on a wide range of species is mounting: mammals, birds, anurans, fishes and invertebrates
can all be affected (see reviews in (Tyack, 2008; Barber et al., 2010; Slabbekoorn et al., 2010;
Normandeau Associates, 2012; Morley et al., 2014; Shannon et al., 2015). Studies showing short-
term impacts of noise are numerous, from hair-cell damage in the ear to reduced opportunity for
copulation (Hastings et al., 1996; Kaiser et al., 2011). Chronic effects of noise have also been
identified, including altered habitat use and reduced pairing success (Habib et al., 2007; Francis et
al., 2011), and recent studies demonstrate impacts of noise at the community level (Francis et al.,
2009; Slabbekoorn and Halfwerk, 2009). National and international legislation now calls for the
regulation of anthropogenic noise (e.g. European Commission Marine Strategy Framework Directive,
United States National Environmental Policy Act), but effective regulation of this global pollutant
requires evidence on the ultimate costs to animals (impacts on individual fitness and population
viability). However, studies that reveal direct fitness consequences via experimental manipulations
with suitable controls and replicates are rare (although see Francis et al., 2011; Nedelec et al., 2014
for exceptions).
Parental care is tightly linked to reproductive output (Clutton-Brock, 1991). This behaviour
arises when offspring are produced that are incapable of surviving alone, and requires the careful
balancing of investment by parents in provisioning and defending offspring while ensuring their own
survival and future prospects for reproduction (Smith and Smith, 2001). Anthropogenic noise is
known to affect parental behaviour, for example reducing time spent tending nests in damselfish
(Chromis chromis) (Picciulin et al., 2010), increasing latency to visit a nest box in great tits (Parus
major) (Naguib et al., 2013), and increasing missed detections of parents leading to reduced begging
in tree swallows (Tachycineta bicolor) (Leonard and Horn, 2012). Although implied, none of these
studies were able to demonstrate a direct impact on fitness. While noise has clear effects on
survival-related behaviour in the short term (e.g. Simpson et al., 2015), there remains the possibility
that ongoing exposure would allow animals to habituate, compensate, or move away from the
source (Bejder et al., 2009; Normandeau Associates, 2012; Morley et al., 2014).
We investigated the effects of repeated exposure to anthropogenic noise on parental behaviour
and offspring survival in a coral reef fish, the spiny chromis (Acanthochromis polyacanthus, Bleeker),
using playbacks of recordings of motorboat noise, the most common source of anthropogenic noise

79
in shallow reef environments (Vasconcelos et al., 2007). The spiny chromis exhibits bi-parental care
of eggs and larvae at nests within shallow reef habitat in the tropical Western Pacific (Allen, 1975;
Thresher, 1985). One of the most vital roles of adults is to guard their nest by chasing away potential
predators and competitors (Nakazono, 1993). Nest defence is energetically expensive (Colgan and
Brown, 1988) and thus regular feeding is also important for parents. Spiny chromis parents provide
mucus for their offspring, delivered via ‘glancing’ (also called ‘parent-touching’, or ‘contacting’ in
other species), which can contain proteins, hormones, ions, micro-organisms, immunoglobulins and
secretocytes undergoing mitosis (Kavanagh, 1998; Buckley et al., 2010; Buckley et al., 2011;
Holbrook, 2011). These three key parental-care behaviours (guarding, feeding and glancing) are all
easily observed in the spiny chromis in its natural habitat (Kavanagh, 1998; Leahy et al., 2011; Jordan
et al., 2013).
We exposed 38 pairs of spiny chromis parents with recently hatched juveniles to 12 days of
playback of either motorboat passes recorded near reefs or natural ambient noise recorded at the
same locations. We predicted that parental care would be impacted due to stress, distraction and/or
higher incidence of decision-making errors (Chan et al., 2010; Anderson et al., 2011; Purser and
Radford, 2011). Predation is thought to be the main driver of mortality during early life stages
(Hixon, 1991), and we predicted that shifts in parental care behaviour away from an optimum
activity budget would lead to higher predation of offspring.
5.2 Methods This study was conducted with ethical approval from: Great Barrier Reef Marine Park Authority,
Australian Institute of Marine Science, Lizard Island Research Station, James Cook University
(A2081), the University of Exeter (2013/247) and the University of Bristol (UIN/13/036).
5.2.1 Study site and species The study was conducted between October and December 2013 at Lizard Island Research Station
(14°4’S 145°28’E), Great Barrier Reef, Australia. The spiny chromis is a planktivorous damselfish
(Pomacentridae) that forms monogamous pairs who maintain nests in a small cave. Larvae and
juveniles stay within close proximity to this nest site (<1 m) for around one month after hatching
(Thresher, 1985). Parents keep the juveniles within a tight shoal and protect them by chasing fish
predators away and herding juveniles into the nest cave when they are threatened (Nakazono,
1993). Thirty-eight spiny chromis nests that had new clutches of juveniles hatch within the 10 days
(standard length < 14 mm) were selected for study. The rapid development and changes in
pigmentation allow newly hatched offspring to be readily identified and aged (Connell, 1998). All
nests were in water between 1 and 4 m deep (with a tidal range of 2 m) and were located in the

80
lagoon between Lizard, Palfrey, and South Islands and Seabird Islet in the Lizard Island group; an
area covering ~1 km2. Nests were separated by at least 40 m to ensure independence (home ranges
of parents at nests is <10 m and parents spend most of their time within 2 m). This system is ideal
for investigating the effects of anthropogenic noise because the biology of the species is well known,
pairs are easily habituated to the presence of snorkelling observers, and nests represent discrete
units where offspring growth and survival can be studied over a biologically relevant and logistically
feasible time frame.
5.2.2 Acoustic recordings Recordings of boat and ambient reef noise were made with a hydrophone (HiTech HTI-96-MIN with
inbuilt preamplifier; sensitivity -165 dB re 1V/μPa; frequency range 2 Hz–30 kHz; calibrated by
manufacturers; High Tech Inc., Gulfport MS) and an accelerometer (M20L; sensitivity following a
curve over the frequency range 0–3 kHz; calibrated by manufacturers; Geospectrum Technologies,
Dartmouth, Canada). Sound was recorded via a sound card (MAYA44, ESI Audiotechnik GmbH,
Leonberg, Germany) onto a laptop (Techra R840-12F, Toshiba). The soundcard and laptop were
calibrated using pure sine wave signals generated in SAS Lab (Avisoft, Germany), played on an mp3
player and measured in line with an oscilloscope. On 30/10/2013, four separate 5-min recordings of
ambient noise were made in front of the Lizard Island Research Station, 20 m from the nearest coral
reef where the water was 5 m deep and the hydrophone and accelerometer were at a depth of 2 m.
Four different typical outboard motorboats (with 5 m long aluminium hulls and 30 hp Suzuki 2-
stroke outboard motors) were also recorded in the same location for 10 min each; an approach from
the shore (600 m away) over 2.5 min was followed by 5 min intense activity where the boat was
driven in figure of eights 10–100 m from the hydrophone and accelerometer in the same location,
followed by 2.5 min where the boat returned to the shore.
5.2.3 Playbacks of ambient and boat noise Four replicate playbacks were constructed for each treatment (‘Ambient’ and ‘Boat’). Each replicate
used a different recording of either ambient or boat noise that was played on a loop during daylight
hours (06:00–18:00) as this is when small boats more often drive around reefs. Nineteen Ambient
and 19 Boat playbacks were then randomly allocated to 38 different pairs of spiny chromis.
Playbacks were from underwater loudspeakers (UW-30, frequency response 0.1–10 kHz, University
Sound, Columbus, USA) connected to mp3 players (Sansa Clip+, SanDisk, Milpitas, CA, USA) via a 40
w amplifier (Kemo, Langen Germany). Mp3 players, amplifiers and 12 V batteries were housed in
waterproof boxes (Peli1200, Peli products, Barcelona, Spain) on the seabed. Loudspeakers were
fixed by two metal poles at 1 m pointing towards a nest. We measured sound pressure and particle
acceleration (using the recording equipment described above) of two examples of each treatment at

81
the location of the nest in the area of the water column that the young fish tended to use.
Comparisons show that for both particle acceleration and sound pressure, boat noise was louder at
all frequencies than ambient noise and boat-noise playback was louder at all frequencies produced
by the speaker (>100 Hz) than ambient-noise playback (Figure 5.1).
Playbacks of boat noise could not be heard above local ambient noise from other nest sites
(verified with the hydrophone described above). Acoustic analyses were performed in MATLAB
v2010a following the method described in Nedelec et al. (2014) and Section 3.2.4 .
Figure 5.1 Power spectral density for a) mono-axial particle acceleration and b) sound pressure levels of original recordings of boats and ambient noise compared with their playbacks. Playbacks reveal a peak in sound level above 2000 Hz (an artefact of the loudspeakers used), but boat noise is louder than ambient noise and boat-noise playback is louder than ambient-noise playback. Particle acceleration levels of boat playbacks matched real boat levels better than sound pressure levels. Some harmonic noise was present at 50 Hz intervals in some recordings, due to an artefact of recording with a laptop.
5.2.4 Behaviour Each nest was visited by snorkelers every other day for 12 days between 08:00 and 16:00. The adult
male was chosen for behavioural observation, as he provides a greater proportion of parental care in
this species (McCormick, pers. obs.) and is easily identified by his large genital papilla. Fish were
given 1-min settling time after the arrival of the observer (SLN) to resume normal activity, after
which behaviour of the adult male was observed for 3 min at a distance of ~2 m from the nest. At
Boat sites, observations were made during playback of intense boat activity. Behaviour of the
parental male during observations was recorded as follows: number of defensive acts
(chasing/making aggressive strikes towards other fish); percent time spent feeding (displaying
characteristic short or extended movements in the water column searching for and consuming
plankton, or algae from the substrate). The number of instances of ‘glancing’ (where offspring eat
mucus from the focal parent) and number of aggressive strikes made towards the parent by other
fish regardless of species, were also recorded.

82
5.2.5 Offspring size, shape and weight Three spiny chromis juveniles from each of the focal nests were removed by hand net at the
beginning of the acoustic exposure; 20 more were removed at the end of day 12. Each fish was
weighed (wet weight) and measured for standard length and myotome length (cross sectional
perimeter at the anus, perpendicular to the line from tip of the mouth to middle of the tail used for
standard length). Myotome length is a measure of muscular development, we measured shape as
the ratio of myotome length to standard length. It was not possible to collect juveniles from one of
the Ambient nests at day 0 due to the morphology of their coral shelter.
5.2.6 Offspring survival Offspring were counted from three photos (taken using a Panasonic Lumix DMC-FT25 underwater
digital camera, by a snorkeler, after behavioural observations) of each brood every two days
throughout the experiment. The highest of the three counts was used for each day. Survival was
calculated as the percentage of fish observed on Day 1 that remained after 12 days. It was not
always possible to count fish from all photos, where the first and last counts could not be used a
count from the second or second to last was used (three times from 38 cases). The counter was blind
to experimental treatment.
5.2.7 Fish community All fish (except for Gobiidae and Blenniidae families, in which counts and species-level identification
by underwater visual census are difficult, and thus were excluded to avoid potential unreliable data;
as in Lecchini and Galzin, 2005) within a 5 m radius were counted (by LP) directly after behavioural
observations at each site every other day.
5.2.8 Statistical analysis As behaviour did not appear to change with time over the course of the experiment, the mean
average of behavioural measures from all observations of each nest was used for analysis. As
assumptions of normality and homogeneity of variances were not met, behaviour in fish from
Ambient nests was compared with that from Boat nests using Wilcoxon rank sums tests (non-paired
analysis). At two Boat nests, offspring survival was 0 before the first parental behaviour observations
could take place on day 2; these nests were not included in the analysis of parental behaviour. The
changes in size, shape and weight from day 0 to day 12 were compared between Ambient and Boat
nests using Wilcoxon rank sums tests. The number of nests where survival was 0 was compared
between playback treatments using a Chi-squared test. The initial size, shape and weight of juveniles
where 100 % mortality occurred was compared with other nests using Wilcoxon rank sums tests.
Survival at other nests was compared between treatments using a Wilcoxon rank sums test. To
examine differences in fish communities surrounding nests, a permutation-based, non-parametric

83
multivariate analysis of similarity (ANOSIM) using the software PRIMER (Plymouth Routines in
Multivariate Ecological Research v. 6.1.13; PRIMER-E Ltd, Plymouth Marine Laboratory, Plymouth,
UK) (Clarke and Gorley, 2006) was conducted. A frequency matrix (species by nest) was created, the
data were log-transformed to reduce the influence of very abundant species, and Bray-Curtis
similarity coefficients between pairs of nests were computed (Clarke and Warwick, 2001). The
ANOSIM procedure was carried out on the similarity matrix. ANOSIM generates an R statistic, which
varies between 0 (similarities within and between treatments are the same) and 1 (all samples
within treatments are more similar to each other than to any sample across treatments) and is
tested for difference from zero with a permutation test (in this study, N = 999 permutations). A one-
way ANOSIM was used to compare fish communities among the two noise treatment types.
5.3 Results
5.3.1 Behaviour Parents made on average twice as many aggressive strikes at other fish during boat-noise than
ambient-noise playback (N Boat = 17, N Ambient = 19, W = 92, p = 0.048; Figure 5.2a). Parents spent
25% less time feeding during boat-noise than ambient-noise playback (N Boat = 17, N Ambient = 19,
W = 215, p = 0.037; Figure 5.2b). Offspring glancing occurred three times less often during boat-
noise than ambient-noise playback (N Boat = 17, N Ambient = 19, W = 222, p = 0.019; Figure 5.2c).
There was no significant difference in the number of attacks from other fish in boat-noise compared
with ambient-noise playback (N Boat = 18, N Ambient = 19, W = 162.5, p = 0.729).

84
Figure 5.2 Behavioural responses to playback of boat noise compared with ambient noise: a) parents made more defensive acts per min; b) parents spent less time self-feeding; c) glancing behaviour was rarer. Boxes represent interquartile ranges and lines within boxes represent the median across 19 Ambient and 17 Boat nests. N determined by number of nests, data within nests averaged over duration of exposure.
5.3.2 Offspring size, shape and weight There was no significant effect of playback treatment on the change in juvenile fish size (W = 41, p =
0.262), shape (W = 67, p = 601) or weight (W = 52, p = 0.516) across 18 Ambient and 13 Boat nests. N
determined by number of nests where data could be collected at day 12 (i.e. not if survival was 0),
data within nests averaged over duration of exposure.
5.3.3 Offspring survival Complete mortality of broods (survival = 0) was significantly more likely in the Boat treatment (six of
19 nest) compared to the Ambient treatment (zero of 19 nests; chi-squared test: Χ21 = 7.13, p =
0.008). The offspring at nests that suffered 100% mortality (N = 6) were not significantly different in
initial size (W = 74, p-value = 0.511), shape (W = 79, p-value = 0.664), or weight (W = 71, p-value =
0.432) compared with other nests (N = 31). There was no significant difference in survival when
survival was non-zero (N Ambient = 19, N Boat = 13, W = 132.5, p = 0.465).
5.3.4 Fish communities There was no significant effect of playback treatment on community composition surrounding A.
polyacanthus nest sites (ANOSIM: R = -0.022, p = 0.632; all pairwise comparisons, p > 0.90).

85
5.4 Discussion Defensive and feeding behaviour of parents, parent-offspring interactions and survival of spiny
chromis were all affected by playback of boat noise. Parents made more defensive acts and spent
less time feeding, juveniles made fewer glances on parents, and overall rearing success of parents
was reduced by one third at sites subject to boat-noise playback compared to those exposed to
playback of reef noise. Earlier studies have shown negative effects of noise on parental-care
behaviour, for example reducing time spent tending nests in damselfish (Chromis chromis) (Picciulin
et al., 2010), increasing latency to visit a nest box in great tits (Parus major) (Naguib et al., 2013), and
increasing missed detections of parents leading to reduced begging in tree swallows (Tachycineta
bicolor) (Leonard and Horn, 2012). However, our study is the first to show experimental evidence of
an impact of anthropogenic noise on survival in the field.
Boat-noise playback may have stressed spiny chomis, leading to higher levels of aggression
and chasing, as has been seen in Neolamrpologus pulcher (Bruintjes and Radford, 2013).
Alternatively, stress may have lead to distraction, or distraction could have occurred without stress
(Purser and Radford, 2011). Distraction could have lead parents in our study to inappropriately chase
and attack other fish when exposed to boat-noise playback, for example chasing fish that were not a
predatory threat or chasing threatening fish less efficiently. Furthermore, many animals, including
damselfishes such as spiny chromis, vocalise during territorial challenges to reduce the chance of
aggressive escalation (Ladich, 1997; reviewed in Pereira et al., 2014), thus boat noise may have
reduced the efficiency of aggressive vocal displays due to masking and led to greater need for
defensive acts (Clark et al., 2009). Allocation of time and energy to the energetically expensive
activities involved in defence of broods is likely to impact the time available for resource acquisition
as well as depleting energy reserves. More chasing would also mean parents spent more time
focusing attention on other fish and less time in close proximity to the nest, which may have left
offspring vulnerable to predatory attack.
Time spent feeding by parents exposed to boat-noise playback was reduced by 25% in
comparison to parents subject to playback of reef noise. One reason for the reduced time spent
foraging could be that parents were spending more time on defence; another is that noise directly
impacted foraging, as has been seen in other species (Wale et al., 2013a; Voellmy et al., 2014b).
Competition for resources and predation pressures in coral reef systems are very high and energy is
needed by guarding parents for effective nest defence, adequate decision-making and offspring
provisioning. A reduction in the acquisition of resources combined with higher energy outputs
involved in nest defence would be likely to reduce body condition of parents, which has previously
been associated with increased mortality in offspring of spiny chromis (Donelson et al., 2008).

86
We also found a reduction in glancing behaviour of fish exposed to playback of boat noise
compared to those exposed to reef-noise playback. Parental provisioning is assumed to be reduced
by anthropogenic noise in great tits, as latency to visit the nest and the number of nest visits were
reduced (Naguib et al., 2013). Birds provision their offspring directly, whereas spiny chromis provide
their offspring indirectly by allowing them to eat their mucus, however, this indirect provisioning still
requires parents to be present and to undergo a cost for their offspring (mucus is energetically
expensive to produce – Grutter and Bshary, 2003). Although the number of glances by juvenile spiny
chromis may not directly determine nutritional state (Kavanagh, 1998), the behaviour is likely to
have an adaptive function involving transfer of hormones such as growth hormone (tiGH) (Schütz
and Barlow, 1997) and building immune function (Buckley et al., 2010; Buckley et al., 2011). The
longer-term effects of a reduction in glancing behaviour for progeny are unknown, but might include
reduced growth or immunocompetency.
There were a number of potential factors that could have acted individually or in
combination to produce the complete mortality we observed at 32% of the broods exposed to
playback of boat noise. Parents could have abandoned or cannibalised their offspring; alternatively
or in addition, predation intensity could have increased and/or the effectiveness of parental defence
been reduced in the presence of boat noise. Spiny chromis parents have been observed occasionally
to drive their offspring away from the nest or abandon them (Thresher, 1985; Nakazono, 1993), after
which offspring may join other older schools of offspring or die. We did not witness parents leaving
nests, but we did observe occasional aggression towards offspring from parents (SLN pers. obs. on
four occasions, observed in both treatments). However, this aggression did not correspond to the
nests where mass mortality occurred. We also never observed offspring near the nest but not under
parental care, thus if broods were abandoned they were preyed upon before further observations
were made (parents remained at the nest site after offspring disappeared in all cases). Filial
cannibalism was only observed in the field when parents were severely stressed (e.g. rarely during
collection of offspring at the end of the experiment but never during behavioural observations, SLN
pers. obs.). Our observations, supported by evidence of stomach content analysis by Nakazono
(1993) (who found one instance of cannibalism of another fish’s offspring but never of own), suggest
that even during times of extreme stress, such as when we collected offspring from broods,
cannibalism is neither rapid nor exhaustive, thus cannibalism seems an unlikely explanation for the
complete loss of broods. As attacks by other fish did not increase we have no evidence that intensity
of predation was greater under conditions where boat noise was broadcast. However, we did find
that boat noise reduced parental care of the brood. So it may be possible that the incidence of
predation did not increase but the lack of parental care might mean that predation was more often
87
successful. This could have happened because parents spending more time chasing inappropriately
may have spent more time further from their offspring, leaving them more open to predation.
Our field study found direct consequences of exposure to chronic noise on the survival of
juveniles in the wild. We note the important caveat that our experiment used underwater
loudspeakers, which do not broadcast the full range of sounds produced by motorboats, but it is also
possible that our results are therefore conservative with respect to the full impact of boat noise.
Motorboats are found throughout the world wherever humans inhabit coastal areas, and our results
suggest that boat noise should be considered in the management of fisheries and protected areas.
Other sources of anthropogenic noise, including ships, seismic surveys and pile-driving during
construction, may also interfere with reproduction, with impacts on fish populations. Findings from
studies that directly assess fitness consequences, such as ours, are vital to parameterise population-
level models that can be used to develop international policy and regulate this issue of global
concern.

88

89
Chapter 6: Anthropogenic noise playback impairs embryonic development and increases mortality in a marine invertebrate
This chapter was published in ‘Scientific Reports’ in 2014, volume 4, page 5891, with the following list of authors:
Sophie L. Nedelec, Andrew N. Radford, Stephen D. Simpson, Brendan Nedelec, David Lecchini, Suzanne C. Mills
Author contributions:
SCM, SLN and ANR designed the study; SLN and BN conducted fieldwork with help from SCM; SCM
conducted labwork with help from SLN and BN; SLN analysed the data with help from ANR; SLN
wrote the first draft of the manuscript and SCM, ANR, SDS and DL all contributed to the manuscript.
SCM, ANR, SDS and DL provided funding.

90
6.1 Introduction Some anthropogenic (man-made) activities create noise. National and international legislation (e.g.
US National Environment Policy Act and European Commission Marine Strategy Framework
Directive) now recognises that some anthropogenic noise can be considered pollution. Yet such
policies are in the early stages of being able to regulate noise and better information could improve
their effectiveness. Noise from activities such as urban development, transportation and resource
extraction has been shown to affect the behaviour and physiology of animals from a range of
taxonomic groups (see Kight and Swaddle, 2011; Francis and Barber, 2013; Morley et al., 2014).
However, if we are to assess the ultimate consequences (impacts on individual fitness and
population viability), studies must include three key elements. First, measurements of survival or
reproductive success are needed; if these are not feasible, biologically meaningful response
parameters that translate directly to fitness consequences should be considered (Francis and Barber,
2013; Morley et al., 2014). Second, experimental manipulations with suitable controls and replicates
are required if the influence of noise is to be isolated; correlative and pseudo-replicated studies do
not allow confounding factors to be ruled out or strong conclusions to be drawn (Slabbekoorn, 2013;
Morley et al., 2014). Third, experiments need to consider repeated or chronic noise exposure
because changes across time and cumulative effects may affect animal responses (Bejder et al.,
2009).
Here, we use a field-based experiment to investigate how repeated exposure to
anthropogenic noise might impact early-life development and survival. Embryos are adapted to
tolerate normal environmental fluctuations and challenges (Gilbert, 2001; Hamdoun and Epel, 2007),
but accelerating anthropogenic change can push conditions beyond the bounds of normal variability
and/or create conditions that did not previously exist. Extremes of temperature and pH, heavy
metals, and estrogen-mimicking chemicals, for instance, have been shown to impair development in
a wide range of taxa (e.g. Markey et al., 2001; Baradaran-Heravi et al., 2012). Noise stress affects
various aspects of development in rats (reviewed in Kight and Swaddle, 2011), suggesting
anthropogenic noise is likely to have detrimental influences on development. However, strong
experimental evidence is currently lacking (for some preliminary work, see Aguilar de Soto et al.,
2013).
Specifically, we investigated how repeated exposure to playback of boat-traffic noise (a
widespread source of anthropogenic noise) affects early-life survival and development in a marine
mollusc, the sea hare Stylocheilus striatus (Figure 6.1) at Moorea Island. Very little is known about
the effect of any source of noise on aquatic invertebrates (for exceptions, see Chan et al., 2010;
Aguilar de Soto et al., 2013; Wale et al., 2013a,b). However, aquatic invertebrates are very diverse
and important to the functioning of ecosystems, as well as often having the ability to hear and using

91
sound for a variety of purposes (see Wale et al., 2013a,b). Sea hares in particular play an important
role in benthic reef ecology throughout their circumtropical distribution as a specialist grazer on the
toxic cyanobacterium, Lyngbya majuscule (Paul and Pennings, 1991). We examined whether
developmental success (eggs completing organogenesis within five days of incubation), hatching
(embryos hatching after five days of incubation), and survival after hatching were affected by
repeated boat-noise exposure during early development in S. striatus. We predicted that
development of embryos would be compromised by increased noise and that those that survived
would take longer to hatch and have higher mortality after hatching.
Figure 6.1 Stylocheilus striatus, photograph courtesy of Fabien Michenet.
6.2 Methods
6.2.1 Study species, husbandry and egg manipulation We collected 50 sea hares from the lagoon of Moorea, French Polynesia. Sea hares were kept in
aquaria at the CRIOBE research station, with oxygenated running seawater and at ambient
temperature and light regimes. They grazed on cyanobacteria colonizing the aquaria and turf algae
collected from the lagoon. We paired similarly sized individuals in 15 x 5 x 5 cm plastic breeding
containers that allowed water flow but prevented sea hares mixing with the main population. We
monitored pairs hourly overnight and separated them after they were observed copulating;
maternity was thus known. We collected eggs the following morning; sea hare mothers lay a string

92
of eggs in gelatinous material (a ribbon) with each egg containing 1–6 embryos. Preliminary
observations revealed that most eggs hatched within five days and this determined the length of
noise exposure eggs received in the field.
We took egg ribbons from 13 mothers over the course of the experiment (from January to
March 2013) and cut each into 8–16 equally sized pieces with a scalpel. Ribbon pieces were
transferred to individually labelled 1.5 ml Eppendorf tubes filled with fresh sea water that had been
collected from outside the lagoon and sterilised. Eppendorfs from the same mother were split
randomly between ‘Boat’ and ‘Ambient’ playback treatments (see below) in a balanced design to
control for potential genetic or epigenetic effects on egg development. Eppendorfs are sealed, air-
and water-tight containers, thus controlling for any differences in water chemistry. Also, no
developmental differences were found between egg ribbons in closed Eppendorfs versus those in
open Petri dishes in the laboratory (S. C. Mills pers. obs.).
6.2.2 Sound recordings and playback design Note that this study was conducted at the same time at the same sites as the study in Chapter 4,
thus some methods are shared. We made boat recordings during the day (on 4/11/2010 and
5/11/2010) at 2 m depth in a deep bay in the lagoon on the east coast of Moorea using a
hydrophone (HiTech HTI-96-MIN with inbuilt preamplifier; sensitivity 2165 dB re 1 V/mPa; frequency
range 2 Hz–30 kHz; High Tech Inc., Gulfport MS) and a solid-state recorder (Edirol R-09HR 16-bit
recorder; sampling rate 44.1 kHz; Roland Systems Group, Bellingham WA). The recorder was fully
calibrated using pure sine wave signals generated in SAS Lab (Avisoft, Germany), played on an mp3
player, measured in line with an oscilloscope. We made 36 recordings of passes made by two typical
outboard motor boats with 25 horse power Yamaha engines; one boat was used per recording.
Boats started 50 m from the hydrophone and drove past in a straight line for 100 m; passing the
hydrophone at a closest distance of 10 m. We also made 12 ambient-noise recordings (without
boats) on location each day.
We clipped boat recordings to 45 s samples that each contained one pass; ambient noise
recordings were clipped into 64 s samples. We then constructed two 12-h replicate playback tracks
for each sound treatment using different mixtures of boat and ambient-noise samples selected at
random. Boat-noise playback tracks (‘Boat’ treatment) included one boat and four ambient-noise
samples each 5 min, to give a regular rate of boat passes; ambient-noise tracks (‘Ambient’
treatment) included no boat-noise samples. A chosen 12-h track was played to sea hare egg ribbon
pieces every day for five days between the hours of 06:00 and 18:00 (during daylight hours when
boats normally moved around the island). All eggs therefore received ambient sound from the
environment (e.g. from the nearby reef), in addition to that included in the playback of recordings

93
taken from another location. Only eggs in the Boat treatment received the added effect of boat
noise for 45 s every 5 min, totalling 144 boat passes per day.
Playbacks were from underwater loudspeakers (UW-30, frequency response 0.1–10 kHz,
University Sound, Columbus, USA) connected to mp3 players (Sansa Clip1, SanDisk, Milpitas, CA,
USA). Loudspeakers were fixed facing upwards to the sandy bottom of experimental sites. We
measured both sound pressure and particle acceleration (using the hydrophone described above
and an M20L accelerometer, sensitivity 0–3 kHz, manufactured and calibrated by GeoSpectrum
Technologies, Dartmouth, Canada; recorded on a laptop via a USB soundcard, MAYA44, ESI
Audiotechnik GmbH, Leonberg, Germany) to compare playbacks of boat passes with real boat
passes. Playbacks were recorded at 1 m from the speaker, at the location of the experiment with
experimental apparatus in place; the recording sensors were the same distance from the speaker
and the sandy bottom as the embryos and were within 30 cm of the embryos. Real boat passes for
the comparison were recorded with the same hydrophone and accelerometer using the same boats
making passes at 10 m at a nearby lagoon location (Figure 6.2). Acoustic analyses were performed in
MATLAB v2010a: Fast-Fourier Transforms transformed time domain recordings into the frequency
domain before power spectral density was calculated to allow comparison of sound levels for each
treatment across the frequency range 100–3000 Hz.
Figure 6.2 Power spectral densities (PSD) of (a) sound pressure and (b) monoaxial particle acceleration of original recordings of boats and boat playbacks at experimental site along with ambient noise and ambient noise playbacks. Window length = 1024. Playbacks were affected by near field effects and speaker performance meaning some frequencies were louder and other s quieter, but boats were louder than ambient noise and boat playbacks were louder than ambient noise playbacks. Some recordings contained harmonic noise at 50 Hz intervals, this was an artefact of recording via a laptop.
6.2.3 Experimental sites and design We used two sites, one for each sound treatment (Boat and Ambient) in each of four replicate trials.
Treatment allocation to sites was alternated between temporal replicates to control for unknown
site differences; sites were similar in depth (1.3–1.8 m), water turbidity, prevailing currents,
proximity to reef (~10 m) and nearest boat channel (~60 m). We allocated replicate 12-h playbacks

94
to sites and temporal replicates in a Latin-square design. Sites were 100 m apart and playbacks at
one site could not be heard above local ambient noise levels from the other (verified with sound
pressure and particle acceleration recordings – the recordings shown in Figure 6.2 of playbacks at
each site were taken while playbacks were ongoing at the alternate site. Sound travel between the
two sites may have been limited due to the sandy bottom with occasional coral bommies and coral
rubble and the fact that between the two sites there is a large area where the depth reduces to 40
cm, cutting off low frequencies.)
We taped Eppendorfs in random groups of three or four around an iron bar (5 mm diameter,
1 m long) using electrical tape. The bar was fixed horizontally at 50 cm height from the sandy bottom
in the lagoon, 1 m from an underwater loudspeaker; sound recordings were taken next to the
structures that supported the iron bars, with iron bars in place. We placed eggs into experimental
noise treatments within 4–8 h of laying (i.e. around the time of their first division or cleavage). We
never approached the sites by a motor boat apart from at the beginning and end of the experiment.
Boating activity in the nearest boat channel was present in the vicinity of both sites, but this was
adequately controlled for by running multiple temporal replicates of the experiment and balancing
allocation of treatments between the sites.
After five days of noise exposure, Eppendorfs were returned to the laboratory where we
examined the contents under 20 x magnification using a light microscope (Leitz diavert). The
following categories were counted: (a) eggs that were dead or had failed to undergo organogenesis
(i.e. failed to develop); (b) unhatched eggs with mature developed embryos; (c) empty eggs
(indicating successful hatching); and (d) dead veligers (post-hatching larvae). Counters were blind to
the sound treatment, and the order in which Eppendorfs from the same mother were counted was
balanced between treatments by an additional observer. We used counts to calculate three
response measures for analysis. First, the percentage of eggs that failed to develop (category
a/categories a + b + c). Second, the percentage of successfully developing eggs that had slowed
development (category b/categories b + c). Third, the number of veligers that died as a percentage
of eggs that hatched (category d/category c); as there was more than one veliger per egg, the
percentage in the third response measure may exceed 100.
6.2.4 Statistical analyses Analyses were conducted at the level of the mother. The proportions of eggs that failed to develop
and that had slowed development were normally distributed and heteroskedastic after arcsine
square root transformations. Thus, we used paired t tests to examine differences between means (n
= 13 mothers); percentages that are arcsine square root transformed may exceed 100 (see Fig. 6.3).
The proportion of hatched individuals that died did not meet the assumptions of parametric testing

95
and thus we used a Wilcoxon signed ranks test to examine differences between medians. No
hatching was observed in ribbons from two mothers in the Boat treatment, thus they were excluded
from the analysis of hatched individuals that died (n = 11).
6.3 Results Of the 29,416 eggs counted, 7,497 failed to develop. The proportion failing to develop was
significantly affected by sound treatment (paired t test: t12 = -2.99, p = 0.011; Figure 6.3a), with 21.3
± 10.8% (mean ± se) fewer eggs per mother developing when exposed to boat-noise playback
compared to playback of ambient noise.
Of the 21,919 eggs that developed successfully, 13,257 had not hatched after 5 days. The
proportion of developing eggs that remained un-hatched was not significantly affected by sound
treatment (paired t test: t12 = -0.63, p = 0.538; Figure 6.3b).
From 8,662 eggs that successfully hatched, 3,514 veligers died before they were counted.
The proportion of dead veligers was significantly affected by sound treatment (Wilcoxon signed
ranks test: V = 10, N = 11, p = 0.045; Figure 6.3c), with 21.6 ± 24.4% (median ± median absolute
deviation) more veligers dying after exposure to boat-noise playback than ambient-noise playback.
Figure 6.3 Arcsin square root transformed proportions of egg capsules that (a) failed to develop and (b) were unhatched in each treatment. The thick black line represents the overall effect (mean for each treatment), whereas the grey lines connect values for the two treatments for each mother. N = 13 mothers. (c) Number of veligers that died as a proportion of egg capsules that hatched per treatment. The thick black line represents the overall effect (median for each treatment), whereas the grey lines connect values for the two treatments for each mother. N = 11 mothers.

96
6.4 Discussion Boat-noise playback significantly increased the likelihood of sea hares suffering developmental
failure at the embryonic stage (see also Banner and Hyatt, 1973) and mortality at the free-swimming
veliger stage, but had no discernible impact on the rate of embryo development (cf. Aguilar de Soto
et al., 2013). Our controlled and replicated experimental manipulation in a field setting therefore
indicates that anthropogenic noise has the potential to impact gastropod molluscs; although marine
invertebrates have significant ecological and economic value (Wale et al., 2013), the majority of
studies have only considered how vertebrates are affected by noise (Morley et al., 2014). Our results
also suggest, more generally, the potential for anthropogenic noise to have detrimental fitness
consequences early in life.
Care must be taken when interpreting our findings because we used underwater
loudspeakers rather than real boats and enclosed sea hare embryos in Eppendorfs supported by iron
bars, whereas eggs of this species are naturally found attached to a substrate such as rock or algae.
While we ensured that the sound pressure and particle acceleration exposure in the water column
matched that of a real boat as closely as possible, it is possible that vibrations of different substrates
may affect sound transmission differently, and this will be a very interesting avenue for future
research. If anthropogenic noise does indeed impact early-life survival, then there are implications
for population dynamics and resilience, and for community structures due to shifts in selective
pressures (Gilbert, 2001; Hamdoun and Epel, 2007). Herbivores, such as sea hares, associated with
coral reefs play a key role in the equilibrium between corals and algae, while populations of S.
striatus are particularly important as they are a specialist grazer on blooms of the toxic
cyanobacterium, L. majuscula (Paul and Pennings, 1991).
The more prevalent developmental failure of sea hare embryos exposed to boat-noise
playback might be the result of stronger molecular vibrations, caused by mechanical energy in the
sound waves produced by the loudspeakers, compared with the ambient noise treatment. Low
frequency sound in combination with whole body vibrations induces sister chromatid exchanges and
delays cell cycle progression in mice and humans (Silva et al., 2002). Although specific frequencies
that cause damage in water may be different to those in air due to the physical properties of sound,
sine sound waves (900, 1000 and 1100 Hz) caused mechanical damage to unhatched red flour beetle
(Tribolium castaneum) larvae (Jinham et al., 2012). Altered gene expression due to environmental
(heat) stress during development affects the penetrance (the extent to which a particular gene or
set of genes is expressed in the phenotypes of individuals carrying it) of genetic mutations, leading
to disease in humans, Drosophila and mice (Baradaran-Heravi et al., 2012). Thus, the effect on sea
hare development might be manifested through disrupted tissue formation, tissue damage or
altered gene expression.

97
One potential mechanism for the death of veligers after hatching is barotrauma (tissue
damage due to pressure changes in gas filled chambers, such as when fish are brought to the surface
too quickly and their swim bladders rupture; see Gross et al., 2013). Sea hare embryos may have gas
bubbles in their circulatory system that could cause barotrauma if they were to fluctuate in size in
response to pressure changes. A second potential mechanism relates to stress if sea hare veligers
are capable of detecting the noise via their statocysts. Statocysts are organs used for hearing in
other molluscs (Mooney et al., 2010), are commonly found in various opisthobranchs (e.g.
Coggeshall, 1969) and were seen in S. striatus embryos in this study (pers. obs.). Noise is known to
cause stress in a wide variety of taxa, and corticosterone levels are negatively associated with
immune responses, survival and recruitment (Kight and Swaddle, 2011) as well as affecting
development via calcium transport disruption (Siegel and Mooney, 1987).
Outboard motor boats are found all over the world wherever humans inhabit coastal areas
and our results suggest that noise from them should be considered in the management of fisheries
and protected areas. Other sources of anthropogenic noise, such as ships, seismic surveys and pile
driving, may also overlap with developmental stages of vulnerable species raising concern for many
populations. Findings from studies directly assessing fitness consequences, as ours has done, are
vital to parameterise population-level models that can be used to develop international policy and
thus regulate this issue of global concern.

98

99
Chapter 7: Final conclusions and future directions 7.1 Introduction In this thesis, I reviewed the literature on underwater anthropogenic noise, fish and marine
invertebrate hearing, and potential impacts of noise on the developmental stages of fishes and
marine invertebrates. My review revealed that there is a pressing need to assess the fitness
consequences of noise pollution in order to eventually be able to regulate it effectively. Often,
longer-term studies are needed rather than extrapolation from short-term responses in order to
assess fitness consequences. I also revealed that, although understudied, the developmental stages
of fishes and invertebrates could be under threat from rising noise levels. Traffic is the most pressing
source of underwater noise as it is the main cause for an estimated increase of 15 dB in ambient
noise levels at frequencies below 200 Hz in the ocean in the past century (Andrew et al., 2002). The
nature of traffic noise means that animals are likely to suffer ongoing repeated exposures over time.
However, knowledge about how repeated exposure to anthropogenic noise could impact animal
responses is severely lacking. Therefore, the topic of my thesis was impacts of repeated traffic noise
exposure on the behaviour, development and fitness of fishes and marine invertebrates.
7.2 Chapter 2 In Chapter 2, I discussed the importance of measuring particle motion in studies with fishes and
marine invertebrates that involve sound. Measurements of particle motion have often been omitted
from such studies because of the limited availability of equipment and limited understanding of how
to handle particle motion data. I hope that this chapter will provide useful information and practical
tools for biologists who wish to make particle motion measurements, a crucial step needed in a
fuller understanding of the impacts of anthropogenic noise in aquatic environments. I used the
techniques detailed in Chapter 2 to characterise underwater soundscapes for experiments involving
playbacks of traffic noise for fishes and invertebrates (Chapters 3–6). The program presented is also
capable of producing outputs appropriate to measurements of impulses, which will be useful for
anyone working on such sources of anthropogenic noise as pile driving or seismic airgun blasting.
I plan to use the analysis program presented in Chapter 2 to investigate the comparative
particle motion and sound pressure characteristics of coral reefs with varying degrees of lionfish
(Pterois volitans) invasion (recordings are already collected and analysis will commence after
handing in my thesis). The hypothesis to be tested is that lionfish predators will remove sound-
producing fishes and invertebrates from coral reef patches, thereby rendering them quieter than

100
less impacted reefs; as larval fishes and invertebrates are attracted to reef sounds (Simpson et al.,
2005b; Vermeij et al., 2010), quieter reefs may suffer reduced recruitment. I plan to present a ‘sound
map’ showing the comparative area over which the sound pressure and particle motion components
of reef sound propagate from the reefs with varying degrees of lionfish invasion. This study will
illustrate the importance of a proper characterisation of relevant sound fields for conservation
efforts.
A different direction that could be taken from the techniques I have described for measuring
particle motion is to quantify the directionality in addition to the magnitude of sound. This could
prove particularly useful for studies using passive acoustic monitoring of natural or human-impacted
soundscapes. Another of the future novel directions that could be taken from this research involves
mixing hydroacoustic modelling techniques (e.g. Bruintjes et al., 2014) with measurement of particle
motion. At higher frequencies, the particle motion component of sound is harder to measure due to
equipment resonance, but there is also less need to measure particle motion at higher frequencies
as the cut-off frequency and near-field effects are less likely to apply (i.e. particle motion can more
likely be calculated using standard modelling techniques from measurements of pressure). When
considering impulses, it is important to include energy at all frequencies, because energy at
frequencies higher than those that can be heard by fishes and invertebrates can still cause injuries
such as barotrauma (Hawkins et al., 2015). Thus, a limitation of the method we have presented for
analysing impulses in particle motion and pressure is that the accelerometer used was only sensitive
up to 3000 Hz, yet energy at higher frequencies could contribute to impulsive signals, meaning there
is the possibility that users will underreport the particle motion energy present in impulses.
7.3 Chapter 3 In Chapter 3, I presented the results of a study investigating how exposure to 16 days of regular and
irregular traffic noise impacted behaviour, growth and development in Atlantic cod (Gadus morhua)
larvae. I found that in the short-term, playback of ship noise led to startle responses at 0 days post-
hatch and a suggestion of heightened alertness at 16 days post-hatch. Neither of these responses
were directly affected by previous exposure to ship-noise playback. Two days of additional noise of
both predictable and unpredictable regimes reduced growth compared to playback of ambient
noise, while predictable noise led to faster yolk sac use. After 16 days, growth in all three sound
treatments converged, although fish exposed to predictable noise had a lower body width–length
ratio. Larvae that had a lower body width–length ratio were easier to catch in a predator-avoidance
experiment. Although noise regime during rearing did not directly affect the behaviours measured,
predictable anthropogenic noise could impact larval cod survival via an indirect effect on body
development.

101
This work was limited to the less-than-ideal acoustic conditions in aquaria because wild
larval cod are challenging to find and follow. This limits the extrapolations we can realistically make
to open-water situations where fish are exposed to real ships. If, however, we were to indulge in
speculation, it is conceivable that both predictable and unpredictable anthropogenic noise may act
as a stressor for larval fish, with potential impacts on fitness. In addition, predictable anthropogenic
noise exposure may impact yolk sac use and body-shape development of Atlantic cod larvae, with
potential implications for predator avoidance and survival. Areas where marine traffic is highly
regular may thus pose higher risk to cod larvae, for example around certain ports and ferry routes.
Further research should investigate recruitment of fish which may also be threatened by overfishing
and other anthropogenic impacts in these areas. Our work may also present an opportunity for
successful mitigation: irregular or overlapping traffic may reduce negative impacts on this species,
although further work is needed to establish whether this is the case. Taken together, our findings
reveal that noise can have effects on fish that extend beyond immediate impacts and are dependent
on exposure regime. These results therefore have important wider implications for research on the
impacts of anthropogenic disturbances on animals.
7.4 Chapter 4 For Chapter 4, I worked in the natural environment investigating the impacts of short and long-term
traffic noise on juvenile threespot dascyllus (Dascyllus trimaculatus), a damselfish species.
Specifically, I considered noise-induced changes in physiology (ventilation rate), behaviour (hiding),
stress (blood cortisol), growth and condition. The fish in this experiment were caged to exclude
natural predators, thus we could establish whether starvation was a likely cause of death. We found
a behavioural and a physiological response to boat-noise playback in the short term: after two days
of exposure, Dascyllus trimaculatus were more likely to hide in the anemones they associated with
during the 45 s of a boat pass playback than in the 50 s before, and naïve fish also showed an
increased ventilation rate in response to noise in the short term (1 min exposure). However, we also
found evidence that in the longer term, boat-noise playback did not cause chronic stress responses:
size, weight, condition and baseline cortisol levels were not significantly different from ambient-
noise exposed controls after up to 21 days. We also found evidence for behavioural attenuation:
after 1 week of boat-noise exposure, hiding responses were no longer observed during boat passes
in repeat measures of the same fish. In addition, after 1 week of boat-noise exposure, ventilation
rate increased less in response to boat-noise playback. Ours is the first evidence from a field-based
experiment to make repeat measures from the same individuals exposed to chronic noise.
We did not find full attenuation of the ventilation-rate increase; potential explanations for
this are partial habituation or partial dishabituation. If fish only partially habituated to boat-noise

102
playback, then our results should be taken with caution as there is the possibility that growth,
condition, survival and reproduction could be impacted beyond the duration of our study. If the
different presentation of the sound (1 min of the loudest part of a boat pass on a loop rather than an
approach and pass of a boat) was novel compared to the exposure they had habituated to (i.e.
dishabituation), then it is possible that habituation may be context specific and again our results
should be taken with caution because in the wild contexts are likely to change over the lifetime of a
fish with respect to habitat use by humans and fish.
Although non-significant, there was a trend towards a decrease in baseline plasma cortisol
levels in D. trimaculatus after 3 weeks of exposure. Although rarer than increases in baseline plasma
cortisol, a decrease can also be a sign of chronic stress (Dickens and Romero, 2013). Taken together
with incomplete attenuation of the ventilation-rate response, an alternative explanation to that
offered in my thesis chapter, is that D. trimaculatus were mildly chronically stressed by boat-noise
playback. Again, there is therefore the possibility that growth, condition, survival and reproduction
could be impacted beyond the duration of our study.
7.5 Chapter 5 For Chapter 5, I again worked in the natural environment, but this time with uncaged juvenile fish, so
that we could determine whether predation rates were likely to be higher when fish were exposed
to traffic noise. I chose a species where the parents provide care to offspring at a nest, making them
good experimental units for investigating the impacts of traffic noise on offspring survival over 12
days. This chapter contained my most exciting result: a highly significant difference in offspring
survival between boat and ambient noise exposed nests.
It is interesting that survival was not different in nests where 100% mortality did not occur.
This could have been because parental condition was reduced below a threshold level required for
effective brood protection at nests where 100% mortality did occur. It would thus be interesting to
study the impacts of noise on parental condition, and the link between parental condition and
offspring survival further. This could be done by photographing the parents next to a scale so that
body length and height could be measured. Alternatively, mass mortality may have occurred at
some nests but not others due to the presence of a particular species or type of predator; however
this seems unlikely as the fish that were observed to eat the offspring were damselfish, which were
abundant around all nests. It is possible that parental care was of lower quality at nests where 100%
mortality occurred; however, we could not formally test this due to having a sample size of four
nests with mass mortality and behavioural observations (two nests suffered 100% mortality before
the first behavioural observation at day 2).

103
There are many potential interesting follow-up studies from this work. For example,
investigating whether adult and juvenile spiny chromis show elevated plasma cortisol in response to
noise, both in the short and long term. The link between parental condition and parental care
behaviour would also be interesting to study further, particularly if parental condition was found to
be impacted by noise (which seems likely due to increased activity and lower feeding rates).
7.6 Chapter 6 In Chapter 6, I presented the results of the first study of the impacts of traffic noise on marine
invertebrate embryonic development and survival. Boat-noise playback significantly increased the
likelihood of sea hares suffering developmental failure at the embryonic stage, and mortality at the
free-swimming veliger stage, but had no discernible impact on the rate of embryo development. Our
controlled and replicated experimental manipulation in a field setting therefore indicates that
anthropogenic noise has the potential to impact gastropod molluscs. While we ensured that the
sound pressure and particle acceleration exposure in the water column matched that of a real boat
as closely as possible, it is possible that vibrations of different substrates may affect sound
transmission differently, and this will be a very interesting avenue for future research.
An alternative explanation for failed development may be that the sea hare embryos enter
diapause. Diapause is common in other gastropod species including marine Opisthobranchs (Page
and Ferguson, 2013) and can happen at any life stage. Entering diapause in response to vibrations
could be an adaptive strategy to avoid extreme natural events, for example storms. Future studies
could reveal whether development was totally halted or only delayed in sea hares. It would also be
very interesting to investigate whether gene expression in impacted eggs differed from controls, to
establish whether the penetrance of genetic mutations could be the mechanism for developmental
failure.
Evidence shows that the molluscan neuroendocrine system utilises some hormones that are
common throughout other taxa where the effects of stress are better known, such as
adrenocorticotrophic hormone (ACTH), noradrenaline and dopamine (Lacoste et al., 2001).
Therefore, it is possible that chronic noise stress may affect survival via the immune system or via a
physiological trade-off in resource allocation to growth and development versus the metabolic load
incurred by chronic adrenal activation. Further work could investigate whether hormone
concentrations in boat noise-exposed eggs were different from ambient controls.
7.7 Final thoughts My thesis has encompassed investigations into impacts of anthropogenic noise on a diverse range of
species in varied settings. A common theme throughout has been repeated exposure to playbacks of

104
traffic noise over the course of multiple days/weeks. This is an approach which until now has not
been attempted in the underwater environment. As a result we have developed new ways of using
recording and playback equipment. Other common themes throughout have been the use of
behavioural and developmental measures to determine impacts over time. Two of my experimental
chapters focused on how responses could differ under different circumstances; temporal regime of
exposure or length of exposure. The other two focused on measures of fitness. My work made a
logical progression from tank to field-based studies and I think that the best way to move forward
with these types of study are to combine field with laboratory studies in the same species.
The main implications of my work are that long-term impacts often need to be considered in
assessments of impacts of anthropogenic noise in order to understand the ultimate consequences. If
short-term measures are directly related to fitness (e.g. anti-predator behaviour – Chan et al., 2010;
Voellmy et al., 2014a; Simpson et al., 2015), then long-term studies may be less necessary. But my
work shows that extrapolating from short-term experiments to long-term fitness consequences is a
major issue, because responses can change over time (Bejder et al., 2009). These impacts may have
apparently subtle mechanisms but with disastrous consequences, with the potential for impacts on
population viability and community structure and function. Future work should aim to consider
measures directly related to fitness whenever possible. Longer-terms studies than those conducted
in this thesis are needed to prove conclusively whether impacts of anthropogenic noise on selective
pressures during developmental stages truly do have greater impacts for populations than impacts
at the adult stage. This would have a large impact on the field of anthropogenic noise research as
the current focus is usually on adults. Findings from studies that directly assess fitness
consequences, such as ours, are vital to parameterise population-level models that can be used to
develop international policy and regulate this issue of global concern.

105

106

107
References
Aguilar de Soto, N., Delorme, N., Atkins, J., Howard, S., Williams, J. and Johnson, M. (2013). "Anthropogenic noise causes body malformations and delays development in marine larvae." Scientific Reports 3: 2831.
Allen, G. R., Ed. (1975). Damselfishes of the South Seas. Neptune City, NJ, TFH Publications. Amorim, M. C. P. and Vasconcelos, R. O. (2008). "Variability in the mating calls of the Lusitanian
toadfish Halobatrachus didactylus: cues for potential individual recognition." Journal of Fish Biology 73(6): 1267-1283.
Amoser, S. and Ladich, F. (2003). "Diversity in noise-induced temporary hearing loss in otophysine fishes." The Journal of the Acoustical Society of America 113(4): 2170-2179.
Amoser, S., Wysocki, L. E. and Ladich, F. (2004). "Noise emission during the first powerboat race in an Alpine lake and potential impact on fish communities." The Journal of the Acoustical Society of America 116(6): 3789-3797.
Anderson, P. A., Berzins, I. K., Fogarty, F., Hamlin, H. J. and Guillette Jr, L. J. (2011). "Sound, stress, and seahorses: The consequences of a noisy environment to animal health." Aquaculture 311(1–4): 129-138.
Andrew, R. K., Howe, B. M., Mercer, J. A. and Dzieciuch, M. A. (2002). "Ocean ambient sound: Comparing the 1960s with the 1990s for a receiver off the California coast." Acoustics Research Letters Online 3(2): 65-70.
Armsworth, P. R. (2002). “Recruitment limitation, population regulation, and larval connectivity in reef fish metapopulations.” Ecology 83(4): 1092-1104.
Au, W. W. L. and Hastings, M. C. (2008). Principles of marine bioacoustics. New York, Springer. Bailey, H., Senior, B., Simmons, D., Rusin, J., Picken, G. and Thompson, P. M. (2010). "Assessing
underwater noise levels during pile-driving at an offshore windfarm and its potential effects on marine mammals." Marine Pollution Bulletin 60(6): 888-897.
Banner, A. (1968). "Measurements of the particle velocity and pressure of the ambient noise in a shallow bay." The Journal of the Acoustical Society of America 44(6): 1741-1742.
Banner, A. and Hyatt, M. (1973). "Effects of noise on eggs and larvae of two estuarine fishes." Transactions of the American Fisheries Society 102(1): 134-136.
Baradaran-Heravi, A., Cho, K. S., Tolhuis, B., Sanyal, M., Morozova, O., Morimoto, M., Elizondo, L. I., Bridgewater, D., Lubieniecka, J., Beirnes, K., Myung, C., Leung, D., Fam, H. K., Choi, K., Huang, Y., Dionis, K. Y., Zonana, J., Keller, K., Stenzel, P., Mayfield, C., Lucke, T., Bokenkamp, A., Marra, M. A., van Lohuizen, M., Lewis, D. B., Shaw, C. and Boerkoel, C. F. (2012). "Penetrance of biallelic SMARCAL1 mutations is associated with environmental and genetic disturbances of gene expression." Human Molecular Genetics 21(11): 2572-2586.
Barber, J. R., Crooks, K. R. and Fristrup, K. M. (2010). "The costs of chronic noise exposure for terrestrial organisms." Trends in Ecology & Evolution 25(3): 180-189.
Bart, A. N., Clark, J., Young, J. and Zohar, Y. (2001). "Underwater ambient noise measurements in aquaculture systems: a survey." Aquacultural Engineering 25(2): 99-110.
Barton, B. A. (2002). "Stress in fishes: a diversity of responses with particular reference to changes in circulating corticosteroids." Integrative and Comparative Biology 42(3): 517-525.
Bejder, L., Samuels, A., Whitehead, H., Finn, H. and Allen, S. (2009). "Impact assessment research: use and misuse of habituation, sensitisation and tolerance in describing wildlife responses to anthropogenic stimuli." Marine Ecology Progress Series 395: 177-185.
Bejder, L., Samuels, A. M. Y., Whitehead, H. A. L., Gales, N., Mann, J., Connor, R., Heithaus, M., Watson-Capps, J., Flaherty, C. and Krützen, M. (2006). "Decline in relative abundance of bottlenose dolphins exposed to long-term disturbance." Conservation Biology 20(6): 1791-1798.

108
Béné, C., Macfadyen, G. and Allison, E. H. (2007). Increasing the contribution of small-scale fisheries to poverty alleviation and food security
Bernardi, G., Beldade, R., Holbrook, S. J. and Schmitt, R. J. (2012). "Full-sibs in cohorts of newly settled coral reef fishes." PLoS ONE 7(9): 6.
Bhandiwad, A. A., Zeddies, D. G., Raible, D. W., Rubel, E. W. and Sisneros, J. A. (2013). "Auditory sensitivity of larval zebrafish (Danio rerio) measured using a behavioral prepulse inhibition assay." Journal of Experimental Biology 216(18): 3504-3513.
Blaxter, J. H. S. and Fuiman, L. A. (1990). "The role of the sensory systems of herring larvae in evading predatory fishes." Journal of the Marine Biological Association of the United Kingdom 70(2): 413-427.
Bleckmann, H. (2004). "3-D-orientation with the octavolateralis system." Journal of Physiology-Paris 98(1-3): 53-65.
Bleckmann, H. and Zelick, R. (2009). "Lateral line system of fish." Integrative Zoology 4(1): 13-25. Blickley, J. L., Word, K. R., Krakauer, A. H., Phillips, J. L., Sells, S. N., Taff, C. C., Wingfield, J. C. and
Patricelli, G. L. (2012). "Experimental chronic noise is related to elevated fecal corticosteroid metabolites in lekking male greater sage-grouse (Centrocercus urophasianus)." PLoS ONE 7(11): e50462.
Bolle, L. J., de Jong, C. A. F., Bierman, S. M., van Beek, P. J. G., van Keeken, O. A., Wessels, P. W., van Damme, C. J. G., Winter, H. V., de Haan, D. and Dekeling, R. P. A. (2012). "Common sole larvae survive high levels of pile-driving sound in controlled exposure experiments." PLoS ONE 7(3): e33052.
Bookstein, F. L. (1991). Morphometric tools for landmark data: geometry and biology. Cambridge, Cambridge University Press.
Bourke, S. A., Turchenek, J., Schmeling, E. E., Mahmood, F. N., Olson, B. M. and Hendry, M. J. (2015). "Comparison of continuous core profiles and monitoring wells for assessing groundwater contamination by agricultural nitrate." Ground Water Monitoring and Remediation 35(1): 110-117.
Bradbury, J. W. and Vehrencamp, S. L. (1998). Principles of animal communication. Sunderland, MA, Sinauer Associates, Inc.
Brown, J. A., Minkoff, G. and Puvanendran, V. (2003). "Larviculture of Atlantic cod (Gadus morhua): progress, protocols and problems." Aquaculture 227(1–4): 357-372.
Bruintjes, R., Armstrong-Smith, E., Botterell, Z., Renshaw, E., Tozer, B., Benson, T., Rossington, K., Jones, D. and Simpson, S. D. (2014). A tool to predict the impact of anthropogenic noise on fish. 2nd International Conference on Environmental Interactions of Marine Renewable Energy Technologies, Stornoway, Isle of Lewis, Outer Hebrides, Scotland.
Bruintjes, R. and Radford, A. N. (2013). "Context-dependent impacts of anthropogenic noise on individual and social behaviour in a cooperatively breeding fish." Animal Behaviour 85(6): 1343-1349.
Bruintjes, R. and Radford, A. N. (2014). "Chronic playback of boat noise does not impact hatching success or post-hatching larval growth and survival in a cichlid fish." Peerj 2: e594.
Buckley, J., Maunder, R. J., Foey, A., Pearce, J., Val, A. L. and Sloman, K. A. (2010). "Biparental mucus feeding: a unique example of parental care in an Amazonian cichlid." Journal of Experimental Biology 213(22): 3787-3795.
Buckley, J., Val, A. L. and Sloman, K. A. (2011). "Response to "Comment on 'Biparental mucus feeding: a unique example of parental care in an Amazonian cichlid'"." Journal of Experimental Biology 214(7): 1214-1214.
Caiger, P. E., Montgomery, J. C. and Radford, C. A. (2012). "Chronic low-intensity noise exposure affects the hearing thresholds of juvenile snapper." Marine Ecology Progress Series 466: 225-232.
Carew, T. J. and Kandel, E. R. (1973). "Acquisition and retention of long-term habituation in Aplysia - correlation of behavioral and cellular processes." Science 182(4117): 1158-1161.
109
Casper, B. and Mann, D. (2006). "Evoked potential audiograms of the nurse shark (Ginglymostoma cirratum) and the yellow stingray (Urobatis jamaicensis)." Environmental Biology of Fishes 76(1): 101-108.
Casper, B. M. and Mann, D. A. (2007a). "Dipole hearing measurements in elasmobranch fishes." Journal of Experimental Biology 210(1): 75-81.
Casper, B. M. and Mann, D. A. (2007b). "The directional hearing abilities of two species of bamboo sharks." Journal of Experimental Biology 210(3): 505-511.
CEFAS (2007). Potential effects of offshore wind farm noise on fish Chan, A., Giraldo-Perez, P., Smith, S. and Blumstein, D. T. (2010). "Anthropogenic noise affects risk
assessment and attention: the distracted prey hypothesis." Biology Letters 6(4): 458-461. Chapman, C. J. and Hawkins, A. D. (1973). "Field study of hearing in cod, Gadus morhua L." Journal of
Comparative Physiology 85(2): 147-167. Chia, F. S., Koss, R. and Bickell, L. R. (1981). "Fine-structural study of the statocysts in the veliger
larva of the nudibranch, Rostanga puchra." Cell and Tissue Research 214(1): 67-80. Clark, C. W., Ellison, W. T., Southall, B. L., Hatch, L., Van Parijs, S. M., Frankel, A. and Ponirakis, D.
(2009). "Acoustic masking in marine ecosystems: intuitions, analysis, and implication." Marine Ecology Progress Series 395: 201-222.
Clarke, K. R. and Gorley, R. N. (2006). PRIMER V6: user manual/tutorial. PRIMER-E. Plymouth. Clarke, K. R. and Warwick, R. M. (2001). Change in marine communities: an approach to statistical
analysis and interpretation. Plymouth, UK, Plymouth Marine Laboratory. Clutton-Brock, T. H. (1991). Monographs in behaviour and ecology: The evolution of parental care.
Princeton University Press: Princeton, New Jersey, USA, Princeton University Press. Coffin, A. B., Zeddies, D. G., Fay, R. R., Brown, A. D., Alderks, P. W., Bhandiwad, A. A., Mohr, R. A.,
Gray, M. D., Rogers, P. H. and Sisneros, J. A. (2014). "Use of the swim bladder and lateral line in near-field sound source localization by fish." Journal of Experimental Biology 217(12): 2078-2088.
Coggeshall, R. E. (1969). "A fine structural analysis of the statocyst in Aplysia californica." Journal of Morphology 127(1): 113-131.
Cohen, S. and Spacapan, S. (1984). The social psychology of noise. In Noise and society. D. M. Jones and Chapman, A. J. (eds). Chichester, John Wiley and Sons Ltd.: 221-245.
Colgan, P. W. and Brown, J. A. (1988). "Dynamics of nest defense by male centrarchid fish." Behavioural Processes 17(1): 17-26.
Connell, S. D. (1998). "Effects of predators on growth, mortality and abundance of a juvenile reef-fish: evidence from manipulations of predator and prey abundance." Marine Ecology Progress Series 169: 251-261.
Crino, O. L., Johnson, E. E., Blickley, J. L., Patricelli, G. L. and Breuner, C. W. (2013). "Effects of experimentally elevated traffic noise on nestling white-crowned sparrow stress physiology, immune function and life history." Journal of Experimental Biology 216(11): 2055-2062.
Cyr, N. E. and Romero, L. M. (2009). "Identifying hormonal habituation in field studies of stress." General and Comparative Endocrinology 161(3): 295-303.
Dahl, P. H., Dall, apos, Osto, D. R. and Farrell, D. M. (2015). "The underwater sound field from vibratory pile driving." The Journal of the Acoustical Society of America 137(6): 3544-3554.
Davidson, J., Bebak, J. and Mazik, P. (2009). "The effects of aquaculture production noise on the growth, condition factor, feed conversion, and survival of rainbow trout, Oncorhynchus mykiss." Aquaculture 288(3-4): 337-343.
Deng, Z. D., Southall, B. L., Carlson, T. J., Xu, J., Martinez, J. J., Weiland, M. A. and Ingraham, J. M. (2014). "200 kHz commercial sonar systems generate lower frequency side lobes audible to some marine mammals." PLoS ONE 9(4): e95315.
Dickens, M. J. and Romero, L. M. (2013). "A consensus endocrine profile for chronically stressed wild animals does not exist." General and Comparative Endocrinology 191: 177-189.
Doksæter, L., Rune Godø, O., Olav Handegard, N., Kvadsheim, P. H., Lam, F.-P. A., Donovan, C. and

110
Miller, P. J. O. (2009). "Behavioral responses of herring (Clupea harengus) to 1–2 and 6–7kHz sonar signals and killer whale feeding sounds." The Journal of the Acoustical Society of America 125(1): 554-564.
Donelson, J. M., McCormick, M. I. and Munday, P. L. (2008). "Parental condition affects early life-history of a coral reef fish." Journal of Experimental Marine Biology and Ecology 360(2): 109-116.
Dorit, R. L., Walkter, W. F. and Barnes, R. D. (1991). Zoology. Orlando, Florida, Saunders College Publishing.
ec.europa.eu. "2015." Retrieved 01/02/15, 2015. Egner, S. A. and Mann, D. A. (2005). "Auditory sensitivity of sergeant major damselfish Abudefduf
saxatilis from post-settlement juvenile to adult." Marine Ecology Progress Series 285: 213-222.
Ellenberg, U., Setiawan, A. N., Cree, A., Houston, D. M. and Seddon, P. J. (2007). "Elevated hormonal stress response and reduced reproductive output in yellow-eyed penguins exposed to unregulated tourism." General and Comparative Endocrinology 152(1): 54-63.
Engen, F. and Folstad, I. (1999). "Cod courtship song: a song at the expense of dance?" Canadian Journal of Zoology 77(4): 542-550.
Enger, P. S. (1973). "Masking of auditory responses in the medulla oblongata of goldfish." Journal of Experimental Biology 59(2): 415-424.
Erbe, C. B. (2011). Underwater acoustics: noise and effects on marine mammals. A pocket handbook. 3rd edition. Droxford, Hampshire, UK, JASCO Applied Sciences.
Fay, R. (1969). "Behavioral audiogram for goldfish." Journal of Auditory Research 9(2): 112-121. Fay, R. (1984). "The goldfish ear codes the axis of acoustic particle motion in three dimensions."
Science 225(4665): 951-954. Fay, R. (2009). "Soundscapes and the sense of hearing of fishes." Integrative Zoology 4(1): 26-32. Fay, R. R. (1970a). "Auditory frequency generalization in goldfish (Carassius auratus)." Journal of the
Experimental Analysis of Behavior 14(3): 353. Fay, R. R. (1970b). "Auditory frequency discrimination in goldfish (Carassius auratus)." Journal of
Comparative and Physiological Psychology 73(2): 175. Fay, R. R. (1972). "Perception of amplitude-modulated auditory signals by goldfish." The Journal of
the Acoustical Society of America 52(2): 660-666. Fay, R. R. (1974). "Masking of tones by noise for the goldfish (Carassius auratus)." Journal of
Comparative and Physiological Psychology 87(4): 708-716. Fay, R. R., Ahroon, W. A. and Orawski, A. A. (1978). "Auditory masking patterns in the goldfish
(Carassius auratus): psychophysical tuning curves." Journal of Experimental Biology 74(1): 83-100.
Fay, R. R. and Popper, A. N. (1974). "Acoustic stimulation of the ear of the goldfish (Carassius auratus)." Journal of Experimental Biology 61(1): 243-260.
Fish, J. F. and Offutt, G. C. (1972). "Hearing thresholds from toadfish, Opsanus tau, measured in the laboratory and field." The Journal of the Acoustical Society of America 51(4B): 1318-1321.
Francis, C. D. and Barber, J. R. (2013). "A framework for understanding noise impacts on wildlife: an urgent conservation priority." Frontiers in Ecology and the Environment 11(6): 305-313.
Francis, C. D., Ortega, C. P. and Cruz, A. (2009). "Noise pollution changes avian communities and species interactions." Current Biology 19(16): 1415-1419.
Francis, C. D., Paritsis, J., Ortega, C. P. and Cruz, A. (2011). "Landscape patterns of avian habitat use and nest success are affected by chronic gas well compressor noise." Landscape Ecology 26(9): 1269-1280.
Gagliano, M., McCormick, M. I. and Meekan, M. G. (2007). "Temperature-induced shifts in selective pressure at a critical developmental transition." Oecologia 152(2): 219-225.
Galhardo, L., Vital, J. and Oliveira, R. F. (2011). "The role of predictability in the stress response of a cichlid fish." Physiology & Behavior 102(3–4): 367-372.

111
Gans, C. (1992). An overview of the evolutionary biology of hearing. .In The evolutionary biology of hearing. D. B. Webster, Fay, R. R. and Popper, A. N. (eds). New York, Springer-Verlag: 3-13.
Gaston, K. J., Bennie, J., Davies, T. W. and Hopkins, J. (2013). "The ecological impacts of nighttime light pollution: a mechanistic appraisal." Biological Reviews 88(4): 912-927.
Ghazali, S. M. (2012). Fish vocalisation: understanding its role from from temporal and spatial characteristics. PhD, University of Auckland.
Gilbert, S. F. (2001). "Ecological developmental biology: developmental biology meets the real world." Developmental Biology 233(1): 1-12.
Govoni, J. J., West, M. A., Settle, L. R., Lynch, R. T. and Greene, M. D. (2008). "Effects of underwater explosions on larval fish: Implications for a coastal engineering project." Journal of Coastal Research 24(2B): 228-233.
Gross, J. A., Irvine, K. M., Wilmoth, S., Wagner, T. L., Shields, P. A. and Fox, J. R. (2013). "The effects of pulse pressure from seismic water gun technology on northern pike." Transactions of the American Fisheries Society 142(5): 1335-1346.
Grutter, A. S. and Bshary, R. (2003). "Cleaner wrasse prefer client mucus: support for partner control mechanisms in cleaning interactions." Proceedings of the Royal Society B 270: S242-S244.
Gutscher, M., Wysocki, L. E. and Ladich, F. (2011). "Effects of aquarium and pond noise on hearing sensitivity in an otophysine fish." Bioacoustics 20(2): 117-136.
Habib, L., Bayne, E. M. and Boutin, S. (2007). "Chronic industrial noise affects pairing success and age structure of ovenbirds Seiurus aurocapilla." Journal of Applied Ecology 44(1): 176-184.
Halvorsen, M. B., Casper, B. M., Woodley, C. M., Carlson, T. J. and Popper, A. N. (2012). "Threshold for onset of injury in Chinook salmon from exposure to impulsive pile driving sounds." PLoS ONE 7(6): e38968.
Hamdoun, A. and Epel, D. (2007). "Embryo stability and vulnerability in an always changing world." Proceedings of the National Academy of Sciences, USA 104(6): 1745-1750.
Harley, C. D. G., Hughes, A. R., Hultgren, K. M., Miner, B. G., Sorte, C. J. B., Thornber, C. S., Rodriguez, L. F., Tomanek, L. and Williams, S. L. (2006). "The impacts of climate change in coastal marine systems." Ecology Letters 9(2): 228-241.
Hastings, M. C., Popper, A. N., Finneran, J. J. and Lanford, P. J. (1996). "Effects of low-frequency underwater sound on hair cells of the inner ear and lateral line of the teleost fish Astronotus ocellatus." The Journal of the Acoustical Society of America 99(3): 1759-1766.
Hawkins, A. (2014). Responses of free-living coastal pelagic fish to impulsive sounds. Proceedings of the 2nd International Conference on Environmental Interactions of Marine Renewable Energy Technologies, Stornoway, Isle of Lewis, Outer Hebrides, Scotland.
Hawkins, A., Pembroke, A. and Popper, A. (2015). "Information gaps in understanding the effects of noise on fishes and invertebrates." Reviews in Fish Biology and Fisheries 25(1): 39-64.
Hawkins, A. D. and Chapman, C. J. (1975). "Masked auditory thresholds in the cod Gadus morhua L." Journal of Comparative Physiology A 103(2): 209-226.
Hawkins, A. D. and Johnstone, A. D. F. (1978). "The hearing of the Atlantic salmon, Salmo salar." Journal of Fish Biology 13(6): 655-673.
Higginson, A. D., Fawcett, T. W., Trimmer, P. C., McNamara, J. M. and Houston, A. I. (2012). "Generalized optimal risk allocation: foraging and antipredator behavior in a fluctuating environment." The American Naturalist 180(5): 589-603.
Higgs, D. M. and Radford, C. A. (2013). "The contribution of the lateral line to 'hearing' in fish." Journal of Experimental Biology 216(8): 1484-1490.
Higgs, D. M., Rollo, A. K., Souza, M. J. and Popper, A. N. (2003). "Development of form and function in peripheral auditory structures of the zebrafish (Danio rerio)." The Journal of the Acoustical Society of America 113(2): 1145-1154.
Higgs, D. M., Souza, M. J., Wilkins, H. R., Presson, J. C. and Popper, A. N. (2001). "Age- and size-related changes in the inner ear and hearing ability of the adult zebrafish (Danio rerio)." Journal of the Association for Research in Otolaryngology 3(2): 174-184.

112
Hinde, R. A. (1954). "Factors governing the changes in strength of a partially inborn response, as shown by the mobbing behaivour of the chaffinch (Fringilla coelebs). 2. The waning of the response." Proceedings of the Royal Society Series B-Biological Sciences 142(908): 331-358.
Hoelzel, A. R. (2002). Marine mammal biology an evolutionary approach. Oxford, Blackwell Publishing.
Holbrook, R. I. (2011). "Comment on 'Biparental mucus feeding: a unique example of parental care in an Amazonian cichlid'." Journal of Experimental Biology 214(7): 1213-1214.
Holles, S. (2010). The impact of ship noise on three-spined stickleback behaviour. M.Sc. by research, University of Bristol.
Holles, S., Simpson, S. D., Radford, A. N., Berten, L. and Lecchini, D. (2013). "Boat noise disrupts orientation behaviour in a coral reef fish." Marine Ecology Progress Series 485: 295-300.
Jinham, A., Kiruba, S., Kumaran, J. and Manohar Das, S. (2012). "Efficacy of audible sound waves in inflicting tissue damage and mortality in Trilobium castaneum (Coleoptera: Tenebrionidae) larvae." Agriculture Tropica et Subtropica 45(1): 32-36.
Jordan, L. A., Herbert-Read, J. E. and Ward, A. J. W. (2013). "Rising costs of care make spiny chromis discerning parents." Behavioral Ecology and Sociobiology 67(3): 449-455.
Jung, C. A. and Swearer, S. E. (2011). "Reactions of temperate reef fish larvae to boat sound." Aquatic Conservation: Marine and Freshwater Ecosystems 21(4): 389-396.
Kaifu, K., Akamatsu, T. and Segawa, S. (2008). "Underwater sound detection by cephalopod statocyst." Fisheries Science 74(4): 781-786.
Kaiser, K., Scofield, D. G., Alloush, M., Jones, R. M., Marczak, S., Martineau, K., Oliva, M. A. and Narins, P. M. (2011). "When sounds collide: the effect of anthropogenic noise on a breeding assemblage of frogs in Belize, Central America." Behaviour 148(2): 215-232.
Kaluza, P., Kölzsch, A., Gastner, M. T. and Blasius, B. (2010). "The complex network of global cargo ship movements." Journal of The Royal Society Interface 7(48): 1093-1103.
Kane, A. S., Song, J., Halvorsen, M. B., Miller, D. L., Salierno, J. D., Wysocki, L. E., Zeddies, D. and Popper, A. N. (2010). "Exposure of fish to high-intensity sonar does not induce acute pathology." Journal of Fish Biology 76(7): 1825-1840.
Kastelein, R. A., Heul, S. v. d., Verboom, W. C., Jennings, N., Veen, J. v. d. and de Haan, D. (2008). "Startle response of captive North Sea fish species to underwater tones between 0.1 and 64 kHz." Marine Environmental Research 65(5): 369-377.
Kavanagh, K. (1998). "Notes on the frequency and function of glancing behavior in juvenile Acanthochromis (Pomacentridae)." Copeia 1998(2): 493-496.
Kearns, C. (2010). "Conservation of biodiversity." Nature Education Knowledge 1(9): 7. Kenyon, T. N. (1996). "Ontogenetic changes in the auditory sensitivity of damselfishes
(Pomacentridae)." Journal of Comparative Physiology A 179(4): 553-561. Kenyon, T. N., Ladich, F. and Yan, H. Y. (1998). "A comparative study of hearing ability in fishes: the
auditory brainstem response approach." Journal of Comparative Physiology A 182(3): 307-318.
Kight, C. R. and Swaddle, J. P. (2011). "How and why environmental noise impacts animals: an integrative, mechanistic review." Ecology Letters 14(10): 1052-1061.
Klimley, A. P. and Beavers, S. C. (1998). "Playback of acoustic thermometry of ocean climate (ATOC) -like signal to bony fishes to evaluate phonotaxis." The Journal of the Acoustical Society of America 104(4): 2506-2510.
Knudsen, F. R., Enger, P. S. and Sand, O. (1992). "Awareness reactions and avoidance responses to sound in juvenile Atlantic salmon, Salmo salar L." Journal of Fish Biology 40(4): 523-534.
Knudsen, F. R., Schreck, C. B., Knapp, S. M., Enger, P. S. and Sand, O. (1997). "Infrasound produces flight and avoidance responses in Pacific juvenile salmonids." Journal of Fish Biology 51(4): 824-829.
Kostyuchenko, L. P. (1973). "Effect of elastic waves generated in marine seismic prospecting on fish eggs in the Black Sea." Hydrobiological Journal 9(5): 45-48.

113
Kuttruff, H. (2006). Acoustics: an introduction. London, UK, Taylor & Francis. Kvadsheim, P. H. and Sevaldsen, E. M. (2005). The potential impact of 1–8 kHz active sonar on stocks
of junveile fish during sonar exercises FFI/RAPPORT-2005/01027. Kyhn, L. A., Sveegaard, S. and Tougaard, J. (2014). "Underwater noise emissions from a drillship in
the Arctic." Marine Pollution Bulletin 86(1-2): 424-433. Lacoste, A., Malham, S. K., Cueff, A., Jalabert, F., Gelebart, F. and Poulet, S. A. (2001). "Evidence for a
form of adrenergic response to stress in the mollusc Crassostrea gigas." Journal of Experimental Biology 204(7): 1247-1255.
Ladich, F. (1997). "Agonistic behaviour and significance of sounds in vocalizing fish." Marine and Freshwater Behaviour and Physiology 29(1-4): 87-108.
Ladich, F. (1999). "Did auditory sensitivity end vocalization evolve independently in otophysan fishes?" Brain Behavior and Evolution 53(5-6): 288-304.
Ladich, F. (2001). "Sound-generating and -detecting motor system in catfish: Design of swimbladder muscles in doradids and pimelodids." Anatomical Record 263(3): 297-306.
Ladich, F. and Yan, H. Y. (1998). "Correlation between auditory sensitivity and vocalization in anabantoid fishes." Journal of Comparative Physiology A 182(6): 737-746.
Leahy, S. M., McCormick, M. I., Mitchell, M. D. and Ferrari, M. C. O. (2011). "To fear or to feed: the effects of turbidity on perception of risk by a marine fish." Biology Letters 7(6): 811-813.
Lecchini, D. and Galzin, R. (2005). "Spatial repartition and ontogenetic shifts in habitat use by coral reef fishes (Moorea, French Polynesia)." Marine Biology 147(1): 47-58.
Lechner, W., Wysocki, L. E. and Ladich, F. (2010). "Ontogenetic development of auditory sensitivity and sound production in the squeaker catfish Synodontis schoutedeni." BMC Biology 8: 10.
Lee, W.-S., Monaghan, P. and Metcalfe, N. B. (2013). "Experimental demonstration of the growth rate–lifespan trade-off." Proceedings of the Royal Society B 280(1752): 20122370.
Leonard, M. L. and Horn, A. G. (2012). "Ambient noise increases missed detections in nestling birds." Biology Letters 8(4): 530-532.
Leslie, C. B., Kendall, J. M. and Jones, J. L. (1956). "Hydrophone for measuring particle velocity." The Journal of the Acoustical Society of America 28(4): 711-715.
Lillis, A., Eggleston, D. B. and Bohnenstiehl, D. R. (2013). "Oyster larvae settle in response to habitat-associated underwater sounds." PLoS ONE 8(10): e79337.
Lovell, J. M., Findlay, M. M., Moate, R. M. and Yan, H. Y. (2005a). "The hearing abilities of the prawn Palaemon serratus." Comparative Biochemistry and Physiology A 140(1): 89-100.
Lovell, J. M., Findlay, M. M., Moate, R. M., Nedwell, J. R. and Pegg, M. A. (2005b). "The inner ear morphology and hearing abilities of the paddlefish (Polyodon spathula) and the lake sturgeon (Acipenser fulvescens)." Comparative Biochemistry and Physiology A 142(3): 286-296.
Lu, Z., Popper, A. N. and Fay, R. R. (1996). "Behavioral detection of acoustic particle motion by a teleost fish (Astronotus ocellatus): sensitivity and directionality." Journal of Comparative Physiology A 179(2): 227-233.
Lu, Z. M. and DeSmidt, A. A. (2013). "Early development of hearing in zebrafish." Journal of the Association for Research in Otolaryngology 14(4): 509-521.
Lugli, M. and Fine, M. L. (2007). "Stream ambient noise, spectrum and propagation of sounds in the goby Padogobius martensii: Sound pressure and particle velocity." The Journal of the Acoustical Society of America 122(5): 2881-2892.
Markey, C. M., Luque, E. H., de Toro, M. M., Sonnenschein, C. and Soto, A. M. (2001). "In utero exposure to bisphenol a alters the development and tissue organization of the mouse mammary gland." Biology of Reproduction 65(4): 1215-1223.
Martin, B., Zeddies, D. G., Gaudet, B. and Richard, J. (in press). Evaluation of three sensor types for particle motion measurement.In The Effects of Noise on Aquatic Life II. A. N. Popper and Hawkins, A. (eds), Springer Science+Business Media, LLC, New York.
McEwen, B. S. and Stellar, E. (1993). "Stress and the individual. Mechanisms leading to disease."

114
Archives of Internal Medicine 153(18): 2093-2101. McKibben, J. R. and Bass, A. H. (1999). "Peripheral encoding of behaviorally relevant acoustic signals
in a vocal fish: single tones." Journal of Comparative Physiology A 184(6): 563-576. MEPC (2013). Noise from commercial shipping and its adverse impacts on marine life Merchant, N. D., Fristrup, K. M., Johnson, M. P., Tyack, P. L., Witt, M. J., Blondel, P. and Parks, S. E.
(2015). "Measuring acoustic habitats." Methods in Ecology and Evolution 6(3): 257-265. Meyer, K. (1991). "Estimating variances and covariances for multivariate animal-models by restricted
maximum-likelihood." Genetics Selection Evolution 23(1): 67-83. Mills, S. C., Mourier, J. and Galzin, R. (2010). "Plasma cortisol and 11-ketotestosterone enzyme
immunoassay (EIA) kit validation for three fish species: the orange clownfish Amphiprion percula, the orangefin anemonefish Amphiprion chrysopterus and the blacktip reef shark Carcharhinus melanopterus." Journal of Fish Biology 77(3): 769-777.
Mirjany, M., Preuss, T. and Faber, D. S. (2011). "Role of the lateral line mechanosensory system in directionality of goldfish auditory evoked escape response." Journal of Experimental Biology 214(20): 3358-3367.
Mooney, T. A., Hanlon, R. T., Christensen-Dalsgaard, J., Madsen, P. T., Ketten, D. R. and Nachtigall, P. E. (2010). "Sound detection by the longfin squid (Loligo pealeii) studied with auditory evoked potentials: sensitivity to low-frequency particle motion and not pressure." Journal of Experimental Biology 213(21): 3748-3759.
Morley, E. L., Jones, G. and Radford, A. N. (2014). "The importance of invertebrates when considering the impacts of anthropogenic noise." Proceedings of the Royal Society B 281(1776): 20132683.
Myrberg, A. A. and Spires J. Y. (1980). "Hearing in damselfishes: An analysis of signal detection among closely related species’." Journal of Comparative Physiology: A 140(2): 135-144.
Nagajyoti, P. C., Lee, K. D. and Sreekanth, T. V. M. (2010). "Heavy metals, occurrence and toxicity for plants: a review." Environmental Chemistry Letters 8(3): 199-216.
Naguib, M., van Oers, K., Braakhuis, A., Griffioen, M., de Goede, P. and Waas, J. R. (2013). "Noise annoys: effects of noise on breeding great tits depend on personality but not on noise characteristics." Animal Behaviour 85(5): 949-956.
Nakazono, A. (1993). "One-parent removal experiment in the brood-caring damselfish, Acanthochromis polyacanthus, with preliminary data on reproductive biology." Marine and Freshwater Research 44(5): 699-707.
Nash, R. D. M., Valencia, A. H. and Geffen, A. J. (2006). "The origin of Fulton's condition factor - Setting the record straight." Fisheries 31(5): 236-238.
Nedelec, S. L., Radford, A. N., Simpson, S. D., Nedelec, B., Lecchini, D. and Mills, S. C. (2014). "Anthropogenic noise playback impairs embryonic development and increases mortality in a marine invertebrate." Scientific Reports 4: 5891.
Nelson, D. R. and Gruber, S. H. (1963). "Sharks: attraction by low-frequency sounds." Science 142(3594): 975-977.
Neo, Y. Y., Parie, L., Bakker, F., Snelderwaard, P., Tudorache, C., Schaaf, M. and Slabbekoorn, H. (2015). "Behavioural changes in response to sound exposure and no spatial avoidance of noisy conditions in captive zebrafish." Frontiers in Behavioral Neuroscience 9: 28.
Neo, Y. Y., Seitz, J., Kastelein, R. A., Winter, H. V., ten Cate, C. and Slabbekoorn, H. (2014). "Temporal structure of sound affects behavioural recovery from noise impact in European seabass." Biological Conservation 178: 65-73.
Nomura, I. (2009). The state of the world's fisheries and aquaculture United Nations Food and Agriculture Organisation (FAO), Rome.
Normandeau Associates, I. (2012). Effects of noise on fish, fisheries, and invertebrates in the U.S. Atlantic and Arctic from energy industry sound-generating activities. A literature synthesis for the U.S. dept. of the interior, bureau of ocean energy management.
NRC (1995). Ocean Studies Board Annual Report

115
Ona, E., Godo, O. R., Handegard, N. O., Hjellvik, V., Patel, R. and Pedersen, G. (2007). "Silent research vessels are not quiet." The Journal of the Acoustical Society of America 121(4): EL145-EL150.
Packard, A., Karlsen, H. E. and Sand, O. (1990). "Low frequency hearing in cephalopods." Journal of Comparative Physiology A 166(4): 501-505.
Page, L. R. and Ferguson, S. J. (2013). "The other gastropod larvae: Larval morphogenesis in a marine neritimorph." Journal of Morphology 274(4): 412-428.
Parvulescu, A. (1967). The acoustics of small tanks.In Marine Bioacoustics. W. N. Tavolga (eds). Oxford, Pergamon: 87-100.
Paul, V. J. and Pennings, S. C. (1991). "Diet-derived chemical defenses in the sea hare Stylocheilus longicauda (Quoy et Gaimard 1824)." Journal of Experimental Marine Biology and Ecology 151(2): 227-243.
Pereira, R., Rismondo, S., Caiano, M., Pedroso, S. S., Fonseca, P. J. and Amorim, M. C. P. (2014). "The role of agonistic sounds in male nest defence in the painted goby Pomatoschistus pictus." Ethology 120(1): 53-63.
Petrinovich, L. and Patterson, T. L. (1979). "Field studies of habituation 1. Effect of reproductive condition, number of trials, and different delay intervals on responses of the white-crowned sparrow." Journal of Comparative and Physiological Psychology 93(2): 337-350.
Picciulin, M., Sebastianutto, L., Codarin, A., Farina, A. and Ferrero, E. A. (2010). "In situ behavioural responses to boat noise exposure of Gobius cruentatus (Gmelin, 1789; fam. Gobiidae) and Chromis chromis (Linnaeus, 1758; fam. Pomacentridae) living in a Marine Protected Area." Journal of Experimental Marine Biology and Ecology 386(1-2): 125-132.
Pimm, S. L., Jenkins, C. N., Abell, R., Brooks, T. M., Gittleman, J. L., Joppa, L. N., Raven, P. H., Roberts, C. M. and Sexton, J. O. (2014). "The biodiversity of species and their rates of extinction, distribution, and protection." Science 344(6187): 1246752.
Plikaytis, B. D., Holder, P. F., Pais, L. B., Maslanka, S. E., Gheesling, L. L. and Carlone, G. M. (1994). "Determination of parallelism and nonparallelism in bioassay dilution curves." Journal of Clinical Microbiology 32(10): 2441-2447.
Popper, A. N. (2003). "Effects of anthropogenic sounds on fishes." Fisheries 28(10): 24-31. Popper, A. N., Carlson, T., Hawkins, A., Southall, B. and Gentry, R. (2006). Interim criteria for injury of
fish exposed to pile driving operations: a white paper Popper, A. N. and Fay, R. R. (2011). "Rethinking sound detection by fishes." Hearing Research 273
(1-2): 25-36. Popper, A. N., Halvorsen, M. B., Kane, A., Miller, D. L., Smith, M. E., Song, J., Stein, P. and Wysocki, L.
E. (2007). "The effects of high-intensity, low-frequency active sonar on rainbow trout." The Journal of the Acoustical Society of America 122(1): 623-635.
Popper, A. N. and Hastings, M. C. (2009). "The effects of anthropogenic sources of sound on fishes." Journal of Fish Biology 75(3): 455-489.
Popper, A. N., Hawkins, A. D., Fay, R. R., Mann, D. A., Bartol, S., Carlson, T. J., Coombs, S., Ellison, W. T., Gentry, R. L., Halvorsen, M. B., Løkkeborg, S., Rogers, P. H., Southall, B. L., Zeddies, D. G. and Tavolga, W. N. (2014). Sound exposure guidelines for fishes and sea turtles: a technical report prepared by ANSI-accredited standards committee S3/SC1 and registered with ANSI
Popper, A. N., Salmon, M. and Horch, K. W. (2001). "Acoustic detection and communication by decapod crustaceans." Journal of Comparative Physiology A 187(2): 83-89.
Popper, A. N., Smith, M. E., Cott, P. A., Hanna, B. W., MacGillivray, A. O., Austin, M. E. and Mann, D. A. (2005). "Effects of exposure to seismic airgun use on hearing of three fish species." The Journal of the Acoustical Society of America 117(6): 3958-3971.
Prior, H. (2002). "Effects of predictable and unpredictable intermittent noise on spatial learning in rats." Behavioural Brain Research 133(2): 117-124.
Purser, J. and Radford, A. N. (2011). "Acoustic noise induces attention shifts and reduces foraging performance in three-spined sticklebacks (Gasterosteus aculeatus)." PLoS ONE 6(2): e17478.
Qin, Q., Chen, X. J. and Zhuang, J. (2015). "The fate and impact of pharmaceuticals and personal care

116
products in agricultural soils irrigated with reclaimed water." Critical Reviews in Environmental Science and Technology 45(13): 1379-1408.
Rabin, L. A., Coss, R. G. and Owings, D. H. (2006). "The effects of wind turbines on antipredator behavior in California ground squirrels (Spermophilus beecheyi)." Biological Conservation 131(3): 410-420.
Radford, A. N., Morley, E. L. and Jones, G. (2012). The effects of noise on biodiversity NO0235. Radford, A. N., Purser, J., Bruintjes, R., Voellmy, I. K., Everley, K. A., Wale, M. A., Holles, S. and
Simpson, S. D. (in press). Beyond a simple effect: variable and changing responses to anthropogenic noise.In Effects of Noise on Aquatic Life II. A. N. Popper and Hawkins, A. (eds). New York, Springer Science+Business Media, LLC, New York.
Radford, C., Jeffs, A., Tindle, C. and Montgomery, J. (2008). "Temporal patterns in ambient noise of biological origin from a shallow water temperate reef." Oecologia 156(4): 921-929.
Radford, C. A., Montgomery, J. C., Caiger, P. and Higgs, D. M. (2012). "Pressure and particle motion detection thresholds in fish: a re-examination of salient auditory cues in teleosts." Journal of Experimental Biology 215(19): 3429-3435.
Ramcharitar, J. and Popper, A. N. (2004). "Masked auditory thresholds in sciaenid fishes: A comparative study." The Journal of the Acoustical Society of America 116(3): 1687-1691.
Ramcharitar, J. U., Deng, X., Ketten, D. and Popper, A. N. (2004). "Form and function in the unique inner ear of a teleost: The silver perch (Bairdiella chrysoura)." The Journal of Comparative Neurology 475(4): 531-539.
Richardson, W. J., Greene, C. R., Malme, C. I., Thomsen, D. H., Moore, S. E. and Würsig, B. (1995). Marine mammals and noise. San Diego, CA, Academic Press.
Rodkin, R., Pommerenck, K. and Reyff, J. (2012). "Interim criteria for injury to fish from pile-driving activities: recent experiences." Advances in Experimental Medicine and Biology 730: 545-549.
Rohlf, F. J. (2001). "tpsDIG, Program version 1.43." http://life.bio.sunysb.edu/morph/softdataacq.html Retrieved 5th May, 2012.
Rohlf, F. J. (2010). "TpsRelw." Retrieved 5th May, 2012. Rossington, K., Benson, T., Lepper, P. and Jones, D. (2013). "Eco-hydro-acoustic modeling and its use
as an EIA tool." Marine Pollution Bulletin 75(1-2): 235-243. Rumrill, S. S. (1990). "Natural mortality of marine invertebrate larvae." Ophelia 32(1-2): 163-198. Sand, O. and Karlsen, H. E. (2000). "Detection of infrasound and linear acceleration in fishes."
Philosophical Transactions of the Royal Society of London Series B 355(1401): 1295-1298. Schreck, C. B. (2000). Accumulation and long-term effects of stress in fish.In The biology of animal
stress: basic principles and implications for animal welfare,. G. P. Moberg and Mench, J. A. (eds). New York, Cabi Publishing: 147-159.
Schuijf, A. (1975). "Directional hearing of cod (Gadus morhua) under approximate free field conditions." Journal of Comparative Physiology 98(4): 307-332.
Schuijf, A., Baretta, J. W. and Wildschut, J. T. (1972). "A field investigation on the discrimination of sound direction in Labrus berggylta Pisces Perciformes." Netherlands Journal of Zoology 22(1): 81-104.
Schütz, M. and Barlow, G. W. (1997). "Young of the Midas cichlid get biologically active nonnutrients by eating mucus from the surface of their parents." Fish Physiology and Biochemistry 16(1): 11-18.
Shannon, G., McKenna, M. F., Angeloni, L. M., Crooks, K. R., Fristrup, K. M., Brown, E., Warner, K. A., Nelson, M. D., White, C., Briggs, J., McFarland, S. and Wittemyer, G. (2015). "A synthesis of two decades of research documenting the effects of noise on wildlife." Biological Reviews: Online early.
Siegel, M. I. and Mooney, M. P. (1987). "Perinatal stress and increased fluctuating asymmetry of dental calcium in the laboratory rat." American Journal of Physical Anthropology 73(2): 267-270.
117
Sigray, P. and Andersson, M. H. (2011). "Particle motion measured at an operational wind turbine in relation to hearing sensitivity in fish." The Journal of the Acoustical Society of America 130(1): 200-207.
Silva, M. J., Dias, A., Barreta, A., Nogueira, P. J., Castelo-Branco, N. A. A. and Boavida, M. G. (2002). "Low frequency noise and whole-body vibration cause increased levels of sister chromatid exchange in splenocytes of exposed mice." Teratogenesis, Carcinogenesis, and Mutagenesis 22(3): 195-203.
Simmonds, M. P. and Lopez-Jurado, L. F. (1991). "Whales and the military." Nature 351(6326): 448-448.
Simpson, S. D., Jennings, S., Johnson, M. P., Blanchard, J. L., Schon, P. J., Sims, D. W. and Genner, M. J. (2011a). "Continental shelf-wide response of a fish assemblage to rapid warming of the sea." Current Biology 21(18): 1565-1570.
Simpson, S. D., Meekan, M., Montgomery, J., McCauley, R. and Jeffs, A. (2005b). "Homeward sound." Science 308(5719): 221.
Simpson, S. D., Purser, J. and Radford, A. N. (2015). "Anthropogenic noise compromises antipredator behaviour in European eels." Global Change Biology 21(2): 586-593.
Simpson, S. D., Radford, A. N., Tickle, E. J., Meekan, M. G. and Jeffs, A. G. (2011b). "Adaptive avoidance of reef noise." PLoS ONE 6(2): e16625.
Simpson, S. D., Yan, H. Y., Wittenrich, M. L. and Meekan, M. G. (2005a). "Response of embryonic coral reef fishes (Pomacentridae: Amphiprion spp.) to noise." Marine Ecology Progress Series 287: 201-208.
Sisneros, J. A. and Bass, A. H. (2005). "Ontogenetic changes in the response properties of individual, primary auditory afferents in the vocal plainfin midshipman fish Porichthys notatus Girard." Journal of Experimental Biology 208(16): 3121-3131.
Slabbekoorn, H. (2013). "Songs of the city: noise-dependent spectral plasticity in the acoustic phenotype of urban birds." Animal Behaviour 85(5): 1089-1099.
Slabbekoorn, H. (in press). Aiming for progress in understanding underwater noise impact on fish: complementary need for indoor and outdoor studies.In The Effects of Noise on Aquatic Life II. A. N. Popper and Hawkins, A. (eds). New York, Springer Science+Business Media, LLC, New York.
Slabbekoorn, H., Bouton, N., van Opzeeland, I., Coers, A., ten Cate, C. and Popper, A. N. (2010). "A noisy spring: the impact of globally rising underwater sound levels on fish." Trends in Ecology & Evolution 25(7): 419-427.
Slabbekoorn, H. and Halfwerk, W. (2009). "Behavioural Ecology: Noise annoys at community level." Current Biology 19(16): R693-R695.
Smith, M. E., Kane, A. S. and Popper, A. N. (2004). "Acoustical stress and hearing sensitivity in fishes: does the linear threshold shift hypothesis hold water?" Journal of Experimental Biology 207(20): 3591-3602.
Smith, R. L. and Smith, T. M. (2001). Ecology and field biology 6th edition. New York, Benjamin Cummings.
Sobel, J. (1996). "Gadus morhua. The IUCN Red List of Threatened Species. Version 2014.2. www.iucnredlist.org“ Retrieved 10 September, 2014.
Song, J., Collin, S. P. and Popper, A. N. (2015). "The sensory world of fish and fisheries: Impact of human activities–An international conference to evaluate the effects of environmental changes on the sensory world of fish/aquatic animals and fisheries." Integrative Zoology 10(1): 1-3.
Southall, B. L. and Scholik-Schlomer, A. (2008). Final report of the NOAA International Conference on Potential Application of Vessel-Quieting Technology on Large Commercial Vessels, 1–2 May, 2007
Staaterman, E., Paris, C. B. and Kough, A. S. (2014). "First evidence of fish larvae producing sounds." Biology Letters 10(10): 20140643.

118
Stanley, J. A., Radford, C. A. and Jeffs, A. G. (2010). "Induction of settlement in crab megalopae by ambient underwater reef sound." Behavioral Ecology 21(1): 113-120.
Sukovaty, R. L., Lee, J. W., Fox, J., Toney, K., Papac, D. I., Grover, T. A. and Wells, D. S. (2006). "Quantification of recombinant human parathyroid hormone (rhPTH(1-84)) in human plasma by immunoassay: Commercial kit evaluation and validation to support pharmacokinetic studies." Journal of Pharmaceutical and Biomedical Analysis 42(2): 261-271.
Tavolga, W. N. (1974). "Signal/noise ratio and the critical band in fishes." The Journal of the Acoustical Society of America 55(6): 1323-1333.
Thompson, P. M., Brookes, K. L., Graham, I. M., Barton, T. R., Needham, K., Bradbury, G. and Merchant, N. D. (2013). "Short-term disturbance by a commercial two-dimensional seismic survey does not lead to long-term displacement of harbour porpoises." Proceedings of the Royal Society of London B: Biological Sciences 280(1771).
Thorpe, W. H. (1963). Learning and instinct in animals. London, Methuen. Thresher, R. (1985). "Brood-directed parental aggression and early brood loss in the coral reef fish,
Acanthochromis polyacanthus (Pomacentridae)." Animal Behaviour 33(3): 897-907. Tolimieri, N., Jeffs, A. and Montgomery, J. C. (2000). "Ambient sound as a cue for navigation by the
pelagic larvae of reef fishes." Marine Ecology Progress Series 207: 219-224. Tournadre, J. (2014). "Anthropogenic pressure on the open ocean: The growth of ship traffic
revealed by altimeter data analysis." Geophysical Research Letters 41(22): 7924-7932. Tyack, P. L. (2008). "Implications for marine mammals of large-scale changes in the marine acoustic
environment." Journal of Mammalogy 89(3): 549-558. Vasconcelos, R. O., Amorim, M. C. P. and Ladich, F. (2007). "Effects of ship noise on the detectability
of communication signals in the Lusitanian toadfish." Journal of Experimental Biology 210(12): 2104-2112.
Vasconcelos, R. O. and Ladich, F. (2008). "Development of vocalization, auditory sensitivity and acoustic communication in the Lusitanian toadfish Halobatrachus didactylus." Journal of Experimental Biology 211(4): 502-509.
Vermeij, M. J. A., Marhaver, K. L., Huijbers, C. M., Nagelkerken, I. and Simpson, S. D. (2010). "Coral larvae move towards reef sounds." PLoS ONE 5(5): e10660.
Victor, B. C. (1983). “Recruitment and population dynamics of a coral reef fish”. Science 219(4583): 419-420.
Voellmy, I. K., Purser, J., Simpson, S. D. and Radford, A. N. (2014a). "Increased noise levels have different impacts on the anti-predator behaviour of two sympatric fish species." PLoS ONE 9(7): e102946.
Voellmy, I. K., Purser, J., Flynn, D., Kennedy, P., Simpson, S. D. and Radford, A. N. (2014b). "Acoustic noise reduces foraging success in two sympatric fish species via different mechanisms." Animal Behaviour 89(0): 191-198.
Voellmy, I. K., Purser, J., Simpson, S. D. and Radford, A. N. (in press). Effects of previous acoustic experience on behavioral responses to experimental sound stimuli and implications for research.In The Effects of Noise on Aquatic Life II. A. N. Popper and Hawkins, A. (eds). New York, Springer Science+Business Media, LLC, New York.
Wale, M. A., Simpson, S. D. and Radford, A. N. (2013a). "Noise negatively affects foraging and antipredator behaviour in shore crabs." Animal Behaviour 86(1): 111-118.
Wale, M. A., Simpson, S. D. and Radford, A. N. (2013b). "Size-dependent physiological responses of shore crabs to single and repeated playback of ship noise." Biology Letters 9(2): 20121194.
Webster, D. B., Fay, R. R. and Popper, A. N. (1992). The evolutionary biology of hearing. New York, Springer-Verlag.
Wensveen, P. J., von Benda-Beckmann, A. M., Ainslie, M. A., Lam, F.-P. A., Kvadsheim, P. H., Tyack, P. L. and Miller, P. J. O. (2015). "How effectively do horizontal and vertical response strategies of long-finned pilot whales reduce sound exposure from naval sonar?" Marine Environmental Research 106: 68-81.

119
Whitfield, A. K. and Becker, A. (2014). "Impacts of recreational motorboats on fishes: A review." Marine Pollution Bulletin 83(1): 24-31.
Wilkinson, C. R. (1996). "Global change and coral reefs: Impacts on reefs, economies and human cultures." Global Change Biology 2(6): 547-558.
Wright, K., Higgs, D., Cato, D. and Leis, J. (2010). "Auditory sensitivity in settlement-stage larvae of coral reef fishes." Coral Reefs 29(1): 235-243.
Wright, K. J., Higgs, D. M., Belanger, A. J. and Leis, J. M. (2005). "Auditory and olfactory abilities of pre-settlement larvae and post-settlement juveniles of a coral reef damselfish (Pisces: Pomacentridae)." Marine Biology 147(6): 1425-1434.
Wright, K. J., Higgs, D. M., Belanger, A. J. and Leis, J. M. (2008). "Auditory and olfactory abilities of larvae of the Indo-Pacific coral trout Plectropomus leopardus (Lacepede) at settlement." Journal of Fish Biology 72(10): 2543-2556.
Wright, K. J., Higgs, D. M. and Leis, J. M. (2011). "Ontogenetic and interspecific variation in hearing ability in marine fish larvae." Marine Ecology Progress Series 424: 1-13.
Wysocki, L. E., Codarin, A., Ladich, F. and Picciulin, M. (2009). "Sound pressure and particle acceleration audiograms in three marine fish species from the Adriatic Sea." The Journal of the Acoustical Society of America 126(4): 2100-2107.
Wysocki, L. E., Davidson, J. W., Smith, M. E., Frankel, A. S., Ellison, W. T., Mazik, P. M., Popper, A. N. and Bebak, J. (2007). "Effects of aquaculture production noise on hearing, growth, and disease resistance of rainbow trout Oncorhynchus mykiss." Aquaculture 272(1-4): 687-697.
Wysocki, L. E., Dittami, J. P. and Ladich, F. (2006). "Ship noise and cortisol secretion in European freshwater fishes." Biological Conservation 128(4): 501-508.
Wysocki, L. E. and Ladich, F. (2001). "The ontogenetic development of auditory sensitivity, vocalization and acoustic communication in the labyrinth fish Trichopsis vittata." Journal of Comparative Physiology A 187(3): 177-187.
Wysocki, L. E. and Ladich, F. (2005a). "Effects of noise exposure on click detection and the temporal resolution ability of the goldfish auditory system." Hearing Research 201(1-2): 27-36.
Wysocki, L. E. and Ladich, F. (2005b). "Hearing in fishes under noise conditions." Journal of the Association for Research in Otolaryngology 6(1): 28-36.
Yan, H. Y. (1998). "Auditory role of the suprabranchial chamber in gourami fish." Journal of Comparative Physiology A 183(3): 325-333.
Yan, H. Y., Fine, M. L., Horn, N. S. and Colon, W. E. (2000). "Variability in the role of the gasbladder in fish audition." Journal of Comparative Physiology A 186: 435-445.
Yelverton, J. T., Richmond, D. R., Hicks, W., Saunders, K. and Fletcher, E. R. (1975). The relationship between fish size and their response to underwater blast. Topical Report DNA, Defense Nuclear Agency, 3677T.
Zeddies, D. G. and Fay, R. R. (2005). "Development of the acoustically evoked behavioral response in zebrafish to pure tones." Journal of Experimental Biology 208(7): 1363-1372.
Zeddies, D. G., Fay, R. R., Alderks, P. W., Shaub, K. S. and Sisneros, J. A. (2010). "Sound source localization by the plainfin midshipman fish, Porichthys notatus." The Journal of the Acoustical Society of America 127(5): 3104-3113.

120

121
Appendix 1: Particle motion: the missing link in underwater acoustic ecology, program instructions A1.1 Should you measure particle motion? A MATLAB script for answering this question is at the design stage. It will appear as follows:
And follow the rules outlined below:
1) Are you in the near field with a monopole source?
IF source type = monopole
AND distance to sound source is anything less than 1 wavelength using lowest frequency: 𝜆𝜆 = 𝑐𝑐𝑤𝑤𝑓𝑓
Output: Recommend measuring particle motion but can compare to calculations using an
equation written by Harris (Chapman and Hawkins, 1973):
𝜉𝜉 = 𝑝𝑝
2𝜋𝜋𝜌𝜌𝑐𝑐 �1 + �𝜆𝜆
2𝜋𝜋𝑎𝑎�2
�
12

122
where ξ = displacement (m), p = pressure (Pa), ρ = density of the water (kg/m3), 𝑐𝑐 = sound speed
(m/s), and r = distance to sound source (m). Can then use standard equations from Box 1 to convert
displacement to acceleration or velocity if required.
2) Are you in the near field with a source that is not a monopole?
IF source type = other
AND distance to sound source is anything less than 1 wavelength using lowest frequency
Output: Need to measure particle motion
3) Are you below the cut-off frequency?
IF lowest frequency is below cut-off:
𝜋𝜋𝑐𝑐 = 𝜋𝜋 − 𝜌𝜌𝑠𝑠𝑠𝑠𝑠𝑠 𝜌𝜌𝑤𝑤⁄
2𝜋𝜋𝜋𝜋𝜋𝜋𝜋𝜋𝜓𝜓𝑐𝑐𝑐𝑐𝐻𝐻
Where 𝜌𝜌𝑠𝑠𝑠𝑠𝑠𝑠 = sediment density, 𝜌𝜌𝑤𝑤 = water density, 𝑐𝑐 = sound speed in water, 𝑐𝑐𝑠𝑠𝑠𝑠𝑠𝑠 = sediment
sound speed, 𝜓𝜓𝑐𝑐 = critical angle = 𝑎𝑎𝑎𝑎𝑐𝑐𝑐𝑐𝑎𝑎𝜋𝜋 � 𝑐𝑐𝑐𝑐𝑠𝑠𝑠𝑠𝑠𝑠
� and 𝐻𝐻 = water depth
Examples of 𝒄𝒄𝒔𝒔𝒔𝒔𝒔𝒔:
Sand = 1.1978 * 𝑐𝑐, Silt = 1.0479 * 𝑐𝑐, Clay = 0.9846 * 𝑐𝑐
Examples of 𝝆𝝆𝒔𝒔𝒔𝒔𝒔𝒔:
Sand = 2.086 * 𝑐𝑐, Silt = 1.601 * 𝑐𝑐, Clay = 1.331 * 𝑐𝑐
Output: Need to measure particle motion
ELSE IF distance to sound source is more than than 1 wavelength
AND frequency is greater than cut-off
Output: Can calculate particle motion using standard equations in Box 1: 𝑢𝑢 = 𝑃𝑃𝜌𝜌𝑐𝑐
, (although

123
caution should be taken if near the surface or bottom, distance to boundaries where this equation
applies requires further investigation)
Can then use standard equations from Box 1 to convert velocity to acceleration or displacement if
required.
Caution that these are rules of thumb only and the best way forward is certainly to make
measurements and compare them with modelling of particle motion from pressure wherever
possible.
A1.2 Calibrating recorders 1. Open MATLAB
2. Set file path to folder containing analysis programs
3. Open “PM_Analysis_GUI_Windows.fig”
4. Tools > Create calibration tone
5. Select desired folder location for calibration tone
6. Enter desired calibration tone parameters
7. Load calibration tone onto an mp3 player
8. Plug the oscilloscope into the headphone jack of the mp3 player and play the tone
9. Note the peak–peak voltage on the oscilloscope—move horizontal markers on oscilloscope
display screen until they are just touching the regular peaks and troughs of the wave to find the
peak–peak voltage (see Figure 2.4). (NB for a sine wave, peak–peak voltage is simply double the
peak voltage.)
10. Record the same tone from the same mp3 player AT THE SAME VOLUME with your recorder.
(Make sure there is no ‘peaking’—in which case, a red light will usually be illuminated on your
recorder. If this is the case then adjust the volume of playback until there is no peaking and
return to step 2.)
11. Note the name of the track which corresponds to the recorded pure tone of known voltage
12. Repeat at each recording input level for each channel you wish to use on your recorder
13. If recorder has a flat frequency response, these recordings will apply over the range at which
frequency response is flat
14. Download recordings onto your computer and name files according to input voltage and
recorder channel and level
As a general point, BEWARE any switches or knobs on your recorder that could change the

124
calibration! For example ‘master volume’ or anything to do with gain such as ‘auto gain’. You need to
calibrate the recorder for each different setting you use when recording (you can never calibrate for
auto gain because the recorder will automatically change its own settings as you record so just avoid
that altogether).
A1.3 Calibration settings in paPAM Either load a previously saved settings profile, or create a new one by following these instructions:
A1.3.1 Calibrate for sensitivity of instrument: 1. Click ‘Select device calibration file’
This should be a comma separated (csv) file containing the frequencies at which your device was
calibrated in columns 1, 3, 5 and 7 respectively for channels X, Y, Z and H. Columns 2, 4, 6 and 8
should contain calibration data for channels X, Y, Z and H in V/ms-1 for accelerometer channels X, Y
and Z, and V/µPa for hydrophone channel H. paPAM will integrate between frequencies entered, so
if you wish to enter a flat response for a hydrophone in a given frequency range (e.g. -165 dB re 1 V/
µPa between 2 and 30 000 Hz) it can be entered as follows:
A1.3.2 Calibrate recorder channels: 1. Click ‘Calibrate Channel’
2. Enter reference voltage (peak–peak voltage measured using oscilloscope in step 9 of Calibrating
recorders)
3. Select channel to calibrate
4. Select pre-recorded calibration tone at reference voltage and input level for the recordings you
wish to analyse
5. A plot of the waveform of your calibration recording will open with time along the x-axis, select
start and end of calibration tone

125
A1.3.3 Save settings profile: 1. Click ‘Save’ under settings profile
2. Save using a name that corresponds to the recording settings used
A1.4 Combining separate channel wav files into multi channel wav files in paPAM Files recorded on separate channels can be analysed together if they are combined as multi-channel
wavs using the following instructions
1. Open MATLAB
2. Set file path to folder containing analysis programs
3. Open “PM_Analysis_GUI_Windows.fig”
4. Tools > Create multi channel wav files
A1.4.1 Creating a single multi-channel wav 5. Select folder location
6. Select X, Y, Z and H wav files (NB adding each further channel is optional)
7. Select folder location for the combined wav to be saved
A1.4.2 Batch processing to create many multichannel wavs 5. Select the folder with the files you want to combine
6. Enter parsing mask (this tells the program the format for the file names you wish to combine,
see examples in graphic user interface (GUI, i.e. the window in which you are running the
program))
7. Enter channel identifiers
A1.5 Analysis options in paPAM Select files for analysis in the ‘input’ section and follow instructions as they appear on screen. You
may analyse a single file (which may be single channel or combined channels), or batch process
several files (which may also be single channel or combined channel files). If analysing single channel
files, specify whether these are particle motion or pressure. If analysing a single channel particle
motion channel, the calibration information for channel X will be used.
A1.5.1 PSD (Power spectral density) Select this analysis option to analyse a sound for which you wish to see the spread of energy in the
frequency domain. This is calculated as in equation 11 of the Supplementary Materials of Merchant
et al. (2015).
A1.5.2 Impulse Select this analysis option to analyse a single impulse; energy at all frequencies will be analysed in

126
the time domain.
A1.5.3 Broadband Select this analysis option to calculate the root-mean-squared energy in a sound averaged over
frequency and time.
A1.6 Defaults and options: A1.6.1 Analysis Options Time range (seconds): Default: analyse entire recording(s). Option: analyse a subsection of your
recording(s) by entering the time range you wish to analyse, or if analysing a single file you can
manually select a time range from a plot of the waveform using GUI select.
Bandpass filter (Hz): Default: analyses from 0 Hz to Nyquist frequency (Fs/2) or limit of device
calibration information, whichever is lower. Option: analyse a subset frequency range by entering
the lower and upper frequencies of interest.
Output units: Applies when analysing particle motion only. Default: acceleration in dB re 1
(µm/s2)2/Hz. Option: velocity in dB re 1 (nm/s)2/Hz. (NB if analysing pressure only, default output
units are dB re 1 µPa2/Hz.)
PSD Options: Default: Values for each frequency bin across all time windows will be averaged over
time via taking the mean before converting to dB. Option: 5%, 50% and 95% exceedance levels
(percentiles calculated before converting to dB) can be added to outputs if selected here, this gives
some idea of variability in sound levels over time and is an alternative to plotting the standard
deviation (which sometimes gives negative numbers which cannot be converted to dB via logging).
Additional Output: Waveform: Produces a plot of sound level over time
Additional Output: Spectrogram: Produces a 3-D plot of PSD over frequency and time. Temporal
and frequency resolution impacted by choice of window length.
A1.6.2 Time Stamp Default: Use system time. Option: Add a custom time stamp to contextualise your recording in real-
time.
A1.6.3 Window Settings

127
To compute a PSD, we divide the sound recording into sections of defined length (‘windows’) before
conducting a discrete Fourier transform (DFT) on each window. The number of samples in a window
determines the temporal and frequency resolution of the analysis.
Window type: Default: Hamming. Option: Hann (Hamming and Hann windows are very similar and
both are fine for PSDs). We apply a windowing filter to each window to prevent ‘spectral leakage’
(an artefact of the computation process which makes results inaccurate). A windowing filter
attenuates the energy in the samples near the beginning and end of the window (this is often in the
shape of a bell curve although there are many different types). So that we do not lose energy via this
attenuation, we allow windows to overlap.
Window length: Default: Window length = Fs (sample frequency). This gives a frequency resolution
of 1 Hz and a temporal resolution of 1 s. Option: Higher numbers than the Fs will give a lower
temporal resolution and a higher frequency resolution, numbers lower than the Fs will give a higher
temporal resolution and a lower frequency resolution.
Overlap: Default: 50% overlap. Option: 50% is sufficient to avoid losing energy due to windowing,
overlapping by more than this will increase the amount of data produced and have the effect of
‘smoothing’ the spectrogram.
A1.6.4 Misc Figure size: Default: 800 x 800 pixels
A1.6.5 Batch Processing Options Allows you to begin processing after an amplitude threshold; useful if you have used a loud bang to
signify the start time of recording.
A1.6.6 Execute Write results to file: Default: Do not write results to file if analysing single recording; always write
results to file if batch processing multiple files. Option: Select this to write results to file if analysing a
single recording.
Select Folder: Use this to select the folder where a csv file will be saved with results.

128

129
Appendix 2: Dascyllus trimaculatus blood cortisol EIA kit validation
A2.1 Methods Blood samples were taken from 25 three-spot damselfish, Dascyllus trimaculatus, laterally from the
caudal vein using heparinised 75 µl haematocrit capillaries and kept on ice until processing.
Individual blood samples were centrifuged (Sigma Centrifuge 1-14; http://www.sigma-
zentrifugen.de/) at 10,000g for 5 minutes. The supernatant, a yellow plasma layer, was collected
without disturbing the white buffy layer or the blood cells. This pool of 25 samples was stored at -80
ºC for three months before kit validation.
Validation of the kit comprised: 1) parallel displacement of serially diluted plasma to the
standard curve; 2) precision from intra- and inter-assay variabilities.
1) Parallelism was evaluated by measuring cortisol concentrations in pooled plasma samples,
serially diluted in EIA buffer provided with the kits. Two sets of dilution ratios were prepared: 1:3,
1:7, 1:20, 1:53, 1:143, and 1:387; as well as 1:11, 1:28, 1:69, 1:172, 1:430, and 1:1074. The maximum
bound (% B/Bo) for each of the 12 sample dilutions and for the seven standards were plotted against
their relative log dilution and the shapes of the resulting curves were compared. These curves must
be parallel to support the assumption that the antibody-binding characteristics of standard and
sample are similar enough to allow the determination of antibody levels in the diluted plasma
sample. An ANCOVA was carried out to determine the homogeneity of slopes between the sample
dilutions and those of the kit’s standards. In addition, regression analysis of the diluted sample was
used to determine the dilution factor that corresponds to 50 % of antibody bound.
2) Precision was assessed by examining intra- and inter-assay variability of samples with
different hormones levels. Intra-assay variability was determined by evaluating 14 plasma samples in
duplicate within the same run of the assay. Inter-assay variability was determined by evaluating four
samples in two runs of the assay. Variabilities or coefficients of variation (CV) of repeated measures
of samples were assessed. CV was calculated according to the formula: CV = (SD.
X -1) x 100. A kit
was considered to have good precision if the CV was < 20% as per the guidelines in (Plikaytis et al.,
1994) and (Sukovaty et al., 2006).

130
A2.2 Results Twelve dilutions of pooled plasma from D. trimaculatus were screened with the cortisol kit’s
standard curve and a characteristic S-shaped curve was observed (Fig. A2.1a). As only the linear part
is of interest, however, the curve using eleven dilutions of pooled plasma was used and was found to
run parallel to that obtained using standards provided with the cortisol kit (Table A2.I and Fig.
A2.1b). Regression analyses enabled the appropriate dilution factors for 50 % of antibody bound for
the three-spot damselfish to be determined with the cortisol kit (Table A2.I). D. trimaculatus also
showed high accuracy and precision with the cortisol kit determined from intra- and inter-assay
variabilities respectively; 4.4% (n = 14) and 7.6% (n = 4).
Table A2.I. ANCOVA on homogeneity of slopes for sample dilution versus standard dilution curves
for cortisol kits in Dascyllus trimaculatus. The dilution factor (dilution) for 50 % of antibody bound
determined from regression analyses is also given.
Assay Species df Mean square F p Dilution factor
Cortisol D. trimaculatus 1,46 0.009 0.542 0.466 1:53 (0.019)
df, degrees of freedom; F, test statistic: p, probability.
a)

131
b)
Figure A2.1. Dose-response curves for cortisol obtained using seven kit standards and pooled plasma
of Dascyllus trimaculatus from a) 12 dilutions and b) 11 dilutions (kit standards: y = -33.153 x -
28.014, R2 = 0.98, N = 24, p < 0.001; samples: y = -33.906 x - 8.385, R2 = 0.96, N = 21, p < 0.001).
Dashed line and arrow represents 50 % bound (see Table I for corresponding dilution factors). =
Pooled sample plasma; = Cortisol kit standards.
In conclusion, the dose-response curves were parallel to the cortisol EIA assay kit standards
(Fig. A2.1b; Table A2.I) and high precision was obtained from intra-and inter-assay variabilities (<
10%) with D. trimaculatus. Consequently, this kit can be confidently used for measuring cortisol in D.
trimaculatus.

132
Résumé : Certains bruits d'origine anthropique sont maintenant considérés comme pollutant avec les impacts sur le comportement et la physiologie dans un large éventail de taxons. Cependant, peu de recherches ont examiné les effets de ces sons répétés ou chroniques sur le développement ou sur les conséquences de fitness. Les poissons et de nombreux invertébrés utilisent le son sous l'eau pour les processus tels que l'orientation et de la communication, et sont donc vulnérables à la pollution sonore anthropique. Aussi, les poissons et les invertébrés constituent une source de nourriture vitale pour des millions de personnes. J’ai fais des expériences portant sur l'impact de l'exposition répétée au bruit du trafic, la source anthropique la plus courante de bruit dans l'environnement marin. Je démontre qu’une variété de comportements a été touchée par le bruit. J’ai aussi trouvé que la regularité du bruit à des impacts différents sur le développement, mais que certaines espèces de poissons peuvent être en mesure de s'habituer au bruit du trafic, tandis que d'autres non. En outre, je trouve que le développement et la survie des limaces de mer peuvent être impactés négativement par le bruit des bateaux. Title : Impacts of anthropogenic noise on behaivour, development and fitness of fishes and invertebrates
Abstract : Evidence is building that noise from human activities such as transportation, construction and exploration can impact behaviour and physiology in a broad range of taxa. However, relatively little research has considered effects on development or directly assessed fitness consequences, particularly with respect to repeated or chronic noise. All fishes and many invertebrates use underwater sound for processes such as orientation and communication, and are thus vulnerable to anthropogenic noise pollution. Fishes and invertebrates detect the particle motion component of sound. As the first part of my thesis (chapter two), I provide a computer program which allows users to determine under what circumstances they should measure particle motion; I explain how these measurements can be made and provide a program for analysing this type of data. The main part of my thesis comprises experiments investigating the impact of repeated exposure to traffic noise, the most common anthropogenic source of noise in the marine environment, on fishes and invertebrates during development. In all three chapters involving experiments on fish in tanks and in the field, I found that a variety of behaviours were impacted by traffic noise playback. I also found that predictable noise can lead to different impacts on development from unpredictable noise, but that some species of fish may be able to habituate to traffic noise, while others suffer lower survival. Further, I found that the development and survival of seahares (Stylocheilus striatus) can be negatively impacted by traffic-noise playback.
Mots-clés : Poissons, invertébrés, bruit anthropique, comportement, développement, fitness
Keywords : Fish, invertebrates, anthropogenic noise, behaviour, development, fitness
Copyright © 2022 FDOKUMEN