Impact of Visual Impairment on Quality of Life: A Comparison With Quality of Life in the General...
236
Quality of Life of Visually Impaired Working Age Adults
Transcript of Impact of Visual Impairment on Quality of Life: A Comparison With Quality of Life in the General...

Quality of Life of Visually Impaired Working Age Adults
The studies presented in this thesis were performed at the Department of Ophthalmology and the Institute for Research in Extramural Medicine (EMGO Institute) of the VU University Medical Centre, the Netherlands. The EMGO Institute participates in the Netherlands School of Primary Care Research (CaRe) which was re-acknowledged in 2000 by the Royal Netherlands Academy of Arts and Sciences (KNAW).
Most of the studies presented in this thesis were performed as part of the study on quality of life of visually impaired adults. This study was financially supported by ‘InZicht’ (grantnumbers 943−01−002 and 943−03−019).
The studies were performed in collaboration with Royal Visio, department of Research & Development.
Additional financial support for the printing of this thesis has been kindly provided by: EMGO Institute Ergra Low Vision Lameris Ootech BV Landelijke Stichting voor Blinden en Slechtzienden Retina Nederland Royal Visio Stichting Blinden-Penning Stichting InZicht Stichting Sensis Vrije Universiteit
Cover: Vera van Bemmel en Michiel van Bemmel
ISBN: 978−90−9021704−8 NUR: 870
Printed by: PrintPartners Ipskamp, Enschede Copyright © 2007, M. Langelaan
VRIJE UNIVERSITEIT
Quality of life of visually impaired working age adults
ACADEMISCH PROEFSCHRIFT
ter verkrijging van de graad Doctor aan de Vrije Universiteit Amsterdam, op gezag van de rector magnificus
prof.dr. L.M. Bouter, in het openbaar te verdedigen
ten overstaan van de promotiecommissie van de faculteit der Geneeskunde
op dinsdag 22 mei 2007 om 13.45 uur in de aula van de universiteit,
De Boelelaan 1105
door
Maaike Langelaan geboren te Ede
promotoren: prof.dr. G.H.M.B. van Rens prof.dr. P.J. Ringens copromotoren: dr. M.R. de Boer dr. A.C. Moll
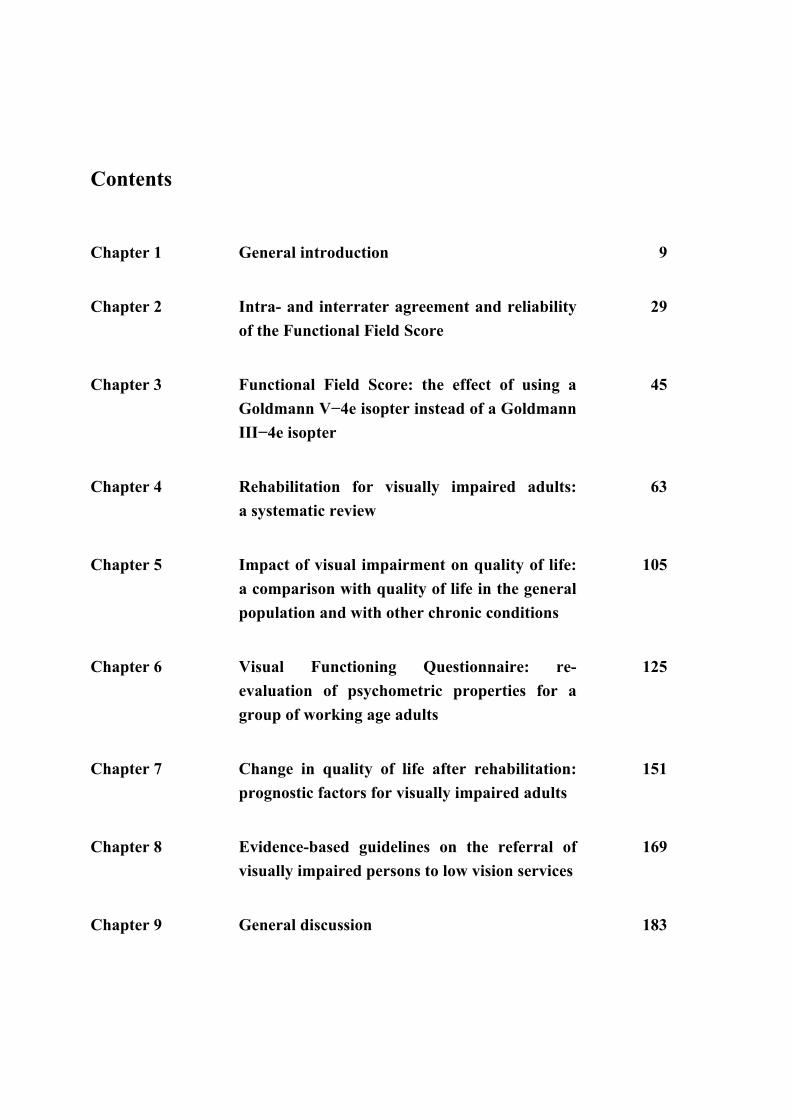
Contents
Chapter 1 General introduction 9
Chapter 2 Intra- and interrater agreement and reliability of the Functional Field Score
29
Chapter 3 Functional Field Score: the effect of using a Goldmann V−4e isopter instead of a Goldmann III−4e isopter
45
Chapter 4 Rehabilitation for visually impaired adults: a systematic review
63
Chapter 5 Impact of visual impairment on quality of life: a comparison with quality of life in the general population and with other chronic conditions
105
Chapter 6 Visual Functioning Questionnaire: re-evaluation of psychometric properties for a group of working age adults
125
Chapter 7 Change in quality of life after rehabilitation: prognostic factors for visually impaired adults
151
Chapter 8 Evidence-based guidelines on the referral of visually impaired persons to low vision services
169
Chapter 9 General discussion 183
Questionnaires 201
Summary 211
Samenvatting 221
Dankwoord 231
Curriculum Vitae 235


11
GGeenneerraall IInnttrroodduuccttiioonn
Chapter 1
10
Introduction Visual impairment is vision loss, due to low vision or blindness, that significantly limits visual capability. It may be the result of disease, trauma, or a congenital or degenerative condition, and cannot be improved by conventional means, such as refractive correction, medication, or surgery.1 Carrying out daily activities adequately is often a major problem, making visual impairment one of the most important barriers to participation. In the Netherlands, adults with severe, irreversible visual impairment can attend a comprehensive rehabilitation programme. Information on the efficacy of these programmes becomes more and more important: patients are asking for the best treatment available in order to improve their participation, and government institutions and insurance companies are demanding a cost-effective treatment. The main aim of the present work is to see which factors are prognostic for an improved quality of life of a visually impaired adult of working age, after having participated in an extensive rehabilitation programme. Until fifteen years ago, the outcome of rehabilitation was measured objectively at the disability level, by recording reading speed, walking distance, and performance of daily activities. Recently, clinicians and researchers have become aware of the need for more subjective measures of outcome, such as quality of life. What is important is the patient’s opinion of his performance and how it affects his daily life, not an objective measure.2;3 As most visually impaired patients are 65 years of age or older,4 most research is conducted on this age group. However, in the group of between 18 and 65 years of age, the impact of the disability on daily life may be much higher than in the elderly. Furthermore, they have more years in which to deal with their vision loss. Consequently, economic costs are high, even though this group is much smaller.5 In spite of this, studies on the quality of life and the outcome of rehabilitation of visually impaired adults of working age are scarce; no such studies had hitherto been carried out in the Netherlands. We therefore discuss the quality of life visually impaired adults of working age in this thesis.
General Introduction
11
Our specific aims are: • to assess the properties of the Functional Field Score; • to review the literature on the use of quality of life as a measure of the effectiveness
of a rehabilitation programme for visually impaired adults; • to compare the quality of life of visually impaired adults with that of healthy Dutch
people, and patients with other chronic diseases; • to further validate the VFQ-25, one of the most widely used vision-related quality of
life questionnaires; • to assess the outcome of rehabilitation both on the short-term and the long-term; • to provide guidelines for the referral of visually impaired persons to rehabilitation
services in the Netherlands.
Background of the definition of visual impairment Visual impairment is measured in the better eye with the best possible correction. In the WHO International Statistical Classification of Diseases, Injuries and Causes of Death (ICD−10)6 low vision is defined as a visual acuity of less than 6/18, but equal to or better than 3/60, or a corresponding visual field loss of less than 20 degrees. Blindness is defined as a visual acuity of less than 3/60, or corresponding visual field loss of less than 10 degrees. However, a visual acuity loss or visual field loss, which alone would not be severe enough to be classified as visual impairment, may in combination be disabling. Therefore, using visual acuity and visual fields separately to assess visual impairment is inadequate for expressing a person’s visual functioning, that is, his or her ability or disability to carry out the activities of daily living.
Functional vision score
The functional vision of a person depends on the degree of visual impairment and is related to activities of daily living, the basic tasks of everyday life, such as eating, bathing, dressing, going to the toilet, and moving from place to place. There have been several attempts to develop a score for visual functioning. The Functional Vision Score (FVS) was developed by Colenbrander.7 The FVS combines visual acuity and visual field into one overall score with the possibility of correcting for other vision related impairments; it was adopted by the American Medical Association (AMA) in order to bring uniformity into the classification of disability by visual impairment, which lacked hitherto. The AMA
Chapter 1
12
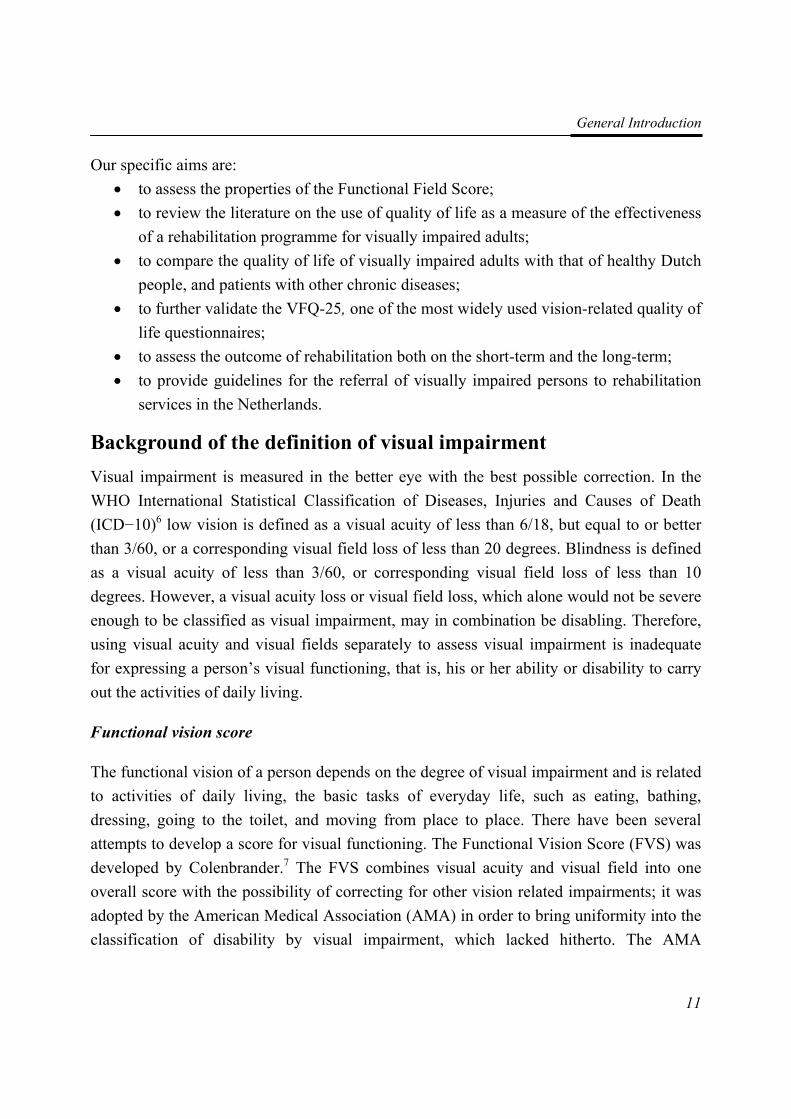
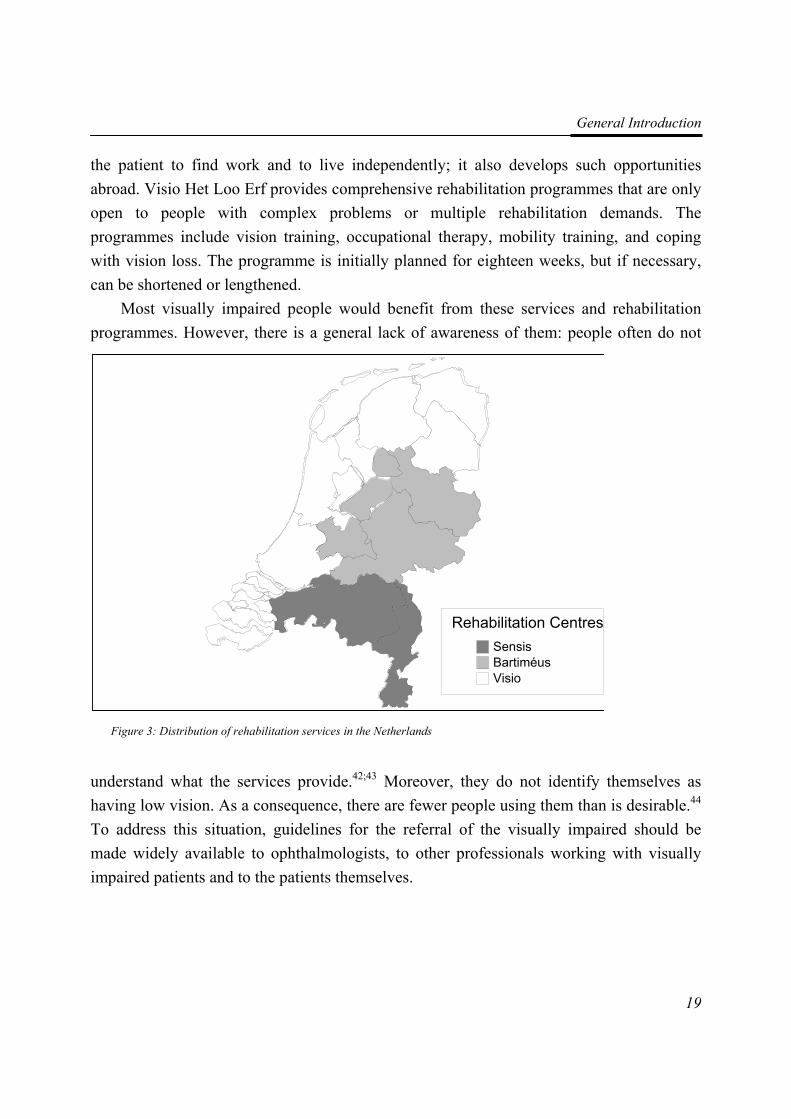
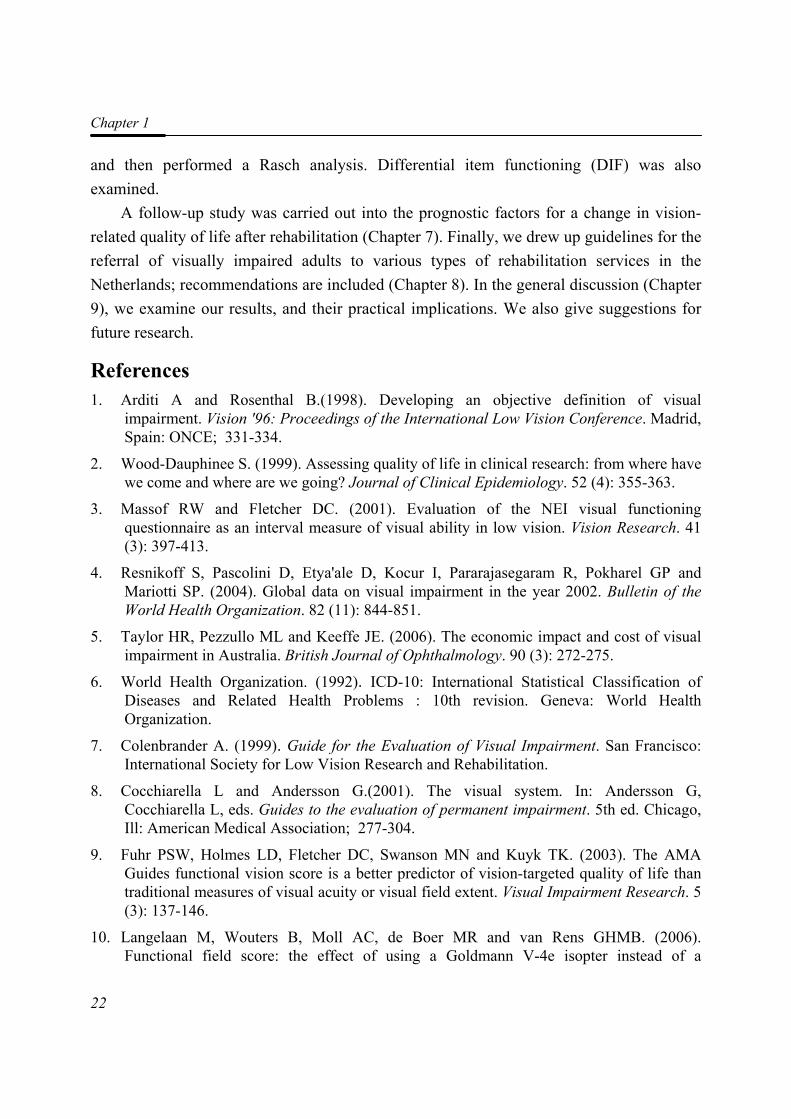
subsequently published guidelines on compensation for eye injuries.8 As shown in Figure 1, the FVS is based on the Functional Acuity Score (FAS) and the Functional Field Score (FFS). The Functional Acuity Score (FAS) is calculated by combining three Visual Acuity Scores, that is, for binocular vision, the right eye and the left eye. A Visual Acuity Score (VAS), is a conversion of the best-corrected visual acuity value obtained for binocular vision (ODS), for the right eye (OD) and for the left eye (OS). In the same way, the Functional Field Score (FFS) is a combination of the Visual Field Scores (VFS) for binocular vision, the right eye and the left eye.
FUNCTIONAL ESTIMATES in the AMA Guides
VISUAL FUNCTIONS for OD / OS / ODS
FUNCTIONAL ESTIMATES for the person
Visual Acuity Score (VAS) = count of letters recognized
Functional Acuity Score (FAS) combines: 60% ODS + 20% OD + 20% OS
Visual Field Score (VFS) = count of points detected
Functional Field Score (FFS) combines: 60% ODS + 20% OD + 20% OS
Optional adjustment for other vision problems
Functional Vision Score (FVS) estimates general visual ability as: FAS x FFS / 100, (other losses)
Visual System Impairment (VSI) estimates visual ability loss as: VSI (AMA) = 100 − FVS Whole Person Impairment (WPI)
Using the WPI calculation and other factors to determine monetary compensation is a separate, administrative decision, beyond the scope of the AMA Guides.
Figure 1: Calculation of the Functional Vision Score (printed with permission)
The FVS aims to provide an estimate of the effect of certain types of vision loss on the ability to perform the activities of daily living. As the FVS is related to functioning in these basic tasks (Table 1), it is a better predictor of self-reported vision-related quality of life
General Introduction
13
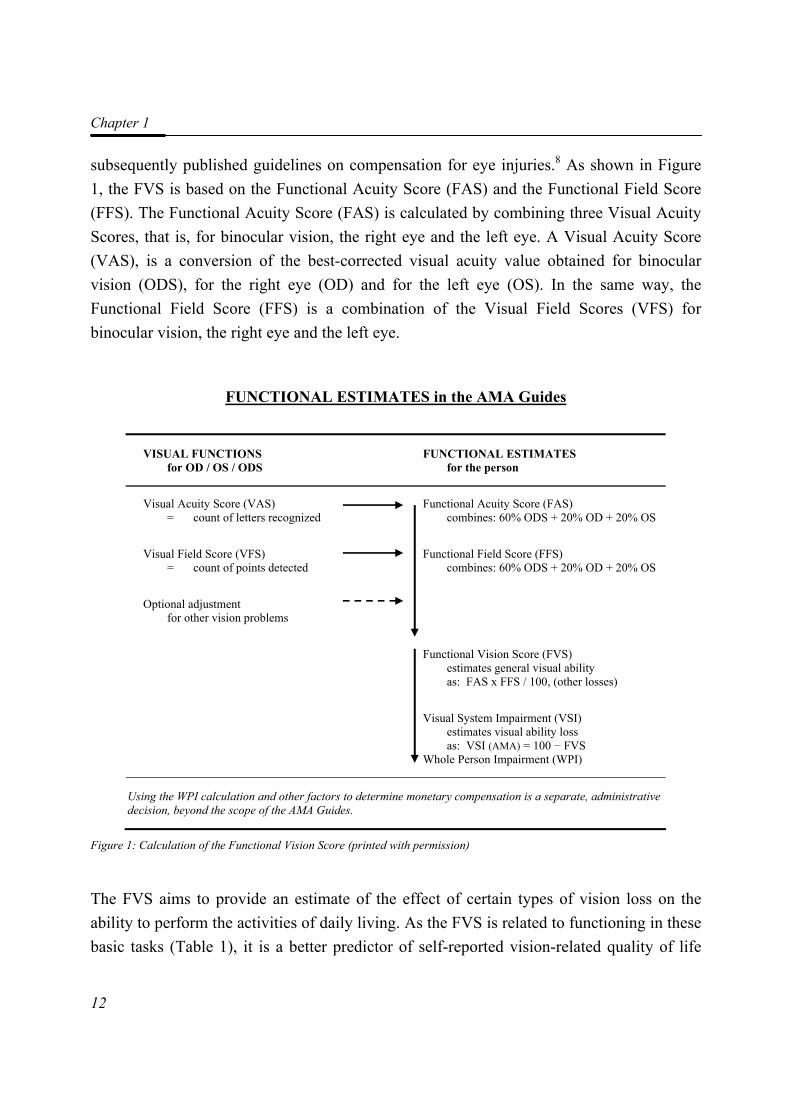
than either visual acuity or visual field extent alone.9 Furthermore, there is also a possibility for adjustment of the FVS for other vision problems, such as glare; a maximum of 15 points may be subtracted from the total FVS. Table 1: Classification of the Functional Vision Score (FVS)8
Class Estimated ability to perform activities of daily living
FVS
1 Range of normal vision Has reserve capacity ≥ 91
2 Near-normal vision Lost reserve capacity 71−90
3 Moderate low vision Need for vision enhancement aids 51−70
4 Severe low vision Slower than normal even with enhancement aids 31−50
5 Profound low vision Marginal visual performance, even with aids 11−30
6 (Near-) total blindness Cannot perform visually; needs substitution aids ≤ 10
To calculate the FFS, the AMA guides recommend using the Goldmann isopter III−4e. When isopter III−4e is unavailable, they suggest analysing a larger isopter, Goldmann IV−4e or V−4e; this, however, leads to overestimation of the FFS.8;10
Prevalence and causes of visual impairment According to the World Health Organisation (WHO), in 2002, the estimated number of people with visual impairment was in excess of 161 million, of which 37 million were blind and 124 million had low vision;4 85% of the visually impaired lived in Third World countries. Worldwide, more than 82% of blind people are aged 50 years and older; the proportional rise in the aging population means that by the year 2020, the number of visually impaired people will have increased by 46.8%.11
Most population-based studies are performed in elderly populations,12-21 where the main causes of visual impairment are age-related macular degeneration, cataract and glaucoma. Although vision loss is a serious disability at any age, it is especially so for those of working age. Despite this, epidemiological data on blindness and low vision in this age group are scarce and insufficient, as shown by a recent overview of epidemiological studies of visually impaired people aged 20-59 years published in Western Europe, North America and Australia.22
Chapter 1
14
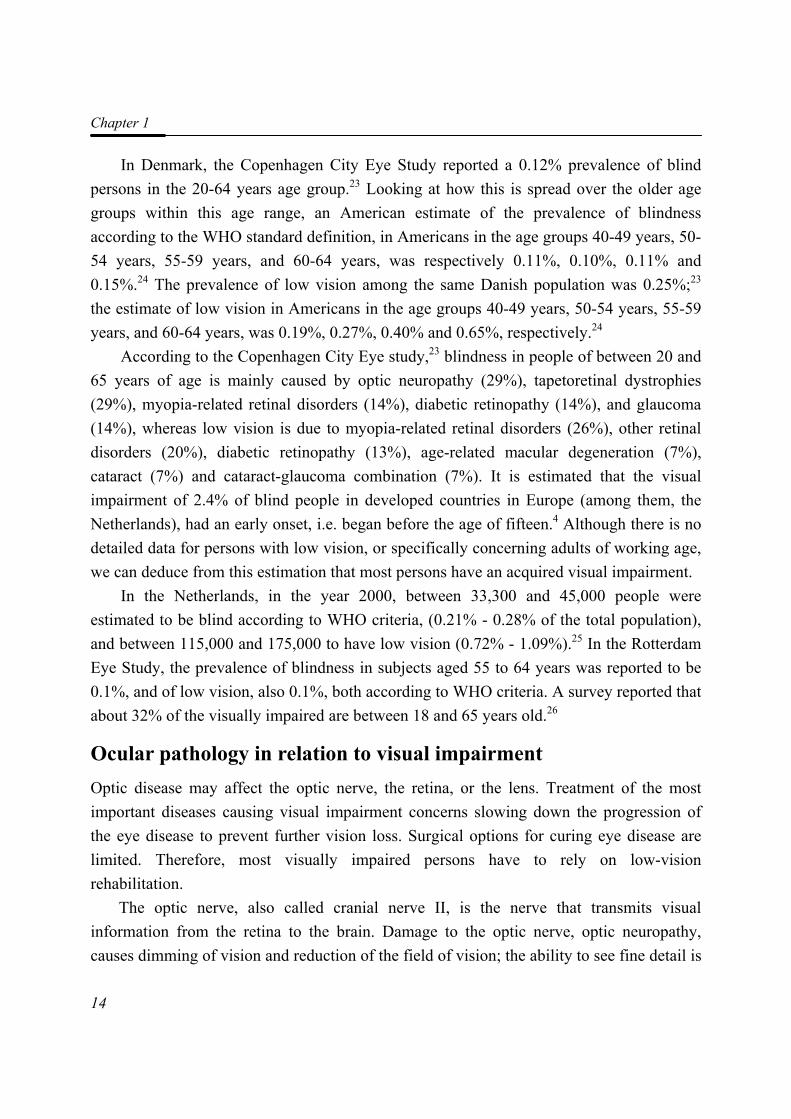
In Denmark, the Copenhagen City Eye Study reported a 0.12% prevalence of blind persons in the 20-64 years age group.23 Looking at how this is spread over the older age groups within this age range, an American estimate of the prevalence of blindness according to the WHO standard definition, in Americans in the age groups 40-49 years, 50-54 years, 55-59 years, and 60-64 years, was respectively 0.11%, 0.10%, 0.11% and 0.15%.24 The prevalence of low vision among the same Danish population was 0.25%;23 the estimate of low vision in Americans in the age groups 40-49 years, 50-54 years, 55-59 years, and 60-64 years, was 0.19%, 0.27%, 0.40% and 0.65%, respectively.24
According to the Copenhagen City Eye study,23 blindness in people of between 20 and 65 years of age is mainly caused by optic neuropathy (29%), tapetoretinal dystrophies (29%), myopia-related retinal disorders (14%), diabetic retinopathy (14%), and glaucoma (14%), whereas low vision is due to myopia-related retinal disorders (26%), other retinal disorders (20%), diabetic retinopathy (13%), age-related macular degeneration (7%), cataract (7%) and cataract-glaucoma combination (7%). It is estimated that the visual impairment of 2.4% of blind people in developed countries in Europe (among them, the Netherlands), had an early onset, i.e. began before the age of fifteen.4 Although there is no detailed data for persons with low vision, or specifically concerning adults of working age, we can deduce from this estimation that most persons have an acquired visual impairment.
In the Netherlands, in the year 2000, between 33,300 and 45,000 people were estimated to be blind according to WHO criteria, (0.21% - 0.28% of the total population), and between 115,000 and 175,000 to have low vision (0.72% - 1.09%).25 In the Rotterdam Eye Study, the prevalence of blindness in subjects aged 55 to 64 years was reported to be 0.1%, and of low vision, also 0.1%, both according to WHO criteria. A survey reported that about 32% of the visually impaired are between 18 and 65 years old.26
Ocular pathology in relation to visual impairment Optic disease may affect the optic nerve, the retina, or the lens. Treatment of the most important diseases causing visual impairment concerns slowing down the progression of the eye disease to prevent further vision loss. Surgical options for curing eye disease are limited. Therefore, most visually impaired persons have to rely on low-vision rehabilitation.
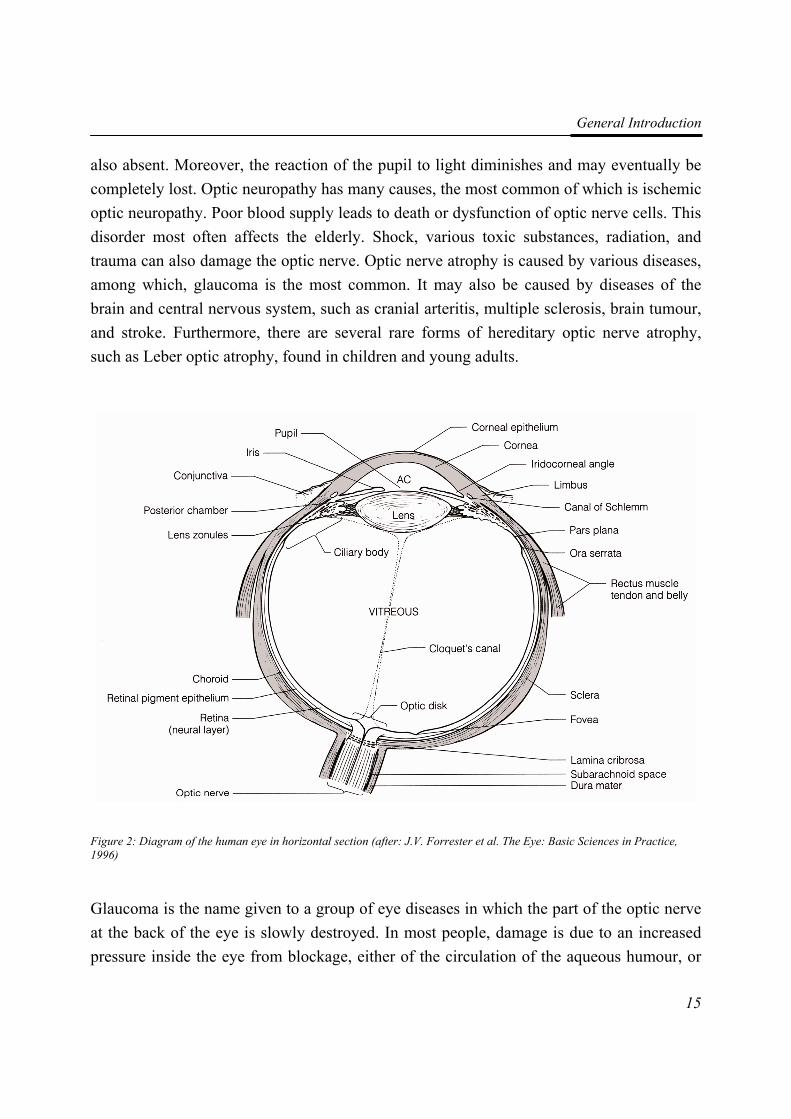
The optic nerve, also called cranial nerve II, is the nerve that transmits visual information from the retina to the brain. Damage to the optic nerve, optic neuropathy, causes dimming of vision and reduction of the field of vision; the ability to see fine detail is
General Introduction
15
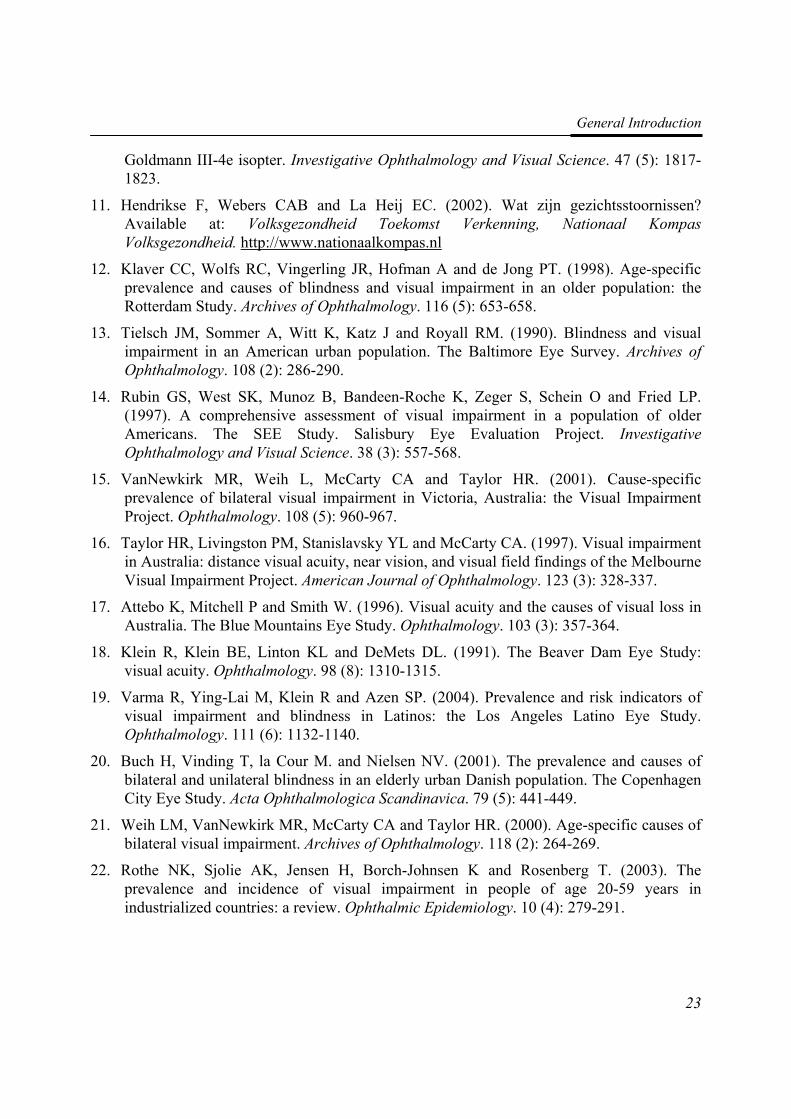
also absent. Moreover, the reaction of the pupil to light diminishes and may eventually be completely lost. Optic neuropathy has many causes, the most common of which is ischemic optic neuropathy. Poor blood supply leads to death or dysfunction of optic nerve cells. This disorder most often affects the elderly. Shock, various toxic substances, radiation, and trauma can also damage the optic nerve. Optic nerve atrophy is caused by various diseases, among which, glaucoma is the most common. It may also be caused by diseases of the brain and central nervous system, such as cranial arteritis, multiple sclerosis, brain tumour, and stroke. Furthermore, there are several rare forms of hereditary optic nerve atrophy, such as Leber optic atrophy, found in children and young adults.
Figure 2: Diagram of the human eye in horizontal section (after: J.V. Forrester et al. The Eye: Basic Sciences in Practice, 1996)
Glaucoma is the name given to a group of eye diseases in which the part of the optic nerve at the back of the eye is slowly destroyed. In most people, damage is due to an increased pressure inside the eye from blockage, either of the circulation of the aqueous humour, or
Chapter 1
16
of its drainage. In other patients, the damage may be caused by poor blood supply to the vital optic nerve fibres, a weakness in the structure of the nerve, or by a problem in the health of the nerve fibres themselves. The progress of the disease is very slow, and vision deteriorates gradually; peripheral vision is usually affected first. One eye takes over the function of the other, and the person is not aware of a problem until the majority of nerve fibres have been irreversibly destroyed. Consequently, a large part of the visual field is lost, contrast sensitivity and light sensitivity are diminished, this last bringing about problems with glare. Some daily activities, such as driving, or playing certain sports may become challenging.27
Tapetoretinal dystrophies (TRD) is the name given to a group of eye diseases that cause the gradual degeneration of the photoreceptor cells in the retina, the rod cells and cone cells; it is therefore sometimes called rod-cone dystrophy. Both types of cells are responsible for converting light into electrical impulses that are transmitted to the brain where the ‘seeing’ actually occurs. A TRD patient thus experiences a progressive loss of vision. Rod cells are concentrated along the outer edge of the retina, helping us to see in the dark or in poor light, as well as to perceive images that come into our peripheral vision. As most forms of TRD cause the degeneration of the rod cells, it usually begins with night blindness, the patient adjusting poorly to a dark or dimly lit environment. As the disease progresses and more rod cells degenerate, the patient loses his peripheral vision, often experiencing a ring of vision loss in the mid-periphery, with small islands of vision in the very far periphery. It is not unusual for a patient to report a sensation of tunnel vision; it is as though he sees the world through a straw. TRD patients seldom become totally blind, retaining a small degree of central vision throughout their life.
Macular degeneration (MD) is a disease that gradually destroys sharp, central vision. Cone cells, concentrated in the macula, the centre of the retina, allow us to see fine visual detail in the centre of our vision, and also to perceive colour, deteriorate. When performing visually demanding tasks, such as reading and sewing, individuals with MD may at first notice a blurred central vision; as the disease progresses, blind spots appear. In most cases, if one eye has MD, the other eye will also develop it. There are two types of macular degeneration, wet and dry; wet MD is less common and its effect more severe. Dry MD affects 80% of the people with age-related macular degeneration (AMD), but blurring rarely leads to blindness. Wet MD occurs when abnormal blood vessels start growing underneath the macula; these new blood vessels tend to be very fragile, often leaking blood and fluid, which raises the macula from its normal place. An early symptom of wet MD is
General Introduction
17
that straight lines appear wavy, but as the displacement of the macula results in rapid destruction of the cone cells, this symptom is soon substituted by loss of central vision.
One of the most common complications of diabetes is diabetic retinopathy. Prolonged periods of high blood sugar levels damage the small blood vessels (capillaries) in the retina at the back of the eye. At first, the capillaries become leaky; these haemorrhages result in spots of blood or protein exudates on the retina. Swelling, known as oedema of the retina, may follow. Later, the vessels may become blocked off, starving the retina of oxygen; this leads to the growth of new, abnormal blood vessels. In diabetic adolescents, retinopathy was significantly more common in patients with type-1 diabetes, 20% compared to 4% in patients with diabetes mellitus type 2.28 After suffering from diabetes for twenty years, almost all patients with type-1 diabetes and nearly 80% of patients with type-2 diabetes develop retinopathy.29;30 However, control of the blood sugar level by the patient himself, is effective in preventing retinopathy.
A cataract is a cloudy or opaque area in the lens. This affects vision, as light entering the eye is blocked, distorted, or diffused. Although blurred vision is usually the first symptom, glare and haloes are also early indications, and, less commonly, double vision. Colours may seem more yellow and less vibrant. A very successful treatment is the implantation of a new lens after removing the clouded one by a technique known as phacoemulsification. The diseased lens is broken up by ultrasound, the eye is then irrigated, and the cells and water suctioned out. However, if a person also has another eye disease, the improvement of vision is usually limited. Cataract usually develops with advancing age and may be hereditary. It may also develop at any time after an eye injury. Certain medications, such as cortisone, can also accelerate cataract formation, as does exposure to some environmental factors, such as UVB light31 and cigarette smoke. Metabolic diseases, such as diabetes, also greatly increase the risk of cataract.31 Congenital cataracts, cataracts present at or shortly after birth, are rare; some are caused by an infection contracted by the mother during pregnancy, such as rubella.32 They may also occur when the mother has a certain metabolic disorder, such as Lowe’s syndrome.33 A congenital cataract may also be inherited; the gene for such a cataract is dominant (autosomal dominant inheritance), the defective gene will thus cause the condition even if only one parent passes it on. In families where one parent carries the gene, in each pregnancy, there is a 50% chance that the child will be affected.
Chapter 1
18
Impact of visual impairment As visual impairment is not common in working age adults, its general impact may be quite low. However, for those suffering from it, its impact is extremely high: every aspect of life is affected, education, occupation, social life, and family life.22 Activities previously taken for granted, such as dressing, eating, writing, travelling and simple communication or interacting with other people are hampered. Younger people generally experience more interference in pursuing the goals in life of this age group, such as supporting a family and making a career, than their healthy peers.34;35 Mental health problems are more likely to develop in the visually impaired;36-38 recent evidence shows that the risk tends to be higher in working adults.39
In addition, there is a substantial, life-long economic burden associated with visual disability;40;41 there are the direct costs, such as those of treatment, extra facilities for education, social security disability benefits, as well as the indirect costs associated with disability, such as an impeded personal development, lower income, reduced productivity of those who help or care for a visually impaired person.5 Relative to these, the costs of providing effective rehabilitation programmes would be quite low.
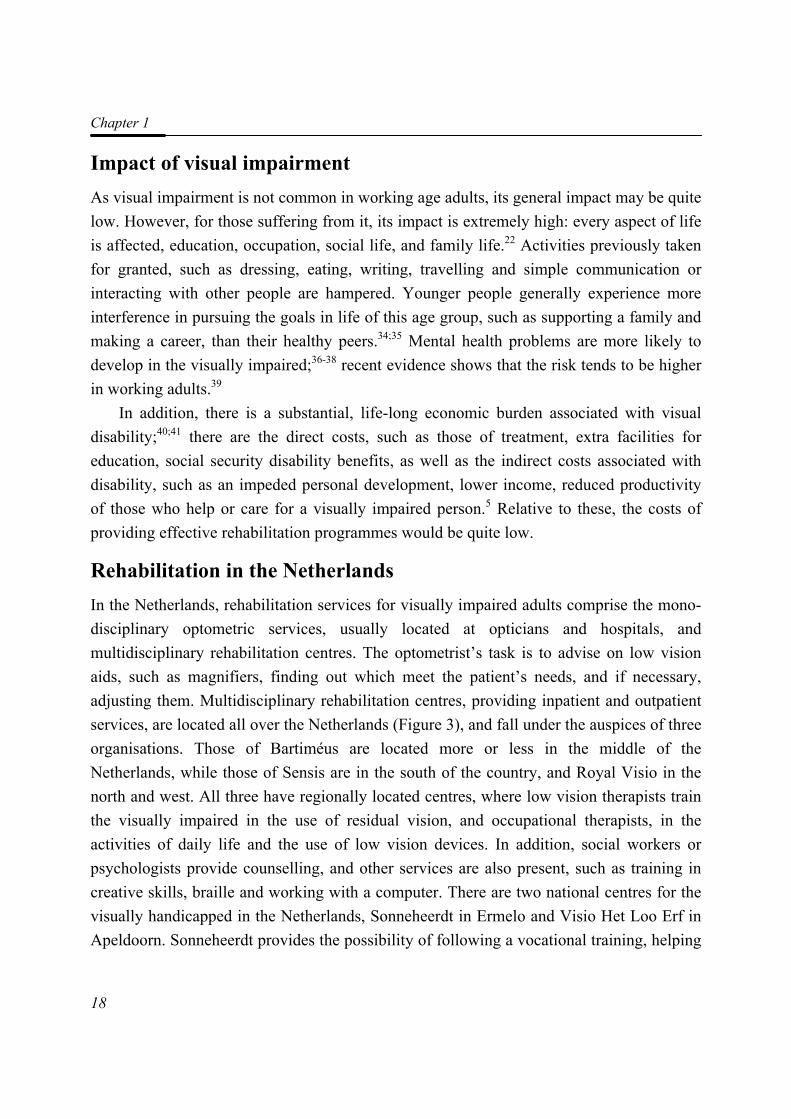
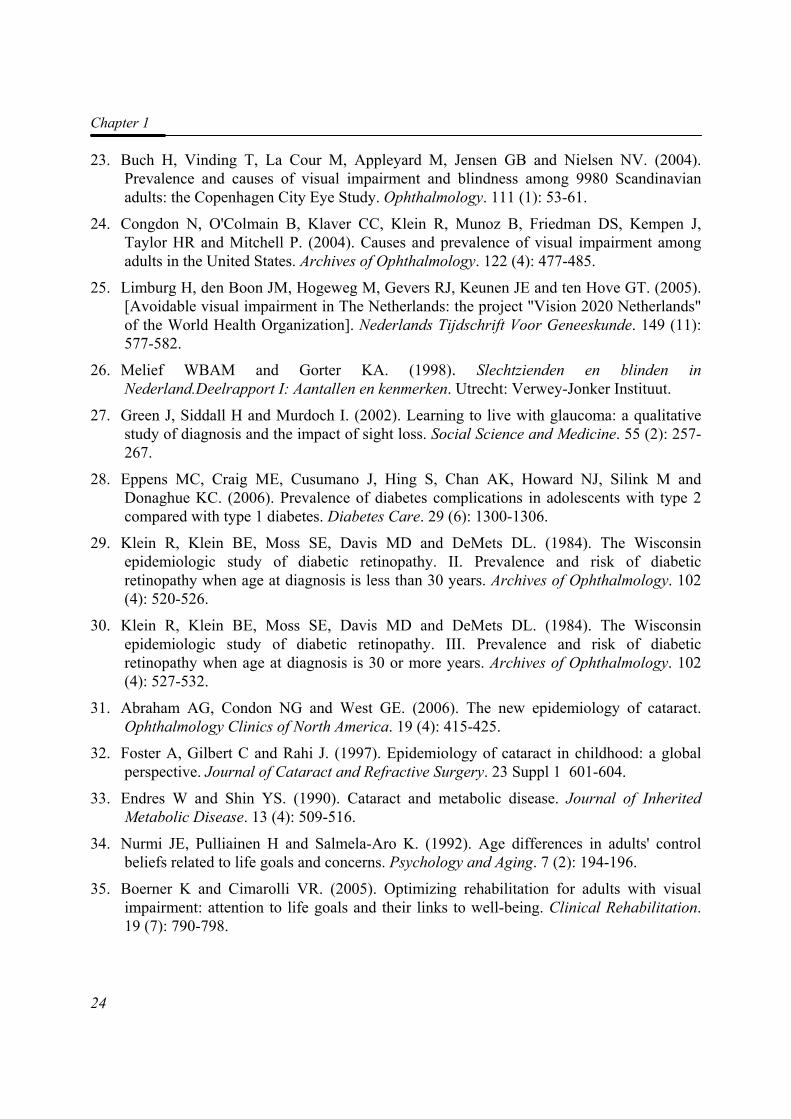
Rehabilitation in the Netherlands In the Netherlands, rehabilitation services for visually impaired adults comprise the mono-disciplinary optometric services, usually located at opticians and hospitals, and multidisciplinary rehabilitation centres. The optometrist’s task is to advise on low vision aids, such as magnifiers, finding out which meet the patient’s needs, and if necessary, adjusting them. Multidisciplinary rehabilitation centres, providing inpatient and outpatient services, are located all over the Netherlands (Figure 3), and fall under the auspices of three organisations. Those of Bartiméus are located more or less in the middle of the Netherlands, while those of Sensis are in the south of the country, and Royal Visio in the north and west. All three have regionally located centres, where low vision therapists train the visually impaired in the use of residual vision, and occupational therapists, in the activities of daily life and the use of low vision devices. In addition, social workers or psychologists provide counselling, and other services are also present, such as training in creative skills, braille and working with a computer. There are two national centres for the visually handicapped in the Netherlands, Sonneheerdt in Ermelo and Visio Het Loo Erf in Apeldoorn. Sonneheerdt provides the possibility of following a vocational training, helping
General Introduction
19
the patient to find work and to live independently; it also develops such opportunities abroad. Visio Het Loo Erf provides comprehensive rehabilitation programmes that are only open to people with complex problems or multiple rehabilitation demands. The programmes include vision training, occupational therapy, mobility training, and coping with vision loss. The programme is initially planned for eighteen weeks, but if necessary, can be shortened or lengthened.
Most visually impaired people would benefit from these services and rehabilitation programmes. However, there is a general lack of awareness of them: people often do not
understand what the services provide.42;43 Moreover, they do not identify themselves as having low vision. As a consequence, there are fewer people using them than is desirable.44 To address this situation, guidelines for the referral of the visually impaired should be made widely available to ophthalmologists, to other professionals working with visually impaired patients and to the patients themselves.
Rehabilitation CentresSensis (2)Bartiméus (4)Visio (6)
Figure 3: Distribution of rehabilitation services in the Netherlands
Chapter 1
20
Quality of life While experts continue to disagree about the definition of quality of life, there seems to be a consensus that Health-Related Quality of Life (HRQOL) takes into account the level of physical, psychological, and social functioning and that it includes abilities, relationships, perceptions, life satisfaction, and well-being.2 Being a subjective measure, the HRQOL varies over time.45 Its use reflects the shift that has taken place over the past thirty years away from relying on only clinical indicators of outcome of rehabilitation; many new tools have been developed to access the patient’s own view of his or her health-related quality of life.
In this thesis, we will adopt the definition of the World Health Organization Quality of Life (WHOQOL) instrument group. The World Health Organization defines Quality of Life as “the individuals’ perception of their position in life in the context of the culture and value systems in which they live and in relation to their goals, expectations, standards and concerns”. The group working on the WHOQOL instrument saw QOL as “a broad ranging concept affected in a complex way by the person’s physical health, psychological state, level of independence, social relationships and their relationship to salient features of their environment”.46 This definition agrees best with the aforementioned consensus.
It should be noted that the HRQOL can be assessed using either a generic or a disease specific questionnaire. The WHOQOL46;47 is an example of a generic HRQOL questionnaire. Such questionnaires are designed to measure the most important aspects of HRQOL. Being generic, they can be applied to a variety of health conditions, impairments, and populations. Other examples are the Medical Outcomes Study short form health surveys, SF-36 and MOS-24,48;49 and the Euroqol 5D (EQ-5D),50 an extensively validated questionnaire developed in a collaboration between the Netherlands and several other European countries.51 These generic questionnaires can be useful for comparing the HRQOL of a group of visually impaired persons with that of a healthy population, or within a group. However, as they contain items of little or no relevance for specific diseases, questionnaires have been developed that are tailored to patients suffering from a particular disease.
There are several patient populations for whom disease-specific questionnaires have been developed, for cancer patients, the EORTC QLQ-C30,52 for those with HIV/AIDS, the MOS-HIV,53 and for stroke patients, the Stroke Impact Scale.54 Questionnaires have also been developed for the visually impaired; they include the 10-item Vision-Related
General Introduction
21
Quality of Life Core Measure (VCM1),55 the 25-item Low Vision Quality of Life Questionnaire (LVQOL),56 and the 25-item National Eye Institute Visual Functioning Questionnaire (VFQ-25).57-59 The VCM1, LVQOL and VFQ-25 seem to have content validity as they result from literature research, and from consulting patients and experts in the field of low vision. These questionnaires contain items regarding activities of daily living, social functioning and coping in relation to vision loss. These are all priorities in comprehensive rehabilitation programmes. The VFQ-25 samples thirteen vision-related quality of life subscales: general health, general vision, ocular pain, near vision, distance vision, social functioning, emotional well-being, vision expectations, role difficulties, dependency, driving, colour vision, and peripheral vision.
The VCM1,55 and the LVQOL56 have been developed and validated in Great Britain and Australia, respectively. These questionnaires are at present being validated for the Dutch low vision population.60 The measures were tested extensively on internal consistency, reproducibility, and several forms of construct validity.60-62
The VFQ-25, also known as NEI-VFQ, has been translated into five languages.59 The Dutch version, the work of a group of ophthalmologists involved in quality of life research, is available on the internet; it has not yet been validated for the Dutch population.
Outline of the contents In this thesis, the measurement properties of the Functional Field Score (FFS) as part of the Functional Vision Score (FVS) are the subject of Chapters 2 and 3; the intrarater and interrater agreements of the FFS were determined (Chapter 2), which led us to recommend a new scoring algorithm of the FFS when a bigger Goldmann isopter is used for measuring the visual field when using a bigger Goldmann isopter to measure the visual field (Chapter 3).
Trials on the outcome of rehabilitation are reviewed in Chapter 4. Following the guidelines set down by the Cochrane Collaboration, we systematically searched the literature, eventually identifying thirty-five trials; descriptive aspects of the trials are included in the review.
We compared the health-related quality of life of visually impaired adults with that of healthy adults and of patients with other chronic conditions (Chapter 5).
Next, we re-evaluated the psychometric quality of the VFQ-25 (Chapter 6). We first carried out an exploratory factor analysis to determine the structure of the questionnaire,
Chapter 1
22
and then performed a Rasch analysis. Differential item functioning (DIF) was also examined.
A follow-up study was carried out into the prognostic factors for a change in vision-related quality of life after rehabilitation (Chapter 7). Finally, we drew up guidelines for the referral of visually impaired adults to various types of rehabilitation services in the Netherlands; recommendations are included (Chapter 8). In the general discussion (Chapter 9), we examine our results, and their practical implications. We also give suggestions for future research.
References 1. Arditi A and Rosenthal B.(1998). Developing an objective definition of visual
impairment. Vision '96: Proceedings of the International Low Vision Conference. Madrid, Spain: ONCE; 331-334.
2. Wood-Dauphinee S. (1999). Assessing quality of life in clinical research: from where have we come and where are we going? Journal of Clinical Epidemiology. 52 (4): 355-363.
3. Massof RW and Fletcher DC. (2001). Evaluation of the NEI visual functioning questionnaire as an interval measure of visual ability in low vision. Vision Research. 41 (3): 397-413.
4. Resnikoff S, Pascolini D, Etya'ale D, Kocur I, Pararajasegaram R, Pokharel GP and Mariotti SP. (2004). Global data on visual impairment in the year 2002. Bulletin of the World Health Organization. 82 (11): 844-851.
5. Taylor HR, Pezzullo ML and Keeffe JE. (2006). The economic impact and cost of visual impairment in Australia. British Journal of Ophthalmology. 90 (3): 272-275.
6. World Health Organization. (1992). ICD-10: International Statistical Classification of Diseases and Related Health Problems : 10th revision. Geneva: World Health Organization.
7. Colenbrander A. (1999). Guide for the Evaluation of Visual Impairment. San Francisco: International Society for Low Vision Research and Rehabilitation.
8. Cocchiarella L and Andersson G.(2001). The visual system. In: Andersson G, Cocchiarella L, eds. Guides to the evaluation of permanent impairment. 5th ed. Chicago, Ill: American Medical Association; 277-304.
9. Fuhr PSW, Holmes LD, Fletcher DC, Swanson MN and Kuyk TK. (2003). The AMA Guides functional vision score is a better predictor of vision-targeted quality of life than traditional measures of visual acuity or visual field extent. Visual Impairment Research. 5 (3): 137-146.
10. Langelaan M, Wouters B, Moll AC, de Boer MR and van Rens GHMB. (2006). Functional field score: the effect of using a Goldmann V-4e isopter instead of a
General Introduction
23
Goldmann III-4e isopter. Investigative Ophthalmology and Visual Science. 47 (5): 1817-1823.
11. Hendrikse F, Webers CAB and La Heij EC. (2002). Wat zijn gezichtsstoornissen? Available at: Volksgezondheid Toekomst Verkenning, Nationaal Kompas Volksgezondheid. http://www.nationaalkompas.nl
12. Klaver CC, Wolfs RC, Vingerling JR, Hofman A and de Jong PT. (1998). Age-specific prevalence and causes of blindness and visual impairment in an older population: the Rotterdam Study. Archives of Ophthalmology. 116 (5): 653-658.
13. Tielsch JM, Sommer A, Witt K, Katz J and Royall RM. (1990). Blindness and visual impairment in an American urban population. The Baltimore Eye Survey. Archives of Ophthalmology. 108 (2): 286-290.
14. Rubin GS, West SK, Munoz B, Bandeen-Roche K, Zeger S, Schein O and Fried LP. (1997). A comprehensive assessment of visual impairment in a population of older Americans. The SEE Study. Salisbury Eye Evaluation Project. Investigative Ophthalmology and Visual Science. 38 (3): 557-568.
15. VanNewkirk MR, Weih L, McCarty CA and Taylor HR. (2001). Cause-specific prevalence of bilateral visual impairment in Victoria, Australia: the Visual Impairment Project. Ophthalmology. 108 (5): 960-967.
16. Taylor HR, Livingston PM, Stanislavsky YL and McCarty CA. (1997). Visual impairment in Australia: distance visual acuity, near vision, and visual field findings of the Melbourne Visual Impairment Project. American Journal of Ophthalmology. 123 (3): 328-337.
17. Attebo K, Mitchell P and Smith W. (1996). Visual acuity and the causes of visual loss in Australia. The Blue Mountains Eye Study. Ophthalmology. 103 (3): 357-364.
18. Klein R, Klein BE, Linton KL and DeMets DL. (1991). The Beaver Dam Eye Study: visual acuity. Ophthalmology. 98 (8): 1310-1315.
19. Varma R, Ying-Lai M, Klein R and Azen SP. (2004). Prevalence and risk indicators of visual impairment and blindness in Latinos: the Los Angeles Latino Eye Study. Ophthalmology. 111 (6): 1132-1140.
20. Buch H, Vinding T, la Cour M. and Nielsen NV. (2001). The prevalence and causes of bilateral and unilateral blindness in an elderly urban Danish population. The Copenhagen City Eye Study. Acta Ophthalmologica Scandinavica. 79 (5): 441-449.
21. Weih LM, VanNewkirk MR, McCarty CA and Taylor HR. (2000). Age-specific causes of bilateral visual impairment. Archives of Ophthalmology. 118 (2): 264-269.
22. Rothe NK, Sjolie AK, Jensen H, Borch-Johnsen K and Rosenberg T. (2003). The prevalence and incidence of visual impairment in people of age 20-59 years in industrialized countries: a review. Ophthalmic Epidemiology. 10 (4): 279-291.
Chapter 1
24
23. Buch H, Vinding T, La Cour M, Appleyard M, Jensen GB and Nielsen NV. (2004). Prevalence and causes of visual impairment and blindness among 9980 Scandinavian adults: the Copenhagen City Eye Study. Ophthalmology. 111 (1): 53-61.
24. Congdon N, O'Colmain B, Klaver CC, Klein R, Munoz B, Friedman DS, Kempen J, Taylor HR and Mitchell P. (2004). Causes and prevalence of visual impairment among adults in the United States. Archives of Ophthalmology. 122 (4): 477-485.
25. Limburg H, den Boon JM, Hogeweg M, Gevers RJ, Keunen JE and ten Hove GT. (2005). [Avoidable visual impairment in The Netherlands: the project "Vision 2020 Netherlands" of the World Health Organization]. Nederlands Tijdschrift Voor Geneeskunde. 149 (11): 577-582.
26. Melief WBAM and Gorter KA. (1998). Slechtzienden en blinden in Nederland.Deelrapport I: Aantallen en kenmerken. Utrecht: Verwey-Jonker Instituut.
27. Green J, Siddall H and Murdoch I. (2002). Learning to live with glaucoma: a qualitative study of diagnosis and the impact of sight loss. Social Science and Medicine. 55 (2): 257-267.
28. Eppens MC, Craig ME, Cusumano J, Hing S, Chan AK, Howard NJ, Silink M and Donaghue KC. (2006). Prevalence of diabetes complications in adolescents with type 2 compared with type 1 diabetes. Diabetes Care. 29 (6): 1300-1306.
29. Klein R, Klein BE, Moss SE, Davis MD and DeMets DL. (1984). The Wisconsin epidemiologic study of diabetic retinopathy. II. Prevalence and risk of diabetic retinopathy when age at diagnosis is less than 30 years. Archives of Ophthalmology. 102 (4): 520-526.
30. Klein R, Klein BE, Moss SE, Davis MD and DeMets DL. (1984). The Wisconsin epidemiologic study of diabetic retinopathy. III. Prevalence and risk of diabetic retinopathy when age at diagnosis is 30 or more years. Archives of Ophthalmology. 102 (4): 527-532.
31. Abraham AG, Condon NG and West GE. (2006). The new epidemiology of cataract. Ophthalmology Clinics of North America. 19 (4): 415-425.
32. Foster A, Gilbert C and Rahi J. (1997). Epidemiology of cataract in childhood: a global perspective. Journal of Cataract and Refractive Surgery. 23 Suppl 1 601-604.
33. Endres W and Shin YS. (1990). Cataract and metabolic disease. Journal of Inherited Metabolic Disease. 13 (4): 509-516.
34. Nurmi JE, Pulliainen H and Salmela-Aro K. (1992). Age differences in adults' control beliefs related to life goals and concerns. Psychology and Aging. 7 (2): 194-196.
35. Boerner K and Cimarolli VR. (2005). Optimizing rehabilitation for adults with visual impairment: attention to life goals and their links to well-being. Clinical Rehabilitation. 19 (7): 790-798.
General Introduction
25
36. Horowitz A, Reinhardt JP and Boerner K. (2005). The effect of rehabilitation on depression among visually disabled older adults. Aging and Mental Health. 9 (6): 563-570.
37. Horowitz A, Reinhardt JP, Boerner K and Travis LA. (2003). The influence of health, social support quality and rehabilitation on depression among disabled elders. Aging and Mental Health. 7 (5): 342-350.
38. Brody BL, Gamst AC, Williams RA, Smith AR, Lau PW, Dolnak D, Rapaport MH, Kaplan RM and Brown SI. (2001). Depression, visual acuity, comorbidity, and disability associated with age-related macular degeneration. Ophthalmology. 108 (10): 1893-1900.
39. Boerner K. (2004). Adaptation to disability among middle-aged and older adults: the role of assimilative and accommodative coping. Journals of Gerontology Series B, Psychological Sciences and Social Sciences. 59 (1): 35-42.
40. Smith AF and Smith JG. (1996). The economic burden of global blindness: a price too high! British Journal of Ophthalmology. 80 (4): 276-277.
41. Raasch TW, Leat SJ, Kleinstein RN, Bullimore MA and Cutter GR. (1997). Evaluating the value of low-vision services. Journal of the American Optometric Association. 68 (5): 287-295.
42. Pollard TL, Simpson JA, Lamoureux EL and Keeffe JE. (2003). Barriers to accessing low vision services. Ophthalmic and Physiological Optics. 23 (4): 321-327.
43. Keeffe JE, Lovie-Kitchin JE and Taylor HR. (1996). Referral to low vision services by ophthalmologists. Australian and New Zealand Journal of Ophthalmology. 24 (3): 207-214.
44. Greenblatt SL. (2005). Ophthalmologists' referrals improve the lives of visually impaired patients. Archives of Ophthalmology. 123 (6): 872-873.
45. Aaronson NK. (1989). Quality of life assessment in clinical trials: methodologic issues. Controlled Clinical Trials. 10 (4 Suppl): 195S-208S.
46. WHOQOL group. (1995). The World Health Organization Quality of Life assessment (WHOQOL): position paper from the World Health Organization. Social Science and Medicine. 41 (10): 1403-1409.
47. WHOQOL group. (1993). Study protocol for the World Health Organization project to develop a Quality of Life assessment instrument (WHOQOL). Quality of Life Research. 2 (2): 153-159.
48. Stewart AL, Hays RD and Ware JE, Jr. (1988). The MOS short-form general health survey. Reliability and validity in a patient population. Medical Care. 26 (7): 724-735.
49. Ware JE, Jr. and Sherbourne CD. (1992). The MOS 36-item short-form health survey (SF-36). I. Conceptual framework and item selection. Medical Care. 30 (6): 473-483.
Chapter 1
26
50. EuroQol Group. (1990). EuroQol--a new facility for the measurement of health-related quality of life. Health Policy. 16 (3): 199-208.
51. Brooks R. (1996). EuroQol: the current state of play. Health Policy. 37 (1): 53-72.
52. Aaronson NK, Ahmedzai S, Bergman B, Bullinger M, Cull A, Duez NJ, Filiberti A, Flechtner H, Fleishman SB, de Haes JC and . (1993). The European Organization for Research and Treatment of Cancer QLQ-C30: a quality-of-life instrument for use in international clinical trials in oncology. Journal of the National Cancer Institute. 85 (5): 365-376.
53. Wu AW, Rubin HR, Mathews WC, Ware JE, Jr., Brysk LT, Hardy WD, Bozzette SA, Spector SA and Richman DD. (1991). A health status questionnaire using 30 items from the Medical Outcomes Study. Preliminary validation in persons with early HIV infection. Medical Care. 29 (8): 786-798.
54. Duncan PW, Wallace D, Lai SM, Johnson D, Embretson S and Laster LJ. (1999). The stroke impact scale version 2.0. Evaluation of reliability, validity, and sensitivity to change. Stroke. 30 (10): 2131-2140.
55. Frost NA, Sparrow JM, Durant JS, Donovan JL, Peters TJ and Brookes ST. (1998). Development of a questionnaire for measurement of vision-related quality of life. Ophthalmic Epidemiology. 5 (4): 185-210.
56. Wolffsohn JS and Cochrane AL. (2000). Design of the low vision quality-of-life questionnaire (LVQOL) and measuring the outcome of low-vision rehabilitation. American Journal of Ophthalmology. 130 (6): 793-802.
57. Mangione CM, Berry S, Spritzer K, Janz NK, Klein R, Owsley C and Lee PP. (1998). Identifying the content area for the 51-item National Eye Institute Visual Function Questionnaire: results from focus groups with visually impaired persons. Archives of Ophthalmology. 116 (2): 227-233.
58. Mangione CM, Lee PP, Pitts J, Gutierrez P, Berry S and Hays RD. (1998). Psychometric properties of the National Eye Institute Visual Function Questionnaire (NEI-VFQ). NEI-VFQ Field Test Investigators. Archives of Ophthalmology. 116 (11): 1496-1504.
59. Mangione CM, Lee PP, Gutierrez PR, Spritzer K, Berry S and Hays RD. (2001). Development of the 25-item National Eye Institute Visual Function Questionnaire. Archives of Ophthalmology. 119 (7): 1050-1058.
60. Terwee CB, Bot SD, de Boer MR, van der Windt DA, Knol DL, Dekker J, Bouter LM and de Vet HCW. (2007). Quality criteria were proposed for measurement properties of health status questionnaires. Journal of Clinical Epidemiology. 60 (1): 34-42.
61. de Boer MR, Terwee CB, de Vet HCW, Moll AC, Volker-Dieben HJ and van Rens GHMB. (2006). Evaluation of cross-sectional and longitudinal construct validity of two vision-related quality of life questionnaires: the LVQOL and VCM1. Quality of Life Research. 15 (2): 233-248.
General Introduction
27
62. van Nispen RMA, Knol DL, Langelaan M, Terwee CB, de Boer MR and van Rens GHMB. Re-evaluating Vision Related Quality of Life in Dutch Visually Impaired Elderly using a Multilevel Analysis in Item Response Theory. accepted for publication

22
IInnttrraa-- aanndd iinntteerrrraatteerr aaggrreeeemmeenntt aanndd rreelliiaabbiilliittyy ooff tthhee FFuunnccttiioonnaall FFiieelldd
SSccoorree
Maaike Langelaan, Bill Wouters, Annette C. Moll, Michiel R. de Boer, Ger H.M.B. van Rens
Ophthalmic and Physiological Optics 2005 25 (2): 136-142
Chapter 2
30
Abstract In 2001, the American Medical Association adopted the Functional Vision Score (FVS). It is built on Functional Acuity Scores (FAS) and Functional Field Scores (FFS). The purpose of this study was to evaluate the intra- and interrater reproducibility of the FFS. The study sample was composed of 62 persons, mean age 41.8 years, from the population of patients who visited a rehabilitation centre for visually impaired adults. We analysed 30 FFSs of isopter III−4e and 58 of isopter V−4e. Two raters independently scored the plots. The smallest detectable difference (SDD) and the weighted kappa quantified agreement. The SDDs were smaller than the minimally clinically important difference (MCID) of ten points. Thus, the MCID can be distinguished from measurement error. The intraclass correlation coefficient (ICC) quantified reliability. The intra- and inter ICCs were high (ICCs>0.98). We concluded that both intra- and interrater reliability of the FFS proved to be excellent.
Intrarater and interrater agreement of the FFS
31
Introduction Since the 19th century, there has been interest in visual functioning. Visual functioning depends on the visual impairment of a person and is related to his/her activities of daily living. Visual acuity loss or visual field loss, which alone would not be severe enough to be classified as visual impairment, may in combination be disabling. Using visual acuity and visual fields separately makes it difficult to give expression to a person’s abilities and disabilities.
Several attempts have been made to develop a score for visual functioning. Until recently, there was no uniform disability classification for visual impairments. In order to make uniform guidelines, the American Medical Association (AMA) published guidelines on compensation for eye injuries. Up to the fourth edition,1 the guidelines were based on Snell’s Visual Efficiency Scale.2
There are several applications where a visual functioning classification is used. The first application is to determine the amount of disability compensation. For example, in the U.S.A. an important application of the classification is the determination of the workers’ compensation. In the Netherlands, the classification is mainly used to determine the claim for damages for insurance and malpractice cases. Second, eligibility for funding for low vision aids and other rehabilitative intervention and support services is often dependent on these classifications for low vision and visual impairment. Third, the classification may be used to enrol an individual in a specific rehabilitation program. For example, in most western countries there are separate centres or services for the blind and for the patients with low vision. Finally, the classification can be used in research for example as a predictor for the effect of visual rehabilitation outcome.
Because visual functioning depends not only on the person’s impairment, but also on the activities he has to perform or his participation in the society, it is not justified to use the visual function score for assessing individual capacities.
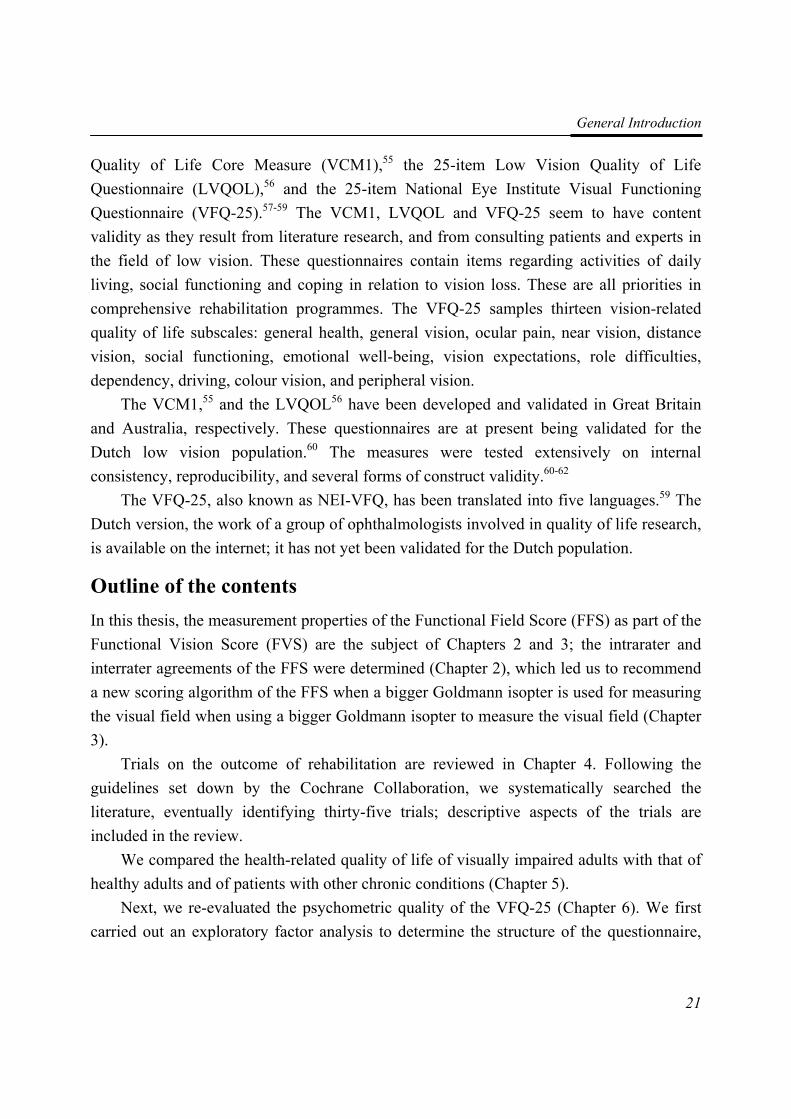
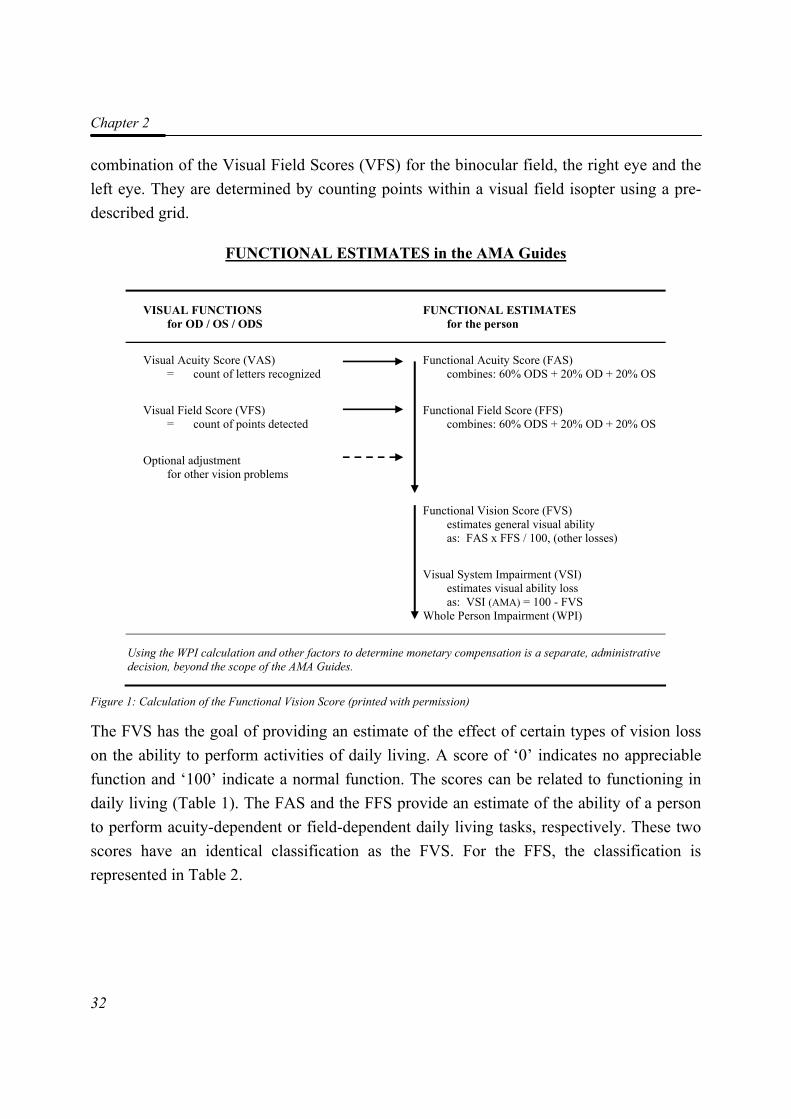
In the fifth, and most recent edition of the guides to the evaluation of permanent impairment,3 the AMA adopted a new algorithm: the Functional Vision Score (FVS).4 As illustrated in Figure 1, the FVS is built on a Functional Acuity Score (FAS) and a Functional Field Score (FFS). After the best-corrected visual acuity values for binocular vision (ODS), for the right eye (OD) and for the left eye (OS) have been obtained and converted to Visual Acuity Scores (VAS), these values need to be combined to a single Functional Acuity Score (FAS). The Functional Field Score (FFS) consists of a
Chapter 2
32
combination of the Visual Field Scores (VFS) for the binocular field, the right eye and the left eye. They are determined by counting points within a visual field isopter using a pre-described grid.
FUNCTIONAL ESTIMATES in the AMA Guides
VISUAL FUNCTIONS for OD / OS / ODS
FUNCTIONAL ESTIMATES for the person
Visual Acuity Score (VAS) = count of letters recognized
Functional Acuity Score (FAS) combines: 60% ODS + 20% OD + 20% OS
Visual Field Score (VFS) = count of points detected
Functional Field Score (FFS) combines: 60% ODS + 20% OD + 20% OS
Optional adjustment for other vision problems
Functional Vision Score (FVS) estimates general visual ability as: FAS x FFS / 100, (other losses)
Visual System Impairment (VSI) estimates visual ability loss as: VSI (AMA) = 100 - FVS Whole Person Impairment (WPI)
Using the WPI calculation and other factors to determine monetary compensation is a separate, administrative decision, beyond the scope of the AMA Guides.
Figure 1: Calculation of the Functional Vision Score (printed with permission)
The FVS has the goal of providing an estimate of the effect of certain types of vision loss on the ability to perform activities of daily living. A score of ‘0’ indicates no appreciable function and ‘100’ indicate a normal function. The scores can be related to functioning in daily living (Table 1). The FAS and the FFS provide an estimate of the ability of a person to perform acuity-dependent or field-dependent daily living tasks, respectively. These two scores have an identical classification as the FVS. For the FFS, the classification is represented in Table 2.
Intrarater and interrater agreement of the FFS
33
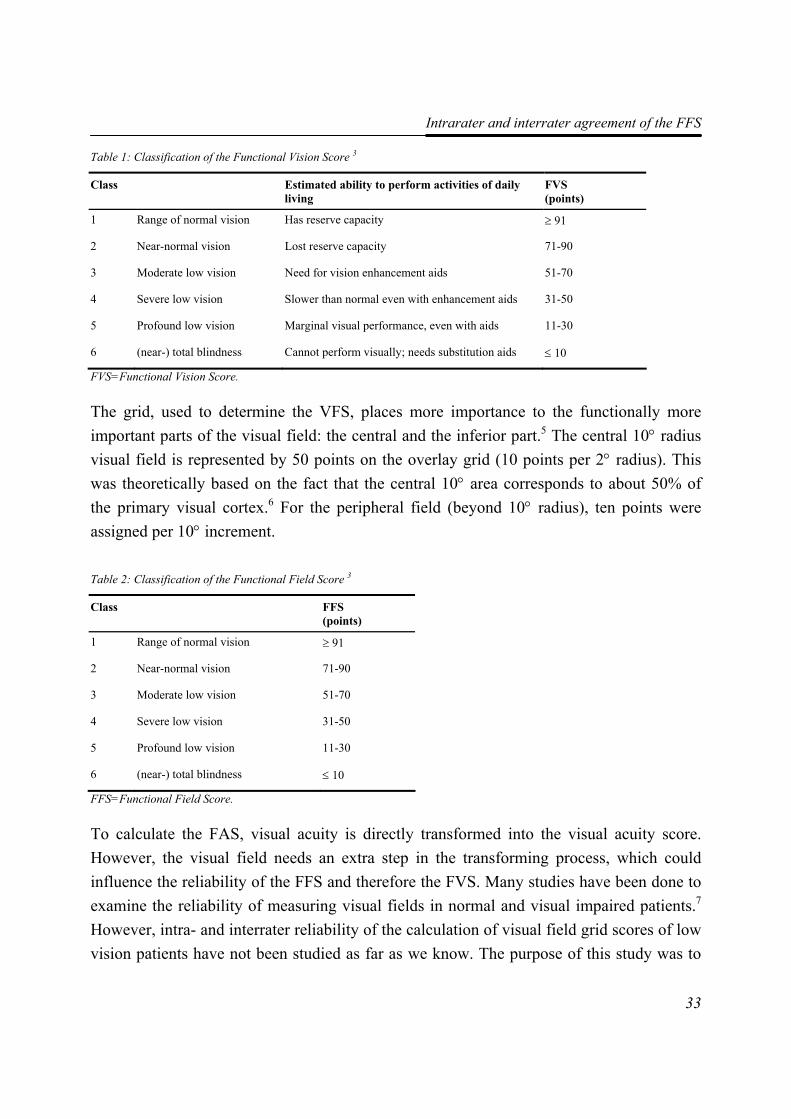
Table 1: Classification of the Functional Vision Score 3
Class Estimated ability to perform activities of daily living
FVS (points)
1 Range of normal vision Has reserve capacity ≥ 91
2 Near-normal vision Lost reserve capacity 71-90
3 Moderate low vision Need for vision enhancement aids 51-70
4 Severe low vision Slower than normal even with enhancement aids 31-50
5 Profound low vision Marginal visual performance, even with aids 11-30
6 (near-) total blindness Cannot perform visually; needs substitution aids ≤ 10
FVS=Functional Vision Score.
The grid, used to determine the VFS, places more importance to the functionally more important parts of the visual field: the central and the inferior part.5 The central 10° radius visual field is represented by 50 points on the overlay grid (10 points per 2° radius). This was theoretically based on the fact that the central 10° area corresponds to about 50% of the primary visual cortex.6 For the peripheral field (beyond 10° radius), ten points were assigned per 10° increment.
Table 2: Classification of the Functional Field Score 3
Class FFS (points)
1 Range of normal vision ≥ 91
2 Near-normal vision 71-90
3 Moderate low vision 51-70
4 Severe low vision 31-50
5 Profound low vision 11-30
6 (near-) total blindness ≤ 10
FFS=Functional Field Score.
To calculate the FAS, visual acuity is directly transformed into the visual acuity score. However, the visual field needs an extra step in the transforming process, which could influence the reliability of the FFS and therefore the FVS. Many studies have been done to examine the reliability of measuring visual fields in normal and visual impaired patients.7 However, intra- and interrater reliability of the calculation of visual field grid scores of low vision patients have not been studied as far as we know. The purpose of this study was to
Chapter 2
34
evaluate the intra- and interrater agreement and reliability of the rating scheme used to calculate the Functional Field Score (FFS).
Methods
Population
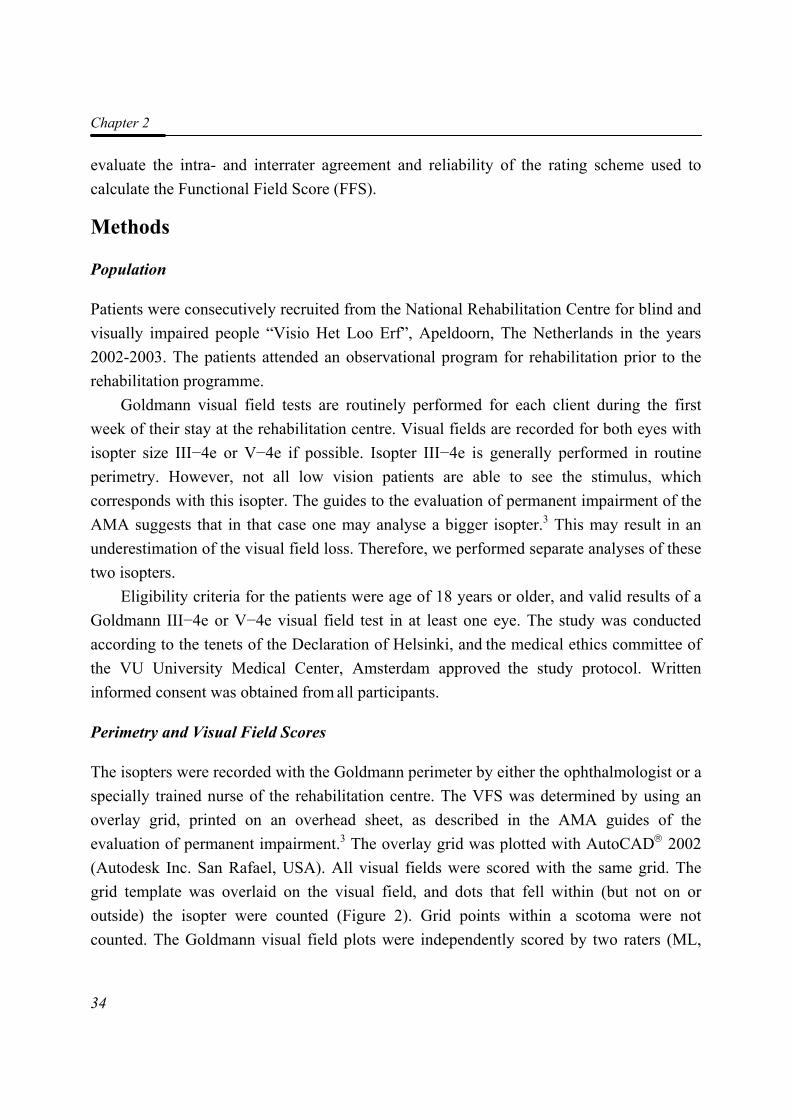
Patients were consecutively recruited from the National Rehabilitation Centre for blind and visually impaired people “Visio Het Loo Erf”, Apeldoorn, The Netherlands in the years 2002-2003. The patients attended an observational program for rehabilitation prior to the rehabilitation programme.
Goldmann visual field tests are routinely performed for each client during the first week of their stay at the rehabilitation centre. Visual fields are recorded for both eyes with isopter size III−4e or V−4e if possible. Isopter III−4e is generally performed in routine perimetry. However, not all low vision patients are able to see the stimulus, which corresponds with this isopter. The guides to the evaluation of permanent impairment of the AMA suggests that in that case one may analyse a bigger isopter.3 This may result in an underestimation of the visual field loss. Therefore, we performed separate analyses of these two isopters.
Eligibility criteria for the patients were age of 18 years or older, and valid results of a Goldmann III−4e or V−4e visual field test in at least one eye. The study was conducted
according to the tenets of the Declaration of Helsinki, and the medical ethics committee of the VU University Medical Center, Amsterdam approved the study protocol. Written informed consent was obtained from all participants.
Perimetry and Visual Field Scores
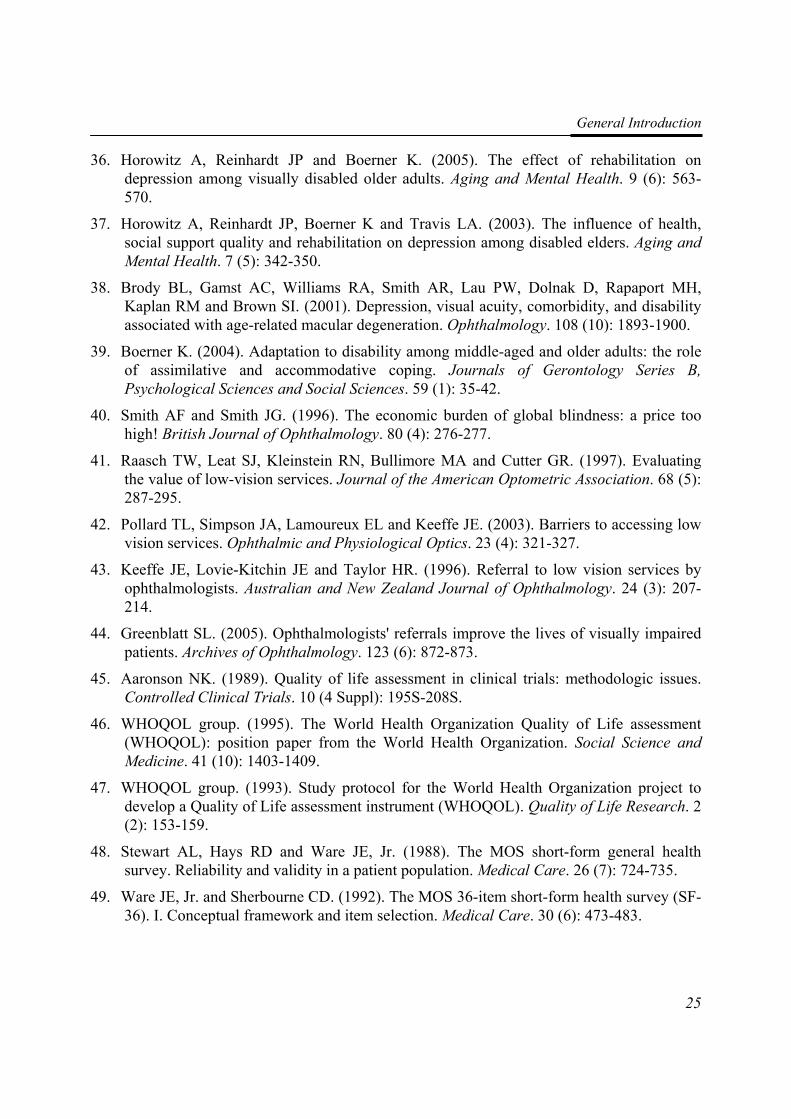
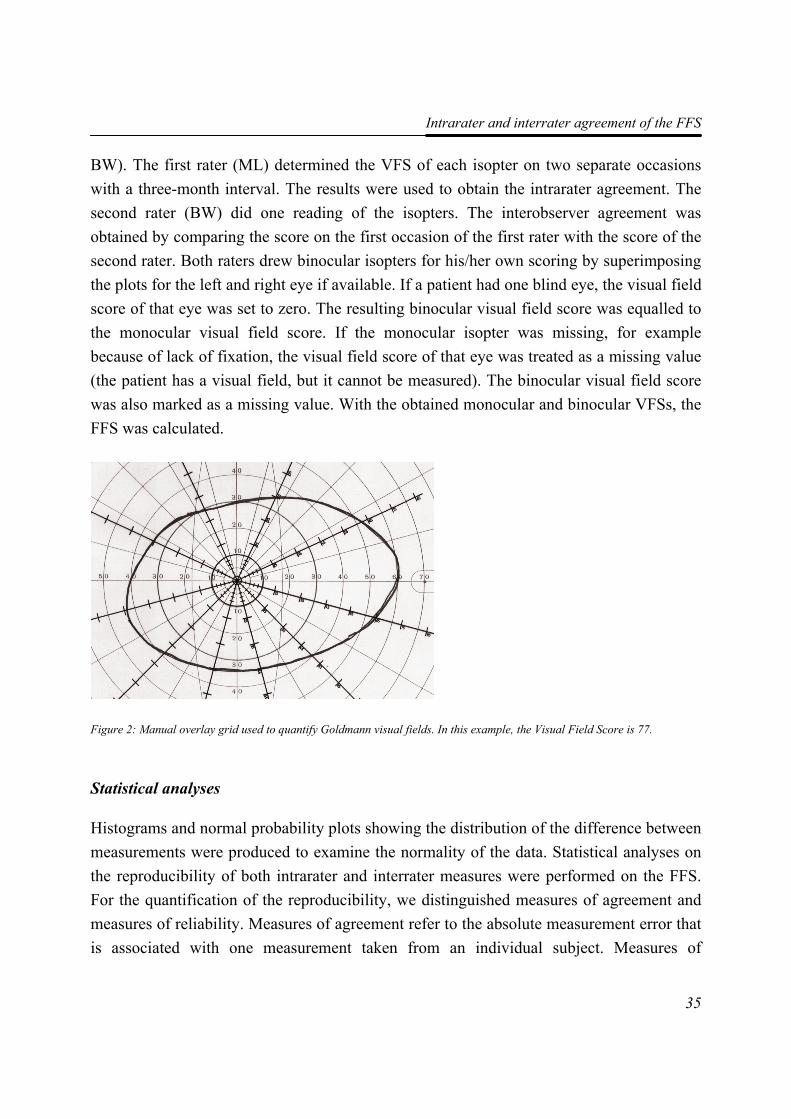
The isopters were recorded with the Goldmann perimeter by either the ophthalmologist or a specially trained nurse of the rehabilitation centre. The VFS was determined by using an overlay grid, printed on an overhead sheet, as described in the AMA guides of the evaluation of permanent impairment.3 The overlay grid was plotted with AutoCAD® 2002 (Autodesk Inc. San Rafael, USA). All visual fields were scored with the same grid. The grid template was overlaid on the visual field, and dots that fell within (but not on or outside) the isopter were counted (Figure 2). Grid points within a scotoma were not counted. The Goldmann visual field plots were independently scored by two raters (ML,
Intrarater and interrater agreement of the FFS
35
BW). The first rater (ML) determined the VFS of each isopter on two separate occasions with a three-month interval. The results were used to obtain the intrarater agreement. The second rater (BW) did one reading of the isopters. The interobserver agreement was obtained by comparing the score on the first occasion of the first rater with the score of the second rater. Both raters drew binocular isopters for his/her own scoring by superimposing the plots for the left and right eye if available. If a patient had one blind eye, the visual field score of that eye was set to zero. The resulting binocular visual field score was equalled to the monocular visual field score. If the monocular isopter was missing, for example because of lack of fixation, the visual field score of that eye was treated as a missing value (the patient has a visual field, but it cannot be measured). The binocular visual field score was also marked as a missing value. With the obtained monocular and binocular VFSs, the FFS was calculated.
Statistical analyses
Histograms and normal probability plots showing the distribution of the difference between measurements were produced to examine the normality of the data. Statistical analyses on the reproducibility of both intrarater and interrater measures were performed on the FFS. For the quantification of the reproducibility, we distinguished measures of agreement and measures of reliability. Measures of agreement refer to the absolute measurement error that is associated with one measurement taken from an individual subject. Measures of
Figure 2: Manual overlay grid used to quantify Goldmann visual fields. In this example, the Visual Field Score is 77.
Chapter 2
36
reliability refer to the relative measure error, i.e. the variation between patients in relation to the total variance of the measurements.8
Agreement
Statistical techniques employed to analyse the intra- and interobserver agreement were the 95% limits of agreement,9 calculation of the smallest detectable difference (SDD) and the calculation of the weighted kappa κw.
Bland and Altman-scatterplots of repeated measurements and of measurement differences plotted against measurement averages were produced to determine whether the differences between the FFS-scores were related to the mean FFS score.9 Subsequently, the 95% limits of agreement were calculated. They are defined as the mean difference between the observations or raters ± tn-1, 0.975 * SDdifferences.
A next step was to compare the smallest detectable difference (SDD) with the clinically important difference to examine whether this could be distinguished from measurement error. The SDD is equal to tn-1, 0.975 * SDdifferences. It expresses the smallest difference between two scores that can be interpreted as 'real' and cannot be attributed to measurement error.
There are no standardized methods for defining the magnitude of minimal clinically important differences. The clinical important difference is an arbitrarily chosen amount of difference indicating which difference clinicians and researchers.minimally expect or judge as important. The minimally clinically important difference for the FFS was defined at 10 points by a small focus group of professionals in low vision care. This is the maximum difference from dividing the patient in a lower or higher FFS class (Table 2). If the minimally clinically important difference we want to measure does exceed the SDD, the measurement instrument is valid for this purpose.
The FFS of the isopter was translated into a classification score according to Table 2. We derived the weighted kappa κw to quantify the agreement for the classes within the classification. The weighted kappa statistic was assumed to show an excellent agreement if kw ≥ 0.80.10
We hypothesized that there may be less variability in the scores above 50. The central horizontal twenty degrees of the visual field contains 50 points. This means that points lie very close together. A slight move of the grid on the Goldmann paper may give great differences in the counted points.
Intrarater and interrater agreement of the FFS
37
Reliability
The intraclass correlation coefficient (ICC) two way random model on absolute agreement was used to analyse measurement reliability.11 It is essentially a ratio of the variance between subjects to the total variance (subjects, raters and error). The values of the ICC can range from 0 to 1, with a higher value indicating better reliability. An intraclass correlation of at least 0.70 is considered to be satisfactory for group comparisons, and a value of 0.90 for individual comparisons.12
Statistical analyses were performed using SPSS 11.5 software (SPSS Inc., Chicago, Illinois).
Results A total of 181 monocular isopters (isopter III−4e and/or V−4e) of 62 subjects (32 males and 30 females, mean age 41.8 years (median 40.5 years)) were scored. For 24 subjects a binocular isopter III−4e could be plotted, and for 46 subjects a binocular isopter V−4e could be plotted. For eight subjects the binocular III−4e and for 13 subjects the binocular V−4e isopter was equal to the monocular isopter, because the subject had one blind eye.
Primary diagnoses of visual system disorders were: optic neuropathy, 34%; tapetoretinal dystrophies, 21%; macular degeneration, 11%; diabetic retinopathy, 10%; glaucoma, 3%; and other eye diseases, 21%. The diversity in the diagnoses reveals a wide range of type and extent of visual field loss.
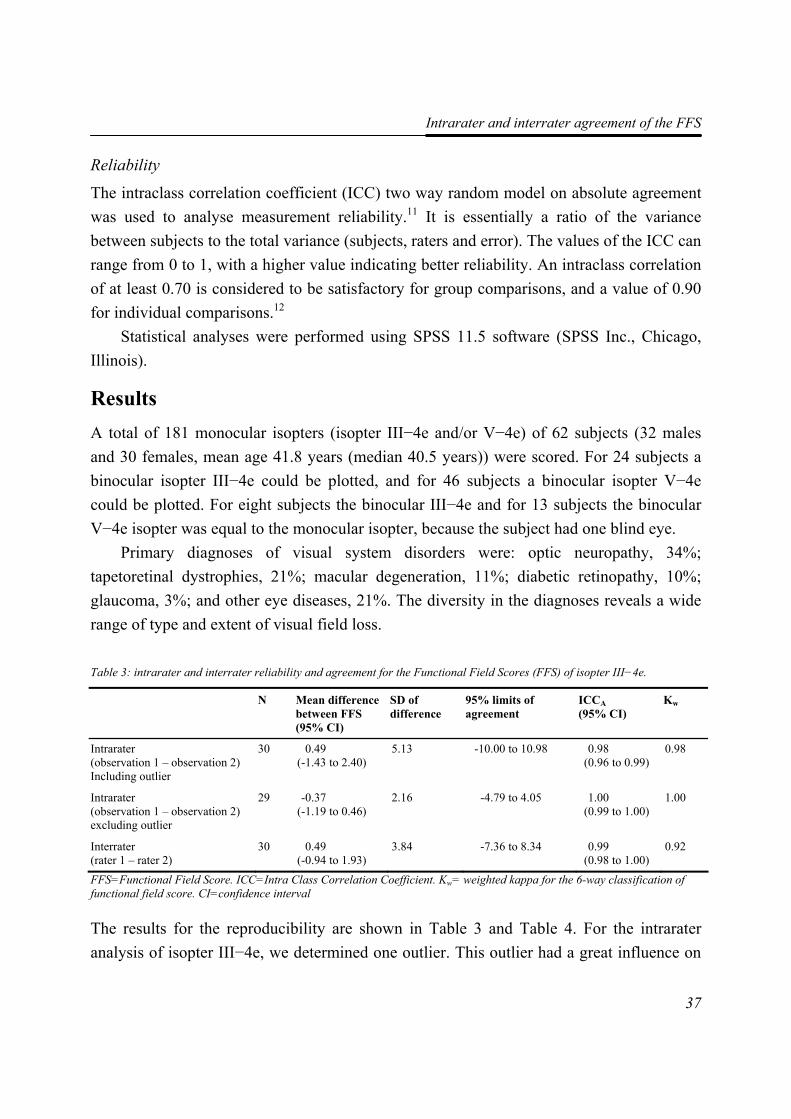
Table 3: intrarater and interrater reliability and agreement for the Functional Field Scores (FFS) of isopter III−4e.
N Mean difference between FFS (95% CI)
SD of difference
95% limits of agreement
ICCA (95% CI)
Kw
Intrarater (observation 1 – observation 2) Including outlier
30 0.49 (-1.43 to 2.40)
5.13 -10.00 to 10.98 0.98 (0.96 to 0.99)
0.98
Intrarater (observation 1 – observation 2) excluding outlier
29 -0.37 (-1.19 to 0.46)
2.16 -4.79 to 4.05 1.00 (0.99 to 1.00)
1.00
Interrater (rater 1 – rater 2)
30 0.49 (-0.94 to 1.93)
3.84 -7.36 to 8.34 0.99 (0.98 to 1.00)
0.92
FFS=Functional Field Score. ICC=Intra Class Correlation Coefficient. Kw= weighted kappa for the 6-way classification of functional field score. CI=confidence interval
The results for the reproducibility are shown in Table 3 and Table 4. For the intrarater analysis of isopter III−4e, we determined one outlier. This outlier had a great influence on
Chapter 2
38
the results. The main cause of this outlier is the irregular visual field of this subject. A second cause could be the amount of isopters that were drawn on one Goldmann paper. There were four isopters drawn on the paper and the boundaries lie close to each other. The statistical analyses were done with and without this outlier.
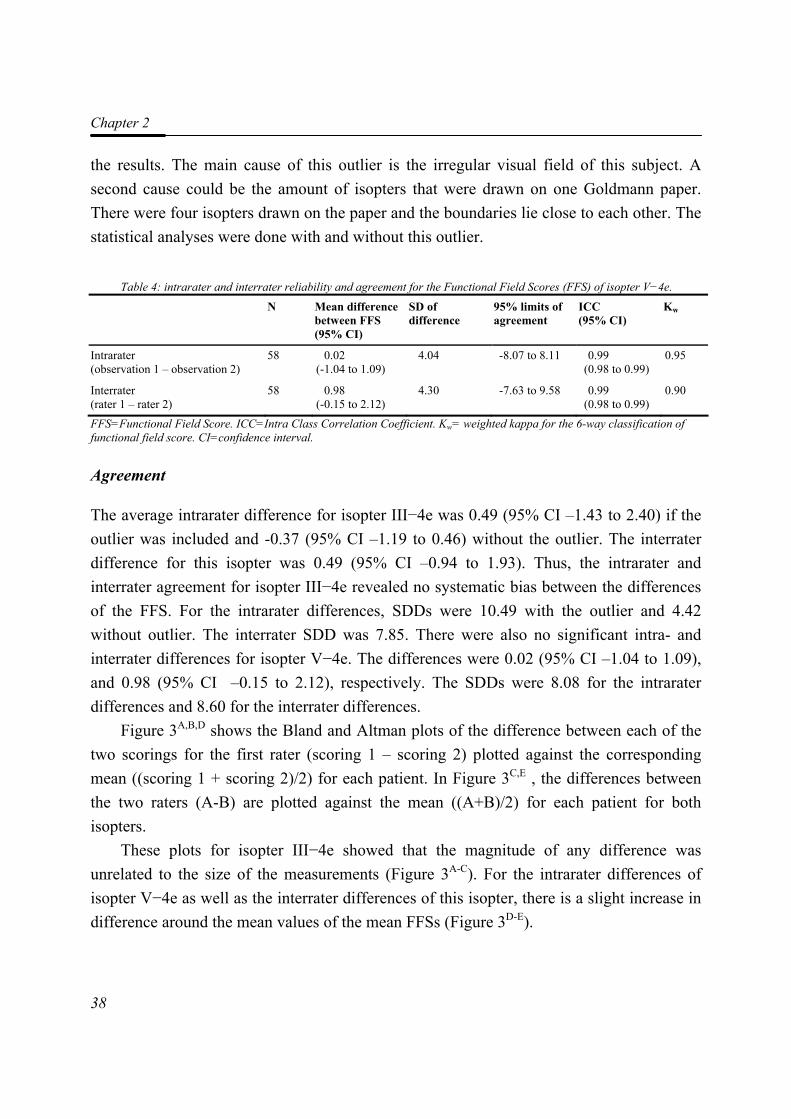
Table 4: intrarater and interrater reliability and agreement for the Functional Field Scores (FFS) of isopter V−4e.
N Mean difference between FFS (95% CI)
SD of difference
95% limits of agreement
ICC (95% CI)
Kw
Intrarater (observation 1 – observation 2)
58 0.02 (-1.04 to 1.09)
4.04 -8.07 to 8.11 0.99 (0.98 to 0.99)
0.95
Interrater (rater 1 – rater 2)
58 0.98 (-0.15 to 2.12)
4.30 -7.63 to 9.58 0.99 (0.98 to 0.99)
0.90
FFS=Functional Field Score. ICC=Intra Class Correlation Coefficient. Kw= weighted kappa for the 6-way classification of functional field score. CI=confidence interval.
Agreement
The average intrarater difference for isopter III−4e was 0.49 (95% CI –1.43 to 2.40) if the outlier was included and -0.37 (95% CI –1.19 to 0.46) without the outlier. The interrater difference for this isopter was 0.49 (95% CI –0.94 to 1.93). Thus, the intrarater and interrater agreement for isopter III−4e revealed no systematic bias between the differences of the FFS. For the intrarater differences, SDDs were 10.49 with the outlier and 4.42 without outlier. The interrater SDD was 7.85. There were also no significant intra- and interrater differences for isopter V−4e. The differences were 0.02 (95% CI –1.04 to 1.09), and 0.98 (95% CI –0.15 to 2.12), respectively. The SDDs were 8.08 for the intrarater differences and 8.60 for the interrater differences.
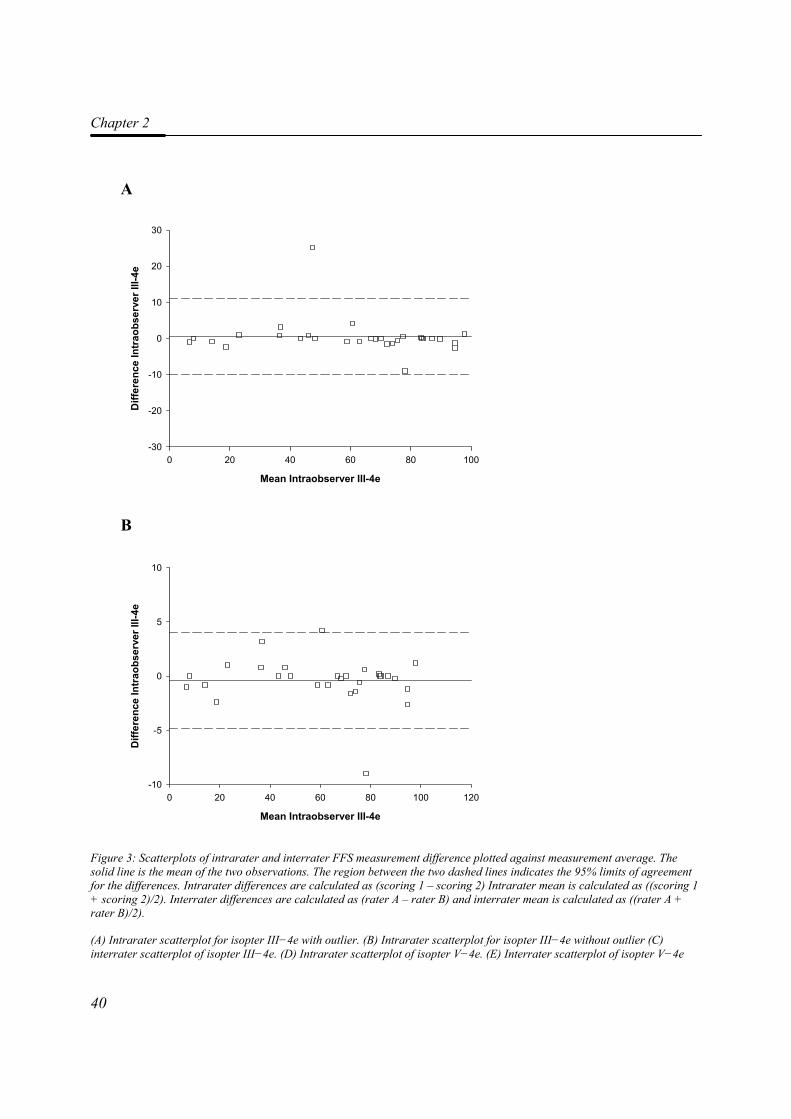
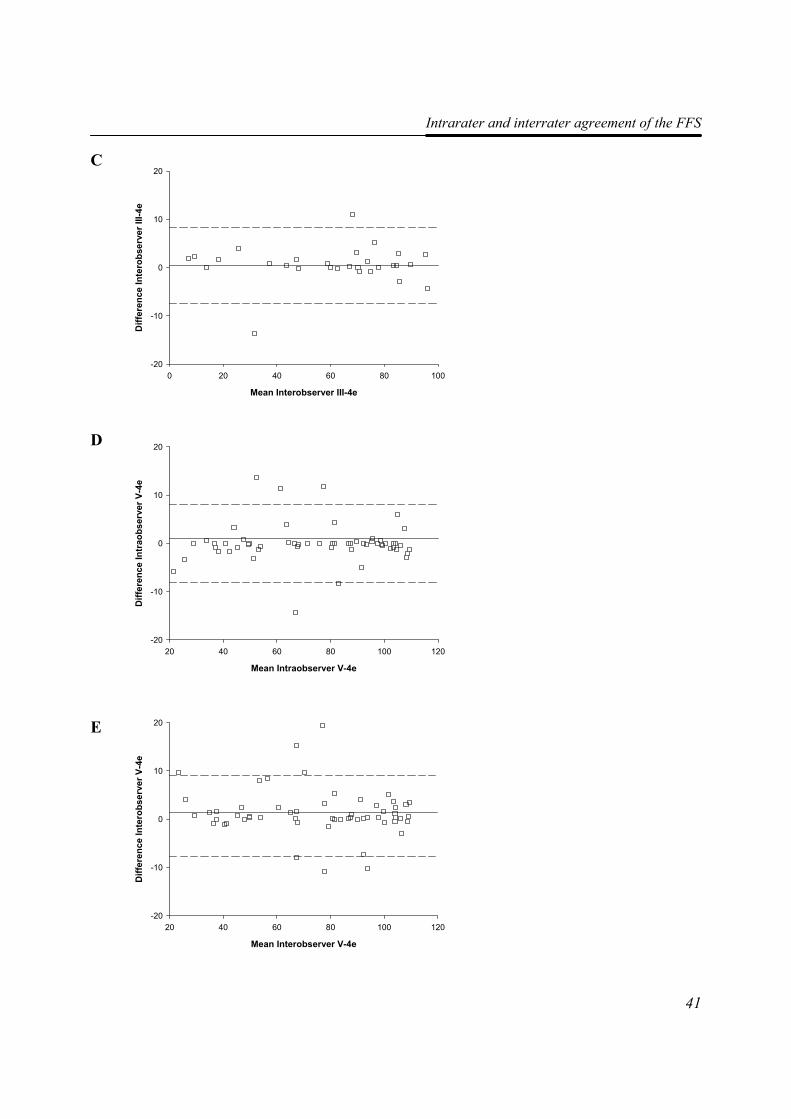
Figure 3A,B,D shows the Bland and Altman plots of the difference between each of the two scorings for the first rater (scoring 1 – scoring 2) plotted against the corresponding mean ((scoring 1 + scoring 2)/2) for each patient. In Figure 3C,E , the differences between the two raters (A-B) are plotted against the mean ((A+B)/2) for each patient for both isopters.
These plots for isopter III−4e showed that the magnitude of any difference was unrelated to the size of the measurements (Figure 3A-C). For the intrarater differences of isopter V−4e as well as the interrater differences of this isopter, there is a slight increase in difference around the mean values of the mean FFSs (Figure 3D-E).
Intrarater and interrater agreement of the FFS
39
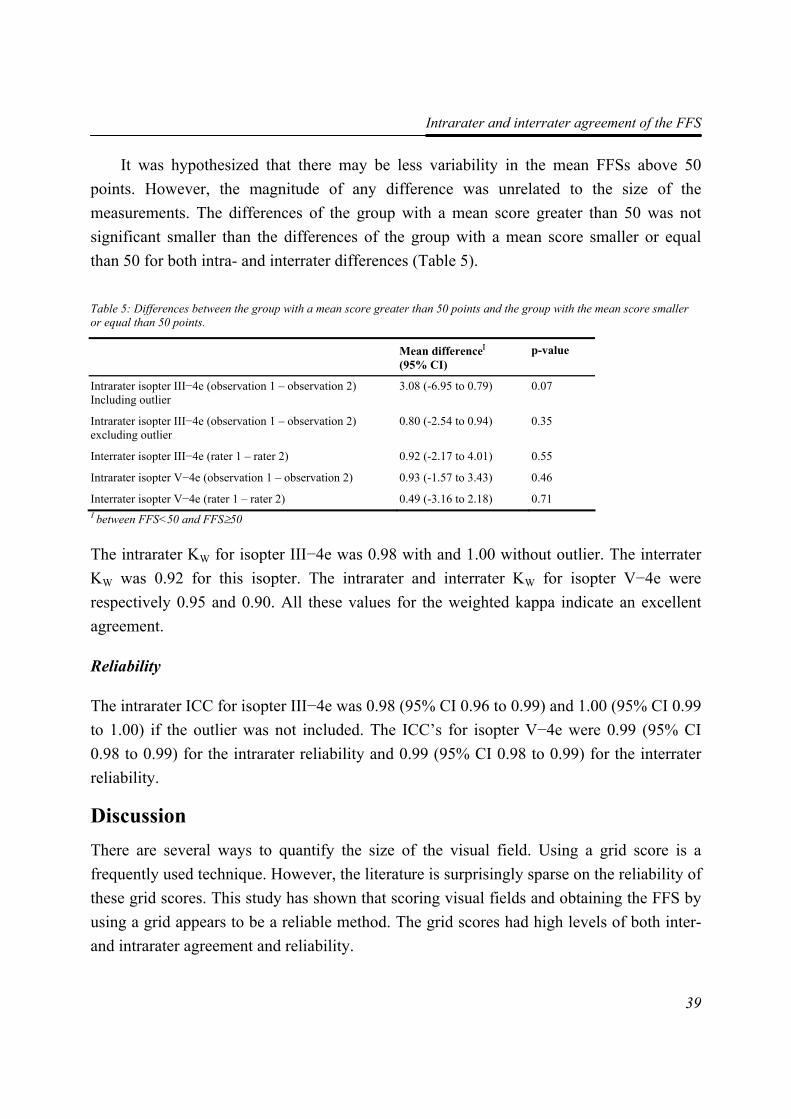
It was hypothesized that there may be less variability in the mean FFSs above 50 points. However, the magnitude of any difference was unrelated to the size of the measurements. The differences of the group with a mean score greater than 50 was not significant smaller than the differences of the group with a mean score smaller or equal than 50 for both intra- and interrater differences (Table 5).
Table 5: Differences between the group with a mean score greater than 50 points and the group with the mean score smaller or equal than 50 points.
Mean differenceΙ (95% CI)
p-value
Intrarater isopter III−4e (observation 1 – observation 2) Including outlier
3.08 (-6.95 to 0.79) 0.07
Intrarater isopter III−4e (observation 1 – observation 2) excluding outlier
0.80 (-2.54 to 0.94) 0.35
Interrater isopter III−4e (rater 1 – rater 2) 0.92 (-2.17 to 4.01) 0.55
Intrarater isopter V−4e (observation 1 – observation 2) 0.93 (-1.57 to 3.43) 0.46
Interrater isopter V−4e (rater 1 – rater 2) 0.49 (-3.16 to 2.18) 0.71 Ι between FFS<50 and FFS≥50
The intrarater ΚW for isopter III−4e was 0.98 with and 1.00 without outlier. The interrater ΚW was 0.92 for this isopter. The intrarater and interrater ΚW for isopter V−4e were respectively 0.95 and 0.90. All these values for the weighted kappa indicate an excellent agreement.
Reliability
The intrarater ICC for isopter III−4e was 0.98 (95% CI 0.96 to 0.99) and 1.00 (95% CI 0.99 to 1.00) if the outlier was not included. The ICC’s for isopter V−4e were 0.99 (95% CI 0.98 to 0.99) for the intrarater reliability and 0.99 (95% CI 0.98 to 0.99) for the interrater reliability.
Discussion There are several ways to quantify the size of the visual field. Using a grid score is a frequently used technique. However, the literature is surprisingly sparse on the reliability of these grid scores. This study has shown that scoring visual fields and obtaining the FFS by using a grid appears to be a reliable method. The grid scores had high levels of both inter- and intrarater agreement and reliability.
Chapter 2
40
A
B
Figure 3: Scatterplots of intrarater and interrater FFS measurement difference plotted against measurement average. The solid line is the mean of the two observations. The region between the two dashed lines indicates the 95% limits of agreement for the differences. Intrarater differences are calculated as (scoring 1 – scoring 2) Intrarater mean is calculated as ((scoring 1 + scoring 2)/2). Interrater differences are calculated as (rater A – rater B) and interrater mean is calculated as ((rater A + rater B)/2).
(A) Intrarater scatterplot for isopter III−4e with outlier. (B) Intrarater scatterplot for isopter III−4e without outlier (C) interrater scatterplot of isopter III−4e. (D) Intrarater scatterplot of isopter V−4e. (E) Interrater scatterplot of isopter V−4e
Mean Intraobserver III-4e
0 20 40 60 80 100 120
Diff
eren
ce In
trao
bser
ver I
II-4e
-10
-5
0
5
10
Mean Intraobserver III-4e
0 20 40 60 80 100
Diff
eren
ce In
trao
bser
ver I
II-4e
-30
-20
-10
0
10
20
30
Intrarater and interrater agreement of the FFS
41
C
D E
Mean Interobserver III-4e
0 20 40 60 80 100
Diff
eren
ce In
tero
bser
ver I
II-4e
-20
-10
0
10
20
Mean Intraobserver V-4e
20 40 60 80 100 120
Diff
eren
ce In
trao
bser
ver V
-4e
-20
-10
0
10
20
Mean Interobserver V-4e
20 40 60 80 100 120
Diff
eren
ce In
tero
bser
ver V
-4e
-20
-10
0
10
20
Chapter 2
42
Except for the intrarater difference of isopter III−4e with outlier, all SDDs were smaller than the clinically important difference of 10 points. Thus, the minimally clinically important difference can be distinguished from measurement error. The method seems to be suitable for clinical practice and making policy decisions.
It might be that actually everyone expected and assumed the outcome of this study. This may be the reason that no research has been done on the agreement and reliability of the grid scoring method. However, before using the FFS and the FVS, it is important to be sure that these aspects of the measurement are suitable.
The reliability that this study examines only relates to the intra- and interrater agreement of scoring the grid for the FFS. It must be clear that it does not assess the reliability associated with repeated visual field testing. This may be important given that the visual field plots are subject to tiredness of the patient and to the technical skills of the perimetrist. The accuracy of visual field determination is subject to reliability by for example stimulus duration, time allowed for response, patient alertness, fatigue, fixation and testing strategy.13
It seems that a FFS of a Goldmann visual field with several isopters that also have irregular shapes and many not sharp limited scotomas is less reliable. For scoring purposes, it is not always clear if a point fells in or out of a scotoma.
Using a different scoring method might reduce this measurement error. The grid can be plotted on the Goldmann paper itself. This might reduce failures like shifting the grid on the paper or 180 degrees rotation so that inferior part of the visual field has the most important weight. Another method of improvement of the scoring method might be automatically counting by the computer.
After transforming the raw data into a classification, the intrarater and interrater agreements were good. The interrater agreement of isopter III−4e was excellent.
In our study, we used the Goldmann perimeter to measure the visual field. It is still the traditional method for evaluating visual field defects in patients with severe neurological impairments or severe vision loss.14 Patients find that the visual field test with the Goldmann perimeter is less tiring than with an automated perimeter for example the Humphrey Field Analyser.15 This is mostly due to fixation difficulties. The use of automated perimetry also requires a higher level of understanding and greater concentration of the patient, therefore limiting its use in neurologically impaired patients.14
Intrarater and interrater agreement of the FFS
43
Conclusion We concluded that both intra- and interrater agreement and reliability of the Functional Field Score proved to be sufficient. The validity of the Functional Field Score and the Functional Vision Score will need further investigation.
References 1. American Medical Association. (1993). Guides to the Evaluation of Permanent
Impairment. 1st ed, 1971; 2nd ed, 1984; 3rd ed, 1988; 3rd ed rev, 1990; 4th ed, 1993 ed. Chicago, Ill: American Medical Association.
2. Snell A and Sterling S. (1925). The percentage evaluation of macular vision. Archives of Ophthalmology. 54 443-461.
3. Cocchiarella L and Andersson G.(2001). The visual system. In: Andersson G, Cocchiarella L, eds. Guides to the evaluation of permanent impairment. 5th ed. Chicago, Ill: American Medical Association; 277-304.
4. Colenbrander A. (1999). Guide for the Evaluation of Visual Impairment. San Francisco: International Society for Low Vision Research and Rehabilitation.
5. Colenbrander A.(1994). The Functional Vision Score. In: Kooijman AC, ed. Low Vision research and new developments in rehabilitation. Amsterdam: IOC Press; 552-561.
6. Wassle H, Grunert U, Rohrenbeck J and Boycott BB. (1990). Retinal ganglion cell density and cortical magnification factor in the primate. Vision Research. 30 (11): 1897-1911.
7. Norden LC. (1989). Reliability in perimetry. Journal of the American Optometric Association. 60 (12): 880-890.
8. de Vet HCW.(1998). Observer reliability and agreement. In: Armitage P, Colton T, eds. Encyclopedia Biostatistica. Boston University, USA: John Wiley & Sons Ltd; 3123-3128.
9. Bland JM and Altman DG. (1986). Statistical methods for assessing agreement between two methods of clinical measurement. Lancet. 1 (8476): 307-310.
10. Landis JR and Koch GG. (1977). The measurement of observer agreement for categorical data. Biometrics. 33 (1): 159-174.
11. Shrout PE and Fleiss JL. (1979). Intraclass correlations: uses in assessing rater reliability. Psychological Bulletin. 86 420-428.
12. Scientific Advisory Committee of the Medical Outcome Trust. (2002). Assessing health status and quality-of-life instruments: attributes and review criteria. Quality of Life Research. 11 (3): 193-205.
13. Parrish RK, Schiffman J and Anderson DR. (1984). Static and kinetic visual field testing. Reproducibility in normal volunteers. Archives of Ophthalmology. 102 (10): 1497-1502.
Chapter 2
44
14. Szatmary G, Biousse V and Newman NJ. (2002). Can Swedish interactive thresholding algorithm fast perimetry be used as an alternative to goldmann perimetry in neuro-ophthalmic practice? Archives of Ophthalmology. 120 (9): 1162-1173.
15. Beck RW, Bergstrom TJ and Lichter PR. (1985). A clinical comparison of visual field testing with a new automated perimeter, the Humphrey Field Analyzer, and the Goldmann perimeter. Ophthalmology. 92 (1): 77-82.
33
FFuunnccttiioonnaall FFiieelldd SSccoorree:: tthhee eeffffeecctt ooff uussiinngg aa GGoollddmmaannnn VV−−44ee iissoopptteerr
iinnsstteeaadd ooff aa GGoollddmmaannnn IIIIII−−44ee iissoopptteerr
Maaike Langelaan, Bill Wouters, Annette C. Moll, Michiel R. de Boer, Ger H.M.B. van Rens
Investigative Ophthalmology and Visual Science 2006 47 (5): 1817-1823
Chapter 3
46
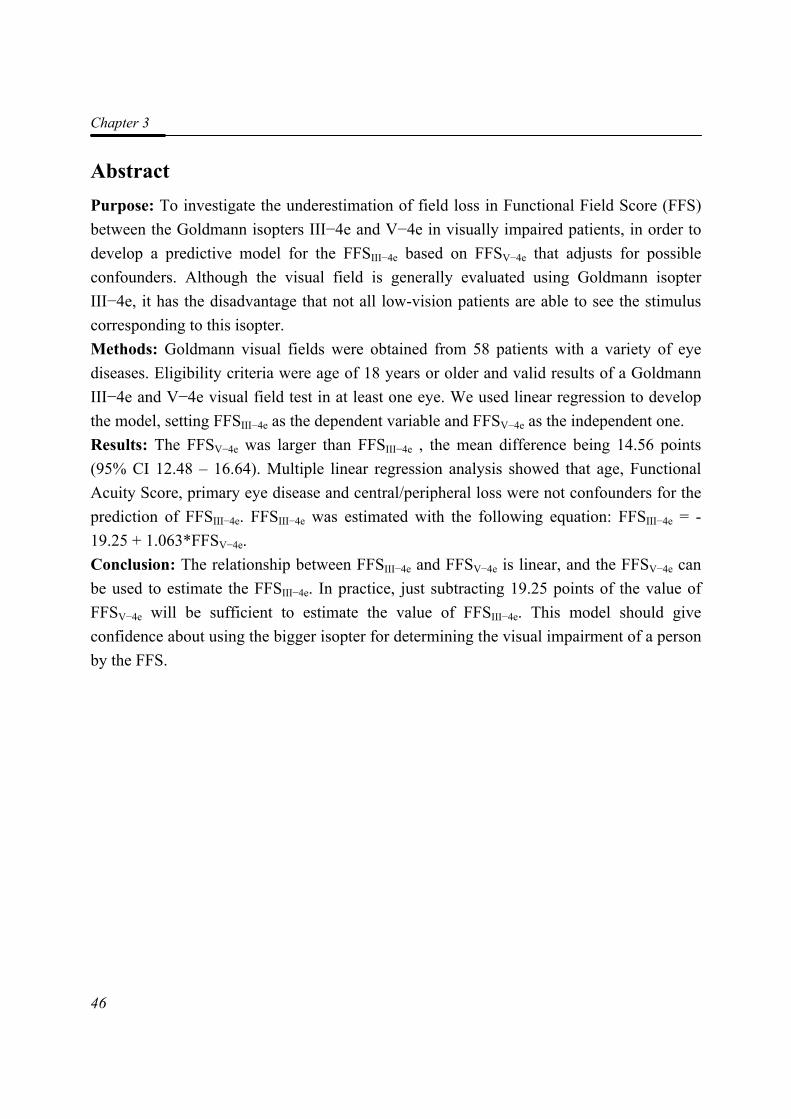
Abstract Purpose: To investigate the underestimation of field loss in Functional Field Score (FFS) between the Goldmann isopters III−4e and V−4e in visually impaired patients, in order to develop a predictive model for the FFSIII−4e based on FFSV−4e that adjusts for possible confounders. Although the visual field is generally evaluated using Goldmann isopter III−4e, it has the disadvantage that not all low-vision patients are able to see the stimulus corresponding to this isopter. Methods: Goldmann visual fields were obtained from 58 patients with a variety of eye diseases. Eligibility criteria were age of 18 years or older and valid results of a Goldmann III−4e and V−4e visual field test in at least one eye. We used linear regression to develop the model, setting FFSIII−4e as the dependent variable and FFSV−4e as the independent one. Results: The FFSV−4e was larger than FFSIII−4e , the mean difference being 14.56 points (95% CI 12.48 – 16.64). Multiple linear regression analysis showed that age, Functional Acuity Score, primary eye disease and central/peripheral loss were not confounders for the prediction of FFSIII−4e. FFSIII−4e was estimated with the following equation: FFSIII−4e = -19.25 + 1.063*FFSV−4e. Conclusion: The relationship between FFSIII−4e and FFSV−4e is linear, and the FFSV−4e can be used to estimate the FFSIII−4e. In practice, just subtracting 19.25 points of the value of FFSV−4e will be sufficient to estimate the value of FFSIII−4e. This model should give confidence about using the bigger isopter for determining the visual impairment of a person by the FFS.
FFS: Goldmann V−4e or III−4e
47
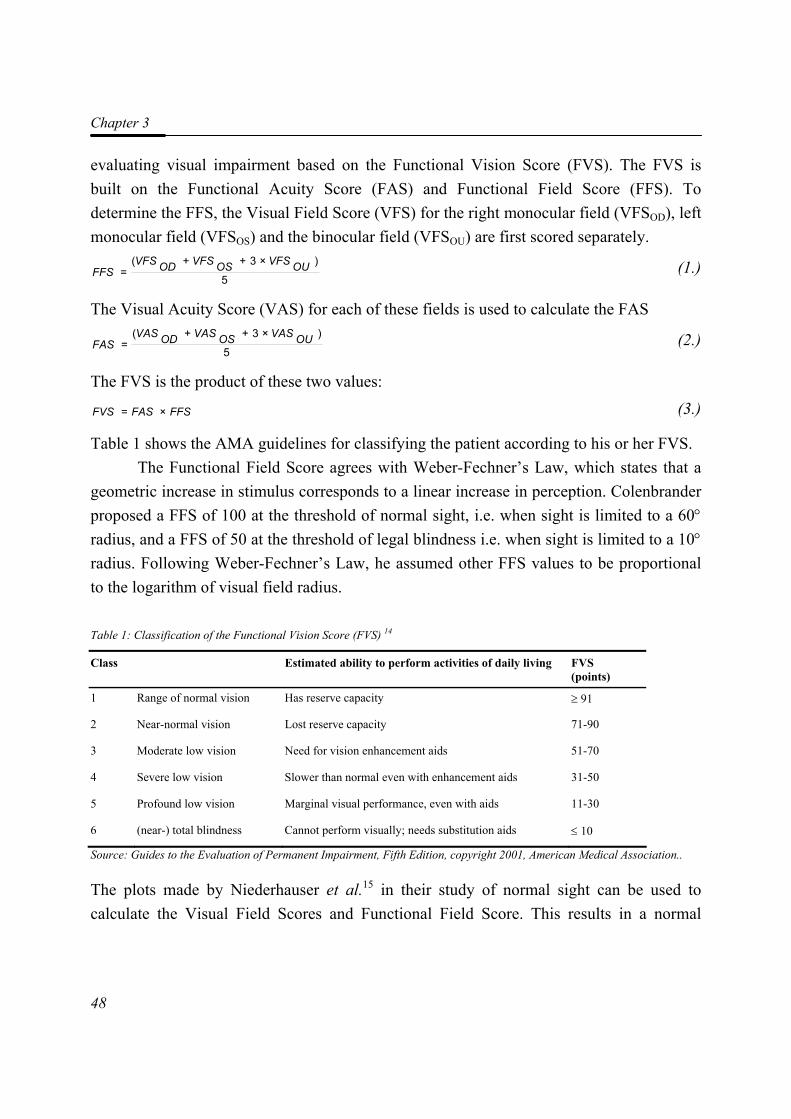
Introduction Visual functioning depends on the visual impairment of a person and can be expressed in terms of the activities of daily life. Loss of visual field is the next major cause of visual impairment after loss of visual acuity, and is thus one of the traditional measures of visual impairment. In the field of low-vision rehabilitation, the Goldmann visual field is the accepted ‘gold standard’ for recording the visual field.1 The isopter that is generally used to evaluate the visual field of the patient is the Goldmann isopter III−4e, and legal blindness currently requires a visual field defined in terms of the size of the isopter generated by a Goldmann III−4e stimulus.2;3 The Goldmann III−4e stimulus consists of a target of 4 mm2 with a luminance of 318 cd/m2 (1,000 apostilbs) projected onto a background luminance of 10 cd/m2 (31.5 apostilbs).
However, not all low-vision patients are able to see the stimulus which corresponds to this isopter, especially those whose visual capacity is severely limited or who are neurologically disabled.2;3 In such cases, the size V stimulus seems to be preferable.4 The Goldmann V−4e stimulus consists of a target of 64 mm2 with a luminance of 318 cd/m2. Compared to stimulus III−4e, this means a sixteen-fold increase in area of the stimulus, although the intensity of the stimulus is the same.
Only a few studies have been carried out to investigate the difference between the size of isopters III−4e and V−4e. Niederhauser et al.5 determined the normal position of isopters III−4e and V−4e in the peripheral visual field in healthy patients aged between 19 and 42 years old. However, they plotted the average position, which resulted in an underestimation of the field loss when the larger isopter was used, and therefore a possible overestimation of the patient’s functional vision.6
Although the area of the visual field depends primarily on the size and intensity of the stimulus, it is influenced by many factors, such as age,7 visual acuity,8 pupil size,9 the interference of eyelid and nose, cooperation,10 interaction with the examiner and level of education of the patient.11 However, there seems to be no evidence for factors that could cause the difference between the visual field areas resulting from a change in the size of the stimulus. We hypothesize that age, primary eye disease, central or peripheral field loss and visual acuity might affect the difference between the visual field areas of the two isopters.
Until recently, there was no uniform disability classification for visual impairments. In order to rectify this, the American Medical Association (AMA) published guidelines in the Guides to the Evaluation of Permanent Impairment.12;13 One part consists of guidelines for
Chapter 3
48
evaluating visual impairment based on the Functional Vision Score (FVS). The FVS is built on the Functional Acuity Score (FAS) and Functional Field Score (FFS). To determine the FFS, the Visual Field Score (VFS) for the right monocular field (VFSOD), left monocular field (VFSOS) and the binocular field (VFSOU) are first scored separately.
5
)×3++(= OUVFSOSVFSODVFS
FFS (1.)
The Visual Acuity Score (VAS) for each of these fields is used to calculate the FAS
5
)×3++(= OUVASOSVASODVAS
FAS (2.)
The FVS is the product of these two values:
FFSFASFVS ×= (3.)
Table 1 shows the AMA guidelines for classifying the patient according to his or her FVS. The Functional Field Score agrees with Weber-Fechner’s Law, which states that a
geometric increase in stimulus corresponds to a linear increase in perception. Colenbrander proposed a FFS of 100 at the threshold of normal sight, i.e. when sight is limited to a 60° radius, and a FFS of 50 at the threshold of legal blindness i.e. when sight is limited to a 10° radius. Following Weber-Fechner’s Law, he assumed other FFS values to be proportional to the logarithm of visual field radius.
Table 1: Classification of the Functional Vision Score (FVS) 14
Class Estimated ability to perform activities of daily living FVS (points)
1 Range of normal vision Has reserve capacity ≥ 91
2 Near-normal vision Lost reserve capacity 71-90
3 Moderate low vision Need for vision enhancement aids 51-70
4 Severe low vision Slower than normal even with enhancement aids 31-50
5 Profound low vision Marginal visual performance, even with aids 11-30
6 (near-) total blindness Cannot perform visually; needs substitution aids ≤ 10
Source: Guides to the Evaluation of Permanent Impairment, Fifth Edition, copyright 2001, American Medical Association..
The plots made by Niederhauser et al.15 in their study of normal sight can be used to calculate the Visual Field Scores and Functional Field Score. This results in a normal
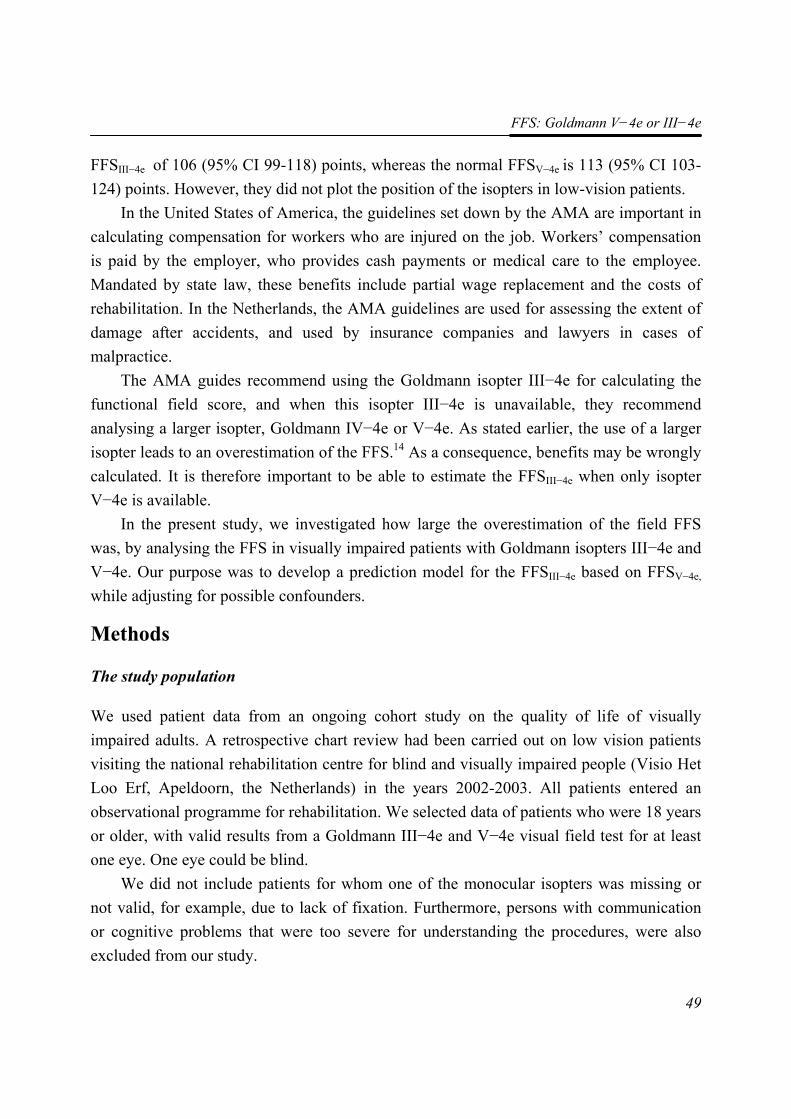
FFS: Goldmann V−4e or III−4e
49
FFSIII−4e of 106 (95% CI 99-118) points, whereas the normal FFSV−4e is 113 (95% CI 103-124) points. However, they did not plot the position of the isopters in low-vision patients.
In the United States of America, the guidelines set down by the AMA are important in calculating compensation for workers who are injured on the job. Workers’ compensation is paid by the employer, who provides cash payments or medical care to the employee. Mandated by state law, these benefits include partial wage replacement and the costs of rehabilitation. In the Netherlands, the AMA guidelines are used for assessing the extent of damage after accidents, and used by insurance companies and lawyers in cases of malpractice.
The AMA guides recommend using the Goldmann isopter III−4e for calculating the functional field score, and when this isopter III−4e is unavailable, they recommend analysing a larger isopter, Goldmann IV−4e or V−4e. As stated earlier, the use of a larger isopter leads to an overestimation of the FFS.14 As a consequence, benefits may be wrongly calculated. It is therefore important to be able to estimate the FFSIII−4e when only isopter V−4e is available.
In the present study, we investigated how large the overestimation of the field FFS was, by analysing the FFS in visually impaired patients with Goldmann isopters III−4e and V−4e. Our purpose was to develop a prediction model for the FFSIII−4e based on FFSV−4e, while adjusting for possible confounders.
Methods
The study population
We used patient data from an ongoing cohort study on the quality of life of visually impaired adults. A retrospective chart review had been carried out on low vision patients visiting the national rehabilitation centre for blind and visually impaired people (Visio Het Loo Erf, Apeldoorn, the Netherlands) in the years 2002-2003. All patients entered an observational programme for rehabilitation. We selected data of patients who were 18 years or older, with valid results from a Goldmann III−4e and V−4e visual field test for at least one eye. One eye could be blind.
We did not include patients for whom one of the monocular isopters was missing or not valid, for example, due to lack of fixation. Furthermore, persons with communication or cognitive problems that were too severe for understanding the procedures, were also excluded from our study.
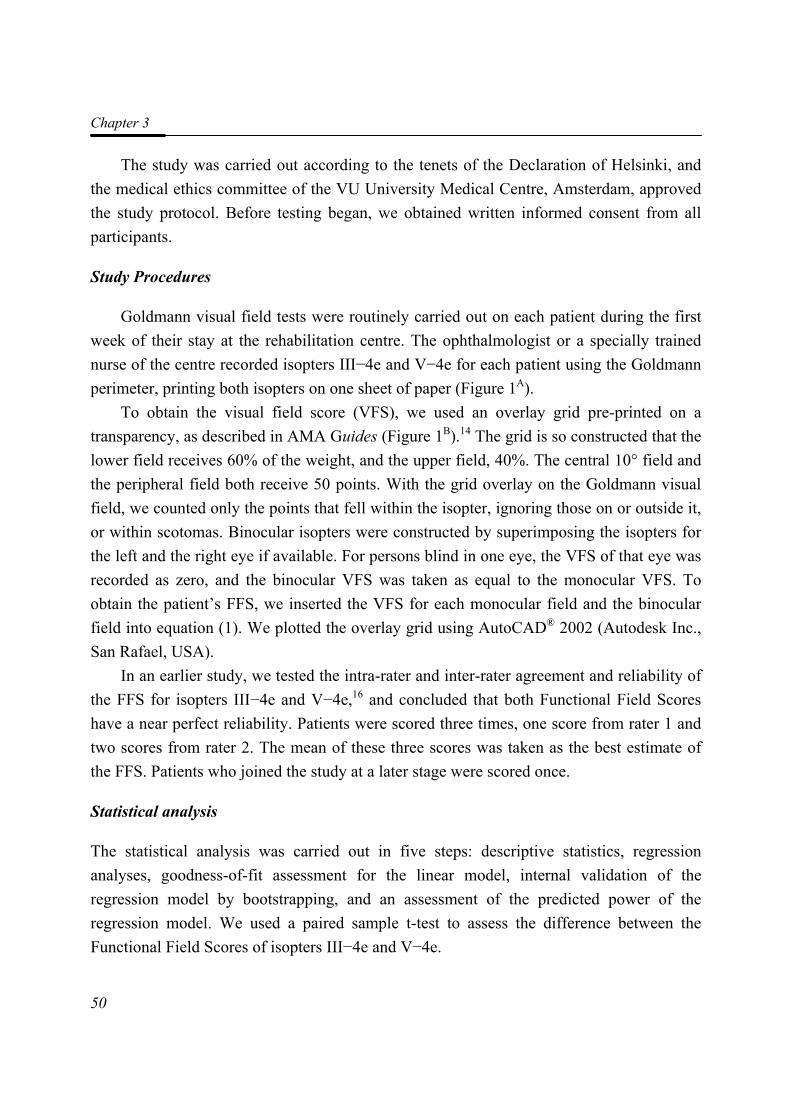
Chapter 3
50
The study was carried out according to the tenets of the Declaration of Helsinki, and the medical ethics committee of the VU University Medical Centre, Amsterdam, approved the study protocol. Before testing began, we obtained written informed consent from all participants.
Study Procedures
Goldmann visual field tests were routinely carried out on each patient during the first week of their stay at the rehabilitation centre. The ophthalmologist or a specially trained nurse of the centre recorded isopters III−4e and V−4e for each patient using the Goldmann perimeter, printing both isopters on one sheet of paper (Figure 1A).
To obtain the visual field score (VFS), we used an overlay grid pre-printed on a transparency, as described in AMA Guides (Figure 1B).14 The grid is so constructed that the lower field receives 60% of the weight, and the upper field, 40%. The central 10° field and the peripheral field both receive 50 points. With the grid overlay on the Goldmann visual field, we counted only the points that fell within the isopter, ignoring those on or outside it, or within scotomas. Binocular isopters were constructed by superimposing the isopters for the left and the right eye if available. For persons blind in one eye, the VFS of that eye was recorded as zero, and the binocular VFS was taken as equal to the monocular VFS. To obtain the patient’s FFS, we inserted the VFS for each monocular field and the binocular field into equation (1). We plotted the overlay grid using AutoCAD® 2002 (Autodesk Inc., San Rafael, USA).
In an earlier study, we tested the intra-rater and inter-rater agreement and reliability of the FFS for isopters III−4e and V−4e,16 and concluded that both Functional Field Scores have a near perfect reliability. Patients were scored three times, one score from rater 1 and two scores from rater 2. The mean of these three scores was taken as the best estimate of the FFS. Patients who joined the study at a later stage were scored once.
Statistical analysis
The statistical analysis was carried out in five steps: descriptive statistics, regression analyses, goodness-of-fit assessment for the linear model, internal validation of the regression model by bootstrapping, and an assessment of the predicted power of the regression model. We used a paired sample t-test to assess the difference between the Functional Field Scores of isopters III−4e and V−4e.
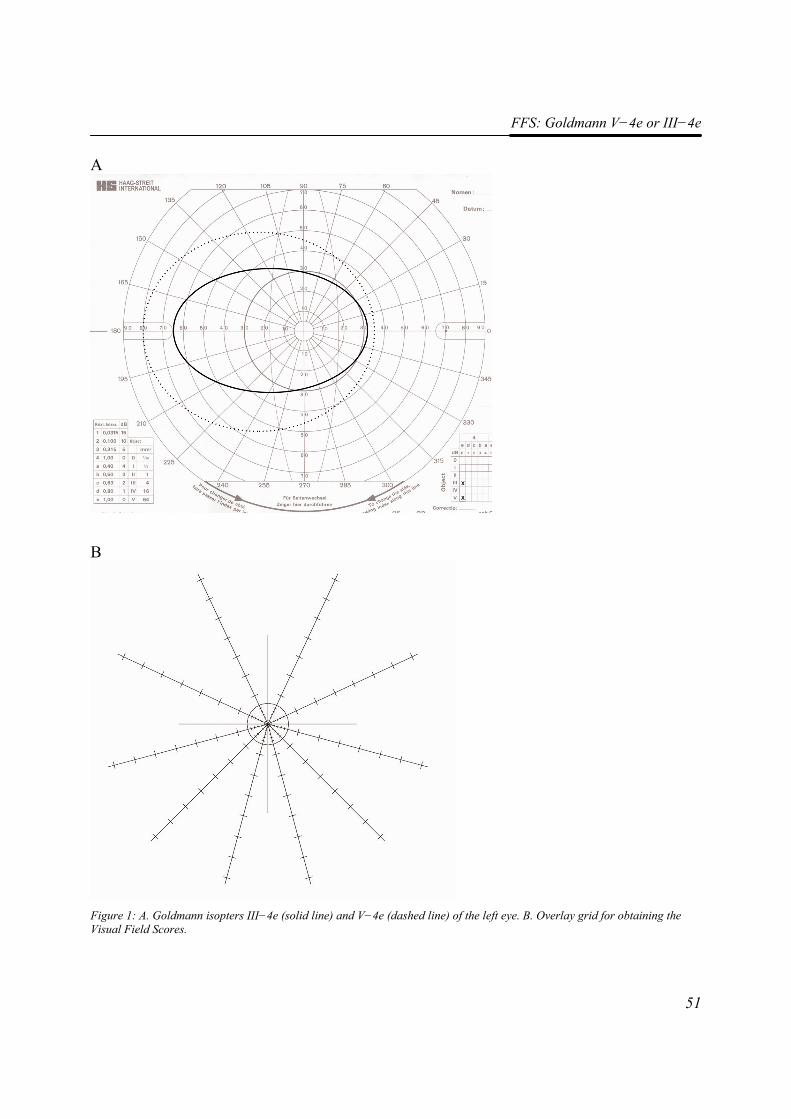
FFS: Goldmann V−4e or III−4e
51
A
B
Figure 1: A. Goldmann isopters III−4e (solid line) and V−4e (dashed line) of the left eye. B. Overlay grid for obtaining the Visual Field Scores.
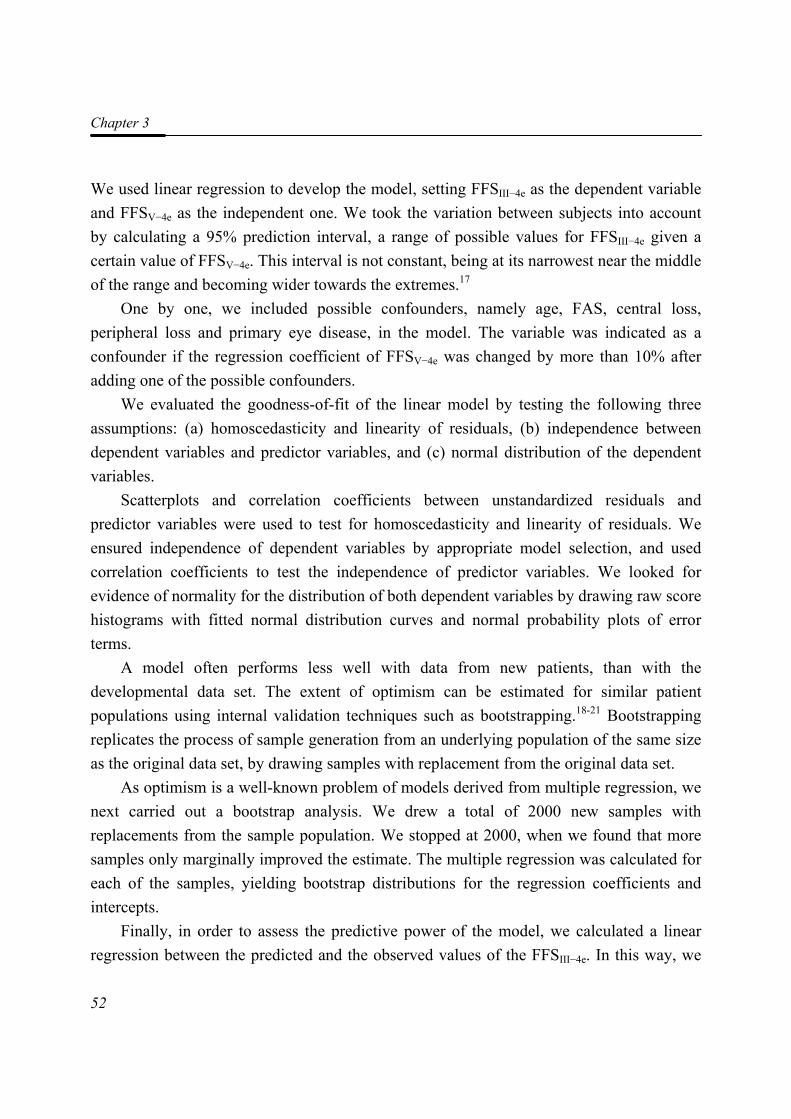
Chapter 3
52
We used linear regression to develop the model, setting FFSIII−4e as the dependent variable and FFSV−4e as the independent one. We took the variation between subjects into account by calculating a 95% prediction interval, a range of possible values for FFSIII−4e given a certain value of FFSV−4e. This interval is not constant, being at its narrowest near the middle of the range and becoming wider towards the extremes.17
One by one, we included possible confounders, namely age, FAS, central loss, peripheral loss and primary eye disease, in the model. The variable was indicated as a confounder if the regression coefficient of FFSV−4e was changed by more than 10% after adding one of the possible confounders.
We evaluated the goodness-of-fit of the linear model by testing the following three assumptions: (a) homoscedasticity and linearity of residuals, (b) independence between dependent variables and predictor variables, and (c) normal distribution of the dependent variables.
Scatterplots and correlation coefficients between unstandardized residuals and predictor variables were used to test for homoscedasticity and linearity of residuals. We ensured independence of dependent variables by appropriate model selection, and used correlation coefficients to test the independence of predictor variables. We looked for evidence of normality for the distribution of both dependent variables by drawing raw score histograms with fitted normal distribution curves and normal probability plots of error terms.
A model often performs less well with data from new patients, than with the developmental data set. The extent of optimism can be estimated for similar patient populations using internal validation techniques such as bootstrapping.18-21 Bootstrapping replicates the process of sample generation from an underlying population of the same size as the original data set, by drawing samples with replacement from the original data set.
As optimism is a well-known problem of models derived from multiple regression, we next carried out a bootstrap analysis. We drew a total of 2000 new samples with replacements from the sample population. We stopped at 2000, when we found that more samples only marginally improved the estimate. The multiple regression was calculated for each of the samples, yielding bootstrap distributions for the regression coefficients and intercepts.
Finally, in order to assess the predictive power of the model, we calculated a linear regression between the predicted and the observed values of the FFSIII−4e. In this way, we
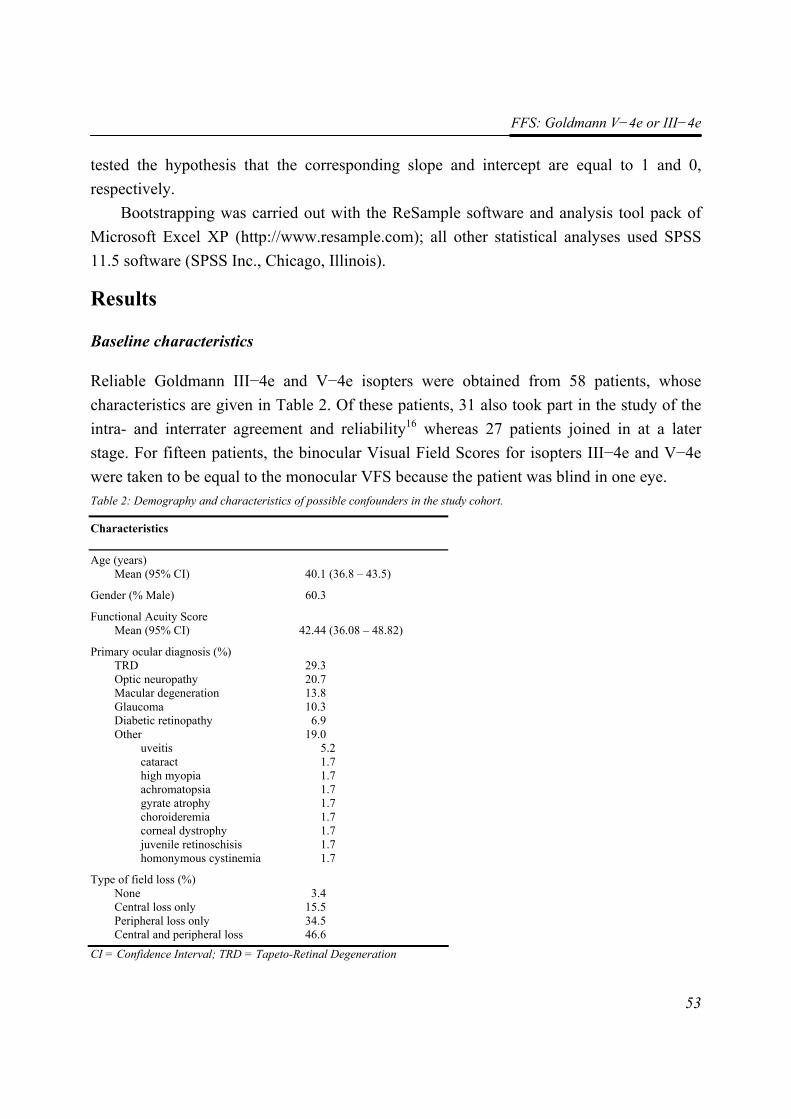
FFS: Goldmann V−4e or III−4e
53
tested the hypothesis that the corresponding slope and intercept are equal to 1 and 0, respectively.
Bootstrapping was carried out with the ReSample software and analysis tool pack of Microsoft Excel XP (http://www.resample.com); all other statistical analyses used SPSS 11.5 software (SPSS Inc., Chicago, Illinois).
Results
Baseline characteristics
Reliable Goldmann III−4e and V−4e isopters were obtained from 58 patients, whose characteristics are given in Table 2. Of these patients, 31 also took part in the study of the intra- and interrater agreement and reliability16 whereas 27 patients joined in at a later stage. For fifteen patients, the binocular Visual Field Scores for isopters III−4e and V−4e were taken to be equal to the monocular VFS because the patient was blind in one eye. Table 2: Demography and characteristics of possible confounders in the study cohort.
Characteristics
Age (years) Mean (95% CI)
40.1 (36.8 – 43.5)
Gender (% Male) 60.3
Functional Acuity Score Mean (95% CI)
42.44 (36.08 – 48.82)
Primary ocular diagnosis (%) TRD Optic neuropathy Macular degeneration Glaucoma Diabetic retinopathy Other uveitis cataract high myopia achromatopsia gyrate atrophy choroideremia corneal dystrophy juvenile retinoschisis homonymous cystinemia
29.3 20.7 13.8 10.3 6.9 19.0 5.2 1.7 1.7 1.7 1.7 1.7 1.7 1.7 1.7
Type of field loss (%) None Central loss only Peripheral loss only Central and peripheral loss
3.4 15.5 34.5 46.6
CI = Confidence Interval; TRD = Tapeto-Retinal Degeneration
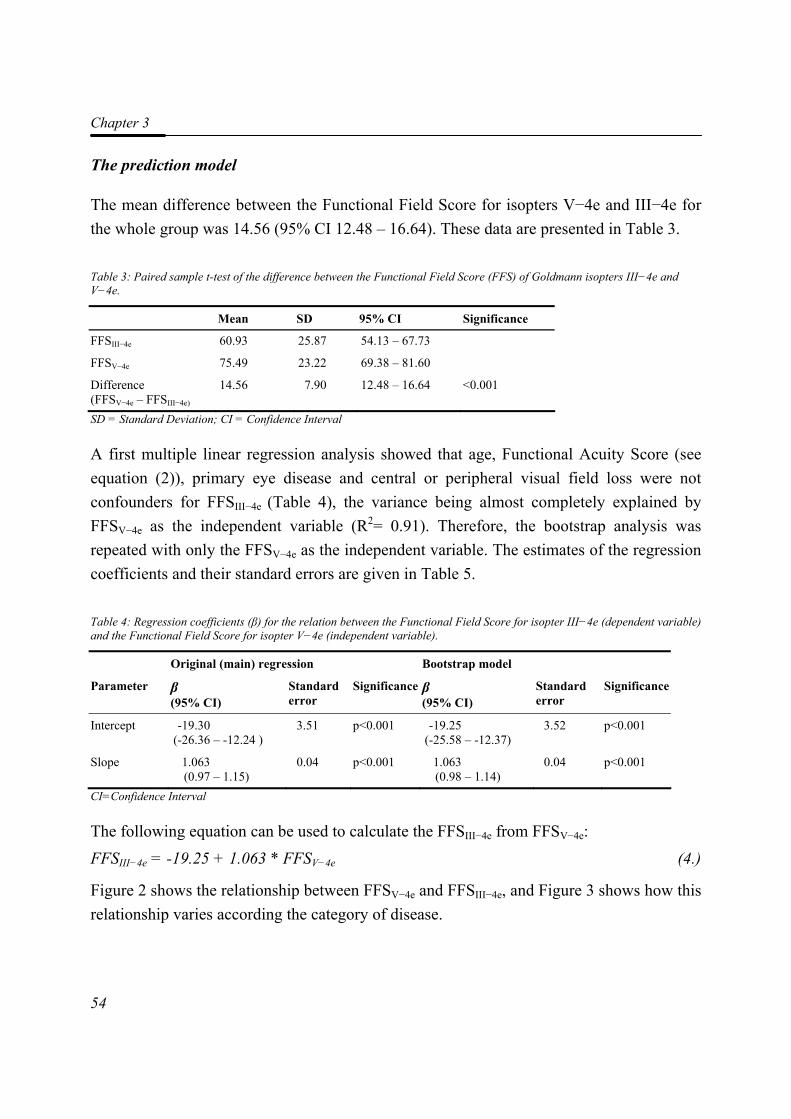
Chapter 3
54
The prediction model
The mean difference between the Functional Field Score for isopters V−4e and III−4e for the whole group was 14.56 (95% CI 12.48 – 16.64). These data are presented in Table 3. Table 3: Paired sample t-test of the difference between the Functional Field Score (FFS) of Goldmann isopters III−4e and V−4e.
Mean SD 95% CI Significance
FFSIII−4e 60.93 25.87 54.13 – 67.73
FFSV−4e 75.49 23.22 69.38 – 81.60
Difference (FFSV−4e – FFSIII−4e)
14.56 7.90 12.48 – 16.64 <0.001
SD = Standard Deviation; CI = Confidence Interval
A first multiple linear regression analysis showed that age, Functional Acuity Score (see equation (2)), primary eye disease and central or peripheral visual field loss were not confounders for FFSIII−4e (Table 4), the variance being almost completely explained by FFSV−4e as the independent variable (R2= 0.91). Therefore, the bootstrap analysis was repeated with only the FFSV−4e as the independent variable. The estimates of the regression coefficients and their standard errors are given in Table 5.
Table 4: Regression coefficients (β) for the relation between the Functional Field Score for isopter III−4e (dependent variable) and the Functional Field Score for isopter V−4e (independent variable).
Original (main) regression Bootstrap model
Parameter β (95% CI)
Standard error
Significance β (95% CI)
Standard error
Significance
Intercept -19.30 (-26.36 – -12.24 )
3.51 p<0.001 -19.25 (-25.58 – -12.37)
3.52 p<0.001
Slope 1.063 (0.97 – 1.15)
0.04 p<0.001 1.063 (0.98 – 1.14)
0.04 p<0.001
CI=Confidence Interval
The following equation can be used to calculate the FFSIII−4e from FFSV−4e: FFSIII−4e = -19.25 + 1.063 * FFSV−4e (4.)
Figure 2 shows the relationship between FFSV−4e and FFSIII−4e, and Figure 3 shows how this relationship varies according the category of disease.
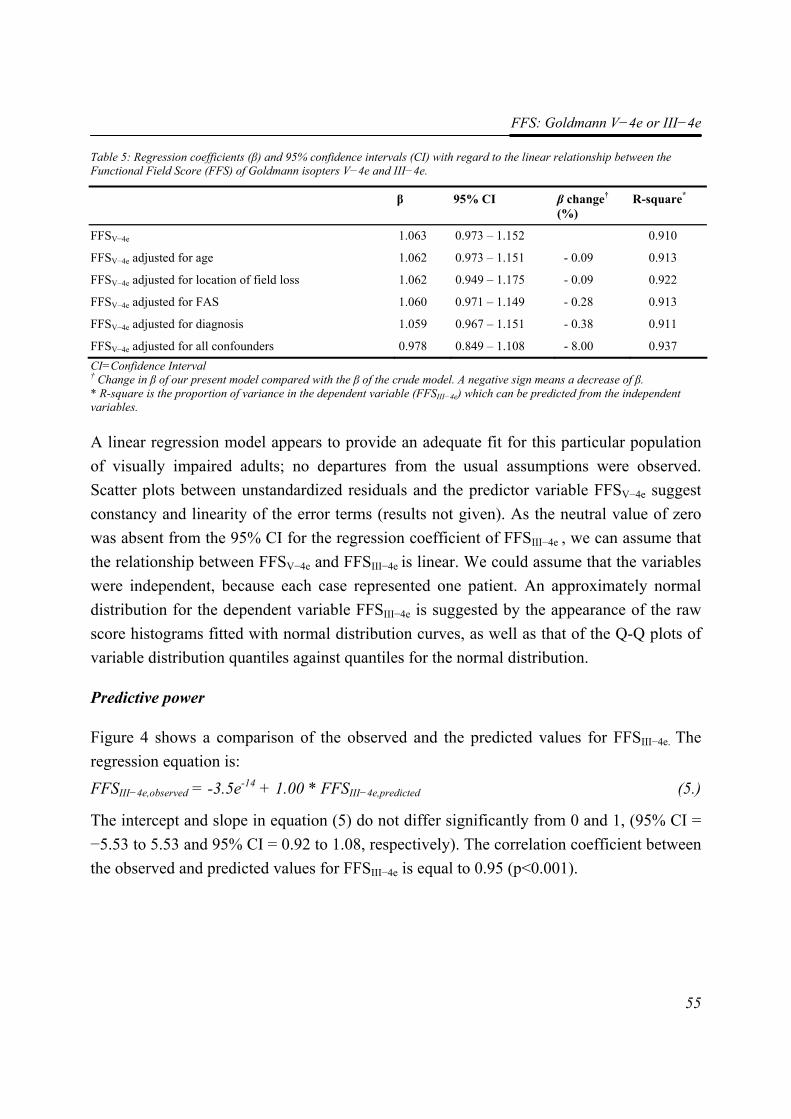
FFS: Goldmann V−4e or III−4e
55
Table 5: Regression coefficients (β) and 95% confidence intervals (CI) with regard to the linear relationship between the Functional Field Score (FFS) of Goldmann isopters V−4e and III−4e.
β 95% CI β change† (%)
R-square*
FFSV−4e 1.063 0.973 – 1.152 0.910
FFSV−4e adjusted for age 1.062 0.973 – 1.151 - 0.09 0.913
FFSV−4e adjusted for location of field loss 1.062 0.949 – 1.175 - 0.09 0.922
FFSV−4e adjusted for FAS 1.060 0.971 – 1.149 - 0.28 0.913
FFSV−4e adjusted for diagnosis 1.059 0.967 – 1.151 - 0.38 0.911
FFSV−4e adjusted for all confounders 0.978 0.849 – 1.108 - 8.00 0.937 CI=Confidence Interval † Change in β of our present model compared with the β of the crude model. A negative sign means a decrease of β. * R-square is the proportion of variance in the dependent variable (FFSIII−4e) which can be predicted from the independent variables.
A linear regression model appears to provide an adequate fit for this particular population of visually impaired adults; no departures from the usual assumptions were observed. Scatter plots between unstandardized residuals and the predictor variable FFSV−4e suggest constancy and linearity of the error terms (results not given). As the neutral value of zero was absent from the 95% CI for the regression coefficient of FFSIII−4e , we can assume that the relationship between FFSV−4e and FFSIII−4e is linear. We could assume that the variables were independent, because each case represented one patient. An approximately normal distribution for the dependent variable FFSIII−4e is suggested by the appearance of the raw score histograms fitted with normal distribution curves, as well as that of the Q-Q plots of variable distribution quantiles against quantiles for the normal distribution.
Predictive power
Figure 4 shows a comparison of the observed and the predicted values for FFSIII−4e. The regression equation is: FFSIII−4e,observed = -3.5e-14 + 1.00 * FFSIII−4e,predicted (5.)
The intercept and slope in equation (5) do not differ significantly from 0 and 1, (95% CI = −5.53 to 5.53 and 95% CI = 0.92 to 1.08, respectively). The correlation coefficient between the observed and predicted values for FFSIII−4e is equal to 0.95 (p<0.001).
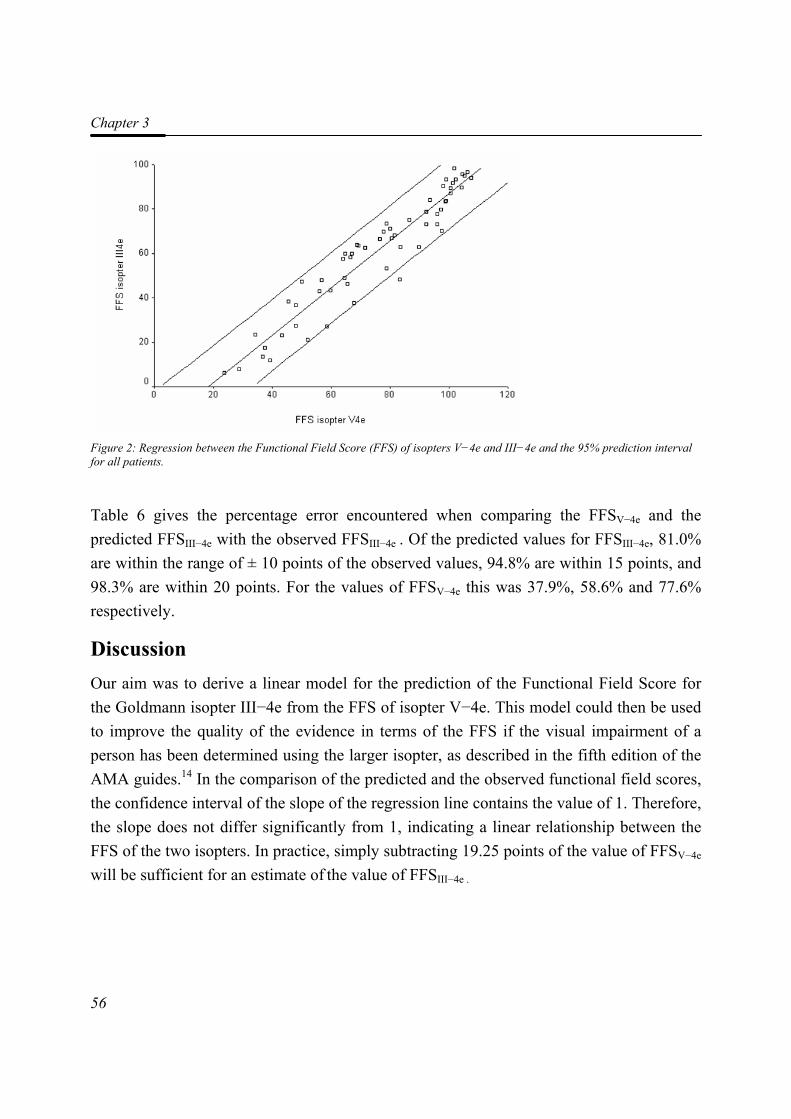
Chapter 3
56
Figure 2: Regression between the Functional Field Score (FFS) of isopters V−4e and III−4e and the 95% prediction interval for all patients.
Table 6 gives the percentage error encountered when comparing the FFSV−4e and the predicted FFSIII−4e with the observed FFSIII−4e . Of the predicted values for FFSIII−4e, 81.0% are within the range of ± 10 points of the observed values, 94.8% are within 15 points, and 98.3% are within 20 points. For the values of FFSV−4e this was 37.9%, 58.6% and 77.6% respectively.
Discussion Our aim was to derive a linear model for the prediction of the Functional Field Score for the Goldmann isopter III−4e from the FFS of isopter V−4e. This model could then be used to improve the quality of the evidence in terms of the FFS if the visual impairment of a person has been determined using the larger isopter, as described in the fifth edition of the AMA guides.14 In the comparison of the predicted and the observed functional field scores, the confidence interval of the slope of the regression line contains the value of 1. Therefore, the slope does not differ significantly from 1, indicating a linear relationship between the FFS of the two isopters. In practice, simply subtracting 19.25 points of the value of FFSV−4e will be sufficient for an estimate of the value of FFSIII−4e .
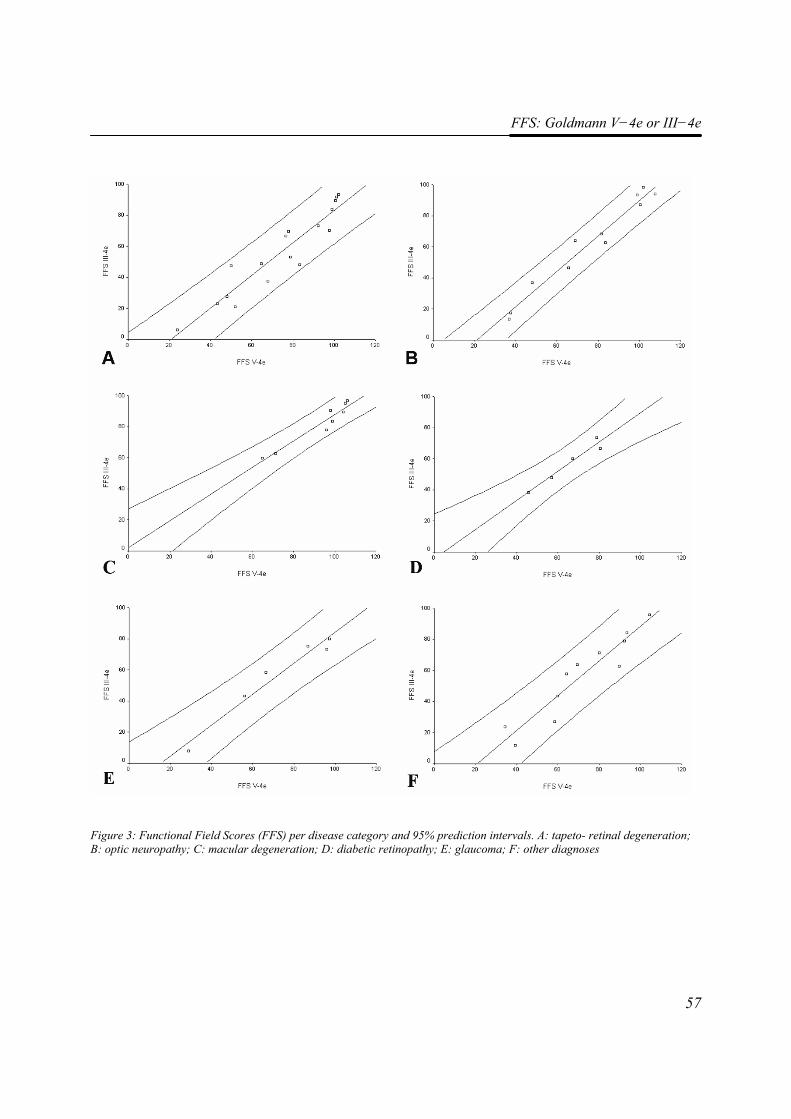
FFS: Goldmann V−4e or III−4e
57
Figure 3: Functional Field Scores (FFS) per disease category and 95% prediction intervals. A: tapeto- retinal degeneration; B: optic neuropathy; C: macular degeneration; D: diabetic retinopathy; E: glaucoma; F: other diagnoses
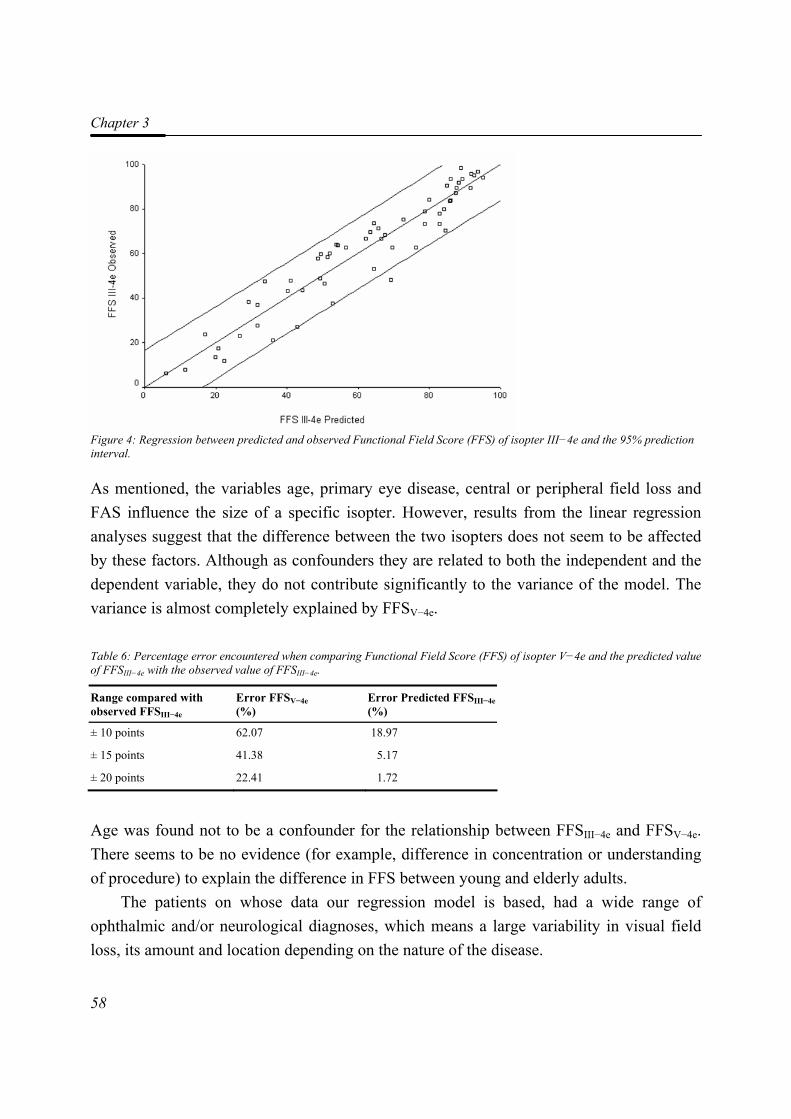
Chapter 3
58
Figure 4: Regression between predicted and observed Functional Field Score (FFS) of isopter III−4e and the 95% prediction interval.
As mentioned, the variables age, primary eye disease, central or peripheral field loss and FAS influence the size of a specific isopter. However, results from the linear regression analyses suggest that the difference between the two isopters does not seem to be affected by these factors. Although as confounders they are related to both the independent and the dependent variable, they do not contribute significantly to the variance of the model. The variance is almost completely explained by FFSV−4e. Table 6: Percentage error encountered when comparing Functional Field Score (FFS) of isopter V−4e and the predicted value of FFSIII−4e with the observed value of FFSIII−4e.
Range compared with observed FFSIII−4e
Error FFSV−4e (%)
Error Predicted FFSIII−4e(%)
± 10 points 62.07 18.97
± 15 points 41.38 5.17
± 20 points 22.41 1.72
Age was found not to be a confounder for the relationship between FFSIII−4e and FFSV−4e. There seems to be no evidence (for example, difference in concentration or understanding of procedure) to explain the difference in FFS between young and elderly adults.
The patients on whose data our regression model is based, had a wide range of ophthalmic and/or neurological diagnoses, which means a large variability in visual field loss, its amount and location depending on the nature of the disease.
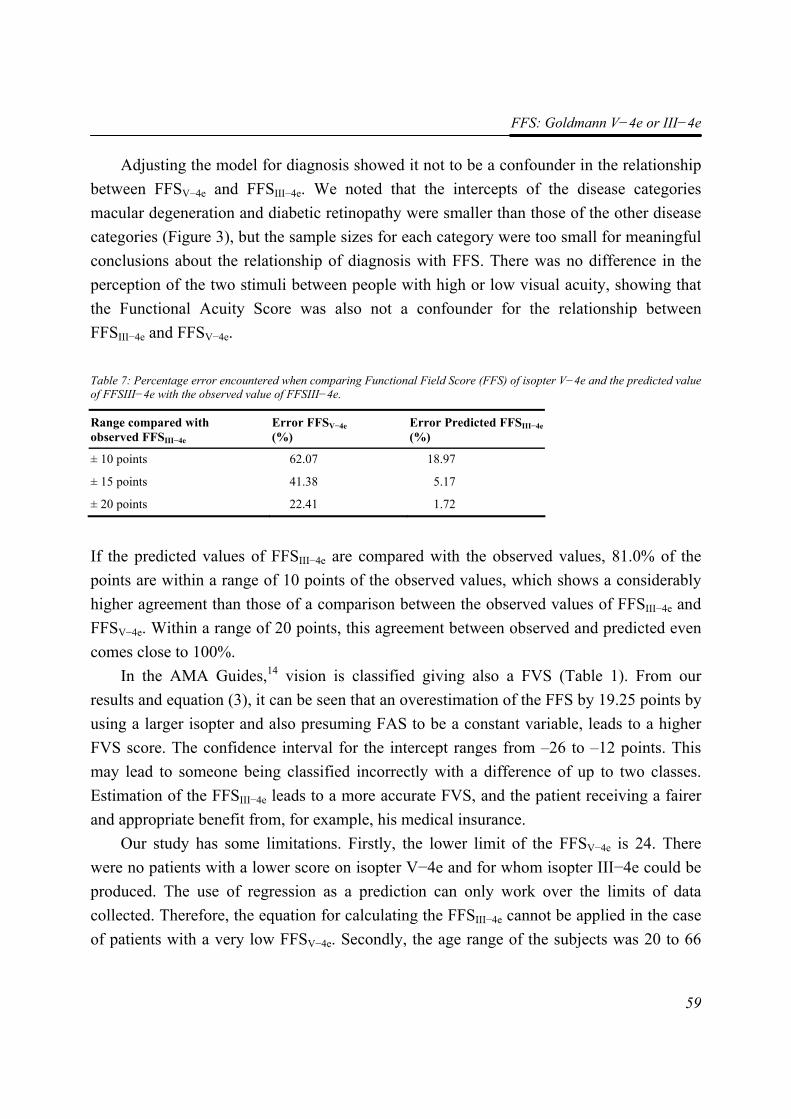
FFS: Goldmann V−4e or III−4e
59
Adjusting the model for diagnosis showed it not to be a confounder in the relationship between FFSV−4e and FFSIII−4e. We noted that the intercepts of the disease categories macular degeneration and diabetic retinopathy were smaller than those of the other disease categories (Figure 3), but the sample sizes for each category were too small for meaningful conclusions about the relationship of diagnosis with FFS. There was no difference in the perception of the two stimuli between people with high or low visual acuity, showing that the Functional Acuity Score was also not a confounder for the relationship between FFSIII−4e and FFSV−4e. Table 7: Percentage error encountered when comparing Functional Field Score (FFS) of isopter V−4e and the predicted value of FFSIII−4e with the observed value of FFSIII−4e.
Range compared with observed FFSIII−4e
Error FFSV−4e (%)
Error Predicted FFSIII−4e(%)
± 10 points 62.07 18.97
± 15 points 41.38 5.17
± 20 points 22.41 1.72
If the predicted values of FFSIII−4e are compared with the observed values, 81.0% of the points are within a range of 10 points of the observed values, which shows a considerably higher agreement than those of a comparison between the observed values of FFSIII−4e and FFSV−4e. Within a range of 20 points, this agreement between observed and predicted even comes close to 100%.
In the AMA Guides,14 vision is classified giving also a FVS (Table 1). From our results and equation (3), it can be seen that an overestimation of the FFS by 19.25 points by using a larger isopter and also presuming FAS to be a constant variable, leads to a higher FVS score. The confidence interval for the intercept ranges from –26 to –12 points. This may lead to someone being classified incorrectly with a difference of up to two classes. Estimation of the FFSIII−4e leads to a more accurate FVS, and the patient receiving a fairer and appropriate benefit from, for example, his medical insurance.
Our study has some limitations. Firstly, the lower limit of the FFSV−4e is 24. There were no patients with a lower score on isopter V−4e and for whom isopter III−4e could be produced. The use of regression as a prediction can only work over the limits of data collected. Therefore, the equation for calculating the FFSIII−4e cannot be applied in the case of patients with a very low FFSV−4e. Secondly, the age range of the subjects was 20 to 66
Chapter 3
60
years, and thus the model is only valid for this age category. Whether the model can be extended to children or elderly people remains to be investigated. Thirdly, the number of participants in the analyses was relatively small, the confidence interval for the estimation of the intercept ranging between –26 and –12 points. Although it is clear from our study that there is a marked difference between FFSV−4e and FFSIII−4e of at least 12 and maximally 26 points, studies with large sample sizes are needed for more precise estimates. We used bootstrap analysis to evaluate the model’s performance for the same patients returning for further treatment. However, this was an internal procedure. As the goal of this study was to develop a general model, the model needs to be evaluated on new data from a population of patients who in age, number and visual impairment differ from the original.22
In conclusion, we found the relationship between Functional Field Score of isopter III−4e and isopter V−4e to be linear. The Functional Field Score of isopter V−4e can be used to estimate the Functional Field Score of isopter III−4e by subtracting 19.25 points from the FFS of isopter V−4e. This estimation should only be used if it is not possible to plot isopter III−4e.
References 1. Bass SJ and Sherman J.(1996). Visual field testing in the low vision patient. In: Rosenthal
BP, Cole RG, eds. Functional Assessment of Low Vision. St. Louis, Mosby: 89-104.
2. Choplin NT, Sherwood MB and Spaeth GL. (1990). The effect of stimulus size on the measured threshold values in automated perimetry. Ophthalmology. 97 (3): 371-374.
3. Szatmary G, Biousse V and Newman NJ. (2002). Can Swedish interactive thresholding algorithm fast perimetry be used as an alternative to goldmann perimetry in neuro-ophthalmic practice? Archives of Ophthalmology. 120 (9): 1162-1173.
4. Wall M, Kutzko KE and Chauhan BC. (1997). Variability in patients with glaucomatous visual field damage is reduced using size V stimuli. Investigative Ophthalmology and Visual Science. 38 (2): 426-435.
5. Niederhauser S and Mojon DS. (2002). Normal isopter position in the peripheral visual field in Goldmann kinetic perimetry. Ophthalmologica. 216 (6): 406-408.
6. Wilensky JT, Mermelstein JR and Siegel HG. (1986). The use of different-sized stimuli in automated perimetry. American Journal of Ophthalmology. 101 (6): 710-713.
7. Hart WM, Jr. and Becker B. (1977). Visual field changes in ocular hypertension. A computer-based analysis. Archives of Ophthalmology. 95 (7): 1176-1179.
8. Madreperla SA, Palmer RW, Massof RW and Finkelstein D. (1990). Visual acuity loss in retinitis pigmentosa. Relationship to visual field loss. Archives of Ophthalmology. 108 (3): 358-361.
FFS: Goldmann V−4e or III−4e
61
9. Kudrna GR, Stanley MA and Remington LA. (1995). Pupillary dilation and its effects on automated perimetry results. Journal of the American Optometric Association. 66 (11): 675-680.
10. Graf M. (1997). [Visual field examination in limited patient cooperation]. Klinische Monatsblatter fur Augenheilkunde. 211 (5): 277-285.
11. Flammer J and Niesel P. (1984). [Reproducibility of perimetric study results]. Klinische Monatsblatter fur Augenheilkunde. 184 (5): 374-376.
12. American Medical Association. (1993). Guides to the Evaluation of Permanent Impairment. 1st ed, 1971; 2nd ed, 1984; 3rd ed, 1988; 3rd ed rev, 1990; 4th ed, 1993 ed. Chicago, Ill: American Medical Association.
13. American Medical Association. (2002). Guides to the Evaluation of Permanent Impairment. 5th ed. Chicago, Ill: American Medical Association.
14. Cocchiarella L and Andersson G.(2001). The visual system. In: Andersson G, Cocchiarella L, eds. Guides to the evaluation of permanent impairment. 5th ed. Chicago, Ill: American Medical Association; 277-304.
15. Niederhauser S and Mojon DS. (2002). Normal isopter position in the peripheral visual field in Goldmann kinetic perimetry. Ophthalmologica. 216 (6): 406-408.
16. Langelaan M, Wouters B, Moll AC, de Boer MR and van Rens GHMB. (2005). Intra- and interrater agreement and reliability of the Functional Field Score. Ophthalmic and Physiological Optics. 25 (2): 136-142.
17. Altman DG. (1991). Practical Statistics for Medical Research. first edition ed. London: Chapman & Hall.
18. Steyerberg EW, Harrell FE, Jr., Borsboom GJ, Eijkemans MJ, Vergouwe Y and Habbema JD. (2001). Internal validation of predictive models: efficiency of some procedures for logistic regression analysis. Journal of Clinical Epidemiology. 54 (8): 774-781.
19. Efron B and Tibshirani R. (1993). An introduction to the bootstrap. Monographs on statistics and applied probability. New York: Chapman & Hall.
20. Visser M. (2001). [Roaming through methodology. XXXIV. Limitations of predictive models]. Nederlands Tijdschrift Voor Geneeskunde. 145 (23): 1109-1112.
21. Altman DG and Royston P. (2000). What do we mean by validating a prognostic model? Statistics in Medicine. 19 (4): 453-473.
22. Bleeker SE, Moll HA, Steyerberg EW, Donders AR, Derksen-Lubsen G, Grobbee DE and Moons KG. (2003). External validation is necessary in prediction research: a clinical example. Journal of Clinical Epidemiology. 56 (9): 826-832.

44
RReehhaabbiilliittaattiioonn ffoorr vviissuuaallllyy iimmppaaiirreedd aadduullttss:: aa ssyysstteemmaattiicc rreevviieeww
Maaike Langelaan, Ruth M.A. van Nispen,
Ger H.M.B. van Rens
The Cochrane Database of Systematic Reviews (submitted)
Chapter 4
64
Abstract Background: Visual impairment rehabilitation is a professional form of rehabilitation with the aim of teaching people to adequately cope with their visual disabilities in daily life. Objectives: The objective of this review was to assess the effectiveness of monodisciplinary and multidisciplinary rehabilitation programmes in improving quality of life in visually impaired adults. Search strategy: We searched MEDLINE/Pubmed (1966 until August 2006), CINAHL (1982 until August 2006), EMBASE (1982 until August 2006), PsycInfo, and the Cochrane Library. We searched the reference lists of relevant articles to find additional trials. We manually searched Journal of visual impairment & Blindness, Visual Impairment Research and several proceedings of conferences. Selection criteria: We included (quasi-) randomised trials of studies on quality of life (QoL) of persons, aged 18 years or older, of either sex, with irreversible visual impairment. We included trials that have compared multidisciplinary rehabilitation with monodisciplinary rehabilitation and no rehabilitation. Data collection & analysis: Both reviewers independently extracted data and assessed trial quality. Main results: The effectiveness of vision rehabilitation programs in improving quality of life was investigated according to the RCT standards in a small number of papers. Considering the diversity of vision rehabilitation interventions, eleven papers were categorized into three groups of related intervention types: the educational group programs, methods of enhancing vision and vision rehabilitation programs. Educational group programmes tended to be preferable to individual programmes or no treatment. Some enhancing vision methods are effective in improving quality of life: adaptation of lighting, and conventional rehabilitation. Prescription of prism spectacles is effective to improve reading skills, but not necessarily to improve quality of life. Participants receiving a comprehensive rehabilitation programme experienced a better psychological well-being and performed more independently on living skills after treatment than in a no treatment group. This programme was not effective in improving independency on orientation and mobility skills. Reviewers' conclusions: The evidence from randomised controlled trials that already exists does support the positive effect of rehabilitation on vision-related quality of life. However, this evidence is based on single studies, and the results should be confirmed in
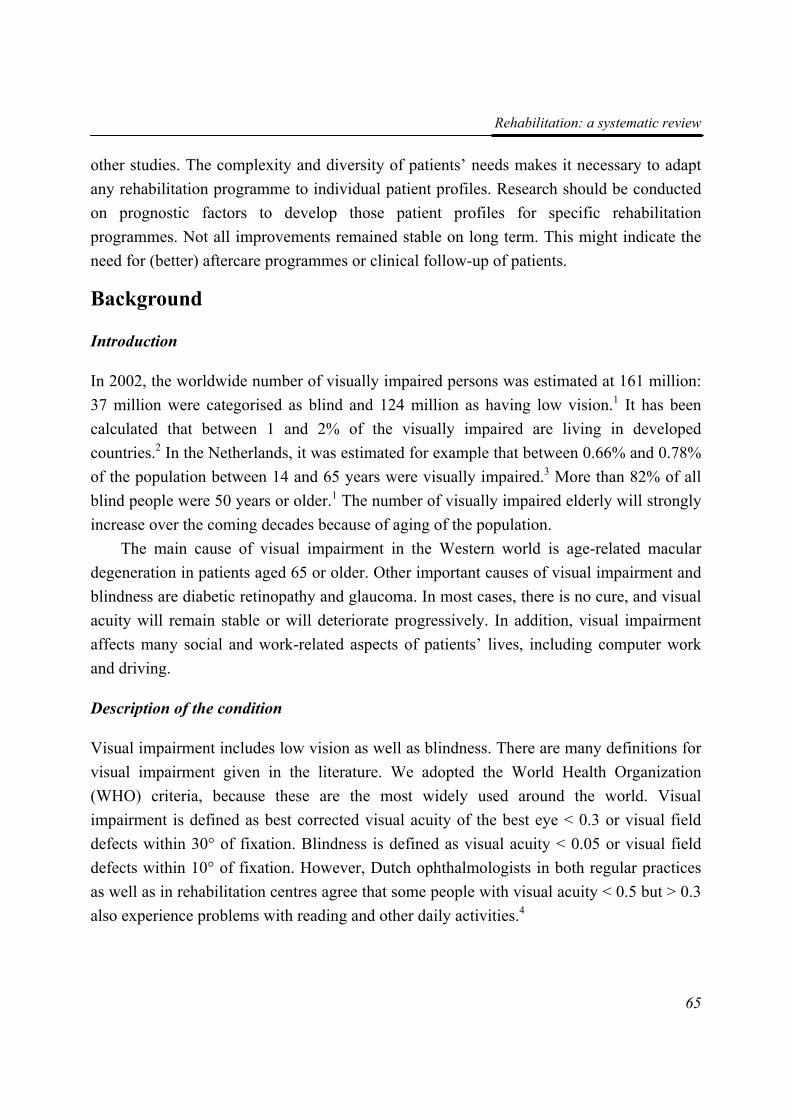
Rehabilitation: a systematic review
65
other studies. The complexity and diversity of patients’ needs makes it necessary to adapt any rehabilitation programme to individual patient profiles. Research should be conducted on prognostic factors to develop those patient profiles for specific rehabilitation programmes. Not all improvements remained stable on long term. This might indicate the need for (better) aftercare programmes or clinical follow-up of patients.
Background
Introduction
In 2002, the worldwide number of visually impaired persons was estimated at 161 million: 37 million were categorised as blind and 124 million as having low vision.1 It has been calculated that between 1 and 2% of the visually impaired are living in developed countries.2 In the Netherlands, it was estimated for example that between 0.66% and 0.78% of the population between 14 and 65 years were visually impaired.3 More than 82% of all blind people were 50 years or older.1 The number of visually impaired elderly will strongly increase over the coming decades because of aging of the population.
The main cause of visual impairment in the Western world is age-related macular degeneration in patients aged 65 or older. Other important causes of visual impairment and blindness are diabetic retinopathy and glaucoma. In most cases, there is no cure, and visual acuity will remain stable or will deteriorate progressively. In addition, visual impairment affects many social and work-related aspects of patients’ lives, including computer work and driving.
Description of the condition
Visual impairment includes low vision as well as blindness. There are many definitions for visual impairment given in the literature. We adopted the World Health Organization (WHO) criteria, because these are the most widely used around the world. Visual impairment is defined as best corrected visual acuity of the best eye < 0.3 or visual field defects within 30° of fixation. Blindness is defined as visual acuity < 0.05 or visual field defects within 10° of fixation. However, Dutch ophthalmologists in both regular practices as well as in rehabilitation centres agree that some people with visual acuity < 0.5 but > 0.3 also experience problems with reading and other daily activities.4
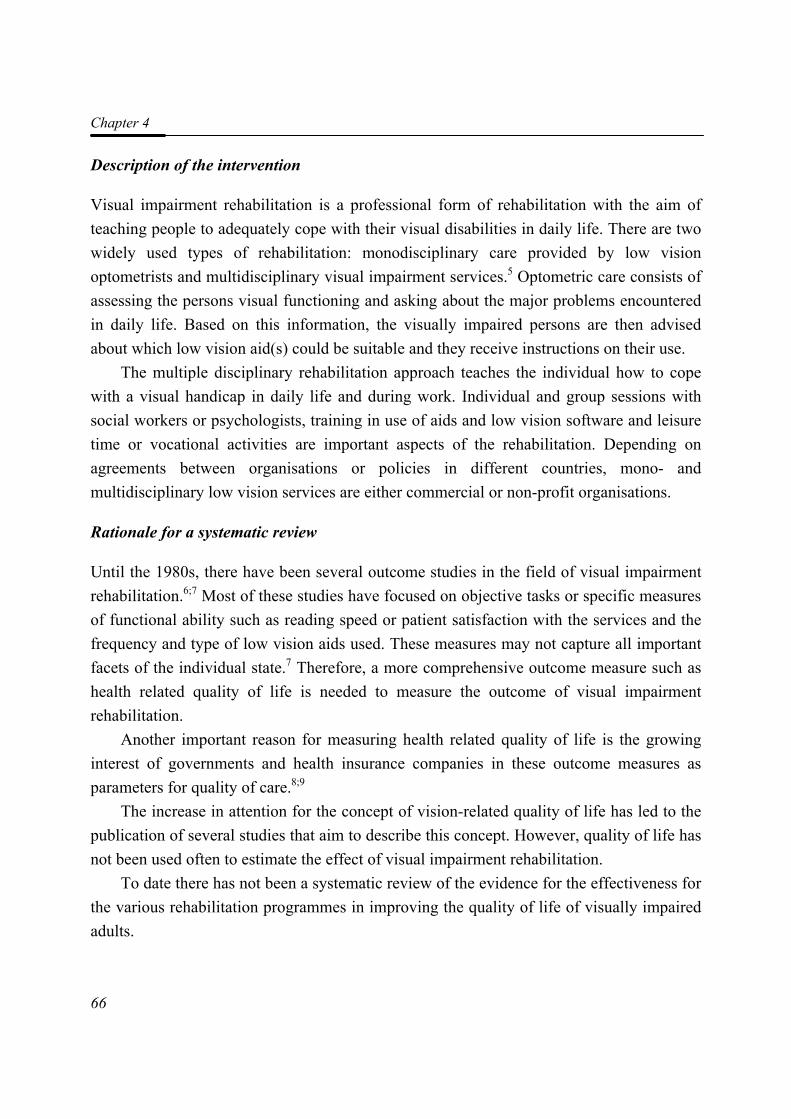
Chapter 4
66
Description of the intervention
Visual impairment rehabilitation is a professional form of rehabilitation with the aim of teaching people to adequately cope with their visual disabilities in daily life. There are two widely used types of rehabilitation: monodisciplinary care provided by low vision optometrists and multidisciplinary visual impairment services.5 Optometric care consists of assessing the persons visual functioning and asking about the major problems encountered in daily life. Based on this information, the visually impaired persons are then advised about which low vision aid(s) could be suitable and they receive instructions on their use.
The multiple disciplinary rehabilitation approach teaches the individual how to cope with a visual handicap in daily life and during work. Individual and group sessions with social workers or psychologists, training in use of aids and low vision software and leisure time or vocational activities are important aspects of the rehabilitation. Depending on agreements between organisations or policies in different countries, mono- and multidisciplinary low vision services are either commercial or non-profit organisations.
Rationale for a systematic review
Until the 1980s, there have been several outcome studies in the field of visual impairment rehabilitation.6;7 Most of these studies have focused on objective tasks or specific measures of functional ability such as reading speed or patient satisfaction with the services and the frequency and type of low vision aids used. These measures may not capture all important facets of the individual state.7 Therefore, a more comprehensive outcome measure such as health related quality of life is needed to measure the outcome of visual impairment rehabilitation.
Another important reason for measuring health related quality of life is the growing interest of governments and health insurance companies in these outcome measures as parameters for quality of care.8;9
The increase in attention for the concept of vision-related quality of life has led to the publication of several studies that aim to describe this concept. However, quality of life has not been used often to estimate the effect of visual impairment rehabilitation.
To date there has not been a systematic review of the evidence for the effectiveness for the various rehabilitation programmes in improving the quality of life of visually impaired adults.
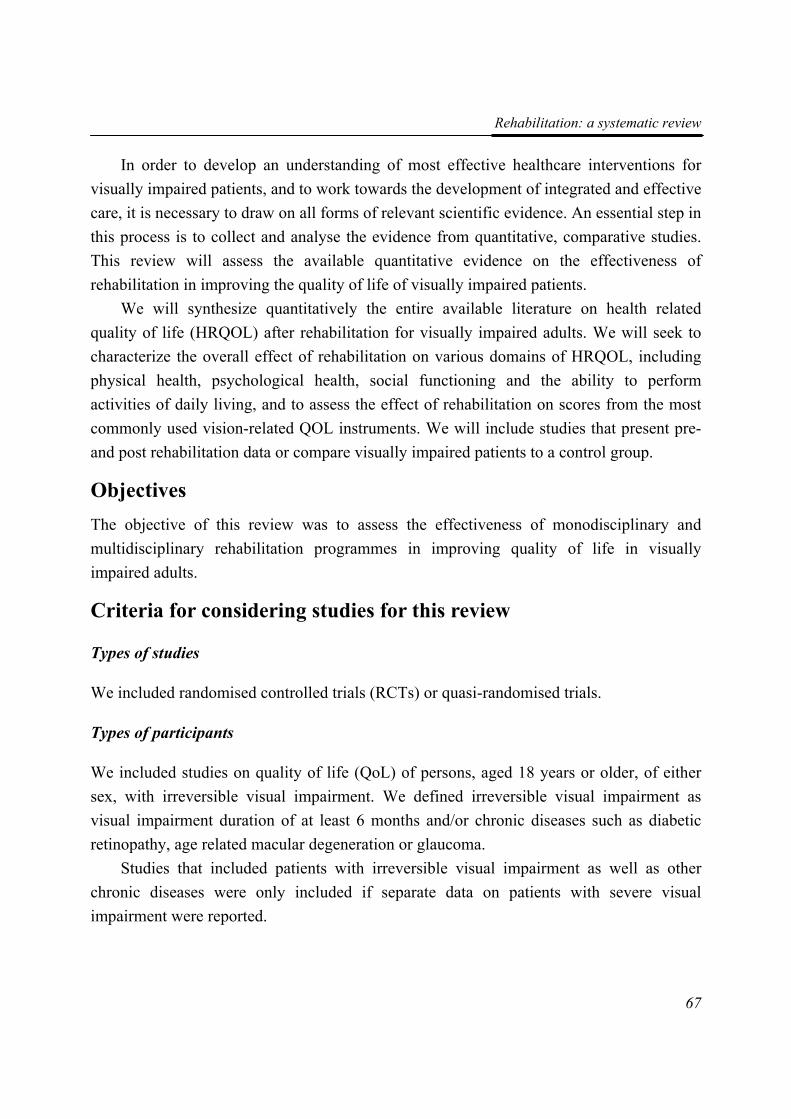
Rehabilitation: a systematic review
67
In order to develop an understanding of most effective healthcare interventions for visually impaired patients, and to work towards the development of integrated and effective care, it is necessary to draw on all forms of relevant scientific evidence. An essential step in this process is to collect and analyse the evidence from quantitative, comparative studies. This review will assess the available quantitative evidence on the effectiveness of rehabilitation in improving the quality of life of visually impaired patients.
We will synthesize quantitatively the entire available literature on health related quality of life (HRQOL) after rehabilitation for visually impaired adults. We will seek to characterize the overall effect of rehabilitation on various domains of HRQOL, including physical health, psychological health, social functioning and the ability to perform activities of daily living, and to assess the effect of rehabilitation on scores from the most commonly used vision-related QOL instruments. We will include studies that present pre- and post rehabilitation data or compare visually impaired patients to a control group.
Objectives The objective of this review was to assess the effectiveness of monodisciplinary and multidisciplinary rehabilitation programmes in improving quality of life in visually impaired adults.
Criteria for considering studies for this review
Types of studies
We included randomised controlled trials (RCTs) or quasi-randomised trials.
Types of participants
We included studies on quality of life (QoL) of persons, aged 18 years or older, of either sex, with irreversible visual impairment. We defined irreversible visual impairment as visual impairment duration of at least 6 months and/or chronic diseases such as diabetic retinopathy, age related macular degeneration or glaucoma.
Studies that included patients with irreversible visual impairment as well as other chronic diseases were only included if separate data on patients with severe visual impairment were reported.
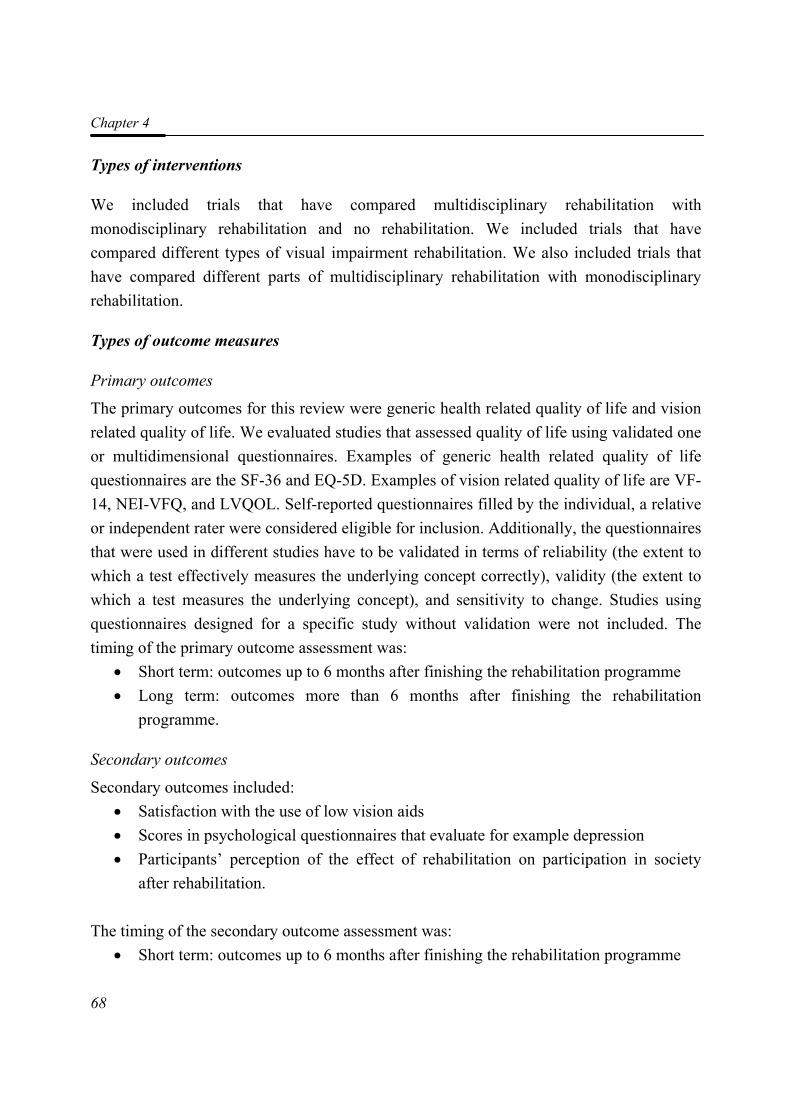
Chapter 4
68
Types of interventions
We included trials that have compared multidisciplinary rehabilitation with monodisciplinary rehabilitation and no rehabilitation. We included trials that have compared different types of visual impairment rehabilitation. We also included trials that have compared different parts of multidisciplinary rehabilitation with monodisciplinary rehabilitation.
Types of outcome measures
Primary outcomes
The primary outcomes for this review were generic health related quality of life and vision related quality of life. We evaluated studies that assessed quality of life using validated one or multidimensional questionnaires. Examples of generic health related quality of life questionnaires are the SF-36 and EQ-5D. Examples of vision related quality of life are VF-14, NEI-VFQ, and LVQOL. Self-reported questionnaires filled by the individual, a relative or independent rater were considered eligible for inclusion. Additionally, the questionnaires that were used in different studies have to be validated in terms of reliability (the extent to which a test effectively measures the underlying concept correctly), validity (the extent to which a test measures the underlying concept), and sensitivity to change. Studies using questionnaires designed for a specific study without validation were not included. The timing of the primary outcome assessment was:
• Short term: outcomes up to 6 months after finishing the rehabilitation programme • Long term: outcomes more than 6 months after finishing the rehabilitation
programme.
Secondary outcomes
Secondary outcomes included: • Satisfaction with the use of low vision aids • Scores in psychological questionnaires that evaluate for example depression • Participants’ perception of the effect of rehabilitation on participation in society
after rehabilitation.
The timing of the secondary outcome assessment was: • Short term: outcomes up to 6 months after finishing the rehabilitation programme
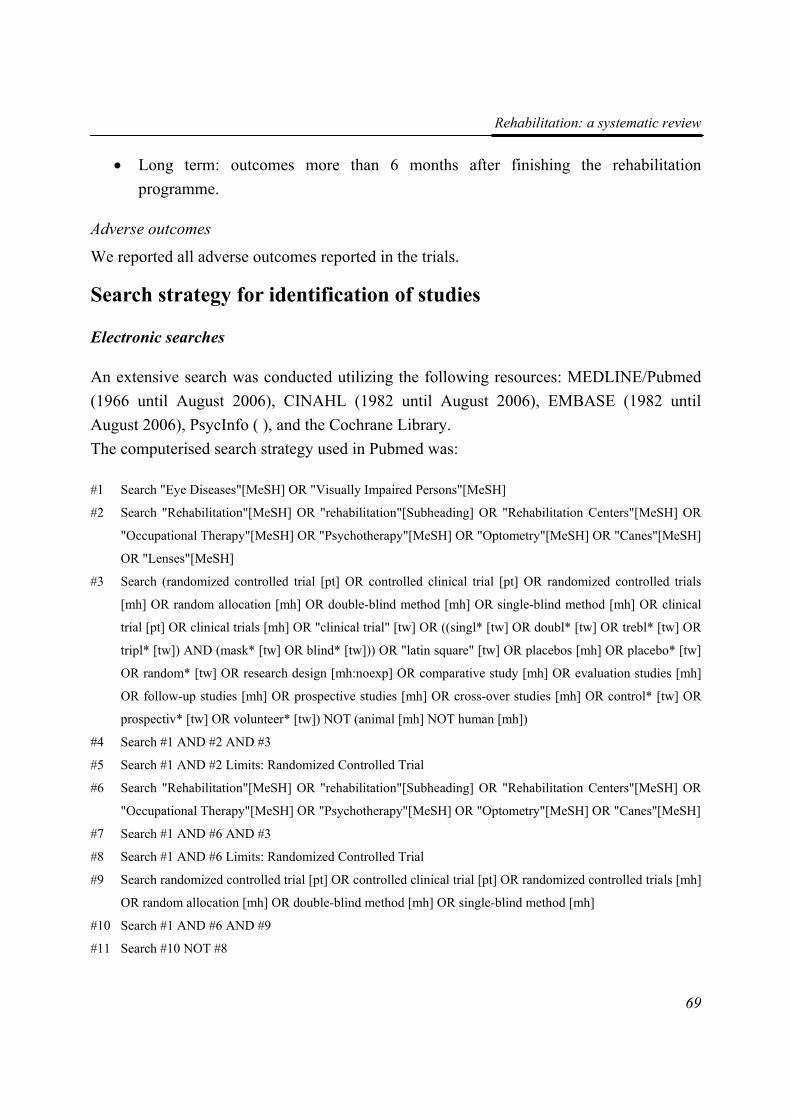
Rehabilitation: a systematic review
69
• Long term: outcomes more than 6 months after finishing the rehabilitation programme.
Adverse outcomes
We reported all adverse outcomes reported in the trials.
Search strategy for identification of studies
Electronic searches
An extensive search was conducted utilizing the following resources: MEDLINE/Pubmed (1966 until August 2006), CINAHL (1982 until August 2006), EMBASE (1982 until August 2006), PsycInfo ( ), and the Cochrane Library. The computerised search strategy used in Pubmed was: #1 Search "Eye Diseases"[MeSH] OR "Visually Impaired Persons"[MeSH]
#2 Search "Rehabilitation"[MeSH] OR "rehabilitation"[Subheading] OR "Rehabilitation Centers"[MeSH] OR
"Occupational Therapy"[MeSH] OR "Psychotherapy"[MeSH] OR "Optometry"[MeSH] OR "Canes"[MeSH]
OR "Lenses"[MeSH]
#3 Search (randomized controlled trial [pt] OR controlled clinical trial [pt] OR randomized controlled trials
[mh] OR random allocation [mh] OR double-blind method [mh] OR single-blind method [mh] OR clinical
trial [pt] OR clinical trials [mh] OR "clinical trial" [tw] OR ((singl* [tw] OR doubl* [tw] OR trebl* [tw] OR
tripl* [tw]) AND (mask* [tw] OR blind* [tw])) OR "latin square" [tw] OR placebos [mh] OR placebo* [tw]
OR random* [tw] OR research design [mh:noexp] OR comparative study [mh] OR evaluation studies [mh]
OR follow-up studies [mh] OR prospective studies [mh] OR cross-over studies [mh] OR control* [tw] OR
prospectiv* [tw] OR volunteer* [tw]) NOT (animal [mh] NOT human [mh])
#4 Search #1 AND #2 AND #3
#5 Search #1 AND #2 Limits: Randomized Controlled Trial
#6 Search "Rehabilitation"[MeSH] OR "rehabilitation"[Subheading] OR "Rehabilitation Centers"[MeSH] OR
"Occupational Therapy"[MeSH] OR "Psychotherapy"[MeSH] OR "Optometry"[MeSH] OR "Canes"[MeSH]
#7 Search #1 AND #6 AND #3
#8 Search #1 AND #6 Limits: Randomized Controlled Trial
#9 Search randomized controlled trial [pt] OR controlled clinical trial [pt] OR randomized controlled trials [mh]
OR random allocation [mh] OR double-blind method [mh] OR single-blind method [mh]
#10 Search #1 AND #6 AND #9
#11 Search #10 NOT #8
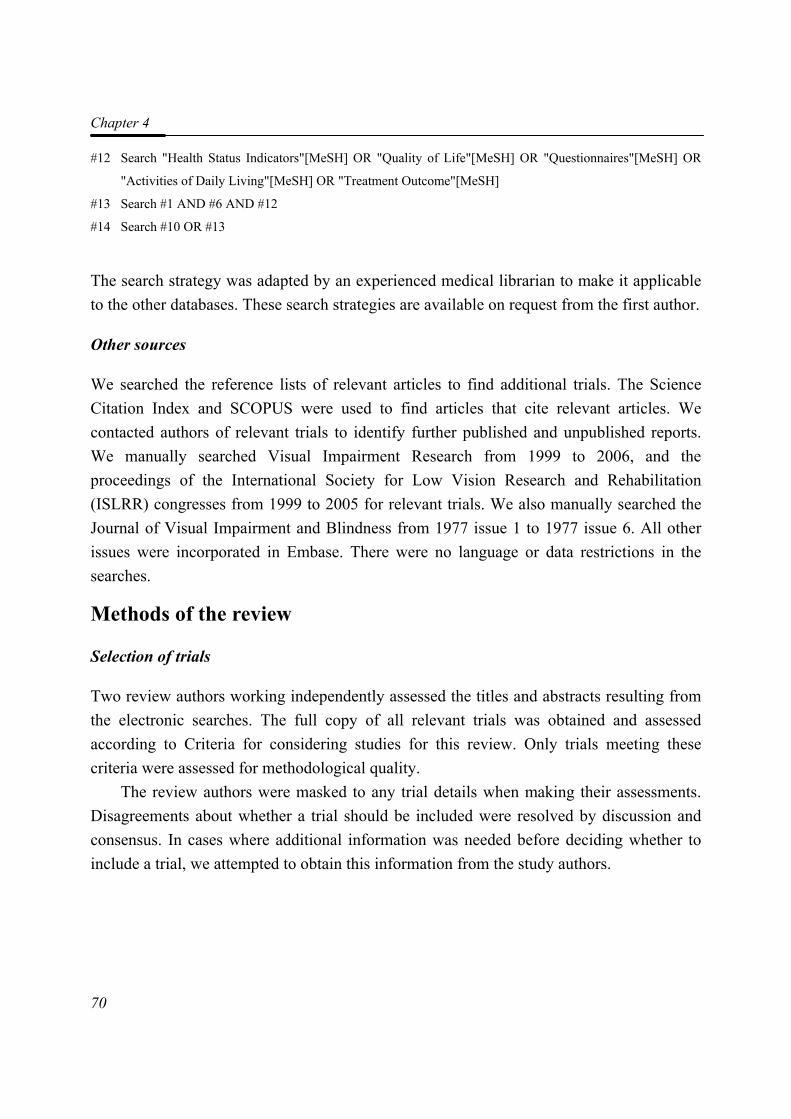
Chapter 4
70
#12 Search "Health Status Indicators"[MeSH] OR "Quality of Life"[MeSH] OR "Questionnaires"[MeSH] OR
"Activities of Daily Living"[MeSH] OR "Treatment Outcome"[MeSH]
#13 Search #1 AND #6 AND #12
#14 Search #10 OR #13
The search strategy was adapted by an experienced medical librarian to make it applicable to the other databases. These search strategies are available on request from the first author.
Other sources
We searched the reference lists of relevant articles to find additional trials. The Science Citation Index and SCOPUS were used to find articles that cite relevant articles. We contacted authors of relevant trials to identify further published and unpublished reports. We manually searched Visual Impairment Research from 1999 to 2006, and the proceedings of the International Society for Low Vision Research and Rehabilitation (ISLRR) congresses from 1999 to 2005 for relevant trials. We also manually searched the Journal of Visual Impairment and Blindness from 1977 issue 1 to 1977 issue 6. All other issues were incorporated in Embase. There were no language or data restrictions in the searches.
Methods of the review
Selection of trials
Two review authors working independently assessed the titles and abstracts resulting from the electronic searches. The full copy of all relevant trials was obtained and assessed according to Criteria for considering studies for this review. Only trials meeting these criteria were assessed for methodological quality.
The review authors were masked to any trial details when making their assessments. Disagreements about whether a trial should be included were resolved by discussion and consensus. In cases where additional information was needed before deciding whether to include a trial, we attempted to obtain this information from the study authors.
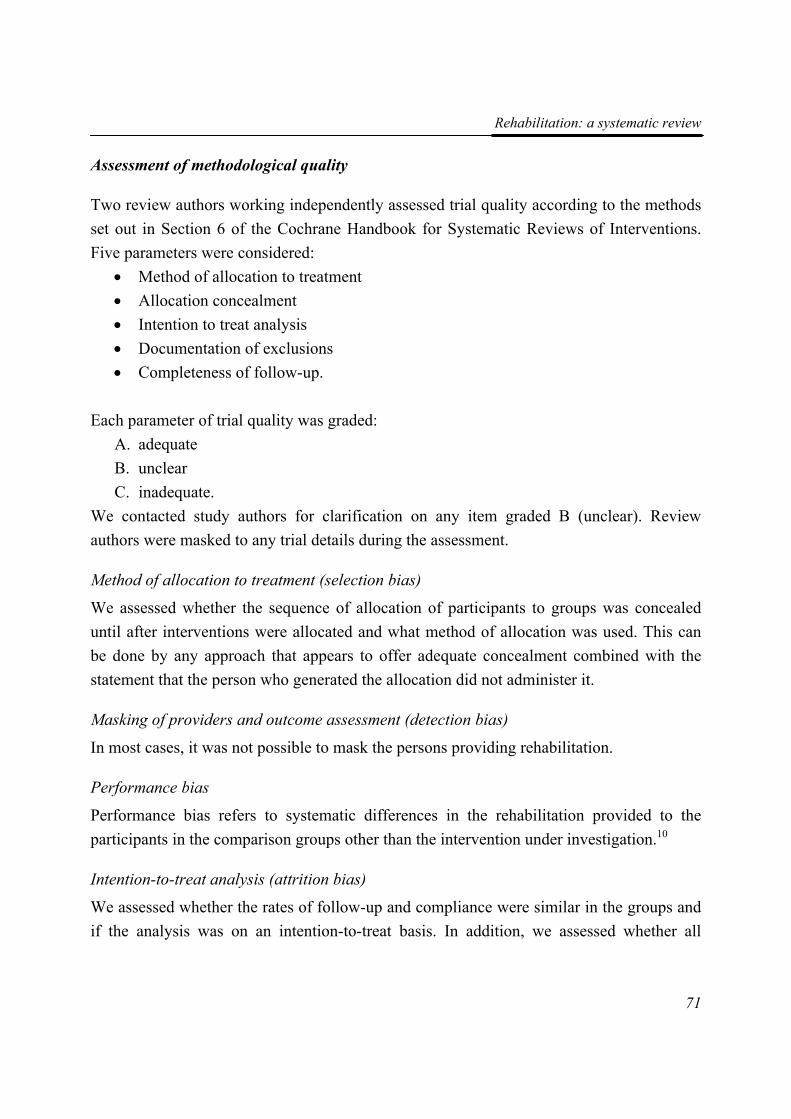
Rehabilitation: a systematic review
71
Assessment of methodological quality
Two review authors working independently assessed trial quality according to the methods set out in Section 6 of the Cochrane Handbook for Systematic Reviews of Interventions. Five parameters were considered:
• Method of allocation to treatment • Allocation concealment • Intention to treat analysis • Documentation of exclusions • Completeness of follow-up.
Each parameter of trial quality was graded: A. adequate B. unclear C. inadequate.
We contacted study authors for clarification on any item graded B (unclear). Review authors were masked to any trial details during the assessment.
Method of allocation to treatment (selection bias)
We assessed whether the sequence of allocation of participants to groups was concealed until after interventions were allocated and what method of allocation was used. This can be done by any approach that appears to offer adequate concealment combined with the statement that the person who generated the allocation did not administer it.
Masking of providers and outcome assessment (detection bias)
In most cases, it was not possible to mask the persons providing rehabilitation.
Performance bias
Performance bias refers to systematic differences in the rehabilitation provided to the participants in the comparison groups other than the intervention under investigation.10
Intention-to-treat analysis (attrition bias)
We assessed whether the rates of follow-up and compliance were similar in the groups and if the analysis was on an intention-to-treat basis. In addition, we assessed whether all
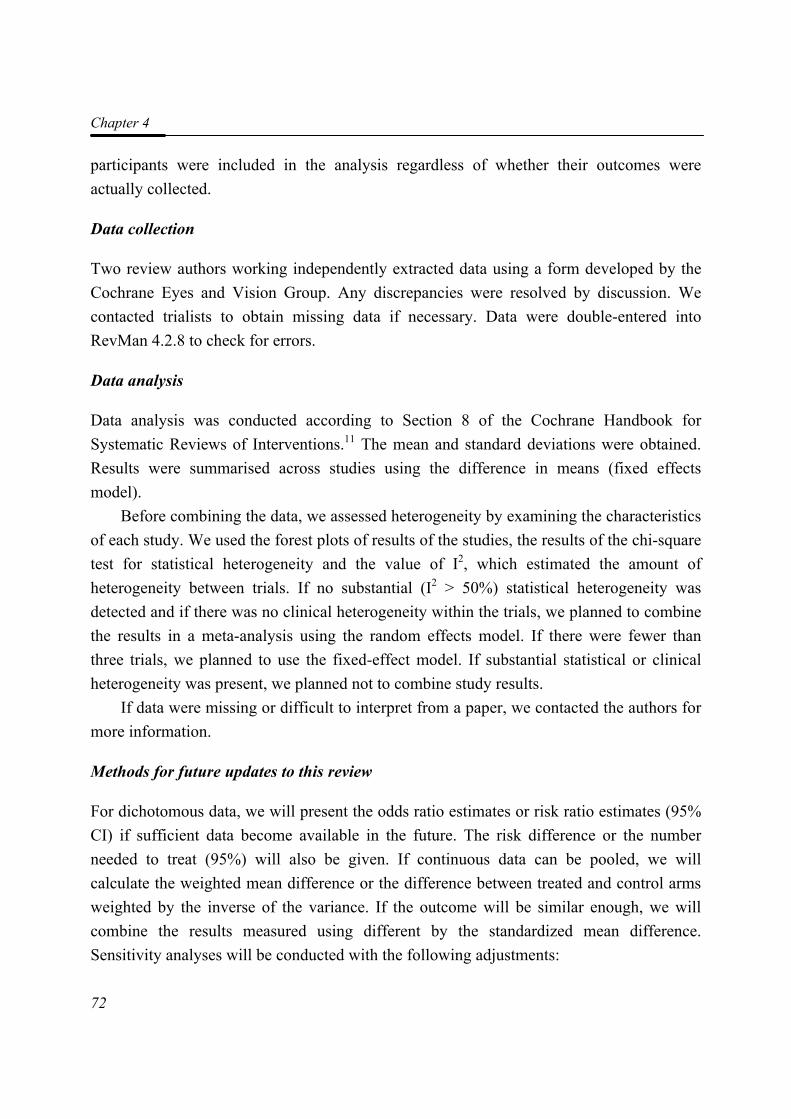
Chapter 4
72
participants were included in the analysis regardless of whether their outcomes were actually collected.
Data collection
Two review authors working independently extracted data using a form developed by the Cochrane Eyes and Vision Group. Any discrepancies were resolved by discussion. We contacted trialists to obtain missing data if necessary. Data were double-entered into RevMan 4.2.8 to check for errors.
Data analysis
Data analysis was conducted according to Section 8 of the Cochrane Handbook for Systematic Reviews of Interventions.11 The mean and standard deviations were obtained. Results were summarised across studies using the difference in means (fixed effects model).
Before combining the data, we assessed heterogeneity by examining the characteristics of each study. We used the forest plots of results of the studies, the results of the chi-square test for statistical heterogeneity and the value of I2, which estimated the amount of heterogeneity between trials. If no substantial (I2 > 50%) statistical heterogeneity was detected and if there was no clinical heterogeneity within the trials, we planned to combine the results in a meta-analysis using the random effects model. If there were fewer than three trials, we planned to use the fixed-effect model. If substantial statistical or clinical heterogeneity was present, we planned not to combine study results.
If data were missing or difficult to interpret from a paper, we contacted the authors for more information.
Methods for future updates to this review
For dichotomous data, we will present the odds ratio estimates or risk ratio estimates (95% CI) if sufficient data become available in the future. The risk difference or the number needed to treat (95%) will also be given. If continuous data can be pooled, we will calculate the weighted mean difference or the difference between treated and control arms weighted by the inverse of the variance. If the outcome will be similar enough, we will combine the results measured using different by the standardized mean difference. Sensitivity analyses will be conducted with the following adjustments:
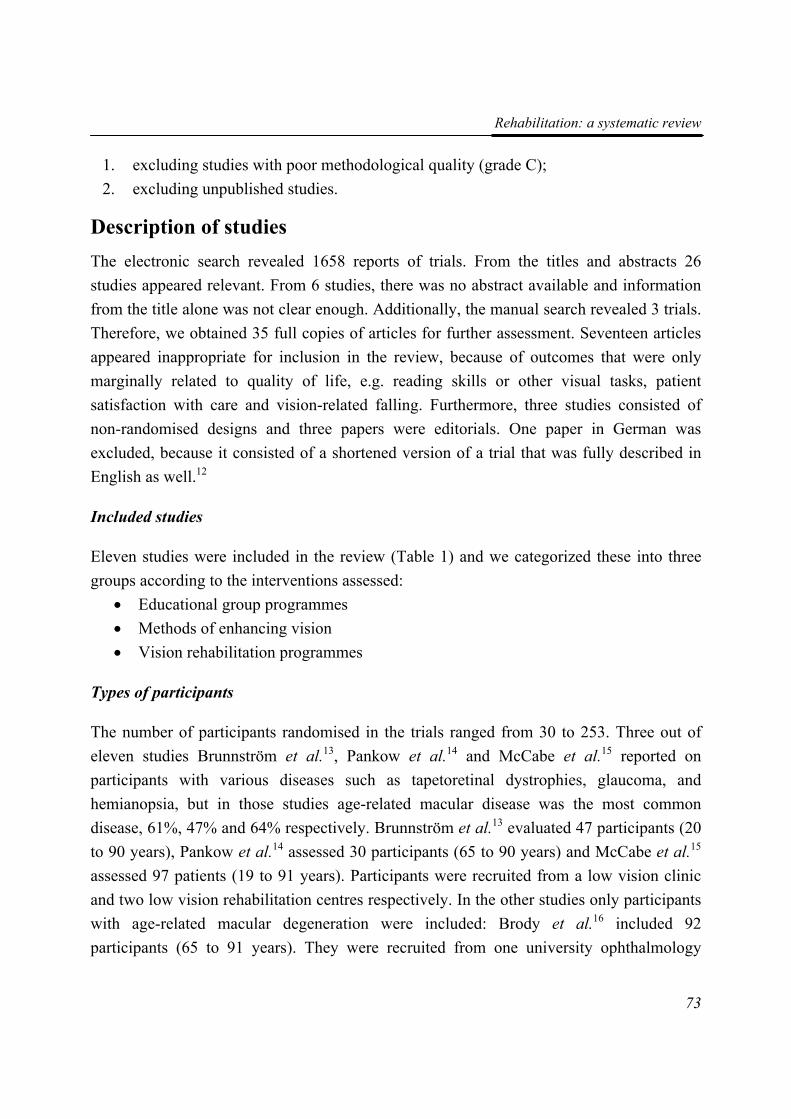
Rehabilitation: a systematic review
73
1. excluding studies with poor methodological quality (grade C); 2. excluding unpublished studies.
Description of studies The electronic search revealed 1658 reports of trials. From the titles and abstracts 26 studies appeared relevant. From 6 studies, there was no abstract available and information from the title alone was not clear enough. Additionally, the manual search revealed 3 trials. Therefore, we obtained 35 full copies of articles for further assessment. Seventeen articles appeared inappropriate for inclusion in the review, because of outcomes that were only marginally related to quality of life, e.g. reading skills or other visual tasks, patient satisfaction with care and vision-related falling. Furthermore, three studies consisted of non-randomised designs and three papers were editorials. One paper in German was excluded, because it consisted of a shortened version of a trial that was fully described in English as well.12
Included studies
Eleven studies were included in the review (Table 1) and we categorized these into three groups according to the interventions assessed:
• Educational group programmes • Methods of enhancing vision • Vision rehabilitation programmes
Types of participants
The number of participants randomised in the trials ranged from 30 to 253. Three out of eleven studies Brunnström et al.13, Pankow et al.14 and McCabe et al.15 reported on participants with various diseases such as tapetoretinal dystrophies, glaucoma, and hemianopsia, but in those studies age-related macular disease was the most common disease, 61%, 47% and 64% respectively. Brunnström et al.13 evaluated 47 participants (20 to 90 years), Pankow et al.14 assessed 30 participants (65 to 90 years) and McCabe et al.15 assessed 97 patients (19 to 91 years). Participants were recruited from a low vision clinic and two low vision rehabilitation centres respectively. In the other studies only participants with age-related macular degeneration were included: Brody et al.16 included 92 participants (65 to 91 years). They were recruited from one university ophthalmology
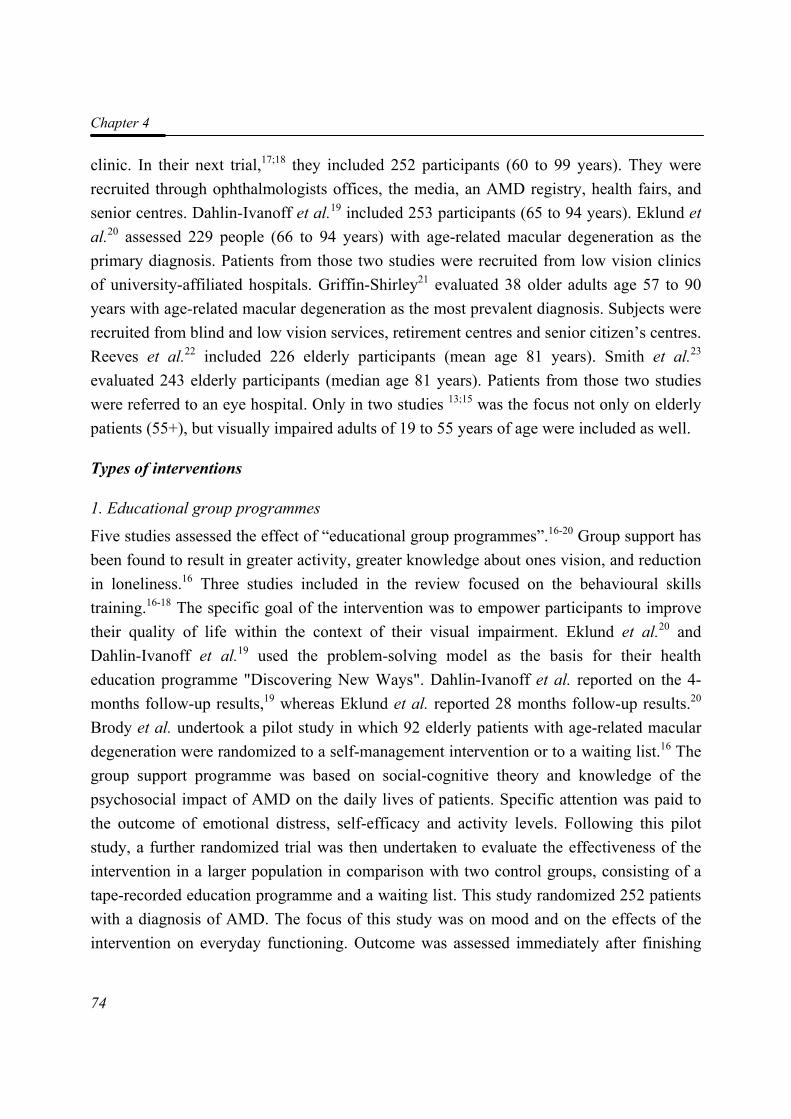
Chapter 4
74
clinic. In their next trial,17;18 they included 252 participants (60 to 99 years). They were recruited through ophthalmologists offices, the media, an AMD registry, health fairs, and senior centres. Dahlin-Ivanoff et al.19 included 253 participants (65 to 94 years). Eklund et al.20 assessed 229 people (66 to 94 years) with age-related macular degeneration as the primary diagnosis. Patients from those two studies were recruited from low vision clinics of university-affiliated hospitals. Griffin-Shirley21 evaluated 38 older adults age 57 to 90 years with age-related macular degeneration as the most prevalent diagnosis. Subjects were recruited from blind and low vision services, retirement centres and senior citizen’s centres. Reeves et al.22 included 226 elderly participants (mean age 81 years). Smith et al.23 evaluated 243 elderly participants (median age 81 years). Patients from those two studies were referred to an eye hospital. Only in two studies 13;15 was the focus not only on elderly patients (55+), but visually impaired adults of 19 to 55 years of age were included as well.
Types of interventions
1. Educational group programmes
Five studies assessed the effect of “educational group programmes”.16-20 Group support has been found to result in greater activity, greater knowledge about ones vision, and reduction in loneliness.16 Three studies included in the review focused on the behavioural skills training.16-18 The specific goal of the intervention was to empower participants to improve their quality of life within the context of their visual impairment. Eklund et al.20 and Dahlin-Ivanoff et al.19 used the problem-solving model as the basis for their health education programme "Discovering New Ways". Dahlin-Ivanoff et al. reported on the 4-months follow-up results,19 whereas Eklund et al. reported 28 months follow-up results.20 Brody et al. undertook a pilot study in which 92 elderly patients with age-related macular degeneration were randomized to a self-management intervention or to a waiting list.16 The group support programme was based on social-cognitive theory and knowledge of the psychosocial impact of AMD on the daily lives of patients. Specific attention was paid to the outcome of emotional distress, self-efficacy and activity levels. Following this pilot study, a further randomized trial was then undertaken to evaluate the effectiveness of the intervention in a larger population in comparison with two control groups, consisting of a tape-recorded education programme and a waiting list. This study randomized 252 patients with a diagnosis of AMD. The focus of this study was on mood and on the effects of the intervention on everyday functioning. Outcome was assessed immediately after finishing

Rehabilitation: a systematic review
75
the intervention. The next study was an examination of the effects at the 6-month follow-up of the AMD self-management programme in terms of the primary intent to improve participants mood and secondarily to improve function.18 There were 214 out of the previously described 252 subjects who completed the 6-month follow-up.
2. Methods of enhancing vision
Three studies assessed the effect of enhancing vision methods.13;22;23 Smith et al. compared the effect of custom prism spectacles with standard prism spectacles and placebo spectacles on vision-specific health related quality of life in people with AMD as a secondary outcome in their study.23 They reported 3-months follow-up results. Reeves et al. compared the effectiveness of conventional low vision rehabilitation (CLVR) with enhanced low vision rehabilitation (ELVR) after one year.22 The intervention components for ELVR are the same as for CLVR plus up to three home visits by a trained rehabilitation officer. A second control group was an ELVR-intervention controlled for additional contact time (CELVR). Subjects were visited at their home by a community care worker. In the third study in this group, the additional effects on providing task lighting in the living room were investigated after 6 months.13 The improved lighting was a 50 W halogen, 12V standard floor lamp.
3. Vision rehabilitation programmes
We found three randomised trials that assessed the effects of vision rehabilitation programmes on visually impaired adults.14;15;21 McCabe et al. assessed the effects of vision rehabilitation using optometry, occupational therapy and social work services on functional ability and assessed the effects of involving families in the intervention.15 They compared the results before rehabilitation with the results at the conclusion of the rehabilitation. Pankow et al. examined effective restoration of functional independence to older adults with vision loss through vision rehabilitation.14 Interventions were optical aids, blind rehabilitation teaching, orientation and mobility training, and occupational therapy. They reported 4-weeks follow-up results.
Griffin-Shirley compared a community or centre based rehabilitation training with a control group that received no training after 15 months.21
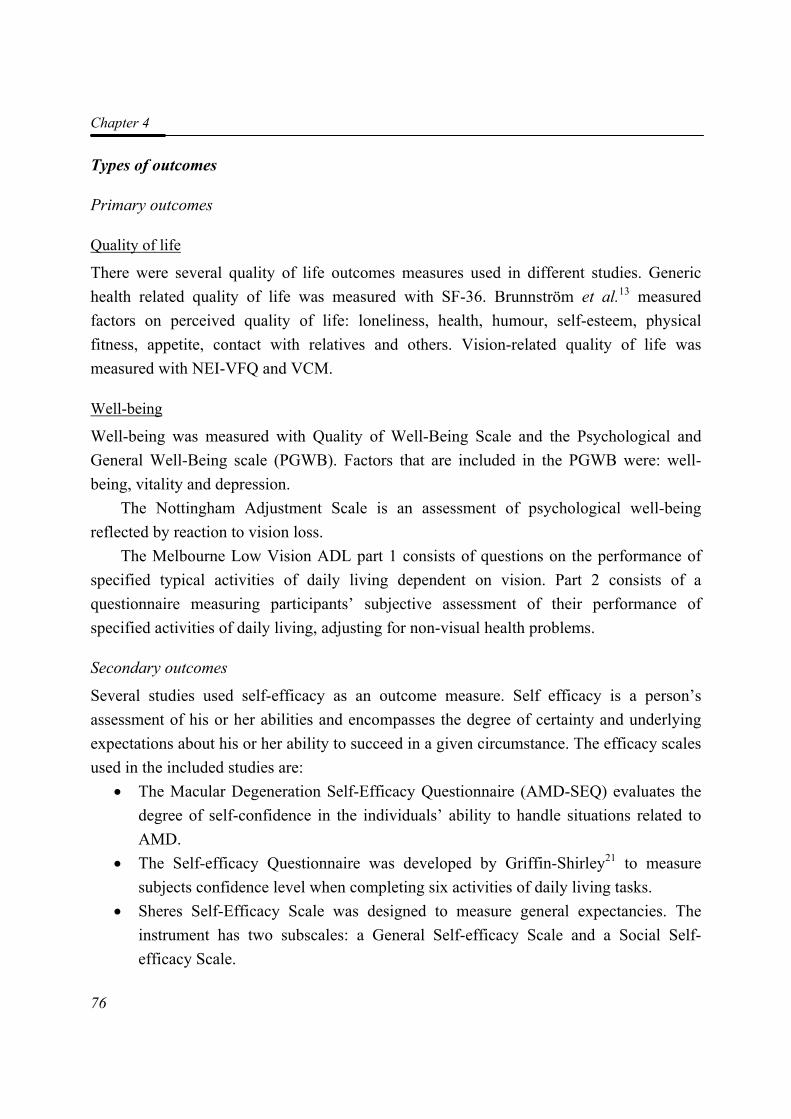
Chapter 4
76
Types of outcomes
Primary outcomes
Quality of life
There were several quality of life outcomes measures used in different studies. Generic health related quality of life was measured with SF-36. Brunnström et al.13 measured factors on perceived quality of life: loneliness, health, humour, self-esteem, physical fitness, appetite, contact with relatives and others. Vision-related quality of life was measured with NEI-VFQ and VCM.
Well-being
Well-being was measured with Quality of Well-Being Scale and the Psychological and General Well-Being scale (PGWB). Factors that are included in the PGWB were: well-being, vitality and depression.
The Nottingham Adjustment Scale is an assessment of psychological well-being reflected by reaction to vision loss.
The Melbourne Low Vision ADL part 1 consists of questions on the performance of specified typical activities of daily living dependent on vision. Part 2 consists of a questionnaire measuring participants’ subjective assessment of their performance of specified activities of daily living, adjusting for non-visual health problems.
Secondary outcomes
Several studies used self-efficacy as an outcome measure. Self efficacy is a person’s assessment of his or her abilities and encompasses the degree of certainty and underlying expectations about his or her ability to succeed in a given circumstance. The efficacy scales used in the included studies are:
• The Macular Degeneration Self-Efficacy Questionnaire (AMD-SEQ) evaluates the degree of self-confidence in the individuals’ ability to handle situations related to AMD.
• The Self-efficacy Questionnaire was developed by Griffin-Shirley21 to measure subjects confidence level when completing six activities of daily living tasks.
• Sheres Self-Efficacy Scale was designed to measure general expectancies. The instrument has two subscales: a General Self-efficacy Scale and a Social Self-efficacy Scale.
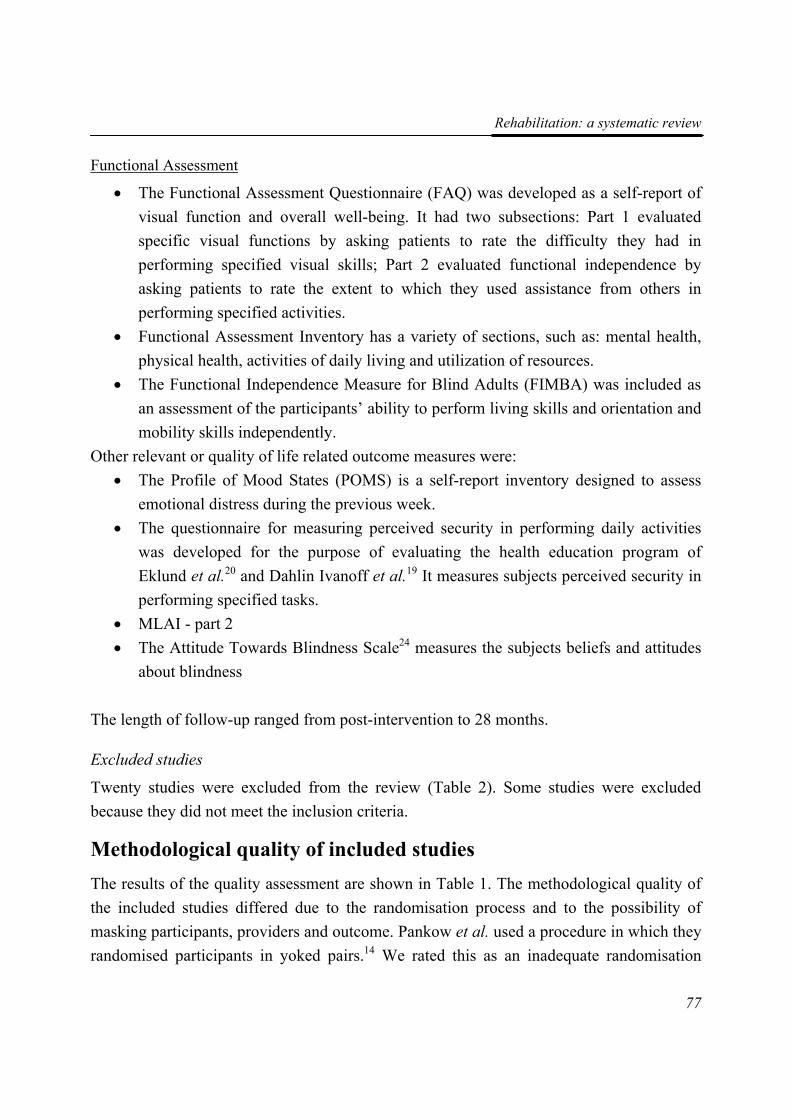
Rehabilitation: a systematic review
77
Functional Assessment
• The Functional Assessment Questionnaire (FAQ) was developed as a self-report of visual function and overall well-being. It had two subsections: Part 1 evaluated specific visual functions by asking patients to rate the difficulty they had in performing specified visual skills; Part 2 evaluated functional independence by asking patients to rate the extent to which they used assistance from others in performing specified activities.
• Functional Assessment Inventory has a variety of sections, such as: mental health, physical health, activities of daily living and utilization of resources.
• The Functional Independence Measure for Blind Adults (FIMBA) was included as an assessment of the participants’ ability to perform living skills and orientation and mobility skills independently.
Other relevant or quality of life related outcome measures were: • The Profile of Mood States (POMS) is a self-report inventory designed to assess
emotional distress during the previous week. • The questionnaire for measuring perceived security in performing daily activities
was developed for the purpose of evaluating the health education program of Eklund et al.20 and Dahlin Ivanoff et al.19 It measures subjects perceived security in performing specified tasks.
• MLAI - part 2 • The Attitude Towards Blindness Scale24 measures the subjects beliefs and attitudes
about blindness
The length of follow-up ranged from post-intervention to 28 months.
Excluded studies
Twenty studies were excluded from the review (Table 2). Some studies were excluded because they did not meet the inclusion criteria.
Methodological quality of included studies The results of the quality assessment are shown in Table 1. The methodological quality of the included studies differed due to the randomisation process and to the possibility of masking participants, providers and outcome. Pankow et al. used a procedure in which they randomised participants in yoked pairs.14 We rated this as an inadequate randomisation
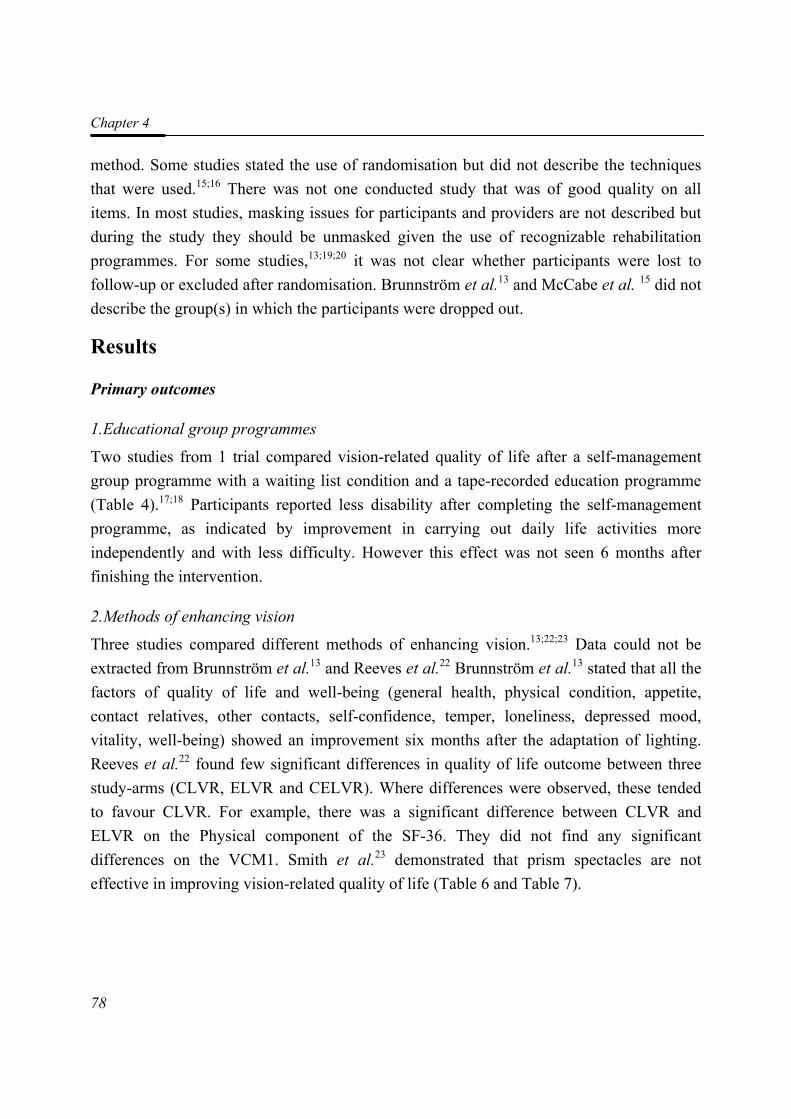
Chapter 4
78
method. Some studies stated the use of randomisation but did not describe the techniques that were used.15;16 There was not one conducted study that was of good quality on all items. In most studies, masking issues for participants and providers are not described but during the study they should be unmasked given the use of recognizable rehabilitation programmes. For some studies,13;19;20 it was not clear whether participants were lost to follow-up or excluded after randomisation. Brunnström et al.13 and McCabe et al. 15 did not describe the group(s) in which the participants were dropped out.
Results
Primary outcomes
1.Educational group programmes
Two studies from 1 trial compared vision-related quality of life after a self-management group programme with a waiting list condition and a tape-recorded education programme (Table 4).17;18 Participants reported less disability after completing the self-management programme, as indicated by improvement in carrying out daily life activities more independently and with less difficulty. However this effect was not seen 6 months after finishing the intervention.
2.Methods of enhancing vision
Three studies compared different methods of enhancing vision.13;22;23 Data could not be extracted from Brunnström et al.13 and Reeves et al.22 Brunnström et al.13 stated that all the factors of quality of life and well-being (general health, physical condition, appetite, contact relatives, other contacts, self-confidence, temper, loneliness, depressed mood, vitality, well-being) showed an improvement six months after the adaptation of lighting. Reeves et al.22 found few significant differences in quality of life outcome between three study-arms (CLVR, ELVR and CELVR). Where differences were observed, these tended to favour CLVR. For example, there was a significant difference between CLVR and ELVR on the Physical component of the SF-36. They did not find any significant differences on the VCM1. Smith et al.23 demonstrated that prism spectacles are not effective in improving vision-related quality of life (Table 6 and Table 7).
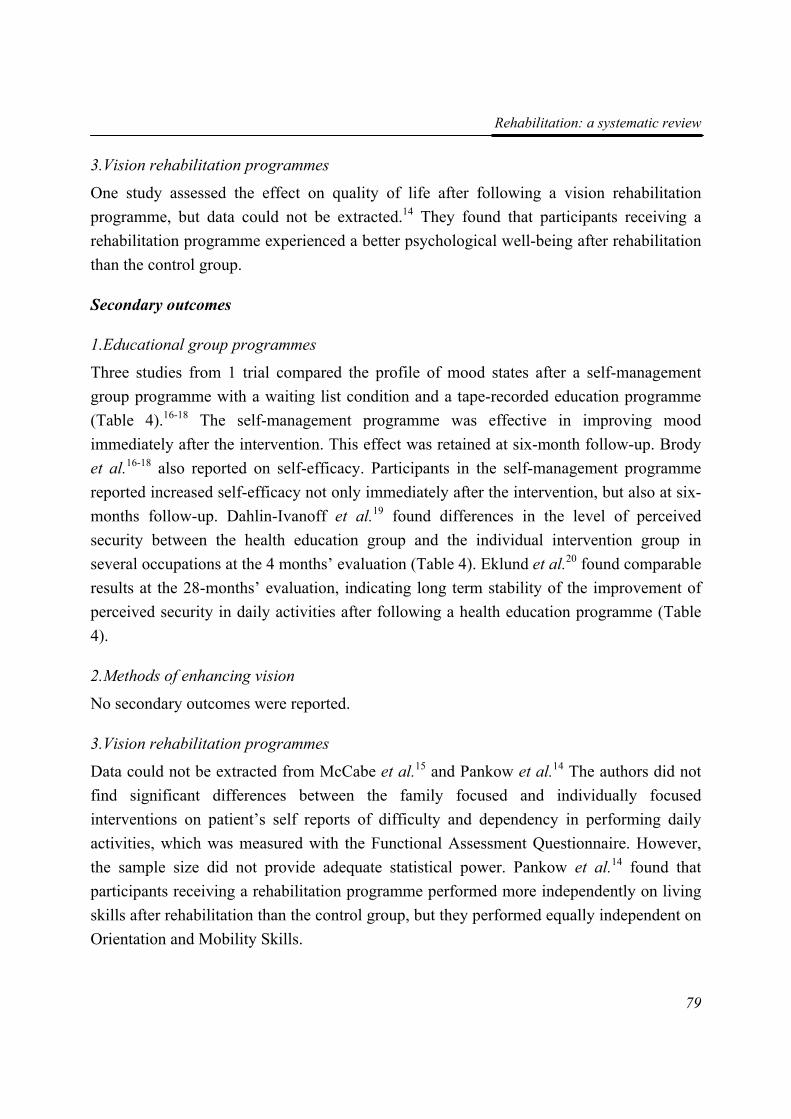
Rehabilitation: a systematic review
79
3.Vision rehabilitation programmes
One study assessed the effect on quality of life after following a vision rehabilitation programme, but data could not be extracted.14 They found that participants receiving a rehabilitation programme experienced a better psychological well-being after rehabilitation than the control group.
Secondary outcomes
1.Educational group programmes
Three studies from 1 trial compared the profile of mood states after a self-management group programme with a waiting list condition and a tape-recorded education programme (Table 4).16-18 The self-management programme was effective in improving mood immediately after the intervention. This effect was retained at six-month follow-up. Brody et al.16-18 also reported on self-efficacy. Participants in the self-management programme reported increased self-efficacy not only immediately after the intervention, but also at six-months follow-up. Dahlin-Ivanoff et al.19 found differences in the level of perceived security between the health education group and the individual intervention group in several occupations at the 4 months’ evaluation (Table 4). Eklund et al.20 found comparable results at the 28-months’ evaluation, indicating long term stability of the improvement of perceived security in daily activities after following a health education programme (Table 4).
2.Methods of enhancing vision
No secondary outcomes were reported.
3.Vision rehabilitation programmes
Data could not be extracted from McCabe et al.15 and Pankow et al.14 The authors did not find significant differences between the family focused and individually focused interventions on patient’s self reports of difficulty and dependency in performing daily activities, which was measured with the Functional Assessment Questionnaire. However, the sample size did not provide adequate statistical power. Pankow et al.14 found that participants receiving a rehabilitation programme performed more independently on living skills after rehabilitation than the control group, but they performed equally independent on Orientation and Mobility Skills.
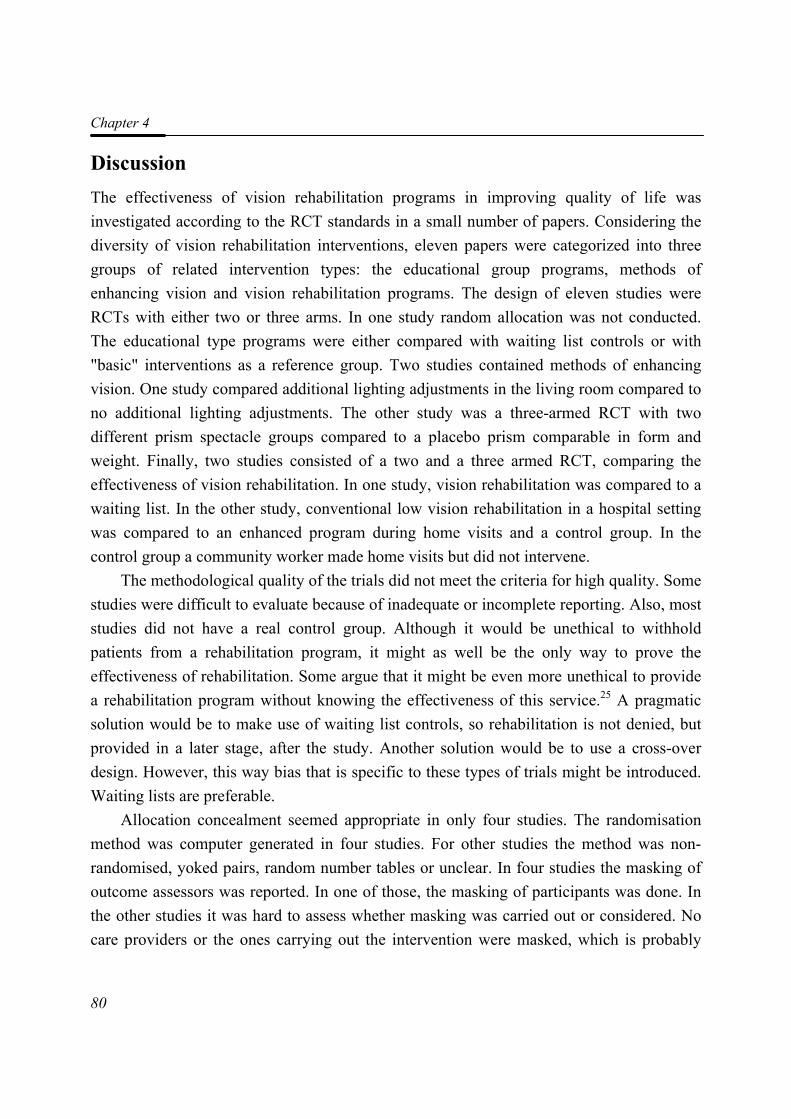
Chapter 4
80
Discussion The effectiveness of vision rehabilitation programs in improving quality of life was investigated according to the RCT standards in a small number of papers. Considering the diversity of vision rehabilitation interventions, eleven papers were categorized into three groups of related intervention types: the educational group programs, methods of enhancing vision and vision rehabilitation programs. The design of eleven studies were RCTs with either two or three arms. In one study random allocation was not conducted. The educational type programs were either compared with waiting list controls or with "basic" interventions as a reference group. Two studies contained methods of enhancing vision. One study compared additional lighting adjustments in the living room compared to no additional lighting adjustments. The other study was a three-armed RCT with two different prism spectacle groups compared to a placebo prism comparable in form and weight. Finally, two studies consisted of a two and a three armed RCT, comparing the effectiveness of vision rehabilitation. In one study, vision rehabilitation was compared to a waiting list. In the other study, conventional low vision rehabilitation in a hospital setting was compared to an enhanced program during home visits and a control group. In the control group a community worker made home visits but did not intervene.
The methodological quality of the trials did not meet the criteria for high quality. Some studies were difficult to evaluate because of inadequate or incomplete reporting. Also, most studies did not have a real control group. Although it would be unethical to withhold patients from a rehabilitation program, it might as well be the only way to prove the effectiveness of rehabilitation. Some argue that it might be even more unethical to provide a rehabilitation program without knowing the effectiveness of this service.25 A pragmatic solution would be to make use of waiting list controls, so rehabilitation is not denied, but provided in a later stage, after the study. Another solution would be to use a cross-over design. However, this way bias that is specific to these types of trials might be introduced. Waiting lists are preferable.
Allocation concealment seemed appropriate in only four studies. The randomisation method was computer generated in four studies. For other studies the method was non-randomised, yoked pairs, random number tables or unclear. In four studies the masking of outcome assessors was reported. In one of those, the masking of participants was done. In the other studies it was hard to assess whether masking was carried out or considered. No care providers or the ones carrying out the intervention were masked, which is probably
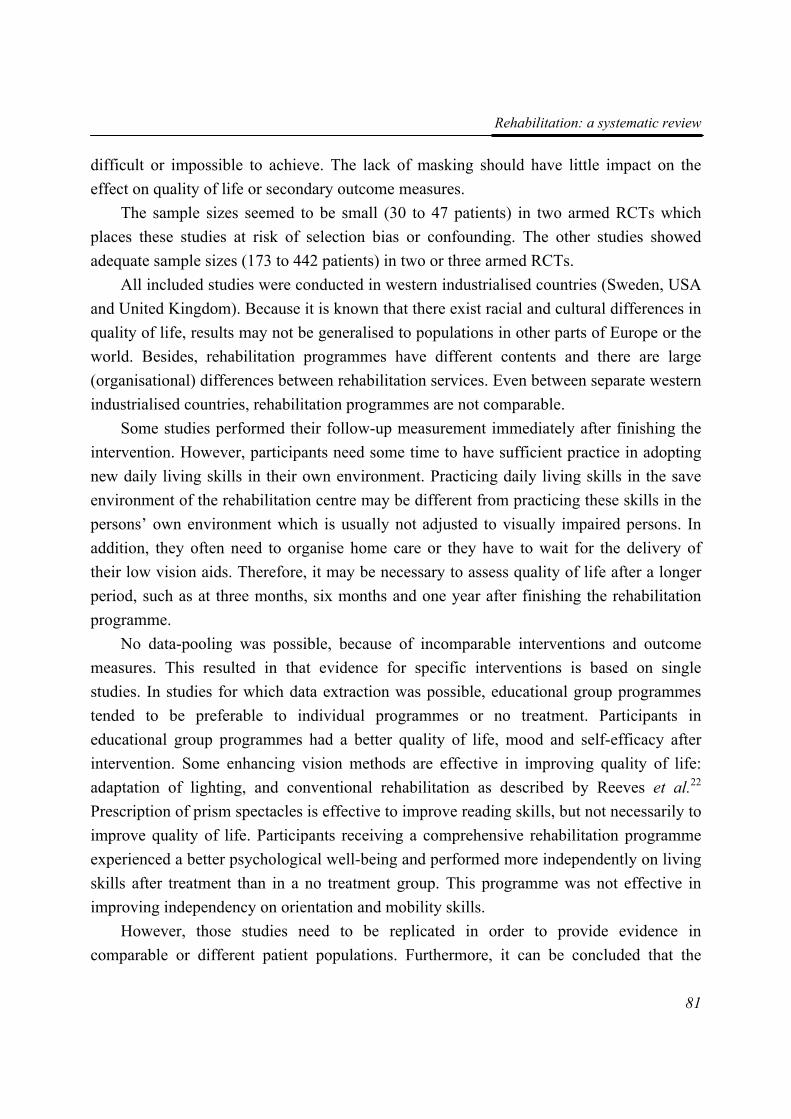
Rehabilitation: a systematic review
81
difficult or impossible to achieve. The lack of masking should have little impact on the effect on quality of life or secondary outcome measures.
The sample sizes seemed to be small (30 to 47 patients) in two armed RCTs which places these studies at risk of selection bias or confounding. The other studies showed adequate sample sizes (173 to 442 patients) in two or three armed RCTs.
All included studies were conducted in western industrialised countries (Sweden, USA and United Kingdom). Because it is known that there exist racial and cultural differences in quality of life, results may not be generalised to populations in other parts of Europe or the world. Besides, rehabilitation programmes have different contents and there are large (organisational) differences between rehabilitation services. Even between separate western industrialised countries, rehabilitation programmes are not comparable.
Some studies performed their follow-up measurement immediately after finishing the intervention. However, participants need some time to have sufficient practice in adopting new daily living skills in their own environment. Practicing daily living skills in the save environment of the rehabilitation centre may be different from practicing these skills in the persons’ own environment which is usually not adjusted to visually impaired persons. In addition, they often need to organise home care or they have to wait for the delivery of their low vision aids. Therefore, it may be necessary to assess quality of life after a longer period, such as at three months, six months and one year after finishing the rehabilitation programme.
No data-pooling was possible, because of incomparable interventions and outcome measures. This resulted in that evidence for specific interventions is based on single studies. In studies for which data extraction was possible, educational group programmes tended to be preferable to individual programmes or no treatment. Participants in educational group programmes had a better quality of life, mood and self-efficacy after intervention. Some enhancing vision methods are effective in improving quality of life: adaptation of lighting, and conventional rehabilitation as described by Reeves et al.22 Prescription of prism spectacles is effective to improve reading skills, but not necessarily to improve quality of life. Participants receiving a comprehensive rehabilitation programme experienced a better psychological well-being and performed more independently on living skills after treatment than in a no treatment group. This programme was not effective in improving independency on orientation and mobility skills.
However, those studies need to be replicated in order to provide evidence in comparable or different patient populations. Furthermore, it can be concluded that the
Chapter 4
82
eleven studies that were included in the review can be considered a good start of obtaining evidence for low vision rehabilitation. It is important to know whether the interventions really contribute to the quality of life of patients or that we merely have the feeling that it works. On the other hand, it is just a start. A lot of work still has to be done to deliver high quality randomised controlled trials in the field of low vision rehabilitation. This is the only way to develop better rehabilitation programs and to remain up to date to the patients’ needs.
Reviewers' conclusions
Implications for practice
Clinical practice of patients, patient organisations and rehabilitation workers suggests that the need for rehabilitation programmes for visually impaired adults is self-evident. The evidence from randomised controlled trials that already exists does support the positive effect of rehabilitation on vision-related quality of life. However, this evidence is based on single studies, and the results should be confirmed in other studies. Therefore, more quantitative outcomes of rehabilitation are needed to identify which programmes are more successful and useful. Such results would help rehabilitation workers in choosing the most appropriate programme or to adjust existing programmes.
Some information was available about the long-term effects of rehabilitation. Not all improvements remained stable on long term. This might indicate the need for (better) aftercare programmes or clinical follow-up of patients.
Implications for research
Further work is required to determine which rehabilitation programmes are most successful in quality of life outcome in visually impaired adults. RCTs need to be set up to provide evidence for already available rehabilitation programmes. Also, the cost-effectiveness of separate parts of the rehabilitation process has to be taken into account in those studies. It would not be ethical to spend many resources on an ineffective rehabilitation programme, where more benefits could be obtained from other programmes. The complexity and diversity of patients’ needs makes it necessary to adapt any rehabilitation programme to individual patient profiles. Research should be conducted on prognostic factors to develop those patient profiles for specific rehabilitation programmes.
Rehabilitation: a systematic review
83
Other areas that particularly need to be addressed include aftercare programmes. The effect of those programmes should be examined in randomised clinical trials if ethically possible.
As the prevalence of visually impairments in working age adults is low, the authors encourage cooperating with other research groups (national or international) in finding more and stronger evidence for the effect of rehabilitation programmes.
Acknowledgements We would like to thank al the study authors who responded to requests for additional information. We are grateful to Hans Ket and Ingrid Riphagen, clinical librerians of the VU University Medical Centre, for creating the search strategies and running them. We would also like to thank Catey Bunce, Tianjing Li and Gianni Virgili for their peer review comments on the protocol.
References 1. Resnikoff S, Pascolini D, Etya'ale D, Kocur I, Pararajasegaram R, Pokharel GP and
Mariotti SP. (2004). Global data on visual impairment in the year 2002. Bulletin of the World Health Organization. 82 (11): 844-851.
2. Limburg H, den Boon JM, Hogeweg M, Gevers RJ, Keunen JE and ten Hove GT. (2005). [Avoidable visual impairment in The Netherlands: the project "Vision 2020 Netherlands" of the World Health Organization]. Nederlands Tijdschrift Voor Geneeskunde. 149 (11): 577-582.
3. Melief WBAM and Gorter KA. (1998). Slechtzienden en blinden in Nederland.Deelrapport I: Aantallen en kenmerken. Utrecht: Verwey-Jonker Instituut.
4. de Boer MR, Langelaan M, Jansonius NM and van Rens GHMB. (2005). Evidence-based guidelines on the referral of visually impaired persons to low vision services. European Journal of Ophthalmology. 15 (3): 400-406.
5. Burggraaff MC, van Nispen RMA, de Boer MR and van Rens GHMB. (2005). Optometric and Multidisciplinary Approaches in Prescribing Low Vision Aids. Visual Impairment Research. 7 (2-3): 1-8.
6. Harper R, Doorduyn K, Reeves B and Slater L. (1999). Evaluating the outcomes of low vision rehabilitation. Ophthalmic and Physiological Optics. 19 (1): 3-11.
7. Scott IU, Smiddy WE, Schiffman J, Feuer WJ and Pappas CJ. (1999). Quality of life of low-vision patients and the impact of low-vision services. American Journal of Ophthalmology. 128 (1): 54-62.
Chapter 4
84
8. Massof RW and Rubin GS. (2001). Visual function assessment questionnaires. Survey of Ophthalmology. 45 (6): 531-548.
9. Stelmack J. (2001). Quality of life of low-vision patients and outcomes of low-vision rehabilitation. Optometry and Vision Science. 78 (5): 335-342.
10. (2005). Cochrane Handbook for Systematic Reviews of Interventions. 4.2.5 [updated May 2005] ed. Chichester, UK: John Wiley & Sons, Ltd.
11. Deeks JJ, Higgins JPT and Altman DG.(2005). Analysing and presenting results. In: Higgins JPT, Green S, eds. Cochrane Handbook for Systematic Reviews 4.2.5. Chichester, UK: John Wiley & Sons, Ltd;
12. Birk T, Hickl S, Wahl HW, Kammerer A, Miller D, Holz F and Becker S. (2004). [A psychosocial training program for elderly patients with age-related macular degeneration: findings of a pilot evaluation study]. Z Gerontol Geriatr. 37 (5): 363-365.
13. Brunnstrom G, Sorensen S, Alsterstad K and Sjostrand J. (2004). Quality of light and quality of life--the effect of lighting adaptation among people with low vision. Ophthalmic and Physiological Optics. 24 (4): 274-280.
14. Pankow L, Luchins D, Studebaker J and Chettleburgh D. (2004). Evaluation of a vision rehabilitation program for older adults with visual impairment. Topics in Geriatric Rehabilitation. 20 (3): 223-232.
15. McCabe P, Nason F, Demers TP, Friedman D and Seddon JM. (2000). Evaluating the effectiveness of a vision rehabilitation intervention using an objective and subjective measure of functional performance. Ophthalmic Epidemiology. 7 (4): 259-270.
16. Brody BL, Williams RA, Thomas RG, Kaplan RM, Chu RM and Brown SI. (1999). Age-related macular degeneration: a randomized clinical trial of a self-management intervention. Annals of Behavioral Medicine. 21 (4): 322-329.
17. Brody BL, Roch-Levecq AC, Gamst AC, Maclean K, Kaplan RM and Brown SI. (2002). Self-management of age-related macular degeneration and quality of life: a randomized controlled trial. Archives of Ophthalmology. 120 (11): 1477-1483.
18. Brody BL, Roch-Levecq AC, Thomas RG, Kaplan RM and Brown SI. (2005). Self-management of age-related macular degeneration at the 6-month follow-up: a randomized controlled trial. Archives of Ophthalmology. 123 (1): 46-53.
19. Dahlin-Ivanoff S, Sonn U and Svensson E. (2002). A health education program for elderly persons with visual impairments and perceived security in the performance of daily occupations: a randomized study. American Journal of Occupational Therapy. 56 (3): 322-330.
20. Eklund K, Sonn U and Dahlin-Ivanoff S. (2004). Long-term evaluation of a health education programme for elderly persons with visual impairment. A randomized study. Disability and Rehabilitation. 26 (7): 401-409.
Rehabilitation: a systematic review
85
21. Griffin-Shirley N. (1994). The effects of rehabilitation training of visually impaired older adults on self-efficacy, depression, activities of daily living, attitudes about blindness, and social support networks. Dissertation Abstracts International Section A: Humanities and Social Sciences. 54(8-A).
22. Reeves BC, Harper RA and Russell WB. (2004). Enhanced low vision rehabilitation for people with age related macular degeneration: a randomised controlled trial. British Journal of Ophthalmology. 88 (11): 1443-1449.
23. Smith HJ, Dickinson CM, Cacho I, Reeves BC and Harper RA. (2005). A randomized controlled trial to determine the effectiveness of prism spectacles for patients with age-related macular degeneration. Archives of Ophthalmology. 123 (8): 1042-1050.
24. Cowen E, Underberg R and Verrillo R. (1958). The development and testing of an attitude to blindness scale. The Journal of Social Psychology. 48 297-304.
25. Health Council. (2000). Van implementeren naar leren: het belang van tweerichtingsverkeer tussen praktijk en wetenschap in de gezondheidszorg. Publication nr 2000/18. The Hague: Health Council.
26. Anonymous. (2005). Program helps relieve distress of age-related eye disease. Harv Womens Health Watch. 12 (10): 7.
27. Campbell AJ, Robertson MC, La Grow SJ, Kerse NM, Sanderson GF, Jacobs RJ, Sharp DM and Hale LA. (2005). Randomised controlled trial of prevention of falls in people aged > or =75 with severe visual impairment: the VIP trial. British Medical Journal. 331 (7520): 817.
28. Eklund K, Sonn U, Nystedt P and Dahlin-Ivanoff S. (2005). A cost-effectiveness analysis of a health education programme for elderly persons with age-related macular degeneration: a longitudinal study. Disability and Rehabilitation. 27 (20): 1203-1212.
29. Gray SF, Spencer IC, Spry PG, Brookes ST, Baker IA, Peters TJ, Sparrow JM and Easty DL. (1997). The Bristol Shared Care Glaucoma Study--validity of measurements and patient satisfaction. Journal of Public Health Medicine. 19 (4): 431-436.
30. Kupfer C. (1999). The Low Vision Education Program: improving quality of life. Optometry and Vision Science. 76 (11): 729-730.
31. Kupfer C. (2000). The National Eye Institute's low vision education program: improving quality of life. Ophthalmology. 107 (2): 229-230.
32. Lincoln NB, Whiting SE, Cockburn J and Bhavnani G. (1985). An evaluation of perceptual retraining. International Rehabilitation Medicine. 7 (3): 99-110.
33. Pambakian AL, Mannan SK, Hodgson TL and Kennard C. (2004). Saccadic visual search training: a treatment for patients with homonymous hemianopia. Journal of Neurology, Neurosurgery and Psychiatry. 75 (10): 1443-1448.
Chapter 4
86
34. Peterson RC, Wolffsohn JS, Rubinstein M and Lowe J. (2003). Benefits of electronic vision enhancement systems (EVES) for the visually impaired. American Journal of Ophthalmology. 136 (6): 1129-1135.
35. Raasch TW, Leat SJ, Kleinstein RN, Bullimore MA and Cutter GR. (1997). Evaluating the value of low-vision services. Journal of the American Optometric Association. 68 (5): 287-295.
36. Rogers P, Menchetti B and Lai SC. (2000). Using existing databases to evaluate rehabilitation outcomes of older persons who are visually impaired. Journal of Visual Impairment and Blindness. 94 (5): 338-342.
37. Rollins G. (2003). Self-management improves functioning for age-related macular degeneration patients. Rep Med Guidel Outcomes Res. 14 (1): 9-10, 12.
38. Rumrill PD, Jr. (1999). Effects of a social competence training program on accommodation request activity, situational self-efficacy, and Americans with disabilities act knowledge among employed people with visual impairments and blindness. Journal of Vocational Rehabilitation. 12 (1): 25-31.
39. Russell W, Harper R, Reeves B, Waterman H, Henson D and McLeod D. (2001). Randomised controlled trial of an integrated versus an optometric low vision rehabilitation service for patients with age-related macular degeneration: study design and methodology. Ophthalmic and Physiological Optics. 21 (1): 36-44.
40. Simonsz HJ, van Els J, Ruijter JM, Bakker D and Spekreijse H. (2001). Preliminary report: prescription of prism-glasses by the Measurement and Correction Method of H.-J. Haase or by conventional orthoptic examination: a multicenter, randomized, double-blind, cross-over study. Strabismus. 9 (1): 17-27.
41. Szlyk JP, Seiple W, Laderman DJ, Kelsch R, Stelmack J and McMahon T. (2000). Measuring the effectiveness of bioptic telescopes for persons with central vision loss. Journal of Rehabilitation Research and Development. 37 (1): 101-108.
42. Vijayakumar V, John RK, Datta D, Thulasiraj RD and Nirmalan PK. (2004). Quality of life after community-based rehabilitation for blind persons in a rural population of South India. Indian Journal of Ophthalmology. 52 (4): 331-335.
43. Birk T, Hickl S, Wahl HW, Miller D, Kammerer A, Holz F, Becker S and Volcker HE. (2004). Development and pilot evaluation of a psychosocial intervention program for patients with age-related macular degeneration. Gerontologist. 44 (6): 836-843.
44. West SK, Friedman D, Munoz B, Roche KB, Park W, Deremeik J, Massof R, Frick KD, Broman A, McGill W, Gilbert D and German P. (2003). A randomized trial of visual impairment interventions for nursing home residents: study design, baseline characteristics and visual loss. Ophthalmic Epidemiology. 10 (3): 193-209.
45. Griffin-Shirley N. (1993). The effects of rehabilitation training of visually impaired older adults on self-efficacy, depression, activities of daily living, attitudes about blindness, and

Rehabilitation: a systematic review
87
social support networks. Dissertation Abstracts International Section A: Humanities and Social Sciences. 54(8-A).
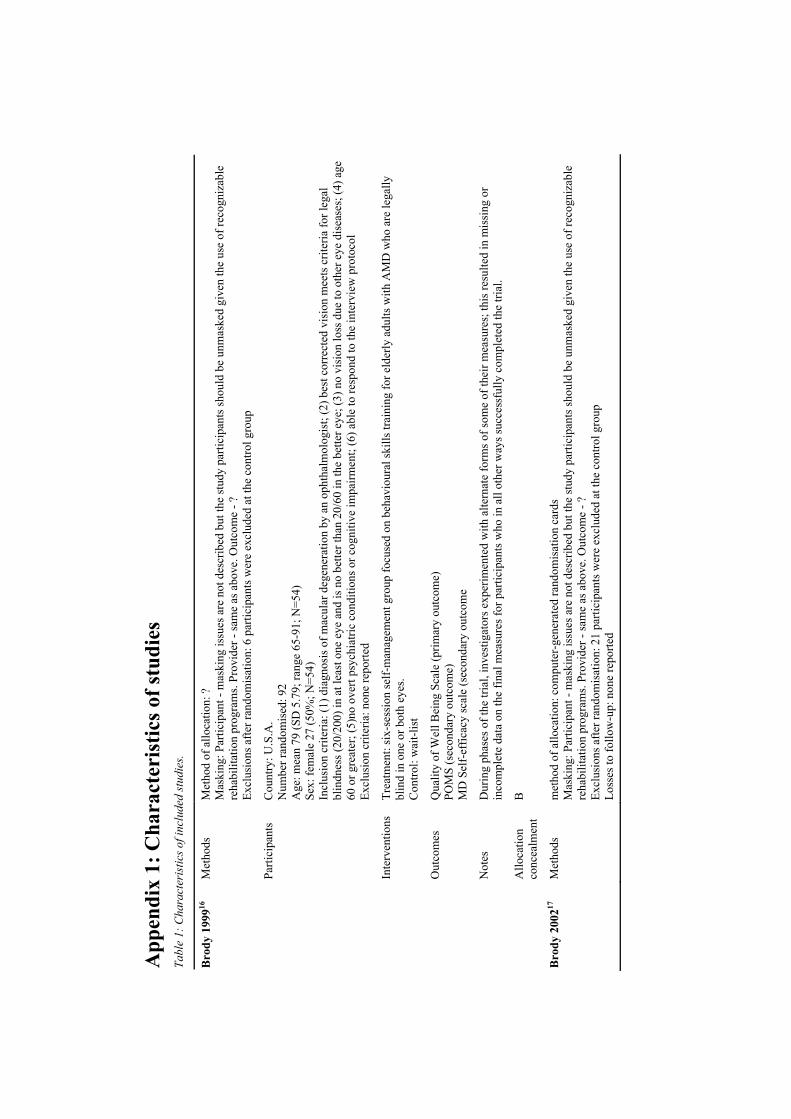
App
endi
x 1:
Cha
ract
eris
tics o
f stu
dies
Ta
ble
1: C
hara
cter
istic
s of i
nclu
ded
stud
ies.
Met
hods
M
etho
d of
allo
catio
n: ?
M
aski
ng: P
artic
ipan
t - m
aski
ng is
sues
are
not
des
crib
ed b
ut th
e st
udy
parti
cipa
nts s
houl
d be
unm
aske
d gi
ven
the
use
of re
cogn
izab
le
reha
bilit
atio
n pr
ogra
ms.
Prov
ider
- sa
me
as a
bove
. Out
com
e - ?
Ex
clus
ions
afte
r ran
dom
isat
ion:
6 p
artic
ipan
ts w
ere
excl
uded
at t
he c
ontro
l gro
up
Parti
cipa
nts
Cou
ntry
: U.S
.A.
Num
ber r
ando
mis
ed: 9
2 A
ge: m
ean
79 (S
D 5
.79;
rang
e 65
-91;
N=5
4)
Sex:
fem
ale
27 (5
0%; N
=54)
In
clus
ion
crite
ria: (
1) d
iagn
osis
of m
acul
ar d
egen
erat
ion
by a
n op
htha
lmol
ogis
t; (2
) bes
t cor
rect
ed v
isio
n m
eets
crit
eria
for l
egal
bl
indn
ess (
20/2
00) i
n at
leas
t one
eye
and
is n
o be
tter t
han
20/6
0 in
the
bette
r eye
; (3)
no
visi
on lo
ss d
ue to
oth
er e
ye d
isea
ses;
(4) a
ge
60 o
r gre
ater
; (5)
no o
vert
psyc
hiat
ric c
ondi
tions
or c
ogni
tive
impa
irmen
t; (6
) abl
e to
resp
ond
to th
e in
terv
iew
pro
toco
l Ex
clus
ion
crite
ria: n
one
repo
rted
Inte
rven
tions
Tr
eatm
ent:
six-
sess
ion
self-
man
agem
ent g
roup
focu
sed
on b
ehav
iour
al sk
ills t
rain
ing
for e
lder
ly a
dults
with
AM
D w
ho a
re le
gally
bl
ind
in o
ne o
r bot
h ey
es.
Con
trol:
wai
t-lis
t
Out
com
es
Qua
lity
of W
ell B
eing
Sca
le (p
rimar
y ou
tcom
e)
POM
S (s
econ
dary
out
com
e)
MD
Sel
f-ef
ficac
y sc
ale
(sec
onda
ry o
utco
me
Not
es
Dur
ing
phas
es o
f the
tria
l, in
vest
igat
ors e
xper
imen
ted
with
alte
rnat
e fo
rms o
f som
e of
thei
r mea
sure
s; th
is re
sulte
d in
mis
sing
or
inco
mpl
ete
data
on
the
final
mea
sure
s for
par
ticip
ants
who
in a
ll ot
her w
ays s
ucce
ssfu
lly c
ompl
eted
the
trial
.
Bro
dy 1
99916
Allo
catio
n co
ncea
lmen
t B
Bro
dy 2
00217
M
etho
ds
met
hod
of a
lloca
tion:
com
pute
r-ge
nera
ted
rand
omis
atio
n ca
rds
Mas
king
: Par
ticip
ant -
mas
king
issu
es a
re n
ot d
escr
ibed
but
the
stud
y pa
rtici
pant
s sho
uld
be u
nmas
ked
give
n th
e us
e of
reco
gniz
able
re
habi
litat
ion
prog
ram
s. Pr
ovid
er -
sam
e as
abo
ve. O
utco
me
- ?
Excl
usio
ns a
fter r
ando
mis
atio
n: 2
1 pa
rtici
pant
s wer
e ex
clud
ed a
t the
con
trol g
roup
Lo
sses
to fo
llow
-up:
non
e re
porte
d
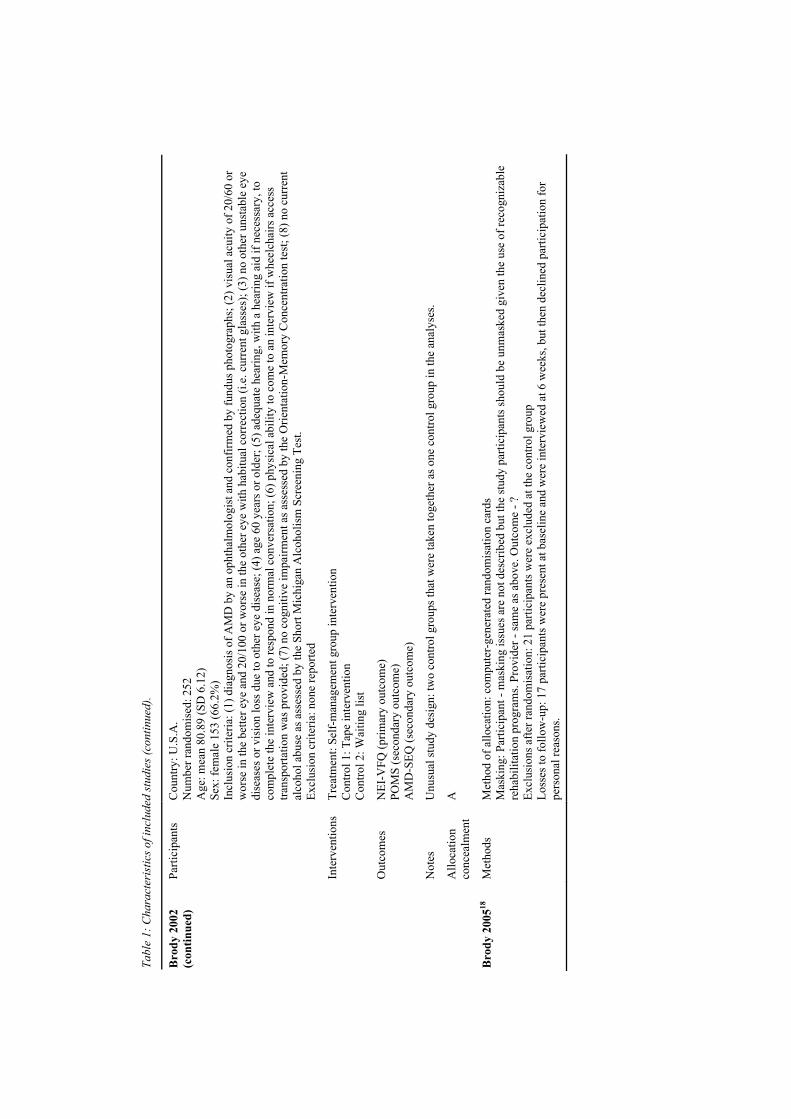
Tabl
e 1:
Cha
ract
eris
tics o
f inc
lude
d st
udie
s (co
ntin
ued)
.
Parti
cipa
nts
Cou
ntry
: U.S
.A.
Num
ber r
ando
mis
ed: 2
52
Age
: mea
n 80
.89
(SD
6.1
2)
Sex:
fem
ale
153
(66.
2%)
Incl
usio
n cr
iteria
: (1)
dia
gnos
is o
f AM
D b
y an
oph
thal
mol
ogis
t and
con
firm
ed b
y fu
ndus
pho
togr
aphs
; (2)
vis
ual a
cuity
of 2
0/60
or
wor
se in
the
bette
r eye
and
20/
100
or w
orse
in th
e ot
her e
ye w
ith h
abitu
al c
orre
ctio
n (i.
e. c
urre
nt g
lass
es);
(3) n
o ot
her u
nsta
ble
eye
dise
ases
or v
isio
n lo
ss d
ue to
oth
er e
ye d
isea
se; (
4) a
ge 6
0 ye
ars o
r old
er; (
5) a
dequ
ate
hear
ing,
with
a h
earin
g ai
d if
nece
ssar
y, to
co
mpl
ete
the
inte
rvie
w a
nd to
resp
ond
in n
orm
al c
onve
rsat
ion;
(6) p
hysi
cal a
bilit
y to
com
e to
an
inte
rvie
w if
whe
elch
airs
acc
ess
trans
porta
tion
was
pro
vide
d; (7
) no
cogn
itive
impa
irmen
t as a
sses
sed
by th
e O
rient
atio
n-M
emor
y C
once
ntra
tion
test
; (8)
no
curr
ent
alco
hol a
buse
as a
sses
sed
by th
e Sh
ort M
ichi
gan
Alc
ohol
ism
Scr
eeni
ng T
est.
Excl
usio
n cr
iteria
: non
e re
porte
d In
terv
entio
ns
Trea
tmen
t: Se
lf-m
anag
emen
t gro
up in
terv
entio
n C
ontro
l 1: T
ape
inte
rven
tion
Con
trol 2
: Wai
ting
list
Out
com
es
NEI
-VFQ
(prim
ary
outc
ome)
PO
MS
(sec
onda
ry o
utco
me)
A
MD
-SEQ
(sec
onda
ry o
utco
me)
N
otes
U
nusu
al st
udy
desi
gn: t
wo
cont
rol g
roup
s tha
t wer
e ta
ken
toge
ther
as o
ne c
ontro
l gro
up in
the
anal
yses
.
Bro
dy 2
002
(con
tinue
d)
Allo
catio
n co
ncea
lmen
t A
Bro
dy 2
00518
M
etho
ds
Met
hod
of a
lloca
tion:
com
pute
r-gen
erat
ed ra
ndom
isat
ion
card
s M
aski
ng: P
artic
ipan
t - m
aski
ng is
sues
are
not
des
crib
ed b
ut th
e st
udy
parti
cipa
nts s
houl
d be
unm
aske
d gi
ven
the
use
of re
cogn
izab
le
reha
bilit
atio
n pr
ogra
ms.
Prov
ider
- sa
me
as a
bove
. Out
com
e - ?
Ex
clus
ions
afte
r ran
dom
isat
ion:
21
parti
cipa
nts w
ere
excl
uded
at t
he c
ontro
l gro
up
Loss
es to
follo
w-u
p: 1
7 pa
rtici
pant
s wer
e pr
esen
t at b
asel
ine
and
wer
e in
terv
iew
ed a
t 6 w
eeks
, but
then
dec
lined
par
ticip
atio
n fo
r pe
rson
al re
ason
s.
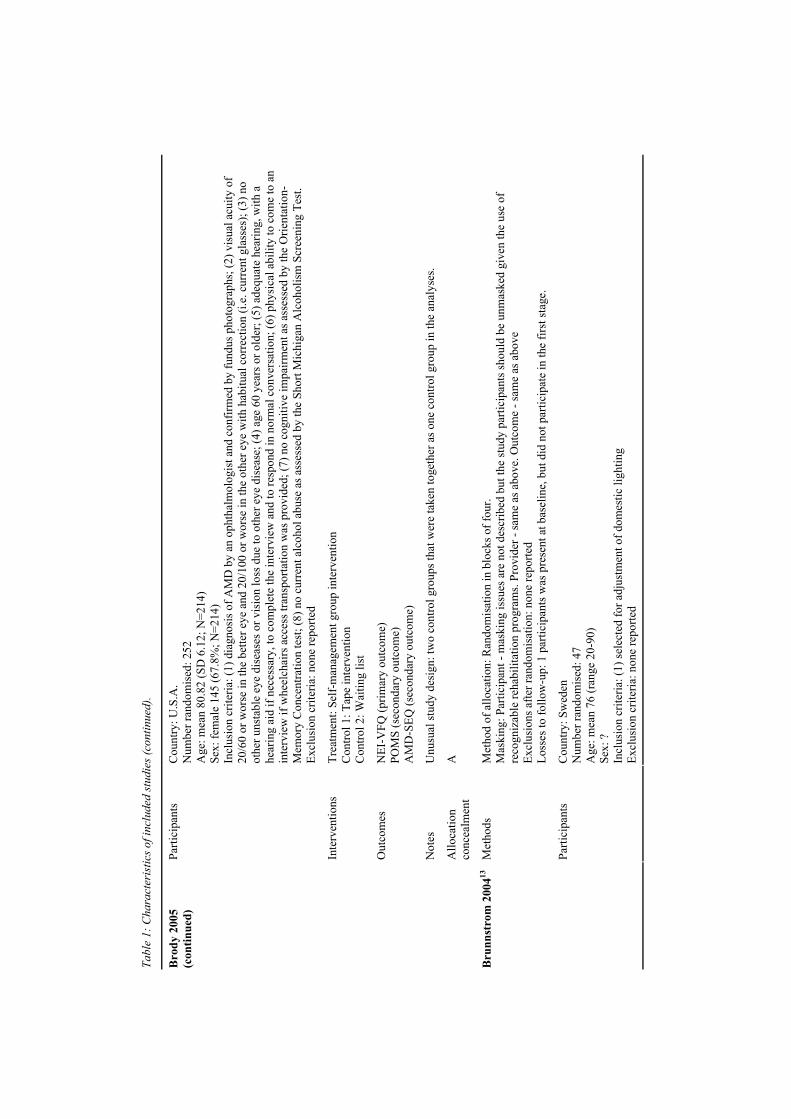
Tabl
e 1:
Cha
ract
eris
tics o
f inc
lude
d st
udie
s (co
ntin
ued)
.
Parti
cipa
nts
Cou
ntry
: U.S
.A.
Num
ber r
ando
mis
ed: 2
52
Age
: mea
n 80
.82
(SD
6.1
2; N
=214
) Se
x: fe
mal
e 14
5 (6
7.8%
; N=2
14)
Incl
usio
n cr
iteria
: (1)
dia
gnos
is o
f AM
D b
y an
oph
thal
mol
ogis
t and
con
firm
ed b
y fu
ndus
pho
togr
aphs
; (2)
vis
ual a
cuity
of
20/6
0 or
wor
se in
the
bette
r eye
and
20/
100
or w
orse
in th
e ot
her e
ye w
ith h
abitu
al c
orre
ctio
n (i.
e. c
urre
nt g
lass
es);
(3) n
o ot
her u
nsta
ble
eye
dise
ases
or v
isio
n lo
ss d
ue to
oth
er e
ye d
isea
se; (
4) a
ge 6
0 ye
ars o
r old
er; (
5) a
dequ
ate
hear
ing,
with
a
hear
ing
aid
if ne
cess
ary,
to c
ompl
ete
the
inte
rvie
w a
nd to
resp
ond
in n
orm
al c
onve
rsat
ion;
(6) p
hysi
cal a
bilit
y to
com
e to
an
inte
rvie
w if
whe
elch
airs
acc
ess t
rans
porta
tion
was
pro
vide
d; (7
) no
cogn
itive
impa
irmen
t as a
sses
sed
by th
e O
rient
atio
n-M
emor
y C
once
ntra
tion
test
; (8)
no
curr
ent a
lcoh
ol a
buse
as a
sses
sed
by th
e Sh
ort M
ichi
gan
Alc
ohol
ism
Scr
eeni
ng T
est.
Excl
usio
n cr
iteria
: non
e re
porte
d In
terv
entio
ns
Trea
tmen
t: Se
lf-m
anag
emen
t gro
up in
terv
entio
n C
ontro
l 1: T
ape
inte
rven
tion
Con
trol 2
: Wai
ting
list
Out
com
es
NEI
-VFQ
(prim
ary
outc
ome)
PO
MS
(sec
onda
ry o
utco
me)
A
MD
-SEQ
(sec
onda
ry o
utco
me)
N
otes
U
nusu
al st
udy
desi
gn: t
wo
cont
rol g
roup
s tha
t wer
e ta
ken
toge
ther
as o
ne c
ontro
l gro
up in
the
anal
yses
.
Bro
dy 2
005
(con
tinue
d)
Allo
catio
n co
ncea
lmen
t A
Met
hods
M
etho
d of
allo
catio
n: R
ando
mis
atio
n in
blo
cks o
f fou
r. M
aski
ng: P
artic
ipan
t - m
aski
ng is
sues
are
not
des
crib
ed b
ut th
e st
udy
parti
cipa
nts s
houl
d be
unm
aske
d gi
ven
the
use
of
reco
gniz
able
reha
bilit
atio
n pr
ogra
ms.
Prov
ider
- sa
me
as a
bove
. Out
com
e - s
ame
as a
bove
Ex
clus
ions
afte
r ran
dom
isat
ion:
non
e re
porte
d Lo
sses
to fo
llow
-up:
1 p
artic
ipan
ts w
as p
rese
nt a
t bas
elin
e, b
ut d
id n
ot p
artic
ipat
e in
the
first
stag
e.
Bru
nnst
rom
200
413
Parti
cipa
nts
Cou
ntry
: Sw
eden
N
umbe
r ran
dom
ised
: 47
Age
: mea
n 76
(ran
ge 2
0-90
) Se
x: ?
In
clus
ion
crite
ria: (
1) se
lect
ed fo
r adj
ustm
ent o
f dom
estic
ligh
ting
Excl
usio
n cr
iteria
: non
e re
porte
d
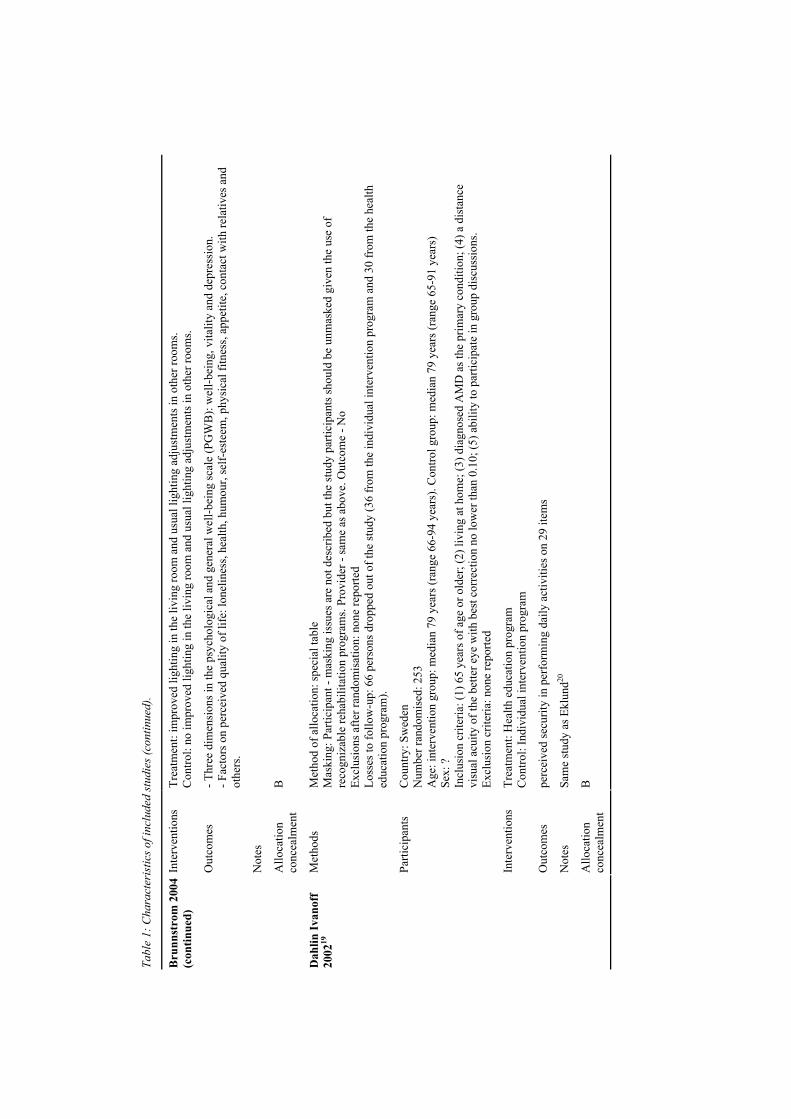
Tabl
e 1:
Cha
ract
eris
tics o
f inc
lude
d st
udie
s (co
ntin
ued)
.
Inte
rven
tions
Tr
eatm
ent:
impr
oved
ligh
ting
in th
e liv
ing
room
and
usu
al li
ghtin
g ad
just
men
ts in
oth
er ro
oms.
Con
trol:
no im
prov
ed li
ghtin
g in
the
livin
g ro
om a
nd u
sual
ligh
ting
adju
stm
ents
in o
ther
room
s. O
utco
mes
- T
hree
dim
ensi
ons i
n th
e ps
ycho
logi
cal a
nd g
ener
al w
ell-b
eing
scal
e (P
GW
B):
wel
l-bei
ng, v
italit
y an
d de
pres
sion
. - F
acto
rs o
n pe
rcei
ved
qual
ity o
f life
: lon
elin
ess,
heal
th, h
umou
r, se
lf-es
teem
, phy
sica
l fitn
ess,
appe
tite,
con
tact
with
rela
tives
and
ot
hers
. N
otes
Bru
nnst
rom
200
4 (c
ontin
ued)
Allo
catio
n co
ncea
lmen
t B
Met
hods
M
etho
d of
allo
catio
n: sp
ecia
l tab
le
Mas
king
: Par
ticip
ant -
mas
king
issu
es a
re n
ot d
escr
ibed
but
the
stud
y pa
rtici
pant
s sho
uld
be u
nmas
ked
give
n th
e us
e of
re
cogn
izab
le re
habi
litat
ion
prog
ram
s. Pr
ovid
er -
sam
e as
abo
ve. O
utco
me
- No
Excl
usio
ns a
fter r
ando
mis
atio
n: n
one
repo
rted
Loss
es to
follo
w-u
p: 6
6 pe
rson
s dro
pped
out
of t
he st
udy
(36
from
the
indi
vidu
al in
terv
entio
n pr
ogra
m a
nd 3
0 fr
om th
e he
alth
ed
ucat
ion
prog
ram
). Pa
rtici
pant
s C
ount
ry: S
wed
en
Num
ber r
ando
mis
ed: 2
53
Age
: int
erve
ntio
n gr
oup:
med
ian
79 y
ears
(ran
ge 6
6-94
yea
rs).
Con
trol g
roup
: med
ian
79 y
ears
(ran
ge 6
5-91
yea
rs)
Sex:
?
Incl
usio
n cr
iteria
: (1)
65
year
s of a
ge o
r old
er; (
2) li
ving
at h
ome;
(3) d
iagn
osed
AM
D a
s the
prim
ary
cond
ition
; (4)
a d
ista
nce
visu
al a
cuity
of t
he b
ette
r eye
with
bes
t cor
rect
ion
no lo
wer
than
0.1
0; (5
) abi
lity
to p
artic
ipat
e in
gro
up d
iscu
ssio
ns.
Excl
usio
n cr
iteria
: non
e re
porte
d In
terv
entio
ns
Trea
tmen
t: H
ealth
edu
catio
n pr
ogra
m
Con
trol:
Indi
vidu
al in
terv
entio
n pr
ogra
m
Out
com
es
perc
eive
d se
curit
y in
per
form
ing
daily
act
iviti
es o
n 29
item
s N
otes
Sa
me
stud
y as
Ekl
und20
Dah
lin Iv
anof
f 20
0219
Allo
catio
n co
ncea
lmen
t B
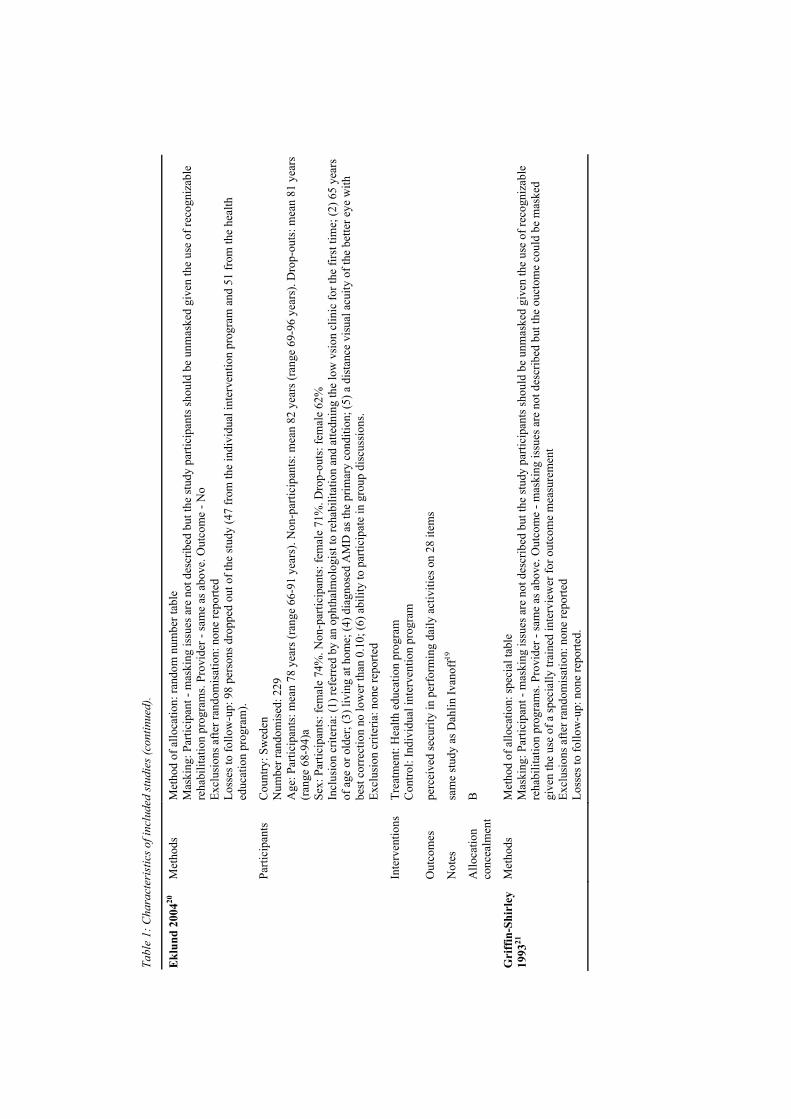
Tabl
e 1:
Cha
ract
eris
tics o
f inc
lude
d st
udie
s (co
ntin
ued)
.
Met
hods
M
etho
d of
allo
catio
n: ra
ndom
num
ber t
able
M
aski
ng: P
artic
ipan
t - m
aski
ng is
sues
are
not
des
crib
ed b
ut th
e st
udy
parti
cipa
nts s
houl
d be
unm
aske
d gi
ven
the
use
of re
cogn
izab
le
reha
bilit
atio
n pr
ogra
ms.
Prov
ider
- sa
me
as a
bove
. Out
com
e - N
o Ex
clus
ions
afte
r ran
dom
isat
ion:
non
e re
porte
d Lo
sses
to fo
llow
-up:
98
pers
ons d
ropp
ed o
ut o
f the
stud
y (4
7 fr
om th
e in
divi
dual
inte
rven
tion
prog
ram
and
51
from
the
heal
th
educ
atio
n pr
ogra
m).
Parti
cipa
nts
Cou
ntry
: Sw
eden
N
umbe
r ran
dom
ised
: 229
A
ge: P
artic
ipan
ts: m
ean
78 y
ears
(ran
ge 6
6-91
yea
rs).
Non
-par
ticip
ants
: mea
n 82
yea
rs (r
ange
69-
96 y
ears
). D
rop-
outs
: mea
n 81
yea
rs
(ran
ge 6
8-94
)a
Sex:
Par
ticip
ants
: fem
ale
74%
. Non
-par
ticip
ants
: fem
ale
71%
. Dro
p-ou
ts: f
emal
e 62
%
Incl
usio
n cr
iteria
: (1)
refe
rred
by
an o
phth
alm
olog
ist t
o re
habi
litat
ion
and
atte
dnin
g th
e lo
w v
sion
clin
ic fo
r the
firs
t tim
e; (2
) 65
year
s of
age
or o
lder
; (3)
livi
ng a
t hom
e; (4
) dia
gnos
ed A
MD
as t
he p
rimar
y co
nditi
on; (
5) a
dis
tanc
e vi
sual
acu
ity o
f the
bet
ter e
ye w
ith
best
cor
rect
ion
no lo
wer
than
0.1
0; (6
) abi
lity
to p
artic
ipat
e in
gro
up d
iscu
ssio
ns.
Excl
usio
n cr
iteria
: non
e re
porte
d In
terv
entio
ns
Trea
tmen
t: H
ealth
edu
catio
n pr
ogra
m
Con
trol:
Indi
vidu
al in
terv
entio
n pr
ogra
m
Out
com
es
perc
eive
d se
curit
y in
per
form
ing
daily
act
iviti
es o
n 28
item
s N
otes
sa
me
stud
y as
Dah
lin Iv
anof
f19
Ekl
und
2004
20
Allo
catio
n co
ncea
lmen
t B
Gri
ffin
-Shi
rley
19
9321
Met
hods
M
etho
d of
allo
catio
n: sp
ecia
l tab
le
Mas
king
: Par
ticip
ant -
mas
king
issu
es a
re n
ot d
escr
ibed
but
the
stud
y pa
rtici
pant
s sho
uld
be u
nmas
ked
give
n th
e us
e of
reco
gniz
able
re
habi
litat
ion
prog
ram
s. Pr
ovid
er -
sam
e as
abo
ve. O
utco
me
- mas
king
issu
es a
re n
ot d
escr
ibed
but
the
ouct
ome
coul
d be
mas
ked
give
n th
e us
e of
a sp
ecia
lly tr
aine
d in
terv
iew
er fo
r out
com
e m
easu
rem
ent
Excl
usio
ns a
fter r
ando
mis
atio
n: n
one
repo
rted
Loss
es to
follo
w-u
p: n
one
repo
rted.
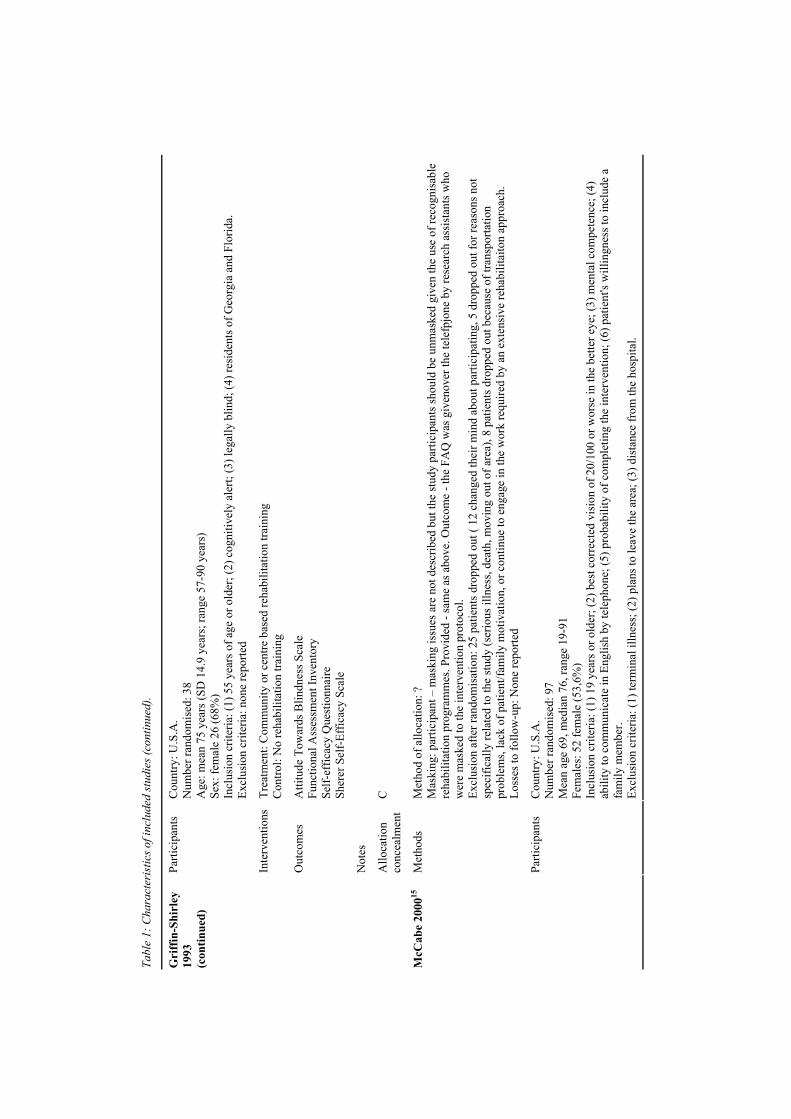
Tabl
e 1:
Cha
ract
eris
tics o
f inc
lude
d st
udie
s (co
ntin
ued)
.
Parti
cipa
nts
Cou
ntry
: U.S
.A.
Num
ber r
ando
mis
ed: 3
8 A
ge: m
ean
75 y
ears
(SD
14.
9 ye
ars;
rang
e 57
-90
year
s)
Sex:
fem
ale
26 (6
8%)
Incl
usio
n cr
iteria
: (1)
55
year
s of a
ge o
r old
er; (
2) c
ogni
tivel
y al
ert;
(3) l
egal
ly b
lind;
(4) r
esid
ents
of G
eorg
ia a
nd F
lorid
a.
Excl
usio
n cr
iteria
: non
e re
porte
d
Inte
rven
tions
Tr
eatm
ent:
Com
mun
ity o
r cen
tre b
ased
reha
bilit
atio
n tra
inin
g C
ontro
l: N
o re
habi
litat
ion
train
ing
Out
com
es
Atti
tude
Tow
ards
Blin
dnes
s Sca
le
Func
tiona
l Ass
essm
ent I
nven
tory
Se
lf-ef
ficac
y Q
uest
ionn
aire
Sh
erer
Sel
f-Ef
ficac
y Sc
ale
Not
es
Gri
ffin
-Shi
rley
19
93
(con
tinue
d)
Allo
catio
n co
ncea
lmen
t C
Met
hods
M
etho
d of
allo
catio
n: ?
M
aski
ng: p
artic
ipan
t – m
aski
ng is
sues
are
not
des
crib
ed b
ut th
e st
udy
parti
cipa
nts s
houl
d be
unm
aske
d gi
ven
the
use
of re
cogn
isab
le
reha
bilit
atio
n pr
ogra
mm
es. P
rovi
ded
- sam
e as
abo
ve. O
utco
me
- the
FA
Q w
as g
iven
over
the
tele
fpjo
ne b
y re
sear
ch a
ssis
tant
s who
w
ere
mas
ked
to th
e in
terv
entio
n pr
otoc
ol.
Excl
usio
n af
ter r
ando
mis
atio
n: 2
5 pa
tient
s dro
pped
out
( 12
cha
nged
thei
r min
d ab
out p
artic
ipat
ing,
5 d
ropp
ed o
ut fo
r rea
sons
not
sp
ecifi
cally
rela
ted
to th
e st
udy
(ser
ious
illn
ess,
deat
h, m
ovin
g ou
t of a
rea)
, 8 p
atie
nts d
ropp
ed o
ut b
ecau
se o
f tra
nspo
rtatio
n pr
oble
ms,
lack
of p
atie
nt/fa
mily
mot
ivat
ion,
or c
ontin
ue to
eng
age
in th
e w
ork
requ
ired
by a
n ex
tens
ive
reha
bilit
aito
n ap
proa
ch.
Loss
es to
follo
w-u
p: N
one
repo
rted
McC
abe
2000
15
Parti
cipa
nts
Cou
ntry
: U.S
.A.
Num
ber r
ando
mis
ed: 9
7 M
ean
age
69, m
edia
n 76
, ran
ge 1
9-91
Fe
mal
es: 5
2 fe
mal
e (5
3,6%
) In
clus
ion
crite
ria: (
1) 1
9 ye
ars o
r old
er; (
2) b
est c
orre
cted
vis
ion
of 2
0/10
0 or
wor
se in
the
bette
r eye
; (3)
men
tal c
ompe
tenc
e; (4
) ab
ility
to c
omm
unic
ate
in E
nglis
h by
tele
phon
e; (5
) pro
babi
lity
of c
ompl
etin
g th
e in
terv
entio
n; (6
) pat
ient
's w
illin
gnes
s to
incl
ude
a fa
mily
mem
ber.
Excl
usio
n cr
iteria
: (1)
term
inal
illn
ess;
(2) p
lans
to le
ave
the
area
; (3)
dis
tanc
e fr
om th
e ho
spita
l.
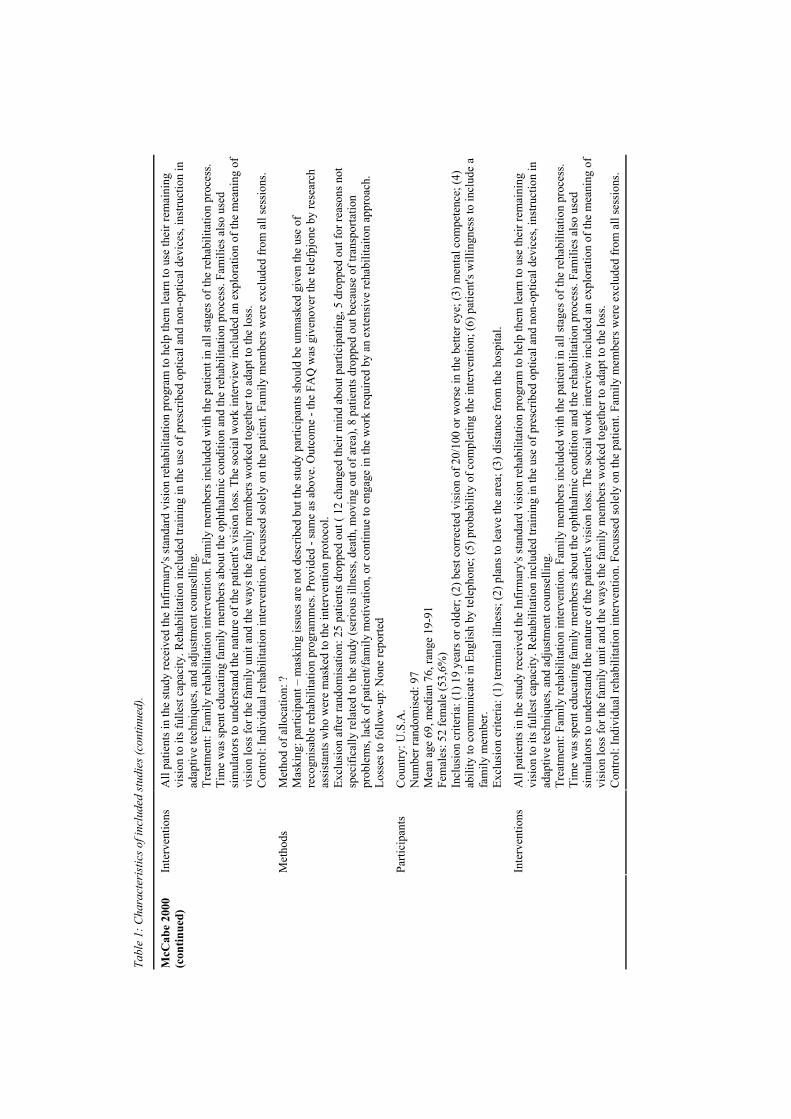
Tabl
e 1:
Cha
ract
eris
tics o
f inc
lude
d st
udie
s (co
ntin
ued)
.
Inte
rven
tions
A
ll pa
tient
s in
the
stud
y re
ceiv
ed th
e In
firm
ary'
s sta
ndar
d vi
sion
reha
bilit
atio
n pr
ogra
m to
hel
p th
em le
arn
to u
se th
eir r
emai
ning
vi
sion
to it
s ful
lest
cap
acity
. Reh
abili
tatio
n in
clud
ed tr
aini
ng in
the
use
of p
resc
ribed
opt
ical
and
non
-opt
ical
dev
ices
, ins
truct
ion
in
adap
tive
tech
niqu
es, a
nd a
djus
tmen
t cou
nsel
ling.
Tr
eatm
ent:
Fam
ily re
habi
litat
ion
inte
rven
tion.
Fam
ily m
embe
rs in
clud
ed w
ith th
e pa
tient
in a
ll st
ages
of t
he re
habi
litat
ion
proc
ess.
Tim
e w
as sp
ent e
duca
ting
fam
ily m
embe
rs a
bout
the
opht
halm
ic c
ondi
tion
and
the
reha
bilit
atio
n pr
oces
s. Fa
mili
es a
lso
used
si
mul
ator
s to
unde
rsta
nd th
e na
ture
of t
he p
atie
nt's
visi
on lo
ss. T
he so
cial
wor
k in
terv
iew
incl
uded
an
expl
orat
ion
of th
e m
eani
ng o
f vi
sion
loss
for t
he fa
mily
uni
t and
the
way
s the
fam
ily m
embe
rs w
orke
d to
geth
er to
ada
pt to
the
loss
. C
ontro
l: In
divi
dual
reha
bilit
atio
n in
terv
entio
n. F
ocus
sed
sole
ly o
n th
e pa
tient
. Fam
ily m
embe
rs w
ere
excl
uded
from
all
sess
ions
. M
etho
ds
Met
hod
of a
lloca
tion:
?
Mas
king
: par
ticip
ant –
mas
king
issu
es a
re n
ot d
escr
ibed
but
the
stud
y pa
rtici
pant
s sho
uld
be u
nmas
ked
give
n th
e us
e of
re
cogn
isab
le re
habi
litat
ion
prog
ram
mes
. Pro
vide
d - s
ame
as a
bove
. Out
com
e - t
he F
AQ
was
giv
enov
er th
e te
lefp
jone
by
rese
arch
as
sist
ants
who
wer
e m
aske
d to
the
inte
rven
tion
prot
ocol
. Ex
clus
ion
afte
r ran
dom
isat
ion:
25
patie
nts d
ropp
ed o
ut (
12 c
hang
ed th
eir m
ind
abou
t par
ticip
atin
g, 5
dro
pped
out
for r
easo
ns n
ot
spec
ifica
lly re
late
d to
the
stud
y (s
erio
us il
lnes
s, de
ath,
mov
ing
out o
f are
a), 8
pat
ient
s dro
pped
out
bec
ause
of t
rans
porta
tion
prob
lem
s, la
ck o
f pat
ient
/fam
ily m
otiv
atio
n, o
r con
tinue
to e
ngag
e in
the
wor
k re
quire
d by
an
exte
nsiv
e re
habi
litai
ton
appr
oach
. Lo
sses
to fo
llow
-up:
Non
e re
porte
d Pa
rtici
pant
s C
ount
ry: U
.S.A
. N
umbe
r ran
dom
ised
: 97
Mea
n ag
e 69
, med
ian
76, r
ange
19-
91
Fem
ales
: 52
fem
ale
(53,
6%)
Incl
usio
n cr
iteria
: (1)
19
year
s or o
lder
; (2)
bes
t cor
rect
ed v
isio
n of
20/
100
or w
orse
in th
e be
tter e
ye; (
3) m
enta
l com
pete
nce;
(4)
abili
ty to
com
mun
icat
e in
Eng
lish
by te
leph
one;
(5) p
roba
bilit
y of
com
plet
ing
the
inte
rven
tion;
(6) p
atie
nt's
will
ingn
ess t
o in
clud
e a
fam
ily m
embe
r. Ex
clus
ion
crite
ria: (
1) te
rmin
al il
lnes
s; (2
) pla
ns to
leav
e th
e ar
ea; (
3) d
ista
nce
from
the
hosp
ital.
McC
abe
2000
(c
ontin
ued)
Inte
rven
tions
A
ll pa
tient
s in
the
stud
y re
ceiv
ed th
e In
firm
ary'
s sta
ndar
d vi
sion
reha
bilit
atio
n pr
ogra
m to
hel
p th
em le
arn
to u
se th
eir r
emai
ning
vi
sion
to it
s ful
lest
cap
acity
. Reh
abili
tatio
n in
clud
ed tr
aini
ng in
the
use
of p
resc
ribed
opt
ical
and
non
-opt
ical
dev
ices
, ins
truct
ion
in
adap
tive
tech
niqu
es, a
nd a
djus
tmen
t cou
nsel
ling.
Tr
eatm
ent:
Fam
ily re
habi
litat
ion
inte
rven
tion.
Fam
ily m
embe
rs in
clud
ed w
ith th
e pa
tient
in a
ll st
ages
of t
he re
habi
litat
ion
proc
ess.
Tim
e w
as sp
ent e
duca
ting
fam
ily m
embe
rs a
bout
the
opht
halm
ic c
ondi
tion
and
the
reha
bilit
atio
n pr
oces
s. Fa
mili
es a
lso
used
si
mul
ator
s to
unde
rsta
nd th
e na
ture
of t
he p
atie
nt's
visi
on lo
ss. T
he so
cial
wor
k in
terv
iew
incl
uded
an
expl
orat
ion
of th
e m
eani
ng o
f vi
sion
loss
for t
he fa
mily
uni
t and
the
way
s the
fam
ily m
embe
rs w
orke
d to
geth
er to
ada
pt to
the
loss
. C
ontro
l: In
divi
dual
reha
bilit
atio
n in
terv
entio
n. F
ocus
sed
sole
ly o
n th
e pa
tient
. Fam
ily m
embe
rs w
ere
excl
uded
from
all
sess
ions
.
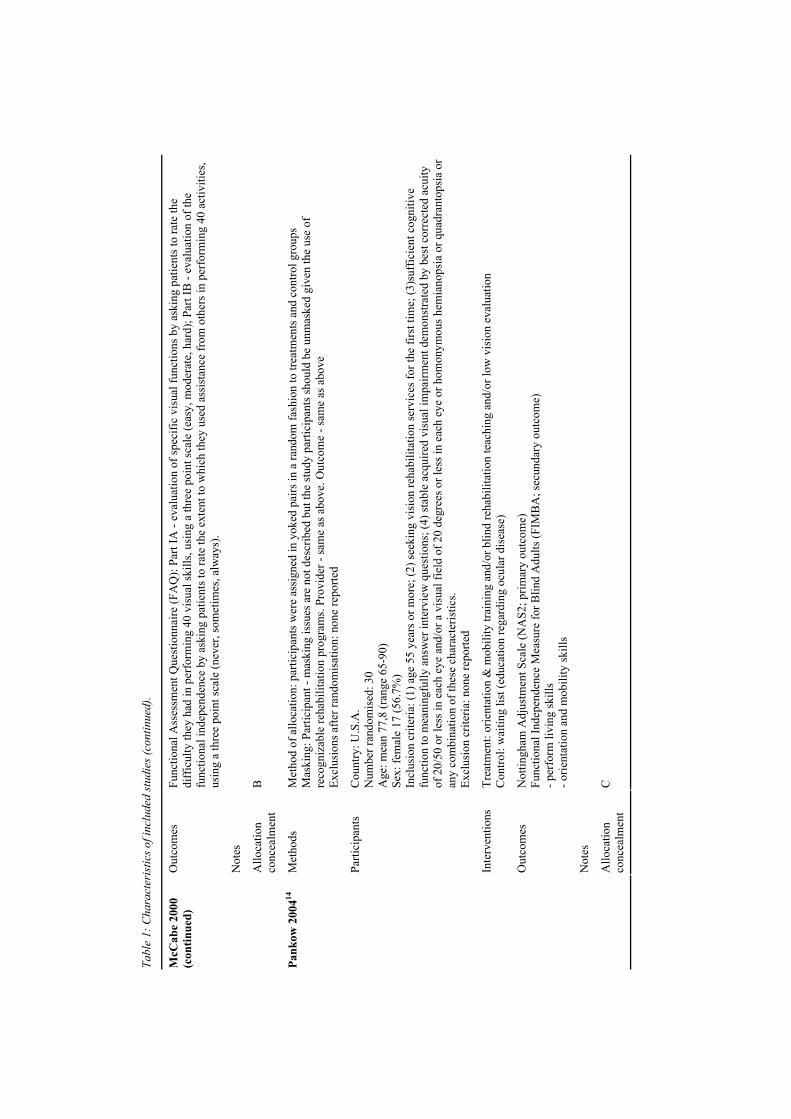
Tabl
e 1:
Cha
ract
eris
tics o
f inc
lude
d st
udie
s (co
ntin
ued)
.
Out
com
es
Func
tiona
l Ass
essm
ent Q
uest
ionn
aire
(FA
Q):
Part
IA -
eval
uatio
n of
spec
ific
visu
al fu
nctio
ns b
y as
king
pat
ient
s to
rate
the
diff
icul
ty th
ey h
ad in
per
form
ing
40 v
isua
l ski
lls, u
sing
a th
ree
poin
t sca
le (e
asy,
mod
erat
e, h
ard)
; Par
t IB
- ev
alua
tion
of th
e fu
nctio
nal i
ndep
ende
nce
by a
skin
g pa
tient
s to
rate
the
exte
nt to
whi
ch th
ey u
sed
assi
stan
ce fr
om o
ther
s in
perf
orm
ing
40 a
ctiv
ities
, us
ing
a th
ree
poin
t sca
le (n
ever
, som
etim
es, a
lway
s).
Not
es
McC
abe
2000
(c
ontin
ued)
Allo
catio
n co
ncea
lmen
t B
Met
hods
M
etho
d of
allo
catio
n: p
artic
ipan
ts w
ere
assi
gned
in y
oked
pai
rs in
a ra
ndom
fash
ion
to tr
eatm
ents
and
con
trol g
roup
s M
aski
ng: P
artic
ipan
t - m
aski
ng is
sues
are
not
des
crib
ed b
ut th
e st
udy
parti
cipa
nts s
houl
d be
unm
aske
d gi
ven
the
use
of
reco
gniz
able
reha
bilit
atio
n pr
ogra
ms.
Prov
ider
- sa
me
as a
bove
. Out
com
e - s
ame
as a
bove
Ex
clus
ions
afte
r ran
dom
isat
ion:
non
e re
porte
d Pa
rtici
pant
s C
ount
ry: U
.S.A
. N
umbe
r ran
dom
ised
: 30
Age
: mea
n 77
,8 (r
ange
65-
90)
Sex:
fem
ale
17 (5
6.7%
) In
clus
ion
crite
ria: (
1) a
ge 5
5 ye
ars o
r mor
e; (2
) see
king
vis
ion
reha
bilit
atio
n se
rvic
es fo
r the
firs
t tim
e; (3
)suf
ficie
nt c
ogni
tive
func
tion
to m
eani
ngfu
lly a
nsw
er in
terv
iew
que
stio
ns; (
4) st
able
acq
uire
d vi
sual
impa
irmen
t dem
onst
rate
d by
bes
t cor
rect
ed a
cuity
of
20/
50 o
r les
s in
each
eye
and
/or a
vis
ual f
ield
of 2
0 de
gree
s or l
ess i
n ea
ch e
ye o
r hom
onym
ous h
emia
nops
ia o
r qua
dran
tops
ia o
r an
y co
mbi
natio
n of
thes
e ch
arac
teris
tics.
Excl
usio
n cr
iteria
: non
e re
porte
d In
terv
entio
ns
Trea
tmen
t: or
ient
atio
n &
mob
ility
trai
ning
and
/or b
lind
reha
bilit
atio
n te
achi
ng a
nd/o
r low
vis
ion
eval
uatio
n C
ontro
l: w
aitin
g lis
t (ed
ucat
ion
rega
rdin
g oc
ular
dis
ease
) O
utco
mes
N
ottin
gham
Adj
ustm
ent S
cale
(NA
S2; p
rimar
y ou
tcom
e)
Func
tiona
l Ind
epen
denc
e M
easu
re fo
r Blin
d A
dults
(FIM
BA
; sec
unda
ry o
utco
me)
- p
erfo
rm li
ving
skill
s - o
rient
atio
n an
d m
obili
ty sk
ills
Not
es
Pank
ow 2
00414
Allo
catio
n co
ncea
lmen
t C
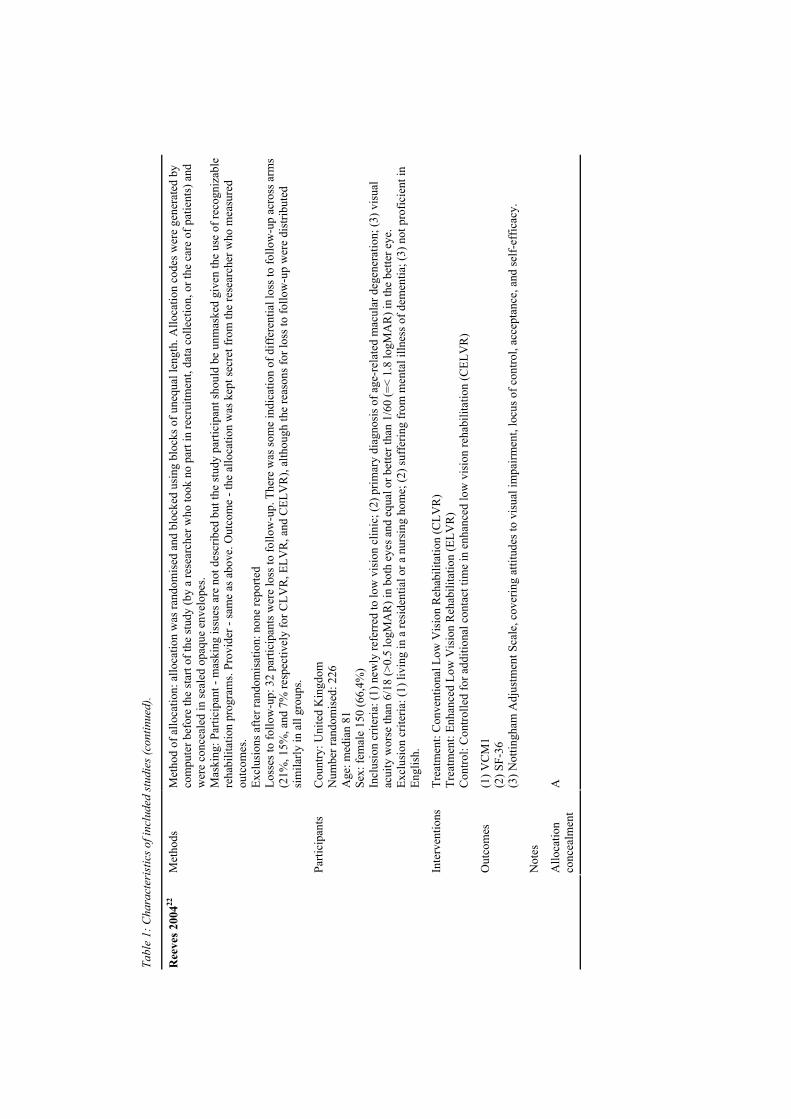
Tabl
e 1:
Cha
ract
eris
tics o
f inc
lude
d st
udie
s (co
ntin
ued)
.
Met
hods
M
etho
d of
allo
catio
n: a
lloca
tion
was
rand
omis
ed a
nd b
lock
ed u
sing
blo
cks o
f une
qual
leng
th. A
lloca
tion
code
s wer
e ge
nera
ted
by
com
pute
r bef
ore
the
star
t of t
he st
udy
(by
a re
sear
cher
who
took
no
part
in re
crui
tmen
t, da
ta c
olle
ctio
n, o
r the
car
e of
pat
ient
s) a
nd
wer
e co
ncea
led
in se
aled
opa
que
enve
lope
s. M
aski
ng: P
artic
ipan
t - m
aski
ng is
sues
are
not
des
crib
ed b
ut th
e st
udy
parti
cipa
nt sh
ould
be
unm
aske
d gi
ven
the
use
of re
cogn
izab
le
reha
bilit
atio
n pr
ogra
ms.
Prov
ider
- sa
me
as a
bove
. Out
com
e - t
he a
lloca
tion
was
kep
t sec
ret f
rom
the
rese
arch
er w
ho m
easu
red
outc
omes
. Ex
clus
ions
afte
r ran
dom
isat
ion:
non
e re
porte
d Lo
sses
to fo
llow
-up:
32
parti
cipa
nts w
ere
loss
to fo
llow
-up.
The
re w
as so
me
indi
catio
n of
diff
eren
tial l
oss t
o fo
llow
-up
acro
ss a
rms
(21%
, 15%
, and
7%
resp
ectiv
ely
for C
LVR
, ELV
R, a
nd C
ELV
R),
alth
ough
the
reas
ons f
or lo
ss to
follo
w-u
p w
ere
dist
ribut
ed
sim
ilarly
in a
ll gr
oups
. Pa
rtici
pant
s C
ount
ry: U
nite
d K
ingd
om
Num
ber r
ando
mis
ed: 2
26
Age
: med
ian
81
Sex:
fem
ale
150
(66,
4%)
Incl
usio
n cr
iteria
: (1)
new
ly re
ferr
ed to
low
vis
ion
clin
ic; (
2) p
rimar
y di
agno
sis o
f age
-rel
ated
mac
ular
deg
ener
atio
n; (3
) vis
ual
acui
ty w
orse
than
6/1
8 (>
0.5
logM
AR
) in
both
eye
s and
equ
al o
r bet
ter t
han
1/60
(=<
1.8
logM
AR
) in
the
bette
r eye
. Ex
clus
ion
crite
ria: (
1) li
ving
in a
resi
dent
ial o
r a n
ursi
ng h
ome;
(2) s
uffe
ring
from
men
tal i
llnes
s of d
emen
tia; (
3) n
ot p
rofic
ient
in
Engl
ish.
In
terv
entio
ns
Trea
tmen
t: C
onve
ntio
nal L
ow V
isio
n R
ehab
ilita
tion
(CLV
R)
Trea
tmen
t: En
hanc
ed L
ow V
isio
n R
ehab
ilita
tion
(ELV
R)
Con
trol:
Con
trolle
d fo
r add
ition
al c
onta
ct ti
me
in e
nhan
ced
low
vis
ion
reha
bilit
atio
n (C
ELV
R)
Out
com
es
(1) V
CM
1 (2
) SF-
36
(3) N
ottin
gham
Adj
ustm
ent S
cale
, cov
erin
g at
titud
es to
vis
ual i
mpa
irmen
t, lo
cus o
f con
trol,
acce
ptan
ce, a
nd se
lf-ef
ficac
y.
Not
es
Ree
ves 2
00422
Allo
catio
n co
ncea
lmen
t A
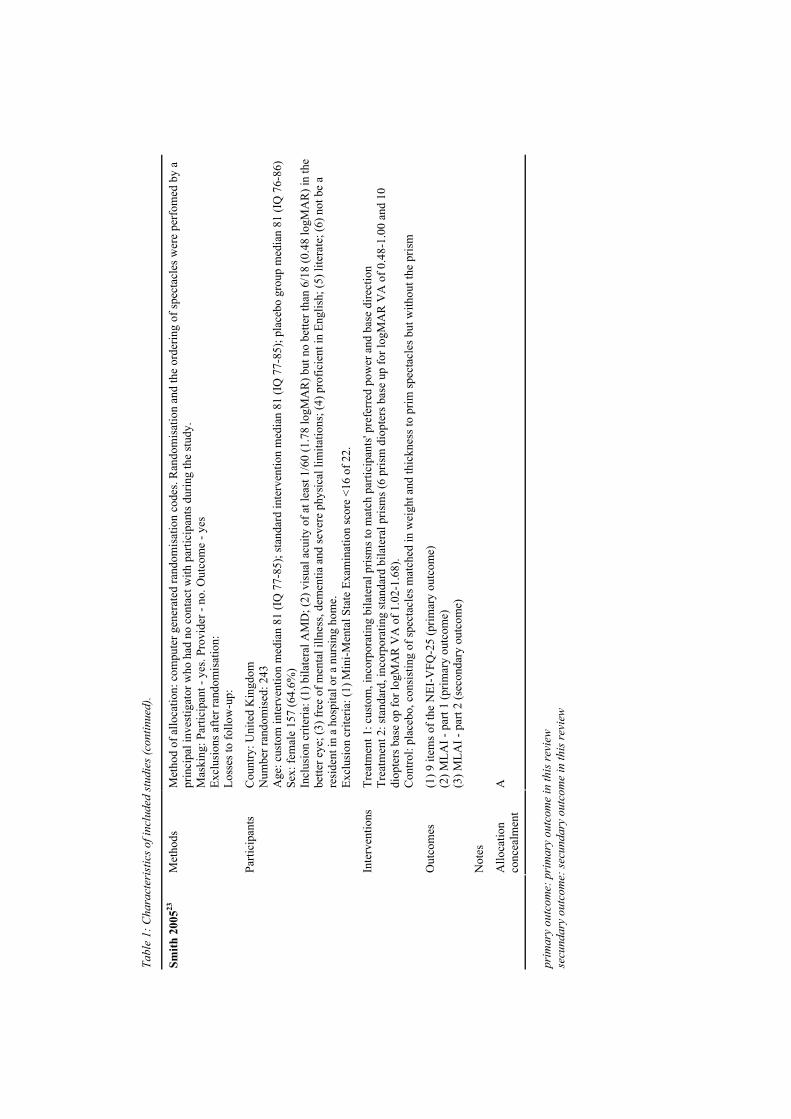
Tabl
e 1:
Cha
ract
eris
tics o
f inc
lude
d st
udie
s (co
ntin
ued)
.
Met
hods
M
etho
d of
allo
catio
n: c
ompu
ter g
ener
ated
rand
omis
atio
n co
des.
Ran
dom
isat
ion
and
the
orde
ring
of sp
ecta
cles
wer
e pe
rfom
ed b
y a
prin
cipa
l inv
estig
ator
who
had
no
cont
act w
ith p
artic
ipan
ts d
urin
g th
e st
udy.
M
aski
ng: P
artic
ipan
t - y
es. P
rovi
der -
no.
Out
com
e - y
es
Excl
usio
ns a
fter r
ando
mis
atio
n:
Loss
es to
follo
w-u
p:
Parti
cipa
nts
Cou
ntry
: Uni
ted
Kin
gdom
N
umbe
r ran
dom
ised
: 243
A
ge: c
usto
m in
terv
entio
n m
edia
n 81
(IQ
77-
85);
stan
dard
inte
rven
tion
med
ian
81 (I
Q 7
7-85
); pl
aceb
o gr
oup
med
ian
81 (I
Q 7
6-86
) Se
x: fe
mal
e 15
7 (6
4.6%
) In
clus
ion
crite
ria: (
1) b
ilate
ral A
MD
; (2)
vis
ual a
cuity
of a
t lea
st 1
/60
(1.7
8 lo
gMA
R) b
ut n
o be
tter t
han
6/18
(0.4
8 lo
gMA
R) i
n th
e be
tter e
ye; (
3) fr
ee o
f men
tal i
llnes
s, de
men
tia a
nd se
vere
phy
sical
lim
itatio
ns; (
4) p
rofic
ient
in E
nglis
h; (5
) lite
rate
; (6)
not
be
a re
side
nt in
a h
ospi
tal o
r a n
ursi
ng h
ome.
Ex
clus
ion
crite
ria: (
1) M
ini-M
enta
l Sta
te E
xam
inat
ion
scor
e <1
6 of
22.
In
terv
entio
ns
Trea
tmen
t 1: c
usto
m, i
ncor
pora
ting
bila
tera
l pris
ms t
o m
atch
par
ticip
ants
' pre
ferr
ed p
ower
and
bas
e di
rect
ion
Trea
tmen
t 2: s
tand
ard,
inco
rpor
atin
g st
anda
rd b
ilate
ral p
rism
s (6
pris
m d
iopt
ers b
ase
up fo
r log
MA
R V
A o
f 0.4
8-1.
00 a
nd 1
0 di
opte
rs b
ase
op fo
r log
MA
R V
A o
f 1.0
2-1.
68).
Con
trol:
plac
ebo,
con
sist
ing
of sp
ecta
cles
mat
ched
in w
eigh
t and
thic
knes
s to
prim
spec
tacl
es b
ut w
ithou
t the
pris
m
Out
com
es
(1) 9
item
s of t
he N
EI-V
FQ-2
5 (p
rimar
y ou
tcom
e)
(2) M
LAI -
par
t 1 (p
rimar
y ou
tcom
e)
(3) M
LAI -
par
t 2 (s
econ
dary
out
com
e)
Not
es
Smith
200
523
Allo
catio
n co
ncea
lmen
t A
prim
ary
outc
ome:
pri
mar
y ou
tcom
e in
this
revi
ew
secu
ndar
y ou
tcom
e: se
cund
ary
outc
ome
in th
is re
view
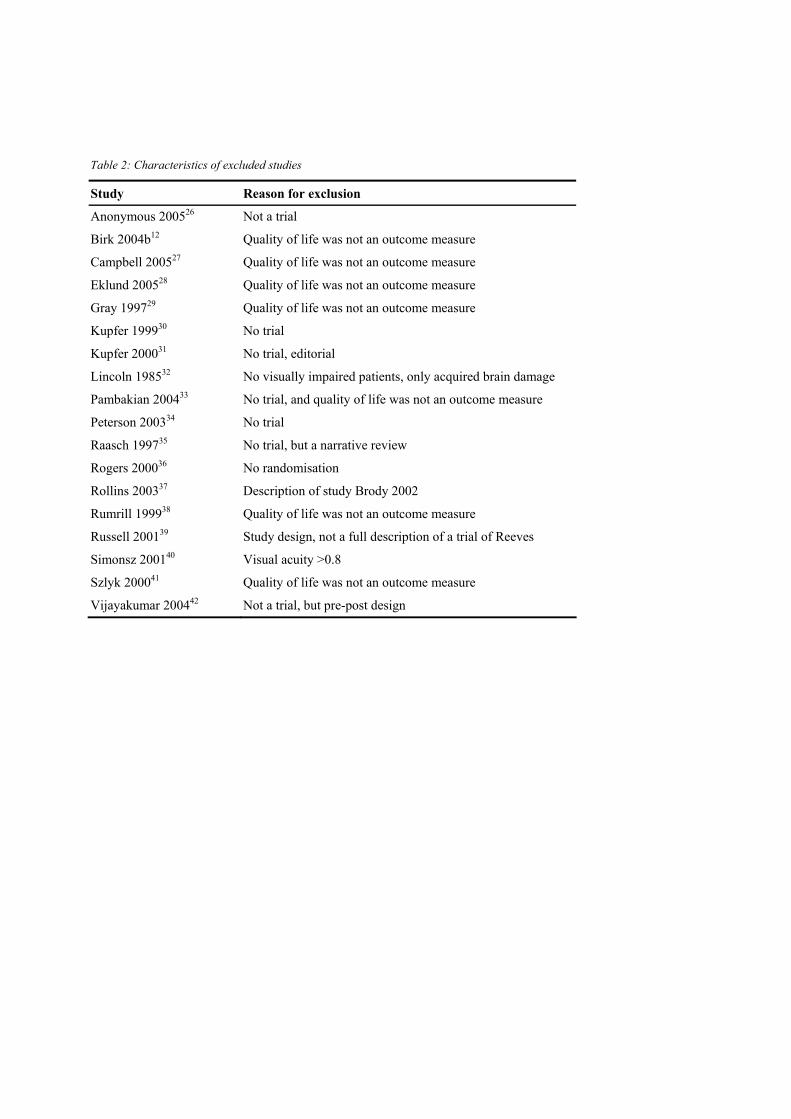
Table 2: Characteristics of excluded studies
Study Reason for exclusion Anonymous 200526 Not a trial Birk 2004b12 Quality of life was not an outcome measure Campbell 200527 Quality of life was not an outcome measure Eklund 200528 Quality of life was not an outcome measure Gray 199729 Quality of life was not an outcome measure Kupfer 199930 No trial Kupfer 200031 No trial, editorial Lincoln 198532 No visually impaired patients, only acquired brain damage Pambakian 200433 No trial, and quality of life was not an outcome measure Peterson 200334 No trial Raasch 199735 No trial, but a narrative review Rogers 200036 No randomisation Rollins 200337 Description of study Brody 2002 Rumrill 199938 Quality of life was not an outcome measure Russell 200139 Study design, not a full description of a trial of Reeves Simonsz 200140 Visual acuity >0.8 Szlyk 200041 Quality of life was not an outcome measure Vijayakumar 200442 Not a trial, but pre-post design
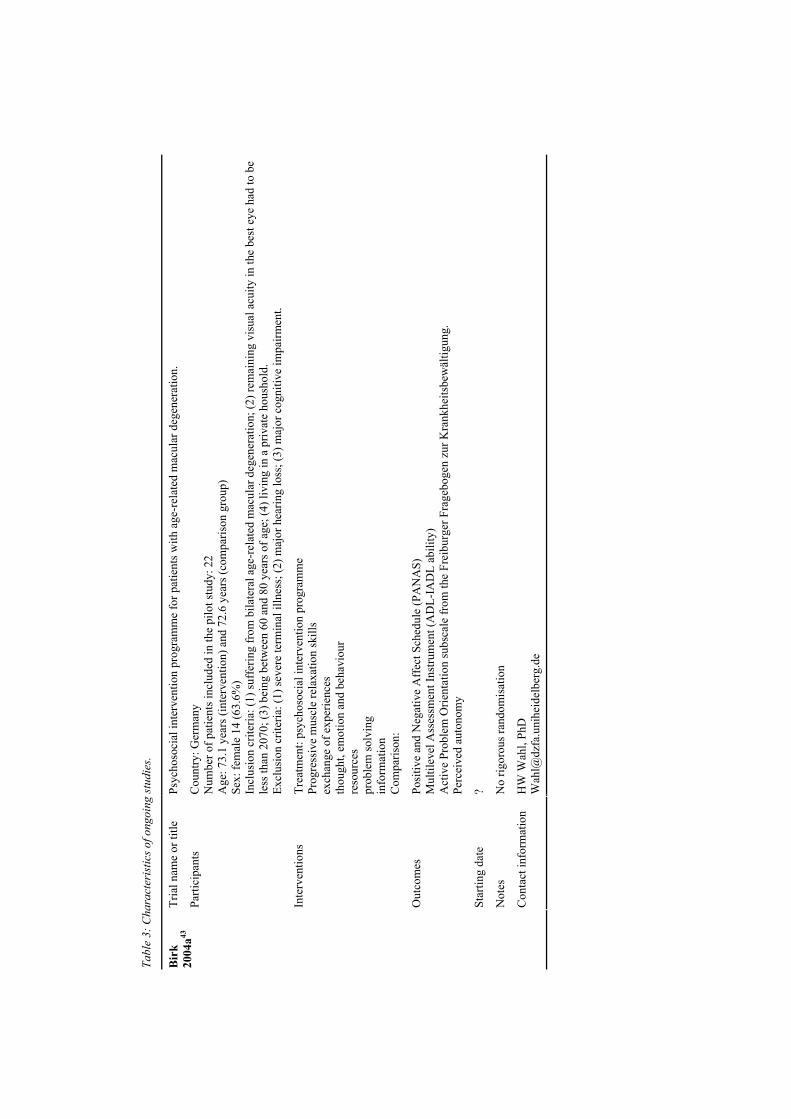
Tabl
e 3:
Cha
ract
eris
tics o
f ong
oing
stud
ies.
Tria
l nam
e or
title
Ps
ycho
soci
al in
terv
entio
n pr
ogra
mm
e fo
r pat
ient
s with
age
-rel
ated
mac
ular
deg
ener
atio
n.
Parti
cipa
nts
Cou
ntry
: Ger
man
y N
umbe
r of p
atie
nts i
nclu
ded
in th
e pi
lot s
tudy
: 22
Age
: 73.
1 ye
ars (
inte
rven
tion)
and
72.
6 ye
ars (
com
paris
on g
roup
) Se
x: fe
mal
e 14
(63.
6%)
Incl
usio
n cr
iteria
: (1)
suff
erin
g fr
om b
ilate
ral a
ge-r
elat
ed m
acul
ar d
egen
erat
ion;
(2) r
emai
ning
vis
ual a
cuity
in th
e be
st e
ye h
ad to
be
less
than
207
0; (3
) bei
ng b
etw
een
60 a
nd 8
0 ye
ars o
f age
; (4)
livi
ng in
a p
rivat
e ho
usho
ld.
Excl
usio
n cr
iteria
: (1)
seve
re te
rmin
al il
lnes
s; (2
) maj
or h
earin
g lo
ss; (
3) m
ajor
cog
nitiv
e im
pairm
ent.
Inte
rven
tions
Tr
eatm
ent:
psyc
hoso
cial
inte
rven
tion
prog
ram
me
Prog
ress
ive
mus
cle
rela
xatio
n sk
ills
exch
ange
of e
xper
ienc
es
thou
ght,
emot
ion
and
beha
viou
r re
sour
ces
prob
lem
solv
ing
info
rmat
ion
Com
paris
on:
Out
com
es
Posi
tive
and
Neg
ativ
e A
ffec
t Sch
edul
e (P
AN
AS)
M
ultil
evel
Ass
essm
ent I
nstru
men
t (A
DL-
IAD
L ab
ility
) A
ctiv
e Pr
oble
m O
rient
atio
n su
bsca
le fr
om th
e Fr
eibu
rger
Fra
gebo
gen
zur K
rank
heits
bew
ältig
ung.
Pe
rcei
ved
auto
nom
y
Star
ting
date
?
Not
es
No
rigor
ous r
ando
mis
atio
n
Bir
k 20
04a43
Con
tact
info
rmat
ion
HW
Wah
l, Ph
D
Wah
l@dz
fa.u
nihe
idel
berg
.de
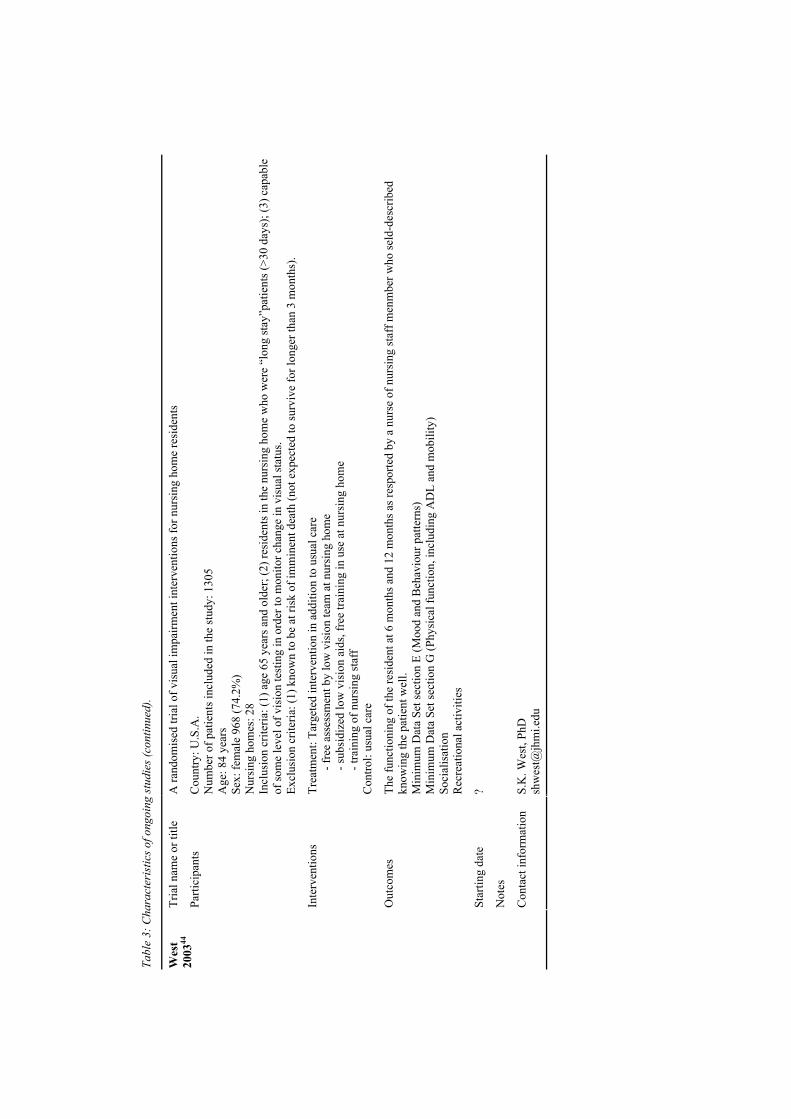
Tabl
e 3:
Cha
ract
eris
tics o
f ong
oing
stud
ies (
cont
inue
d).
Tria
l nam
e or
title
A
rand
omis
ed tr
ial o
f vis
ual i
mpa
irmen
t int
erve
ntio
ns fo
r nur
sing
hom
e re
side
nts
Parti
cipa
nts
Cou
ntry
: U.S
.A.
Num
ber o
f pat
ient
s inc
lude
d in
the
stud
y: 1
305
Age
: 84
year
s Se
x: fe
mal
e 96
8 (7
4.2%
) N
ursi
ng h
omes
: 28
Incl
usio
n cr
iteria
: (1)
age
65
year
s and
old
er; (
2) re
side
nts i
n th
e nu
rsin
g ho
me
who
wer
e “l
ong
stay
”pat
ient
s (>3
0 da
ys);
(3) c
apab
le
of so
me
leve
l of v
isio
n te
stin
g in
ord
er to
mon
itor c
hang
e in
vis
ual s
tatu
s. Ex
clus
ion
crite
ria: (
1) k
now
n to
be
at ri
sk o
f im
min
ent d
eath
(not
exp
ecte
d to
surv
ive
for l
onge
r tha
n 3
mon
ths)
.
Inte
rven
tions
Tr
eatm
ent:
Targ
eted
inte
rven
tion
in a
dditi
on to
usu
al c
are
- f
ree
asse
ssm
ent b
y lo
w v
isio
n te
am a
t nur
sing
hom
e
- sub
sidi
zed
low
vis
ion
aids
, fre
e tra
inin
g in
use
at n
ursi
ng h
ome
- t
rain
ing
of n
ursi
ng st
aff
Con
trol:
usua
l car
e
Out
com
es
The
func
tioni
ng o
f the
resi
dent
at 6
mon
ths a
nd 1
2 m
onth
s as r
espo
rted
by a
nur
se o
f nur
sing
staf
f men
mbe
r who
seld
-des
crib
ed
know
ing
the
patie
nt w
ell.
Min
imum
Dat
a Se
t sec
tion
E (M
ood
and
Beh
avio
ur p
atte
rns)
M
inim
um D
ata
Set s
ectio
n G
(Phy
sica
l fun
ctio
n, in
clud
ing
AD
L an
d m
obili
ty)
Soci
alis
atio
n R
ecre
atio
nal a
ctiv
ities
Star
ting
date
?
Not
es
Wes
t 20
0344
Con
tact
info
rmat
ion
S.K
. Wes
t, Ph
D
shw
est@
jhm
i.edu
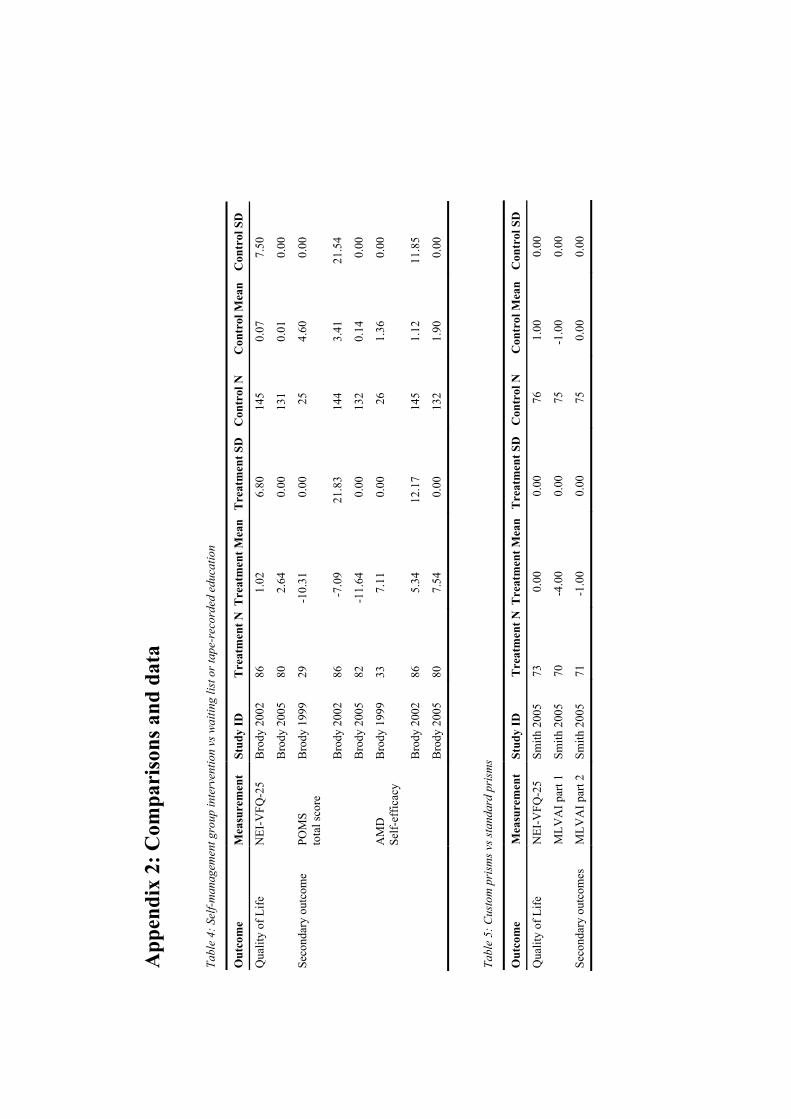
App
endi
x 2:
Com
pari
sons
and
dat
a Ta
ble
4: S
elf-m
anag
emen
t gro
up in
terv
entio
n vs
wai
ting
list o
r tap
e-re
cord
ed e
duca
tion
Out
com
e M
easu
rem
ent
Stud
y ID
T
reat
men
t NT
reat
men
t Mea
nT
reat
men
t SD
C
ontr
ol N
C
ontr
ol M
ean
Con
trol
SD
Q
ualit
y of
Life
N
EI-V
FQ-2
5 B
rody
200
2 86
1.
02
6.80
14
5 0.
07
7.50
B
rody
200
5 80
2.
64
0.00
13
1 0.
01
0.00
Se
cond
ary
outc
ome
POM
S to
tal s
core
B
rody
199
9 29
-1
0.31
0.
00
25
4.60
0.
00
Bro
dy 2
002
86
-7.0
9 21
.83
144
3.41
21
.54
Bro
dy 2
005
82
-11.
64
0.00
13
2 0.
14
0.00
AM
D
Self-
effic
acy
Bro
dy 1
999
33
7.11
0.
00
26
1.36
0.
00
Bro
dy 2
002
86
5.34
12
.17
145
1.12
11
.85
Bro
dy 2
005
80
7.54
0.
00
132
1.90
0.
00
Ta
ble
5: C
usto
m p
rism
s vs s
tand
ard
pris
ms
Out
com
e M
easu
rem
ent
Stud
y ID
T
reat
men
t NT
reat
men
t Mea
nT
reat
men
t SD
C
ontr
ol N
C
ontr
ol M
ean
Con
trol
SD
Q
ualit
y of
Life
N
EI-V
FQ-2
5 Sm
ith 2
005
73
0.00
0.
00
76
1.00
0.
00
M
LVA
I par
t 1
Smith
200
5 70
-4
.00
0.00
75
-1
.00
0.00
Se
cond
ary
outc
omes
M
LVA
I par
t 2
Smith
200
5 71
-1
.00
0.00
75
0.
00
0.00
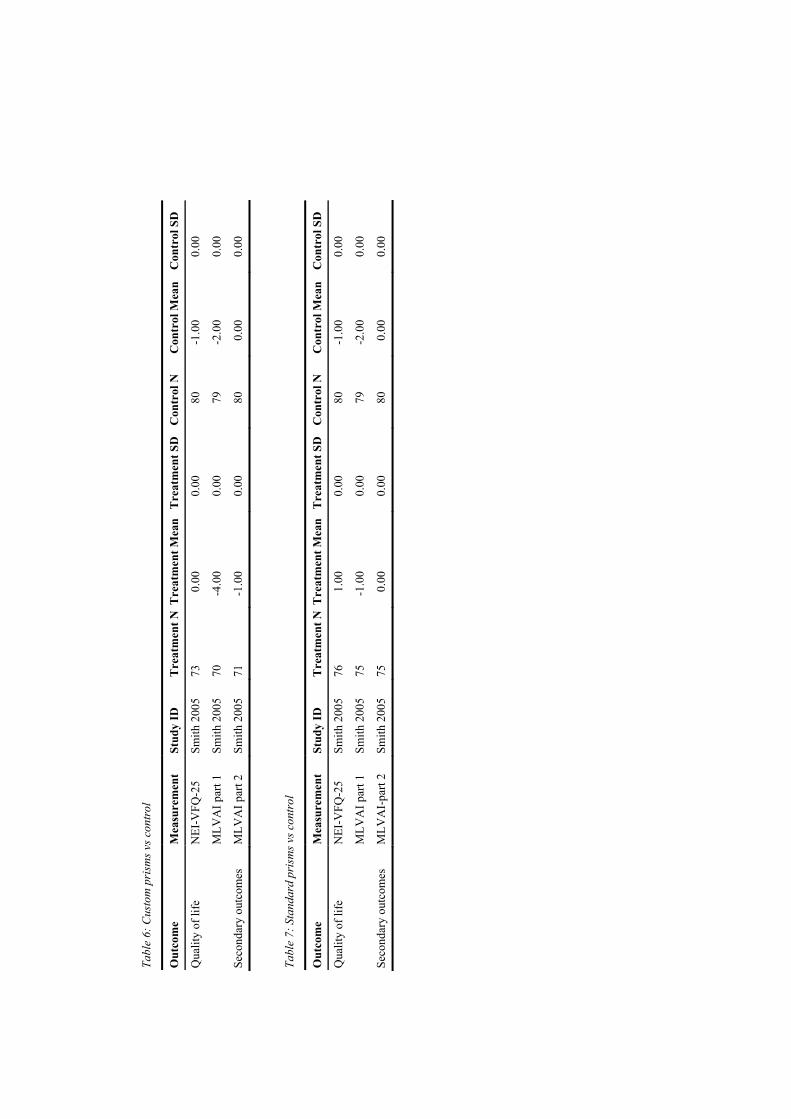
Tabl
e 6:
Cus
tom
pri
sms v
s con
trol
Out
com
e M
easu
rem
ent
Stud
y ID
T
reat
men
t NT
reat
men
t Mea
n T
reat
men
t SD
C
ontr
ol N
C
ontr
ol M
ean
Con
trol
SD
Qua
lity
of li
fe
NEI
-VFQ
-25
Smith
200
5 73
0.
00
0.00
80
-1
.00
0.00
M
LVA
I par
t 1
Smith
200
5 70
-4
.00
0.00
79
-2
.00
0.00
Seco
ndar
y ou
tcom
es
MLV
AI p
art 2
Sm
ith 2
005
71
-1.0
0 0.
00
80
0.00
0.
00
Ta
ble
7: S
tand
ard
pris
ms v
s con
trol
Out
com
e M
easu
rem
ent
Stud
y ID
T
reat
men
t NT
reat
men
t Mea
n T
reat
men
t SD
C
ontr
ol N
C
ontr
ol M
ean
Con
trol
SD
Qua
lity
of li
fe
NEI
-VFQ
-25
Smith
200
5 76
1.
00
0.00
80
-1
.00
0.00
M
LVA
I par
t 1
Smith
200
5 75
-1
.00
0.00
79
-2
.00
0.00
Seco
ndar
y ou
tcom
es
MLV
AI-
part
2 Sm
ith 2
005
75
0.00
0.
00
80
0.00
0.
00
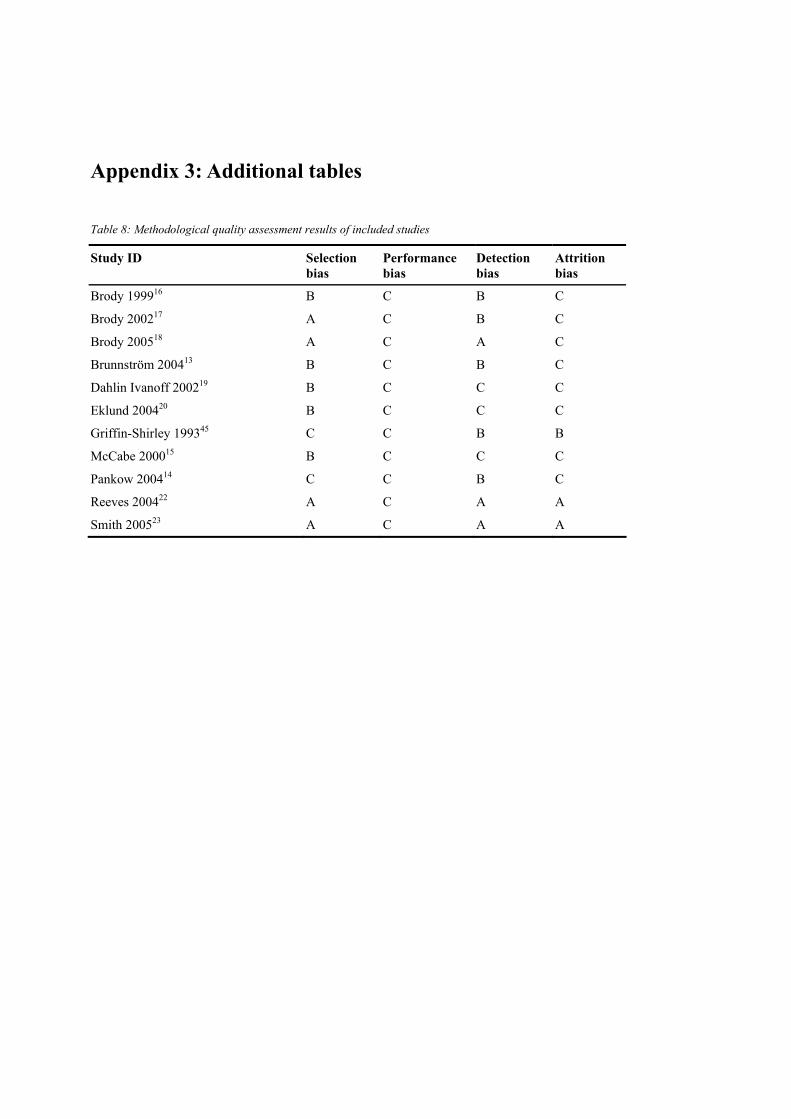
Appendix 3: Additional tables Table 8: Methodological quality assessment results of included studies
Study ID Selection bias
Performance bias
Detection bias
Attrition bias
Brody 199916 B C B C Brody 200217 A C B C Brody 200518 A C A C Brunnström 200413 B C B C Dahlin Ivanoff 200219 B C C C Eklund 200420 B C C C Griffin-Shirley 199345 C C B B McCabe 200015 B C C C Pankow 200414 C C B C Reeves 200422 A C A A Smith 200523 A C A A

55
IImmppaacctt ooff vviissuuaall iimmppaaiirrmmeenntt oonn qquuaalliittyy ooff lliiffee:: aa ccoommppaarriissoonn wwiitthh
qquuaalliittyy ooff lliiffee iinn tthhee ggeenneerraall ppooppuullaattiioonn aanndd wwiitthh ootthheerr cchhrroonniicc
ccoonnddiittiioonnss
Maaike Langelaan, Michiel R. de Boer, Ruth M.A. van Nispen, Bill Wouters, Annette C. Moll,
Ger H.M.B. van Rens
Ophthalmic Epidemiology (accepted for publication)
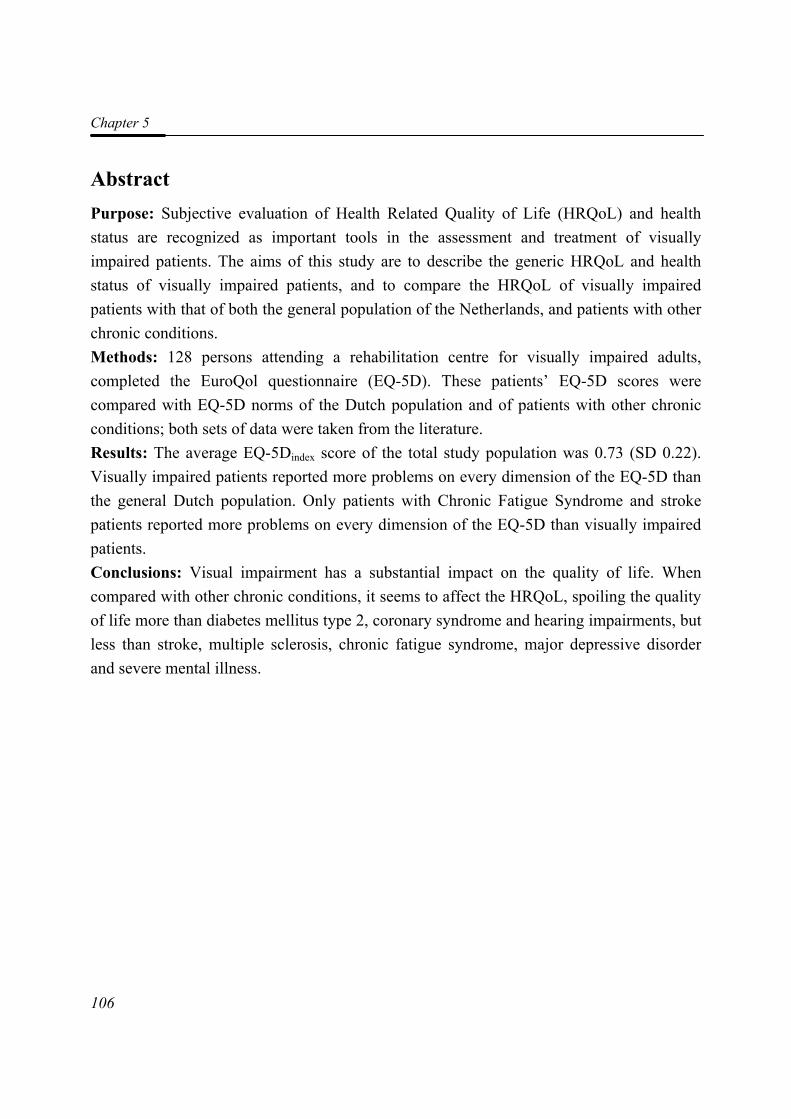
Chapter 5
106
Abstract Purpose: Subjective evaluation of Health Related Quality of Life (HRQoL) and health status are recognized as important tools in the assessment and treatment of visually impaired patients. The aims of this study are to describe the generic HRQoL and health status of visually impaired patients, and to compare the HRQoL of visually impaired patients with that of both the general population of the Netherlands, and patients with other chronic conditions. Methods: 128 persons attending a rehabilitation centre for visually impaired adults, completed the EuroQol questionnaire (EQ-5D). These patients’ EQ-5D scores were compared with EQ-5D norms of the Dutch population and of patients with other chronic conditions; both sets of data were taken from the literature. Results: The average EQ-5Dindex score of the total study population was 0.73 (SD 0.22). Visually impaired patients reported more problems on every dimension of the EQ-5D than the general Dutch population. Only patients with Chronic Fatigue Syndrome and stroke patients reported more problems on every dimension of the EQ-5D than visually impaired patients. Conclusions: Visual impairment has a substantial impact on the quality of life. When compared with other chronic conditions, it seems to affect the HRQoL, spoiling the quality of life more than diabetes mellitus type 2, coronary syndrome and hearing impairments, but less than stroke, multiple sclerosis, chronic fatigue syndrome, major depressive disorder and severe mental illness.
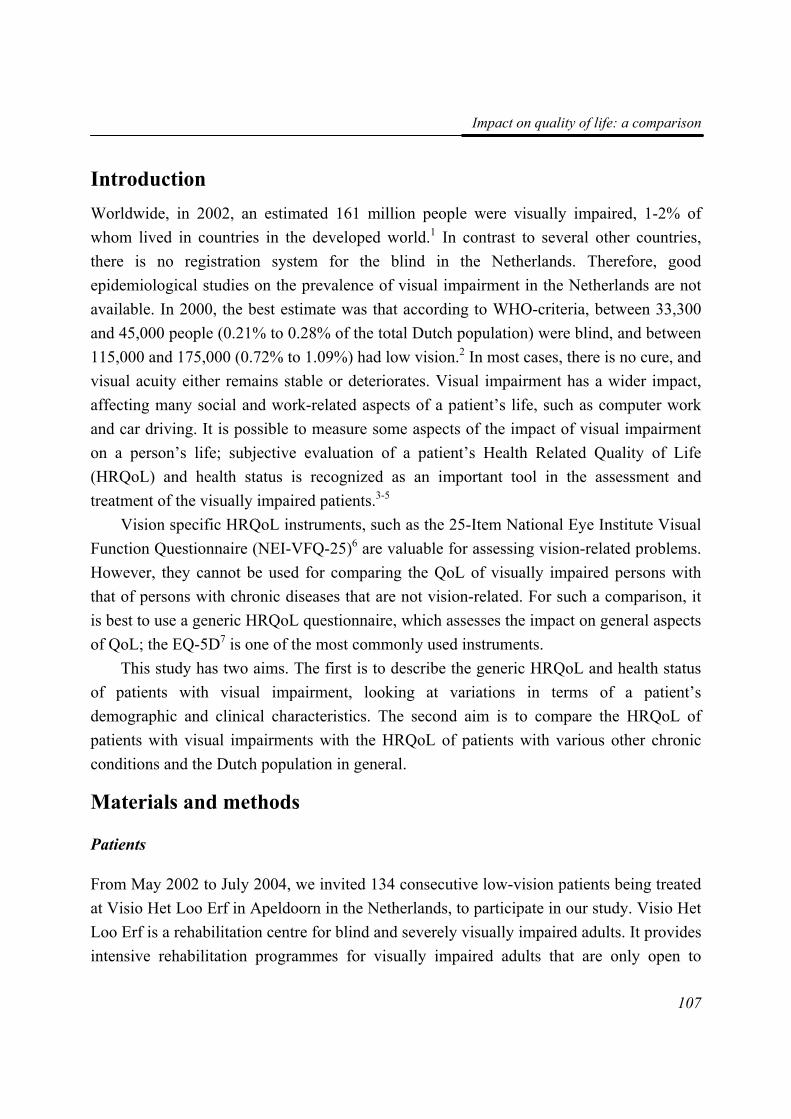
Impact on quality of life: a comparison
107
Introduction Worldwide, in 2002, an estimated 161 million people were visually impaired, 1-2% of whom lived in countries in the developed world.1 In contrast to several other countries, there is no registration system for the blind in the Netherlands. Therefore, good epidemiological studies on the prevalence of visual impairment in the Netherlands are not available. In 2000, the best estimate was that according to WHO-criteria, between 33,300 and 45,000 people (0.21% to 0.28% of the total Dutch population) were blind, and between 115,000 and 175,000 (0.72% to 1.09%) had low vision.2 In most cases, there is no cure, and visual acuity either remains stable or deteriorates. Visual impairment has a wider impact, affecting many social and work-related aspects of a patient’s life, such as computer work and car driving. It is possible to measure some aspects of the impact of visual impairment on a person’s life; subjective evaluation of a patient’s Health Related Quality of Life (HRQoL) and health status is recognized as an important tool in the assessment and treatment of the visually impaired patients.3-5
Vision specific HRQoL instruments, such as the 25-Item National Eye Institute Visual Function Questionnaire (NEI-VFQ-25)6 are valuable for assessing vision-related problems. However, they cannot be used for comparing the QoL of visually impaired persons with that of persons with chronic diseases that are not vision-related. For such a comparison, it is best to use a generic HRQoL questionnaire, which assesses the impact on general aspects of QoL; the EQ-5D7 is one of the most commonly used instruments.
This study has two aims. The first is to describe the generic HRQoL and health status of patients with visual impairment, looking at variations in terms of a patient’s demographic and clinical characteristics. The second aim is to compare the HRQoL of patients with visual impairments with the HRQoL of patients with various other chronic conditions and the Dutch population in general.
Materials and methods
Patients
From May 2002 to July 2004, we invited 134 consecutive low-vision patients being treated at Visio Het Loo Erf in Apeldoorn in the Netherlands, to participate in our study. Visio Het Loo Erf is a rehabilitation centre for blind and severely visually impaired adults. It provides intensive rehabilitation programmes for visually impaired adults that are only open to
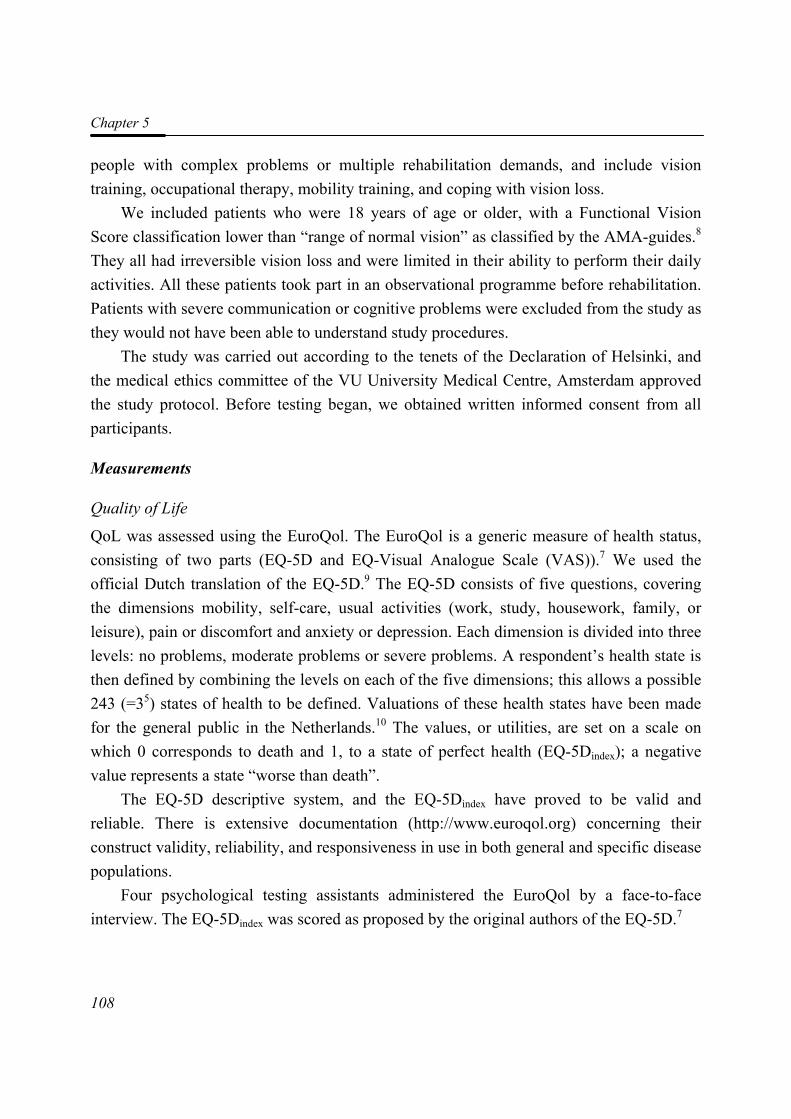
Chapter 5
108
people with complex problems or multiple rehabilitation demands, and include vision training, occupational therapy, mobility training, and coping with vision loss.
We included patients who were 18 years of age or older, with a Functional Vision Score classification lower than “range of normal vision” as classified by the AMA-guides.8 They all had irreversible vision loss and were limited in their ability to perform their daily activities. All these patients took part in an observational programme before rehabilitation. Patients with severe communication or cognitive problems were excluded from the study as they would not have been able to understand study procedures.
The study was carried out according to the tenets of the Declaration of Helsinki, and the medical ethics committee of the VU University Medical Centre, Amsterdam approved the study protocol. Before testing began, we obtained written informed consent from all participants.
Measurements
Quality of Life
QoL was assessed using the EuroQol. The EuroQol is a generic measure of health status, consisting of two parts (EQ-5D and EQ-Visual Analogue Scale (VAS)).7 We used the official Dutch translation of the EQ-5D.9 The EQ-5D consists of five questions, covering the dimensions mobility, self-care, usual activities (work, study, housework, family, or leisure), pain or discomfort and anxiety or depression. Each dimension is divided into three levels: no problems, moderate problems or severe problems. A respondent’s health state is then defined by combining the levels on each of the five dimensions; this allows a possible 243 (=35) states of health to be defined. Valuations of these health states have been made for the general public in the Netherlands.10 The values, or utilities, are set on a scale on which 0 corresponds to death and 1, to a state of perfect health (EQ-5Dindex); a negative value represents a state “worse than death”.
The EQ-5D descriptive system, and the EQ-5Dindex have proved to be valid and reliable. There is extensive documentation (http://www.euroqol.org) concerning their construct validity, reliability, and responsiveness in use in both general and specific disease populations.
Four psychological testing assistants administered the EuroQol by a face-to-face interview. The EQ-5Dindex was scored as proposed by the original authors of the EQ-5D.7
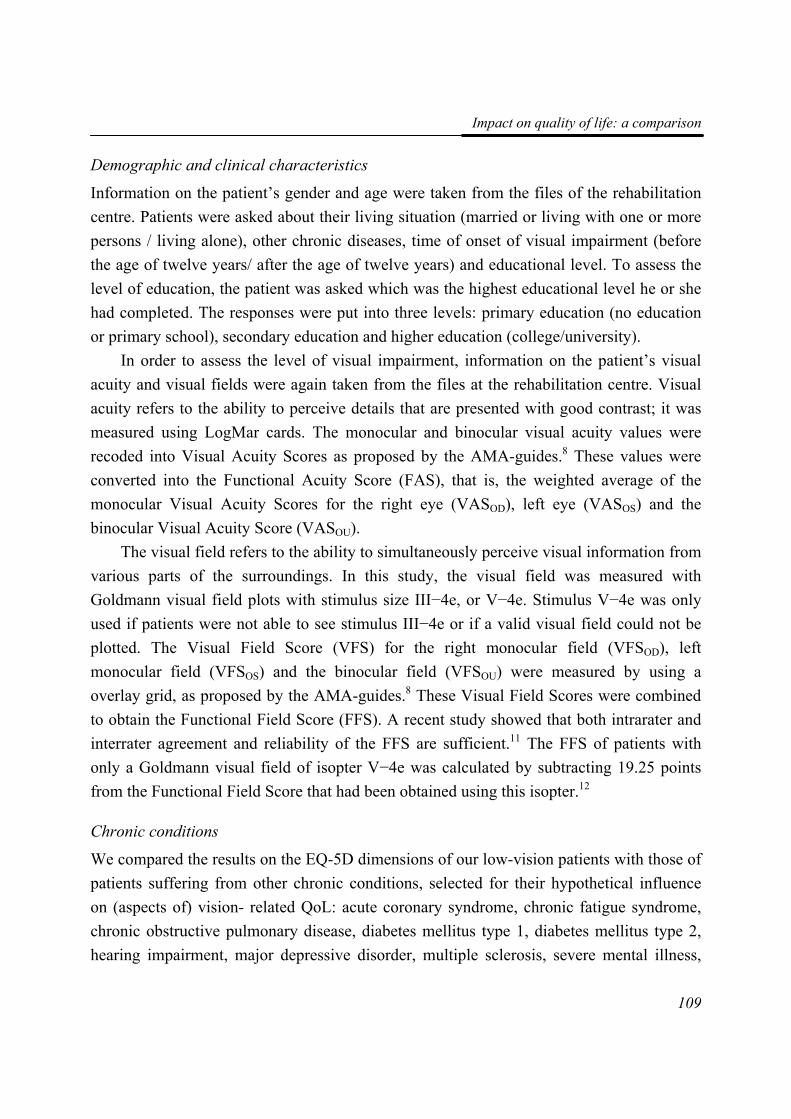
Impact on quality of life: a comparison
109
Demographic and clinical characteristics
Information on the patient’s gender and age were taken from the files of the rehabilitation centre. Patients were asked about their living situation (married or living with one or more persons / living alone), other chronic diseases, time of onset of visual impairment (before the age of twelve years/ after the age of twelve years) and educational level. To assess the level of education, the patient was asked which was the highest educational level he or she had completed. The responses were put into three levels: primary education (no education or primary school), secondary education and higher education (college/university).
In order to assess the level of visual impairment, information on the patient’s visual acuity and visual fields were again taken from the files at the rehabilitation centre. Visual acuity refers to the ability to perceive details that are presented with good contrast; it was measured using LogMar cards. The monocular and binocular visual acuity values were recoded into Visual Acuity Scores as proposed by the AMA-guides.8 These values were converted into the Functional Acuity Score (FAS), that is, the weighted average of the monocular Visual Acuity Scores for the right eye (VASOD), left eye (VASOS) and the binocular Visual Acuity Score (VASOU).
The visual field refers to the ability to simultaneously perceive visual information from various parts of the surroundings. In this study, the visual field was measured with Goldmann visual field plots with stimulus size III−4e, or V−4e. Stimulus V−4e was only used if patients were not able to see stimulus III−4e or if a valid visual field could not be plotted. The Visual Field Score (VFS) for the right monocular field (VFSOD), left monocular field (VFSOS) and the binocular field (VFSOU) were measured by using a overlay grid, as proposed by the AMA-guides.8 These Visual Field Scores were combined to obtain the Functional Field Score (FFS). A recent study showed that both intrarater and interrater agreement and reliability of the FFS are sufficient.11 The FFS of patients with only a Goldmann visual field of isopter V−4e was calculated by subtracting 19.25 points from the Functional Field Score that had been obtained using this isopter.12
Chronic conditions
We compared the results on the EQ-5D dimensions of our low-vision patients with those of patients suffering from other chronic conditions, selected for their hypothetical influence on (aspects of) vision- related QoL: acute coronary syndrome, chronic fatigue syndrome, chronic obstructive pulmonary disease, diabetes mellitus type 1, diabetes mellitus type 2, hearing impairment, major depressive disorder, multiple sclerosis, severe mental illness,
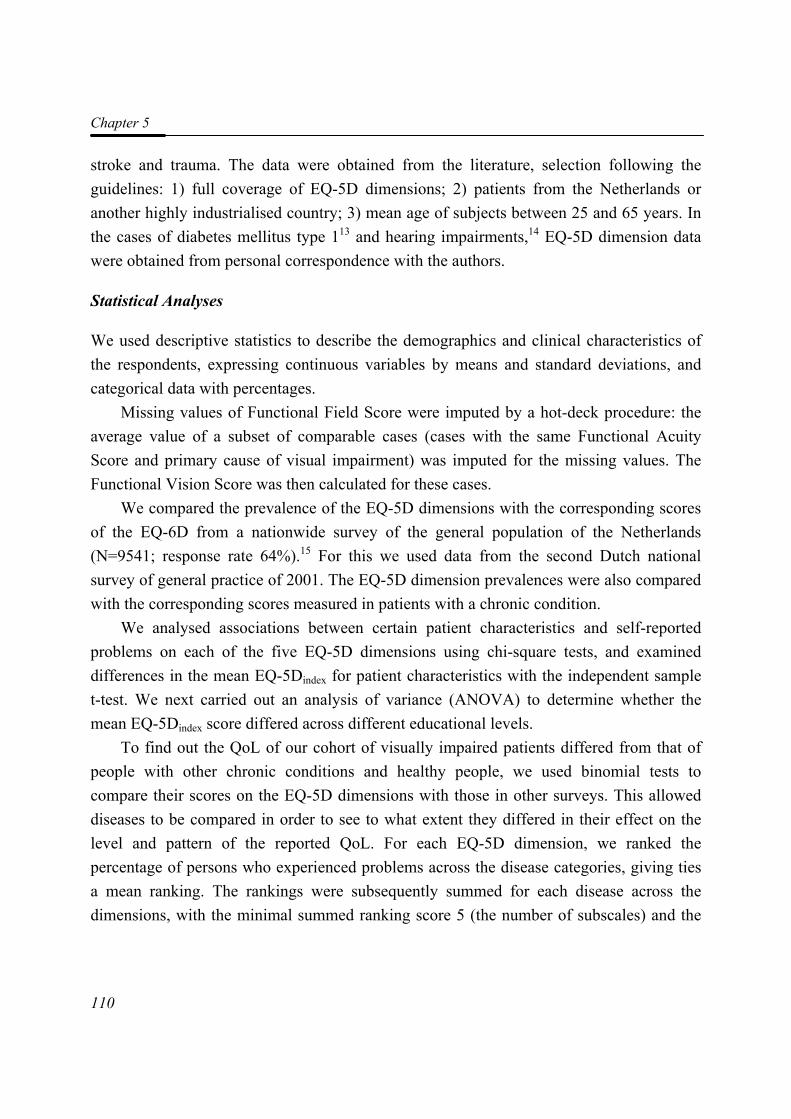
Chapter 5
110
stroke and trauma. The data were obtained from the literature, selection following the guidelines: 1) full coverage of EQ-5D dimensions; 2) patients from the Netherlands or another highly industrialised country; 3) mean age of subjects between 25 and 65 years. In the cases of diabetes mellitus type 113 and hearing impairments,14 EQ-5D dimension data were obtained from personal correspondence with the authors.
Statistical Analyses
We used descriptive statistics to describe the demographics and clinical characteristics of the respondents, expressing continuous variables by means and standard deviations, and categorical data with percentages.
Missing values of Functional Field Score were imputed by a hot-deck procedure: the average value of a subset of comparable cases (cases with the same Functional Acuity Score and primary cause of visual impairment) was imputed for the missing values. The Functional Vision Score was then calculated for these cases.
We compared the prevalence of the EQ-5D dimensions with the corresponding scores of the EQ-6D from a nationwide survey of the general population of the Netherlands (N=9541; response rate 64%).15 For this we used data from the second Dutch national survey of general practice of 2001. The EQ-5D dimension prevalences were also compared with the corresponding scores measured in patients with a chronic condition.
We analysed associations between certain patient characteristics and self-reported problems on each of the five EQ-5D dimensions using chi-square tests, and examined differences in the mean EQ-5Dindex for patient characteristics with the independent sample t-test. We next carried out an analysis of variance (ANOVA) to determine whether the mean EQ-5Dindex score differed across different educational levels.
To find out the QoL of our cohort of visually impaired patients differed from that of people with other chronic conditions and healthy people, we used binomial tests to compare their scores on the EQ-5D dimensions with those in other surveys. This allowed diseases to be compared in order to see to what extent they differed in their effect on the level and pattern of the reported QoL. For each EQ-5D dimension, we ranked the percentage of persons who experienced problems across the disease categories, giving ties a mean ranking. The rankings were subsequently summed for each disease across the dimensions, with the minimal summed ranking score 5 (the number of subscales) and the
Impact on quality of life: a comparison
111
maximum 65 (five times the number of diseases compared); a low ranking sum indicates good functioning.
We performed “sensitivity” analyses by excluding a number of patients from the binomial tests, because they had at least one comorbid condition, that was similar to one of the other chronic conditions. We then re-examined the ranking between the different chronic conditions. We used SPSS version 11.5 for all analyses.
Results
Non-response and loss to follow-up
A total of 134 persons were eligible for inclusion in the study, but six (4.4%) did not participate, either because of a weak general health (mainly fatigue), or not being interested in the study. There were no significant differences in age, gender, visual acuity and visual field between participants and non-participants (data not shown). All 128 participants completed each of the five dimensions of the EQ-5D; there were no missing data.
Baseline characteristics
The characteristics of the 128 patients who completed the EuroQol questionnaire are presented in Table 1. For nine persons, a visual field plot was unavailable or unreliable due to lack of fixation, and thus we imputed the Functional Field Score by the hot-deck procedure. No values were missing on the five dimensions of the EQ-5D. However, there was one missing value on the EQ-5DVAS: one person was unable to conceptualise his condition in a score from 0 to 100, and thus did not provide a response.
Quality of life within the low-vision group
The percentages of patients reporting problems on the five EuroQol dimensions mobility, self-care, daily activities, pain or discomfort, and anxiety or depression were 42%, 9%, 66%, 47% and 45%, respectively (Table 2). There was a significant association between the level of education and having problems with daily activities (Table 2). Patients aged below 41 years, and patients with comorbid conditions reported significantly more pain or discomfort than elderly patients or patients with no comorbid conditions. Patients with a Functional Acuity Score of higher than 50 had more problems with mobility, and patients
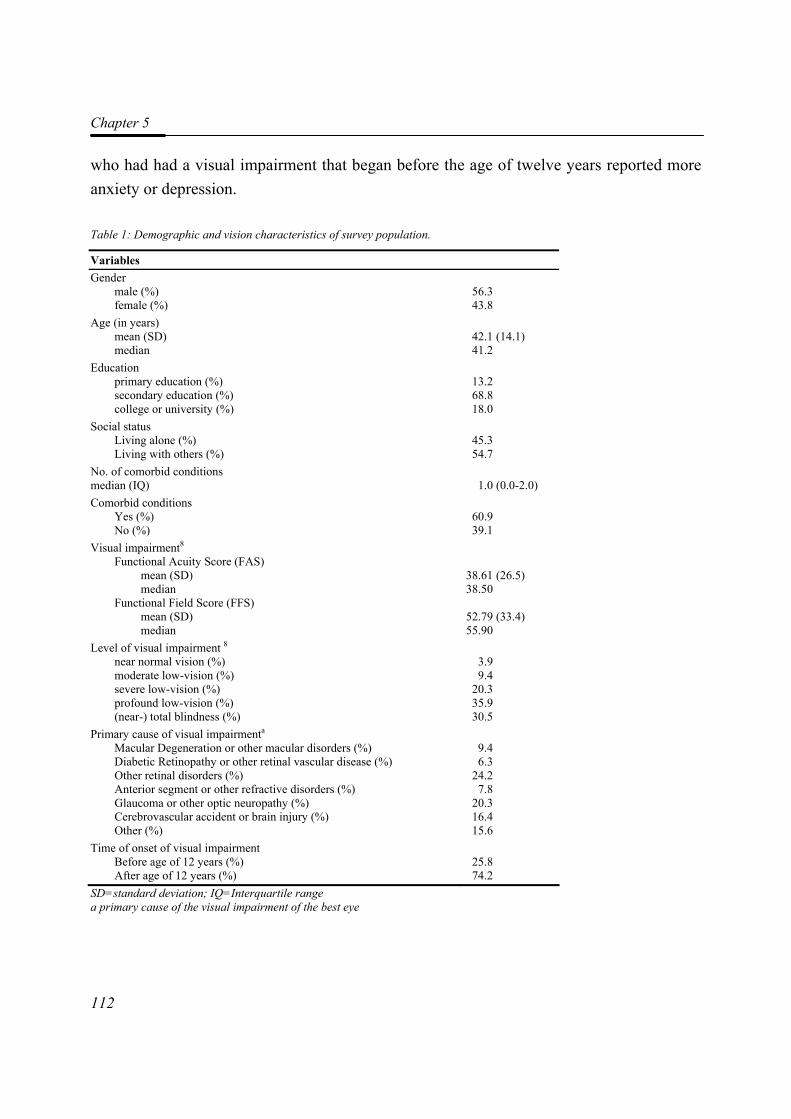
Chapter 5
112
who had had a visual impairment that began before the age of twelve years reported more anxiety or depression.
Table 1: Demographic and vision characteristics of survey population.
Variables Gender male (%) female (%)
56.3 43.8
Age (in years) mean (SD) median
42.1 (14.1) 41.2
Education primary education (%) secondary education (%) college or university (%)
13.2 68.8 18.0
Social status Living alone (%) Living with others (%)
45.3 54.7
No. of comorbid conditions median (IQ)
1.0 (0.0-2.0)
Comorbid conditions Yes (%) No (%)
60.9 39.1
Visual impairment8 Functional Acuity Score (FAS) mean (SD) median Functional Field Score (FFS) mean (SD) median
38.61 (26.5) 38.50
52.79 (33.4) 55.90
Level of visual impairment 8 near normal vision (%) moderate low-vision (%) severe low-vision (%) profound low-vision (%) (near-) total blindness (%)
3.9 9.4
20.3 35.9 30.5
Primary cause of visual impairmenta
Macular Degeneration or other macular disorders (%) Diabetic Retinopathy or other retinal vascular disease (%) Other retinal disorders (%) Anterior segment or other refractive disorders (%) Glaucoma or other optic neuropathy (%) Cerebrovascular accident or brain injury (%) Other (%)
9.4 6.3
24.2 7.8
20.3 16.4 15.6
Time of onset of visual impairment Before age of 12 years (%) After age of 12 years (%)
25.8 74.2
SD=standard deviation; IQ=Interquartile range a primary cause of the visual impairment of the best eye
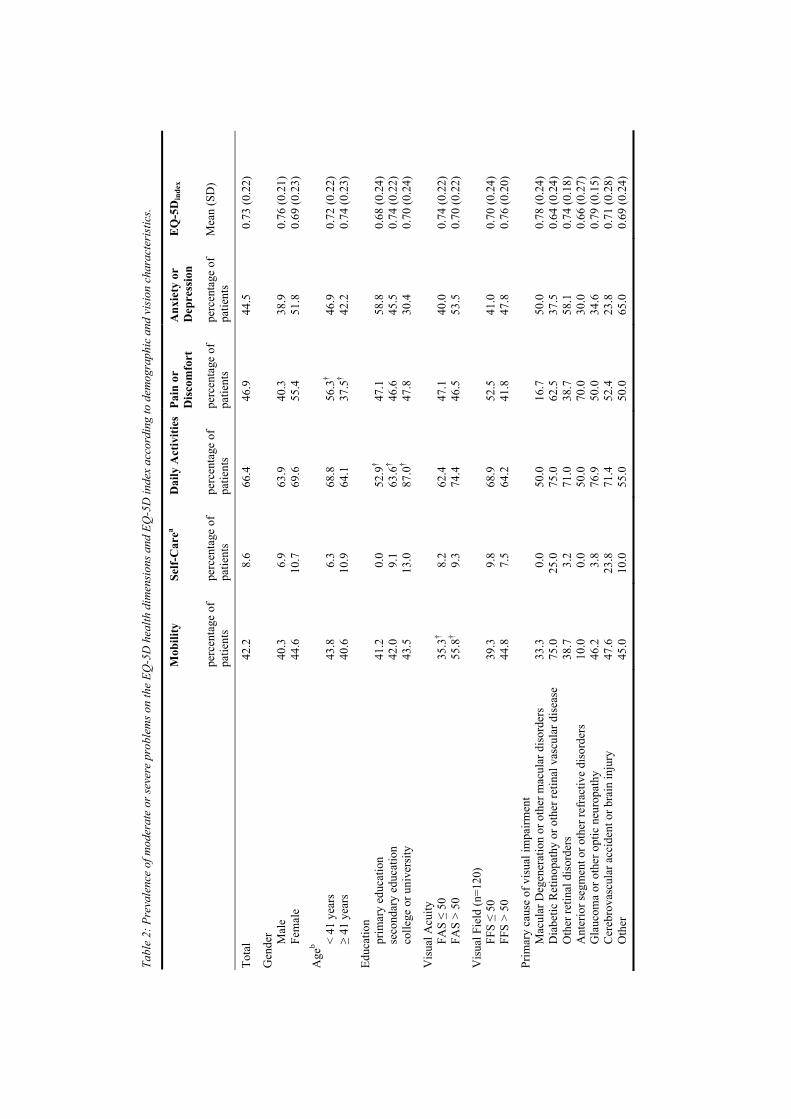
Tabl
e 2:
Pre
vale
nce
of m
oder
ate
or se
vere
pro
blem
s on
the
EQ-5
D h
ealth
dim
ensi
ons a
nd E
Q-5
D in
dex
acco
rdin
g to
dem
ogra
phic
and
vis
ion
char
acte
rist
ics.
Mob
ility
Se
lf-C
area
Dai
ly A
ctiv
ities
Pain
or
Dis
com
fort
A
nxie
ty o
r D
epre
ssio
n E
Q-5
Din
dex
perc
enta
ge o
f pa
tient
s pe
rcen
tage
of
patie
nts
perc
enta
ge o
f pa
tient
s pe
rcen
tage
of
patie
nts
perc
enta
ge o
f pa
tient
s M
ean
(SD
)
Tota
l 42
.2
8.6
66.4
46
.9
44.5
0.
73 (0
.22)
Gen
der
M
ale
Fe
mal
e
40
.3
44.6
6.
9 10
.7
63
.9
69.6
40
.3
55.4
38
.9
51.8
0.
76 (0
.21)
0.
69 (0
.23)
Age
b
< 41
yea
rs
≥
41 y
ears
43
.8
40.6
6.
3 10
.9
68
.8
64.1
56
.3†
37.5
†
46
.9
42.2
0.
72 (0
.22)
0.
74 (0
.23)
Educ
atio
n
prim
ary
educ
atio
n
seco
ndar
y ed
ucat
ion
co
llege
or u
nive
rsity
41
.2
42.0
43
.5
0.
0 9.
1 13
.0
52
.9†
63.6
† 87
.0†
47
.1
46.6
47
.8
58
.8
45.5
30
.4
0.
68 (0
.24)
0.
74 (0
.22)
0.
70 (0
.24)
Vis
ual A
cuity
FAS ≤
50
FA
S >
50
35
.3†
55.8
†
8.
2 9.
3
62
.4
74.4
47
.1
46.5
40
.0
53.5
0.
74 (0
.22)
0.
70 (0
.22)
Vis
ual F
ield
(n=1
20)
FF
S ≤
50
FF
S >
50
39
.3
44.8
9.
8 7.
5
68
.9
64.2
52
.5
41.8
41
.0
47.8
0.
70 (0
.24)
0.
76 (0
.20)
Prim
ary
caus
e of
vis
ual i
mpa
irmen
t
M
acul
ar D
egen
erat
ion
or o
ther
mac
ular
dis
orde
rs
D
iabe
tic R
etin
opat
hy o
r oth
er re
tinal
vas
cula
r dis
ease
Oth
er re
tinal
dis
orde
rs
A
nter
ior s
egm
ent o
r oth
er re
frac
tive
diso
rder
s
Gla
ucom
a or
oth
er o
ptic
neu
ropa
thy
C
ereb
rova
scul
ar a
ccid
ent o
r bra
in in
jury
Oth
er
33
.3
75.0
38
.7
10.0
46
.2
47.6
45
.0
0.
0 25
.0
3.2
0.0
3.8
23.8
10
.0
50
.0
75.0
71
.0
50.0
76
.9
71.4
55
.0
16
.7
62.5
38
.7
70.0
50
.0
52.4
50
.0
50
.0
37.5
58
.1
30.0
34
.6
23.8
65
.0
0.
78 (0
.24)
0.
64 (0
.24)
0.
74 (0
.18)
0.
66 (0
.27)
0.
79 (0
.15)
0.
71 (0
.28)
0.
69 (0
.24)
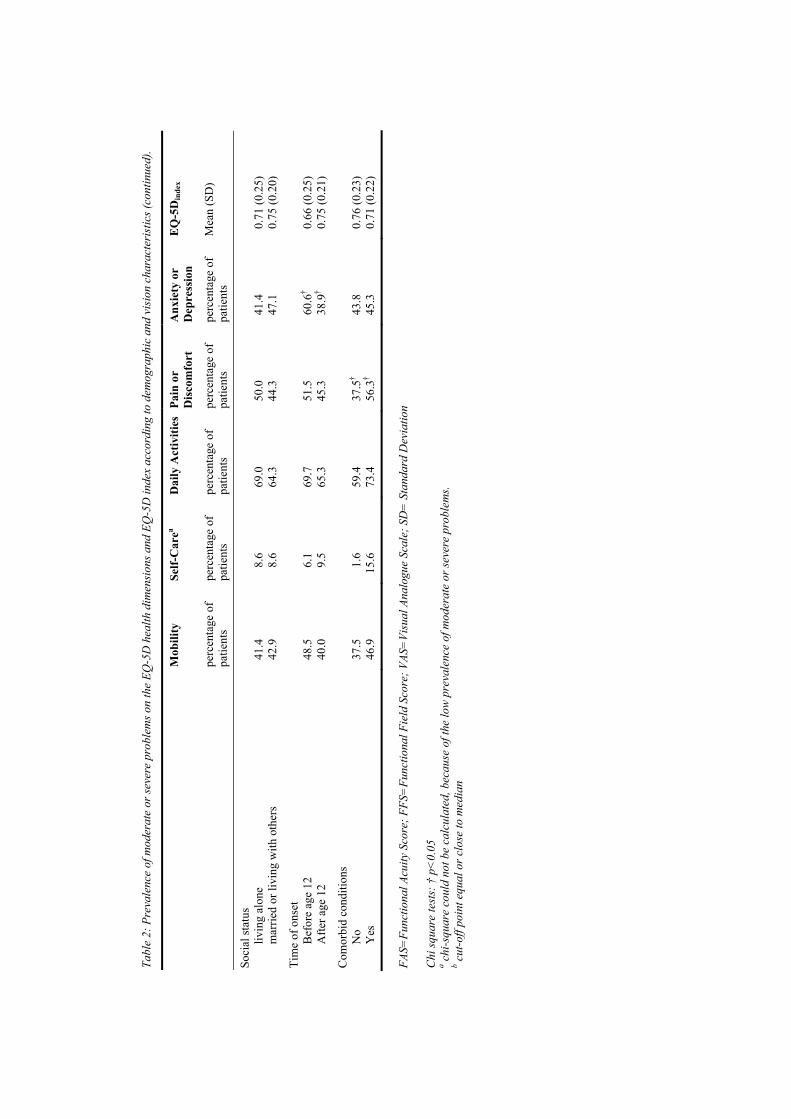
Tabl
e 2:
Pre
vale
nce
of m
oder
ate
or se
vere
pro
blem
s on
the
EQ-5
D h
ealth
dim
ensi
ons a
nd E
Q-5
D in
dex
acco
rdin
g to
dem
ogra
phic
and
vis
ion
char
acte
rist
ics (
cont
inue
d).
M
obili
ty
Self-
Car
ea D
aily
Act
iviti
es
Pain
or
Dis
com
fort
A
nxie
ty o
r D
epre
ssio
n E
Q-5
Din
dex
pe
rcen
tage
of
patie
nts
perc
enta
ge o
f pa
tient
s pe
rcen
tage
of
patie
nts
perc
enta
ge o
f pa
tient
s pe
rcen
tage
of
patie
nts
Mea
n (S
D)
Soci
al st
atus
livin
g al
one
m
arrie
d or
livi
ng w
ith o
ther
s
41
.4
42.9
8.
6 8.
6
69
.0
64.3
50
.0
44.3
41
.4
47.1
0.
71 (0
.25)
0.
75 (0
.20)
Tim
e of
ons
et
B
efor
e ag
e 12
Afte
r age
12
48
.5
40.0
6.
1 9.
5
69
.7
65.3
51
.5
45.3
60
.6†
38.9
†
0.
66 (0
.25)
0.
75 (0
.21)
Com
orbi
d co
nditi
ons
N
o
Yes
37
.5
46.9
1.
6 15
.6
59
.4
73.4
37
.5†
56.3
†
43
.8
45.3
0.
76 (0
.23)
0.
71 (0
.22)
FA
S=Fu
nctio
nal A
cuity
Sco
re; F
FS=
Func
tiona
l Fie
ld S
core
; VAS
=Vi
sual
Ana
logu
e Sc
ale;
SD
= S
tand
ard
Dev
iatio
n C
hi sq
uare
test
s: †
p<
0.05
a c
hi-s
quar
e co
uld
not b
e ca
lcul
ated
, bec
ause
of t
he lo
w p
reva
lenc
e of
mod
erat
e or
seve
re p
robl
ems.
b cut
-off
poin
t equ
al o
r clo
se to
med
ian
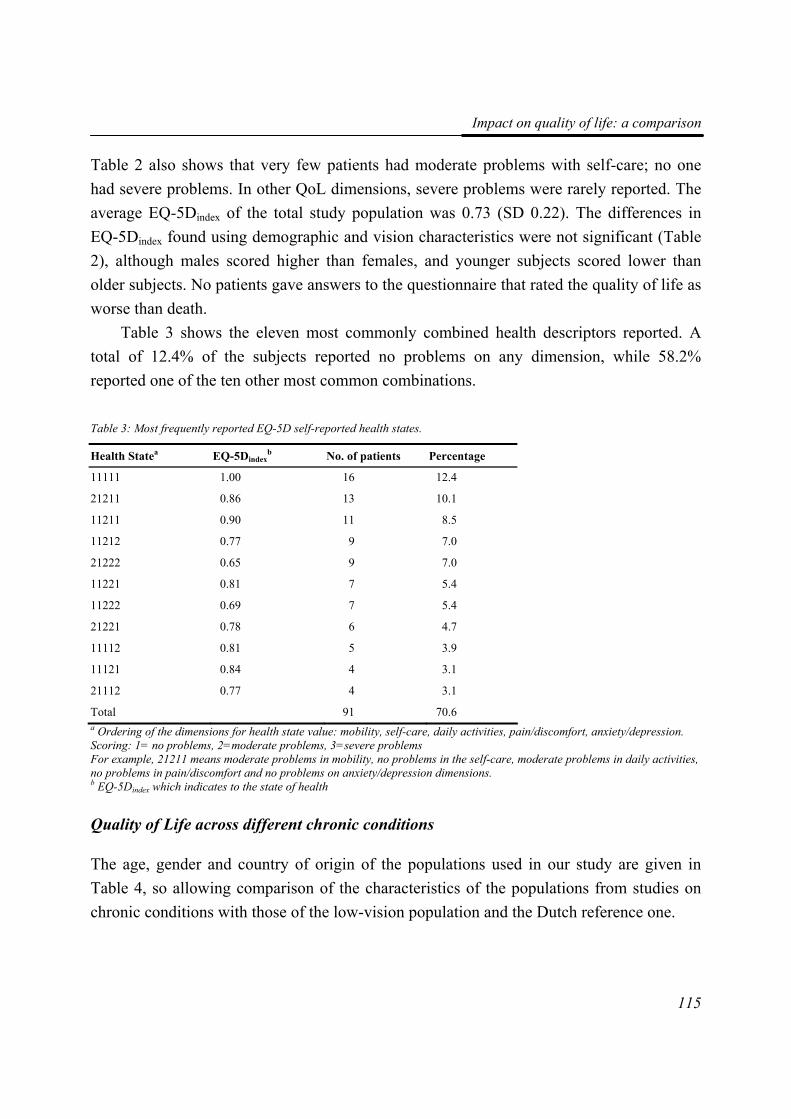
Impact on quality of life: a comparison
115
Table 2 also shows that very few patients had moderate problems with self-care; no one had severe problems. In other QoL dimensions, severe problems were rarely reported. The average EQ-5Dindex of the total study population was 0.73 (SD 0.22). The differences in EQ-5Dindex found using demographic and vision characteristics were not significant (Table 2), although males scored higher than females, and younger subjects scored lower than older subjects. No patients gave answers to the questionnaire that rated the quality of life as worse than death.
Table 3 shows the eleven most commonly combined health descriptors reported. A total of 12.4% of the subjects reported no problems on any dimension, while 58.2% reported one of the ten other most common combinations.
Table 3: Most frequently reported EQ-5D self-reported health states.
Health Statea EQ-5Dindexb No. of patients Percentage
11111 1.00 16 12.4
21211 0.86 13 10.1
11211 0.90 11 8.5
11212 0.77 9 7.0
21222 0.65 9 7.0
11221 0.81 7 5.4
11222 0.69 7 5.4
21221 0.78 6 4.7
11112 0.81 5 3.9
11121 0.84 4 3.1
21112 0.77 4 3.1
Total 91 70.6 a Ordering of the dimensions for health state value: mobility, self-care, daily activities, pain/discomfort, anxiety/depression. Scoring: 1= no problems, 2=moderate problems, 3=severe problems For example, 21211 means moderate problems in mobility, no problems in the self-care, moderate problems in daily activities, no problems in pain/discomfort and no problems on anxiety/depression dimensions. b EQ-5Dindex which indicates to the state of health
Quality of Life across different chronic conditions
The age, gender and country of origin of the populations used in our study are given in Table 4, so allowing comparison of the characteristics of the populations from studies on chronic conditions with those of the low-vision population and the Dutch reference one.
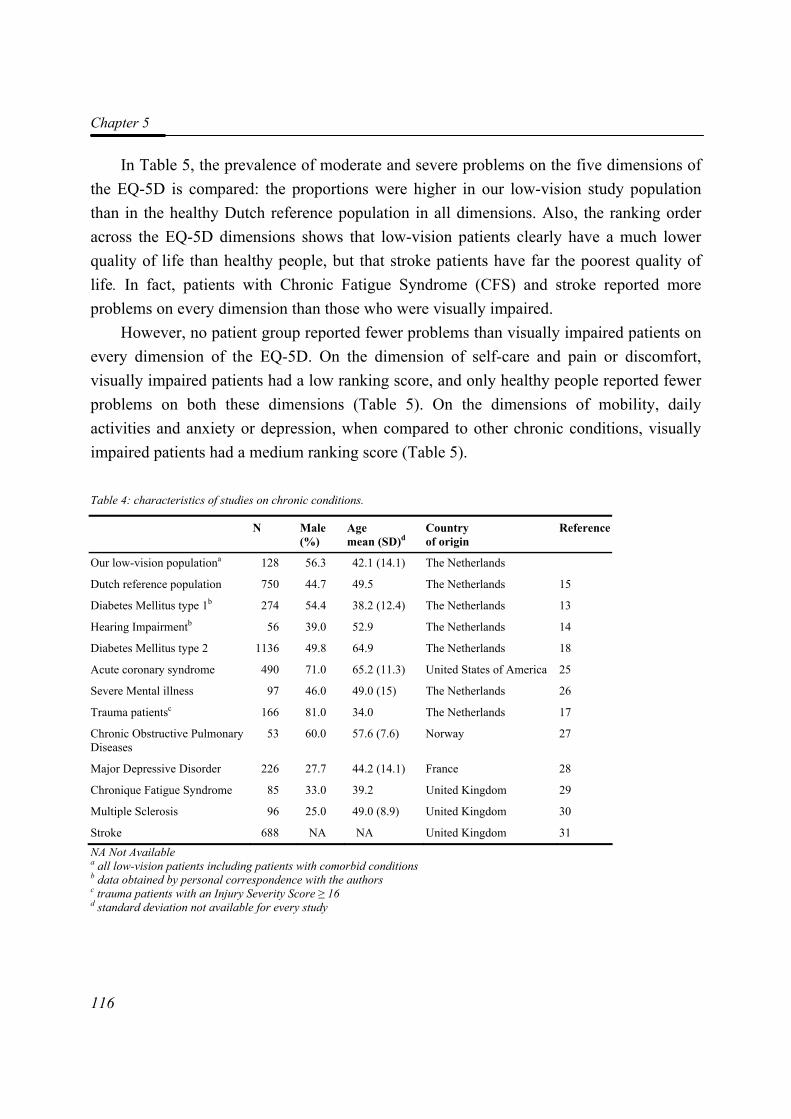
Chapter 5
116
In Table 5, the prevalence of moderate and severe problems on the five dimensions of the EQ-5D is compared: the proportions were higher in our low-vision study population than in the healthy Dutch reference population in all dimensions. Also, the ranking order across the EQ-5D dimensions shows that low-vision patients clearly have a much lower quality of life than healthy people, but that stroke patients have far the poorest quality of life. In fact, patients with Chronic Fatigue Syndrome (CFS) and stroke reported more problems on every dimension than those who were visually impaired.
However, no patient group reported fewer problems than visually impaired patients on every dimension of the EQ-5D. On the dimension of self-care and pain or discomfort, visually impaired patients had a low ranking score, and only healthy people reported fewer problems on both these dimensions (Table 5). On the dimensions of mobility, daily activities and anxiety or depression, when compared to other chronic conditions, visually impaired patients had a medium ranking score (Table 5).
Table 4: characteristics of studies on chronic conditions.
N Male (%)
Age mean (SD)d
Country of origin
Reference
Our low-vision populationa 128 56.3 42.1 (14.1) The Netherlands
Dutch reference population 750 44.7 49.5 The Netherlands 15
Diabetes Mellitus type 1b 274 54.4 38.2 (12.4) The Netherlands 13
Hearing Impairmentb 56 39.0 52.9 The Netherlands 14
Diabetes Mellitus type 2 1136 49.8 64.9 The Netherlands 18
Acute coronary syndrome 490 71.0 65.2 (11.3) United States of America 25
Severe Mental illness 97 46.0 49.0 (15) The Netherlands 26
Trauma patientsc 166 81.0 34.0 The Netherlands 17
Chronic Obstructive Pulmonary Diseases
53 60.0 57.6 (7.6) Norway 27
Major Depressive Disorder 226 27.7 44.2 (14.1) France 28
Chronique Fatigue Syndrome 85 33.0 39.2 United Kingdom 29
Multiple Sclerosis 96 25.0 49.0 (8.9) United Kingdom 30
Stroke 688 NA NA United Kingdom 31 NA Not Available a all low-vision patients including patients with comorbid conditions b data obtained by personal correspondence with the authors c trauma patients with an Injury Severity Score ≥ 16 d standard deviation not available for every study
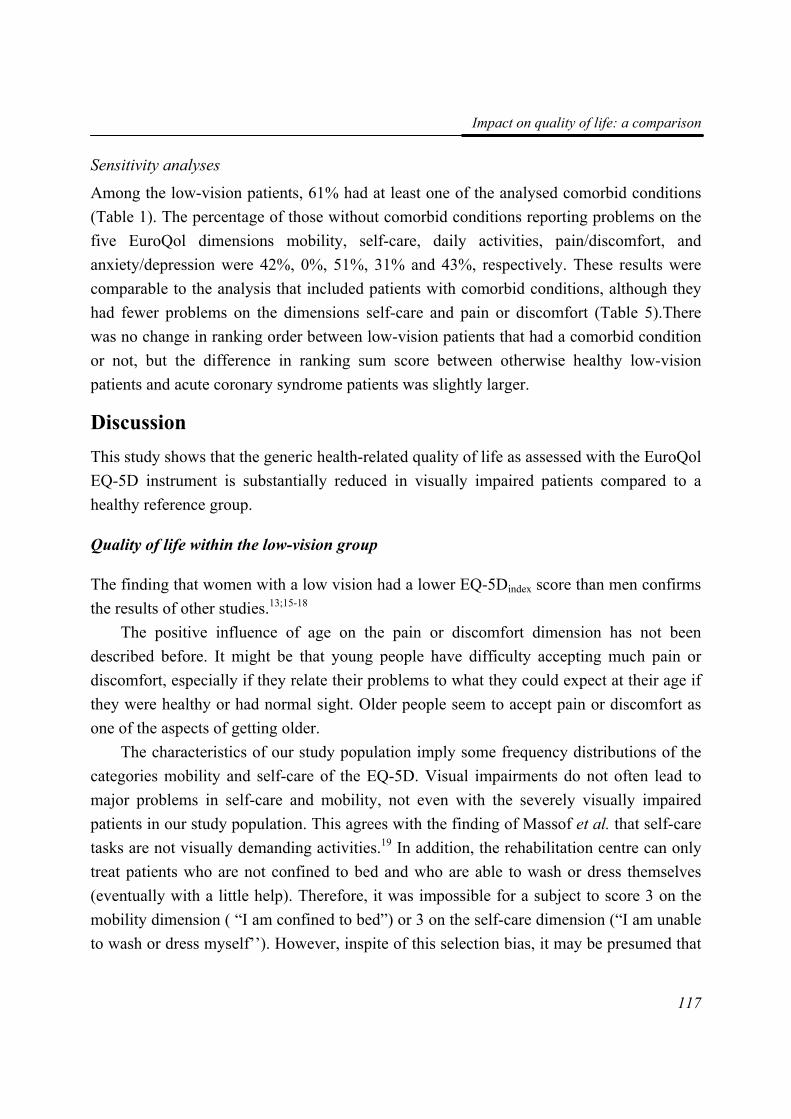
Impact on quality of life: a comparison
117
Sensitivity analyses
Among the low-vision patients, 61% had at least one of the analysed comorbid conditions (Table 1). The percentage of those without comorbid conditions reporting problems on the five EuroQol dimensions mobility, self-care, daily activities, pain/discomfort, and anxiety/depression were 42%, 0%, 51%, 31% and 43%, respectively. These results were comparable to the analysis that included patients with comorbid conditions, although they had fewer problems on the dimensions self-care and pain or discomfort (Table 5).There was no change in ranking order between low-vision patients that had a comorbid condition or not, but the difference in ranking sum score between otherwise healthy low-vision patients and acute coronary syndrome patients was slightly larger.
Discussion This study shows that the generic health-related quality of life as assessed with the EuroQol EQ-5D instrument is substantially reduced in visually impaired patients compared to a healthy reference group.
Quality of life within the low-vision group
The finding that women with a low vision had a lower EQ-5Dindex score than men confirms the results of other studies.13;15-18
The positive influence of age on the pain or discomfort dimension has not been described before. It might be that young people have difficulty accepting much pain or discomfort, especially if they relate their problems to what they could expect at their age if they were healthy or had normal sight. Older people seem to accept pain or discomfort as one of the aspects of getting older.
The characteristics of our study population imply some frequency distributions of the categories mobility and self-care of the EQ-5D. Visual impairments do not often lead to major problems in self-care and mobility, not even with the severely visually impaired patients in our study population. This agrees with the finding of Massof et al. that self-care tasks are not visually demanding activities.19 In addition, the rehabilitation centre can only treat patients who are not confined to bed and who are able to wash or dress themselves (eventually with a little help). Therefore, it was impossible for a subject to score 3 on the mobility dimension ( “I am confined to bed”) or 3 on the self-care dimension (“I am unable to wash or dress myself’’). However, inspite of this selection bias, it may be presumed that
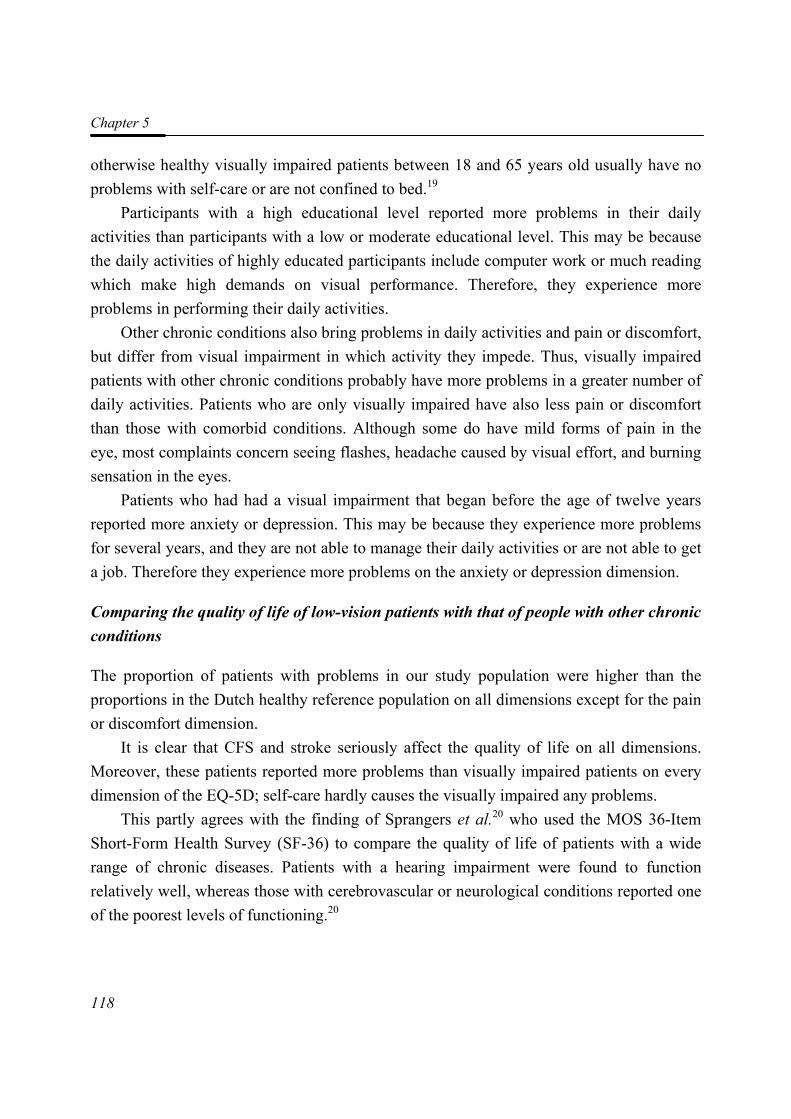
Chapter 5
118
otherwise healthy visually impaired patients between 18 and 65 years old usually have no problems with self-care or are not confined to bed.19
Participants with a high educational level reported more problems in their daily activities than participants with a low or moderate educational level. This may be because the daily activities of highly educated participants include computer work or much reading which make high demands on visual performance. Therefore, they experience more problems in performing their daily activities.
Other chronic conditions also bring problems in daily activities and pain or discomfort, but differ from visual impairment in which activity they impede. Thus, visually impaired patients with other chronic conditions probably have more problems in a greater number of daily activities. Patients who are only visually impaired have also less pain or discomfort than those with comorbid conditions. Although some do have mild forms of pain in the eye, most complaints concern seeing flashes, headache caused by visual effort, and burning sensation in the eyes.
Patients who had had a visual impairment that began before the age of twelve years reported more anxiety or depression. This may be because they experience more problems for several years, and they are not able to manage their daily activities or are not able to get a job. Therefore they experience more problems on the anxiety or depression dimension.
Comparing the quality of life of low-vision patients with that of people with other chronic conditions
The proportion of patients with problems in our study population were higher than the proportions in the Dutch healthy reference population on all dimensions except for the pain or discomfort dimension.
It is clear that CFS and stroke seriously affect the quality of life on all dimensions. Moreover, these patients reported more problems than visually impaired patients on every dimension of the EQ-5D; self-care hardly causes the visually impaired any problems.
This partly agrees with the finding of Sprangers et al.20 who used the MOS 36-Item Short-Form Health Survey (SF-36) to compare the quality of life of patients with a wide range of chronic diseases. Patients with a hearing impairment were found to function relatively well, whereas those with cerebrovascular or neurological conditions reported one of the poorest levels of functioning.20
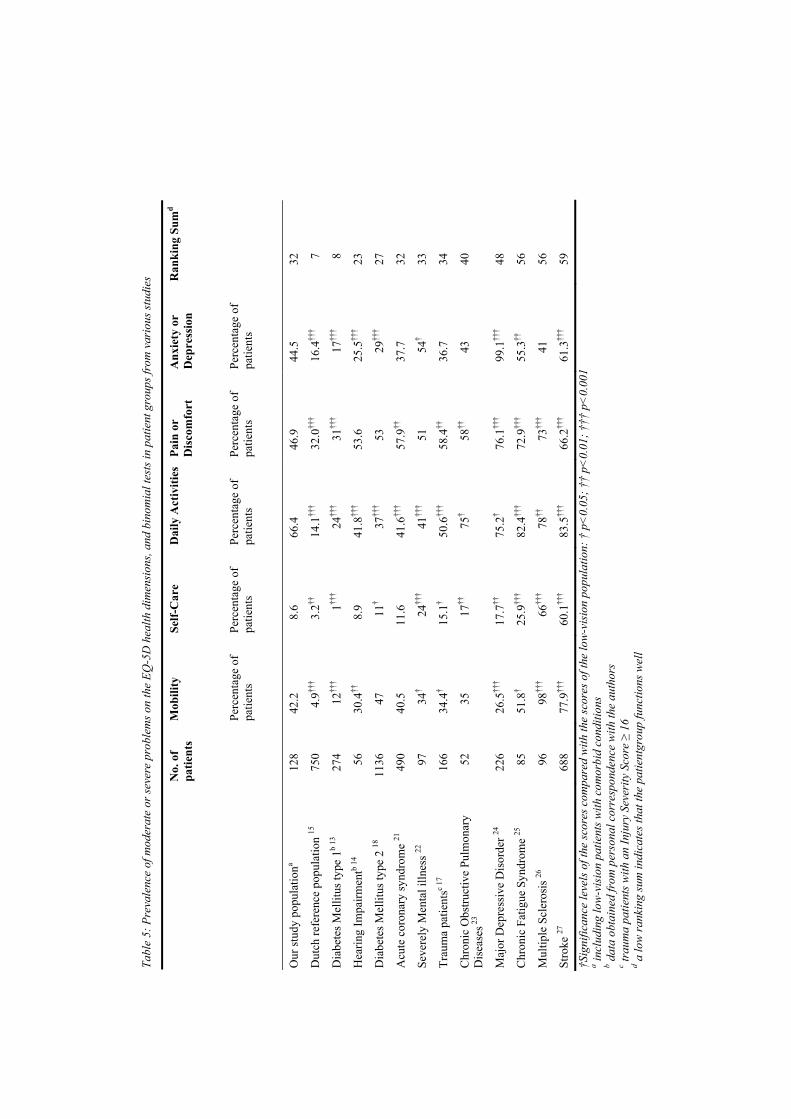
Tabl
e 5:
Pre
vale
nce
of m
oder
ate
or se
vere
pro
blem
s on
the
EQ-5
D h
ealth
dim
ensi
ons,
and
bino
mia
l tes
ts in
pat
ient
gro
ups f
rom
var
ious
stud
ies
Mob
ility
Se
lf-C
are
Dai
ly A
ctiv
ities
Pa
in o
r D
isco
mfo
rt
Anx
iety
or
Dep
ress
ion
N
o. o
f pa
tient
s
Perc
enta
ge o
f pa
tient
s Pe
rcen
tage
of
patie
nts
Perc
enta
ge o
f pa
tient
s Pe
rcen
tage
of
patie
nts
Perc
enta
ge o
f pa
tient
s
Ran
king
Sum
d
Our
stud
y po
pula
tiona
128
42.2
8.
6 66
.4
46.9
44
.5
32
Dut
ch re
fere
nce
popu
latio
n 15
75
0 4.
9†††
3.2††
14
.1††
† 32
.0††
† 16
.4††
† 7
Dia
bete
s Mel
litus
type
1b
13
274
12††
† 1††
† 24
†††
31††
† 17
†††
8
Hea
ring
Impa
irmen
tb 14
56
30
.4††
8.
9 41
.8††
† 53
.6
25.5
†††
23
Dia
bete
s Mel
litus
type
2 18
11
36
47
11†
37††
† 53
29
†††
27
Acu
te c
oron
ary
synd
rom
e 21
49
0 40
.5
11.6
41
.6††
† 57
.9††
37
.7
32
Seve
rely
Men
tal i
llnes
s 22
97
34†
24††
† 41
†††
51
54†
33
Trau
ma
patie
ntsc
17
166
34.4
† 15
.1†
50.6
†††
58.4
††
36.7
34
Chr
onic
Obs
truct
ive
Pulm
onar
y D
isea
ses 2
3 52
35
17
††
75†
58††
43
40
Maj
or D
epre
ssiv
e D
isor
der 24
22
6 26
.5††
† 17
.7††
75
.2†
76.1
†††
99.1
†††
48
Chr
onic
Fat
igue
Syn
drom
e 25
85
51
.8†
25.9
†††
82.4
†††
72.9
†††
55.3
††
56
Mul
tiple
Scl
eros
is 26
96
98
†††
66††
† 78
††
73††
† 41
56
Stro
ke 27
68
8 77
.9††
† 60
.1††
† 83
.5††
† 66
.2††
† 61
.3††
† 59
†S
igni
fican
ce le
vels
of t
he sc
ores
com
pare
d w
ith th
e sc
ores
of t
he lo
w-v
isio
n po
pula
tion:
† p
<0.
05; †
† p<
0.01
; †††
p<
0.00
1
a incl
udin
g lo
w-v
isio
n pa
tient
s with
com
orbi
d co
nditi
ons
b dat
a ob
tain
ed fr
om p
erso
nal c
orre
spon
denc
e w
ith th
e au
thor
s c tr
aum
a pa
tient
s with
an
Inju
ry S
ever
ity S
core
≥ 1
6 d a
low
rank
ing
sum
indi
cate
s tha
t the
pat
ient
grou
p fu
nctio
ns w
ell
Chapter 5
120
Methodological limitations
There are several limitations to the present study. Firstly, the elderly are poorly represented as the patients visiting the rehabilitation centre are aged from 18 to and 65 years. Since the elderly are the largest group of people with a visual impairment, this limitation is important. Our results are only valid for the younger age category, and we need to find out whether they apply to the elderly.
Secondly, we used a self-report method to assess co morbid conditions. We chose this method because there are no comprehensive medical data on the patients at centre. We thus had to ask the patient, by means of an open-ended question, whether he or she suffered from any disease or condition other than eye disease. This is a weakness of the method, because it is questionable if participants were able to answer the question accurately. This, while the completeness of data obtained from interviews or questionnaires depends on the patients’ ability to adequately remember the diseases they suffer from. This ability is strongly influenced by the knowledge and memory of the patient.28 Accuracy is better in younger populations.29 Several studies showed that data from medical records should preferably be used, although data from interviews or questionnaires are a useful alternative.28;30 The severity of the comorbid condition was not asked for and therefore not analysed in this study. Future research might benefit from the use of validated self-report questionnaires which pay attention to the severity of the comorbid condition.
Thirdly, we administered the EuroQol by a face-to-face interview. There can be a communication problem between the interviewer and the participant, if the participant feels embarrased about giving certain answers. This mode of administration was chosen, because some persons were unable to read and/or write. Furthermore, reading is tiring for most participants and not everyone has help with filling in the forms. However, Wu et al.31 have shown that there are only slight differences in EQ-5Dindex scores when EuroQol data are collected by face-to-face interview rather than by the patient himself. Therefore, the influence of using face-to-face interviews for the EuroQol will most likely be small.
Fourthly, comparison of scores between studies raises questions of validity owing to differences in case definition and selection, comorbidity, age, and probably language and culture. For example, the mean age of patients with diabetes mellitus type 2 and patients with acute coronary syndrome was slightly higher than that of the low-vision patients, while trauma patients were younger. Several population-based studies showed that older
Impact on quality of life: a comparison
121
people report more problems than younger people, on all dimensions except for anxiety and depression.15;32;33 There was a higher proportion of males among trauma patients than in the low-vision population, whereas there were higher proportions of females with multiple sclerosis and chronic fatigue. Several population-based studies showed that women report more problems on all dimension than men.15;32;33
Finally, we compared results for the low-vision patients without comorbid conditions with those of patients with other chronic conditions. However, in the data from studies of chronic conditions, prevalences of visual impairments were not mentioned. It is therefore not certain that the quality of life of patients with other chronic conditions was also affected by visual impairment. This means that we may not have made a comparison between the influence on QoL of purely visual impairment with that of solely another chronic condition.
Conclusions Visual impairments have a substantial negative impact on the quality of life. Compared with other chronic conditions, it affects the health related quality of life more than diabetes mellitus type 2, and hearing impairment, but less than stroke, multiple sclerosis, chronic fatigue syndrome, major depressive disorder and severe mental illness. Future research should indicate whether these results can be extended to elderly people.
References 1. Resnikoff S, Pascolini D, Etya'ale D, Kocur I, Pararajasegaram R, Pokharel GP and
Mariotti SP. (2004). Global data on visual impairment in the year 2002. Bulletin of the World Health Organization. 82 (11): 844-851.
2. Limburg H, den Boon JM, Hogeweg M, Gevers RJ, Keunen JE and ten Hove GT. (2005). [Avoidable visual impairment in The Netherlands: the project "Vision 2020 Netherlands" of the World Health Organization]. Nederlands Tijdschrift Voor Geneeskunde. 149 (11): 577-582.
3. de Boer MR, Moll AC, de Vet HCW, Terwee CB, Volker-Dieben HJM and van Rens GHMB. (2004). Psychometric properties of vision-related quality of life questionnaires: a systematic review. Ophthalmic and Physiological Optics. 24 (4): 257-273.
4. Margolis MK, Coyne K, Kennedy-Martin T, Baker T, Schein O and Revicki DA. (2002). Vision-specific instruments for the assessment of health-related quality of life and visual functioning: a literature review. Pharmacoeconomics. 20 (12): 791-812.
5. Massof RW and Rubin GS. (2001). Visual function assessment questionnaires. Survey of Ophthalmology. 45 (6): 531-548.
Chapter 5
122
6. Mangione CM, Lee PP, Pitts J, Gutierrez P, Berry S and Hays RD. (1998). Psychometric properties of the National Eye Institute Visual Function Questionnaire (NEI-VFQ). NEI-VFQ Field Test Investigators. Archives of Ophthalmology. 116 (11): 1496-1504.
7. Brooks R. (1996). EuroQol: the current state of play. Health Policy. 37 (1): 53-72.
8. Cocchiarella L and Andersson G.(2001). The visual system. In: Andersson G, Cocchiarella L, eds. Guides to the evaluation of permanent impairment. 5th ed. Chicago, Ill: American Medical Association; 277-304.
9. EuroQol Group. (1996). EQ-5D User guide. Rotterdam, the Netherlands: EuroQol Business Management.
10. Lamers LM, Stalmeier PF, McDonnell J, Krabbe PF and van Busschbach JJ. (2005). [Measuring the quality of life in cost-utility analyses: the Dutch EQ-5D tariff]. Nederlands Tijdschrift Voor Geneeskunde. 149 (28): 1574-1578.
11. Langelaan M, Wouters B, Moll AC, de Boer MR and van Rens GHMB. (2005). Intra- and interrater agreement and reliability of the Functional Field Score. Ophthalmic and Physiological Optics. 25 (2): 136-142.
12. Langelaan M, Wouters B, Moll AC, de Boer MR and van Rens GHMB. (2006). Functional field score: the effect of using a Goldmann V−4e isopter instead of a Goldmann III-4e isopter. Investigative Ophthalmology and Visual Science. 47 (5): 1817-1823.
13. Hart HE, Bilo HJ, Redekop WK, Stolk RP, Assink JH and Meyboom-de Jong B. (2003). Quality of life of patients with type I diabetes mellitus. Quality of Life Research. 12 (8): 1089-1097.
14. Hol MK, Spath MA, Krabbe PF, van der Pouw CT, Snik AF, Cremers CW and Mylanus EA. (2004). The bone-anchored hearing aid: quality-of-life assessment. Archives of Otolaryngology -- Head and Neck Surgery. 130 (4): 394-399.
15. Hoeymans N, van Lindert H and Westert GP. (2005). The health status of the Dutch population as assessed by the EQ-6D. Quality of Life Research. 14 (3): 655-663.
16. Meerding WJ, Looman CW, Essink-Bot ML, Toet H, Mulder S and van Beeck EF. (2004). Distribution and determinants of health and work status in a comprehensive population of injury patients. Journal of Trauma. 56 (1): 150-161.
17. Vles WJ, Steyerberg EW, Essink-Bot ML, van Beeck EF, Meeuwis JD and Leenen LP. (2005). Prevalence and determinants of disabilities and return to work after major trauma. Journal of Trauma. 58 (1): 126-135.
18. Redekop WK, Koopmanschap MA, Stolk RP, Rutten GE, Wolffenbuttel BH and Niessen LW. (2002). Health-related quality of life and treatment satisfaction in Dutch patients with type 2 diabetes. Diabetes Care. 25 (3): 458-463.
19. Massof RW, Hsu CT, Baker FH, Barnett GD, Park WL, Deremeik JT, Rainey C and Epstein C. (2005). Visual disability variables. I: the importance and difficulty of activity
Impact on quality of life: a comparison
123
goals for a sample of low-vision patients. Archives of Physical Medicine and Rehabilitation. 86 (5): 946-953.
20. Sprangers MA, de Regt EB, Andries F, van Agt HM, Bijl RV, de Boer JB, Foets M, Hoeymans N, Jacobs AE, Kempen GI, Miedema HS, Tijhuis MA and de Haes HC. (2000). Which chronic conditions are associated with better or poorer quality of life? Journal of Clinical Epidemiology. 53 (9): 895-907.
21. Ellis JJ, Eagle KA, Kline-Rogers EM and Erickson SR. (2005). Validation of the EQ-5D in patients with a history of acute coronary syndrome. Current Medical Research and Opinion. 21 (8): 1209-1216.
22. Wiersma D and van Busschbach J. (2001). Are needs and satisfaction of care associated with quality of life? An epidemiological survey among the severely mentally ill in the Netherlands. European Archives of Psychiatry and Clinical Neuroscience. 251 (5): 239-246.
23. Stavem K and Jodalen H. (2002). Reliability and validity of the COOP/WONCA health status measure in patients with chronic obstructive pulmonary disease. Quality of Life Research. 11 (6): 527-533.
24. Sapin C, Fantino B, Nowicki ML and Kind P. (2004). Usefulness of EQ-5D in assessing health status in primary care patients with major depressive disorder. Health and Quality of Life Outcomes. 2 20.
25. Myers C and Wilks D. (1999). Comparison of Euroqol EQ-5D and SF-36 in patients with chronic fatigue syndrome. Quality of Life Research. 8 (1-2): 9-16.
26. Nicholl CR, Lincoln NB, Francis VM and Stephan TF. (2001). Assessing quality of life in people with multiple sclerosis. Disability and Rehabilitation. 23 (14): 597-603.
27. Dorman PJ, Dennis M and Sandercock P. (1999). How do scores on the EuroQol relate to scores on the SF-36 after stroke? Stroke. 30 (10): 2146-2151.
28. de Groot V, Beckerman H, Lankhorst GJ and Bouter LM. (2003). How to measure comorbidity. a critical review of available methods. Journal of Clinical Epidemiology. 56 (3): 221-229.
29. Boissonnault WG and Badke MB. (2005). Collecting health history information: the accuracy of a patient self-administered questionnaire in an orthopedic outpatient setting. Physical Therapy. 85 (6): 531-543.
30. Katz JN, Chang LC, Sangha O, Fossel AH and Bates DW. (1996). Can comorbidity be measured by questionnaire rather than medical record review? Medical Care. 34 (1): 73-84.
31. Wu AW, Jacobson DL, Berzon RA, Revicki DA, van der Horst C., Fichtenbaum CJ, Saag MS, Lynn L, Hardy D and Feinberg J. (1997). The effect of mode of administration on medical outcomes study health ratings and EuroQol scores in AIDS. Quality of Life Research. 6 (1): 3-10.
Chapter 5
124
32. Kind P, Dolan P, Gudex C and Williams A. (1998). Variations in population health status: results from a United Kingdom national questionnaire survey. British Medical Journal. 316 (7133): 736-741.
33. Luo N, Johnson JA, Shaw JW, Feeny D and Coons SJ. (2005). Self-reported health status of the general adult U.S. population as assessed by the EQ-5D and Health Utilities Index. Medical Care. 43 (11): 1078-1086.
66
VViissuuaall FFuunnccttiioonniinngg QQuueessttiioonnnnaaiirree:: rree--eevvaalluuaattiioonn ooff ppssyycchhoommeettrriicc
pprrooppeerrttiieess ffoorr aa ggrroouupp ooff wwoorrkkiinngg aaggee aadduullttss
Maaike Langelaan, Ruth M.A. van Nispen,
Dirk L. Knol, Annette C. Moll, Michiel R. de Boer, Bill Wouters, Ger HMB van Rens
(accepted for publication)
Chapter 6
126
Abstract Purpose. The Visual Functioning Questionnaire (VFQ-25) is one of the most widely used measures of vision-related quality of life. However, the questionnaire does not meet some psychometric quality criteria. The objectives of this study were first to obtain the factor structure of the VFQ-25. Second, to obtain interval scales by Rasch analysis. Methods. The questionnaire was administered to 129 visually impaired adults (mean age 42.1 years; range 21-67 years). First, the items of the VFQ-25 were subjected to an exploratory factor analysis with Promax rotation. Next, we performed a separate Rasch analysis on each factor. We examined step thresholds and goodness of fit statistics of the items. Finally, we examined differential item functioning. Results. Factor analysis indicated four factors: Near Activities, Distance Activities & Mobility, Mental Health & Dependency, and Pain & Discomfort. They accounted for 46.37% of the total variance. Most items showed some degree of disordering. After collapsing response categories, all items showed ordered thresholds. The Near Activities domain showed excellent fit, the Distance Activities & Mobility domain good fit, the Mental Health & Dependency domain and the Pain & Discomfort domain an unsatisfactory fit. There were two items showing uniform differential item functioning. Conclusions. The four-factor structure of the VFQ-25 largely confirms the structure of the questionnaire. However, the results of this study suggest that modifications of the original VFQ-25 structure are necessary.
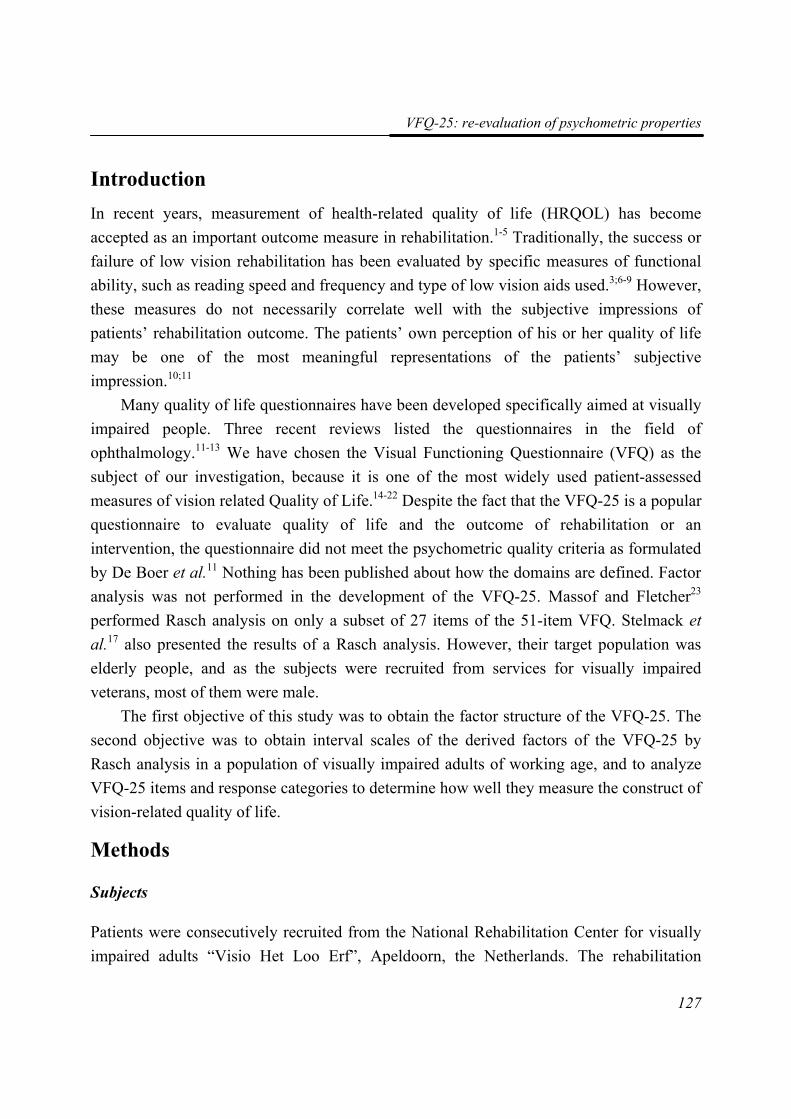
VFQ-25: re-evaluation of psychometric properties
127
Introduction In recent years, measurement of health-related quality of life (HRQOL) has become accepted as an important outcome measure in rehabilitation.1-5 Traditionally, the success or failure of low vision rehabilitation has been evaluated by specific measures of functional ability, such as reading speed and frequency and type of low vision aids used.3;6-9 However, these measures do not necessarily correlate well with the subjective impressions of patients’ rehabilitation outcome. The patients’ own perception of his or her quality of life may be one of the most meaningful representations of the patients’ subjective impression.10;11
Many quality of life questionnaires have been developed specifically aimed at visually impaired people. Three recent reviews listed the questionnaires in the field of ophthalmology.11-13 We have chosen the Visual Functioning Questionnaire (VFQ) as the subject of our investigation, because it is one of the most widely used patient-assessed measures of vision related Quality of Life.14-22 Despite the fact that the VFQ-25 is a popular questionnaire to evaluate quality of life and the outcome of rehabilitation or an intervention, the questionnaire did not meet the psychometric quality criteria as formulated by De Boer et al.11 Nothing has been published about how the domains are defined. Factor analysis was not performed in the development of the VFQ-25. Massof and Fletcher23 performed Rasch analysis on only a subset of 27 items of the 51-item VFQ. Stelmack et al.17 also presented the results of a Rasch analysis. However, their target population was elderly people, and as the subjects were recruited from services for visually impaired veterans, most of them were male.
The first objective of this study was to obtain the factor structure of the VFQ-25. The second objective was to obtain interval scales of the derived factors of the VFQ-25 by Rasch analysis in a population of visually impaired adults of working age, and to analyze VFQ-25 items and response categories to determine how well they measure the construct of vision-related quality of life.
Methods
Subjects
Patients were consecutively recruited from the National Rehabilitation Center for visually impaired adults “Visio Het Loo Erf”, Apeldoorn, the Netherlands. The rehabilitation
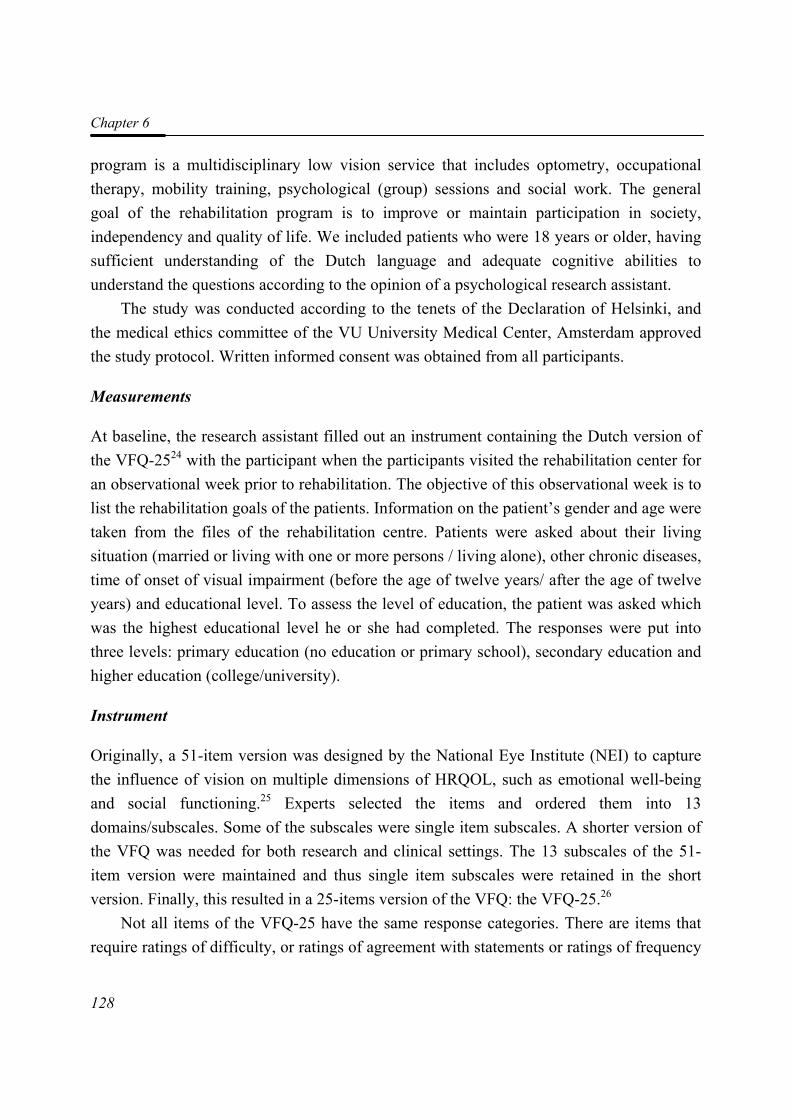
Chapter 6
128
program is a multidisciplinary low vision service that includes optometry, occupational therapy, mobility training, psychological (group) sessions and social work. The general goal of the rehabilitation program is to improve or maintain participation in society, independency and quality of life. We included patients who were 18 years or older, having sufficient understanding of the Dutch language and adequate cognitive abilities to understand the questions according to the opinion of a psychological research assistant.
The study was conducted according to the tenets of the Declaration of Helsinki, and the medical ethics committee of the VU University Medical Center, Amsterdam approved the study protocol. Written informed consent was obtained from all participants.
Measurements
At baseline, the research assistant filled out an instrument containing the Dutch version of the VFQ-2524 with the participant when the participants visited the rehabilitation center for an observational week prior to rehabilitation. The objective of this observational week is to list the rehabilitation goals of the patients. Information on the patient’s gender and age were taken from the files of the rehabilitation centre. Patients were asked about their living situation (married or living with one or more persons / living alone), other chronic diseases, time of onset of visual impairment (before the age of twelve years/ after the age of twelve years) and educational level. To assess the level of education, the patient was asked which was the highest educational level he or she had completed. The responses were put into three levels: primary education (no education or primary school), secondary education and higher education (college/university).
Instrument
Originally, a 51-item version was designed by the National Eye Institute (NEI) to capture the influence of vision on multiple dimensions of HRQOL, such as emotional well-being and social functioning.25 Experts selected the items and ordered them into 13 domains/subscales. Some of the subscales were single item subscales. A shorter version of the VFQ was needed for both research and clinical settings. The 13 subscales of the 51-item version were maintained and thus single item subscales were retained in the short version. Finally, this resulted in a 25-items version of the VFQ: the VFQ-25.26
Not all items of the VFQ-25 have the same response categories. There are items that require ratings of difficulty, or ratings of agreement with statements or ratings of frequency
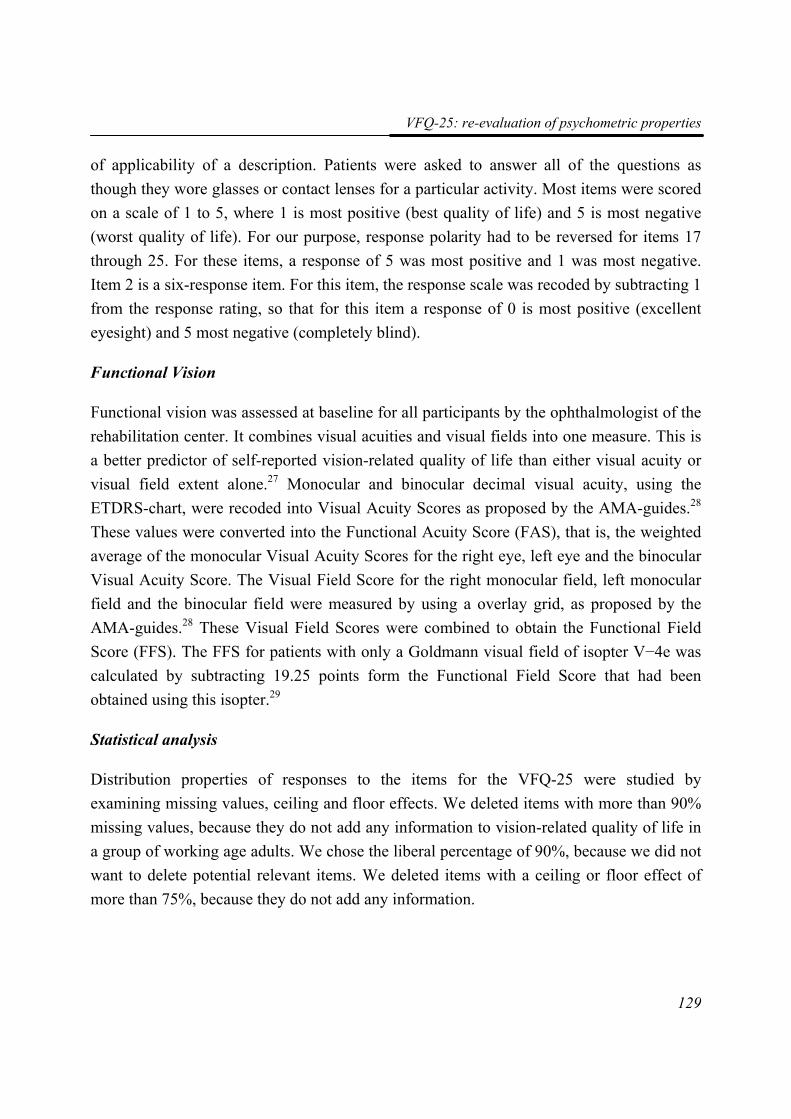
VFQ-25: re-evaluation of psychometric properties
129
of applicability of a description. Patients were asked to answer all of the questions as though they wore glasses or contact lenses for a particular activity. Most items were scored on a scale of 1 to 5, where 1 is most positive (best quality of life) and 5 is most negative (worst quality of life). For our purpose, response polarity had to be reversed for items 17 through 25. For these items, a response of 5 was most positive and 1 was most negative. Item 2 is a six-response item. For this item, the response scale was recoded by subtracting 1 from the response rating, so that for this item a response of 0 is most positive (excellent eyesight) and 5 most negative (completely blind).
Functional Vision
Functional vision was assessed at baseline for all participants by the ophthalmologist of the rehabilitation center. It combines visual acuities and visual fields into one measure. This is a better predictor of self-reported vision-related quality of life than either visual acuity or visual field extent alone.27 Monocular and binocular decimal visual acuity, using the ETDRS-chart, were recoded into Visual Acuity Scores as proposed by the AMA-guides.28 These values were converted into the Functional Acuity Score (FAS), that is, the weighted average of the monocular Visual Acuity Scores for the right eye, left eye and the binocular Visual Acuity Score. The Visual Field Score for the right monocular field, left monocular field and the binocular field were measured by using a overlay grid, as proposed by the AMA-guides.28 These Visual Field Scores were combined to obtain the Functional Field Score (FFS). The FFS for patients with only a Goldmann visual field of isopter V−4e was calculated by subtracting 19.25 points form the Functional Field Score that had been obtained using this isopter.29
Statistical analysis
Distribution properties of responses to the items for the VFQ-25 were studied by examining missing values, ceiling and floor effects. We deleted items with more than 90% missing values, because they do not add any information to vision-related quality of life in a group of working age adults. We chose the liberal percentage of 90%, because we did not want to delete potential relevant items. We deleted items with a ceiling or floor effect of more than 75%, because they do not add any information.
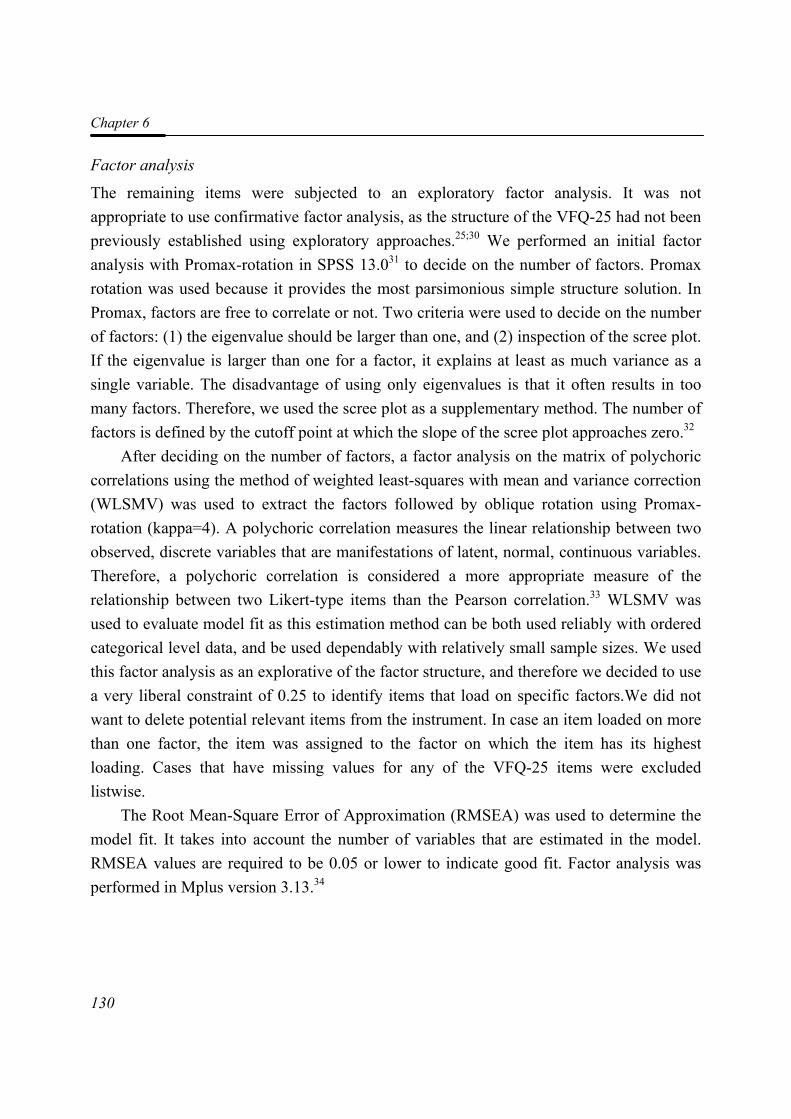
Chapter 6
130
Factor analysis
The remaining items were subjected to an exploratory factor analysis. It was not appropriate to use confirmative factor analysis, as the structure of the VFQ-25 had not been previously established using exploratory approaches.25;30 We performed an initial factor analysis with Promax-rotation in SPSS 13.031 to decide on the number of factors. Promax rotation was used because it provides the most parsimonious simple structure solution. In Promax, factors are free to correlate or not. Two criteria were used to decide on the number of factors: (1) the eigenvalue should be larger than one, and (2) inspection of the scree plot. If the eigenvalue is larger than one for a factor, it explains at least as much variance as a single variable. The disadvantage of using only eigenvalues is that it often results in too many factors. Therefore, we used the scree plot as a supplementary method. The number of factors is defined by the cutoff point at which the slope of the scree plot approaches zero.32
After deciding on the number of factors, a factor analysis on the matrix of polychoric correlations using the method of weighted least-squares with mean and variance correction (WLSMV) was used to extract the factors followed by oblique rotation using Promax-rotation (kappa=4). A polychoric correlation measures the linear relationship between two observed, discrete variables that are manifestations of latent, normal, continuous variables. Therefore, a polychoric correlation is considered a more appropriate measure of the relationship between two Likert-type items than the Pearson correlation.33 WLSMV was used to evaluate model fit as this estimation method can be both used reliably with ordered categorical level data, and be used dependably with relatively small sample sizes. We used this factor analysis as an explorative of the factor structure, and therefore we decided to use a very liberal constraint of 0.25 to identify items that load on specific factors.We did not want to delete potential relevant items from the instrument. In case an item loaded on more than one factor, the item was assigned to the factor on which the item has its highest loading. Cases that have missing values for any of the VFQ-25 items were excluded listwise.
The Root Mean-Square Error of Approximation (RMSEA) was used to determine the model fit. It takes into account the number of variables that are estimated in the model. RMSEA values are required to be 0.05 or lower to indicate good fit. Factor analysis was performed in Mplus version 3.13.34
VFQ-25: re-evaluation of psychometric properties
131
Rasch analysis
We performed separate Rasch analyses on the separate scales of the VFQ-25. Rasch analysis is a measurement procedure used to transform ordinal-scaled measures into interval-scaled measures to provide good clinical precision and acceptable fit characteristics.35 Rasch analysis derives item measures and person measures. The parameter estimates are all in the same dimension (logits), which enables targeting of the items to the ability of persons. The difficulty of an item is given by its location on the interval scale. For the VFQ-25, items with a high location on the logit scale are easier to endorse than items with a low location. The location of a person on the logit scale corresponds to his/her ability to perform the item. For the VFQ-25, persons with a low location on the logit scale are more able than persons with a high location on the logit scale are. For rating-scale data, not only does an item have a location of difficulty, but an item has also a series of thresholds. Step thresholds are the levels at which the likelihood of failure to endorse at a given response category turns to the likelihood of endorsement of an adjacent response category. As explained in the instrument section, the VFQ-25 has different types of ratings and response categories. Under the assumption that the distances between thresholds vary across items, the partial credit model was used.
Rasch analysis was performed in three steps. First, we examined Andrich step thresholds of the items at the four scales of the VFQ-25. Disordered thresholds occur when participants have difficulty consistently discriminating between response categories. They indicate that it might be appropriate to collapse categories to improve overall model fit. The first and most important guideline in collapsing categories is that what we collapse must make sense. The recommended minimal number of responses per category is 10.36
Second, we examined the goodness of fit statistics of the VFQ-25. The chi-square Item-trait interaction statistic was considered as an overall goodness of fit statistic to assess overall model fit. A significant chi-square indicates that the hierarchical ordering of the items varies across the scale. In addition to this overall fit statistic, a Person Separation Index (PSI) is considered to assess how well the construct discriminates between the respondents. This PSI is comparable to Cronbach’s α and indicates the degree to which persons can be differentiated into certain groups. For scales which are used as research tools to compare groups, Cronbach’s α values of 0.7 are regarded as satisfactory.37 Individual person- and item fit statistics are presented as residuals. The fit residual is a summation of individual person or item deviations. Residuals between ± 2.5 logits are deemed to indicate adequate fit to the model.38
Chapter 6
132
Third, we examined differential item functioning (DIF). DIF, or item bias, addresses the issue of comparing the estimates across two or more distinct groups to examine whether the items have different meanings for the different groups. The statistical test used for detecting DIF is an ANOVA of the person-item deviation residuals with person factors and class intervals as factors. Two types of DIF can be identified: uniform DIF and non-uniform DIF. Uniform DIF exists when one group shows a systematic difference in its responses to an item, across the whole range of the characteristic being measured. It is indicated by a significant main effect (p<0.01) for the person factor. Non-uniform DIF exists when there is non-uniformity in the group differences. It is indicated by a significant interaction effect (person factor x class interval; p<0.01). In this study, DIF was investigated for the person factors: age (<42 / ≥42 years), gender, FVS (<20 / ≥20 years) comorbidity (yes/no), educational level (primary+secondary / tertiary), time of onset of the visual impairment, and social status. We used a significance level of 0.01.
A person-item threshold distribution was plotted for every scale. The plot shows the distribution of the visual ability measures of persons in the upper part of the figure and the distribution of item thresholds are shown on the lower part of the person-item distribution. For Rasch analyses the RUMM2020 program was used.39
Next, person estimates were transferred to SPSS 13.031 for further analyses. Pearson correlations between the four scales were calculated. The subscales that are found by factor analysis and Rasch analysis were tested for internal consistency, i.e. homogeneity of the items in a subscale. Finally, item-total correlations were calculated. The usual rule of thumb is that an item should correlate with the total score above 0.20.40 Items with lower correlations should be deleted from the scale.
Results A total of 135 persons were eligible for inclusion in the study. Six persons (4.4%) did not participate. Reasons for not participating were a weak general health (mainly fatigue) or not being interested in the study. The VFQ-25 was administered to the remaining 129 patients. The mean age of the sample was 42.1 years (SD=14.1 years; range 21-67 years), and 55.8% were male. Primary diagnoses were as follows: macular degeneration or other macular disorders, 9.4%; diabetic retinopathy or other retinal vascular diseases, 6.3%; other retinal disorders, 24.2%; anterior segment or other refractive disorders, 7.8%; glaucoma or other optic neuropathy, 20.3%; cerebrovascular accident or brain injury, 16.4%; and other causes, 15.6%. The mean Functional Acuity Score was 39.0 points (SD=26.8), the mean
VFQ-25: re-evaluation of psychometric properties
133
Functional Field Score was 53.1 points (SD=33.5), and the mean Functional Vision Score was 24.9 points (SD=21.7). Twenty-three participants (18%) finished higher education (college or university), 60.9% had one or more other chronic diseases at baseline, and 45.3% lived alone.
Frequencies of responses on item categories for all 25 items of the VFQ-25 are shown in Table 1. Although all 25 items were administered during our study, the question that rate general health (item 1) was eliminated. The general health question is treated as a stand-alone item in the original questionnaire, because it is a robust marker of overall health status in many population-based studies and provides a comparative benchmark for groups of persons who complete the VFQ-25.26 Item 15c showed a high ceiling effect (96.7%), whereas items 16 and 16a had both 98.4% missing data. Therefore, these three items on driving (15c, 16 and 16a) were eliminated from the analyses.
Exploratory factor analysis
An exploratory factor analysis was carried out on the remaining 22 items of the VFQ-25. After initial factor analysis in SPSS 13.0, examination of eigenvalues and the scree plot indicated four factors (data not shown). Next, the WLSMV method was used as implemented in Mplus.34 Table 1 shows the factor loadings ≥ 0.25. Following factor extraction and Promax rotation, the four factors accumulatively accounted for 46.37% of the total variance. RMSEA was 0.05, which is satisfactory.
Rasch analysis
We performed a separate Rasch analysis on every scale found in the exploratory factor analysis. First, we examined the scaling properties. Table 2 showed uncentralized thresholds of items of the initial Rasch analysis. All disordered thresholds were recoded from the original 5-point scale by collapsing two or three categories to form a four-point or three-point scale. This resulted in ordered thresholds for all categories. (Table 2). In general, the change in rating scale resulted in slight improvements in overall model fit statistics and separation indexes. However, the person separation index of Near Activities showed a slight deterioration from 0.85 to 0.83. The overall model fit statistics of Mental Health & Dependency slightly deteriorated from Χ2=14.43 (df=6;p=0.27) to Χ2=15.07 (df=6;p=0.24).
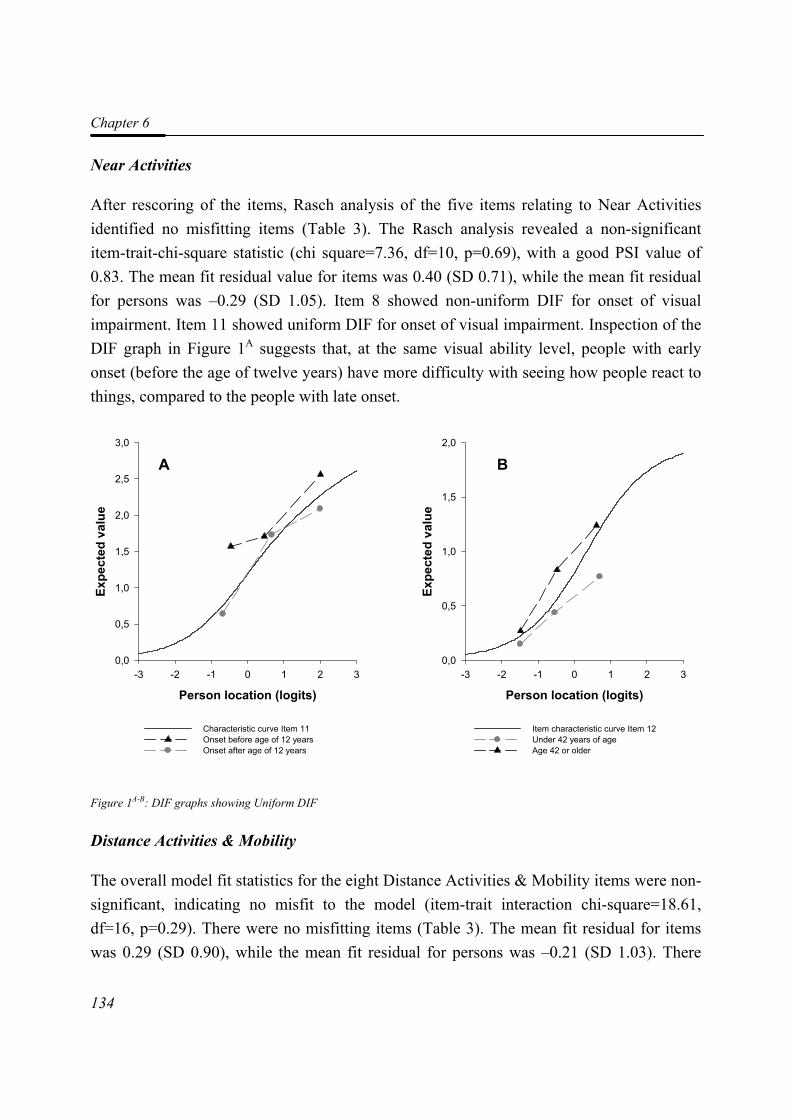
Chapter 6
134
Near Activities
After rescoring of the items, Rasch analysis of the five items relating to Near Activities identified no misfitting items (Table 3). The Rasch analysis revealed a non-significant item-trait-chi-square statistic (chi square=7.36, df=10, p=0.69), with a good PSI value of 0.83. The mean fit residual value for items was 0.40 (SD 0.71), while the mean fit residual for persons was –0.29 (SD 1.05). Item 8 showed non-uniform DIF for onset of visual impairment. Item 11 showed uniform DIF for onset of visual impairment. Inspection of the DIF graph in Figure 1A suggests that, at the same visual ability level, people with early onset (before the age of twelve years) have more difficulty with seeing how people react to things, compared to the people with late onset.
Person location (logits)-3 -2 -1 0 1 2 3
Expe
cted
val
ue
0,0
0,5
1,0
1,5
2,0
2,5
3,0
Characteristic curve Item 11Onset before age of 12 yearsOnset after age of 12 years
Person location (logits)-3 -2 -1 0 1 2 3
Expe
cted
val
ue
0,0
0,5
1,0
1,5
2,0
Item characteristic curve Item 12Under 42 years of ageAge 42 or older
A B
Figure 1A-B: DIF graphs showing Uniform DIF
Distance Activities & Mobility
The overall model fit statistics for the eight Distance Activities & Mobility items were non-significant, indicating no misfit to the model (item-trait interaction chi-square=18.61, df=16, p=0.29). There were no misfitting items (Table 3). The mean fit residual for items was 0.29 (SD 0.90), while the mean fit residual for persons was –0.21 (SD 1.03). There
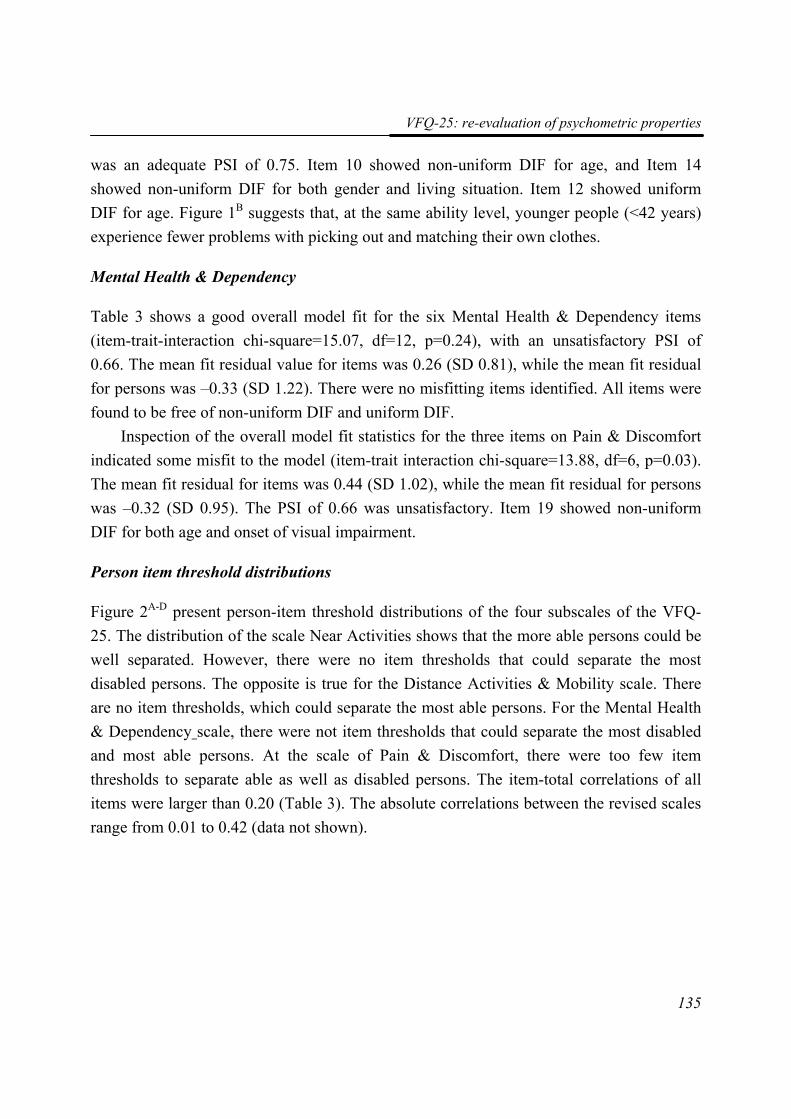
VFQ-25: re-evaluation of psychometric properties
135
was an adequate PSI of 0.75. Item 10 showed non-uniform DIF for age, and Item 14 showed non-uniform DIF for both gender and living situation. Item 12 showed uniform DIF for age. Figure 1B suggests that, at the same ability level, younger people (<42 years) experience fewer problems with picking out and matching their own clothes.
Mental Health & Dependency
Table 3 shows a good overall model fit for the six Mental Health & Dependency items (item-trait-interaction chi-square=15.07, df=12, p=0.24), with an unsatisfactory PSI of 0.66. The mean fit residual value for items was 0.26 (SD 0.81), while the mean fit residual for persons was –0.33 (SD 1.22). There were no misfitting items identified. All items were found to be free of non-uniform DIF and uniform DIF.
Inspection of the overall model fit statistics for the three items on Pain & Discomfort indicated some misfit to the model (item-trait interaction chi-square=13.88, df=6, p=0.03). The mean fit residual for items was 0.44 (SD 1.02), while the mean fit residual for persons was –0.32 (SD 0.95). The PSI of 0.66 was unsatisfactory. Item 19 showed non-uniform DIF for both age and onset of visual impairment.
Person item threshold distributions
Figure 2A-D present person-item threshold distributions of the four subscales of the VFQ-25. The distribution of the scale Near Activities shows that the more able persons could be well separated. However, there were no item thresholds that could separate the most disabled persons. The opposite is true for the Distance Activities & Mobility scale. There are no item thresholds, which could separate the most able persons. For the Mental Health & Dependency scale, there were not item thresholds that could separate the most disabled and most able persons. At the scale of Pain & Discomfort, there were too few item thresholds to separate able as well as disabled persons. The item-total correlations of all items were larger than 0.20 (Table 3). The absolute correlations between the revised scales range from 0.01 to 0.42 (data not shown).
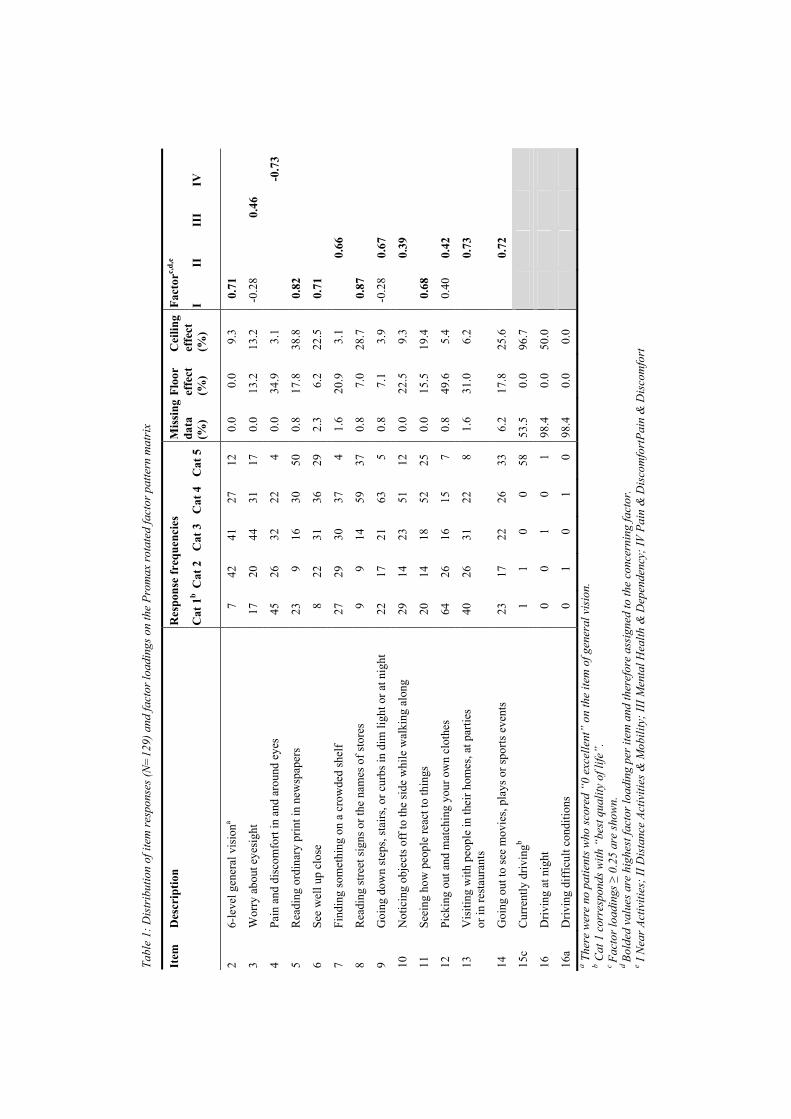
Tabl
e 1:
Dis
trib
utio
n of
item
resp
onse
s (N
=12
9) a
nd fa
ctor
load
ings
on
the
Prom
ax ro
tate
d fa
ctor
pat
tern
mat
rix
Res
pons
e fr
eque
ncie
s Fa
ctor
c,d,
e It
em
Des
crip
tion
Cat
1b
Cat
2
Cat
3
Cat
4
Cat
5
Mis
sing
da
ta
(%)
Floo
r ef
fect
(%
)
Cei
ling
effe
ct
(%)
I II
II
I IV
2 6-
leve
l gen
eral
vis
iona
7 42
41
27
12
0.
0 0.
0 9.
3 0.
71
3 W
orry
abo
ut e
yesi
ght
17
20
44
31
17
0.0
13.2
13
.2
-0.2
8
0.46
4 Pa
in a
nd d
isco
mfo
rt in
and
aro
und
eyes
45
26
32
22
4
0.0
34.9
3.
1
-0.7
3
5 R
eadi
ng o
rdin
ary
prin
t in
new
spap
ers
23
9 16
30
50
0.
8 17
.8
38.8
0.
82
6 Se
e w
ell u
p cl
ose
8 22
31
36
29
2.
3 6.
2 22
.5
0.71
7 Fi
ndin
g so
met
hing
on
a cr
owde
d sh
elf
27
29
30
37
4 1.
6 20
.9
3.1
0.
66
8 R
eadi
ng st
reet
sign
s or t
he n
ames
of s
tore
s 9
9 14
59
37
0.
8 7.
0 28
.7
0.87
9 G
oing
dow
n st
eps,
stai
rs, o
r cur
bs in
dim
ligh
t or a
t nig
ht
22
17
21
63
5 0.
8 7.
1 3.
9 -0
.28
0.67
10
Not
icin
g ob
ject
s off
to th
e si
de w
hile
wal
king
alo
ng
29
14
23
51
12
0.0
22.5
9.
3
0.39
11
Seei
ng h
ow p
eopl
e re
act t
o th
ings
20
14
18
52
25
0.
0 15
.5
19.4
0.
68
12
Pick
ing
out a
nd m
atch
ing
your
ow
n cl
othe
s 64
26
16
15
7
0.8
49.6
5.
4 0.
40
0.42
13
Vis
iting
with
peo
ple
in th
eir h
omes
, at p
artie
s or
in re
stau
rant
s 40
26
31
22
8
1.6
31.0
6.
2
0.73
14
Goi
ng o
ut to
see
mov
ies,
play
s or s
ports
eve
nts
23
17
22
26
33
6.2
17.8
25
.6
0.
72
15c
Cur
rent
ly d
rivin
gb 1
1 0
0 58
53
.5
0.0
96.7
16
Driv
ing
at n
ight
0
0 1
0 1
98.4
0.
0 50
.0
16a
Driv
ing
diff
icul
t con
ditio
ns
0 1
0 1
0 98
.4
0.0
0.0
a The
re w
ere
no p
atie
nts w
ho sc
ored
“0
exce
llent
” on
the
item
of g
ener
al v
isio
n.
b Cat
1 c
orre
spon
ds w
ith “
best
qua
lity
of li
fe”.
c Fa
ctor
load
ings
≥ 0
.25
are
show
n.
d Bo
lded
val
ues a
re h
ighe
st fa
ctor
load
ing
per i
tem
and
ther
efor
e as
sign
ed to
the
conc
erni
ng fa
ctor
. e I
Nea
r Act
iviti
es; I
I Dis
tanc
e Ac
tiviti
es &
Mob
ility
; III
Men
tal H
ealth
& D
epen
denc
y; IV
Pai
n &
Dis
com
fort
Pain
& D
isco
mfo
rt
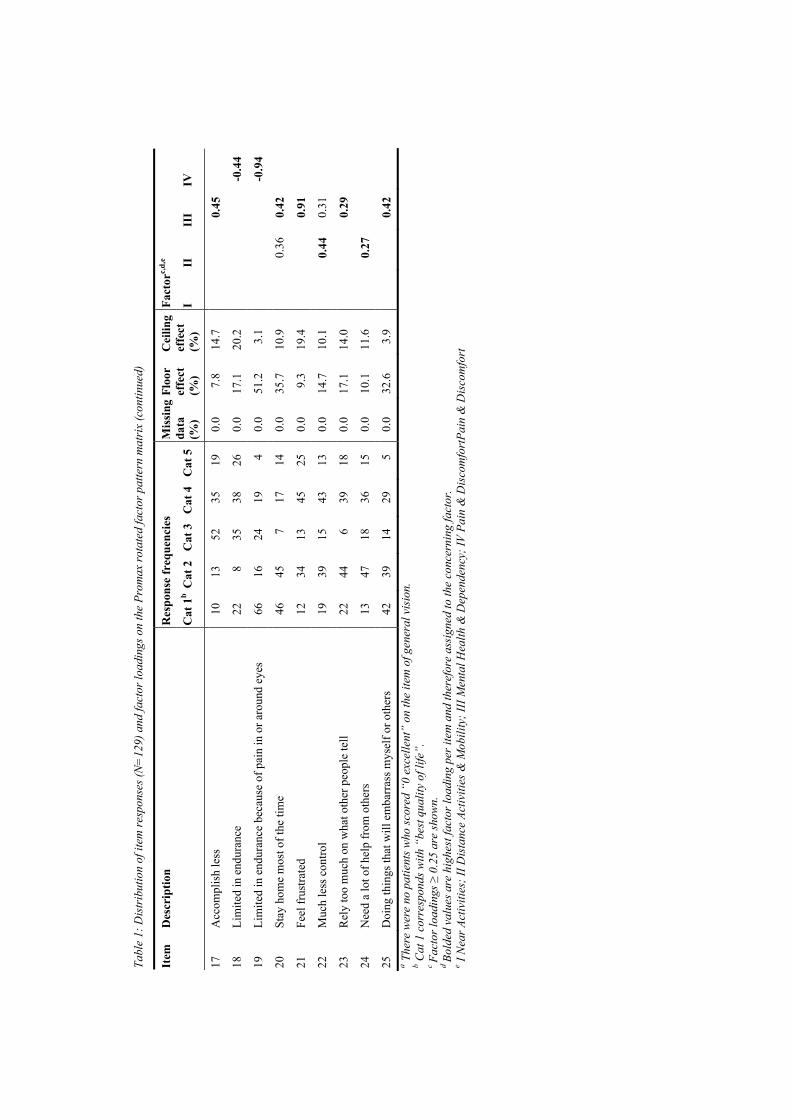
Tabl
e 1:
Dis
trib
utio
n of
item
resp
onse
s (N
=12
9) a
nd fa
ctor
load
ings
on
the
Prom
ax ro
tate
d fa
ctor
pat
tern
mat
rix
(con
tinue
d)
Res
pons
e fr
eque
ncie
s Fa
ctor
c,d,
e It
em
Des
crip
tion
Cat
1b
Cat
2
Cat
3
Cat
4
Cat
5
Mis
sing
da
ta
(%)
Floo
r ef
fect
(%
)
Cei
ling
effe
ct
(%)
I II
II
I IV
17
Acc
ompl
ish
less
10
13
52
35
19
0.
0 7.
8 14
.7
0.45
18
Lim
ited
in e
ndur
ance
22
8
35
38
26
0.0
17.1
20
.2
-0
.44
19
Lim
ited
in e
ndur
ance
bec
ause
of p
ain
in o
r aro
und
eyes
66
16
24
19
4
0.0
51.2
3.
1
-0.9
4
20
Stay
hom
e m
ost o
f the
tim
e 46
45
7
17
14
0.0
35.7
10
.9
0.
36
0.42
21
Feel
frus
trate
d 12
34
13
45
25
0.
0 9.
3 19
.4
0.91
22
Muc
h le
ss c
ontro
l 19
39
15
43
13
0.
0 14
.7
10.1
0.44
0.
31
23
Rel
y to
o m
uch
on w
hat o
ther
peo
ple
tell
22
44
6 39
18
0.
0 17
.1
14.0
0.
29
24
Nee
d a
lot o
f hel
p fr
om o
ther
s 13
47
18
36
15
0.
0 10
.1
11.6
0.27
25
Doi
ng th
ings
that
will
em
barr
ass m
ysel
f or o
ther
s 42
39
14
29
5
0.0
32.6
3.
9
0.
42
a T
here
wer
e no
pat
ient
s who
scor
ed “
0 ex
celle
nt”
on th
e ite
m o
f gen
eral
vis
ion.
b C
at 1
cor
resp
onds
with
“be
st q
ualit
y of
life
”.
c Fa
ctor
load
ings
≥ 0
.25
are
show
n.
d Bo
lded
val
ues a
re h
ighe
st fa
ctor
load
ing
per i
tem
and
ther
efor
e as
sign
ed to
the
conc
erni
ng fa
ctor
. e I
Nea
r Act
iviti
es; I
I Dis
tanc
e Ac
tiviti
es &
Mob
ility
; III
Men
tal H
ealth
& D
epen
denc
y; IV
Pai
n &
Dis
com
fort
Pain
& D
isco
mfo
rt
Chapter 6
138
Discussion In this study, a new factor structure of the VFQ-25 was established. Highly skewed items and items with too many missing values were removed from the questionnaire. Most adults with severe visual impairments are not able to drive. Items about driving were deleted from the questionnaire. This finding is in line with other studies.17;27;41 Besides, it is not expected that the driving ability of people with severe visual impairment will improve. If the VFQ-25 is used to measure the outcome of rehabilitation of severe visually impaired adults, then it is not expected that there will be any change on driving items. The conceptual structure was improved by factor analysis.
Factor analysis
As detailed in the introduction, a number of concerns have been raised in recent years concerning the dimensionality of the VFQ-25 and the behavior of individual items. Factor analysis showed that the items in the current study could be rearranged into four scales: Near Activities, Distance Activities & Mobility, Mental Health & Dependency and Pain & Discomfort. In general, at least three items per scale are needed to identify common factors.32 Therefore, it may be necessary to add items with high loadings to the scale of Pain & Discomfort, as more items per scale increase factor stability.
The total variance explained by four scales was slightly under 50% as suggested by Streiner.42 These findings suggest that it might be possible to eliminate a variable with relatively weak factor loadings on all scales. However, we used this initial factor analysis as an indicator for the factor structure of the VFQ-25. Therefore, we decided to be very conservative in deleting items from the questionnaire and had chosen a very liberal constraint of 0.25 to identify items that load on specific scales.
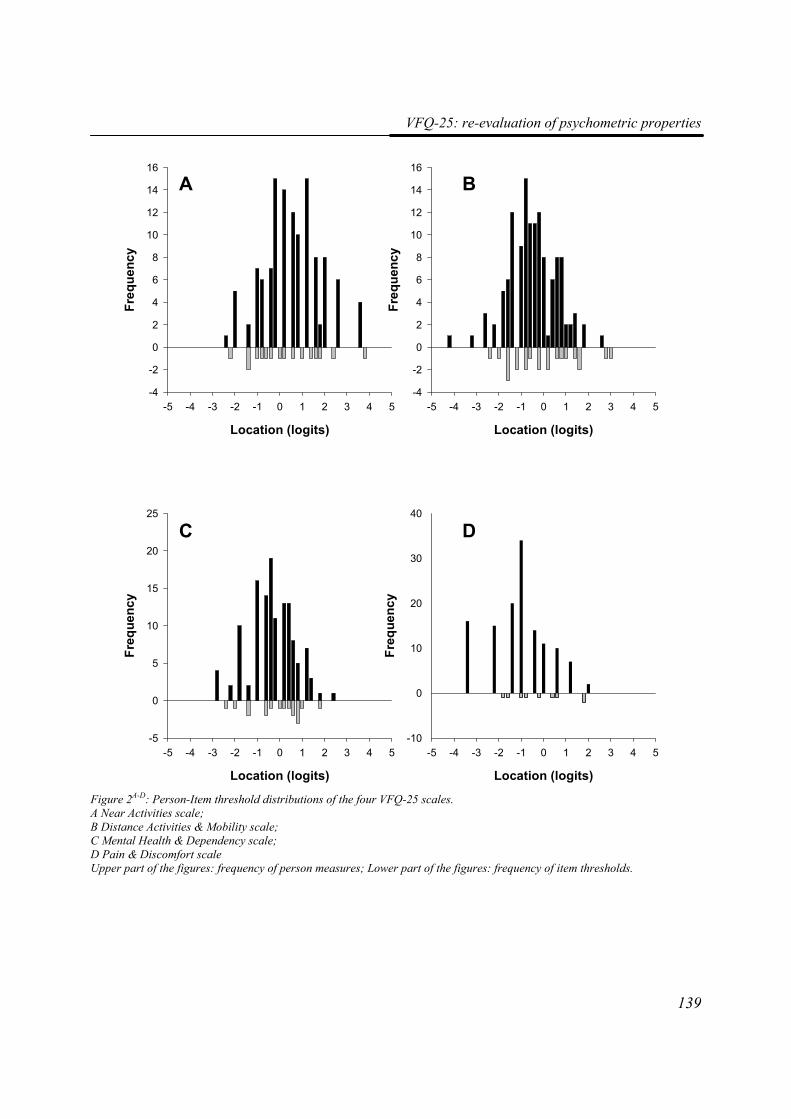
VFQ-25: re-evaluation of psychometric properties
139
Location (logits)
-5 -4 -3 -2 -1 0 1 2 3 4 5
Freq
uenc
y
-4
-2
0
2
4
6
8
10
12
14
16
Location (logits)
-5 -4 -3 -2 -1 0 1 2 3 4 5Fr
eque
ncy
-4
-2
0
2
4
6
8
10
12
14
16
Location (logits)
-5 -4 -3 -2 -1 0 1 2 3 4 5
Freq
uenc
y
-5
0
5
10
15
20
25
Location (logits)
-5 -4 -3 -2 -1 0 1 2 3 4 5
Freq
uenc
y
-10
0
10
20
30
40
A B
C D
Figure 2A-D: Person-Item threshold distributions of the four VFQ-25 scales. A Near Activities scale; B Distance Activities & Mobility scale; C Mental Health & Dependency scale; D Pain & Discomfort scale Upper part of the figures: frequency of person measures; Lower part of the figures: frequency of item thresholds.
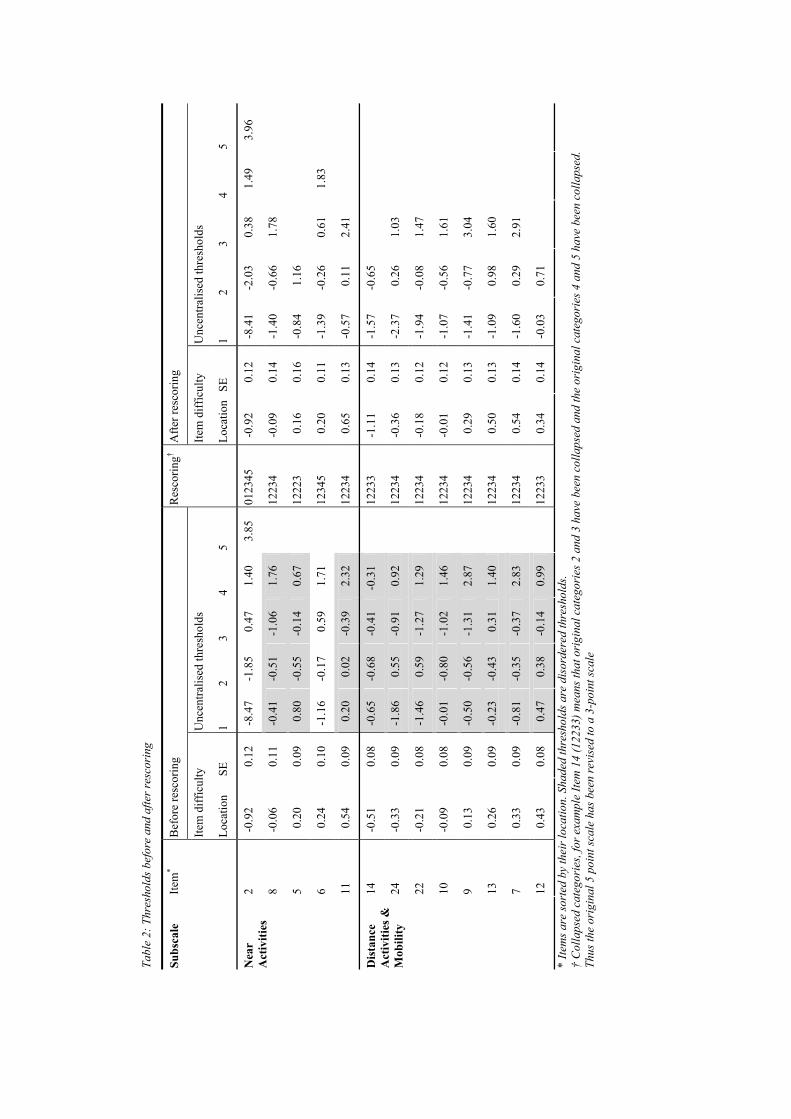
Tabl
e 2:
Thr
esho
lds b
efor
e an
d af
ter r
esco
ring
Bef
ore
resc
orin
g A
fter r
esco
ring
Item
diff
icul
ty
Unc
entra
lised
thre
shol
ds
Item
diff
icul
ty
Unc
entra
lised
thre
shol
ds
Subs
cale
Ite
m*
Loca
tion
SE
1 2
3 4
5
Res
corin
g†
Loca
tion
SE
1 2
3 4
5
2 -0
.92
0.12
-8
.47
-1.8
5 0.
47
1.40
3.
85
0123
45
-0.9
2 0.
12
-8.4
1 -2
.03
0.38
1.
49
3.96
8 -0
.06
0.11
-0
.41
-0.5
1 -1
.06
1.76
1223
4 -0
.09
0.14
-1
.40
-0.6
6 1.
78
5 0.
20
0.09
0.
80
-0.5
5 -0
.14
0.67
1222
3 0.
16
0.16
-0
.84
1.16
6 0.
24
0.10
-1
.16
-0.1
7 0.
59
1.71
1234
5 0.
20
0.11
-1
.39
-0.2
6 0.
61
1.83
Nea
r A
ctiv
ities
11
0.54
0.
09
0.20
0.
02
-0.3
9 2.
32
12
234
0.65
0.
13
-0.5
7 0.
11
2.41
14
-0.5
1 0.
08
-0.6
5 -0
.68
-0.4
1 -0
.31
12
233
-1.1
1 0.
14
-1.5
7 -0
.65
24
-0.3
3 0.
09
-1.8
6 0.
55
-0.9
1 0.
92
12
234
-0.3
6 0.
13
-2.3
7 0.
26
1.03
22
-0.2
1 0.
08
-1.4
6 0.
59
-1.2
7 1.
29
12
234
-0.1
8 0.
12
-1.9
4 -0
.08
1.47
10
-0.0
9 0.
08
-0.0
1 -0
.80
-1.0
2 1.
46
12
234
-0.0
1 0.
12
-1.0
7 -0
.56
1.61
9 0.
13
0.09
-0
.50
-0.5
6 -1
.31
2.87
1223
4 0.
29
0.13
-1
.41
-0.7
7 3.
04
13
0.26
0.
09
-0.2
3 -0
.43
0.31
1.
40
12
234
0.50
0.
13
-1.0
9 0.
98
1.60
7 0.
33
0.09
-0
.81
-0.3
5 -0
.37
2.83
1223
4 0.
54
0.14
-1
.60
0.29
2.
91
Dis
tanc
e A
ctiv
ities
&
Mob
ility
12
0.43
0.
08
0.47
0.
38
-0.1
4 0.
99
12
233
0.34
0.
14
-0.0
3 0.
71
* Ite
ms a
re so
rted
by
thei
r loc
atio
n. S
hade
d th
resh
olds
are
dis
orde
red
thre
shol
ds.
† C
olla
psed
cat
egor
ies,
for e
xam
ple
Item
14
(122
33) m
eans
that
ori
gina
l cat
egor
ies 2
and
3 h
ave
been
col
laps
ed a
nd th
e or
igin
al c
ateg
orie
s 4 a
nd 5
hav
e be
en c
olla
psed
. Th
us th
e or
igin
al 5
poi
nt sc
ale
has b
een
revi
sed
to a
3-p
oint
scal
e
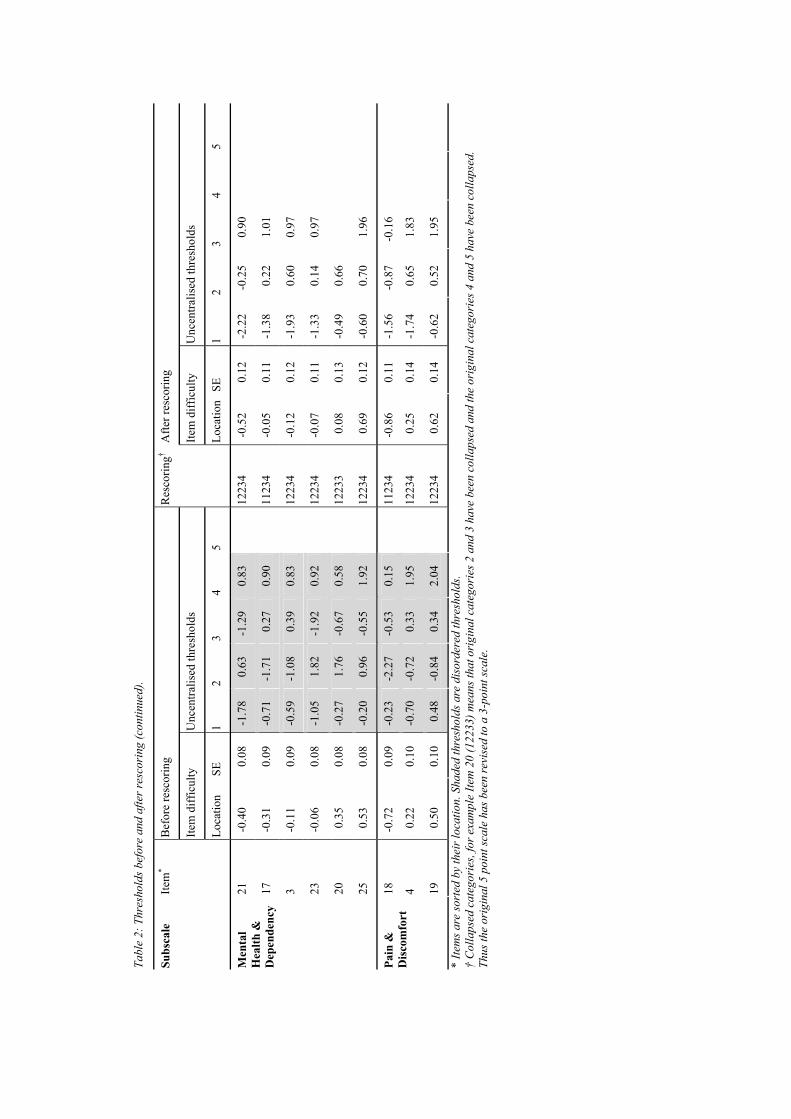
Tabl
e 2:
Thr
esho
lds b
efor
e an
d af
ter r
esco
ring
(con
tinue
d).
Bef
ore
resc
orin
g A
fter r
esco
ring
Item
diff
icul
ty
Unc
entra
lised
thre
shol
ds
Item
diff
icul
ty
Unc
entra
lised
thre
shol
ds
Subs
cale
Ite
m*
Loca
tion
SE
1 2
3 4
5
Res
corin
g†
Loca
tion
SE
1 2
3 4
5
21
-0.4
0 0.
08
-1.7
8 0.
63
-1.2
9 0.
83
12
234
-0.5
2 0.
12
-2.2
2 -0
.25
0.90
17
-0.3
1 0.
09
-0.7
1 -1
.71
0.27
0.
90
11
234
-0.0
5 0.
11
-1.3
8 0.
22
1.01
3 -0
.11
0.09
-0
.59
-1.0
8 0.
39
0.83
1223
4 -0
.12
0.12
-1
.93
0.60
0.
97
23
-0.0
6 0.
08
-1.0
5 1.
82
-1.9
2 0.
92
12
234
-0.0
7 0.
11
-1.3
3 0.
14
0.97
20
0.35
0.
08
-0.2
7 1.
76
-0.6
7 0.
58
12
233
0.08
0.
13
-0.4
9 0.
66
Men
tal
Hea
lth &
D
epen
denc
y
25
0.53
0.
08
-0.2
0 0.
96
-0.5
5 1.
92
12
234
0.69
0.
12
-0.6
0 0.
70
1.96
18
-0.7
2 0.
09
-0.2
3 -2
.27
-0.5
3 0.
15
11
234
-0.8
6 0.
11
-1.5
6 -0
.87
-0.1
6
4 0.
22
0.10
-0
.70
-0.7
2 0.
33
1.95
1223
4 0.
25
0.14
-1
.74
0.65
1.
83
Pain
&
Dis
com
fort
19
0.50
0.
10
0.48
-0
.84
0.34
2.
04
12
234
0.62
0.
14
-0.6
2 0.
52
1.95
* Ite
ms a
re so
rted
by
thei
r loc
atio
n. S
hade
d th
resh
olds
are
dis
orde
red
thre
shol
ds.
† C
olla
psed
cat
egor
ies,
for e
xam
ple
Item
20
(122
33) m
eans
that
ori
gina
l cat
egor
ies 2
and
3 h
ave
been
col
laps
ed a
nd th
e or
igin
al c
ateg
orie
s 4 a
nd 5
hav
e be
en c
olla
psed
. Th
us th
e or
igin
al 5
poi
nt sc
ale
has b
een
revi
sed
to a
3-p
oint
scal
e.
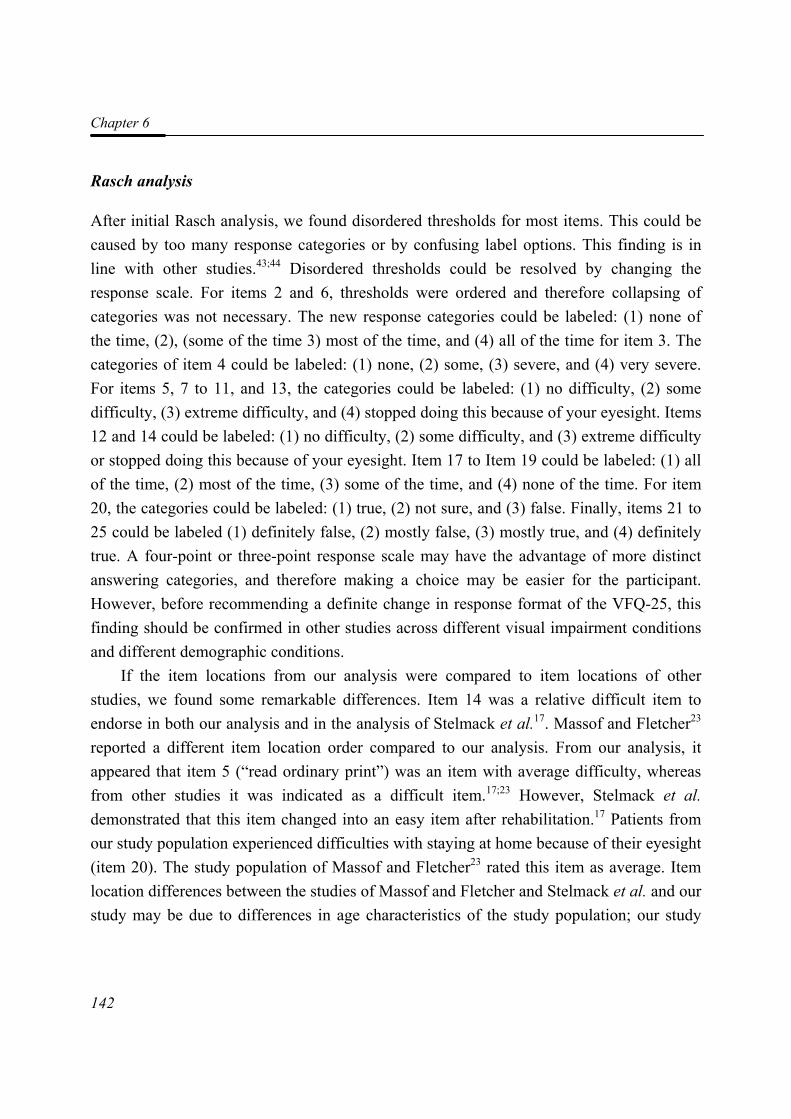
Chapter 6
142
Rasch analysis
After initial Rasch analysis, we found disordered thresholds for most items. This could be caused by too many response categories or by confusing label options. This finding is in line with other studies.43;44 Disordered thresholds could be resolved by changing the response scale. For items 2 and 6, thresholds were ordered and therefore collapsing of categories was not necessary. The new response categories could be labeled: (1) none of the time, (2), (some of the time 3) most of the time, and (4) all of the time for item 3. The categories of item 4 could be labeled: (1) none, (2) some, (3) severe, and (4) very severe. For items 5, 7 to 11, and 13, the categories could be labeled: (1) no difficulty, (2) some difficulty, (3) extreme difficulty, and (4) stopped doing this because of your eyesight. Items 12 and 14 could be labeled: (1) no difficulty, (2) some difficulty, and (3) extreme difficulty or stopped doing this because of your eyesight. Item 17 to Item 19 could be labeled: (1) all of the time, (2) most of the time, (3) some of the time, and (4) none of the time. For item 20, the categories could be labeled: (1) true, (2) not sure, and (3) false. Finally, items 21 to 25 could be labeled (1) definitely false, (2) mostly false, (3) mostly true, and (4) definitely true. A four-point or three-point response scale may have the advantage of more distinct answering categories, and therefore making a choice may be easier for the participant. However, before recommending a definite change in response format of the VFQ-25, this finding should be confirmed in other studies across different visual impairment conditions and different demographic conditions.
If the item locations from our analysis were compared to item locations of other studies, we found some remarkable differences. Item 14 was a relative difficult item to endorse in both our analysis and in the analysis of Stelmack et al.17. Massof and Fletcher23 reported a different item location order compared to our analysis. From our analysis, it appeared that item 5 (“read ordinary print”) was an item with average difficulty, whereas from other studies it was indicated as a difficult item.17;23 However, Stelmack et al. demonstrated that this item changed into an easy item after rehabilitation.17 Patients from our study population experienced difficulties with staying at home because of their eyesight (item 20). The study population of Massof and Fletcher23 rated this item as average. Item location differences between the studies of Massof and Fletcher and Stelmack et al. and our study may be due to differences in age characteristics of the study population; our study
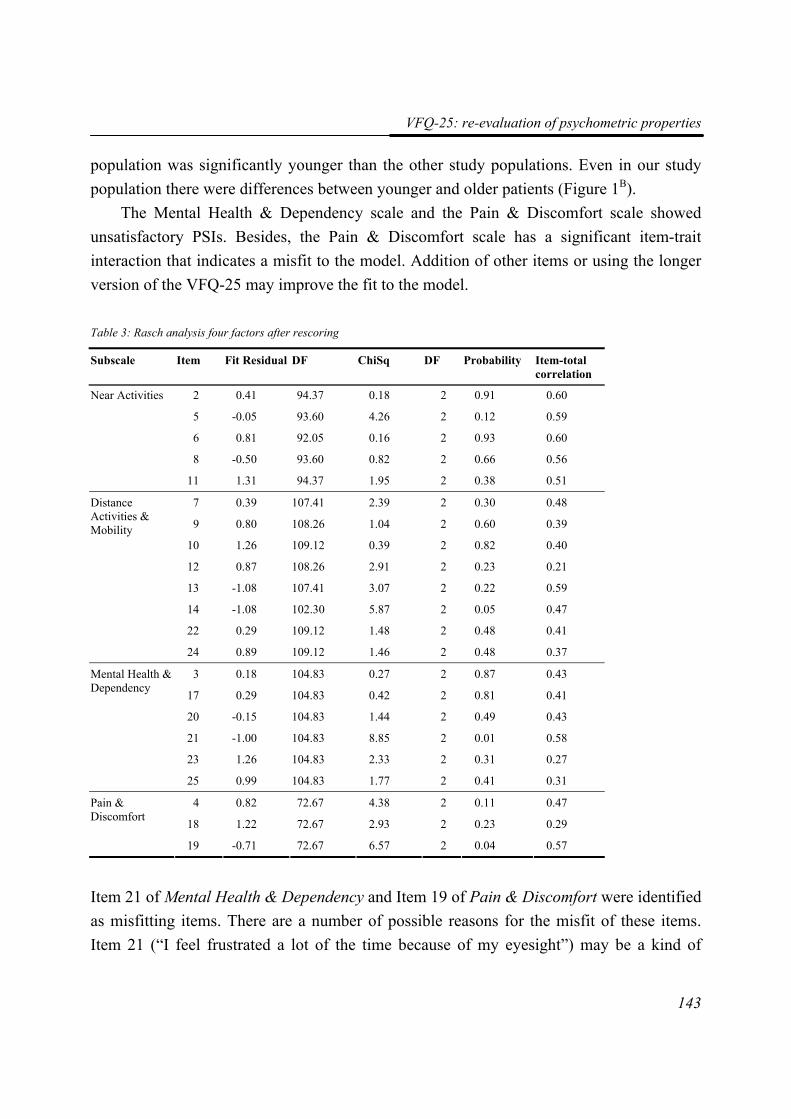
VFQ-25: re-evaluation of psychometric properties
143
population was significantly younger than the other study populations. Even in our study population there were differences between younger and older patients (Figure 1B).
The Mental Health & Dependency scale and the Pain & Discomfort scale showed unsatisfactory PSIs. Besides, the Pain & Discomfort scale has a significant item-trait interaction that indicates a misfit to the model. Addition of other items or using the longer version of the VFQ-25 may improve the fit to the model.
Table 3: Rasch analysis four factors after rescoring
Subscale Item Fit Residual DF ChiSq DF Probability Item-total correlation
2 0.41 94.37 0.18 2 0.91 0.60
5 -0.05 93.60 4.26 2 0.12 0.59
6 0.81 92.05 0.16 2 0.93 0.60
8 -0.50 93.60 0.82 2 0.66 0.56
Near Activities
11 1.31 94.37 1.95 2 0.38 0.51
7 0.39 107.41 2.39 2 0.30 0.48
9 0.80 108.26 1.04 2 0.60 0.39
10 1.26 109.12 0.39 2 0.82 0.40
12 0.87 108.26 2.91 2 0.23 0.21
13 -1.08 107.41 3.07 2 0.22 0.59
14 -1.08 102.30 5.87 2 0.05 0.47
22 0.29 109.12 1.48 2 0.48 0.41
Distance Activities & Mobility
24 0.89 109.12 1.46 2 0.48 0.37
3 0.18 104.83 0.27 2 0.87 0.43
17 0.29 104.83 0.42 2 0.81 0.41
20 -0.15 104.83 1.44 2 0.49 0.43
21 -1.00 104.83 8.85 2 0.01 0.58
23 1.26 104.83 2.33 2 0.31 0.27
Mental Health & Dependency
25 0.99 104.83 1.77 2 0.41 0.31
4 0.82 72.67 4.38 2 0.11 0.47
18 1.22 72.67 2.93 2 0.23 0.29
Pain & Discomfort
19 -0.71 72.67 6.57 2 0.04 0.57
Item 21 of Mental Health & Dependency and Item 19 of Pain & Discomfort were identified as misfitting items. There are a number of possible reasons for the misfit of these items. Item 21 (“I feel frustrated a lot of the time because of my eyesight”) may be a kind of
Chapter 6
144
summarizing item. Frustrations of people with a visual impairment are frequently a consequence of a disability to perform activities mentioned in the other items, for example inability to drive, needing a lot of help from others, being able to read ordinary print and limited in how long they can work or do other activities. Item 19 (“How much pain or discomfort in or around your eyes keep you from doing what you’d like to be doing?”) has a high correlation with Item 4 (“how much pain or discomfort have you had in and around your eyes?”; r=0.65). Therefore, Item 19 may be redundant. However, removal of these two items from the questionnaire did not improve the fit statistics. They should be considered for future removal from the VFQ-25.
Item 11 showed DIF for the onset of visual impairment. Inspection of the wording of the item revealed that this it is potentially confusing, because “seeing how people react to things” can be interpreted in a physical way as well as in a psychological way. Some participants interpret the item as “can you see the facial expression”, where as some participants interpret the same item as “do you experience communication problems if you cannot see the facial expressions”. Besides, people with early onset of the visual impairment (before the age of 12 years) might never have learned the impact and relevance of facial expression in communication with other people. Therefore, they might experience more problems with this type of communication. Item 12 showed uniform DIF for age. This was also an item with almost equal loadings on Near Activities en Distance Activities & Mobility. Interpretation of the commentaries of the participants showed that young people tend to wear clothes, which are easy to match with other clothes, like a pair of jeans. They do not experience problems with matching their own clothes. It could be an option to delete items that show DIF, but we believe this would be a too rigorous decision on the base of this small sample size. Besides, although DIF is an indication for the removal of an item, items with DIF do not always produce poor measurements.45
The weak to moderate correlations between the four subscales (|r|=0.01 to 0.42) indicate that the scales are measuring different aspects of quality of life. The strongest correlation was between Distance Activities & Mobility and Mental Health & Dependency with the lowest occurring between Near Activities and Pain & Discomfort.
Methodological limitations
There are several limitations to the current study. Firstly, the people who are visiting the rehabilitation center all have a severe irreversible visual impairment. Adults with “near
VFQ-25: re-evaluation of psychometric properties
145
normal” or “moderate low vision” are under represented. This might have biased the results as this group might experience other difficulties that influence their quality of life. Therefore, this instrument should be re-evaluated across different groups of persons with visual impairment in different settings. Persons experiencing a more diverse array of visual impairment symptoms, and who accordingly employ more heterogeneous low vision rehabilitation, could provide more variability in their responses on the VFQ-25 items than the participants in the sample of this rehabilitation center could.
Secondly, the age of the patients who are visiting the rehabilitation center ranges from 18 to approximately 65 years; elderly are poorly represented. The studies of Massof and Fletcher23 and Stelmack et al.17 showed that item location order in the elderly was different from our working age population. Therefore, the results of this study are only valid for the age category 18 to 65 years.
Future research
Given the relatively small sample involved in this study, the generalizability of the findings should be further investigated. The newly developed factor structure should be validated in new studies by confirmatory factor analysis. Addition of other items relevant to the factors could further improve the discrimination and validity. The VFQ-25 also needs further testing in construct validity and responsiveness.
Conclusion In conclusion, the four scales of the VFQ-25 largely confirm the structure of the instrument. However, the results of this current study suggest that modifications of the original VFQ-25 structure are necessary when using the questionnaire in a sample of working age visually impaired adults. The instrument could be improved by collapsing response categories, removal of items with poor fit statistics and items that show DIF. Besides, the instrument could be improved by adding meaningful items to the scales. Until these deficiencies are addressed, VFQ-25 scores and changes in scores must be interpreted with caution.
Chapter 6
146
References 1. Aaronson NK. (1988). Quality of life: what is it? How should it be measured? Oncology
(Huntington). 2 (5): 69-76, 64.
2. Jaeschke R, Singer J and Guyatt GH. (1989). Measurement of health status. Ascertaining the minimal clinically important difference. Controlled Clinical Trials. 10 (4): 407-415.
3. Stelmack J. (2001). Quality of life of low-vision patients and outcomes of low-vision rehabilitation. Optometry and Vision Science. 78 (5): 335-342.
4. Massof RW, Hsu CT, Baker FH, Barnett GD, Park WL, Deremeik JT, Rainey C and Epstein C. (2005). Visual disability variables. I: the importance and difficulty of activity goals for a sample of low-vision patients. Archives of Physical Medicine and Rehabilitation. 86 (5): 946-953.
5. Massof RW, Hsu CT, Baker FH, Barnett GD, Park WL, Deremeik JT, Rainey C and Epstein C. (2005). Visual disability variables. II: The difficulty of tasks for a sample of low-vision patients. Archives of Physical Medicine and Rehabilitation. 86 (5): 954-967.
6. van Rens GHMB and Arkell SM. (1991). Refractive errors and axial length among Alaskan Eskimos. Acta Ophthalmologica. 69 (1): 27-32.
7. Leat SJ, Fryer A and Rumney NJ. (1994). Outcome of low vision aid provision: the effectiveness of a low vision clinic. Optometry and Vision Science. 71 (3): 199-206.
8. Harper R, Doorduyn K, Reeves B and Slater L. (1999). Evaluating the outcomes of low vision rehabilitation. Ophthalmic and Physiological Optics. 19 (1): 3-11.
9. Hinds A, Sinclair A, Park J, Suttie A, Paterson H and Macdonald M. (2003). Impact of an interdisciplinary low vision service on the quality of life of low vision patients. British Journal of Ophthalmology. 87 (11): 1391-1396.
10. Raasch TW, Leat SJ, Kleinstein RN, Bullimore MA and Cutter GR. (1997). Evaluating the value of low-vision services. Journal of the American Optometric Association. 68 (5): 287-295.
11. de Boer MR, Moll AC, de Vet HCW, Terwee CB, Volker-Dieben HJM and van Rens GHMB. (2004). Psychometric properties of vision-related quality of life questionnaires: a systematic review. Ophthalmic and Physiological Optics. 24 (4): 257-273.
12. Margolis MK, Coyne K, Kennedy-Martin T, Baker T, Schein O and Revicki DA. (2002). Vision-specific instruments for the assessment of health-related quality of life and visual functioning: a literature review. Pharmacoeconomics. 20 (12): 791-812.
13. Massof RW and Rubin GS. (2001). Visual function assessment questionnaires. Survey of Ophthalmology. 45 (6): 531-548.
VFQ-25: re-evaluation of psychometric properties
147
14. Bradley EA, Sloan JA, Novotny PJ, Garrity JA, Woog JJ and West SK. (2006). Evaluation of the National Eye Institute Visual Function Questionnaire in Graves' Ophthalmopathy. Ophthalmology. 113 (8): 1450-1454.
15. Hyman LG, Komaroff E, Heijl A, Bengtsson B and Leske MC. (2005). Treatment and vision-related quality of life in the early manifest glaucoma trial. Ophthalmology. 112 (9): 1505-1513.
16. Cahill MT, Stinnett SS, Banks AD, Freedman SF and Toth CA. (2005). Quality of life after macular translocation with 360 degrees peripheral retinectomy for age-related macular degeneration. Ophthalmology. 112 (1): 144-151.
17. Stelmack JA, Stelmack TR and Massof RW. (2002). Measuring low-vision rehabilitation outcomes with the NEI VFQ-25. Investigative Ophthalmology and Visual Science. 43 (9): 2859-2868.
18. Suzukamo Y, Oshika T, Yuzawa M, Tokuda Y, Tomidokoro A, Oki K, Mangione CM, Green J and Fukuhara S. (2005). Psychometric properties of the 25-item National Eye Institute Visual Function Questionnaire (NEI VFQ-25), Japanese version. Health and Quality of Life Outcomes. 3 65.
19. Toprak AB, Eser E, Guler C, Baser FE and Mayali H. (2005). Cross-validation of the Turkish version of the 25-item National Eye Institute Visual Functioning Questionnaire (NEI-VFQ 25). Ophthalmic Epidemiology. 12 (4): 259-269.
20. Broman AT, Munoz B, West SK, Rodriguez J, Sanchez R, Snyder R and Klein R. (2001). Psychometric properties of the 25-item NEI-VFQ in a Hispanic population: Proyecto VER. Investigative Ophthalmology and Visual Science. 42 (3): 606-613.
21. Magacho L, Lima FE, Nery AC, Sagawa A, Magacho B and Avila MP. (2004). Quality of life in glaucoma patients: regression analysis and correlation with possible modifiers. Ophthalmic Epidemiology. 11 (4): 263-270.
22. Nordmann JP, Viala M, Sullivan K, Arnould B and Berdeaux G. (2004). Psychometric Validation of the National Eye Institute Visual Function Questionnaire - 25 (NEI VFQ-25) French Version : In a Population of Patients Treated for Ocular Hypertension and Glaucoma. Pharmacoeconomics. 22 (3): 197-206.
23. Massof RW and Fletcher DC. (2001). Evaluation of the NEI visual functioning questionnaire as an interval measure of visual ability in low vision. Vision Research. 41 (3): 397-413.
24. van der Sterre GW, van de Graaf ES, Verezen CA, Meulendijks CFM, Schouten JSAG, Saxena R, Polling JR, van Rijn LJ, Essink-Bot ML and Simonsz HJ. (2001). National Eye Institute Visual Functioning Questionnaire - 25 : Nederlandse Consensus Vertaling (VFQ-25/NL). Available at: National Eye Institute. http://www2.eur.nl/fgg/mgz/mgzpapers/interviewer%20versie%20%20VFQ25-NL%2020011107.pdf; Accessed Nov. 2002.
Chapter 6
148
25. Mangione CM, Berry S, Spritzer K, Janz NK, Klein R, Owsley C and Lee PP. (1998). Identifying the content area for the 51-item National Eye Institute Visual Function Questionnaire: results from focus groups with visually impaired persons. Archives of Ophthalmology. 116 (2): 227-233.
26. Mangione CM, Lee PP, Gutierrez PR, Spritzer K, Berry S and Hays RD. (2001). Development of the 25-item National Eye Institute Visual Function Questionnaire. Archives of Ophthalmology. 119 (7): 1050-1058.
27. Fuhr PSW, Holmes LD, Fletcher DC, Swanson MN and Kuyk TK. (2003). The AMA Guides functional vision score is a better predictor of vision-targeted quality of life than traditional measures of visual acuity or visual field extent. Visual Impairment Research. 5 (3): 137-146.
28. Cocchiarella L, Turk MA and Andersson G. (2000). Improving the evaluation of permanent impairment. JAMA. 283 (4): 532-533.
29. Langelaan M, Wouters B, Moll AC, de Boer MR and van Rens GHMB. (2006). Functional field score: the effect of using a Goldmann V-4e isopter instead of a Goldmann III-4e isopter. Investigative Ophthalmology and Visual Science. 47 (5): 1817-1823.
30. Mangione CM, Lee PP, Pitts J, Gutierrez P, Berry S and Hays RD. (1998). Psychometric properties of the National Eye Institute Visual Function Questionnaire (NEI-VFQ). NEI-VFQ Field Test Investigators. Archives of Ophthalmology. 116 (11): 1496-1504.
31. SPSS [computer program]. (2004). Version 13.0. Chicago, Il: SPSS Inc.
32. Floyd FJ and Widaman KF. (1995). Factor analysis in the development and refinement of clinical assessment instruments. Psychological Assessment. 7 (3): 286-299.
33. Flora DB and Curran PJ. (2004). An empirical evaluation of alternative methods of estimation for confirmatory factor analysis with ordinal data. Psychological Methods. 9 (4): 466-491.
34. Mplus user's guide [computer program]. (2005). Version Los Angeles,CA: Muthen & Muthen.
35. Wright BD. (2000). Rasch models overview. Journal of Applied Measurement. (1): 83-106.
36. Linacre JM. (1999). Investigating rating scale category utility. Journal of Outcome Measurement. 3 (2): 103-122.
37. Bland JM and Altman DG. (1997). Cronbach's alpha. BMJ. 314 (7080): 572.
38. Wright BD and Masters GN. (1982). Rating scale analysis. Chicago, IL: Mesa Press.
39. RUMM2020 [computer program]. (2003). Version Duncraig, Western Australia: Rumm laboratory Pty Ltd.
40. Kline P. (1986). A handbook of test construction. London: Methuen.
VFQ-25: re-evaluation of psychometric properties
149
41. Globe D, Varma R, Azen SP, Paz S, Yu E and Preston-Martin S. (2003). Psychometric performance of the NEI VFQ-25 in visually normal Latinos: the Los Angeles Latino Eye Study. Investigative Ophthalmology and Visual Science. 44 (4): 1470-1478.
42. Streiner DL. (1994). Figuring out factors: the use and misuse of factor analysis. Canadian Journal of Psychiatry Revue Canadienne de Psychiatrie. 39 (3): 135-140.
43. Pesudovs K, Garamendi E and Elliott DB. (2004). The Quality of Life Impact of Refractive Correction (QIRC) Questionnaire: development and validation. Optometry and Vision Science. 81 (10): 769-777.
44. Lamoureux EL, Pallant JF, Pesudovs K, Hassell JB and Keeffe JE. (2006). The Impact of Vision Impairment Questionnaire: an evaluation of its measurement properties using Rasch analysis. Investigative Ophthalmology and Visual Science. 47 (11): 4732-4741.
45. Roznowski M, Dickter DN, Hong S, Sawin LL and Shute VJ. (2000). Validity of measures of cognitive processes and general ability for learning and performance on highly complex computerized tutors: is the g factor of intelligence even more general? Journal of Applied Psychology. 85 (6): 940-955.

77
CChhaannggee iinn qquuaalliittyy ooff lliiffee aafftteerr rreehhaabbiilliittaattiioonn:: pprrooggnnoossttiicc ffaaccttoorrss ffoorr
vviissuuaallllyy iimmppaaiirreedd aadduullttss
Maaike Langelaan, Ruth M.A. van Nispen, Michiel R. de Boer,Bill Wouters, Annette C. Moll,
Ger HMB van Rens
(submitted)
Chapter 7
152
Abstract Purpose. The overall aim of rehabilitation for visually impaired adults is to improve the quality of life and (societal) participation. The objectives of this study were to obtain the short-term and long-term outcome of a comprehensive rehabilitation programme on quality of life for visually impaired adults, and prognostic baseline factors responsible for differences in outcome between certain groups of patients. Methods. The questionnaire was administered to 129 visually impaired adults (mean age 42.1 years). Quality of life was measured with the Visual Functioning Questionnaire, developed by the National Eye Institute (NEI-VFQ-25). Measurements were conducted during the observational programme (baseline measurement), and three months and one year after finishing rehabilitation. The change between subsequent measurements of the four dependent variables was measured, and the longitudinal relationship between vision-related quality of life on the one hand and possible prediction factors on the other was evaluated by means of random coefficient analyses. Results. If the factor scores one year after rehabilitation were compared to baseline-scores, the Mental Health & Dependency scale showed a significant improvement. For participants who received rehabilitation, age appeared to be a significant prediction variable for all factors. Additionally, FVS, and time of onset of visual impairment were predictors for the factor “Pain and Discomfort”. Conclusions. The results indicate that only age was a predictor for all domains of quality of life. Future research should be aimed at confirming our results. Ultimately, these findings should lead to adjustments in the rehabilitation programme.
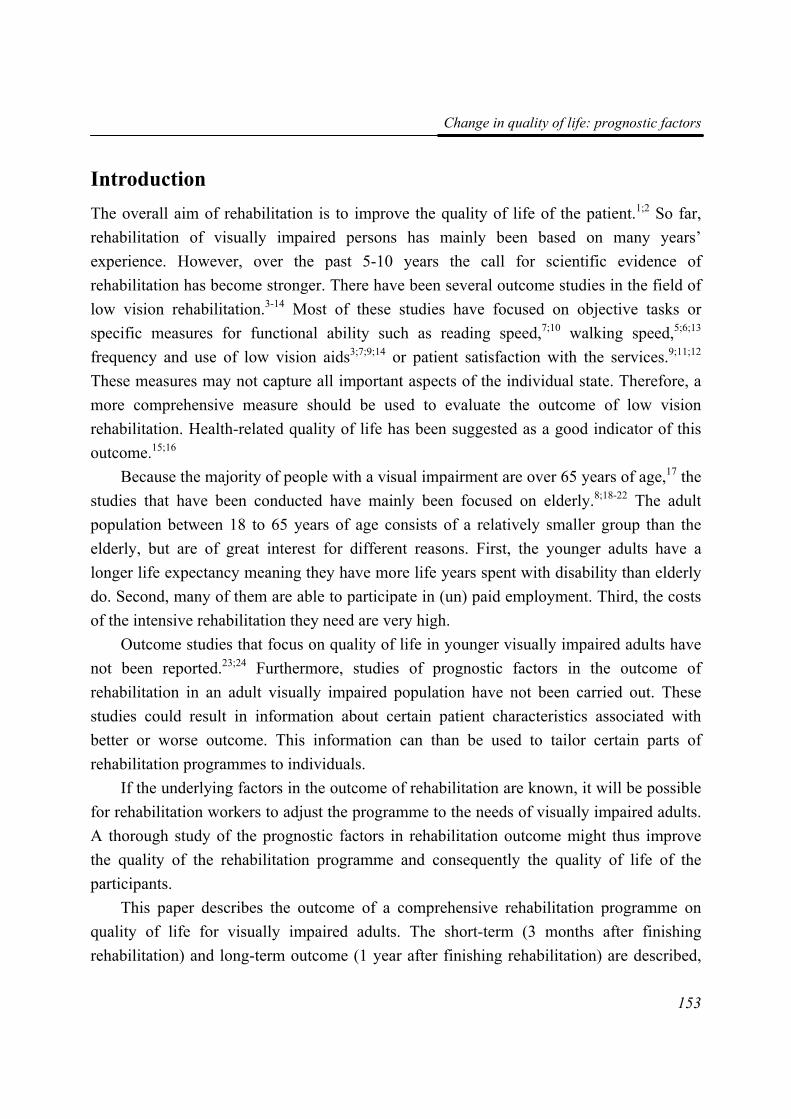
Change in quality of life: prognostic factors
153
Introduction The overall aim of rehabilitation is to improve the quality of life of the patient.1;2 So far, rehabilitation of visually impaired persons has mainly been based on many years’ experience. However, over the past 5-10 years the call for scientific evidence of rehabilitation has become stronger. There have been several outcome studies in the field of low vision rehabilitation.3-14 Most of these studies have focused on objective tasks or specific measures for functional ability such as reading speed,7;10 walking speed,5;6;13 frequency and use of low vision aids3;7;9;14 or patient satisfaction with the services.9;11;12 These measures may not capture all important aspects of the individual state. Therefore, a more comprehensive measure should be used to evaluate the outcome of low vision rehabilitation. Health-related quality of life has been suggested as a good indicator of this outcome.15;16
Because the majority of people with a visual impairment are over 65 years of age,17 the studies that have been conducted have mainly been focused on elderly.8;18-22 The adult population between 18 to 65 years of age consists of a relatively smaller group than the elderly, but are of great interest for different reasons. First, the younger adults have a longer life expectancy meaning they have more life years spent with disability than elderly do. Second, many of them are able to participate in (un) paid employment. Third, the costs of the intensive rehabilitation they need are very high.
Outcome studies that focus on quality of life in younger visually impaired adults have not been reported.23;24 Furthermore, studies of prognostic factors in the outcome of rehabilitation in an adult visually impaired population have not been carried out. These studies could result in information about certain patient characteristics associated with better or worse outcome. This information can than be used to tailor certain parts of rehabilitation programmes to individuals.
If the underlying factors in the outcome of rehabilitation are known, it will be possible for rehabilitation workers to adjust the programme to the needs of visually impaired adults. A thorough study of the prognostic factors in rehabilitation outcome might thus improve the quality of the rehabilitation programme and consequently the quality of life of the participants.
This paper describes the outcome of a comprehensive rehabilitation programme on quality of life for visually impaired adults. The short-term (3 months after finishing rehabilitation) and long-term outcome (1 year after finishing rehabilitation) are described,
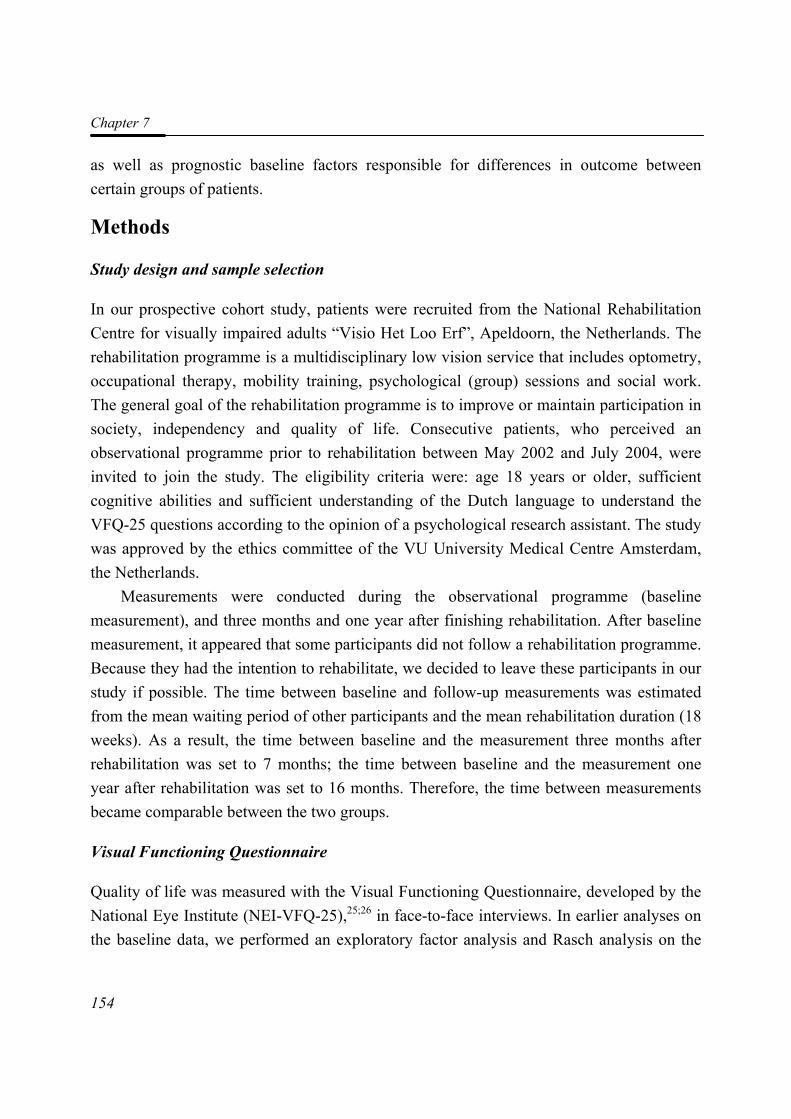
Chapter 7
154
as well as prognostic baseline factors responsible for differences in outcome between certain groups of patients.
Methods
Study design and sample selection
In our prospective cohort study, patients were recruited from the National Rehabilitation Centre for visually impaired adults “Visio Het Loo Erf”, Apeldoorn, the Netherlands. The rehabilitation programme is a multidisciplinary low vision service that includes optometry, occupational therapy, mobility training, psychological (group) sessions and social work. The general goal of the rehabilitation programme is to improve or maintain participation in society, independency and quality of life. Consecutive patients, who perceived an observational programme prior to rehabilitation between May 2002 and July 2004, were invited to join the study. The eligibility criteria were: age 18 years or older, sufficient cognitive abilities and sufficient understanding of the Dutch language to understand the VFQ-25 questions according to the opinion of a psychological research assistant. The study was approved by the ethics committee of the VU University Medical Centre Amsterdam, the Netherlands.
Measurements were conducted during the observational programme (baseline measurement), and three months and one year after finishing rehabilitation. After baseline measurement, it appeared that some participants did not follow a rehabilitation programme. Because they had the intention to rehabilitate, we decided to leave these participants in our study if possible. The time between baseline and follow-up measurements was estimated from the mean waiting period of other participants and the mean rehabilitation duration (18 weeks). As a result, the time between baseline and the measurement three months after rehabilitation was set to 7 months; the time between baseline and the measurement one year after rehabilitation was set to 16 months. Therefore, the time between measurements became comparable between the two groups.
Visual Functioning Questionnaire
Quality of life was measured with the Visual Functioning Questionnaire, developed by the National Eye Institute (NEI-VFQ-25),25;26 in face-to-face interviews. In earlier analyses on the baseline data, we performed an exploratory factor analysis and Rasch analysis on the
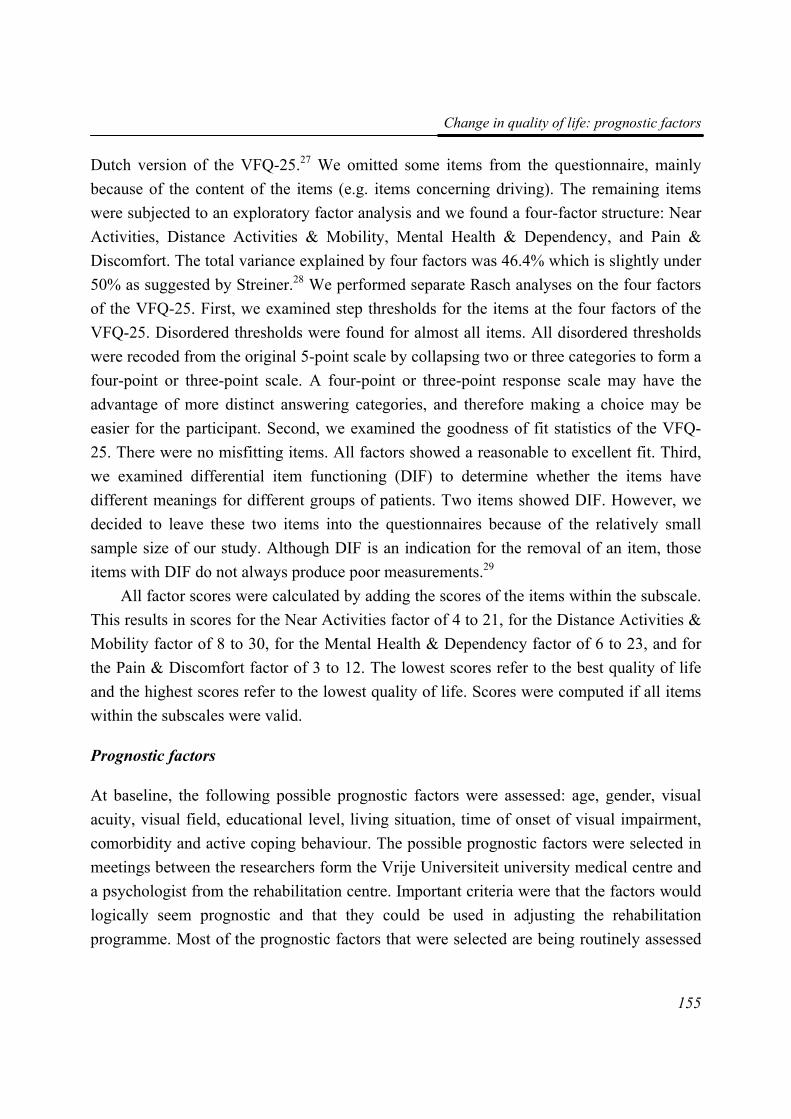
Change in quality of life: prognostic factors
155
Dutch version of the VFQ-25.27 We omitted some items from the questionnaire, mainly because of the content of the items (e.g. items concerning driving). The remaining items were subjected to an exploratory factor analysis and we found a four-factor structure: Near Activities, Distance Activities & Mobility, Mental Health & Dependency, and Pain & Discomfort. The total variance explained by four factors was 46.4% which is slightly under 50% as suggested by Streiner.28 We performed separate Rasch analyses on the four factors of the VFQ-25. First, we examined step thresholds for the items at the four factors of the VFQ-25. Disordered thresholds were found for almost all items. All disordered thresholds were recoded from the original 5-point scale by collapsing two or three categories to form a four-point or three-point scale. A four-point or three-point response scale may have the advantage of more distinct answering categories, and therefore making a choice may be easier for the participant. Second, we examined the goodness of fit statistics of the VFQ-25. There were no misfitting items. All factors showed a reasonable to excellent fit. Third, we examined differential item functioning (DIF) to determine whether the items have different meanings for different groups of patients. Two items showed DIF. However, we decided to leave these two items into the questionnaires because of the relatively small sample size of our study. Although DIF is an indication for the removal of an item, those items with DIF do not always produce poor measurements.29
All factor scores were calculated by adding the scores of the items within the subscale. This results in scores for the Near Activities factor of 4 to 21, for the Distance Activities & Mobility factor of 8 to 30, for the Mental Health & Dependency factor of 6 to 23, and for the Pain & Discomfort factor of 3 to 12. The lowest scores refer to the best quality of life and the highest scores refer to the lowest quality of life. Scores were computed if all items within the subscales were valid.
Prognostic factors
At baseline, the following possible prognostic factors were assessed: age, gender, visual acuity, visual field, educational level, living situation, time of onset of visual impairment, comorbidity and active coping behaviour. The possible prognostic factors were selected in meetings between the researchers form the Vrije Universiteit university medical centre and a psychologist from the rehabilitation centre. Important criteria were that the factors would logically seem prognostic and that they could be used in adjusting the rehabilitation programme. Most of the prognostic factors that were selected are being routinely assessed
Chapter 7
156
at Visio Het Loo Erf as part of the observational programme. Information on age and gender was routinely available for every participant. Visual acuity and visual field were assessed for every participant using ETDRS charts and Goldmann perimetry. A functional vision score (FVS) was calculated for each participant. This FVS30;31 integrates visual acuity and visual field into one comprehensive score. The FVS ranges from 0 to 100, with 0 referring to a condition of totally blind and 100 referring to a normal functional vision. Several studies have presented results that support the use of the FVS over standard measures of visual acuity and visual field.32-34 Activity orientation as preferred coping behaviour (ACT) was being assessed using the Utrechtse Coping List (UCL).35 The highest possible score of 28 refers to an active coping behaviour. The lowest possible score was 7. Co-morbidity was assessed by asking the participants if they suffered from any diseases or conditions other than their eye condition.
Statistical analysis
First, we calculated the change between subsequent measurements of the four dependent variables.
Second, the longitudinal relationship between vision-related quality of life on the one hand and possible prediction factors on the other was evaluated by means of random coefficient analyses. We made two separate models: one model for participants who received a rehabilitation programme and a second model for all participants, also including participants who did not undergo the rehabilitation programme. In longitudinal studies, the repeated measurements are correlated and clustered within the individuals and the measurement (two-level model). Random coefficient analysis takes into account that the repeated observations within one participant are dependent of each other. It does not require complete datasets and both the number of observations per individual and the time between observations may vary. The random coefficient analyses were performed with MLwiN.36 The intercept was assumed to be randomly distributed between participants. The iterative generalized least-squares algorithm was used to estimate the regression coefficients.37
Two-level models were fitted for each of the four outcome variables separately. We used the approach “analysis of covariance” to correct for the phenomenon “regression to the mean”. In the analysis of covariance, a correction was made for the baseline value of the outcome variable. Time was constituted as an independent covariate, because of the
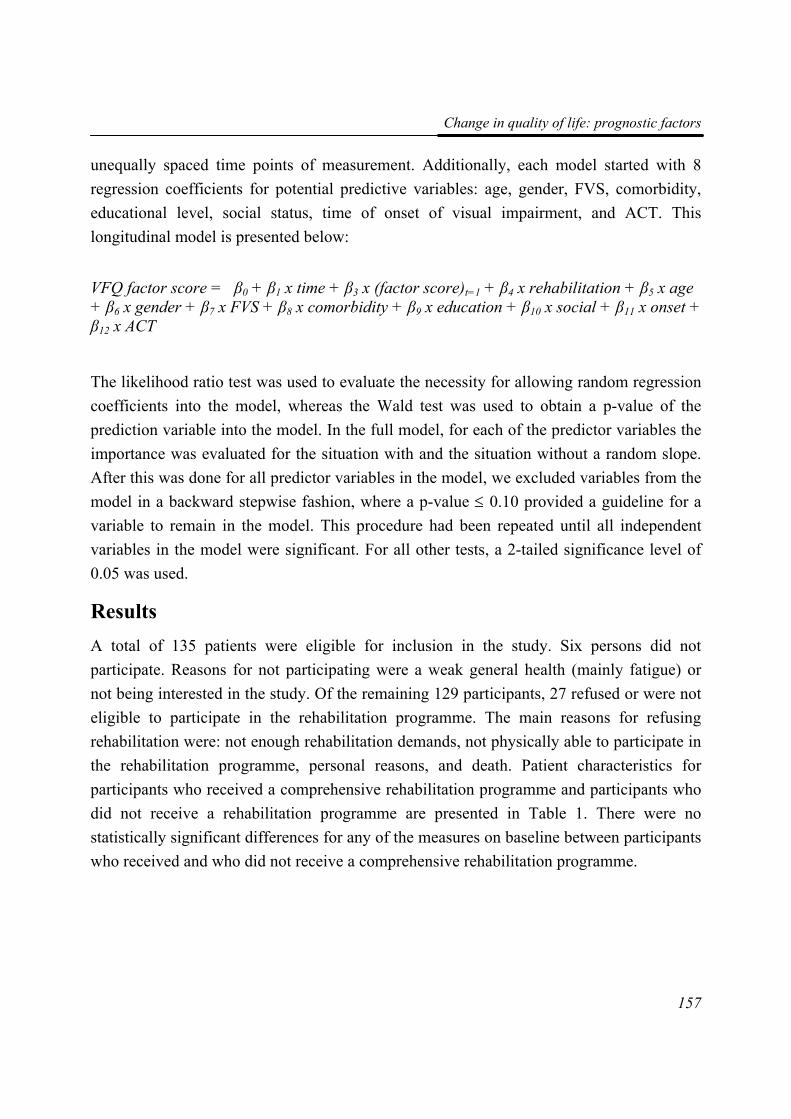
Change in quality of life: prognostic factors
157
unequally spaced time points of measurement. Additionally, each model started with 8 regression coefficients for potential predictive variables: age, gender, FVS, comorbidity, educational level, social status, time of onset of visual impairment, and ACT. This longitudinal model is presented below:
VFQ factor score = β0 + β1 x time + β3 x (factor score)t=1 + β4 x rehabilitation + β5 x age + β6 x gender + β7 x FVS + β8 x comorbidity + β9 x education + β10 x social + β11 x onset + β12 x ACT
The likelihood ratio test was used to evaluate the necessity for allowing random regression coefficients into the model, whereas the Wald test was used to obtain a p-value of the prediction variable into the model. In the full model, for each of the predictor variables the importance was evaluated for the situation with and the situation without a random slope. After this was done for all predictor variables in the model, we excluded variables from the model in a backward stepwise fashion, where a p-value ≤ 0.10 provided a guideline for a variable to remain in the model. This procedure had been repeated until all independent variables in the model were significant. For all other tests, a 2-tailed significance level of 0.05 was used.
Results A total of 135 patients were eligible for inclusion in the study. Six persons did not participate. Reasons for not participating were a weak general health (mainly fatigue) or not being interested in the study. Of the remaining 129 participants, 27 refused or were not eligible to participate in the rehabilitation programme. The main reasons for refusing rehabilitation were: not enough rehabilitation demands, not physically able to participate in the rehabilitation programme, personal reasons, and death. Patient characteristics for participants who received a comprehensive rehabilitation programme and participants who did not receive a rehabilitation programme are presented in Table 1. There were no statistically significant differences for any of the measures on baseline between participants who received and who did not receive a comprehensive rehabilitation programme.
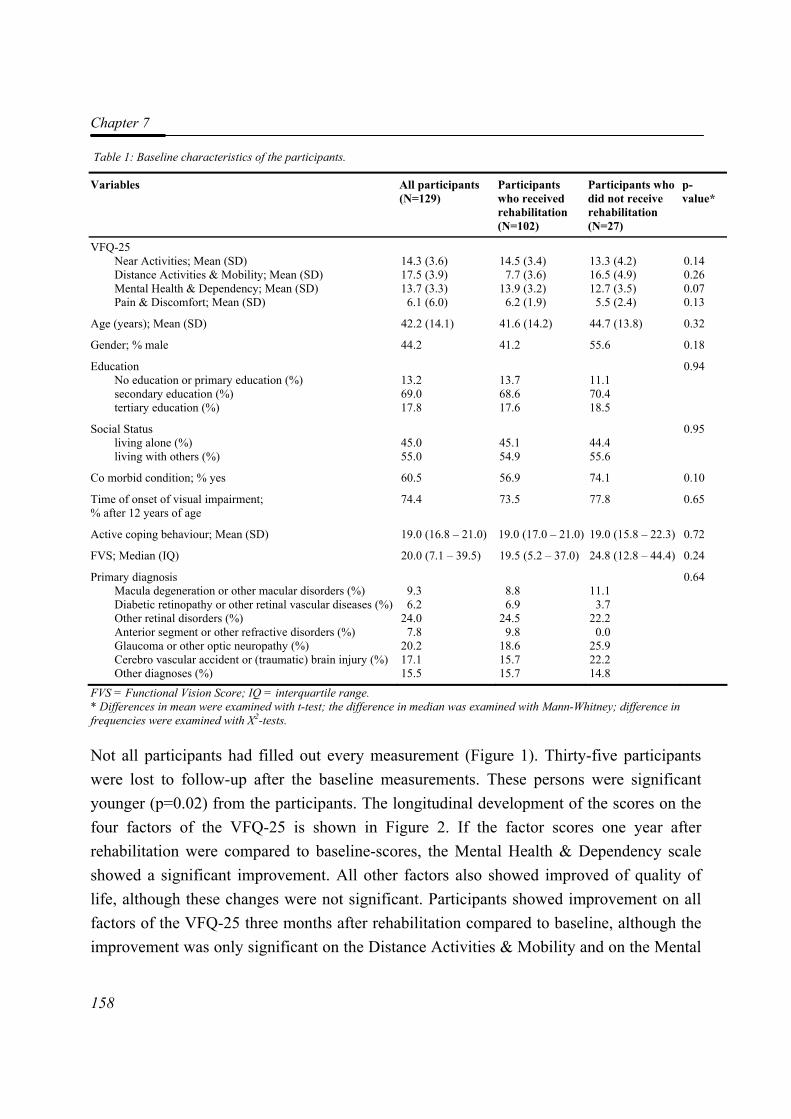
Chapter 7
158
Table 1: Baseline characteristics of the participants.
Variables All participants (N=129)
Participants who received rehabilitation (N=102)
Participants who did not receive rehabilitation (N=27)
p-value*
VFQ-25 Near Activities; Mean (SD) Distance Activities & Mobility; Mean (SD) Mental Health & Dependency; Mean (SD) Pain & Discomfort; Mean (SD)
14.3 (3.6) 17.5 (3.9) 13.7 (3.3) 6.1 (6.0)
14.5 (3.4) 7.7 (3.6)
13.9 (3.2) 6.2 (1.9)
13.3 (4.2) 16.5 (4.9) 12.7 (3.5) 5.5 (2.4)
0.14 0.26 0.07 0.13
Age (years); Mean (SD) 42.2 (14.1) 41.6 (14.2) 44.7 (13.8) 0.32
Gender; % male 44.2 41.2 55.6 0.18
Education No education or primary education (%) secondary education (%) tertiary education (%)
13.2 69.0 17.8
13.7 68.6 17.6
11.1 70.4 18.5
0.94
Social Status living alone (%) living with others (%)
45.0 55.0
45.1 54.9
44.4 55.6
0.95
Co morbid condition; % yes 60.5 56.9 74.1 0.10
Time of onset of visual impairment; % after 12 years of age
74.4 73.5 77.8 0.65
Active coping behaviour; Mean (SD) 19.0 (16.8 – 21.0) 19.0 (17.0 – 21.0) 19.0 (15.8 – 22.3) 0.72
FVS; Median (IQ) 20.0 (7.1 – 39.5) 19.5 (5.2 – 37.0) 24.8 (12.8 – 44.4) 0.24
Primary diagnosis Macula degeneration or other macular disorders (%) Diabetic retinopathy or other retinal vascular diseases (%) Other retinal disorders (%) Anterior segment or other refractive disorders (%) Glaucoma or other optic neuropathy (%) Cerebro vascular accident or (traumatic) brain injury (%) Other diagnoses (%)
9.3 6.2
24.0 7.8
20.2 17.1 15.5
8.8 6.9
24.5 9.8
18.6 15.7 15.7
11.1 3.7
22.2 0.0
25.9 22.2 14.8
0.64
FVS = Functional Vision Score; IQ = interquartile range. * Differences in mean were examined with t-test; the difference in median was examined with Mann-Whitney; difference in frequencies were examined with Χ2-tests.
Not all participants had filled out every measurement (Figure 1). Thirty-five participants were lost to follow-up after the baseline measurements. These persons were significant younger (p=0.02) from the participants. The longitudinal development of the scores on the four factors of the VFQ-25 is shown in Figure 2. If the factor scores one year after rehabilitation were compared to baseline-scores, the Mental Health & Dependency scale showed a significant improvement. All other factors also showed improved of quality of life, although these changes were not significant. Participants showed improvement on all factors of the VFQ-25 three months after rehabilitation compared to baseline, although the improvement was only significant on the Distance Activities & Mobility and on the Mental
Change in quality of life: prognostic factors
159
Health & Dependency scale. No significant changes could be detected one year after finishing rehabilitation compared to 3 months after rehabilitation. The Near Activities scale showed a slight improvement, whereas the other scales showed a slight deterioration in quality of life.
Figure 1: Final working data set of visually impaired adults. The numbers reflect participants that did (Yes) or did not (No) filled out the questionnaires at the specific measurement. The numbers in parentheses reflect the participants that did not receive rehabilitation. For example, 77 (67+10) participants filled out the questionnaire to assess long-term outcome, of whom 10 (7+3) participants did not follow a rehabilitation programme.
Table 2 presents the significant predictor variables of the multivariate random coefficient models of the four factors. For participants who received rehabilitation, age appeared to be a significant prediction variable for all factors. A higher age corresponded with a worse quality of life after rehabilitation for three subscales compared to an earlier measurement. On the Pain & Discomfort subscale, older people had a better quality of life after rehabilitation.
Additionally, FVS, and time of onset of visual impairment were predictors for the factor “Pain and Discomfort”. Participants with a lower FVS had a better quality of life compared to persons with a better visual function. If the onset of the visual impairment was before the age of twelve years, the participants had fewer problems with pain and discomfort after rehabilitation.
Yes Yes
Yes
No No
No
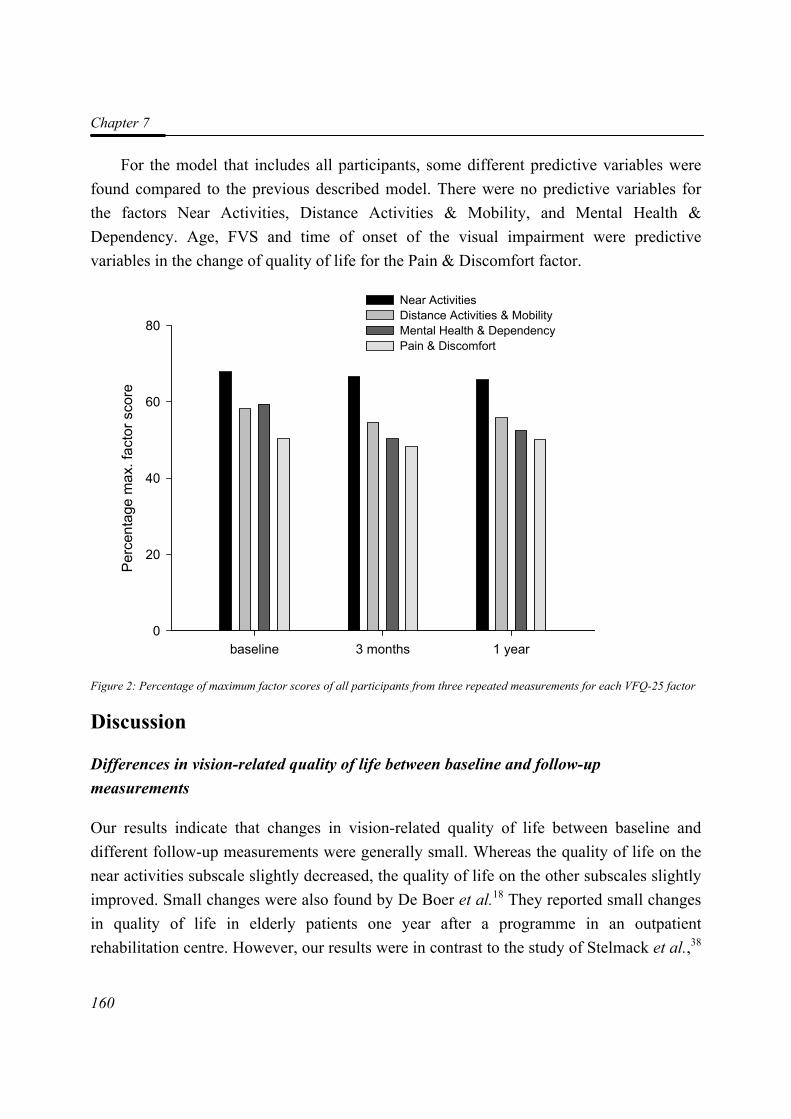
Chapter 7
160
For the model that includes all participants, some different predictive variables were found compared to the previous described model. There were no predictive variables for the factors Near Activities, Distance Activities & Mobility, and Mental Health & Dependency. Age, FVS and time of onset of the visual impairment were predictive variables in the change of quality of life for the Pain & Discomfort factor.
Figure 2: Percentage of maximum factor scores of all participants from three repeated measurements for each VFQ-25 factor
Discussion
Differences in vision-related quality of life between baseline and follow-up measurements
Our results indicate that changes in vision-related quality of life between baseline and different follow-up measurements were generally small. Whereas the quality of life on the near activities subscale slightly decreased, the quality of life on the other subscales slightly improved. Small changes were also found by De Boer et al.18 They reported small changes in quality of life in elderly patients one year after a programme in an outpatient rehabilitation centre. However, our results were in contrast to the study of Stelmack et al.,38
baseline 3 months 1 year
Perc
enta
ge m
ax. f
acto
r sco
re
0
20
40
60
80
Near ActivitiesDistance Activities & MobilityMental Health & DependencyPain & Discomfort
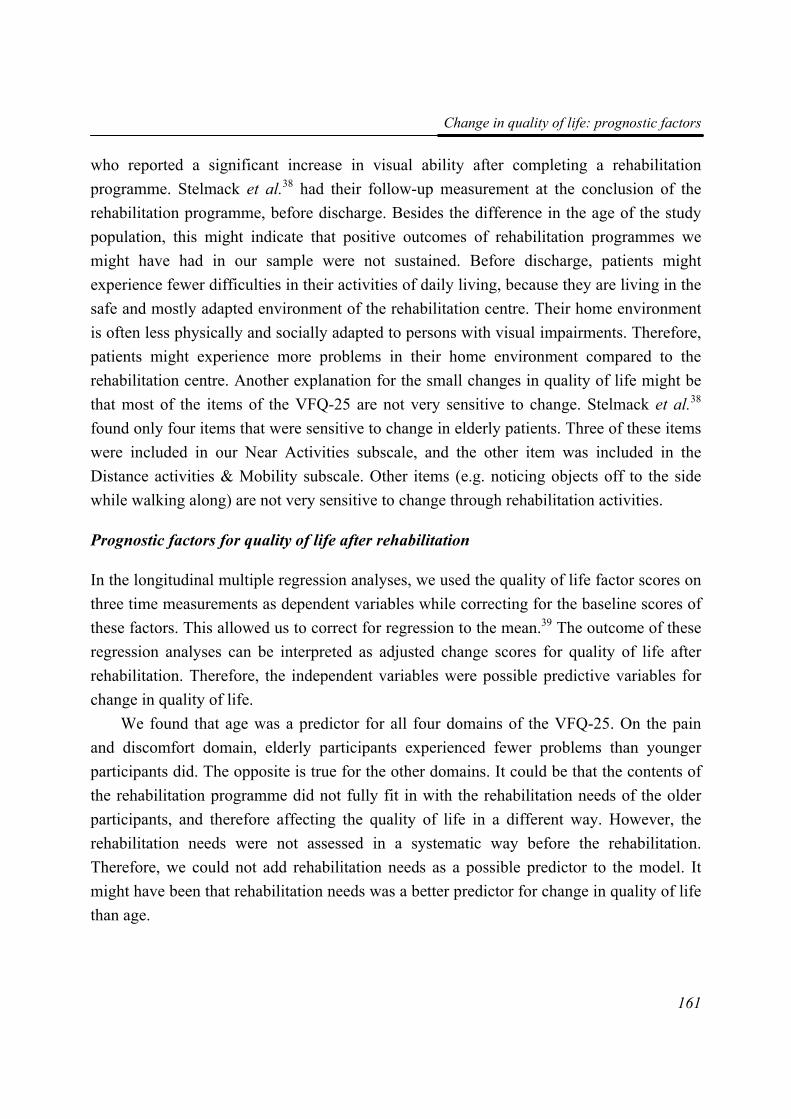
Change in quality of life: prognostic factors
161
who reported a significant increase in visual ability after completing a rehabilitation programme. Stelmack et al.38 had their follow-up measurement at the conclusion of the rehabilitation programme, before discharge. Besides the difference in the age of the study population, this might indicate that positive outcomes of rehabilitation programmes we might have had in our sample were not sustained. Before discharge, patients might experience fewer difficulties in their activities of daily living, because they are living in the safe and mostly adapted environment of the rehabilitation centre. Their home environment is often less physically and socially adapted to persons with visual impairments. Therefore, patients might experience more problems in their home environment compared to the rehabilitation centre. Another explanation for the small changes in quality of life might be that most of the items of the VFQ-25 are not very sensitive to change. Stelmack et al.38 found only four items that were sensitive to change in elderly patients. Three of these items were included in our Near Activities subscale, and the other item was included in the Distance activities & Mobility subscale. Other items (e.g. noticing objects off to the side while walking along) are not very sensitive to change through rehabilitation activities.
Prognostic factors for quality of life after rehabilitation
In the longitudinal multiple regression analyses, we used the quality of life factor scores on three time measurements as dependent variables while correcting for the baseline scores of these factors. This allowed us to correct for regression to the mean.39 The outcome of these regression analyses can be interpreted as adjusted change scores for quality of life after rehabilitation. Therefore, the independent variables were possible predictive variables for change in quality of life.
We found that age was a predictor for all four domains of the VFQ-25. On the pain and discomfort domain, elderly participants experienced fewer problems than younger participants did. The opposite is true for the other domains. It could be that the contents of the rehabilitation programme did not fully fit in with the rehabilitation needs of the older participants, and therefore affecting the quality of life in a different way. However, the rehabilitation needs were not assessed in a systematic way before the rehabilitation. Therefore, we could not add rehabilitation needs as a possible predictor to the model. It might have been that rehabilitation needs was a better predictor for change in quality of life than age.
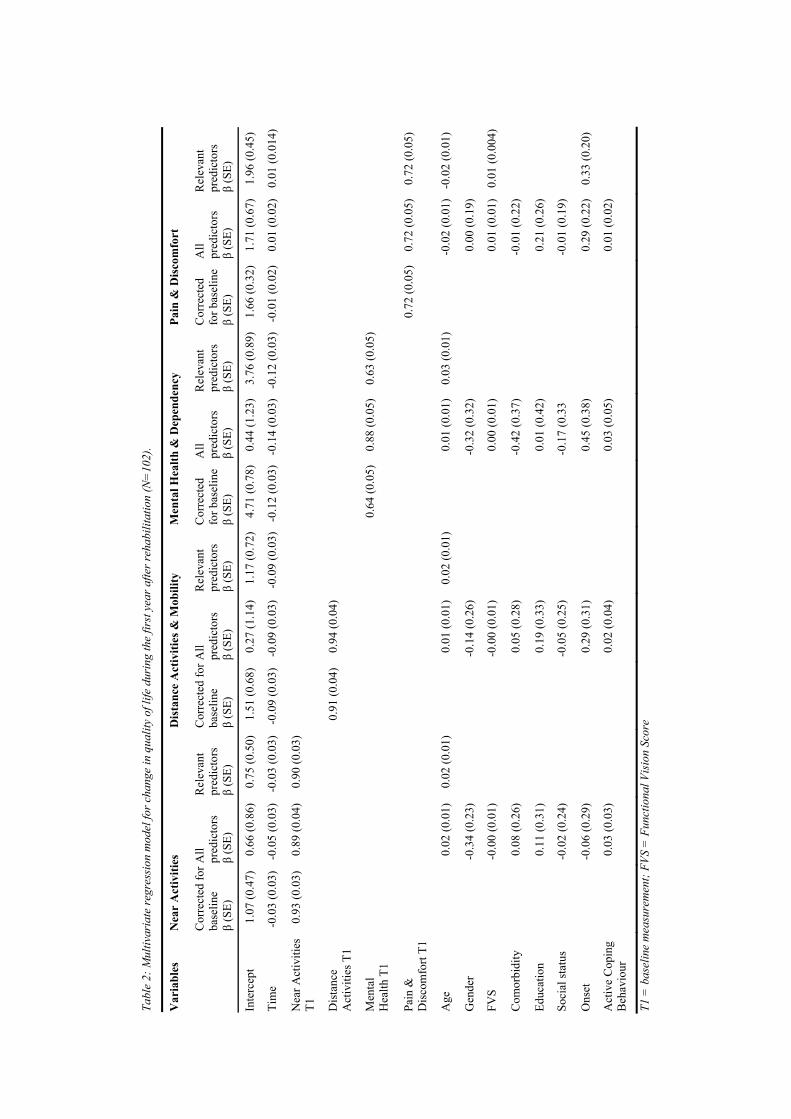
Tabl
e 2:
Mul
tivar
iate
regr
essi
on m
odel
for c
hang
e in
qua
lity
of li
fe d
urin
g th
e fir
st y
ear a
fter r
ehab
ilita
tion
(N=
102)
.
Nea
r A
ctiv
ities
D
ista
nce
Act
iviti
es &
Mob
ility
M
enta
l Hea
lth &
Dep
ende
ncy
Pain
& D
isco
mfo
rt
Var
iabl
es
Cor
rect
ed fo
r ba
selin
e β
(SE)
All
pred
icto
rs
β (S
E)
Rel
evan
t pr
edic
tors
β
(SE)
Cor
rect
ed fo
r ba
selin
e β
(SE)
All
pred
icto
rs
β (S
E)
Rel
evan
t pr
edic
tors
β
(SE)
Cor
rect
ed
for b
asel
ine
β (S
E)
All
pred
icto
rs
β (S
E)
Rel
evan
t pr
edic
tors
β
(SE)
Cor
rect
ed
for b
asel
ine
β (S
E)
All
pred
icto
rs
β (S
E)
Rel
evan
t pr
edic
tors
β
(SE)
Inte
rcep
t 1.
07 (0
.47)
0.
66 (0
.86)
0.
75 (0
.50)
1.
51 (0
.68)
0.
27 (1
.14)
1.
17 (0
.72)
4.71
(0.7
8)0.
44 (1
.23)
3.76
(0.8
9)1.
66 (0
.32)
1.71
(0.6
7)1.
96 (0
.45)
Tim
e -0
.03
(0.0
3)
-0.0
5 (0
.03)
-0
.03
(0.0
3)
-0.0
9 (0
.03)
-0
.09
(0.0
3)
-0.0
9 (0
.03)
-0.1
2 (0
.03)
-0.1
4 (0
.03)
-0.1
2 (0
.03)
-0.0
1 (0
.02)
0.01
(0.0
2)0.
01 (0
.014
)
Nea
r Act
iviti
es
T1
0.93
(0.0
3)
0.89
(0.0
4)
0.90
(0.0
3)
Dis
tanc
e A
ctiv
ities
T1
0.
91 (0
.04)
0.
94 (0
.04)
Men
tal
Hea
lth T
1
0.
64 (0
.05)
0.88
(0.0
5)0.
63 (0
.05)
Pain
&
Dis
com
fort
T1
0.
72 (0
.05)
0.72
(0.0
5)0.
72 (0
.05)
Age
0.02
(0.0
1)
0.02
(0.0
1)
0.
01 (0
.01)
0.
02 (0
.01)
0.
01 (0
.01)
0.03
(0.0
1)
-0.0
2 (0
.01)
-0.0
2 (0
.01)
Gen
der
-0
.34
(0.2
3)
-0.1
4 (0
.26)
-0
.32
(0.3
2)
0.
00 (0
.19)
FVS
-0
.00
(0.0
1)
-0.0
0 (0
.01)
0.
00 (0
.01)
0.01
(0.0
1)0.
01 (0
.004
)
Com
orbi
dity
0.08
(0.2
6)
0.05
(0.2
8)
-0.4
2 (0
.37)
-0.0
1 (0
.22)
Educ
atio
n
0.11
(0.3
1)
0.19
(0.3
3)
0.01
(0.4
2)
0.
21 (0
.26)
Soci
al st
atus
-0.0
2 (0
.24)
-0
.05
(0.2
5)
-0.1
7 (0
.33
-0.0
1 (0
.19)
Ons
et
-0
.06
(0.2
9)
0.29
(0.3
1)
0.45
(0.3
8)
0.
29 (0
.22)
0.33
(0.2
0)
Act
ive
Cop
ing
Beh
avio
ur
0.
03 (0
.03)
0.
02 (0
.04)
0.
03 (0
.05)
0.01
(0.0
2)
T1 =
bas
elin
e m
easu
rem
ent;
FVS
= F
unct
iona
l Vis
ion
Scor
e
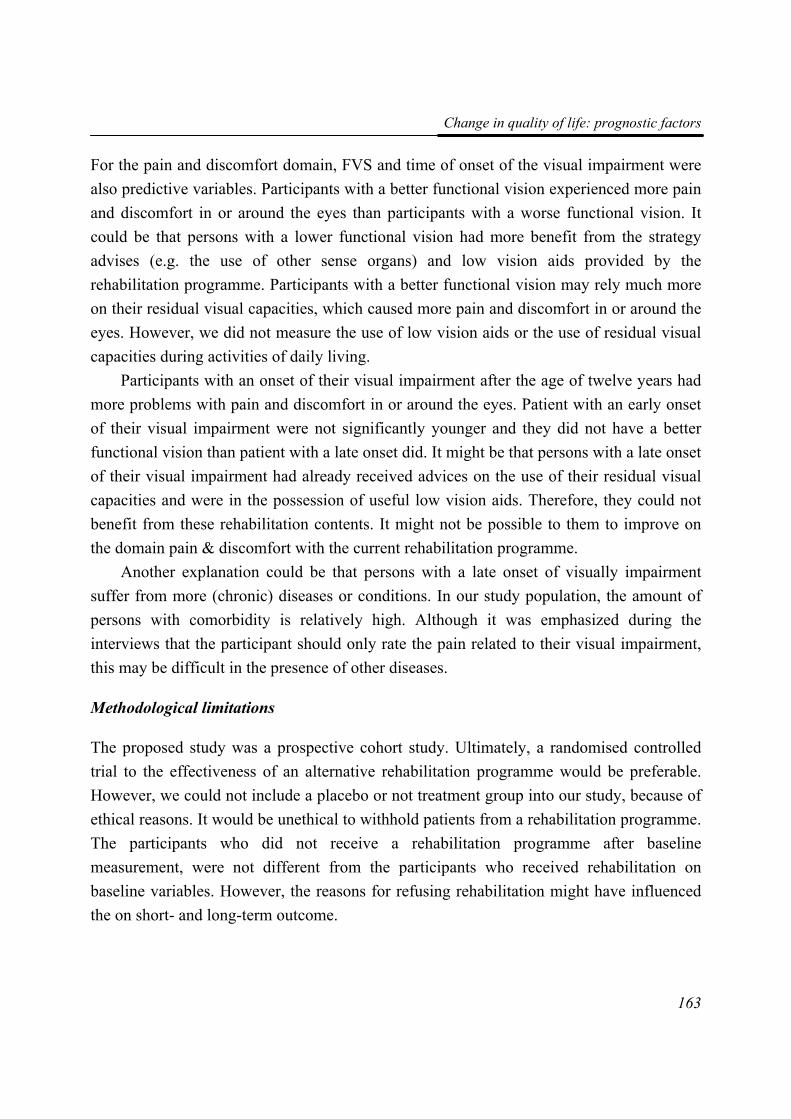
Change in quality of life: prognostic factors
163
For the pain and discomfort domain, FVS and time of onset of the visual impairment were also predictive variables. Participants with a better functional vision experienced more pain and discomfort in or around the eyes than participants with a worse functional vision. It could be that persons with a lower functional vision had more benefit from the strategy advises (e.g. the use of other sense organs) and low vision aids provided by the rehabilitation programme. Participants with a better functional vision may rely much more on their residual visual capacities, which caused more pain and discomfort in or around the eyes. However, we did not measure the use of low vision aids or the use of residual visual capacities during activities of daily living.
Participants with an onset of their visual impairment after the age of twelve years had more problems with pain and discomfort in or around the eyes. Patient with an early onset of their visual impairment were not significantly younger and they did not have a better functional vision than patient with a late onset did. It might be that persons with a late onset of their visual impairment had already received advices on the use of their residual visual capacities and were in the possession of useful low vision aids. Therefore, they could not benefit from these rehabilitation contents. It might not be possible to them to improve on the domain pain & discomfort with the current rehabilitation programme.
Another explanation could be that persons with a late onset of visually impairment suffer from more (chronic) diseases or conditions. In our study population, the amount of persons with comorbidity is relatively high. Although it was emphasized during the interviews that the participant should only rate the pain related to their visual impairment, this may be difficult in the presence of other diseases.
Methodological limitations
The proposed study was a prospective cohort study. Ultimately, a randomised controlled trial to the effectiveness of an alternative rehabilitation programme would be preferable. However, we could not include a placebo or not treatment group into our study, because of ethical reasons. It would be unethical to withhold patients from a rehabilitation programme. The participants who did not receive a rehabilitation programme after baseline measurement, were not different from the participants who received rehabilitation on baseline variables. However, the reasons for refusing rehabilitation might have influenced the on short- and long-term outcome.
Chapter 7
164
Although the cohort study was dictated, there were some problems using this design in the study. First, a possible bias in the proposed study could be induced by the Hawthorne effect. The Hawthorne effect is the effect that the scores of the participants in the study were influenced by the fact that the participants know they are under observation. This effect could apply in every sort of research, but quality of life research, where the outcome measures are of a subjective nature, seems especially vulnerable to this effect.40 However, a real solution for this problem is not available. The only thing that would be effective is to have people have to fill out the questionnaires without knowing they are part of a study. This would also mean that informed consent could not be obtained. It is apparent that this would have been neither ethical nor acceptable to carry out in our study.
A second problem of using a cohort study was the possible placebo effect. The participants’ answers on the questionnaires could be influenced by the expectancy that they had of the rehabilitation programme and by the intense contact between the participant and the rehabilitation workers. However, this effect was a ‘real’ effect of the rehabilitation programme and would also exist without the research being done.
A limitation of the current study was the possible lack of statistical power. A guideline for the use of multiple regression analysis is that no more than n/10 variables are examined.41 A sufficient statistical power for eight possible predictive variables in the model a minimum amount of 80 participants was required. We assumed a non-response of 10 % and a dropout rate of 10% at three months follow-up and also at 1 year follow-up, the number of clients that were needed to enrol in the rehabilitation programme was 125. However, it appeared that 27 participants did not enrol in the rehabilitation programme. A larger sample of participants would have increased the statistical power, and possible would have led to more statistically significant results or other predictive variables.
In conclusion, our results indicate that only age was a predictor for all domains of quality of life. Because the explanation for the results concerning age are not yet fully understood and because prognostic models tended not to be very stable, future research should be aimed at confirming our results. Ultimately, these findings should lead to adjustments in the rehabilitation programme, which should be tested in a randomised way. However, we could not include placebo or no treatment group into our study, because of ethical reasons. It would be unethical to withhold patients from a rehabilitation programme.

Change in quality of life: prognostic factors
165
References 1. Heine C and Browning CJ. (2002). Communication and psychosocial consequences of
sensory loss in older adults: overview and rehabilitation directions. Disability and Rehabilitation. 24 (15): 763-773.
2. Watson GR. (2001). Low vision in the geriatric population: rehabilitation and management. Journal of the American Geriatrics Society. 49 (3): 317-330.
3. Bischoff P. (1995). Long-term results of low vision rehabilitation in age-related macular degeneration. Documenta Ophthalmologica. 89 (4): 305-311.
4. Harper R, Doorduyn K, Reeves B and Slater L. (1999). Evaluating the outcomes of low vision rehabilitation. Ophthalmic and Physiological Optics. 19 (1): 3-11.
5. Hartong DT, Jorritsma FF, Neve JJ, Melis-Dankers BJ and Kooijman AC. (2004). Improved mobility and independence of night-blind people using night-vision goggles. Investigative Ophthalmology and Visual Science. 45 (6): 1725-1731.
6. Jones T and Troscianko T. (2006). Mobility performance of low-vision adults using an electronic mobility aid. Clinical and Experimental Optometry. 89 (1): 10-17.
7. Leat SJ, Fryer A and Rumney NJ. (1994). Outcome of low vision aid provision: the effectiveness of a low vision clinic. Optometry and Vision Science. 71 (3): 199-206.
8. McCabe P, Nason F, Demers TP, Friedman D and Seddon JM. (2000). Evaluating the effectiveness of a vision rehabilitation intervention using an objective and subjective measure of functional performance. Ophthalmic Epidemiology. 7 (4): 259-270.
9. McIlwaine GG, Bell JA and Dutton GN. (1991). Low vision aids--is our service cost effective? Eye. 5 ( Pt 5) 607-611.
10. Nilsson UL. (1990). Visual rehabilitation with and without educational training in the use of optical aids and residual vision. A prospective study of patients with advanced age-related macular degeneration. Clinical Vision Sciences. 6 (1): 3-10.
11. Scott IU, Smiddy WE, Schiffman J, Feuer WJ and Pappas CJ. (1999). Quality of life of low-vision patients and the impact of low-vision services. American Journal of Ophthalmology. 128 (1): 54-62.
12. Shuttleworth GN, Dunlop A, Collins JK and James CR. (1995). How effective is an integrated approach to low vision rehabilitation? Two year follow-up results from south Devon. British Journal of Ophthalmology. 79 (8): 719-723.
13. Soong GP, Lovie-Kitchin JE and Brown B. (2001). Does mobility performance of visually impaired adults improve immediately after orientation and mobility training? Optometry and Vision Science. 78 (9): 657-666.
14. van Rens GHMB, Chmielowski RJ and Lemmens WA. (1991). Results obtained with low vision aids. A retrospective study. Documenta Ophthalmologica. 78 (3-4): 205-210.
Chapter 7
166
15. Raasch TW, Leat SJ, Kleinstein RN, Bullimore MA and Cutter GR. (1997). Evaluating the value of low-vision services. Journal of the American Optometric Association. 68 (5): 287-295.
16. Stelmack J. (2001). Quality of life of low-vision patients and outcomes of low-vision rehabilitation. Optometry and Vision Science. 78 (5): 335-342.
17. Resnikoff S, Pascolini D, Etya'ale D, Kocur I, Pararajasegaram R, Pokharel GP and Mariotti SP. (2004). Global data on visual impairment in the year 2002. Bulletin of the World Health Organization. 82 (11): 844-851.
18. de Boer MR, Twisk J, Moll AC, Volker-Dieben HJ, de Vet HC and van Rens GHMB. (2006). Outcomes of low-vision services using optometric and multidisciplinary approaches: a non-randomized comparison. Ophthalmic and Physiological Optics. 26 (6): 535-544.
19. Birk T, Hickl S, Wahl HW, Miller D, Kammerer A, Holz F, Becker S and Volcker HE. (2004). Development and pilot evaluation of a psychosocial intervention program for patients with age-related macular degeneration. Gerontologist. 44 (6): 836-843.
20. Lund R and Dietrichson J.(2000). Rehabilitation of people with visual impairments and quality of life. In: Stuen C, Arditi A, Horowitz A, et al., eds. Vision rehabilitation - assessment, intervention and outcomes. Lisse: Swets and Zeitlinger Publishers; 780-785.
21. Reeves BC, Harper RA and Russell WB. (2004). Enhanced low vision rehabilitation for people with age related macular degeneration: a randomised controlled trial. British Journal of Ophthalmology. 88 (11): 1443-1449.
22. Wolffsohn JS and Cochrane AL. (2000). Design of the low vision quality-of-life questionnaire (LVQOL) and measuring the outcome of low-vision rehabilitation. American Journal of Ophthalmology. 130 (6): 793-802.
23. de Boer MR, Langelaan M, Jansonius NM and van Rens GHMB. (2005). Evidence-based guidelines on the referral of visually impaired persons to low vision services. European Journal of Ophthalmology. 15 (3): 400-406.
24. Langelaan M, van Nispen RMA and van Rens GHMB. Quality of life after rehabilitation for visual impairments.
25. Mangione CM, Berry S, Spritzer K, Janz NK, Klein R, Owsley C and Lee PP. (1998). Identifying the content area for the 51-item National Eye Institute Visual Function Questionnaire: results from focus groups with visually impaired persons. Archives of Ophthalmology. 116 (2): 227-233.
26. Mangione CM, Lee PP, Gutierrez PR, Spritzer K, Berry S and Hays RD. (2001). Development of the 25-item National Eye Institute Visual Function Questionnaire. Archives of Ophthalmology. 119 (7): 1050-1058.
Change in quality of life: prognostic factors
167
27. Langelaan M, van Nispen RMA, Knol DL, Moll AC, de Boer MR, Wouters B and van Rens GHMB. (2007). Visual Functioning Questionnaire: re-evaluation of psychometric properties for a group of working age adults. Optometry and Vision Science.
28. Streiner DL. (1994). Figuring out factors: the use and misuse of factor analysis. Canadian Journal of Psychiatry Revue Canadienne de Psychiatrie. 39 (3): 135-140.
29. Roznowski M, Dickter DN, Hong S, Sawin LL and Shute VJ. (2000). Validity of measures of cognitive processes and general ability for learning and performance on highly complex computerized tutors: is the g factor of intelligence even more general? Journal of Applied Psychology. 85 (6): 940-955.
30. Cocchiarella L and Andersson G.(2001). The visual system. In: Andersson G, Cocchiarella L, eds. Guides to the evaluation of permanent impairment. 5th ed. Chicago, Ill: American Medical Association; 277-304.
31. Colenbrander A. (1999). Guide for the Evaluation of Visual Impairment. San Francisco: International Society for Low Vision Research and Rehabilitation.
32. Massof RW. (2002). The measurement of vision disability. Optometry and Vision Science. 79 (8): 516-552.
33. Massof RW and Fletcher DC. (2001). Evaluation of the NEI visual functioning questionnaire as an interval measure of visual ability in low vision. Vision Research. 41 (3): 397-413.
34. Fuhr PSW, Holmes LD, Fletcher DC, Swanson MN and Kuyk TK. (2003). The AMA Guides functional vision score is a better predictor of vision-targeted quality of life than traditional measures of visual acuity or visual field extent. Visual Impairment Research. 5 (3): 137-146.
35. Schreurs PJG, Willige Gvd, Brosschot JF, Tellegen B and Graus GHM. (1993). Handleiding Utrechtse Coping Lijst UCL (herziene versie). Lisse: Zwets & Zeitlinger.
36. Rashbash J, Browne W, Goldstein H, Yang M, Plewis I, Healy M, Woodhouse G, Draper D, Langford I and Lewis T. (2000). A user's guide to MLwiN. London, UK: Centre for Multilevel Modelling.
37. Twisk JWR. (2003). Applied longitudinal data analysis for epidemiology. Cambridge, UK: Cambridge University Press.
38. Stelmack JA, Stelmack TR and Massof RW. (2002). Measuring low-vision rehabilitation outcomes with the NEI VFQ-25. Investigative Ophthalmology and Visual Science. 43 (9): 2859-2868.
39. Twisk J and Proper K. (2004). Evaluation of the results of a randomized controlled trial: how to define changes between baseline and follow-up. Journal of Clinical Epidemiology. 57 (3): 223-228.

Chapter 7
168
40. Bouchet C, Guillemin F and Briancon S. (1996). Nonspecific effects in longitudinal studies: impact on quality of life measures. Journal of Clinical Epidemiology. 49 (1): 15-20.
41. Altman DG. (1991). Practical Statistics for Medical Research. first edition ed. London: Chapman & Hall.
88
EEvviiddeennccee--bbaasseedd gguuiiddeelliinneess oonn tthhee rreeffeerrrraall ooff vviissuuaallllyy iimmppaaiirreedd ppeerrssoonnss
ttoo llooww vviissiioonn sseerrvviicceess
Michiel R de Boer, Maaike Langelaan, Nomdo M Jansonius, Ger HMB van Rens
European Journal of Ophthalmology 2005 15 (3): 400-406
Chapter 8
170
Abstract Background: One to two percent of the population in the Western world is visually impaired or blind. For most of these people there is no curative therapy. Therefore, the Dutch ophthalmic society has taken the initiative to develop evidence-based guidelines for the referral of visually impaired persons to low vision services. Methods: A systematic literature search was performed in the Embase (1991-2001) and Medline (1966-2003) databases. Literature was searched for definitions of visual impairment, for physician-patient communication and for outcome of interventions for visually impaired persons. Results of the articles that were selected were summarised and rated according to the level of evidence. Other considerations such as the current organisation of rehabilitation for visually impaired persons in the Netherlands, were also taken into account. Results: The WHO criteria were slightly adapted in order to include all people who experience problems with reading and other daily life activities due to visual impairment. A large number of recommendations were devised. Among these is that the complete diagnosis should be communicated to the patient and that a second appointment should be offered in which the diagnosis and potential treatment options are discussed again. Another recommendation is that in general visually impaired adults eligible for referral should be referred for the provision of low vision aids and that patients with complex problems or extensive rehabilitative demand should be referred to a rehabilitation centre. Conclusions: This paper presents a summary of the first European evidence-based guidelines for the referral of visually impaired persons.
Guidelines on the referral of visually impaired persons
171
Introduction It has been estimated that 1-2% of the population in the Western world is visually impaired or blind.1 At this moment, there are approximately 200.000 visually impaired or blind persons in The Netherlands of which the majority (85 %) is age 65 or older.2 The main cause of visual impairment and blindness is age-related macular degeneration (AMD).3;4 Ninety percent of people with AMD have the so-called dry form, for which no curative therapy exists. Other important causes of visual impairment and blindness are diabetic retinopathy and glaucoma. Although progression of these diseases can be slowed down, no curative therapy is currently available. The number of visually impaired elderly will strongly increase over the coming decades because of the ageing of the population. This will result in both an increased number of ophthalmic consultations and an increased demand on visual rehabilitation.
The Dutch ophthalmic society (NOG) has taken the initiative to develop evidence-based guidelines for timely transparent and efficient referral of persons with irreversible vision loss to proven and relevant forms of rehabilitation. These guidelines are primarily aimed at ophthalmologists, but can also be used by other physicians (e.g. general practitioners, rehabilitation specialists, company doctors).
Although several guidelines for the referral of visually impaired persons exist, only one of these is evidence-based. This concerns the guideline developed by the American Academy of Ophthalmology.5 However, this guideline appeared not to be useful in The Netherlands, because the organisation of health care in the United States is too different from the situation in The Netherlands (and the rest of Europe). Therefore, we decided to develop new guidelines which can be used in The Netherlands and possibly the rest of Europe. The purpose of this paper is to describe the development and to summarise the results and recommendations of these first European evidence-based guidelines for referral of persons with irreversible vision loss to proven and relevant forms of rehabilitation.
Methods
Commission
In 2001 a multidisciplinary eight-person commission was formed, which worked on the development of these guidelines until June 2004. The authors of this paper formed the core commission. The core commission shaped the development of the guidelines while the rest
Chapter 8
172
of the commission gave feedback on their work on several occasions. After the concept of the guidelines had been developed, it was discussed with members of patients organisations, the directors of the rehabilitation centres for visually impaired persons in The Netherlands, and all members of the Dutch Ophthalmic Society.
Literature search
A systematic literature search was performed in the Embase (1991-2001) and Medline (1966-2003) databases. Furthermore, we cross-checked the references from the articles we retrieved and from existing guidelines. In general, literature was searched on three major subjects, stemming from three questions we thought these guidelines should answer. The first question was: who should be referred? Accordingly, we searched for definitions of visual impairment and blindness. The second question was: how should people be referred? Accordingly, we searched for evidence on physician-patient communication with a special focus on how to communicate bad news. Because we thought beforehand that there would be only few articles on this subject concerning visually impaired persons, we also searched for literature involving other patient groups such as patients with cancer. The third question was: what is the current evidence on the available interventions for various groups of visually impaired persons? The groups we distinguished were (1) visually impaired adults, (2) visually impaired children, (3) geriatric patients with visual impairment, and (4) people with visual impairment caused by acquired brain damage. We developed specific search strategies for these separate groups.
The abstracts which were retrieved in the literature search were scored for relevance by three of the members of the core commission (MdB, NJ and GvR) independently from each other. Disagreement was discussed. If disagreement could not be resolved, the full text article was scored and discussed again. Following this method, agreement was reached for all articles.
Grading the evidence and deducing recommendations
The full text articles that were selected, were divided among the same three members of the core commission. The members summarised the results of the studies presented in the articles and rated these results according to the level of evidence. The ratings for the level of evidence are presented in Table 1. In addition to the scientific information retrieved from the literature, other considerations such as the current organisation of rehabilitation for
Guidelines on the referral of visually impaired persons
173
visually impaired persons in the Netherlands were taken into account when devising the recommendations. Table 1: Levels of evidence according to study design
1a Systematic review of randomised controlled trials (RCT) with consistency (homogeneity) of results 1b RCT of good quality 1c “All or nothing” research 2a Systematic review of cohort or patient-control studies with consistency (homogeneity) of results 2b RCT of poor/moderate quality or cohort or patient-control study. 2c ´Outcomes research´ (registration, descriptive research) 3 Patient series or cohort or patient-control study of poor quality 4 Expert opinion.
Results
Definitions
There are many definitions for visually impairment or blindness given in the literature.6 We adopted the WHO criteria,7 because these are the most widely used around the world as well as in the Netherlands. These criteria define visual impairment as best corrected visual acuity of the best eye < 0.3 or visual field defects within 30° of fixation. Blindness is defined as visual acuity < 0.05 or visual field defects within 10° of fixation. However, ophthalmologists in both regular practices as well as in rehabilitation centres agree that some people with visual acuity < 0.5 but > 0.3 also experience problems with reading and other daily life activities. This can be attributed to the high visual demands current society places on people and to the fact that people might suffer from other aspects of visual impairment not mentioned in the definitions of the WHO, such as decreased contrast sensitivity or night blindness.8 Therefore, this group of people was also included in the guidelines. It is recommended that persons with a visual acuity < 0.5, a reading acuity of < 0.25, visual field defects within 30° of fixation or other severe impairments in visual field such as hemianopsia and relevant vision-related problems in daily life, which cannot be addressed by interventions in the standard ophthalmic practice, and which can potentially be solved by visual rehabilitation, should be considered for referral to forms of visual rehabilitation (see Table 2).
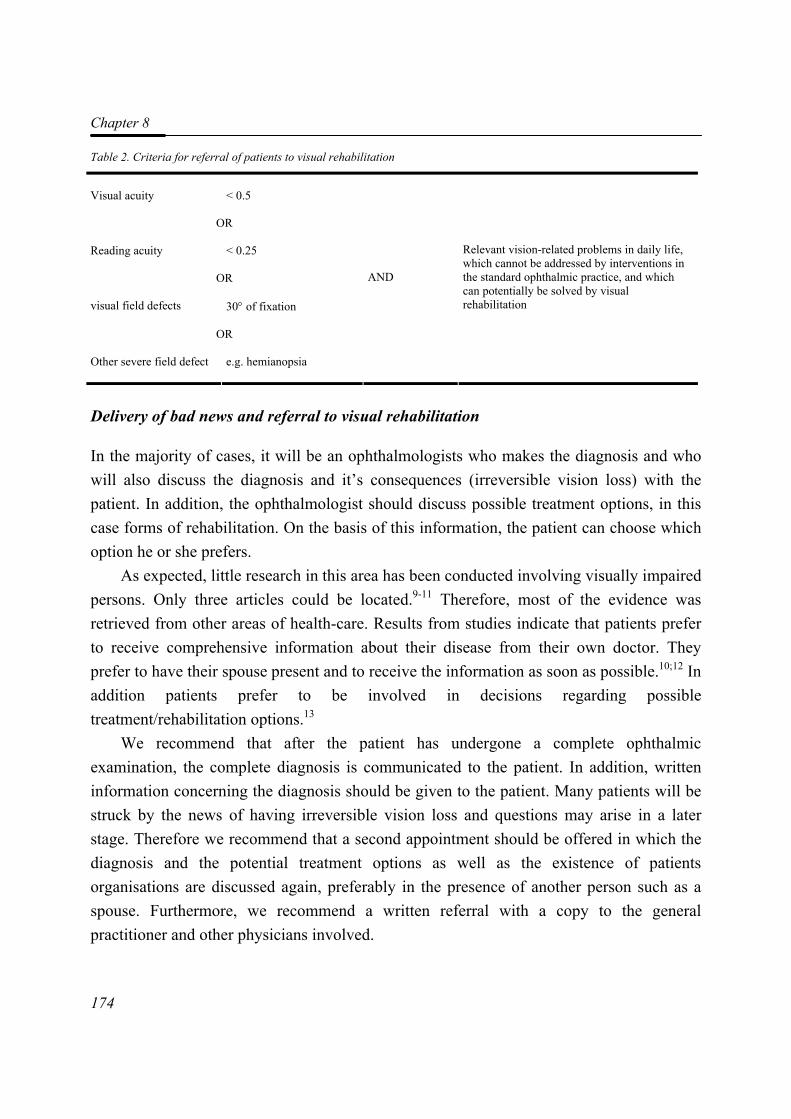
Chapter 8
174
Table 2. Criteria for referral of patients to visual rehabilitation
Visual acuity
< 0.5
OR
Reading acuity < 0.25
OR
visual field defects 30° of fixation
OR
Other severe field defect e.g. hemianopsia
AND
Relevant vision-related problems in daily life, which cannot be addressed by interventions in the standard ophthalmic practice, and which can potentially be solved by visual rehabilitation
Delivery of bad news and referral to visual rehabilitation
In the majority of cases, it will be an ophthalmologists who makes the diagnosis and who will also discuss the diagnosis and it’s consequences (irreversible vision loss) with the patient. In addition, the ophthalmologist should discuss possible treatment options, in this case forms of rehabilitation. On the basis of this information, the patient can choose which option he or she prefers.
As expected, little research in this area has been conducted involving visually impaired persons. Only three articles could be located.9-11 Therefore, most of the evidence was retrieved from other areas of health-care. Results from studies indicate that patients prefer to receive comprehensive information about their disease from their own doctor. They prefer to have their spouse present and to receive the information as soon as possible.10;12 In addition patients prefer to be involved in decisions regarding possible treatment/rehabilitation options.13
We recommend that after the patient has undergone a complete ophthalmic examination, the complete diagnosis is communicated to the patient. In addition, written information concerning the diagnosis should be given to the patient. Many patients will be struck by the news of having irreversible vision loss and questions may arise in a later stage. Therefore we recommend that a second appointment should be offered in which the diagnosis and the potential treatment options as well as the existence of patients organisations are discussed again, preferably in the presence of another person such as a spouse. Furthermore, we recommend a written referral with a copy to the general practitioner and other physicians involved.
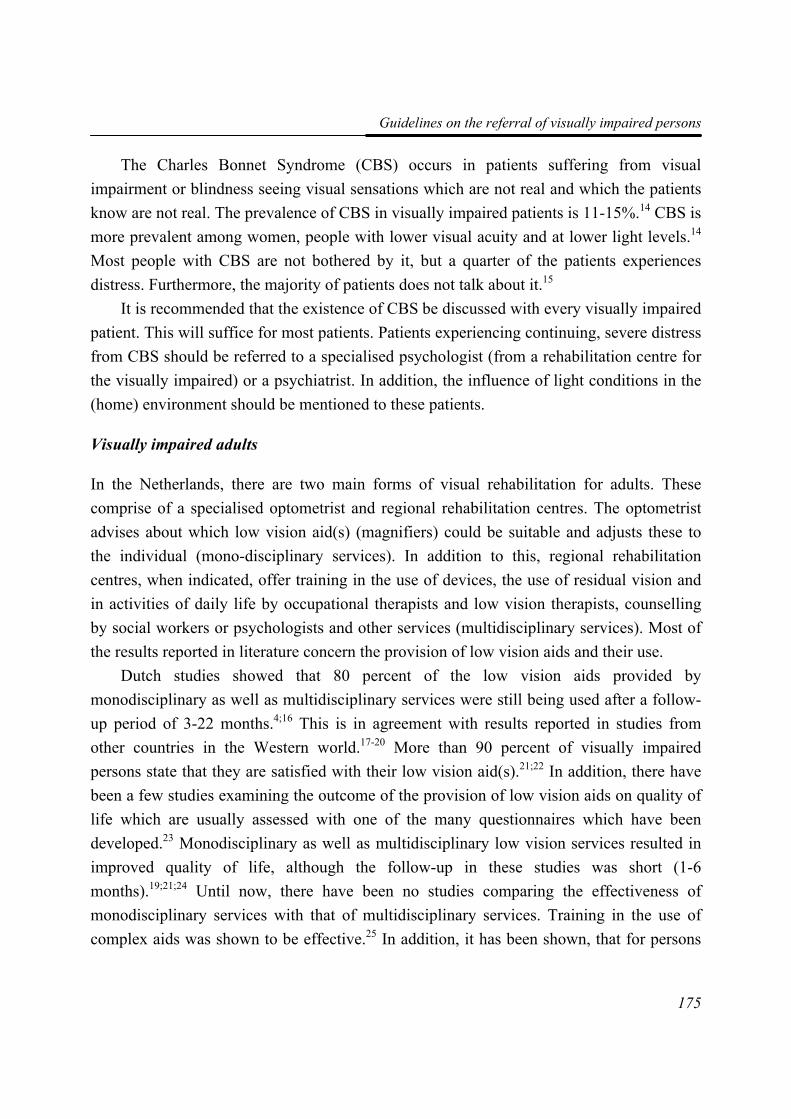
Guidelines on the referral of visually impaired persons
175
The Charles Bonnet Syndrome (CBS) occurs in patients suffering from visual impairment or blindness seeing visual sensations which are not real and which the patients know are not real. The prevalence of CBS in visually impaired patients is 11-15%.14 CBS is more prevalent among women, people with lower visual acuity and at lower light levels.14 Most people with CBS are not bothered by it, but a quarter of the patients experiences distress. Furthermore, the majority of patients does not talk about it.15
It is recommended that the existence of CBS be discussed with every visually impaired patient. This will suffice for most patients. Patients experiencing continuing, severe distress from CBS should be referred to a specialised psychologist (from a rehabilitation centre for the visually impaired) or a psychiatrist. In addition, the influence of light conditions in the (home) environment should be mentioned to these patients.
Visually impaired adults
In the Netherlands, there are two main forms of visual rehabilitation for adults. These comprise of a specialised optometrist and regional rehabilitation centres. The optometrist advises about which low vision aid(s) (magnifiers) could be suitable and adjusts these to the individual (mono-disciplinary services). In addition to this, regional rehabilitation centres, when indicated, offer training in the use of devices, the use of residual vision and in activities of daily life by occupational therapists and low vision therapists, counselling by social workers or psychologists and other services (multidisciplinary services). Most of the results reported in literature concern the provision of low vision aids and their use.
Dutch studies showed that 80 percent of the low vision aids provided by monodisciplinary as well as multidisciplinary services were still being used after a follow-up period of 3-22 months.4;16 This is in agreement with results reported in studies from other countries in the Western world.17-20 More than 90 percent of visually impaired persons state that they are satisfied with their low vision aid(s).21;22 In addition, there have been a few studies examining the outcome of the provision of low vision aids on quality of life which are usually assessed with one of the many questionnaires which have been developed.23 Monodisciplinary as well as multidisciplinary low vision services resulted in improved quality of life, although the follow-up in these studies was short (1-6 months).19;21;24 Until now, there have been no studies comparing the effectiveness of monodisciplinary services with that of multidisciplinary services. Training in the use of complex aids was shown to be effective.25 In addition, it has been shown, that for persons
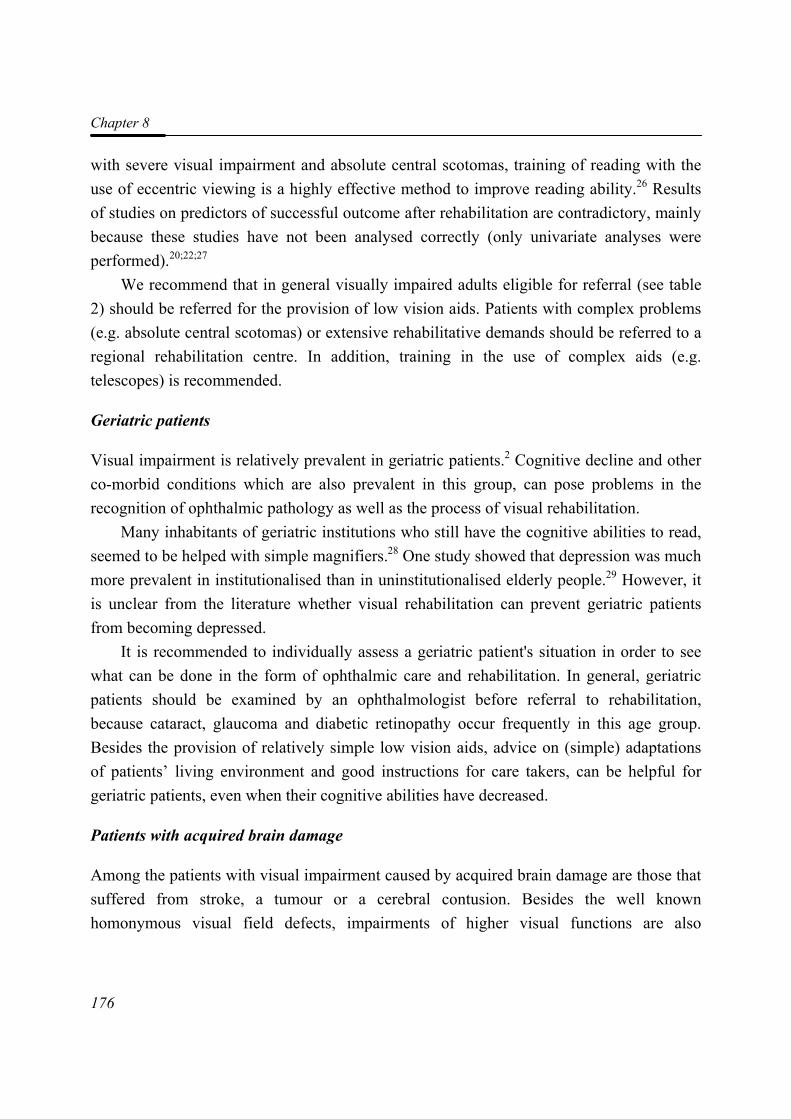
Chapter 8
176
with severe visual impairment and absolute central scotomas, training of reading with the use of eccentric viewing is a highly effective method to improve reading ability.26 Results of studies on predictors of successful outcome after rehabilitation are contradictory, mainly because these studies have not been analysed correctly (only univariate analyses were performed).20;22;27
We recommend that in general visually impaired adults eligible for referral (see table 2) should be referred for the provision of low vision aids. Patients with complex problems (e.g. absolute central scotomas) or extensive rehabilitative demands should be referred to a regional rehabilitation centre. In addition, training in the use of complex aids (e.g. telescopes) is recommended.
Geriatric patients
Visual impairment is relatively prevalent in geriatric patients.2 Cognitive decline and other co-morbid conditions which are also prevalent in this group, can pose problems in the recognition of ophthalmic pathology as well as the process of visual rehabilitation.
Many inhabitants of geriatric institutions who still have the cognitive abilities to read, seemed to be helped with simple magnifiers.28 One study showed that depression was much more prevalent in institutionalised than in uninstitutionalised elderly people.29 However, it is unclear from the literature whether visual rehabilitation can prevent geriatric patients from becoming depressed.
It is recommended to individually assess a geriatric patient's situation in order to see what can be done in the form of ophthalmic care and rehabilitation. In general, geriatric patients should be examined by an ophthalmologist before referral to rehabilitation, because cataract, glaucoma and diabetic retinopathy occur frequently in this age group. Besides the provision of relatively simple low vision aids, advice on (simple) adaptations of patients’ living environment and good instructions for care takers, can be helpful for geriatric patients, even when their cognitive abilities have decreased.
Patients with acquired brain damage
Among the patients with visual impairment caused by acquired brain damage are those that suffered from stroke, a tumour or a cerebral contusion. Besides the well known homonymous visual field defects, impairments of higher visual functions are also
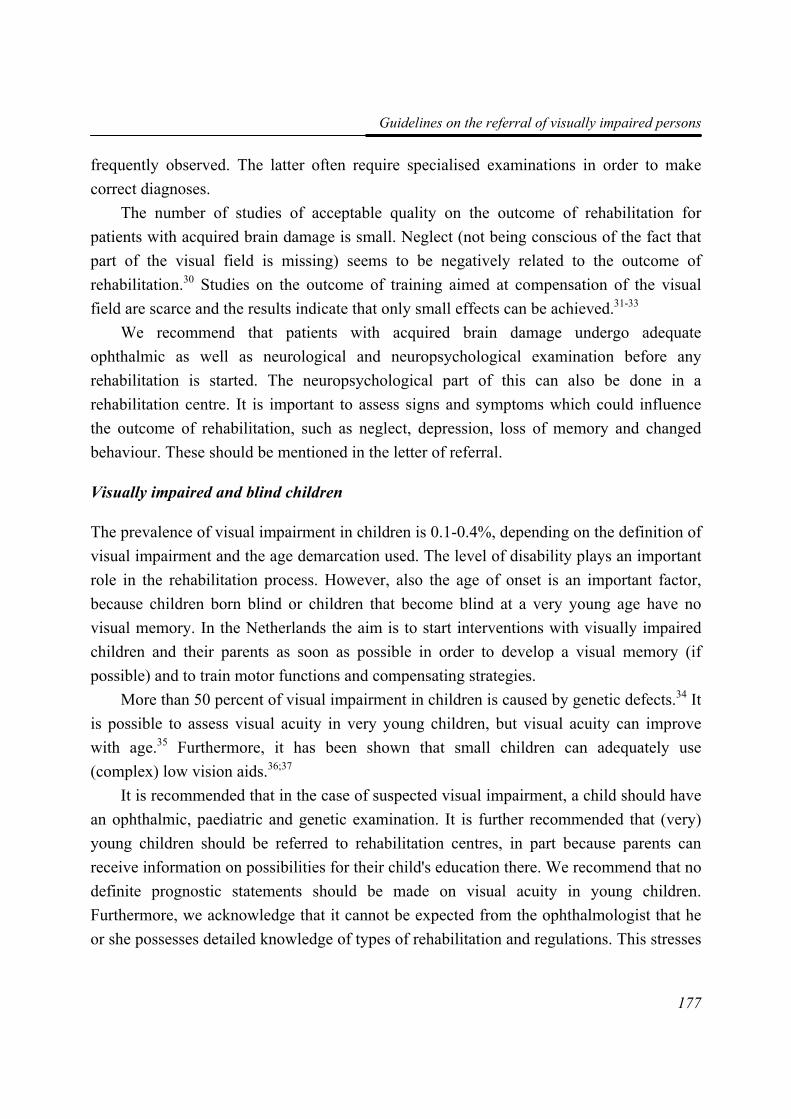
Guidelines on the referral of visually impaired persons
177
frequently observed. The latter often require specialised examinations in order to make correct diagnoses.
The number of studies of acceptable quality on the outcome of rehabilitation for patients with acquired brain damage is small. Neglect (not being conscious of the fact that part of the visual field is missing) seems to be negatively related to the outcome of rehabilitation.30 Studies on the outcome of training aimed at compensation of the visual field are scarce and the results indicate that only small effects can be achieved.31-33
We recommend that patients with acquired brain damage undergo adequate ophthalmic as well as neurological and neuropsychological examination before any rehabilitation is started. The neuropsychological part of this can also be done in a rehabilitation centre. It is important to assess signs and symptoms which could influence the outcome of rehabilitation, such as neglect, depression, loss of memory and changed behaviour. These should be mentioned in the letter of referral.
Visually impaired and blind children
The prevalence of visual impairment in children is 0.1-0.4%, depending on the definition of visual impairment and the age demarcation used. The level of disability plays an important role in the rehabilitation process. However, also the age of onset is an important factor, because children born blind or children that become blind at a very young age have no visual memory. In the Netherlands the aim is to start interventions with visually impaired children and their parents as soon as possible in order to develop a visual memory (if possible) and to train motor functions and compensating strategies.
More than 50 percent of visual impairment in children is caused by genetic defects.34 It is possible to assess visual acuity in very young children, but visual acuity can improve with age.35 Furthermore, it has been shown that small children can adequately use (complex) low vision aids.36;37
It is recommended that in the case of suspected visual impairment, a child should have an ophthalmic, paediatric and genetic examination. It is further recommended that (very) young children should be referred to rehabilitation centres, in part because parents can receive information on possibilities for their child's education there. We recommend that no definite prognostic statements should be made on visual acuity in young children. Furthermore, we acknowledge that it cannot be expected from the ophthalmologist that he or she possesses detailed knowledge of types of rehabilitation and regulations. This stresses
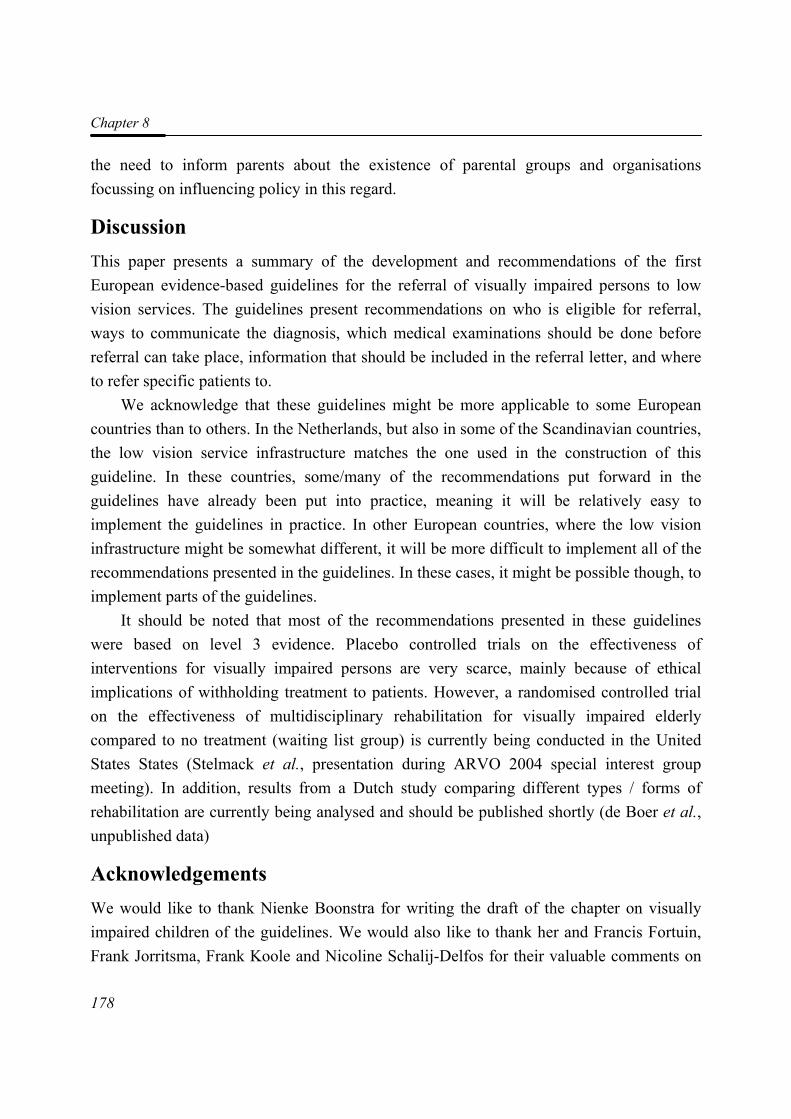
Chapter 8
178
the need to inform parents about the existence of parental groups and organisations focussing on influencing policy in this regard.
Discussion This paper presents a summary of the development and recommendations of the first European evidence-based guidelines for the referral of visually impaired persons to low vision services. The guidelines present recommendations on who is eligible for referral, ways to communicate the diagnosis, which medical examinations should be done before referral can take place, information that should be included in the referral letter, and where to refer specific patients to.
We acknowledge that these guidelines might be more applicable to some European countries than to others. In the Netherlands, but also in some of the Scandinavian countries, the low vision service infrastructure matches the one used in the construction of this guideline. In these countries, some/many of the recommendations put forward in the guidelines have already been put into practice, meaning it will be relatively easy to implement the guidelines in practice. In other European countries, where the low vision infrastructure might be somewhat different, it will be more difficult to implement all of the recommendations presented in the guidelines. In these cases, it might be possible though, to implement parts of the guidelines.
It should be noted that most of the recommendations presented in these guidelines were based on level 3 evidence. Placebo controlled trials on the effectiveness of interventions for visually impaired persons are very scarce, mainly because of ethical implications of withholding treatment to patients. However, a randomised controlled trial on the effectiveness of multidisciplinary rehabilitation for visually impaired elderly compared to no treatment (waiting list group) is currently being conducted in the United States States (Stelmack et al., presentation during ARVO 2004 special interest group meeting). In addition, results from a Dutch study comparing different types / forms of rehabilitation are currently being analysed and should be published shortly (de Boer et al., unpublished data)
Acknowledgements We would like to thank Nienke Boonstra for writing the draft of the chapter on visually impaired children of the guidelines. We would also like to thank her and Francis Fortuin, Frank Jorritsma, Frank Koole and Nicoline Schalij-Delfos for their valuable comments on
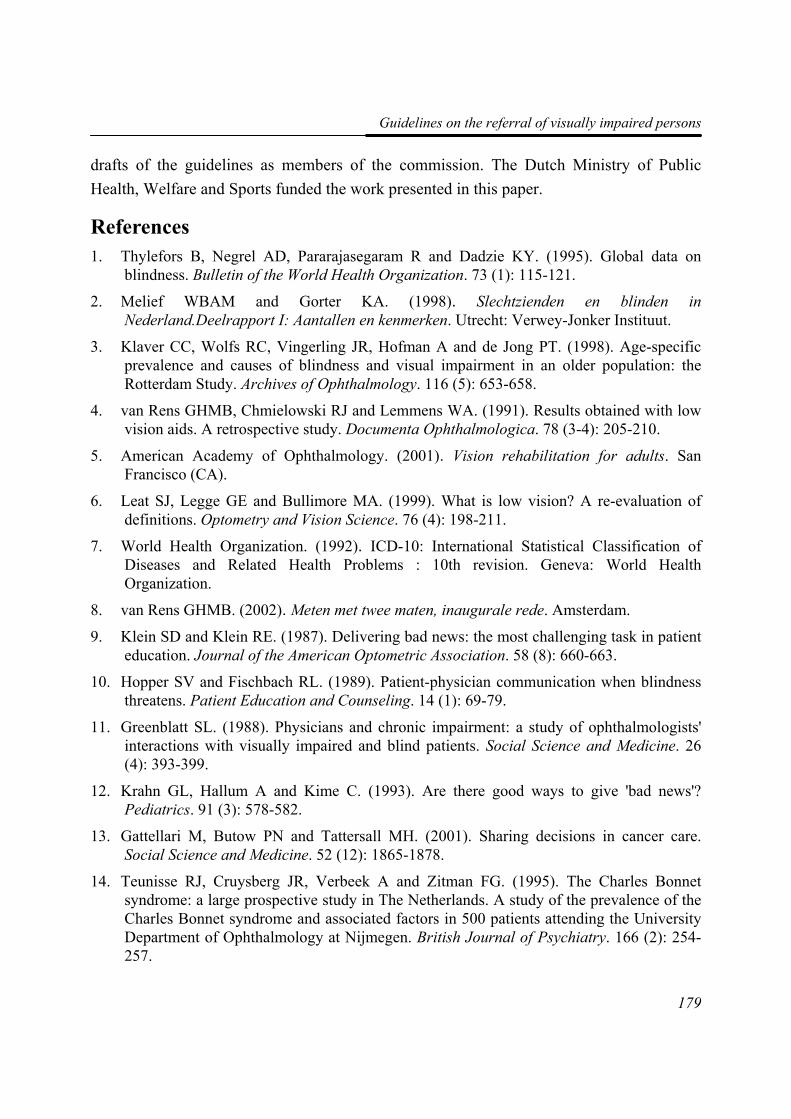
Guidelines on the referral of visually impaired persons
179
drafts of the guidelines as members of the commission. The Dutch Ministry of Public Health, Welfare and Sports funded the work presented in this paper.
References 1. Thylefors B, Negrel AD, Pararajasegaram R and Dadzie KY. (1995). Global data on
blindness. Bulletin of the World Health Organization. 73 (1): 115-121.
2. Melief WBAM and Gorter KA. (1998). Slechtzienden en blinden in Nederland.Deelrapport I: Aantallen en kenmerken. Utrecht: Verwey-Jonker Instituut.
3. Klaver CC, Wolfs RC, Vingerling JR, Hofman A and de Jong PT. (1998). Age-specific prevalence and causes of blindness and visual impairment in an older population: the Rotterdam Study. Archives of Ophthalmology. 116 (5): 653-658.
4. van Rens GHMB, Chmielowski RJ and Lemmens WA. (1991). Results obtained with low vision aids. A retrospective study. Documenta Ophthalmologica. 78 (3-4): 205-210.
5. American Academy of Ophthalmology. (2001). Vision rehabilitation for adults. San Francisco (CA).
6. Leat SJ, Legge GE and Bullimore MA. (1999). What is low vision? A re-evaluation of definitions. Optometry and Vision Science. 76 (4): 198-211.
7. World Health Organization. (1992). ICD-10: International Statistical Classification of Diseases and Related Health Problems : 10th revision. Geneva: World Health Organization.
8. van Rens GHMB. (2002). Meten met twee maten, inaugurale rede. Amsterdam.
9. Klein SD and Klein RE. (1987). Delivering bad news: the most challenging task in patient education. Journal of the American Optometric Association. 58 (8): 660-663.
10. Hopper SV and Fischbach RL. (1989). Patient-physician communication when blindness threatens. Patient Education and Counseling. 14 (1): 69-79.
11. Greenblatt SL. (1988). Physicians and chronic impairment: a study of ophthalmologists' interactions with visually impaired and blind patients. Social Science and Medicine. 26 (4): 393-399.
12. Krahn GL, Hallum A and Kime C. (1993). Are there good ways to give 'bad news'? Pediatrics. 91 (3): 578-582.
13. Gattellari M, Butow PN and Tattersall MH. (2001). Sharing decisions in cancer care. Social Science and Medicine. 52 (12): 1865-1878.
14. Teunisse RJ, Cruysberg JR, Verbeek A and Zitman FG. (1995). The Charles Bonnet syndrome: a large prospective study in The Netherlands. A study of the prevalence of the Charles Bonnet syndrome and associated factors in 500 patients attending the University Department of Ophthalmology at Nijmegen. British Journal of Psychiatry. 166 (2): 254-257.
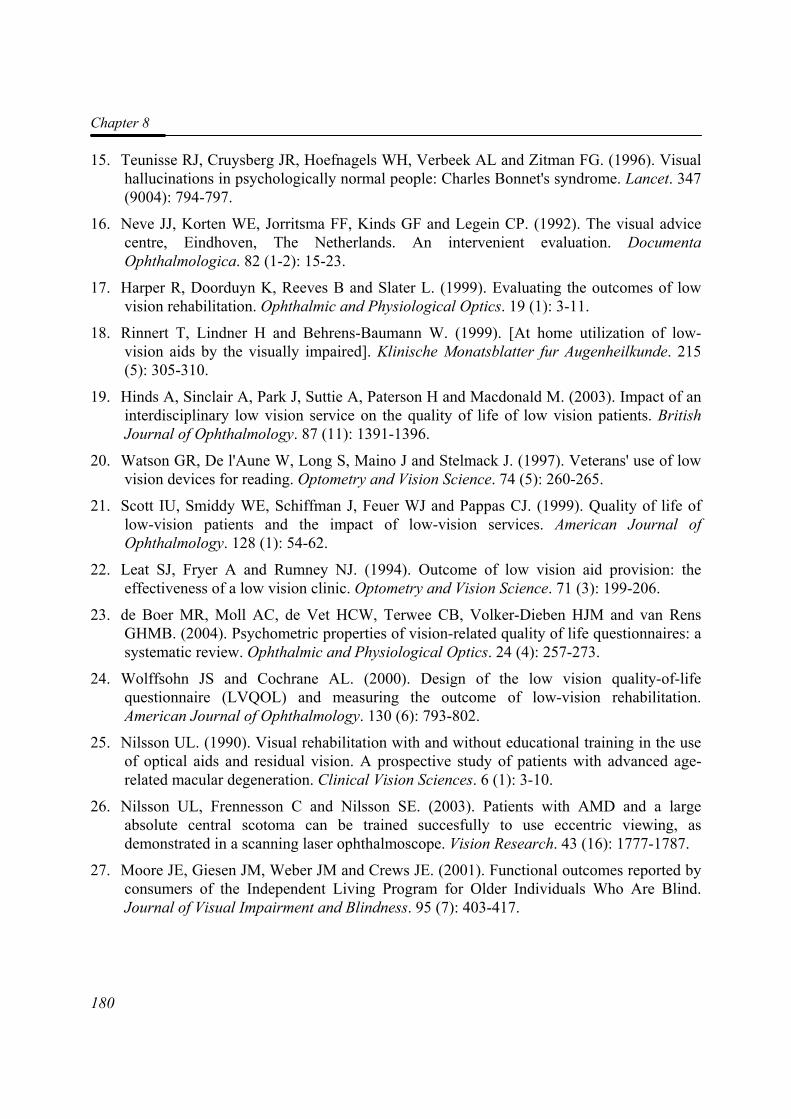
Chapter 8
180
15. Teunisse RJ, Cruysberg JR, Hoefnagels WH, Verbeek AL and Zitman FG. (1996). Visual hallucinations in psychologically normal people: Charles Bonnet's syndrome. Lancet. 347 (9004): 794-797.
16. Neve JJ, Korten WE, Jorritsma FF, Kinds GF and Legein CP. (1992). The visual advice centre, Eindhoven, The Netherlands. An intervenient evaluation. Documenta Ophthalmologica. 82 (1-2): 15-23.
17. Harper R, Doorduyn K, Reeves B and Slater L. (1999). Evaluating the outcomes of low vision rehabilitation. Ophthalmic and Physiological Optics. 19 (1): 3-11.
18. Rinnert T, Lindner H and Behrens-Baumann W. (1999). [At home utilization of low-vision aids by the visually impaired]. Klinische Monatsblatter fur Augenheilkunde. 215 (5): 305-310.
19. Hinds A, Sinclair A, Park J, Suttie A, Paterson H and Macdonald M. (2003). Impact of an interdisciplinary low vision service on the quality of life of low vision patients. British Journal of Ophthalmology. 87 (11): 1391-1396.
20. Watson GR, De l'Aune W, Long S, Maino J and Stelmack J. (1997). Veterans' use of low vision devices for reading. Optometry and Vision Science. 74 (5): 260-265.
21. Scott IU, Smiddy WE, Schiffman J, Feuer WJ and Pappas CJ. (1999). Quality of life of low-vision patients and the impact of low-vision services. American Journal of Ophthalmology. 128 (1): 54-62.
22. Leat SJ, Fryer A and Rumney NJ. (1994). Outcome of low vision aid provision: the effectiveness of a low vision clinic. Optometry and Vision Science. 71 (3): 199-206.
23. de Boer MR, Moll AC, de Vet HCW, Terwee CB, Volker-Dieben HJM and van Rens GHMB. (2004). Psychometric properties of vision-related quality of life questionnaires: a systematic review. Ophthalmic and Physiological Optics. 24 (4): 257-273.
24. Wolffsohn JS and Cochrane AL. (2000). Design of the low vision quality-of-life questionnaire (LVQOL) and measuring the outcome of low-vision rehabilitation. American Journal of Ophthalmology. 130 (6): 793-802.
25. Nilsson UL. (1990). Visual rehabilitation with and without educational training in the use of optical aids and residual vision. A prospective study of patients with advanced age-related macular degeneration. Clinical Vision Sciences. 6 (1): 3-10.
26. Nilsson UL, Frennesson C and Nilsson SE. (2003). Patients with AMD and a large absolute central scotoma can be trained succesfully to use eccentric viewing, as demonstrated in a scanning laser ophthalmoscope. Vision Research. 43 (16): 1777-1787.
27. Moore JE, Giesen JM, Weber JM and Crews JE. (2001). Functional outcomes reported by consumers of the Independent Living Program for Older Individuals Who Are Blind. Journal of Visual Impairment and Blindness. 95 (7): 403-417.
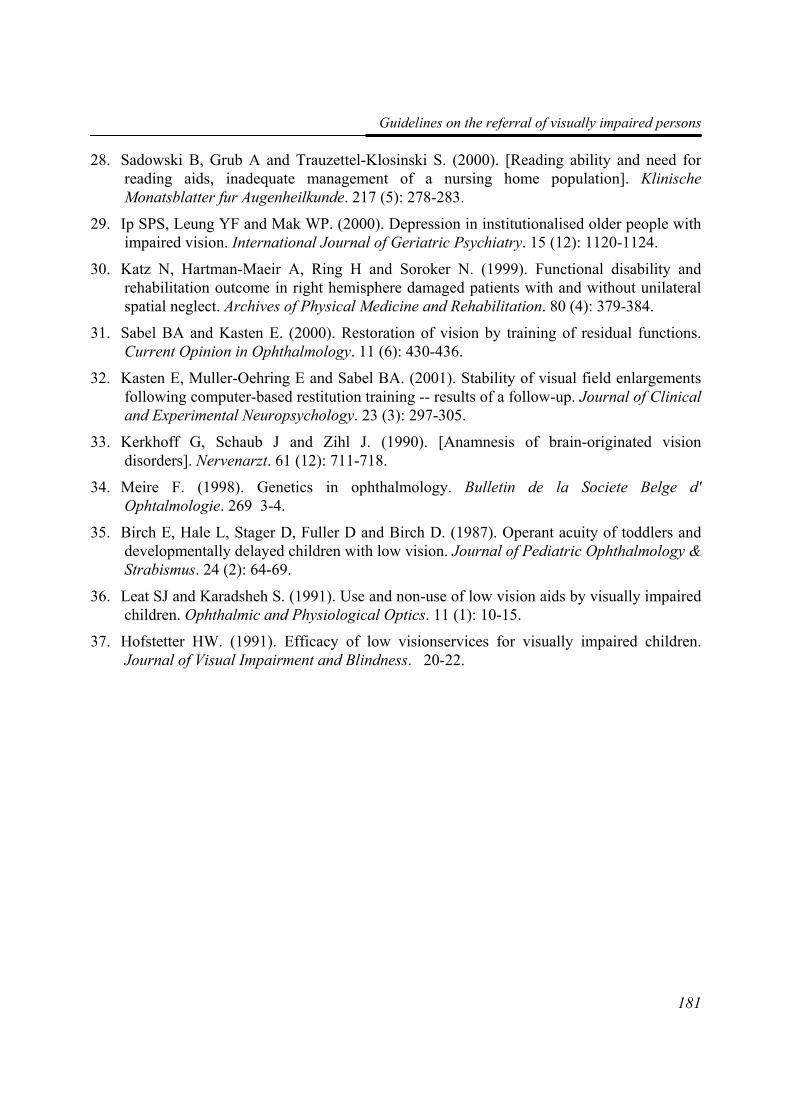
Guidelines on the referral of visually impaired persons
181
28. Sadowski B, Grub A and Trauzettel-Klosinski S. (2000). [Reading ability and need for reading aids, inadequate management of a nursing home population]. Klinische Monatsblatter fur Augenheilkunde. 217 (5): 278-283.
29. Ip SPS, Leung YF and Mak WP. (2000). Depression in institutionalised older people with impaired vision. International Journal of Geriatric Psychiatry. 15 (12): 1120-1124.
30. Katz N, Hartman-Maeir A, Ring H and Soroker N. (1999). Functional disability and rehabilitation outcome in right hemisphere damaged patients with and without unilateral spatial neglect. Archives of Physical Medicine and Rehabilitation. 80 (4): 379-384.
31. Sabel BA and Kasten E. (2000). Restoration of vision by training of residual functions. Current Opinion in Ophthalmology. 11 (6): 430-436.
32. Kasten E, Muller-Oehring E and Sabel BA. (2001). Stability of visual field enlargements following computer-based restitution training -- results of a follow-up. Journal of Clinical and Experimental Neuropsychology. 23 (3): 297-305.
33. Kerkhoff G, Schaub J and Zihl J. (1990). [Anamnesis of brain-originated vision disorders]. Nervenarzt. 61 (12): 711-718.
34. Meire F. (1998). Genetics in ophthalmology. Bulletin de la Societe Belge d' Ophtalmologie. 269 3-4.
35. Birch E, Hale L, Stager D, Fuller D and Birch D. (1987). Operant acuity of toddlers and developmentally delayed children with low vision. Journal of Pediatric Ophthalmology & Strabismus. 24 (2): 64-69.
36. Leat SJ and Karadsheh S. (1991). Use and non-use of low vision aids by visually impaired children. Ophthalmic and Physiological Optics. 11 (1): 10-15.
37. Hofstetter HW. (1991). Efficacy of low visionservices for visually impaired children. Journal of Visual Impairment and Blindness. 20-22.


99
GGeenneerraall DDiissccuussssiioonn
Chapter 9
184
Introduction The main aim of the work described this thesis was to assess the prognostic variables for the quality of life of visually impaired adults who had taken part in a comprehensive rehabilitation programme. The thesis can be divided into three parts. The first, Chapters 2 and 3, is a study of the reliability of the Functional Field Score (FFS) as part of the Functional Vision Score (FVS), which resulted in an adaptation to the calculation method of the FFS. In the second part, Chapters 5 and 6, the generic and vision-related quality of life of visually impaired adults is assessed. The generic quality of life of visually-impaired adults was compared with that of adults with other chronic conditions. This led to the re-evaluation of a vision-related quality of life questionnaire on psychometric properties, and the development of a new scoring algorithm (Chapter 6). The third part (Chapters 4, 7 and 8) deals with the outcome of a comprehensive rehabilitation programme, and the assessment of factors that were found to be predictive for a change in vision-related quality of life after rehabilitation. This included an overview of the existing literature on quality of life as a measure of the effectiveness of rehabilitation in visually-impaired adults. In addition, guidelines are given for the referral of visually impaired adults to various rehabilitation options in the Netherlands. In this final chapter, after summarising the conclusions, we discuss the methodology, the implications of our research for clinical practice, and make suggestions for future research.
Main conclusions
Functional Field Score (FFS)
As functional vision seems to be a promising predictive variable for vision-related quality of life, it is important to have a valid, reliable and feasible method for assessing it. After loss of visual acuity, loss of visual field is the next major cause of visual impairment, and thus one of its traditional measures. Grid scores are often used to assess the visual field, but despite this, the reliability of this method had never been investigated. We thus assessed the intrarater and interrater agreement of the Functional Field Score (FFS) as a part of the Functional Vision Score (FVS); both intrarater and interrater agreement and reliability of the FFS proved to be sufficient.
General Discussion
185
The size of the visual field greatly depends on the intensity and size of the stimulus. According to the guidelines for measuring the FVS, a size III stimulus and 4e intensity were preferable, but if necessary, a bigger stimulus could be used; the American Medical Association (AMA) did not make any adaptations for the visual field score obtained with a bigger stimulus. However, we hypothesized that using a bigger isopter than III−4e would overestimate the visual field of the patient. Our results and equation 3 (Chapter 3) confirm this, showing that FVS score is remarkably higher when the Functional Acuity Score (FAS) is taken as a constant variable. Furthermore, using a larger isopter results in an overestimation of the FFS by 19.25 points. We concluded that the relationship between the Functional Field Scores obtained with stimulus III−4e and stimulus V−4e was linear; by subtracting 19.25 points (95% CI: –26 to –12) from the FFS obtained using size V−4e, the FFS for the isopter III−4e can be estimated.
Generic and vision-related quality of life
In Chapter 5, the generic health-related quality of life (HRQoL) of visually impaired patients is compared with that of a healthy reference group using the EuroQoL EQ-5D instrument. It was shown to be substantially reduced in low vision patients, although men had a better quality of life than women, and compared with the QoL of younger participants, that of the elderly was less affected by pain or discomfort. Furthermore, highly educated, visually impaired adults reported more problems in their daily activities than those with a low or moderate educational level.
Until recently, it was generally considered that questionnaires should be as short as possible; they sometimes require excessive patient or interview time, and thus are inappropriate if the patient is unable to participate in a lengthy procedure. Shorter instruments would be a great advantage in many situations, both in clinical practice and research. Also, when administered as part of a test battery, shorter questionnaires would reduce the burden of response.
With this in mind, we looked at the National Eye Institute Visual Functioning Questionnaire 25, the VFQ-25, which is much used for evaluating vision-related quality of life and the outcome of rehabilitation or an intervention. The questionnaire comprises 13 domains, such as peripheral vision, colour vision and driving. However, despite its popularity, it does not meet the psychometric quality criteria formulated by De Boer et al.1 In Chapter 6, a new version of VFQ-25 is presented to address this problem. It is based on
Chapter 9
186
four factors: Near Activities, Distance Activities & Mobility, Mental Health & Dependency, and Pain & Discomfort. Items connected with car driving were deleted from the questionnaire, because a visually impaired adult who has been referred to a rehabilitation centre is not usually able to drive. Furthermore, rehabilitation is not expected to improve the driving ability of a person with severe visual impairment. The remaining twenty-two items were subjected to an exploratory factor analysis: the total variance explained by four factors was 46.4%. Next, these factors were evaluated with a Rasch analysis. We then recoded the original 5-point response scale by collapsing two or three categories to form a four-point or three-point scale, respectively. These four-point and three-point response scales had the possible advantage of presenting the participant with more distinct answering categories, making choosing an option easier. However, before recommending a definite change in response format of the VFQ-25, this finding has to be confirmed in other studies across various visual impairment conditions and various demographic conditions. Moreover, two items, Item 11 “seeing how people react to things” and Item 12 “picking out and matching your own clothes”, showed uniform DIF, indicating a possible misfit to the model.
Our newly derived VFQ-25 structure, with fewer items, fewer response categories, and fewer composite scores than the original version, fulfils the criteria for a shorter instrument. However, when we considered the person-item-threshold maps (Chapter 6, figure 2A-D), it became clear that there were some inadequacies in person-item distributions of the factors. Some items were overlapping which meant that they had comparable difficulty levels. On the other hand, the person-item maps showed some gaps between difficulty levels of the items, indicating that some patients were not represented by the items in our VFQ-25. This means that for the population of visually impaired working age adults, redundant items should be deleted, adding more pertinent questions with difficulties that fill the various gaps. The Rasch analysis suggests that it might be possible to eliminate items with relatively weak factor loadings or items that show differential item functioning. Although some items of the original VFQ-25 seem to be redundant, adding questions would probably lengthen the questionnaire. Furthermore, it contains an additional set of 14 items. However, their content does not seem to be essentially different from the original ones and cannot be expected to improve the psychometric quality of the VFQ-25. Concerning our VFQ-25 version, we may be able to fill in the gaps in difficulty levels between items by using items from other vision-related quality of life questionnaires.
General Discussion
187
Recently, a checklist was published containing criteria for the evaluation of quality of life instruments.2 According to these criteria, future research should be directed at construct validity, reproducibility, responsiveness, and interpretability. Furthermore, item stability across occasions needs to be examined; item calibrations should remain stable across time within a given population, whether or not the health of that population changes.3-5
Vision Rehabilitation
The quality of life of visually impaired adults is lower than that of healthy people and sometimes, even of those with other chronic conditions, such as poor hearing (Chapter 5). As this results in participation problems, it is of utmost importance to refer the patient to the rehabilitation services, where the focus is on this type of problem (Chapter 8). Unfortunately, the services and programmes offered are not fully utilised by the target group; neither doctors nor patients yet recognise their potential benefits. This will only happen when rehabilitation is effective, justifying the costs involved. To prove that participation is growing, and thus the HRQoL is being improved, good outcome studies are urgently needed.
Evidence on the effectiveness of rehabilitation programmes is scarce. The results of the systematic literature review showed that evidence on the effectiveness of rehabilitation programmes is scarce. This review was made to assess the outcome of rehabilitation programmes for improving the quality of life of visually impaired adults (Chapter 4) and to develop guidelines for the referral of visually impaired persons (Chapter 8). In Chapter 4, we concluded that only a few (quasi-) randomised clinical trials have been carried out with quality of life as an outcome of rehabilitation.6-16 Their results indicate that most programmes were effective, as the quality of life improved. However, in most trials, the follow-up was too short, and there were only a few trials with reasonable or good methodology. Furthermore, one study showed that the improvement was not stable; it did not persist on the long term.
Quality of life is also examined in other types of studies, such as cohort studies,17;18 but the evidence is less strong because of weaknesses in the methodology, i.e.. no randomisation and no control group. Recently, a study was published on the quality of life of visually impaired elderly one year after referral to Dutch low vision services;17 optometric services were compared to multidisciplinary ones. People referred to optometric services showed less deterioration in mobility than those referred to multidisciplinary
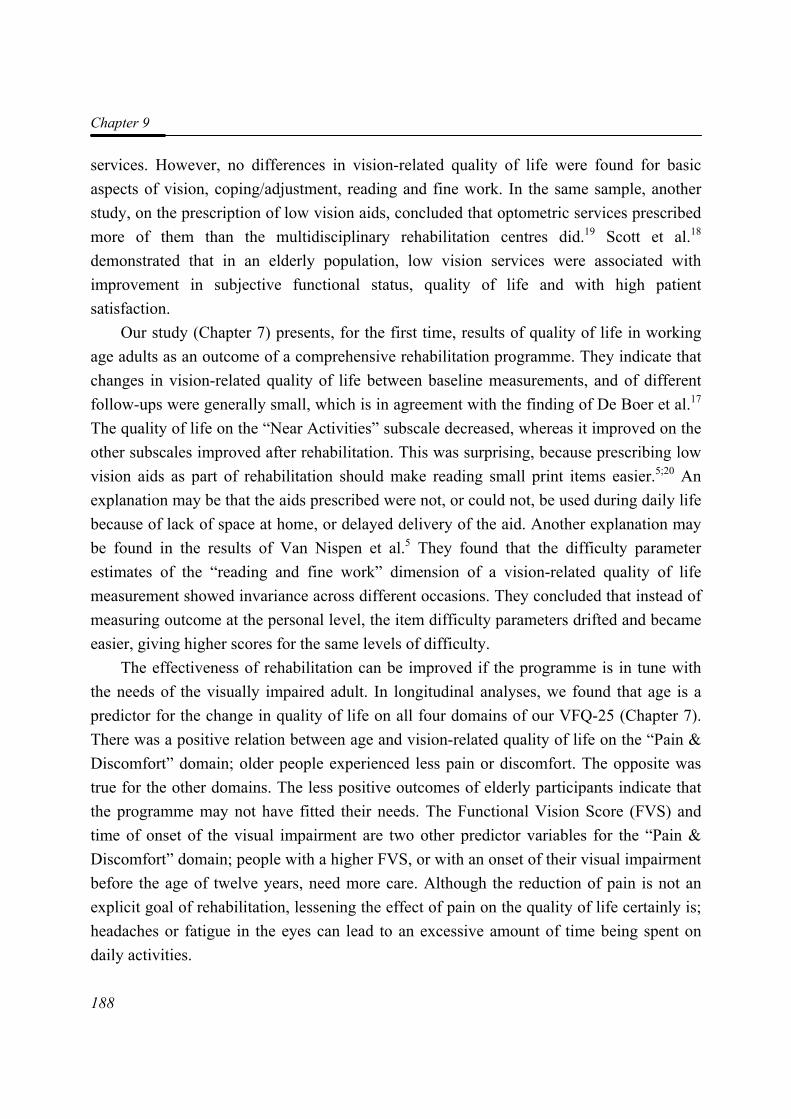
Chapter 9
188
services. However, no differences in vision-related quality of life were found for basic aspects of vision, coping/adjustment, reading and fine work. In the same sample, another study, on the prescription of low vision aids, concluded that optometric services prescribed more of them than the multidisciplinary rehabilitation centres did.19 Scott et al.18 demonstrated that in an elderly population, low vision services were associated with improvement in subjective functional status, quality of life and with high patient satisfaction.
Our study (Chapter 7) presents, for the first time, results of quality of life in working age adults as an outcome of a comprehensive rehabilitation programme. They indicate that changes in vision-related quality of life between baseline measurements, and of different follow-ups were generally small, which is in agreement with the finding of De Boer et al.17 The quality of life on the “Near Activities” subscale decreased, whereas it improved on the other subscales improved after rehabilitation. This was surprising, because prescribing low vision aids as part of rehabilitation should make reading small print items easier.5;20 An explanation may be that the aids prescribed were not, or could not, be used during daily life because of lack of space at home, or delayed delivery of the aid. Another explanation may be found in the results of Van Nispen et al.5 They found that the difficulty parameter estimates of the “reading and fine work” dimension of a vision-related quality of life measurement showed invariance across different occasions. They concluded that instead of measuring outcome at the personal level, the item difficulty parameters drifted and became easier, giving higher scores for the same levels of difficulty.
The effectiveness of rehabilitation can be improved if the programme is in tune with the needs of the visually impaired adult. In longitudinal analyses, we found that age is a predictor for the change in quality of life on all four domains of our VFQ-25 (Chapter 7). There was a positive relation between age and vision-related quality of life on the “Pain & Discomfort” domain; older people experienced less pain or discomfort. The opposite was true for the other domains. The less positive outcomes of elderly participants indicate that the programme may not have fitted their needs. The Functional Vision Score (FVS) and time of onset of the visual impairment are two other predictor variables for the “Pain & Discomfort” domain; people with a higher FVS, or with an onset of their visual impairment before the age of twelve years, need more care. Although the reduction of pain is not an explicit goal of rehabilitation, lessening the effect of pain on the quality of life certainly is; headaches or fatigue in the eyes can lead to an excessive amount of time being spent on daily activities.
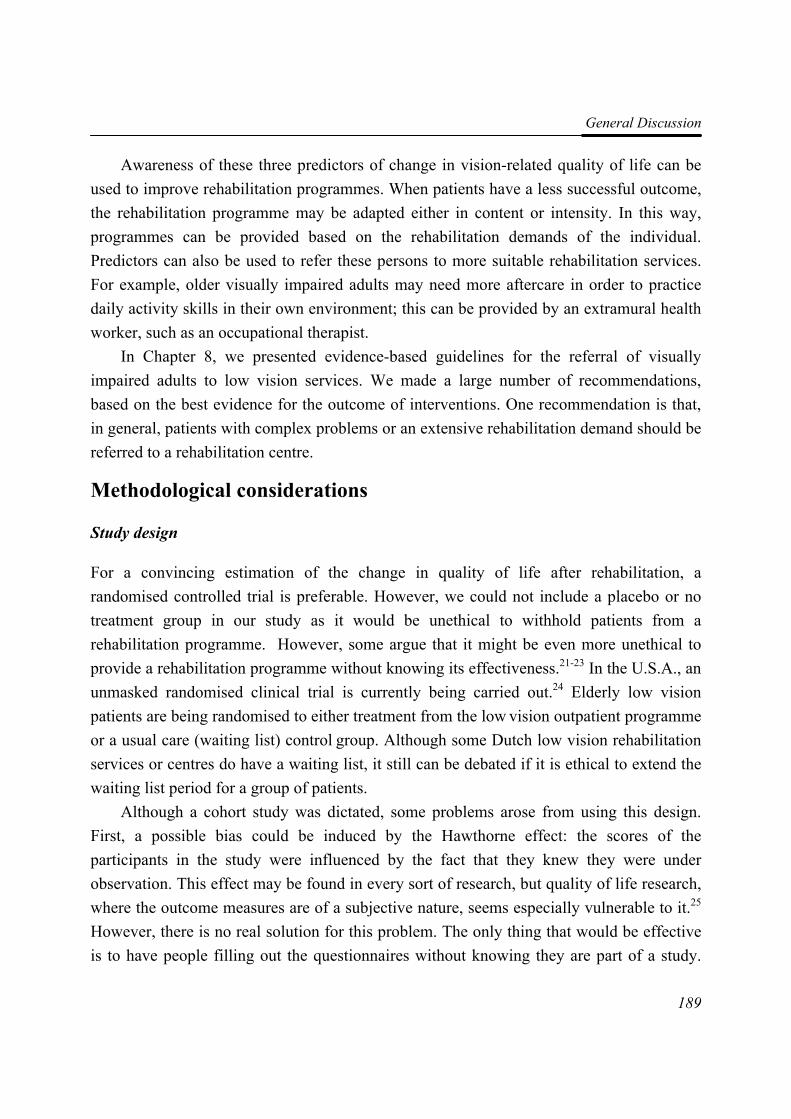
General Discussion
189
Awareness of these three predictors of change in vision-related quality of life can be used to improve rehabilitation programmes. When patients have a less successful outcome, the rehabilitation programme may be adapted either in content or intensity. In this way, programmes can be provided based on the rehabilitation demands of the individual. Predictors can also be used to refer these persons to more suitable rehabilitation services. For example, older visually impaired adults may need more aftercare in order to practice daily activity skills in their own environment; this can be provided by an extramural health worker, such as an occupational therapist.
In Chapter 8, we presented evidence-based guidelines for the referral of visually impaired adults to low vision services. We made a large number of recommendations, based on the best evidence for the outcome of interventions. One recommendation is that, in general, patients with complex problems or an extensive rehabilitation demand should be referred to a rehabilitation centre.
Methodological considerations
Study design
For a convincing estimation of the change in quality of life after rehabilitation, a randomised controlled trial is preferable. However, we could not include a placebo or no treatment group in our study as it would be unethical to withhold patients from a rehabilitation programme. However, some argue that it might be even more unethical to provide a rehabilitation programme without knowing its effectiveness.21-23 In the U.S.A., an unmasked randomised clinical trial is currently being carried out.24 Elderly low vision patients are being randomised to either treatment from the low vision outpatient programme or a usual care (waiting list) control group. Although some Dutch low vision rehabilitation services or centres do have a waiting list, it still can be debated if it is ethical to extend the waiting list period for a group of patients.
Although a cohort study was dictated, some problems arose from using this design. First, a possible bias could be induced by the Hawthorne effect: the scores of the participants in the study were influenced by the fact that they knew they were under observation. This effect may be found in every sort of research, but quality of life research, where the outcome measures are of a subjective nature, seems especially vulnerable to it.25 However, there is no real solution for this problem. The only thing that would be effective is to have people filling out the questionnaires without knowing they are part of a study.
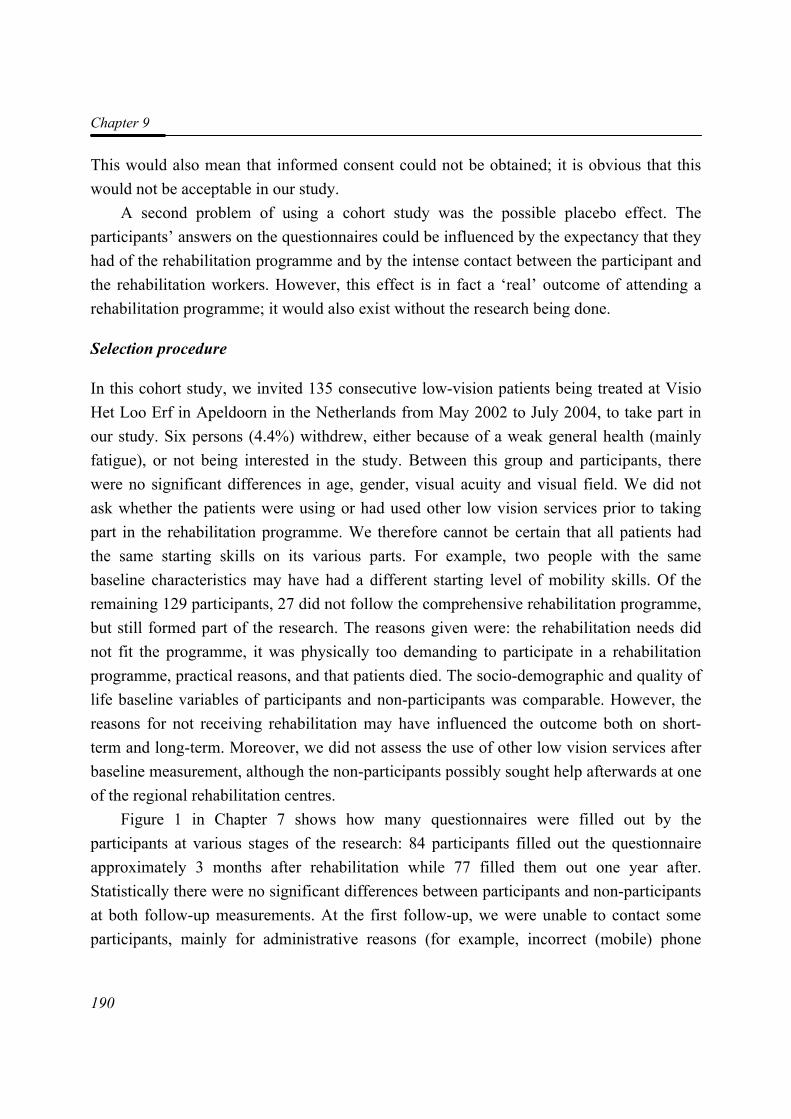
Chapter 9
190
This would also mean that informed consent could not be obtained; it is obvious that this would not be acceptable in our study.
A second problem of using a cohort study was the possible placebo effect. The participants’ answers on the questionnaires could be influenced by the expectancy that they had of the rehabilitation programme and by the intense contact between the participant and the rehabilitation workers. However, this effect is in fact a ‘real’ outcome of attending a rehabilitation programme; it would also exist without the research being done.
Selection procedure
In this cohort study, we invited 135 consecutive low-vision patients being treated at Visio Het Loo Erf in Apeldoorn in the Netherlands from May 2002 to July 2004, to take part in our study. Six persons (4.4%) withdrew, either because of a weak general health (mainly fatigue), or not being interested in the study. Between this group and participants, there were no significant differences in age, gender, visual acuity and visual field. We did not ask whether the patients were using or had used other low vision services prior to taking part in the rehabilitation programme. We therefore cannot be certain that all patients had the same starting skills on its various parts. For example, two people with the same baseline characteristics may have had a different starting level of mobility skills. Of the remaining 129 participants, 27 did not follow the comprehensive rehabilitation programme, but still formed part of the research. The reasons given were: the rehabilitation needs did not fit the programme, it was physically too demanding to participate in a rehabilitation programme, practical reasons, and that patients died. The socio-demographic and quality of life baseline variables of participants and non-participants was comparable. However, the reasons for not receiving rehabilitation may have influenced the outcome both on short-term and long-term. Moreover, we did not assess the use of other low vision services after baseline measurement, although the non-participants possibly sought help afterwards at one of the regional rehabilitation centres.
Figure 1 in Chapter 7 shows how many questionnaires were filled out by the participants at various stages of the research: 84 participants filled out the questionnaire approximately 3 months after rehabilitation while 77 filled them out one year after. Statistically there were no significant differences between participants and non-participants at both follow-up measurements. At the first follow-up, we were unable to contact some participants, mainly for administrative reasons (for example, incorrect (mobile) phone
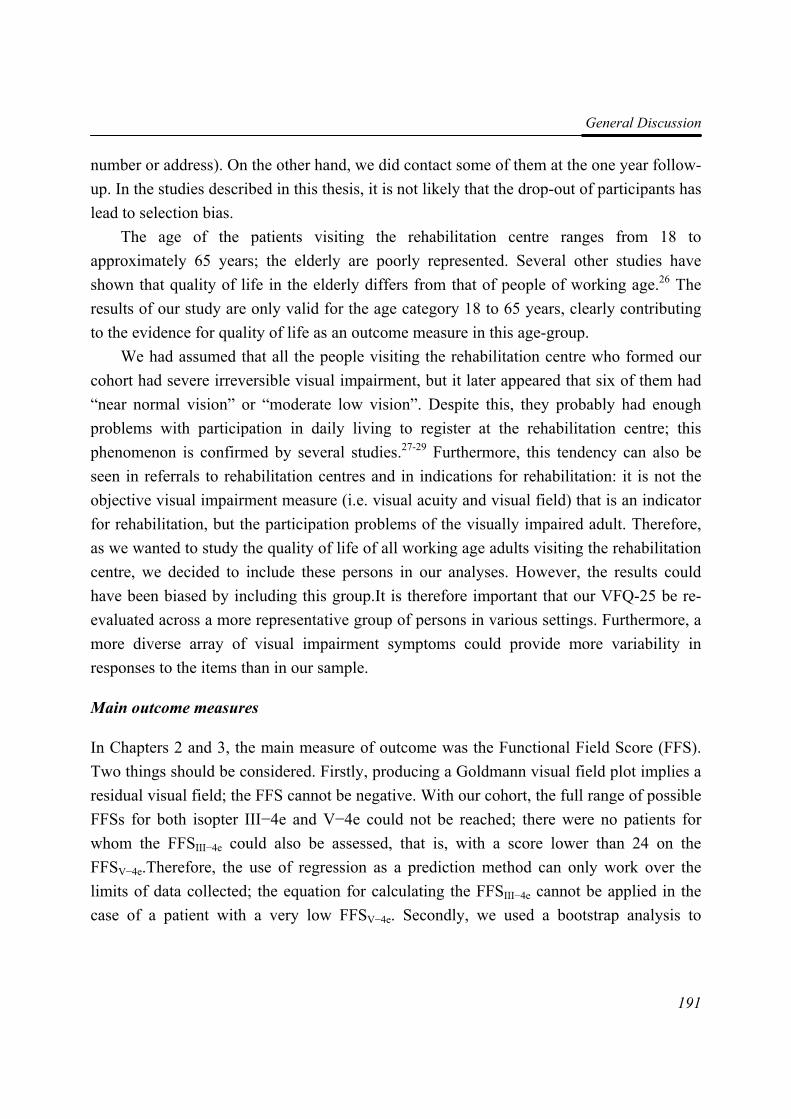
General Discussion
191
number or address). On the other hand, we did contact some of them at the one year follow-up. In the studies described in this thesis, it is not likely that the drop-out of participants has lead to selection bias.
The age of the patients visiting the rehabilitation centre ranges from 18 to approximately 65 years; the elderly are poorly represented. Several other studies have shown that quality of life in the elderly differs from that of people of working age.26 The results of our study are only valid for the age category 18 to 65 years, clearly contributing to the evidence for quality of life as an outcome measure in this age-group.
We had assumed that all the people visiting the rehabilitation centre who formed our cohort had severe irreversible visual impairment, but it later appeared that six of them had “near normal vision” or “moderate low vision”. Despite this, they probably had enough problems with participation in daily living to register at the rehabilitation centre; this phenomenon is confirmed by several studies.27-29 Furthermore, this tendency can also be seen in referrals to rehabilitation centres and in indications for rehabilitation: it is not the objective visual impairment measure (i.e. visual acuity and visual field) that is an indicator for rehabilitation, but the participation problems of the visually impaired adult. Therefore, as we wanted to study the quality of life of all working age adults visiting the rehabilitation centre, we decided to include these persons in our analyses. However, the results could have been biased by including this group.It is therefore important that our VFQ-25 be re-evaluated across a more representative group of persons in various settings. Furthermore, a more diverse array of visual impairment symptoms could provide more variability in responses to the items than in our sample.
Main outcome measures
In Chapters 2 and 3, the main measure of outcome was the Functional Field Score (FFS). Two things should be considered. Firstly, producing a Goldmann visual field plot implies a residual visual field; the FFS cannot be negative. With our cohort, the full range of possible FFSs for both isopter III−4e and V−4e could not be reached; there were no patients for whom the FFSIII−4e could also be assessed, that is, with a score lower than 24 on the FFSV−4e.Therefore, the use of regression as a prediction method can only work over the limits of data collected; the equation for calculating the FFSIII−4e cannot be applied in the case of a patient with a very low FFSV−4e. Secondly, we used a bootstrap analysis to
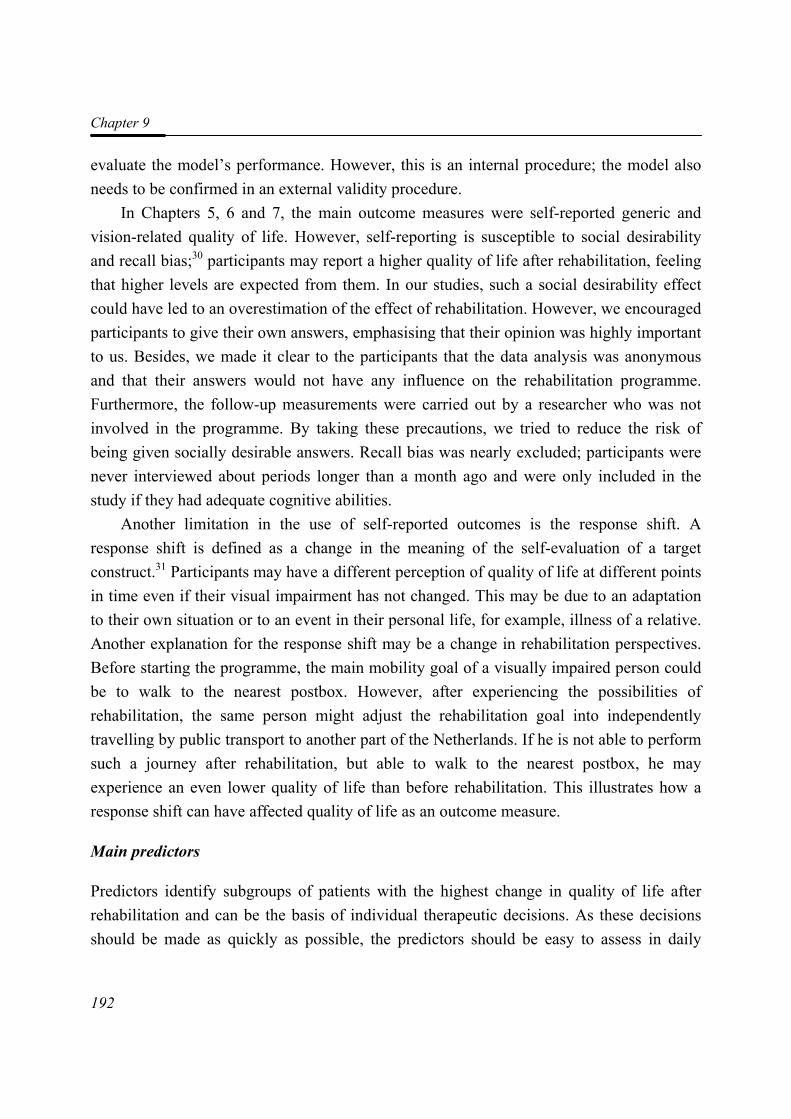
Chapter 9
192
evaluate the model’s performance. However, this is an internal procedure; the model also needs to be confirmed in an external validity procedure.
In Chapters 5, 6 and 7, the main outcome measures were self-reported generic and vision-related quality of life. However, self-reporting is susceptible to social desirability and recall bias;30 participants may report a higher quality of life after rehabilitation, feeling that higher levels are expected from them. In our studies, such a social desirability effect could have led to an overestimation of the effect of rehabilitation. However, we encouraged participants to give their own answers, emphasising that their opinion was highly important to us. Besides, we made it clear to the participants that the data analysis was anonymous and that their answers would not have any influence on the rehabilitation programme. Furthermore, the follow-up measurements were carried out by a researcher who was not involved in the programme. By taking these precautions, we tried to reduce the risk of being given socially desirable answers. Recall bias was nearly excluded; participants were never interviewed about periods longer than a month ago and were only included in the study if they had adequate cognitive abilities.
Another limitation in the use of self-reported outcomes is the response shift. A response shift is defined as a change in the meaning of the self-evaluation of a target construct.31 Participants may have a different perception of quality of life at different points in time even if their visual impairment has not changed. This may be due to an adaptation to their own situation or to an event in their personal life, for example, illness of a relative. Another explanation for the response shift may be a change in rehabilitation perspectives. Before starting the programme, the main mobility goal of a visually impaired person could be to walk to the nearest postbox. However, after experiencing the possibilities of rehabilitation, the same person might adjust the rehabilitation goal into independently travelling by public transport to another part of the Netherlands. If he is not able to perform such a journey after rehabilitation, but able to walk to the nearest postbox, he may experience an even lower quality of life than before rehabilitation. This illustrates how a response shift can have affected quality of life as an outcome measure.
Main predictors
Predictors identify subgroups of patients with the highest change in quality of life after rehabilitation and can be the basis of individual therapeutic decisions. As these decisions should be made as quickly as possible, the predictors should be easy to assess in daily
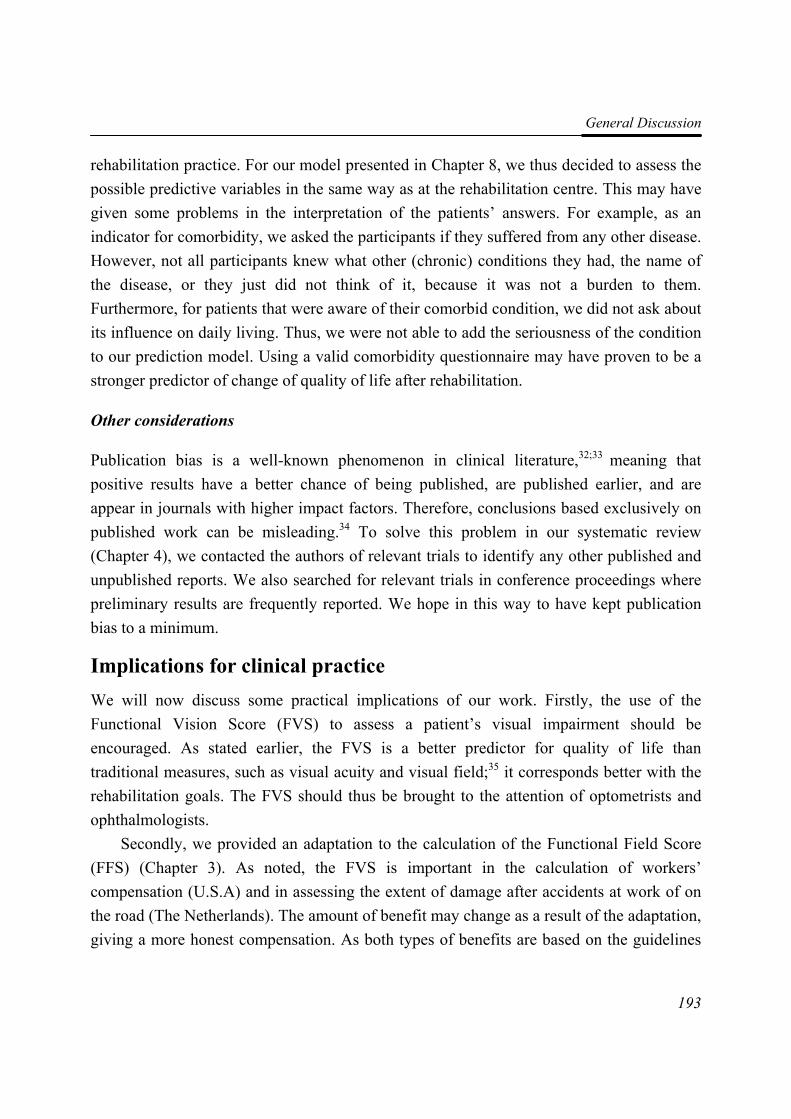
General Discussion
193
rehabilitation practice. For our model presented in Chapter 8, we thus decided to assess the possible predictive variables in the same way as at the rehabilitation centre. This may have given some problems in the interpretation of the patients’ answers. For example, as an indicator for comorbidity, we asked the participants if they suffered from any other disease. However, not all participants knew what other (chronic) conditions they had, the name of the disease, or they just did not think of it, because it was not a burden to them. Furthermore, for patients that were aware of their comorbid condition, we did not ask about its influence on daily living. Thus, we were not able to add the seriousness of the condition to our prediction model. Using a valid comorbidity questionnaire may have proven to be a stronger predictor of change of quality of life after rehabilitation.
Other considerations
Publication bias is a well-known phenomenon in clinical literature,32;33 meaning that
positive results have a better chance of being published, are published earlier, and are appear in journals with higher impact factors. Therefore, conclusions based exclusively on published work can be misleading.34 To solve this problem in our systematic review (Chapter 4), we contacted the authors of relevant trials to identify any other published and unpublished reports. We also searched for relevant trials in conference proceedings where preliminary results are frequently reported. We hope in this way to have kept publication bias to a minimum.
Implications for clinical practice We will now discuss some practical implications of our work. Firstly, the use of the Functional Vision Score (FVS) to assess a patient’s visual impairment should be encouraged. As stated earlier, the FVS is a better predictor for quality of life than traditional measures, such as visual acuity and visual field;35 it corresponds better with the rehabilitation goals. The FVS should thus be brought to the attention of optometrists and ophthalmologists.
Secondly, we provided an adaptation to the calculation of the Functional Field Score (FFS) (Chapter 3). As noted, the FVS is important in the calculation of workers’ compensation (U.S.A) and in assessing the extent of damage after accidents at work of on the road (The Netherlands). The amount of benefit may change as a result of the adaptation, giving a more honest compensation. As both types of benefits are based on the guidelines
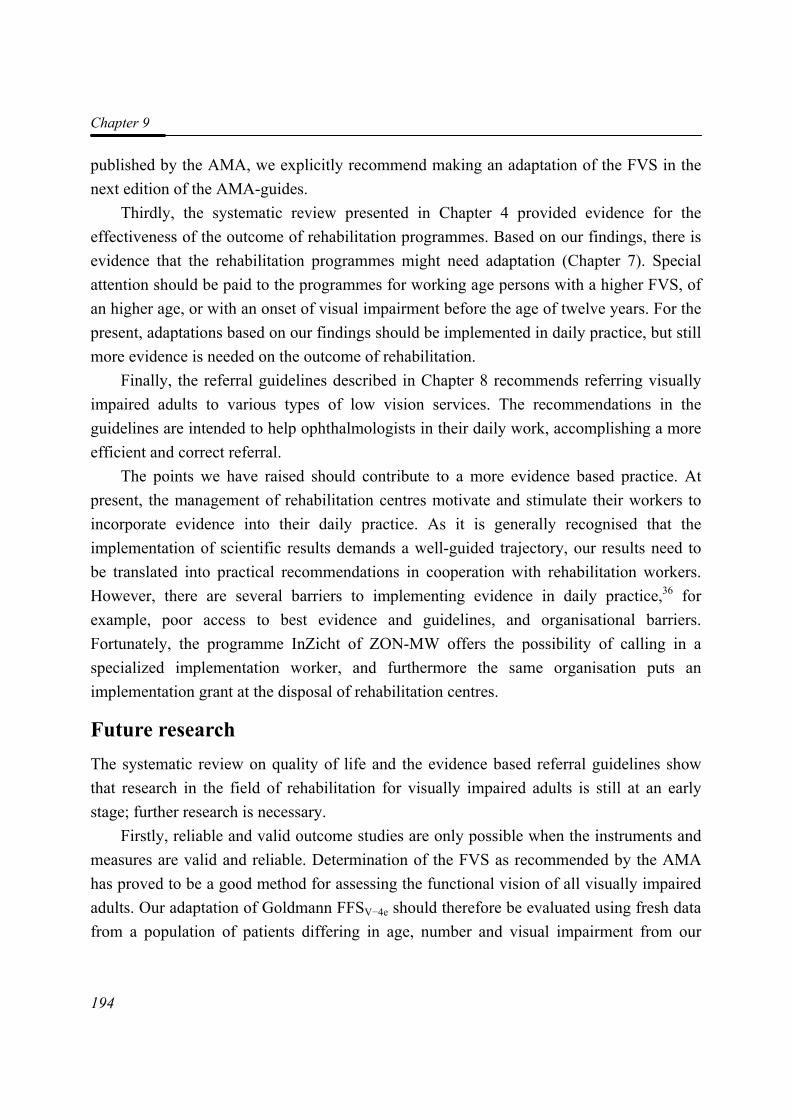
Chapter 9
194
published by the AMA, we explicitly recommend making an adaptation of the FVS in the next edition of the AMA-guides.
Thirdly, the systematic review presented in Chapter 4 provided evidence for the effectiveness of the outcome of rehabilitation programmes. Based on our findings, there is evidence that the rehabilitation programmes might need adaptation (Chapter 7). Special attention should be paid to the programmes for working age persons with a higher FVS, of an higher age, or with an onset of visual impairment before the age of twelve years. For the present, adaptations based on our findings should be implemented in daily practice, but still more evidence is needed on the outcome of rehabilitation.
Finally, the referral guidelines described in Chapter 8 recommends referring visually impaired adults to various types of low vision services. The recommendations in the guidelines are intended to help ophthalmologists in their daily work, accomplishing a more efficient and correct referral.
The points we have raised should contribute to a more evidence based practice. At present, the management of rehabilitation centres motivate and stimulate their workers to incorporate evidence into their daily practice. As it is generally recognised that the implementation of scientific results demands a well-guided trajectory, our results need to be translated into practical recommendations in cooperation with rehabilitation workers. However, there are several barriers to implementing evidence in daily practice,36 for example, poor access to best evidence and guidelines, and organisational barriers. Fortunately, the programme InZicht of ZON-MW offers the possibility of calling in a specialized implementation worker, and furthermore the same organisation puts an implementation grant at the disposal of rehabilitation centres.
Future research The systematic review on quality of life and the evidence based referral guidelines show that research in the field of rehabilitation for visually impaired adults is still at an early stage; further research is necessary.
Firstly, reliable and valid outcome studies are only possible when the instruments and measures are valid and reliable. Determination of the FVS as recommended by the AMA has proved to be a good method for assessing the functional vision of all visually impaired adults. Our adaptation of Goldmann FFSV−4e should therefore be evaluated using fresh data from a population of patients differing in age, number and visual impairment from our
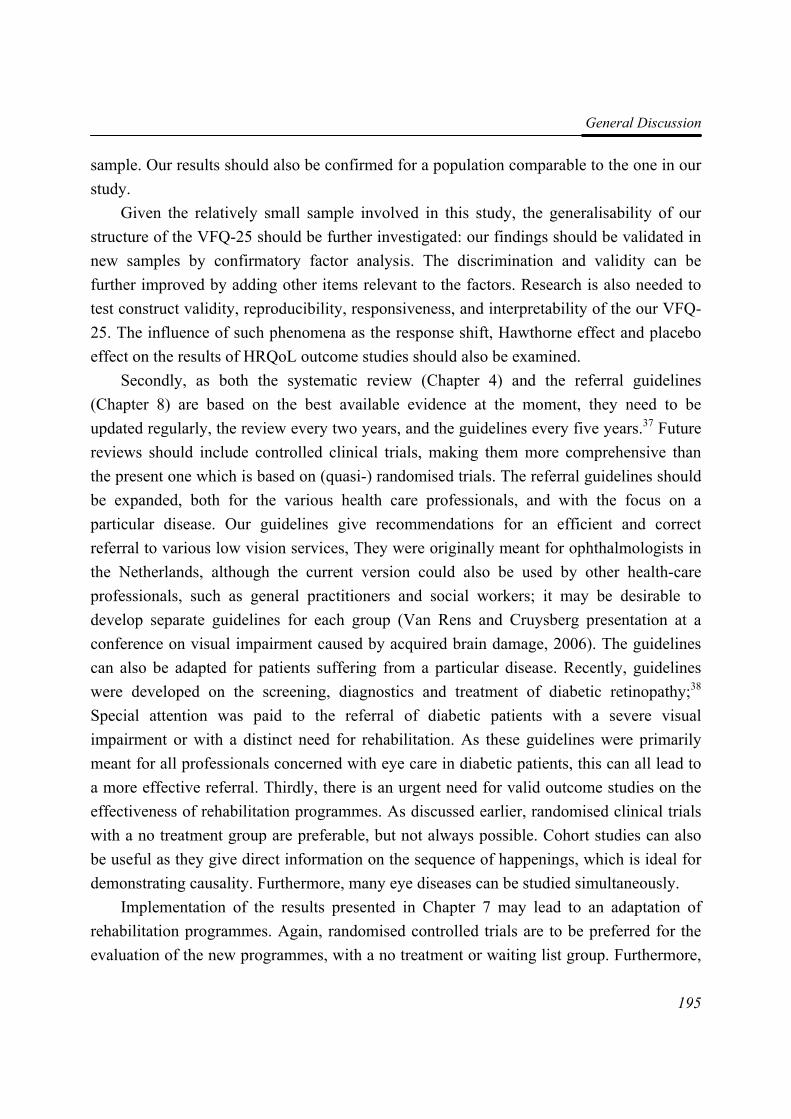
General Discussion
195
sample. Our results should also be confirmed for a population comparable to the one in our study.
Given the relatively small sample involved in this study, the generalisability of our structure of the VFQ-25 should be further investigated: our findings should be validated in new samples by confirmatory factor analysis. The discrimination and validity can be further improved by adding other items relevant to the factors. Research is also needed to test construct validity, reproducibility, responsiveness, and interpretability of the our VFQ-25. The influence of such phenomena as the response shift, Hawthorne effect and placebo effect on the results of HRQoL outcome studies should also be examined.
Secondly, as both the systematic review (Chapter 4) and the referral guidelines (Chapter 8) are based on the best available evidence at the moment, they need to be updated regularly, the review every two years, and the guidelines every five years.37 Future reviews should include controlled clinical trials, making them more comprehensive than the present one which is based on (quasi-) randomised trials. The referral guidelines should be expanded, both for the various health care professionals, and with the focus on a particular disease. Our guidelines give recommendations for an efficient and correct referral to various low vision services, They were originally meant for ophthalmologists in the Netherlands, although the current version could also be used by other health-care professionals, such as general practitioners and social workers; it may be desirable to develop separate guidelines for each group (Van Rens and Cruysberg presentation at a conference on visual impairment caused by acquired brain damage, 2006). The guidelines can also be adapted for patients suffering from a particular disease. Recently, guidelines were developed on the screening, diagnostics and treatment of diabetic retinopathy;38 Special attention was paid to the referral of diabetic patients with a severe visual impairment or with a distinct need for rehabilitation. As these guidelines were primarily meant for all professionals concerned with eye care in diabetic patients, this can all lead to a more effective referral. Thirdly, there is an urgent need for valid outcome studies on the effectiveness of rehabilitation programmes. As discussed earlier, randomised clinical trials with a no treatment group are preferable, but not always possible. Cohort studies can also be useful as they give direct information on the sequence of happenings, which is ideal for demonstrating causality. Furthermore, many eye diseases can be studied simultaneously.
Implementation of the results presented in Chapter 7 may lead to an adaptation of rehabilitation programmes. Again, randomised controlled trials are to be preferred for the evaluation of the new programmes, with a no treatment or waiting list group. Furthermore,
Chapter 9
196
the predictors that we found for a change in quality of life should also be assessed for an elderly, visually impaired population. At present, one such study is being performed in the Netherlands.39 However, most of the elderly attend an outpatient rehabilitation centre where they receive a less comprehensive rehabilitation programme. This makes comparing the results between the two age groups difficult.
We also suggested studying the change in the performance of daily activities after rehabilitation, because patients may change their activities as a result of attending the programme. In January 2007, such a study was started in an elderly population.40 Possibly, it can be extended to include a younger population with (severe) visual impairment. In future outcome studies, costs should be taken into account in order to enable the comparison of cost-effectiveness of various rehabilitation programmes. Such comparisons will become increasingly important with the rising costs and restricted budgets in health care.
Finally, more studies are necessary on the effectiveness of existing interventions. Fortunately, The InZicht programme of ZON-MW recognised this, and is at present financing them. Research is in preparation on the use of reading aids, and on mobility.41
Final Conclusions We have shown that changes in age, Functional Vision Score, and time of onset of the visual impairment are predictors for a change in quality of life after rehabilitation; vision-related quality of life generally differs little between baseline and various follow-up measurements. After rehabilitation, quality of life on the “Near Activities” subscale decreases, whereas it improves on the other subscales. The present thesis shows that there is little evidence on the outcome of rehabilitation programmes for improving the quality of life of visually impaired adults. It is clear that to judge their effectiveness in this respect valid outcome studies are urgently needed, especially for visually impaired adults of working age.
References 1. de Boer MR, Moll AC, de Vet HCW, Terwee CB, Volker-Dieben HJM and van Rens
GHMB. (2004). Psychometric properties of vision-related quality of life questionnaires: a systematic review. Ophthalmic and Physiological Optics. 24 (4): 257-273.
2. Terwee CB, Bot SD, de Boer MR, van der Windt DA, Knol DL, Dekker J, Bouter LM and de Vet HCW. (2007). Quality criteria were proposed for measurement properties of health status questionnaires. Journal of Clinical Epidemiology. 60 (1): 34-42.
General Discussion
197
3. Barley EA and Jones PW. (2006). Repeatability of a Rasch model of the AQ20 over five assessments. Quality of Life Research. 15 (5): 801-809.
4. Tennant A, McKenna SP and Hagell P. (2004). Application of Rasch analysis in the development and application of quality of life instruments. Value Health. 7 Suppl 1 S22-S26.
5. van Nispen RMA, Knol DL, Langelaan M, Terwee CB, de Boer MR and van Rens GHMB. Re-evaluating Vision Related Quality of Life in Dutch Visually Impaired Elderly using a Multilevel Analysis in Item Response Theory. accepted for publication
6. Brody BL, Williams RA, Thomas RG, Kaplan RM, Chu RM and Brown SI. (1999). Age-related macular degeneration: a randomized clinical trial of a self-management intervention. Annals of Behavioral Medicine. 21 (4): 322-329.
7. Brody BL, Roch-Levecq AC, Gamst AC, Maclean K, Kaplan RM and Brown SI. (2002). Self-management of age-related macular degeneration and quality of life: a randomized controlled trial. Archives of Ophthalmology. 120 (11): 1477-1483.
8. Brody BL, Roch-Levecq AC, Thomas RG, Kaplan RM and Brown SI. (2005). Self-management of age-related macular degeneration at the 6-month follow-up: a randomized controlled trial. Archives of Ophthalmology. 123 (1): 46-53.
9. Brunnstrom G, Sorensen S, Alsterstad K and Sjostrand J. (2004). Quality of light and quality of life--the effect of lighting adaptation among people with low vision. Ophthalmic and Physiological Optics. 24 (4): 274-280.
10. Eklund K, Sonn U and Dahlin-Ivanoff S. (2004). Long-term evaluation of a health education programme for elderly persons with visual impairment. A randomized study. Disability and Rehabilitation. 26 (7): 401-409.
11. Griffin-Shirley N. (1994). The effects of rehabilitation training of visually impaired older adults on self-efficacy, depression, activities of daily living, attitudes about blindness, and social support networks. Dissertation Abstracts International Section A: Humanities and Social Sciences. 54(8-A).
12. McCabe P, Nason F, Demers TP, Friedman D and Seddon JM. (2000). Evaluating the effectiveness of a vision rehabilitation intervention using an objective and subjective measure of functional performance. Ophthalmic Epidemiology. 7 (4): 259-270.
13. Pankow L, Luchins D, Studebaker J and Chettleburgh D. (2004). Evaluation of a vision rehabilitation program for older adults with visual impairment. Topics in Geriatric Rehabilitation. 20 (3): 223-232.
14. Reeves BC, Harper RA and Russell WB. (2004). Enhanced low vision rehabilitation for people with age related macular degeneration: a randomised controlled trial. British Journal of Ophthalmology. 88 (11): 1443-1449.
Chapter 9
198
15. Smith HJ, Dickinson CM, Cacho I, Reeves BC and Harper RA. (2005). A randomized controlled trial to determine the effectiveness of prism spectacles for patients with age-related macular degeneration. Archives of Ophthalmology. 123 (8): 1042-1050.
16. Dahlin-Ivanoff S, Sonn U and Svensson E. (2002). A health education program for elderly persons with visual impairments and perceived security in the performance of daily occupations: a randomized study. American Journal of Occupational Therapy. 56 (3): 322-330.
17. de Boer MR, Twisk J, Moll AC, Volker-Dieben HJ, de Vet HC and van Rens GHMB. (2006). Outcomes of low-vision services using optometric and multidisciplinary approaches: a non-randomized comparison. Ophthalmic and Physiological Optics. 26 (6): 535-544.
18. Scott IU, Smiddy WE, Schiffman J, Feuer WJ and Pappas CJ. (1999). Quality of life of low-vision patients and the impact of low-vision services. American Journal of Ophthalmology. 128 (1): 54-62.
19. Burggraaff MC, Nispen RMA, de Boer MR and Van Rens G.H.M.B. (2006). Optometric and multidisciplinary approaches in prescribing low vision aids-revised. Visual Impairment Research. 8 (1-2): 17-24.
20. Stelmack JA, Stelmack TR and Massof RW. (2002). Measuring low-vision rehabilitation outcomes with the NEI VFQ-25. Investigative Ophthalmology and Visual Science. 43 (9): 2859-2868.
21. Health Council. (2000). Van implementeren naar leren: het belang van tweerichtingsverkeer tussen praktijk en wetenschap in de gezondheidszorg. Vol. publication nr 2000/18. The Hague: Health Council.
22. Vos R, Willems D and Houtepen R. (2004). Coordinating the norms and values of medical research, medical practice and patient worlds-the ethics of evidence based medicine in orphaned fields of medicine. Journal of Medical Ethics. 30 (2): 166-170.
23. Slowther A, Ford S and Schofield T. (2004). Ethics of evidence based medicine in the primary care setting. Journal of Medical Ethics. 30 (2): 151-155.
24. Stelmack J, Mancil R, Mancil G, Cummings R, Moran D, Rinne S and Massof R. (2005). Veterans Affairs Low Vision Intervention Trial (LOVIT). Investigative Ophthalmology and Visual Science. 46 (5): 1920.
25. Bouchet C, Guillemin F and Briancon S. (1996). Nonspecific effects in longitudinal studies: impact on quality of life measures. Journal of Clinical Epidemiology. 49 (1): 15-20.
26. Aaronson NK, Muller M, Cohen PD, Essink-Bot ML, Fekkes M, Sanderman R, Sprangers MA, te VA and Verrips E. (1998). Translation, validation, and norming of the Dutch language version of the SF-36 Health Survey in community and chronic disease populations. Journal of Clinical Epidemiology. 51 (11): 1055-1068.
General Discussion
199
27. Varma R, Wu J, Chong K, Azen SP and Hays RD. (2006). Impact of severity and bilaterality of visual impairment on health-related quality of life. Ophthalmology. 113 (10): 1846-1853.
28. Chia EM, Mitchell P, Rochtchina E, Foran S and Wang JJ. (2003). Unilateral visual impairment and health related quality of life: the Blue Mountains Eye Study. British Journal of Ophthalmology. 87 (4): 392-395.
29. Ma SL, Shea JA, Galetta SL, Jacobs DA, Markowitz CE, Maguire MG and Balcer LJ. (2002). Self-reported visual dysfunction in multiple sclerosis: new data from the VFQ-25 and development of an MS-specific vision questionnaire. American Journal of Ophthalmology. 133 (5): 686-692.
30. Brewer NT, Hallman WK, Fiedler N and Kipen HM. (2004). Why do people report better health by phone than by mail? Medical Care. 42 (9): 875-883.
31. Sprangers MA and Schwartz CE. (1999). Integrating response shift into health-related quality of life research: a theoretical model. Social Science and Medicine. 48 (11): 1507-1515.
32. Chalmers I. (1990). Underreporting research is scientific misconduct. JAMA. 263 (10): 1405-1408.
33. Easterbrook PJ, Berlin JA, Gopalan R and Matthews DR. (1991). Publication bias in clinical research. Lancet. 337 (8746): 867-872.
34. Egger M and Smith GD. (1995). Misleading meta-analysis. British Medical Journal. 310 (6982): 752-754.
35. Fuhr PSW, Holmes LD, Fletcher DC, Swanson MN and Kuyk TK. (2003). The AMA Guides functional vision score is a better predictor of vision-targeted quality of life than traditional measures of visual acuity or visual field extent. Visual Impairment Research. 5 (3): 137-146.
36. Grol R and Wensing M. (2004). What drives change? Barriers to and incentives for achieving evidence-based practice. Medical Journal of Australia. 180 (6 Suppl): S57-S60.
37. van Everdingen JJE, Burgers JS and Assendelft WJJ. (2004). Evidence-Based Richtlijnontwikkeling. Een leidraad voor de praktijk. Houten, The Netherlands: Bohn Stafleu van Loghum.
38. Dutch Ophthalmic Society. (2006). Guideline Diabetic Retinopathy: screening, diagnostics and treatment. Alphen aan den Rijn: Van Zuiden Communications B.V.
39. van Nispen RMA and van Rens GHMB. (2004). Long term outcome of visual rehabilitation of elderly and prognostic factors for differences in quality of life. The Hague, The Netherlands: ZonMW.
40. Bruijning JE, van Nispen RMA and van Rens GHMB. (2007). Development of the Dutch Activity Inventory to measure rehabilitation needs of visually impaired elderly and rehabilitation outcome.
Chapter 9
200
41. van Benten IJ and Stuurgroep InZicht. (2005). Programmabeschrijving 2005-2008. Available at: Website ZonMW. http://www.zonmw.nl/InZicht

QQuueessttiioonnnnaaiirreess
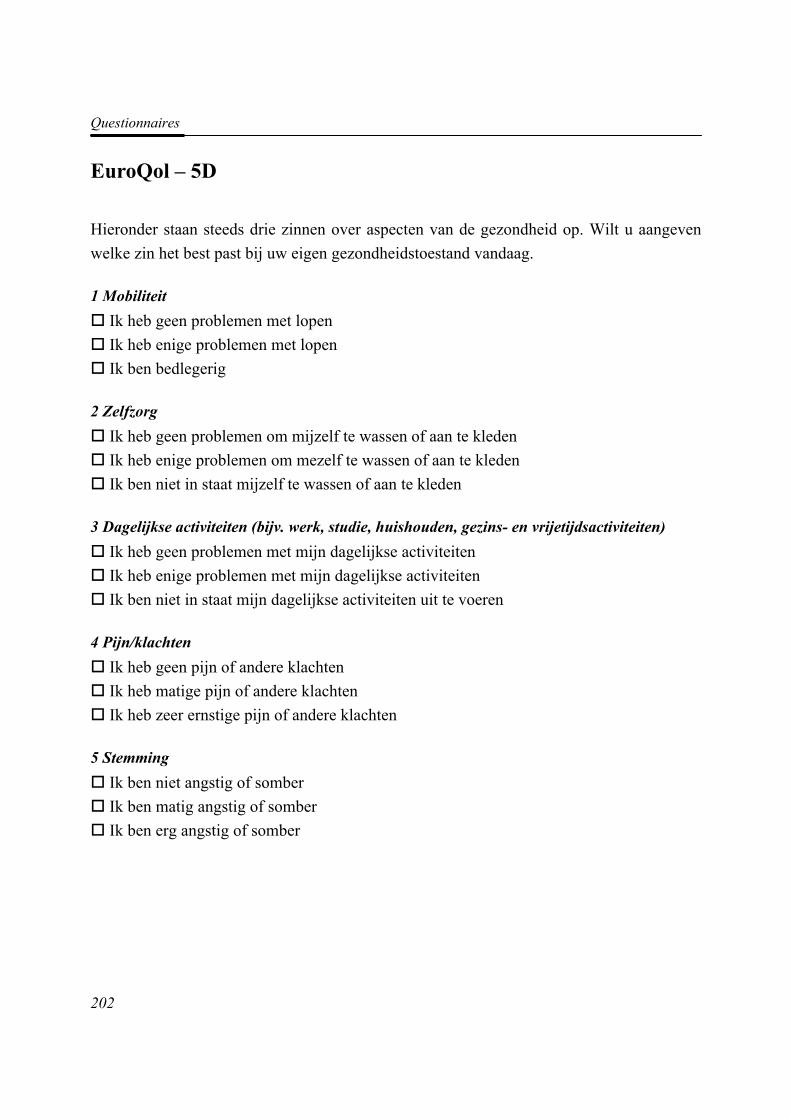
Questionnaires
202
EuroQol – 5D Hieronder staan steeds drie zinnen over aspecten van de gezondheid op. Wilt u aangeven welke zin het best past bij uw eigen gezondheidstoestand vandaag. 1 Mobiliteit
Ik heb geen problemen met lopen Ik heb enige problemen met lopen Ik ben bedlegerig
2 Zelfzorg
Ik heb geen problemen om mijzelf te wassen of aan te kleden Ik heb enige problemen om mezelf te wassen of aan te kleden Ik ben niet in staat mijzelf te wassen of aan te kleden
3 Dagelijkse activiteiten (bijv. werk, studie, huishouden, gezins- en vrijetijdsactiviteiten)
Ik heb geen problemen met mijn dagelijkse activiteiten Ik heb enige problemen met mijn dagelijkse activiteiten Ik ben niet in staat mijn dagelijkse activiteiten uit te voeren
4 Pijn/klachten
Ik heb geen pijn of andere klachten Ik heb matige pijn of andere klachten Ik heb zeer ernstige pijn of andere klachten
5 Stemming
Ik ben niet angstig of somber Ik ben matig angstig of somber Ik ben erg angstig of somber
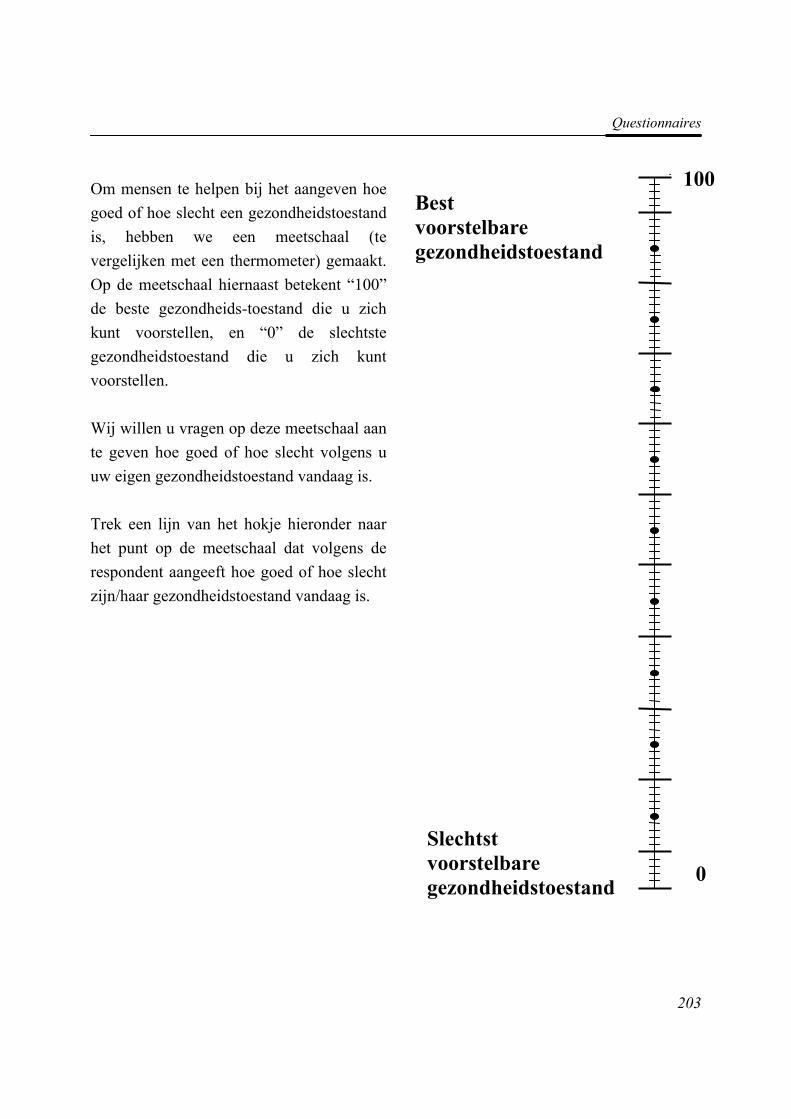
Questionnaires
203
Om mensen te helpen bij het aangeven hoe goed of hoe slecht een gezondheidstoestand is, hebben we een meetschaal (te vergelijken met een thermometer) gemaakt. Op de meetschaal hiernaast betekent “100” de beste gezondheids-toestand die u zich kunt voorstellen, en “0” de slechtste gezondheidstoestand die u zich kunt voorstellen. Wij willen u vragen op deze meetschaal aan te geven hoe goed of hoe slecht volgens u uw eigen gezondheidstoestand vandaag is. Trek een lijn van het hokje hieronder naar het punt op de meetschaal dat volgens de respondent aangeeft hoe goed of hoe slecht zijn/haar gezondheidstoestand vandaag is.
Slechtst voorstelbare gezondheidstoestand
Best voorstelbare gezondheidstoestand
0
1
0
100
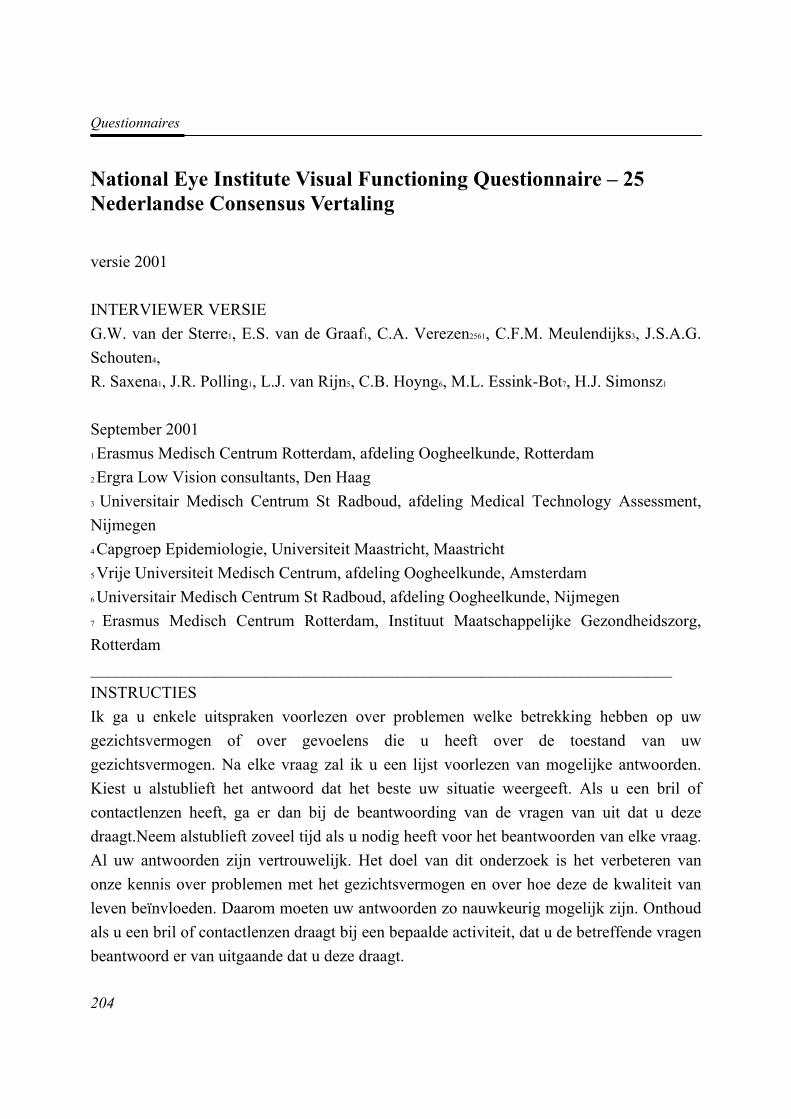
Questionnaires
204
National Eye Institute Visual Functioning Questionnaire – 25 Nederlandse Consensus Vertaling
versie 2001 INTERVIEWER VERSIE G.W. van der Sterre1, E.S. van de Graaf1, C.A. Verezen2561, C.F.M. Meulendijks3, J.S.A.G. Schouten4, R. Saxena1, J.R. Polling1, L.J. van Rijn5, C.B. Hoyng6, M.L. Essink-Bot7, H.J. Simonsz1
September 2001 1 Erasmus Medisch Centrum Rotterdam, afdeling Oogheelkunde, Rotterdam 2 Ergra Low Vision consultants, Den Haag 3 Universitair Medisch Centrum St Radboud, afdeling Medical Technology Assessment, Nijmegen 4 Capgroep Epidemiologie, Universiteit Maastricht, Maastricht 5 Vrije Universiteit Medisch Centrum, afdeling Oogheelkunde, Amsterdam 6 Universitair Medisch Centrum St Radboud, afdeling Oogheelkunde, Nijmegen 7 Erasmus Medisch Centrum Rotterdam, Instituut Maatschappelijke Gezondheidszorg, Rotterdam ______________________________________________________________________ INSTRUCTIES Ik ga u enkele uitspraken voorlezen over problemen welke betrekking hebben op uw gezichtsvermogen of over gevoelens die u heeft over de toestand van uw gezichtsvermogen. Na elke vraag zal ik u een lijst voorlezen van mogelijke antwoorden. Kiest u alstublieft het antwoord dat het beste uw situatie weergeeft. Als u een bril of contactlenzen heeft, ga er dan bij de beantwoording van de vragen van uit dat u deze draagt.Neem alstublieft zoveel tijd als u nodig heeft voor het beantwoorden van elke vraag. Al uw antwoorden zijn vertrouwelijk. Het doel van dit onderzoek is het verbeteren van onze kennis over problemen met het gezichtsvermogen en over hoe deze de kwaliteit van leven beïnvloeden. Daarom moeten uw antwoorden zo nauwkeurig mogelijk zijn. Onthoud als u een bril of contactlenzen draagt bij een bepaalde activiteit, dat u de betreffende vragen beantwoord er van uitgaande dat u deze draagt.
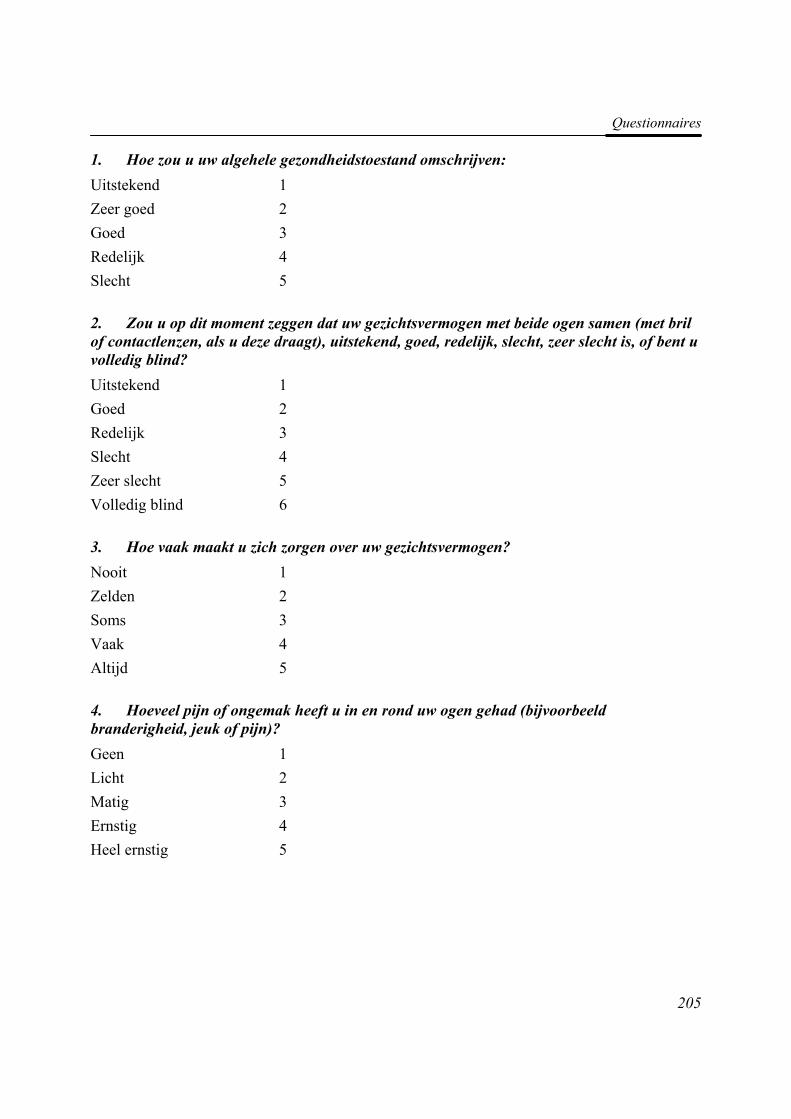
Questionnaires
205
1. Hoe zou u uw algehele gezondheidstoestand omschrijven: Uitstekend 1 Zeer goed 2 Goed 3 Redelijk 4 Slecht 5 2. Zou u op dit moment zeggen dat uw gezichtsvermogen met beide ogen samen (met bril of contactlenzen, als u deze draagt), uitstekend, goed, redelijk, slecht, zeer slecht is, of bent u volledig blind? Uitstekend 1 Goed 2 Redelijk 3 Slecht 4 Zeer slecht 5 Volledig blind 6 3. Hoe vaak maakt u zich zorgen over uw gezichtsvermogen? Nooit 1 Zelden 2 Soms 3 Vaak 4 Altijd 5 4. Hoeveel pijn of ongemak heeft u in en rond uw ogen gehad (bijvoorbeeld branderigheid, jeuk of pijn)? Geen 1 Licht 2 Matig 3 Ernstig 4 Heel ernstig 5
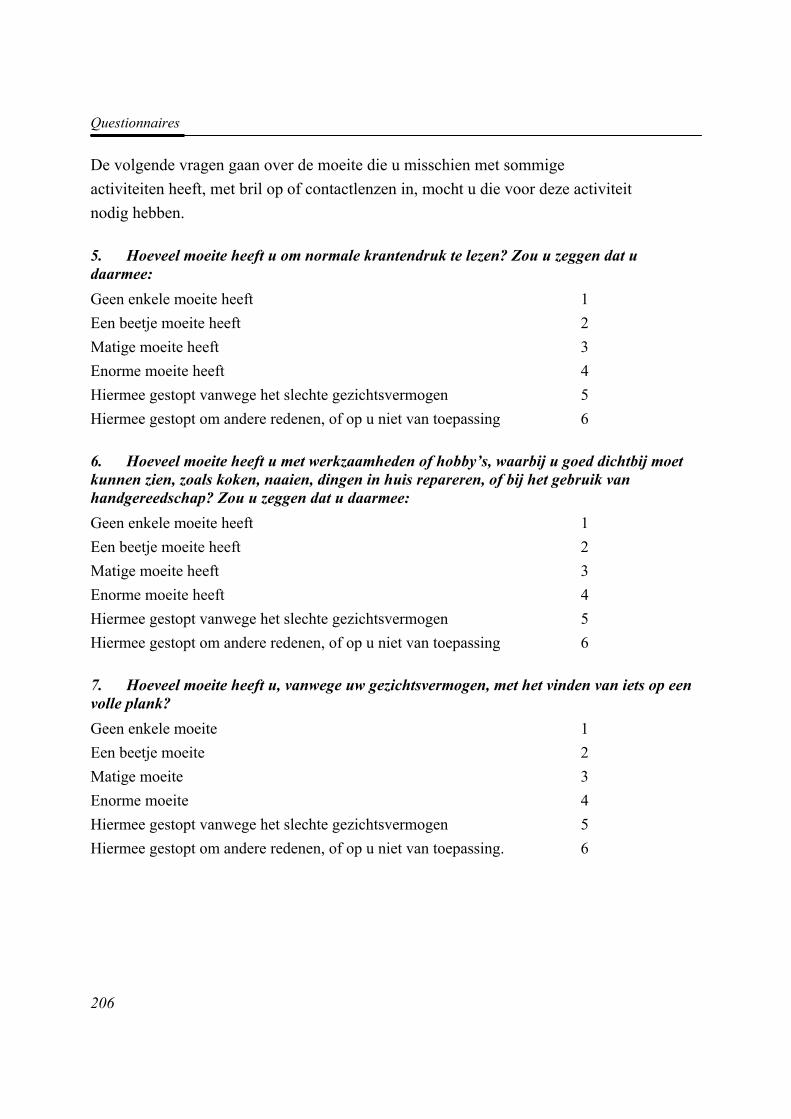
Questionnaires
206
De volgende vragen gaan over de moeite die u misschien met sommige activiteiten heeft, met bril op of contactlenzen in, mocht u die voor deze activiteit nodig hebben. 5. Hoeveel moeite heeft u om normale krantendruk te lezen? Zou u zeggen dat u daarmee: Geen enkele moeite heeft 1 Een beetje moeite heeft 2 Matige moeite heeft 3 Enorme moeite heeft 4 Hiermee gestopt vanwege het slechte gezichtsvermogen 5 Hiermee gestopt om andere redenen, of op u niet van toepassing 6 6. Hoeveel moeite heeft u met werkzaamheden of hobby’s, waarbij u goed dichtbij moet kunnen zien, zoals koken, naaien, dingen in huis repareren, of bij het gebruik van handgereedschap? Zou u zeggen dat u daarmee: Geen enkele moeite heeft 1 Een beetje moeite heeft 2 Matige moeite heeft 3 Enorme moeite heeft 4 Hiermee gestopt vanwege het slechte gezichtsvermogen 5 Hiermee gestopt om andere redenen, of op u niet van toepassing 6 7. Hoeveel moeite heeft u, vanwege uw gezichtsvermogen, met het vinden van iets op een volle plank? Geen enkele moeite 1 Een beetje moeite 2 Matige moeite 3 Enorme moeite 4 Hiermee gestopt vanwege het slechte gezichtsvermogen 5 Hiermee gestopt om andere redenen, of op u niet van toepassing. 6
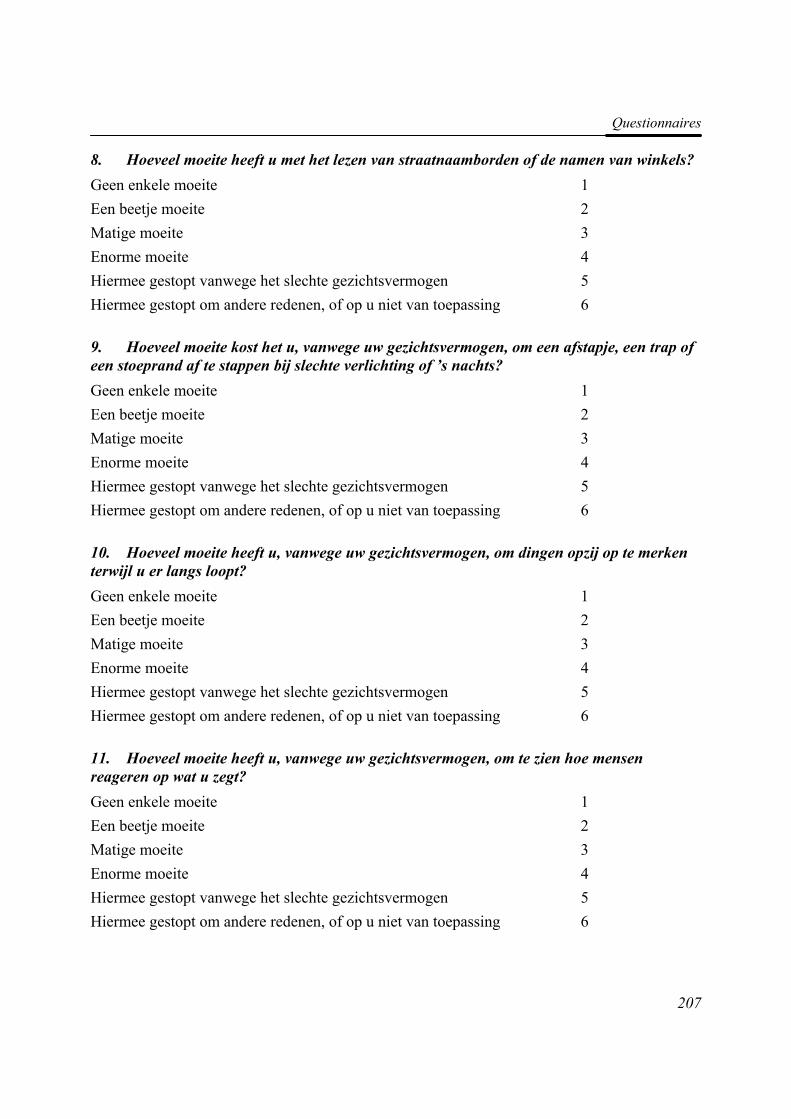
Questionnaires
207
8. Hoeveel moeite heeft u met het lezen van straatnaamborden of de namen van winkels? Geen enkele moeite 1 Een beetje moeite 2 Matige moeite 3 Enorme moeite 4 Hiermee gestopt vanwege het slechte gezichtsvermogen 5 Hiermee gestopt om andere redenen, of op u niet van toepassing 6 9. Hoeveel moeite kost het u, vanwege uw gezichtsvermogen, om een afstapje, een trap of een stoeprand af te stappen bij slechte verlichting of ’s nachts? Geen enkele moeite 1 Een beetje moeite 2 Matige moeite 3 Enorme moeite 4 Hiermee gestopt vanwege het slechte gezichtsvermogen 5 Hiermee gestopt om andere redenen, of op u niet van toepassing 6 10. Hoeveel moeite heeft u, vanwege uw gezichtsvermogen, om dingen opzij op te merken terwijl u er langs loopt? Geen enkele moeite 1 Een beetje moeite 2 Matige moeite 3 Enorme moeite 4 Hiermee gestopt vanwege het slechte gezichtsvermogen 5 Hiermee gestopt om andere redenen, of op u niet van toepassing 6 11. Hoeveel moeite heeft u, vanwege uw gezichtsvermogen, om te zien hoe mensen reageren op wat u zegt? Geen enkele moeite 1 Een beetje moeite 2 Matige moeite 3 Enorme moeite 4 Hiermee gestopt vanwege het slechte gezichtsvermogen 5 Hiermee gestopt om andere redenen, of op u niet van toepassing 6
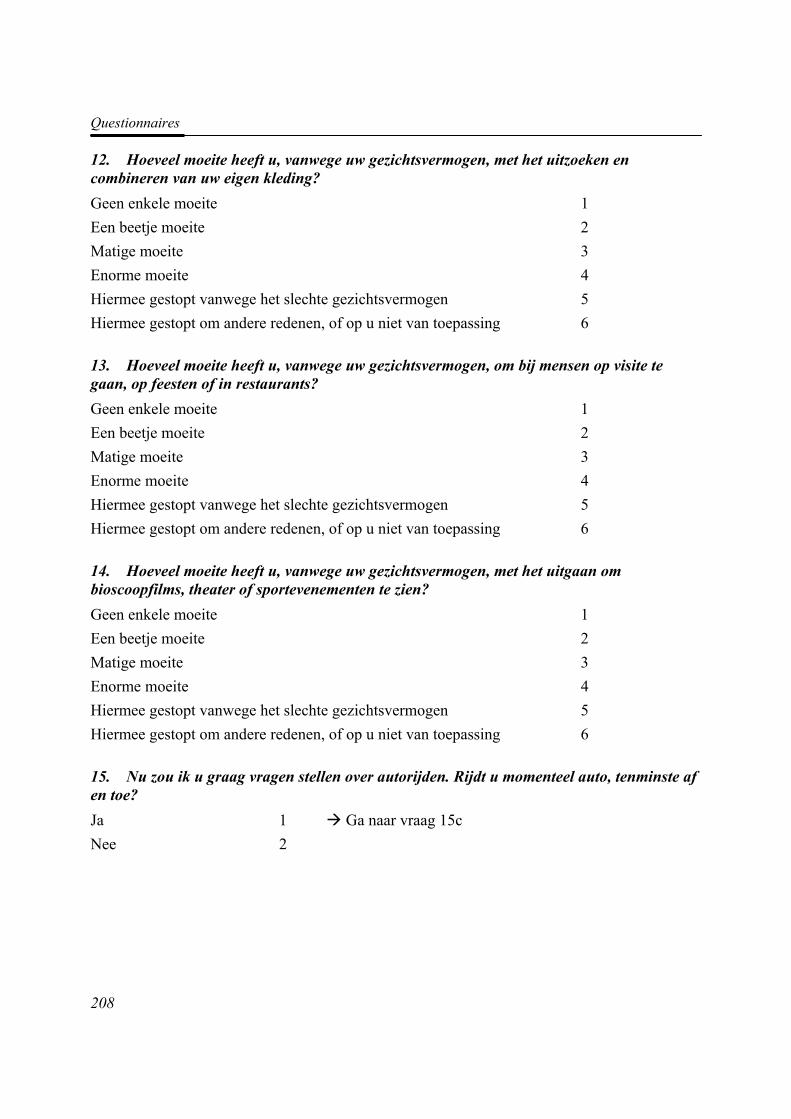
Questionnaires
208
12. Hoeveel moeite heeft u, vanwege uw gezichtsvermogen, met het uitzoeken en combineren van uw eigen kleding? Geen enkele moeite 1 Een beetje moeite 2 Matige moeite 3 Enorme moeite 4 Hiermee gestopt vanwege het slechte gezichtsvermogen 5 Hiermee gestopt om andere redenen, of op u niet van toepassing 6 13. Hoeveel moeite heeft u, vanwege uw gezichtsvermogen, om bij mensen op visite te gaan, op feesten of in restaurants? Geen enkele moeite 1 Een beetje moeite 2 Matige moeite 3 Enorme moeite 4 Hiermee gestopt vanwege het slechte gezichtsvermogen 5 Hiermee gestopt om andere redenen, of op u niet van toepassing 6 14. Hoeveel moeite heeft u, vanwege uw gezichtsvermogen, met het uitgaan om bioscoopfilms, theater of sportevenementen te zien? Geen enkele moeite 1 Een beetje moeite 2 Matige moeite 3 Enorme moeite 4 Hiermee gestopt vanwege het slechte gezichtsvermogen 5 Hiermee gestopt om andere redenen, of op u niet van toepassing 6 15. Nu zou ik u graag vragen stellen over autorijden. Rijdt u momenteel auto, tenminste af en toe? Ja 1 Ga naar vraag 15c Nee 2
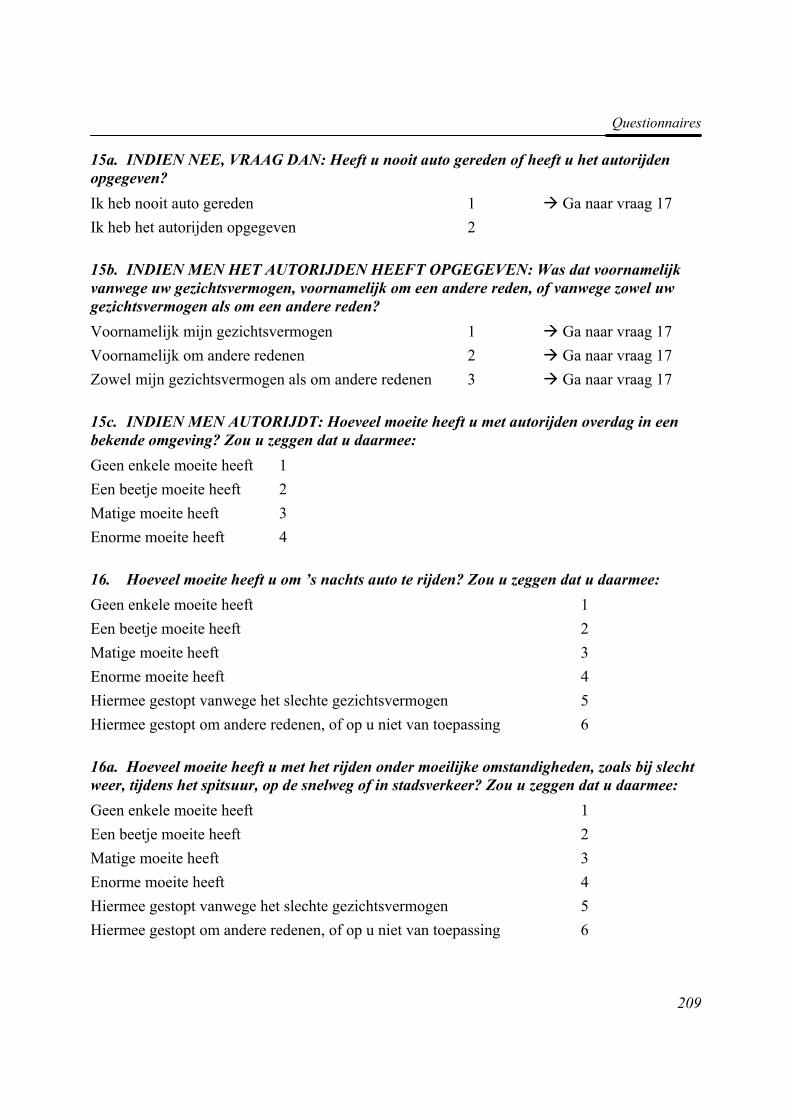
Questionnaires
209
15a. INDIEN NEE, VRAAG DAN: Heeft u nooit auto gereden of heeft u het autorijden opgegeven? Ik heb nooit auto gereden 1 Ga naar vraag 17 Ik heb het autorijden opgegeven 2 15b. INDIEN MEN HET AUTORIJDEN HEEFT OPGEGEVEN: Was dat voornamelijk vanwege uw gezichtsvermogen, voornamelijk om een andere reden, of vanwege zowel uw gezichtsvermogen als om een andere reden? Voornamelijk mijn gezichtsvermogen 1 Ga naar vraag 17 Voornamelijk om andere redenen 2 Ga naar vraag 17 Zowel mijn gezichtsvermogen als om andere redenen 3 Ga naar vraag 17 15c. INDIEN MEN AUTORIJDT: Hoeveel moeite heeft u met autorijden overdag in een bekende omgeving? Zou u zeggen dat u daarmee: Geen enkele moeite heeft 1 Een beetje moeite heeft 2 Matige moeite heeft 3 Enorme moeite heeft 4 16. Hoeveel moeite heeft u om ’s nachts auto te rijden? Zou u zeggen dat u daarmee: Geen enkele moeite heeft 1 Een beetje moeite heeft 2 Matige moeite heeft 3 Enorme moeite heeft 4 Hiermee gestopt vanwege het slechte gezichtsvermogen 5 Hiermee gestopt om andere redenen, of op u niet van toepassing 6 16a. Hoeveel moeite heeft u met het rijden onder moeilijke omstandigheden, zoals bij slecht weer, tijdens het spitsuur, op de snelweg of in stadsverkeer? Zou u zeggen dat u daarmee: Geen enkele moeite heeft 1 Een beetje moeite heeft 2 Matige moeite heeft 3 Enorme moeite heeft 4 Hiermee gestopt vanwege het slechte gezichtsvermogen 5 Hiermee gestopt om andere redenen, of op u niet van toepassing 6
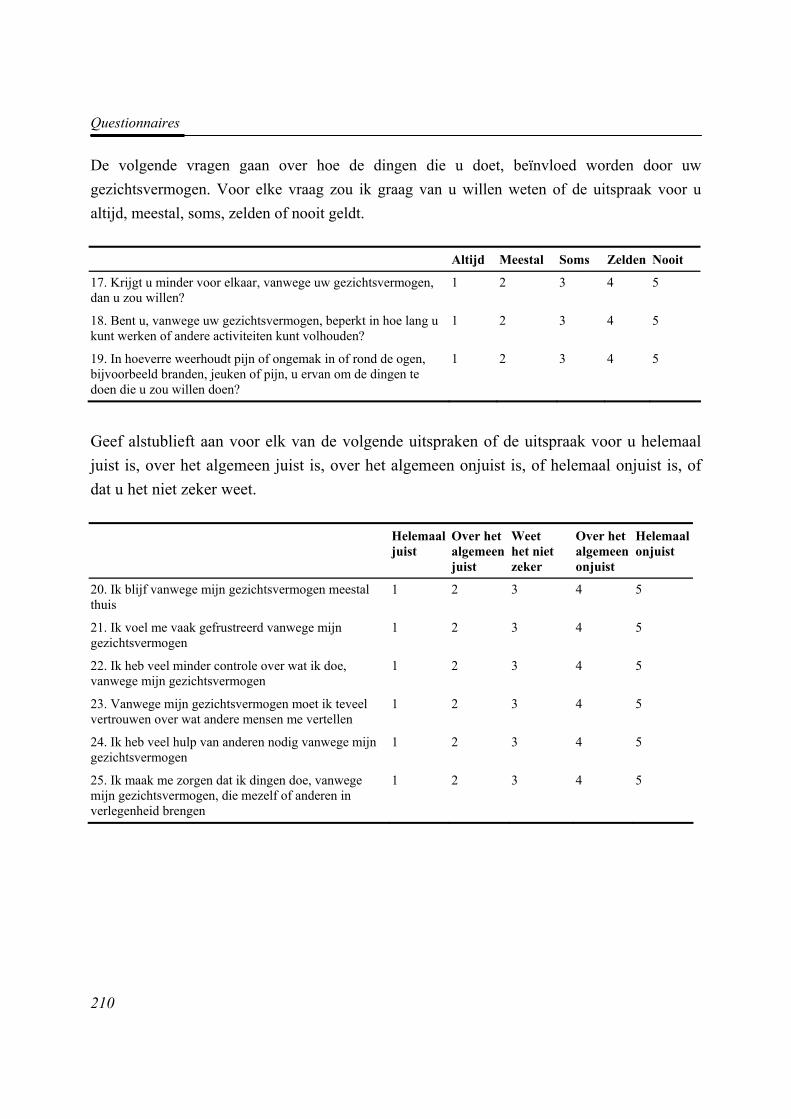
Questionnaires
210
De volgende vragen gaan over hoe de dingen die u doet, beïnvloed worden door uw gezichtsvermogen. Voor elke vraag zou ik graag van u willen weten of de uitspraak voor u altijd, meestal, soms, zelden of nooit geldt.
Altijd Meestal Soms Zelden Nooit
17. Krijgt u minder voor elkaar, vanwege uw gezichtsvermogen, dan u zou willen?
1 2 3 4 5
18. Bent u, vanwege uw gezichtsvermogen, beperkt in hoe lang u kunt werken of andere activiteiten kunt volhouden?
1 2 3 4 5
19. In hoeverre weerhoudt pijn of ongemak in of rond de ogen, bijvoorbeeld branden, jeuken of pijn, u ervan om de dingen te doen die u zou willen doen?
1 2 3 4 5
Geef alstublieft aan voor elk van de volgende uitspraken of de uitspraak voor u helemaal juist is, over het algemeen juist is, over het algemeen onjuist is, of helemaal onjuist is, of dat u het niet zeker weet. Helemaal
juist
Over het algemeenjuist
Weet het niet zeker
Over het algemeen onjuist
Helemaalonjuist
20. Ik blijf vanwege mijn gezichtsvermogen meestal thuis
1 2 3 4 5
21. Ik voel me vaak gefrustreerd vanwege mijn gezichtsvermogen
1 2 3 4 5
22. Ik heb veel minder controle over wat ik doe, vanwege mijn gezichtsvermogen
1 2 3 4 5
23. Vanwege mijn gezichtsvermogen moet ik teveel vertrouwen over wat andere mensen me vertellen
1 2 3 4 5
24. Ik heb veel hulp van anderen nodig vanwege mijn gezichtsvermogen
1 2 3 4 5
25. Ik maak me zorgen dat ik dingen doe, vanwege mijn gezichtsvermogen, die mezelf of anderen in verlegenheid brengen
1 2 3 4 5

SSuummmmaarryy
Summary
212
Background, aims and methods According to the World Health Organisation (WHO), in 2002 the number of people with visual impairment was estimated to be in excess of 161 million: 37 million people were blind and 124 had low vision. For the Netherlands, in 2000 the best estimation was that between 33,300 and 45,000 people (0.21% - 0.28% of the total Dutch population) were blind and between 115,000 and 175,000 (0.72% - 1.09%) had low vision according to the WHO criteria. The main causes of blindness and low vision in those aged 20 to 65 years are optic neuropathy, tapetoretinal dystrophies, myopia-related retinal disorders, diabetic retinopathy, age-related macular degeneration, other retinal disorders, glaucoma, and cataract. For the main causes of visual impairment (surgical) treatment options are limited. Most treatments are aimed at slowing down the progression of the eye disease, or the underlying disease must be found and treated (if possible) to prevent further vision loss. Although the prevalence of visual impairment in working-age adults is low, the impact is extremely high and affects all aspects of life. Therefore, many visually impaired persons have to rely on low vision rehabilitation.
The Netherlands has several rehabilitation services for visually impaired adults, including optometric services and multidisciplinary rehabilitation centres. For example, Visio Het Loo Erf (in Apeldoorn) provides comprehensive rehabilitation programs for visually impaired adults; their rehabilitation programs are only available for persons with complex problems or multiple rehabilitation demands, and include vision training, occupational therapy, mobility training, and coping with vision loss. Evidence regarding the efficacy of the rehabilitation programs has become increasingly important. Up to about 15 years ago the outcome of rehabilitation was calculated by objective measures at the disability level, such as reading speed, walking distance, and performance of daily activities. Recently, however, clinicians and researchers have become aware of the need for more subjective outcome measures, such as quality of life. The main objective of the work presented in this thesis is to assess prognostic factors for quality of life after rehabilitation among visually impaired adults.
Summary
213
The specific aims of this thesis are: • to assess the properties of the Functional Field Score; • to review the literature on quality of life as an outcome of rehabilitation for visually
impaired adults; • to compare quality of life of visually impaired adults with quality of life in a healthy
Dutch population and patients with other chronic diseases; • to further validate one of the most widely used vision-related quality of life
questionnaires; • to assess the outcome of rehabilitation on the short term and long term; • to provide guidelines for the referral of visually impaired persons to rehabilitation
services in the Netherlands.
Chapters 2 and 3 address the Functional Field Score; these studies are based on data from a retrospective chart review of all low vision patients who entered an observational program prior to rehabilitation. We selected data of 58 patients aged 18 years or older, who had valid results from a Goldmann III−4e and V−4e visual field test for at least one eye. In these studies one eye could be blind.
Most of the studies with original data described in this thesis (Chapters 5, 6, and 7) were based on a prospective cohort study on the quality of life of visually impaired adults. We included patients aged 18 years or older who had sufficient understanding of the Dutch language and adequate cognitive abilities to understand the questions (as assessed by a research assistant in psychology). Participants were asked to complete a generic and a vision-related quality of life instrument on three occasions: i.e. at baseline (when the participants visited the rehabilitation centre for an observational week prior to rehabilitation), at 3 months after finishing rehabilitation, and at 12 months after finishing rehabilitation. The questionnaire was completed by 129 participants at baseline, by 87 at 3-months follow-up, and by 77 participants at 12-months follow-up.
The studies described in Chapters 4 and 8 were based on systematic reviews of the relevant literature.
Functional Field Score (FFS) In 2001, the American Medical Association adopted the Functional Vision Score; this score is built on the Functional Acuity Scores and Functional Field Scores (FFS). In this thesis, we focused on the scoring method (grid method) and calculation of the FFS. Despite the
Summary
214
fact that grid scores are frequently used to assess visual field, the reliability of this method has not yet been investigated. The size of the visual field depends to a large extent on the stimulus intensity and stimulus size. Although the visual field is generally evaluated using the Goldmann isopter III−4e, it has the disadvantage that not all low-vision patients are able to see the stimulus corresponding to this isopter.
In Chapter 2 we evaluated the intra- and interrater reproducibility of the FFS. The FFSs of isopters III−4e and V−4e were analysed. Two raters independently scored the plots; the smallest detectable difference (SDD) and the weighted kappa were used to quantify agreement. The SDD expresses the smallest difference between two scores that can be interpreted as ‘real’ and cannot be attributed to measurement error. The SDDs were smaller than the minimally clinically important difference (MCID) of ten points; thus, the MCID can be distinguished from measurement error. The intraclass correlation coefficient (ICC) was used to quantify reliability. The intra- and inter ICCs were high (ICCs >0.98). It was concluded that both intra- and interrater reliability of the FFS were excellent.
In Chapter 3 we investigated underestimation of field loss in FFS between the Goldmann isopters III−4e and V−4e in visually impaired patients, in order to develop a predictive model for the FFSIII−4e based on the FFSV−4e that adjusts for possible confounders. Linear regression was used to develop the model, setting FFSIII−4e as the dependent variable and FFSV−4e as the independent variable. The FFSV−4e was larger than FFSIII−4e - the mean difference being 14.6 points. Multiple linear regression analysis showed that age, Functional Acuity Score, primary eye disease and central/peripheral loss were not confounders for the prediction of FFSIII−4e. The FFSIII−4e was estimated using the following equation: FFSIII−4e = -19.25 + 1.063*FFSV−4e. In practice, just subtracting 19.25 points of the value of FFSV−4e will be sufficient to estimate the value of FFSIII−4e. This model should give confidence about using the larger isopter to determine the visual impairment of a person by means of the FFS.
Review of quality of life in visually impaired adults Increased attention to the concept of vision-related quality of life has resulted in several studies exploring the effect of different rehabilitation programs on quality of life. However, because these studies used different vision-related quality of life questionnaires to compare different rehabilitation programs for different populations, it is difficult to discuss and assess the effectiveness of these programs. Therefore, we conducted a systematic review of the evidence for the effectiveness of the various rehabilitation programs in improving the
Summary
215
quality of life of visually impaired adults (Chapter 4). First, we systematically searched and selected literature from different sources. We included (quasi-) randomised trials of studies on quality of life of persons aged 18 years or older, of either sex, with irreversible visual impairment. Also included were trials that compared multidisciplinary rehabilitation with monodisciplinary rehabilitation and with no rehabilitation. Two reviewers independently extracted data and assessed trial quality. Considering the diversity of vision rehabilitation interventions, 10 studies (11 articles) were categorized into three groups of related intervention types: the educational group programs, methods of enhancing vision, and vision rehabilitation programs. Educational group programs tended to be preferable to individual programs, or to no treatment. Some enhancing vision methods are effective in improving quality of life, including adaptation of lighting, and conventional rehabilitation. Prescription of prism spectacles is effective in improving reading skills, but not necessarily in improving quality of life. Participants receiving a comprehensive rehabilitation program experienced a better psychological well-being and performed more independently on living skills after treatment compared with a no-treatment group. However, this program was not effective in improving independence regarding orientation and mobility skills.
The evidence from randomised controlled trials supports the positive effect of rehabilitation on vision-related quality of life. However, this evidence is based on single studies, and the results need to be confirmed in additional studies. The complexity and diversity of patients’ needs implies the necessity to adapt any rehabilitation program to the individual patient profile. Studies on prognostic factors are needed in order to develop such patient profiles for specific rehabilitation programs. In general, not all improvements remained stable on the long term, which might indicate the need for (better) aftercare programs or clinical follow-up of the patients.
Quality of life compared to other chronic conditions Generic health-related quality of life (HRQoL) questionnaires are useful to compare the quality of life of visually impaired persons with that of persons with chronic conditions that are not vision related. Chapter 5 describes the generic HRQoL and health status of visually impaired patients, and compares the HRQoL of visually impaired patients with that of both the general Dutch population and of patients with other chronic conditions. The chronic conditions selected for their hypothetical influence on (aspects of) vision-related quality of life were: acute coronary syndrome, chronic fatigue syndrome, pulmonary disease, diabetes mellitus type 1 and type 2, hearing impairment, major depressive disorder, multiple
Summary
216
sclerosis, severe mental illness, stroke and major trauma. Generic HRQoL was assessed using the EuroQol (EQ-5D), which is one of the most commonly used instruments. It consists of five questions covering the dimensions mobility, self-care, usual activities, pain or discomfort, and anxiety or depression. The EQ-5D scores of visually impaired adults were compared with EQ-5D norms of the Dutch population and of patients with other chronic conditions; both sets of data were taken from the literature. We found that visual impairment has a substantial impact on the quality of life when compared with other chronic conditions. The average EQ-5Dindex score of the total study population was 0.73. The values of the EQ-5Dindex are set on a scale in which 0 corresponds to death and 1 to a state of perfect health. Visually impaired patients reported more problems on every dimension of the EQ-5D than the general Dutch population. Only patients with chronic fatigue syndrome and stroke patients reported more problems on every dimension of the EQ-5D than visually impaired patients. Visual impairment disturbs quality of life more than diabetes mellitus type 2, coronary syndrome and hearing impairments, but less than stroke, multiple sclerosis, chronic fatigue syndrome, major depressive disorder and severe mental illness.
Evaluation of a vision-related quality of life questionnaire The Visual Functioning Questionnaire (VFQ-25) is one of the most widely used measures of vision-related quality of life. However, the questionnaire does not meet some psychometric quality criteria. In Chapter 6 we re-evaluated the psychometric properties of the VFQ-25 for a group of visually impaired working-age adults. Three items on automobile driving were excluded from further analyses because they showed a high ceiling effect or had too many missing values. First, the items of the VFQ-25 were subjected to an exploratory factor analysis. Next, a separate Rasch analysis was performed on each factor. We examined step thresholds and goodness of fit statistics of the items. Finally, we examined differential item functioning. The results indicated that modifications of the original VFQ-25 structure are necessary. Factor analysis indicated four domains: Near Activities, Distance Activities & Mobility, Mental Health & Dependency, and Pain & Discomfort; these accounted for 46.4% of the total variance. Most items showed some degree of threshold disordering. All disordered thresholds were recoded from the original 5-point scale by collapsing two or three categories to form a 4-point or a 3-point scale. After collapsing the item response categories, all items showed ordered thresholds. The Near Activities domain showed excellent fit, the Distance Activities & Mobility domain
Summary
217
good fit, the Mental Health & Dependency domain and the Pain & Discomfort domain an unsatisfactory fit. Two items showed uniform differential item functioning.
Prognostic factors for quality of life in visually impaired working- age adults The overall aim of rehabilitation for visually impaired adults is to improve the quality of life and (societal) participation. The complexity and diversity of patients’ needs makes it necessary to adapt the rehabilitation program to individual patient profiles. These patient profiles can be based on factors responsible for differences in quality of life outcome between certain groups of patients (prognostic factors). In Chapter 7 we obtained the short and long-term outcome of a comprehensive rehabilitation program on quality of life for visually impaired adults, and on prognostic baseline factors. The change between subsequent measurements of the four factors of the VFQ-25 was measured, and the longitudinal relationship between vision-related quality of life on the one hand and possible prognostic factors on the other was evaluated by means of random coefficient analyses. When the factor scores one year after rehabilitation were compared with baseline scores, the Mental Health & Dependency scale showed a significant improvement. For participants who received rehabilitation, age appeared to be a significant prediction variable for all factors. Additionally, the Functional Visual Score and time of onset of visual impairment were predictors for the factor Pain & Discomfort. Although additional studies are needed to confirm our results, these findings should lead to adjustments in the rehabilitation programs.
Guidelines on the referral of visually impaired persons to low vision services Although there are several guidelines on the referral of visually impaired persons, only the one devised by the American Academy of Ophthalmology is evidence based. However, because this guideline is not applicable to the Dutch healthcare system, we decided to develop evidence-based guidelines for the referral of visually impaired persons to low vision services (Chapter 8). We systematically searched the literature for definitions of visual impairment, for physician-patient communication, and for outcome of interventions for visually impaired persons. Results of the selected articles were summarised and rated according to the level of evidence. Other considerations, such as the current organisation of rehabilitation for visually impaired persons in the Netherlands, were also taken into
Summary
218
account. In this study, we slightly adapted the WHO criteria in order to include all people who experience problems with reading and other daily life activities due to visual impairment. A large number of recommendations were devised. Among these is that the complete diagnosis should be communicated to the patient and that a second appointment should be offered in which the diagnosis and potential treatment options are discussed again. Another recommendation is that, in general, visually impaired adults eligible for referral should be referred for the provision of low vision aids, and that patients with complex problems or extensive rehabilitative demands should be referred to a rehabilitation centre.
Conclusions One of the central themes in this thesis is the reliability and validity of the Functional Field Score (FFS) as a part of the Functional Visual Score; the reliability and the agreement of the FFS proved to be sufficient. The FFS corresponding to stimulus III−4e can be estimated from the FFS corresponding to stimulus V−4e by subtracting 19.25 points. It can be seen that an overestimation of the FFS by using a larger isopter leads to a remarkably higher Functional Visual Score. As this might have serious consequences for benefits, we recommend that the Functional Visual Score be adapted in the next edition of the American Medical Association guidelines.
A second important aim was to assess the generic and vision-related quality of life of visually impaired adults. We found that generic health-related quality of life is reduced in visually impaired patients compared to a healthy reference group. Compared with other chronic conditions, visual impairment has a stronger effect on quality of life than diabetes mellitus type 2, coronary syndrome and hearing impairment, but less than stroke, multiple sclerosis, chronic fatigue syndrome, major depressive disorder and severe mental illness. To assess vision-related quality of life, we re-evaluated one of the most popular vision-related quality of life questionnaires, the VFQ-25. Although our results regarding this evaluation require confirmation and some additional analyses, we were able to show that the new factor structure is a better alternative to evaluate the outcome of rehabilitation programs in visually impaired working-age adults compared to the original factor structure.
Finally, we have shown that evidence regarding the outcome of rehabilitation programs in improving quality of life of visually impaired adults is scarce. The systematic review presented in Chapter 4 provided some evidence for the effectiveness of the outcome of parts of rehabilitation programs. This thesis presents the first long-term outcomes on
Summary
219
quality of life of visually impaired working-age adults. Changes in quality of life after rehabilitation are generally small. Based on our findings, there is evidence that rehabilitation programs offered at the rehabilitation centre might need adaptations tailored to the individual needs of the visually impaired adult. Age, Functional Vision Score and time of onset of the visual impairment were predictors for changes in quality of life. This information may be helpful in assessing the best referral patterns for specific groups of patients. For now, the guidelines presented in this thesis provides recommendations based on ‘best’ available evidence on how to refer visually impaired persons to rehabilitation services.

SSaammeennvvaattttiinngg
Samenvatting
222
Achtergrond, doelstelling en methoden Naar schatting van de Wereldgezondheidsorganisatie hebben wereldwijd ruim 161 miljoen mensen een visuele beperking: 37 miljoen mensen zijn blind en 124 slechtziend. In 2000 waren in Nederland naar schatting tussen de 33.300 en 45.000 mensen blind en tussen de 115.000 en 175.000 mensen slechtziend. De belangrijkste oorzaken van blindheid en slechtziendheid bij mensen in de leeftijd van 20 tot 65 jaar zijn: opticus neuropathie, tapetoretinale dystrofieën, aan myopie gerelateerde afwijkingen van het netvlies, diabetische retinopathie, leeftijdsgebonden maculadegeneratie, overige netvliesafwijkingen, glaucoom, en cataract. Voor de belangrijkste oorzaken van visuele beperkingen zijn (chirurgische) behandelingen beperkt. De meeste behandelingen zijn er op gericht om de progressie van de oogaandoening te verminderen of de onderliggende aandoening op te sporen en te behandelen zodat verdere schade aan het visuele systeem beperkt wordt. Hoewel de prevalentie bij volwassenen in de leeftijd van 18 tot 65 jaar laag is, is de impact van een visuele beperking op het dagelijks leven erg groot. Daarom doen veel visueel beperkte volwassen een beroep op revalidatievoorzieningen.
In Nederland zijn diverse revalidatievoorzieningen voor volwassenen met een visuele beperking, waaronder optometristen en multidisciplinaire revalidatiecentra. Visio Het Loo Erf (in Apeldoorn) is een voorbeeld van een multidisciplinair revalidatiecentrum en biedt een intensief revalidatieprogramma aan visueel beperkte volwassenen; het revalidatieprogramma is vooral bedoeld voor mensen met complexe problemen of meervoudige hulpvragen. Het programma bestaat onder andere uit zientraining, ergotherapie, mobiliteitstraining, psychologische en maatschappelijke hulp.
Aantonen van de effectiviteit van revalidatieprogramma’s wordt steeds belangrijker. Tot 15 jaar geleden werd de effectiviteit bepaald met behulp van objectieve maten, zoals leessnelheid, loopafstand en de uitvoering van dagelijkse activiteiten. Clinici en onderzoekers zijn zich tegenwoordig meer bewust van de behoefte aan een meer subjectieve maat om de effectiviteit te meten, zoals kwaliteit van leven.
Het belangrijkste doel van het in dit proefschrift beschreven onderzoek is om factoren te identificeren die een verandering in kwaliteit van leven na revalidatie voorspellen bij visueel beperkte volwassenen in de leeftijd van 18 tot 65 jaar.
Samenvatting
223
Specifieke doelstellingen zijn: • Eigenschappen van de Functional Field Score bepalen, een maat voor de grootte van
de visuele beperking; • Een overzicht geven van literatuurgegevens waarbij kwaliteit van leven van
volwassenen een uitkomstmaat is van revalidatie; • Het vergelijken van de kwaliteit van leven van volwassenen met een visuele
beperkingen met die van gezonde volwassenen en volwassenen met een andere chronische aandoening
• Valideren van een van de meest gebruikte visus-gerelateerde kwaliteit van leven vragenlijsten, de VFQ-25;
• Bepalen van de visus-gerelateerde kwaliteit van leven op korte en lange termijn; • Maken van richtlijnen voor de verwijzing van personen met een visuele beperking
naar diverse revalidatie mogelijkheden in Nederland.
In Hoofdstuk 2 en 3 wordt ingegaan op de Functional Field Score; de deelonderzoeken zijn gebaseerd op een retrospectief dossieronderzoek van alle slechtziende patiënten die deelnamen aan een observatieprogramma voorafgaand aan een revalidatieprogramma. We selecteerden de data van 58 patiënten van 18 jaar of ouder, van wie zowel een Goldmann III−4e als een V−4e gezichtsveld was bepaald in ten minste één oog.
De meeste deelonderzoeken beschreven in dit proefschrift (hoofdstukken 5, 6 en 7) zijn gebaseerd op een prospectief cohort onderzoek naar de kwaliteit van leven van volwassenen met een visuele beperking. Inclusiecriteria voor deelname aan de studie waren: een leeftijd van 18 jaar of ouder, voldoende kennis van de Nederlandse taal en voldoende cognitieve mogelijkheden (beoordeeld door een psychodiagnostisch werker) om de vragen uit de vragenlijst te kunnen begrijpen. Deelnemers aan het onderzoek werd gevraagd drie keer een kwaliteit van leven vragenlijst in te vullen: aan het begin (tijdens de observatieweek voorafgaande aan de revalidatie), drie maanden respectievelijk één jaar na afloop van de revalidatie. De vragenlijst werd aan het begin door 129 deelnemers ingevuld, drie maanden respectievelijk één jaar na afloop van de revalidatie door 87 en 77 mensen.
De deelonderzoeken in hoofdstukken 4 en 8 zijn gebaseerd op gegevens die verzameld zijn uit systematisch literatuuronderzoek.
Samenvatting
224
Functional Field Score (FFS) De Functional Vision Score (FVS) werd in 2001 door de American Medical Association (AMA) opgenomen in de Guides for the Evaluation of Permanent Impairment. Deze score is opgebouwd uit een Functional Acuity Score (FAS) en een Functional Field Score (FFS). In het onderzoek in dit proefschrift hebben we de scoringsmethode (grid-methode) en berekening van de FFS onder de loep genomen. Ondanks het feit dat de grid-methode veel wordt gebruikt bij het bepalen van de grootte van een gezichtsveld, is de betrouwbaarheid tot op heden nog niet onderzocht. De grootte van het gezichtsveld hangt af van de sterkte en grootte van de stimulus. Hoewel een gezichtsveld over het algemeen wordt bepaald met behulp van een stimulus met grootte III en intensiteit 4−e, blijkt dat niet alle slechtziende patiënten in staat zijn om deze stimulus waar te nemen. In dat geval wordt een grotere stimulus aangeboden.
In hoofdstuk 2 evalueerden wij de intra- en interbeoordelaars reproduceerbaarheid van de FFS. Voor de gezichtsvelden met stimuli III−4e en V−4e, werd respectievelijk de FFSIII−4e en de FFSV−4e. bepaald. De Functional Field Scores van de isopters III−4e en V−4e werden geanalyseerd. Twee beoordelaars scoorden onafhankelijk van elkaar de gezichtsvelden. Het kleinst detecteerbare verschil dat nog uitstijgt boven de meetfout (‘smallest detectable difference’ SDD) en de gewogen kappa werden gebruikt om de overeenstemming tussen de beoordelaars te kwantificeren. De SDD’s waren kleiner dan het minimale klinisch relevante verschil (‘minimally clinically important difference’ MCID) van 10 punten. De MCID kan hierdoor worden onderscheiden van de meetfout. De intraklasse correlatie coëfficiënt (ICC) werd gebruikt om de betrouwbaarheid te kwantificeren. De intra- en inter- ICC’s waren hoog (ICCs>0.98). De conclusie was dat zowel de intra- als interbeoordelaarsbetrouwbaarheid van de FFS zeer goed was.
In het deelonderzoek in hoofdstuk 3 onderzochten we de onderschatting van het gezichtsveld in FFS tussen de Goldmann isopter III−4e en isopter V−4e bij patiënten met een visuele beperking. Hieruit werd een voorspellend model ontwikkeld voor de FFSIII−4e, gebaseerd op de FFSV−4e waarbij gecorrigeerd werd voor mogelijke confounders. Met behulp van lineaire regressie werd het model ontwikkeld waarbij FFSIII−4e als de afhankelijke variabele en FFSV−4e als de onafhankelijke variabele werden gekozen. De FFSV−4e was groter dan de FFSIII−4e, waarbij het verschil 14.6 punten was. Multiple lineaire regressie toonde aan dat leeftijd, FAS, primaire oogheelkundige aandoening en centraal/perifere gezichtsvelduitval geen confounders waren in de voorspelling van
Samenvatting
225
FFSIII−4e. De FFSIII−4e kan worden geschat met behulp van de volgende vergelijking: FFSIII−4e = −19.25 +1.063 * FFSV−4e. In de praktijk is het aftrekken van 19.25 van de FFSV−4e voldoende om de waarde van de FFSIII−4e te schatten. Dit model kan dus worden gebruikt wanneer alleen een gezichtsveld met een stimulus groter dan Goldmann III−4e kan worden bepaald.
Kwaliteit van leven van volwassenen met een visuele beperking De toegenomen aandacht voor visus-gerelateerde kwaliteit van leven heeft geleid tot verscheidene onderzoeken naar het effect van revalidatieprogramma’s op de kwaliteit van leven. Deze onderzoeken maakten gebruik van diverse visus-gerelateerde kwaliteit van leven vragenlijsten voor diverse populaties, waardoor het op basis van individuele studies moeilijk is om de effectiviteit van revalidatieprogramma’s te bepalen en de programma’s met elkaar te vergelijken. Daarom hebben we een systematisch literatuuronderzoek verricht naar het bewijs van de effectiviteit van verschillende revalidatieprogramma’s op het verbeteren van de kwaliteit van leven van volwassenen met een visuele beperking (hoofdstuk 4). Eerst werd systematisch naar literatuur gezocht en er werd literatuur geselecteerd vanuit diverse bronnen. We includeerden (quasi-) gerandomiseerde klinische trials naar kwaliteit van leven bij personen van 18 jaar of ouder, van beide geslachten, met een niet-reversibele visuele beperking. Er werden trials geïncludeerd die multidisciplinaire revalidatie vergeleken met monodisciplinaire revalidatie en “geen revalidatie”. Twee onderzoekers hebben onafhankelijk van elkaar data verzameld en de kwaliteit van de trial bepaald. De tien gevonden studies (11 artikelen) werden ingedeeld in drie categorieën gebaseerd op de interventie die was onderzocht: informatieve groepsprogramma’s, methoden voor verbetering visuele mogelijkheden, visuele revalidatieprogramma’s; informatieve groepsprogramma’s lijken effectiever dan individuele programma’s of “geen revalidatie”. Sommige methoden voor verbetering van visuele mogelijkheden zijn effectief voor de verbetering van de kwaliteit van leven, zoals verlichtingsaanpassingen en traditionele revalidatieprogramma’s. Het voorschrijven van prismabrillen is effectief voor de verbetering van de leesvaardigheid, maar niet voor de verbetering van de kwaliteit van leven. Patiënten die een intensief revalidatieprogramma volgden, ervaarden een betere psychosociaal welbevinden en toonden meer onafhankelijkheid in hun dagelijkse activiteiten vergeleken met patiënten die geen revalidatieprogramma volgden. Dit programma had echter geen invloed op de onafhankelijkheid in oriëntatie- en mobiliteitsvaardigheden. In het algemeen blijken niet alle verbeteringen in kwaliteit van
Samenvatting
226
leven stabiel op de lange termijn. Dit kan een indicatie zijn om (betere) nazorgprogramma’s te ontwikkelen en aandacht te besteden aan de klinische follow-up van patiënten.
Het bewijs dat geleverd wordt door gerandomiseerde studies ondersteunen het positieve effect van revalidatie op visus-gerelateerde kwaliteit van leven. Het bewijs is echter gebaseerd op enkelvoudige studies en de resultaten zullen dan ook nog bevestigd moeten worden in aanvullende studies. De complexiteit en diversiteit van de hulpvragen van de patiënten impliceren dat revalidatieprogramma’s zullen moeten worden aangepast aan individuele patiëntenprofielen. Studies naar voorspellende factoren zijn nodig om de patiënten profielen te kunnen bepalen voor specifieke revalidatieprogramma’s.
Kwaliteit van leven van visueel beperkte volwassenen in vergelijking met andere chronische aandoeningen Algemene kwaliteit van leven vragenlijsten zijn bruikbaar bij het vergelijken van kwaliteit van leven van mensen met een visuele beperking met die van mensen met andere chronische aandoeningen die niet gerelateerd zijn aan de visus. In Hoofdstuk 5 wordt de algemene kwaliteit van leven en gezondheidsstatus van volwassenen met een visuele beperking beschreven. De kwaliteit van leven van deze personen wordt vergeleken met die van gezonde Nederlandse volwassenen en met die van volwassenen met een andere chronische aandoening. De volgende chronische aandoeningen werden hierbij gekozen vanwege hun hypothetische invloed op (aspecten van) visus-gerelateerde kwaliteit van leven: acuut hartfalen, chronisch vermoeidheidssyndroom, longziekten, diabetes mellitus type 1, diabetes mellitus type 2, auditieve beperkingen, depressiviteit, andere ernstige psychiatrische aandoeningen, multiple sclerose, herseninfarct of hersenbloeding (CVA) en trauma. De algemene kwaliteit van leven werd gemeten met de EuroQol (EQ-5D), een van de meest gebruikte instrumenten voor dit doel. Deze vragenlijst bestaat uit vijf vragen die de volgende domeinen omvatten: mobiliteit, zelfverzorging, dagelijkse activiteiten, pijn of onbehagelijkheid, en angst of depressie. De EQ-5D scores van visueel beperkte volwassenen werden vergeleken met de EQ-5D norm scores van een gezonde Nederlandse populatie en met de scores van volwassenen met andere chronische aandoeningen. Alle datasets werden uit de literatuur gehaald. Uit ons onderzoek blijkt dat een visuele beperking een substantiële impact heeft op de kwaliteit van leven vergeleken met die van andere chronische aandoeningen en volledige gezondheid. De gemiddelde EQ-5Dindex-score van mensen met een visuele beperking was 0.73. De waarden van de EQ-5Dindex-score
Samenvatting
227
liggen op een schaal waarbij 0 overeenkomt met “dood” en 1 met een perfecte gezondheidstoestand. Volwassenen met een visuele beperking ervaren op iedere dimensie van de EQ-5D meer problemen dan gezonde personen. Alleen patiënten met het chronisch vermoeidheidssyndroom en CVA-patiënten ervaren op iedere dimensie meer problemen dan volwassenen met een visuele beperking. Visuele beperkingen lijken de kwaliteit van leven meer te beïnvloeden dan diabetes mellitus type 2, acuut hartfalen en auditieve beperkingen, maar hebben minder invloed dan CVA, multiple sclerose, chronisch vermoeidheidssyndroom, depressie en ernstige psychiatrische aandoeningen.
Evaluatie van een visus-gerelateerde kwaliteit van leven vragenlijst De ‘Visual Functioning Questionnaire’ (VFQ-25) is een van de meest gebruikte meetinstrumenten voor visus-gerelateerde kwaliteit van leven. Deze vragenlijst voldoet echter niet aan een aantal psychometrische criteria. In Hoofdstuk 6 hebben we een herevaluatie uitgevoerd van de psychometrische eigenschappen van de VFQ-25 voor een groep van visueel beperkte volwassenen in de leeftijd van 18 tot 65 jaar. Drie vragen met betrekking tot autorijden werden uit de verdere analyses gelaten, omdat deze een extreem plafondeffect toonden of teveel ontbrekende waarden hadden. De overige items werden eerst onderworpen aan een exploratieve factoranalyse. Vervolgens werd een Rasch analyse uitgevoerd op iedere factor. We bestudeerden de drempelwaarden van de items en of de data passen bij het betreffende model. De resultaten laten zien dat een aanpassing nodig is van de originele factorstructuur van de VFQ-25. Uit de factoranalyse blijkt dat er vier factoren aan te wijzen zijn: ‘Activiteiten voor dichtbij zien’, ‘Activiteiten voor veraf zien & Mobiliteit’, ‘Mentale gezondheid & Afhankelijkheid’, en ‘Pijn & Onbehagelijkheid’. Met deze factoren werd 46.4% van de variantie verklaard. De meeste items vertoonden ongeordende drempelwaarden. De originele vijfpunt-scoringschalen werden daarom gecomprimeerd tot een vier- of driepuntschaal, door respectievelijk twee of drie antwoordcategorieën samen te voegen. Na het samenvoegen van de antwoordcategorieën waren de drempelwaarden van alle items geordend. De factor ‘Activiteiten voor dichtbij zien’ paste zeer goede, de factor ‘Activiteiten voor veraf zien & mobiliteit’ paste ook. De overige twee factoren sloten onvoldoende aan bij het model. Ten slotte bestudeerden we eventuele ‘differential item functioning’ (DIF). Hiervan is sprake als een vraag (item) anders wordt geïnterpreteerd bij verschillende subgroepen, waardoor mensen in de verschillende subgroepen niet dezelfde kans hebben op een bepaalde uitkomst. Twee
Samenvatting
228
vragen vertoonden DIF voor de subgroepen op basis van leeftijd en tijdstip van ontstaan van de visuele beperking.
Voorspellende factoren voor kwaliteit van leven van volwassenen tussen 18 en 65 jaar met een visuele beperking Het belangrijkste doel van revalidatie van volwassenen met een visuele beperking is het verbeteren van de kwaliteit van leven en de (sociale) participatie. De complexiteit en diversiteit van de hulpvragen van de patiënten maken het noodzakelijk om het revalidatieprogramma af te stemmen op patiëntenprofielen. Deze profielen kunnen worden gebaseerd op voorspellende factoren die verantwoordelijk zijn voor de verschillen in de uitkomst van kwaliteit van leven tussen verschillende groepen patiënten (prognostische factoren). In hoofdstuk 7 hebben we de korte en lange termijn uitkomsten op kwaliteit van leven na een intensief revalidatieprogramma en prognostische factoren voor de verandering in kwaliteit van leven bepaald. De veranderingen tussen de verschillende meetmomenten op de vier factoren van de VFQ-25 werden gemeten en de longitudinale relatie tussen visus-gerelateerde kwaliteit van leven en mogelijke prognostische factoren werd geëvalueerd door middel van random coëfficiënt analyses. Wanneer de scores op de factoren één jaar na de revalidatie werden vergeleken met baseline scores, liet de subschaal “Mentale gezondheid & Afhankelijkheid” een significante verbetering zien. Leeftijd bleek een voorspellende factor voor alle subschalen. Bovendien was de FVS en het tijdstip van ontstaan van de visuele beperking voorspellend voor een verandering in kwaliteit van leven op de subschaal “Pijn & Onbehagelijkheid”. Hoewel aanvullende studies nodig zijn om onze resultaten te bevestigen, kunnen de huidige resultaten gebruikt worden om patiëntenprofielen op te stellen en revalidatieprogramma’s daarop aan te passen.
Richtlijnen voor de verwijzing van slechtzienden en blinden Hoewel er verscheidene richtlijnen bestaan voor de verwijzing van slechtzienden en blinden naar hulpverleners en instellingen voor mensen met een visuele beperking, is alleen de richtlijn van de “American Academy of Ophthalmology” een evidence based richtlijn, gebaseerd op het op dat moment best beschikbare bewijs. Deze richtlijn is echter niet toepasbaar op de organisatie van de Nederlandse gezondheidszorg, zodat een nieuwe evidence based richtlijn voor de Nederlandse situatie ontworpen werd. We hebben systematisch in de literatuur gezocht naar definities van visuele beperkingen, arts-patiënt communicatie en naar uitkomsten van interventies bij personen met een visuele beperking.
Samenvatting
229
Resultaten uit de geselecteerde artikelen werden samengevat en gescoord naar het niveau van de bewijskracht. Andere overwegingen zoals de huidige organisatie van de revalidatie in Nederland, werden hierin meegenomen. We hebben daarom een kleine aanpassing gemaakt in de criteria voor visuele beperkingen van de WHO om alle personen te kunnen verwijzen die problemen hebben met lezen en andere activiteiten van het dagelijks leven als gevolg van de visuele beperking. Een groot aantal aanbevelingen werd in de richtlijnen gegeven. Een van de aanbevelingen was dat de volledige diagnose aan de patiënt moet worden meegedeeld. Daarnaast moet de arts een mogelijkheid bieden voor een tweede gesprek waarin de diagnose en therapiemogelijkheden nogmaals met de patiënt besproken worden. Een andere aanbeveling is dat over het algemeen volwassenen met een visuele beperking verwezen moeten worden voor het verkrijgen van de juiste hulpmiddelen naar een optometrist of regionaal revalidatiecentrum, en patiënten met complexe problemen en meer hulpvragen naar een revalidatiecentrum.
Conclusies Een van de centrale thema’s in dit proefschrift waren de betrouwbaarheid en validiteit van de Functional Field Score (FFS) als onderdeel van de Functional Vision Score (FVS); de betrouwbaarheid en overeenstemming tussen de beoordelaars van de FFS blijken voldoende te zijn. De FFS die correspondeert met Goldmann stimulus III−4e kan worden geschat met behulp van de FFS die correspondeert met Goldmann stimulus V−4e door 19.25 punten van deze laatste score af te trekken. De overschatting van de FFS als gevolg van het gebruik van een grotere stimulus leidt tot een aanmerkelijk hogere FVS. Dit kan grote gevolgen hebben voor de hoogte van een (arbeidsongeschiktheids- of letselschade-) uitkering. Daarom hebben we aanbevolen om de berekening van de FVS op dit punt in de volgende editie van de AMA-guides aan te passen.
Een tweede belangrijke doelstelling was om de algemene en visus-gerelateerde kwaliteit van leven van volwassen tussen de 18 en 65 jaar met een visuele beperking vast te stellen. De algemene kwaliteit van leven blijkt verminderd te zijn in vergelijking met die in een gezonde populatie. Vergeleken met de kwaliteit van leven van patiënten met andere chronische aandoeningen heeft een visuele beperking meer effect op kwaliteit van leven dan in geval van diabetes mellitus type 2, acuut hartfalen, auditieve beperkingen, en minder effect dan bij CVA, multiple sclerose, chronisch vermoeidheidssyndroom, een depressieve stoornis en andere ernstige psychiatrische aandoening. Om de visus-gerelateerde kwaliteit van leven te bepalen hebben we een van de meest gebruikte vragenlijsten, de VFQ-25,
Samenvatting
230
opnieuw geëvalueerd op psychometrische eigenschappen. Hoewel onze resultaten met betrekking tot deze evaluatie nog moeten worden bevestigd en aanvullende analyses moeten worden uitgevoerd, kunnen we stellen dat de nieuwe factorstructuur van de VFQ−25 een beter alternatief is dan de originele structuur.
Tot slot hebben we aangetoond dat bewijs met betrekking tot verbetering in kwaliteit van leven als uitkomst van revalidatieprogramma’s erg schaars is. Het systematische literatuuroverzicht in Hoofdstuk 4 laat enig bewijs zien voor de effectiviteit van onderdelen van revalidatieprogramma’s. In dit proefschrift worden de eerste resultaten gepresenteerd van lange-termijn uitkomsten naar kwaliteit van leven bij volwassen tussen de 18 en 65 jaar. Over het algemeen blijken de veranderingen in kwaliteit van leven klein te zijn. De revalidatieprogramma’s zouden meer op de individuele behoeften kunnen worden toegesneden. Leeftijd, FVS en tijdstip van ontstaan van de visuele beperking waren voorspellers van een verandering in kwaliteit van leven. Deze voorspellers kunnen worden gebruikt om de revalidatieprogramma’s aan te passen. Deze informatie kan ook in de toekomst behulpzaam zijn bij het verwijzen van specifieke groepen patiënten. In de huidige situatie, kunnen de in dit proefschrift gepresenteerde richtlijnen en aanbevelingen voor verwijzing, die gebaseerd zijn op het best beschikbare bewijs, gebruikt worden voor de verwijzing naar hulpverleners en instellingen voor revalidatie van mensen met een visuele beperking.

DDaannkkwwoooorrdd
Dankwoord
232
Na ruim vier jaar hard werken zit dit hoofdstuk in mijn leven er op. Ik heb met veel plezier aan dit proefschrift gewerkt. Zoals het bij een promotietraject hoort ging het gepaard met pieken en dalen. In het laatste rapport dat ik op de basisschool ontving staat geschreven: “… ik hoop dat je honger naar kennis verder gestild wordt”. Ik kan nu zeggen dat de ergste honger gestild is, maar de “lekkere trek” blijft. Op deze plek wil ik graag iedereen bedanken die het mogelijk heeft gemaakt om dit promotietraject tot een goed einde te brengen.
Allereerst wil ik de klanten van Visio Het Loo Erf bedanken die belangeloos en met veel enthousiasme aan dit onderzoek hebben deelgenomen. Naast talloze vragenlijsten die in een observatieweek worden doorgenomen, hebben zij ook de kwaliteit van leven vragenlijsten ingevuld. Ik hoop dat de resultaten zullen bijdragen aan een nog betere kwaliteit van leven na revalidatie.
Vervolgens wil ik mijn eerste promotor, prof.dr. G.H.M.B. van Rens bedanken. Beste Ger, bedankt voor alle ruimte en mogelijkheden die je me gegeven hebt tijdens dit onderzoek. Ik waardeer het zeer dat ik als promovendus zelf richting kon geven aan dit onderzoek en dat je altijd open staat voor alle ideeën. Ik hoop dat we in de toekomst nog eens samen kunnen werken.
Ook mijn tweede promotor, prof.dr. P.J. Ringens, wil ik graag op deze plaats bedanken. Uw enthousiasme voor al onze low vision onderzoeken werkt erg aanstekelijk. Daarnaast heb ik het delen van ervaringen met betrekking tot visuele beperkingen tussen een clinicus en ergotherapeut erg gewaardeerd.
Ook mijn beide copromotoren wil ik bedanken voor hun hulp en begeleiding. Michiel, zoals je in je eigen proefschrift al schreef was jij de pionier van ons promovendi. Zonder al jouw voorwerk, zowel inhoudelijk als organisatorisch, had ik deze promotie waarschijnlijk niet in dit tijdsbestek tot een goed einde kunnen brengen. Deze plaats als copromotor heb je zeker verdiend, maar ik vind het vooral erg leuk dat je deze plaats bij mijn promotie in neemt.
Annette, bedankt voor je enorme interesse in mijn onderzoek. Ik waardeer ook dat je steeds weer terug komt op planningen. Dat schept vaak veel duidelijkheid; iets dat een promovendus wel eens niet meer zo ziet.
De begeleider van Visio Het Loo Erf, Bill Wouters, ben ik veel dank verschuldigd. Allereerst hartelijk bedankt voor het beoordelen en scoren van de vele gezichtsvelden!
Dankwoord
233
Bedankt ook voor alle hulp bij alle organisatorische aspecten van dit onderzoek. Geniet lekker van je pensioen!
De leden van de leescommissie, prof.dr. A.C. Kooijman, mevr. prof.dr. B.C.P. Polak, mevr. dr. M.M. van Genderen, prof.dr. F. Hendrikse en mevr. prof.dr.ir. H.C.W. de Vet, wil ik bedanken voor het kritisch doorlezen en beoordelen van het proefschrift, voor de positieve reacties en aanvullende suggesties.
Naast de promotoren en copromotoren zijn er nog een aantal mensen nauw betrokken geweest bij het tot stand komen van de artikelen als co-auteur. Dirk Knol wil ik bedanken voor al zijn hulp bij de Rasch analyse. Hans Ket, bedankt voor alle hulp bij het opzoeken van de literatuur voor de systematische review. Zonder jouw hulp was de review niet zo volledig geweest. Claire Hengeveld, heel erg bedankt voor al het correctiewerk. Ik heb er veel van geleerd, mijn Engels is daardoor weer een stukje verbeterd.
Alle collega’s van de afdeling oogheelkunde wil ik hartelijk bedanken voor hun steun en belangstelling in de afgelopen vier jaar. Een promovendus kan niet zonder collega promovendi waarmee tegenslagen maar gelukkig ook de vele successen (met taart) gedeeld kunnen worden. Ruth, onze eerste co-productie begon bij hoofdstuk 6 van dit proefschrift. Samen ervaarden we de betekenis van ons nieuwe werkwoord “raschen”. Ook bedankt voor het doornemen van de vele titels en het beoordelen van de artikelen voor de systematische review. Naast de werkgerelateerde gesprekken was er gelukkig ook tijd om het over leuke dingen te hebben, zoals kinderen. Ik vind het erg fijn om jou naast me te hebben staan als paranimf. Jennifer, ik heb er bewondering voor hoe je omgaat met de vele moeilijke gesprekken die je tijdens jouw onderzoek heb gevoerd met retinoblastoom patiënten. Daarnaast was er gelukkig ook veel te lachen en hebben we een geweldig leuke week gehad in Lissabon. Tamara, de vele reizen met de trein van Amsterdam Zuid WTC naar Amersfoort waren samen met jou een stuk gezelliger. Ook jij hebt niet de eenvoudigste patiëntengroep voor je onderzoek en daarnaast zijn ze vaak moeilijk te vinden. Janna, heel veel succes in de komende jaren als promovendus en wellicht komen we elkaar nog tegen bij Visio of Sensis tijdens de uitvoering van je onderzoek Juliette, bedankt voor het bezoeken van mijn proefpersonen tijdens mijn zwangerschapsverlof. Ellen Althuizen, niet van de afdeling oogheelkunde maar toch een belangrijke collega promovendus, vele cursussen hebben we samen als AIO gevolgd. Het idee vanuit de beginnerscursus om met een collega AIO eens een kopje koffie te drinken en de AIO-beslommeringen te bespreken hebben we regelmatig ten uitvoer kunnen brengen in het ‘DE-café’. Een promotieonderzoek kan nooit worden uitgevoerd zonder ondersteunend personeel. Hans,
Dankwoord
234
Joke, Annie, Nanja, naast alle praktische hulp, bedankt voor de vele gezellige thee- en koffiemomenten. Dat is een welkome onderbreking bij de vele uren die we achter de computer zitten.
Verder wil ik alle collega’s van Visio Het Loo Erf bedanken voor hun steun de afgelopen jaren en de vele klusjes die voor mij zijn gedaan. Een aantal mensen wil ik speciaal bedanken. Dat zijn allereerst de (ex-) PDW-ers, Ingrid, Mirjam, Talitha en Anoeska die de vele vragenlijsten hebben afgenomen en diverse andere gegevens bij elkaar hebben gezocht. Het management van Visio Het Loo Erf wil ik bedanken voor het beschikbaar stellen van personeel voor het kunnen uitvoeren van dit onderzoek. Ik zie er naar uit om de resultaten van dit onderzoek te kunnen implementeren in de praktijk. Relinde, bedankt dat ik het schilderij “De Tallozen” voor de omslag van dit proefschrift mocht gebruiken. Mijn nieuwe collega’s van de afdeling Onderzoek en Innovatie van Visio wil ik bedanken voor hun steun en belangstelling. Ik vind het erg leuk dat ik nu echt deel kan uitmaken van de afdeling Onderzoek en Innovatie.
Op deze plaats wil ik natuurlijk ook mijn vrienden en familie bedanken die gedurende dit promotietraject volop belangstelling hebben getoond. Maartje, ook al zien we elkaar niet heel vaak, ik kan me geen betere vriendin wensen. Vera heel erg bedankt voor alle hulp bij het maken van de omslag van dit proefschrift. Het is echt heel erg mooi geworden. Connie en Esther, met jullie als zus en schoonzus is het altijd gezellig. Connie, ik vind het ontzettend leuk dat jij mijn paranimf wil zijn. Natuurlijk ligt de basis van alles wat ik tot nu toe heb gedaan bij mijn ouders. Papa en mama, heel erg bedankt dat jullie er altijd voor mij zijn en mij alle kansen hebben gegeven om dit te kunnen bereiken.
Allerliefste Michiel en allerliefste Dagmar, ik zou hier heel veel willen neerzetten om jullie te bedanken. Michiel zonder jouw steun was dit proefschrift nooit afgekomen. Als een echte projectleider wist je mij steeds te stimuleren en motiveren. Daarnaast heb je ook ontelbare malen computerproblemen opgelost. Dagmar, van jouw vrolijkheid, ondernemingslust en gezellige gebabbel blijf ik genieten. Ik ben trots op jullie maar eigenlijk het belangrijkste: jullie zijn de allerliefste van het hele universum en weer terug.…..

CCuurrrriiccuulluumm VViittaaee
Curriculum Vitae
236
Maaike Langelaan werd op 16 juli 1974 geboren in Ede. In 1992 behaalde zij het VWO−diploma aan het Hendrik Pierson College te Zetten. Vervolgens ging zij Gezondheidswetenschappen studeren aan de Universiteit Maastricht, met als afstudeerrichting Bewegingswetenschappen. In 1996 verbleef zij negen maanden in Sydney, Australië, waar zij bij de School of Exercise and Sport Sciences van de University of Sydney, een afstudeeronderzoek uitvoerde naar de mechanische energie tijdens roeien. In 1997 studeerde zij af, waarna ze in 1998 startte met de studie Ergotherapie aan de Hogeschool Zuyd te Heerlen. Zij liep stage bij Visio Het Loo Erf te Apeldoorn en Verpleeghuis Gelders Hof te Dieren. Haar afstudeerproject betrof een onderzoek naar de bruikbaarheid van het Orienterend Neuropsychologisch Onderzoek bij volwassenen met een visuele beperking. In 2001 studeerde zij af als ergotherapeut. Vanaf 2000 werkte zij als ergotherapeut bij Visio Het Loo Erf. In november 2002 startte zij met haar promotieonderzoek bij de afdeling Oogheelkunde van het VU Medisch Centrum naar voorspellende factoren voor kwaliteit van leven bij volwassenen met een visuele beperking na revalidatie. Tijdens deze periode volgde ze de postdoctorale opleiding tot Epidemioloog B. Sinds augustus 2006 werkt zij bij de afdeling Onderzoek en Innovatie van Visio als medewerker Toegepast Wetenschappelijk Onderzoek, waar zij zich bezig houdt met onderzoek bij volwassenen en ouderen met een visuele beperking.