The Quality of Life in China
35
The Quality of Life in China Xiaoling Shu Yifei Zhu Accepted: 6 October 2008 / Published online: 4 November 2008 Ó Springer Science+Business Media B.V. 2008 Abstract The Asia Barometer Survey of 2,000 respondents reveals that substantial majorities of the Chinese people experience feelings of happiness, enjoyment, and accomplishment. In fact, the proportion experiencing these indicators of a high quality of life are larger in China than in some more prosperous countries. Favorable historical comparison, sustained high economic growth, satisfaction with interpersonal life, and a high percentage of married people are among the explanations for China’s prevalence of subjective well-being. The Chinese people’s high levels of satisfaction with their inter- personal, material, and nonmaterial life domains, their positive assessments of their relative living standards, and their high rate of marriage are three direct positive influences on subjective well-being. Value priorities and other demographic characteristics also have indirect bearings on subjective well-being in China. Keywords Subjective well-being Á Happiness Á Enjoyment Á Accomplishment Á Life domains Á China For millennia, China has been the Center of East Asian civilization. In China, the teachings of Confucius and Mencius have served as its ethical system and political ideology. These teachings, known as Confucianism, have for more than 2,000 years profoundly affected how the people of China and other East Asians live and what they value for themselves and their country. Confucianism delineates the rights and duties of individuals relative to the power and authority of fathers, husbands, and political leaders (Bell 2006; Bell et al 1995; Compton 2000; Pye 1992; Tu 1996). As the birthplace of Confucianism, China constitutes the core state of the Confucian Asian civilization zone, which stretches northeast to Korea and Japan and southwest to Singapore and Vietnam. X. Shu (&) Á Y. Zhu (&) Department of Sociology, University of California Davis, Davis, CA 95616, USA e-mail: [email protected] Y. Zhu e-mail: [email protected] 123 Soc Indic Res (2009) 92:191–225 DOI 10.1007/s11205-008-9350-4
Transcript of The Quality of Life in China

The Quality of Life in China
Xiaoling Shu Æ Yifei Zhu
Accepted: 6 October 2008 / Published online: 4 November 2008� Springer Science+Business Media B.V. 2008
Abstract The Asia Barometer Survey of 2,000 respondents reveals that substantial
majorities of the Chinese people experience feelings of happiness, enjoyment, and
accomplishment. In fact, the proportion experiencing these indicators of a high quality of
life are larger in China than in some more prosperous countries. Favorable historical
comparison, sustained high economic growth, satisfaction with interpersonal life, and a
high percentage of married people are among the explanations for China’s prevalence of
subjective well-being. The Chinese people’s high levels of satisfaction with their inter-
personal, material, and nonmaterial life domains, their positive assessments of their relative
living standards, and their high rate of marriage are three direct positive influences on
subjective well-being. Value priorities and other demographic characteristics also have
indirect bearings on subjective well-being in China.
Keywords Subjective well-being � Happiness � Enjoyment � Accomplishment �Life domains � China
For millennia, China has been the Center of East Asian civilization. In China, the teachings
of Confucius and Mencius have served as its ethical system and political ideology. These
teachings, known as Confucianism, have for more than 2,000 years profoundly affected
how the people of China and other East Asians live and what they value for themselves and
their country. Confucianism delineates the rights and duties of individuals relative to the
power and authority of fathers, husbands, and political leaders (Bell 2006; Bell et al 1995;
Compton 2000; Pye 1992; Tu 1996). As the birthplace of Confucianism, China constitutes
the core state of the Confucian Asian civilization zone, which stretches northeast to Korea
and Japan and southwest to Singapore and Vietnam.
X. Shu (&) � Y. Zhu (&)Department of Sociology, University of California Davis, Davis, CA 95616, USAe-mail: [email protected]
Y. Zhue-mail: [email protected]
123
Soc Indic Res (2009) 92:191–225DOI 10.1007/s11205-008-9350-4

In recent years, Confucianism has been interpreted as the ideological and cultural
engine powering economic growth. According to this thesis, Confucianism embodies a
belief system that values and demands hard work, frugality, education, and the willing
sacrifice of the individual for the benefit of collective good. The East Asian economic
miracle is, therefore, seen as a direct result of the moral regeneration of Confucianism (Tu
1996). The recent growth of the Chinese economy has also been attributed to Confucian
tradition, at least partially. Emphasizing authority, hierarchical order, and discipline,
Confucianism is widely believed to have enabled the Chinese government to mobilize the
society and facilitate the achievement of economic development (Peng 1996).
Against this backdrop of a long Confucian tradition, the Chinese society has since the
late 1970s experienced some of the most rapid advances in human history. From the start
of the reform in the later 1970s to 2002, China’s GDP enjoyed an average annual growth
rate of 9.3%, and the total GDP grew more than eightfold. Per capita GDP grew more than
six times, and household consumption grew more than five times (China National Bureau
of Statistics 2003). In the past 30 years, China has lifted more than 400 million Chinese
people out of poverty (Ravallion and Chen 2004). The consumption structure of both urban
and rural residents has experienced substantial change, with the relative expenses on food
and clothing declining (China National Bureau of Statistics 2003). Life expectancy has also
increased rapidly (China National Bureau of Statistics 2003). China’s Human Develop-
ment Index Ranking increased 20% since 1990 (United Nations Development Program
2005).
China actively partakes in globalization and is increasingly engaged in international
trade and cultural exchanges. Its total imports and exports grew more than 30-fold, and
foreign direct investment increased more than 12-fold (China National Bureau of Statistics
2003) from 1978 to 2002. China received more than 36 million international tourists in
2002, and more than 16 million of its 1.3 billion residents traveled to other countries that
the same year (China National Bureau of Statistics 2003).
However, much of China’s phenomenal economic advance has yet to be translated into
social progress. The Communist state continues its one-party rule and controls all of the
vital institutions (all levels of government, all levels of legislature, the military, the courts,
and police) and major industries (utilities, telecommunications, and banking), despite
market reforms. Economic reforms also led to massive layoffs from state-owned enter-
prises. From 70 to 80% of rural households no longer have medical insurance after China’s
socialized health care system was dismantled (United Nations Development Program
2005). Income inequalities, both between individual citizens and between rural and urban
regions, have been on the rise. The uneven economic development and globalization also
resulted in regional inequality within China, with the coastal regions enjoying a much
higher level of development than the hinterland (United Nations Development Program
2005).
How have these drastic changes, particularly in Chinese economy and society during the
past three decades, affected the way the Chinese people live and what they value for
themselves and their country? How have those changes affected the quality of life the
Chinese people experience in their private and public lives? Have these economic gains
enabled them to live lives of subjective well-being, evidenced by feelings of happiness,
enjoyment, and accomplishment? What factors directly and indirectly influence the
Chinese people’s perceptions and evaluations of the quality of their lives? To answer these
questions, we start this paper with a brief introduction of China as a place to live; we
describe its geography, climate, population, economy, politics, culture, public health, and
environment. We next introduce a hypothesized conceptual model that depicts the ways in
192 X. Shu, Y. Zhu
123

which lifestyles, value priorities and satisfaction with various life domains influence
perceived quality of life, both directly and indirectly. We then analyze data from the 2006
AsiaBarometer Survey to examine subjective well-being, measured as perceived quality of
life in terms of happiness, enjoyment, and achievement, among Chinese people. We first
analyze the various lifestyles the Chinese lead and the effects demographic characteristics
have on their lifestyles. Next we ascertain the types of resources and activities that they
value most for their lives and how demographic characteristics affect their value priorities.
Afterwards, we analyze assessments of life quality as a whole and of its specific compo-
nents, i.e. happiness, enjoyment, and accomplishment. These analyses are followed by
analyses of how demographics, value priorities, and satisfaction with various life domains
affect the Chinese’s assessments of overall life quality. On the basis of all these analyses,
we finally construct a model that specifies both direct and indirect influences on perceived
quality of life in China.
1 Life in China
1.1 Geography and Climate
The territory of China contains a large variety of landscapes. In the East, there are
extensive and densely populated plains, while Southern China is dominated by hills and
low mountain ranges. In the West are major mountain ranges, high plateaus, and deserts.
The climate of China also varies greatly. Northern China has fairly hot summers and
extremely cold winters. Central China has a temperate continental climate. Southern China
has a subtropical climate and is very hot in the summer and mild in the winter.
1.2 Population
On this diverse land resides a population of more than 1.3 billion, the largest national
population in the world (China National Bureau of Statistics 2007). Sixty-five percent of
the Chinese population is concentrated in Eastern and Middle China, which constitute only
20% of the country’s land area. Western provinces account for more than 70% of China’s
land but less than 30% of its population. Overall, 56% of the Chinese are rural residents,
while 44% are urban dwellers (China National Bureau of Statistics 2007).
1.3 Economy
Since the late 1970s, China’s economy has been reforming from a socialist structure to a
market-oriented economy. Notable reforms include private contracts of farmlands,
allowances for private and other new forms of firms, relaxed prices, increased authority of
managers, and policies and practices to promote foreign investment. As a result, China’s
GDP increased six-fold since 1978, with an average annual GDP growth rate of 9.4% for
the past 25 years (United Nations Development Program 2005). With the rapid economic
development, there has been a significant rise in the Chinese people’s objective standard of
living. The percentage of the population in poverty has been reduced to 10%. The per-
centage of literate citizens increased from 20% in 1950 to more than 90% in 2004 (United
Nations Development Program 2005).
The Quality of Life in China 193
123

1.4 Politics
China is a one-party state ruled by the Chinese Communist Party (CCP). Compared to the
strict control prior to the mid-1970s, the political climate has become more open. Openly
contested elections are held at the village and town levels. Despite these changes, the CCP
retains effective control and continues to impose heavy restrictions on the press, Internet
use, freedom of assembly, freedom of reproductive rights, and freedom of religion. There
is also widespread corruption among government leadership.
1.5 Education
China operates a 9-year compulsory education in 90% of its populated areas. As of 2002,
the literacy rate for the population aged 15 and older was 91%, with the rate for males at
95% and females 87%; the literacy rate among 15–24 year olds was 99% in 2000 (Ross
2004). For non-compulsory education, China adopts a shared-cost mechanism, charging
tuition at a certain percentage of the cost. This policy has posed considerable difficulties
for students from low-income families and regions.
1.6 Public Health
The health of the Chinese population has improved rapidly as a result of better nutrition.
Life expectancy increased from about 41 years in 1950 to 69 years in 1998 to 73 years in
2006. Infant mortality declined more than 40% from 37 per thousand in 1990 to about 20
per thousand in 2006 (World Health Statistics 2008). However, many of the free public
health services provided to the rural population have disappeared in the last 20 years, and
health care has become largely a private fee-for-service industry during China’s market
transition.
1.7 Environment
Despite fairly stringent regulations, the environment of China continues to deteriorate.
While seeking economic development, local communities frequently disregarded envi-
ronment regulations (Ma and Ortalano 2000). With rapid industrialization, air quality in
large cities has rapidly deteriorated. As a result, 16 of the 20 most polluted cities in the
world are Chinese (World Bank and China State Environmental Protection Administration
2007). Due to expansion of deserts and poor agricultural practices, Northern China has also
suffered from dust storms each spring. In addition, China faces a severe water crisis as
increased industrial production has created considerable water pollution in many of the
country’s rivers. The drinking water of 300 million peasants is unsafe, and water quality in
one fifth of the cities is not up to standard. In addition, 400 out of 600 cities suffer from a
water shortage (Ma 2004).
2 The Conceptual Model
How do individual Chinese citizens appraise their quality of life? What forces have the
most influence on their experiences of well-being, evidenced by happiness, enjoyment, and
achievement? To answer these questions, we consider demographic characteristics, life-
style types, value priorities, and satisfaction levels with specific life domains. We take into
194 X. Shu, Y. Zhu
123

account the dynamics that exist between these forces, noting that satisfaction levels depend
on value priorities and lifestyles, which are, in turn, influenced by demographic charac-
teristics. We also examine how a Chinese person’s membership in a particular population
group affects his or her chances of experiencing a sense of wellbeing. Figure 1 shows the
interrelationships among demographic characteristics, lifestyles, value priorities, satisfac-
tion with life domains, and subjective well-being. It also presents the types and measures of
demographic characteristics, lifestyles, value priorities, life domain satisfaction, and sub-
jective well-being. We organize our analysis based on this conceptual model describing a
series of direct and indirect influences on subjective well-being.
We analyze the four sets of variables reported in Fig. 1 as influences on subjective well-
being, which we measure in terms of happiness, enjoyment, and accomplishment. These
four variable sets influencing well-being are: (1) the demographic characteristics of gender,
age, educational attainment, marital status, household income, employment, and urban/
rural residency; (2) value priorities, which refer to the resources and activities the Chinese
consider to be the most important to their private and public lives; (3) lifestyles, which
refer to the various ways people spend their time and money and their interactions with
other people; and (4) satisfaction with 16 specific life domains encompassing personal life,
interpersonal life, material life, nonmaterial life, and public life.
3 Sampling and Respondents
We use data from the 2006 Asia Barometer Survey (ABS hereafter), a national sample of
2,000 males and females aged 20–69. The survey was carried out by the Chinese Academy
of Social Science Research Center in the summer of 2006. It used a three-stage stratified
sampling methodology. In the first stage, China was stratified into five population sizes and
three regions. In the second stage, 100 primary sampling units were chosen randomly from
Demographic Characteristics: Gender Age Education Marital status Household income Employment Urban/rural resident
Value Priorities: Being healthy Having a comfortable home Having enough to eat Having access to medical care Raising children
Lifestyles: Household related Access to resources Religiosity Participation in elections Trusting others Self-rated living standard Globalism and localism
Life Domain Satisfaction: Personal life Interpersonal life Material life Nonmaterial life Public life Subjective wellbeing:
Happiness Enjoyment Accomplishment
Fig. 1 A conceptual model of influences on happiness, enjoyment, accomplishment and overall subjectivewell-being
The Quality of Life in China 195
123

the city lists in the China Population Statistics Yearbook 2005, and two sampling units
(neighborhoods or villages) were selected from each of these units. In the last stage, ten
individuals were systematically chosen at equal intervals from the resident registration
ledger at each neighborhood or village. Then face-to-face interviews were conducted to
gather information. Appendix Table A1 describes the variables and their measurements
used in our analysis.
We compared data from the 2006 ABS with data from two recent national surveys and
the 2000 Census, and present demographic characteristics of the respondents in Appendix
Table A2. The table shows that the ABS respondents have similar demographic charac-
teristics with the two other national surveys. The respondents from all three national
surveys are slightly better educated than the census population and have a higher per-
centage residing in urban areas, however.
Regarding gender, 49% of the respondents are female and 51%, male. Respondents’
average age is 41. The largest age group, those 30–39, covers 29% of the respondents,
while the smallest age cohort, respondents aged 60–69, accounts for 10% of the sample.
Thirteen percent of respondents have a bachelor’s degree or higher, 13%, an associate
degree, 24%, a senior high education, and the rest, 50%, a junior high education or lower.
Seventy-nine percent of respondents are married, while 17% are single. The rest are either
divorced/separated (2%) or widowed (also 2%). When respondents are divided into three
income groups, 50% fall in the low income group (an annual household income of
20,000 RMB yuan or less), 30% are in the medium income range (an annual household
income of 20,000–40,000 yuan), and 20%, are in the high income category (an annual
household income of more than 40,000 yuan per year). Ten percent of the respondents are
unemployed, and the respondents are evenly divided between urban and rural residents
(Table 1).
4 Statistical Methods
To estimate the magnitude and significance of the hypothesized causal connections
described in Fig. 1 between various variable sets, we analyze either a series of OLS
regression or Logistic regression models, depending on whether the dependent variable is
continuous or dichotomous. Because multiple independent variables linking to the
dependent variables by arrows are simultaneously included in the statistical analyses in
these models, the estimated coefficients are considered ‘‘net’’ influences of these variables
after controlling for the effects of other variables in these models. Figure 1 helps plan the
analysis and represents the causal connections that are predicted by our hypothesis. Fol-
lowing our completion of a series of OLS and Logistic regressions will be another diagram
that depicts the relationships actually found. This second diagram will summarize complex
scientific ideas in terms of statistical relationships.
To report the OLS and Logistic regression results, we present partial regression coef-
ficients for OLS regression and odds-ratios for Logistic regression. For a continuous
dependent variable, a partial regression coefficient indicates the predicted change in the
dependent variable per each unit increase in the independent variable after controlling for
the effects of all the other variables in the model. For a dichotomous dependent variable, an
odds-ratio for a given independent variable represents the factor by which the odds change
for a one-unit change in the independent variable. An odds ratio[1 means the independent
variable increases the probability of event. If an odds ratio = 1, the independent variable
has no effect. If an odds ratio is smaller than 1, then the independent variable decreases the
196 X. Shu, Y. Zhu
123

odds. For instance, if odds ratio = 3, then we may say that when the independent variable
increases one unit, the odds that the dependent = 1 increase by a factor of 3, when other
variables are controlled. We report these ‘‘net’’ effects of independent variables in our
analytical tables for three reasons: (1) to rule out other relationships and find true asso-
ciations, (2) to connect our findings with the existing literature in which the predictors of
subjective well-being are always ‘‘net’’ effects with other variables controlled for, and (3)
to summarize our findings in a conceptual model as described by Fig. 1.
5 Lifestyles
5.1 Family Life
Confucianism emphasizes family as the most important institution of human life. To
examine the nature of Chinese family life, the ABS asked four questions concerning
household composition, home ownership, and the frequency of eating breakfast and dinner
at home. As Table 2 indicates, the average Chinese person lives in a two-generation
Table 1 Descriptive statistics for demographic variables
Percentage N
Gender
Female respondents 49.3 2000
Male respondents 50.7 2000
Age
Cohort 20–29 20.8 2000
Cohort 30–39 29.2 2000
Cohort 40–49 22.8 2000
Cohort 50–59 17.5 2000
Cohort 60–69 9.7 2000
Educational attainment
Primary school or below 18.2 2000
Junior high 31.6 2000
Senior high/vocational school 24.4 2000
Associate’s degree 13.3 2000
Bachelor’s degree and Graduate degree 12.5 2000
Marital status
Single 16.7 1988
Married 79.3 1988
Divorced and Widowed 4.0 1988
Household Income
Low income households: less than 20,000 yuan 49.2 1990
Median income households: 20,000–40,000 yuan 28.9 1990
High income households: 40,000 yuan and above 21.9 1990
Employment
Employed 93.0 2000
Unemployed 7.0 2000
The Quality of Life in China 197
123

Table 2 Descriptive statistics for lifestyle variables
Means/percentages N
Family related
Household Size 3.74 2000
Home ownership 77.5% 1992
Eating breakfast at home 81.0% 2000
Eating dinner at home 92.1% 2000
Access to resources
Access to no. of utilities (public water supply; electricity; LPGor piped gas; fixed-line phone; mobile phone; facsimile; cable tv)
4.91 2000
Access to communication technologies
Frequency viewing Internet webpages by computers
Never 59.0% 1968
Seldom 11.7% 1968
Several times a month 5.6% 1968
Several times a week 8.7% 1968
Almost everyday 14.9% 1968
Frequency reading or writing emails by computers 1.63
Never 70.5% 1959
Seldom 12.2% 1959
Several times a month 6.1% 1959
Several times a week 6.5% 1959
Almost everyday 4.7% 1959
Frequency using mobile phone to send and receive messages 2.77 1981
Never 39.7% 1981
Seldom 14.1% 1981
Several times a month 4.9% 1981
Several times a week 11.9% 1981
Almost everyday 29.4% 1981
Religious behavior
Being religious 19.9% 1993
Christian 4.1% 1993
Muslim 0.7% 1993
Buddhist 13.4% 1993
Frequency pray 1.56 1996
Political involvement
Vote in national elections 28.5% 1991
Vote in local elections 43.3% 1989
Globalism and localism
Being able to speak English 6.3% 1997
Overseas connections 44.1% 2000
Identify oneself as Chinese 84.4% 1990
Being proud to be Chinese 88.6% 1991
Being able to memorize the national anthem 89.9% 2000
Indentify oneself as Asian 43.5% 1998
198 X. Shu, Y. Zhu
123

household with 3.7 members. More than three out of four Chinese people (78%) own the
place in which they live. Four out of five (81%) eat breakfast at home, and nine out of ten
(92%) eat dinner at home.
How does each demographic characteristic affect the way the Chinese live their lives?
To address this question, we estimated the independent effects of seven demographic
variables on each of the aforementioned four indicators of family-related lifestyles by the
techniques of ordinary least square and logit regression. Table 3 reports results of these
multivariate analyses. We use B to represent regression coefficients for OLS regressions
and Exp(B) to represent odds-ratios for logit regressions. The coefficients reported in this
table show that marital status significantly affects all four indicators of family-related
lifestyles. Compared with single people, the married live in larger households (?.32); are
more likely to be homeowners (the odds-ratio increases by a factor of 2.0); and have
breakfast and dinner at home more often (the odds-ratios change by factors of 1.83 and
2.32 respectively).
Education also significantly influences family-related lifestyles. Specifically, greater
education is negatively associated with household size. Compared with a primary school
education; a junior high school education decreases household size by .61; a senior-high
education, by .96; and a college education, by more than 1.0. In terms of having meals at
home, those with a senior high school education and more are significantly less likely to
have breakfast at home (odds-ratios decrease by a factor of .40 or more), perhaps partly due
to their busy work schedule. Somewhat surprising is the finding that those with a college
education are no more likely than those with a primary education to be homeowners. This
may be due to the fact that when the housing market first opened, state enterprises and
institutions heavily subsidized housing purchases of their employees. In particular, these
work units considered the seniority of their employees and granted those with longer
seniority favorable prices in purchasing apartments previously owned by these work units.
In addition, foreign companies, joint ventures, and private companies usually do not
provide housing subsidies. Thus, it was work sector and job seniority, not educational level
or technical expertise, that determined both a person’s access to and the price of housing in
the early housing market that was heavily subsidized by work units. Only in more recent
years has the housing market become fully commercialized, allowing income and
knowledge to play an important role in homeownership (Logan 2002).
As expected, income is positively associated with homeownership. High-income people
are more likely to own their home than low-income people. Age is also an important
predictor on three of the four measures of family-related lifestyles: household size,
homeownership, and having breakfast at home. Compared with those in their 20s, those 40
and older have fewer household members, are more likely to be homeowners, and are more
likely to eat breakfast at home. In particular, the difference between those in their 60s and
Table 2 continued
Means/percentages N
Other
Trusting others 63.9% 1994
Self-rated standard of living
High 10.7% 1998
Medium 68.1% 1998
Low 21.2% 1998
The Quality of Life in China 199
123

Ta
ble
3O
LS
Reg
ress
ion
coef
fici
ents
and
odds-
rati
os
of
logis
tic
regre
ssio
nof
life
style
var
iable
sby
popula
tion
gro
ups
Fam
ily
rela
ted
Acc
ess
tore
sourc
esR
elig
iosi
tyP
oli
tica
lin
volv
emen
t
House
hold
size
(B)
Hom
e
ow
ner
(Exp(B
))
Bre
akfa
st
athom
e
(Exp(B
))
Din
ner
at
hom
e
(Exp(B
))
No.
of
uti
liti
es
(B)
Inte
rnet
(B)
Em
ail
(B)
Cel
lulo
us
phone
(B)
Rel
igio
us
(Exp(B
))
Pra
y(B
)V
ote
nat
ional
(Exp(B
))
Vote
loca
l
(Exp(B
))
Mal
e,ag
es20–29,
pri
mar
ysc
hool
educa
tion,
single
,lo
wfa
mil
yin
com
e,not
unem
plo
yed
,
rura
lre
siden
t
4.5
5***
1.0
63.4
9***
5.1
3***
3.6
0***
2.0
3***
1.5
9***
2.6
5***
0.6
3*
1.9
0***
0.0
7***
0.4
0
Gen
der
Fem
ale
-0.1
5*
1.0
81.1
01.2
00.0
8-
0.1
4***
-0.0
8*
-0.0
71.3
2*
0.1
7***
0.7
9*
0.7
6***
Age
cohort
30–39
-0.2
7*
1.0
41.1
51.6
20.0
8-
0.2
7***
-0.1
8**
-0.2
7**
0.9
00.0
01.6
5**
1.2
7
40–49
-0.3
3**
1.7
9**
1.8
2***
1.5
50.0
3-
0.6
4***
-0.3
5***
-0.8
0***
0.8
10.0
42.6
4***
1.7
5***
50–59
-0.4
2***
1.7
7**
2.6
1***
1.8
40.0
0-
0.8
1***
-0.5
5***
-1.3
2***
0.5
9*
-0.0
13.0
3***
1.6
3**
60–69
-0.7
***
2.9
6***
2.7
3***
2.0
7-
0.0
1-
0.9
8***
-0.5
7***
-1.5
5***
0.5
3*
-0.1
12.7
4***
2.1
6***
Educa
tional
att
ain
men
t
Junio
rhig
h-
0.6
1***
1.5
1*
0.8
90.6
60.5
5***
-0.0
3-
0.0
90.4
2***
0.3
5***
-0.5
2***
1.5
1**
1.3
7*
Sen
ior
hig
h/v
oca
tional
school
-0.9
6***
1.8
***
0.5
1***
0.8
10.9
***
0.5
8***
0.1
8**
1.0
9***
0.2
1***
-0.5
9***
1.7
9***
1.2
4
Ass
oci
ate’
sdeg
ree
-1.0
5***
1.9
1**
0.4
***
0.9
70.8
5***
1.3
6***
0.9
***
1.6
***
0.2
1***
-0.6
1***
2.3
5***
0.9
3
Bac
hel
or’
san
dgra
duat
edeg
ree
-1.5
6***
1.1
40.5
1*
0.5
60.8
6***
1.7
8***
1.4
2***
1.7
6***
0.2
3***
-0.4
6***
3.0
6***
0.9
2
Mari
tal
statu
s
Mar
ried
0.3
2**
2.0
0***
1.8
3***
2.3
2***
0.0
6-
0.4
6***
-0.2
1***
-0.4
9***
0.9
7-
0.0
21.5
3*
1.9
1***
Div
orc
ed/s
epar
ated
/wid
ow
ed-
0.3
01.0
71.3
05.1
4*
-0.0
1-
0.4
**
-0.1
8-
0.4
2*
1.8
60.2
41.5
22.0
4*
House
hold
inco
me
Med
ium
:20,0
00–40,0
00
Yuan
0.4
9***
1.5
1***
0.9
61.2
00.4
0***
0.2
8***
0.1
3**
0.3
8***
1.3
5*
0.1
2*
1.5
1***
1.2
7*
Hig
h:
40,0
00
and
Yuan
and
above
0.4
7***
2.6
4***
1.0
11.4
00.7
3***
0.7
1***
0.5
1***
0.5
5***
1.4
3*
0.1
7**
1.4
2**
1.4
3**
Unem
plo
yed
0.1
21.3
50.9
71.1
3-
0.1
30.2
6**
0.0
6-
0.0
91.1
80.0
80.9
60.6
1**
Urb
an
resi
den
t-
0.3
4***
0.4
7***
0.7
0**
0.7
80.6
7***
0.3
2***
0.1
3***
0.2
9***
0.9
5-
0.1
1*
1.0
70.4
6***
R2
0.1
10.0
70.0
80.0
30.2
90.5
20.4
50.4
70.0
50.0
60.0
60.0
9
200 X. Shu, Y. Zhu
123

Ta
ble
3co
nti
nued
Glo
bal
ism
and
loca
lism
Sel
f-ra
ted
stan
dar
dof
livin
gO
ther
Spea
k
Engli
sha
(Exp(B
))
Over
sea
(B)
Iden
tify
as
Chin
ese
(Exp(B
))
Pro
ud
tobe
Chin
ese
(Exp(B
))
Mem
ori
ze
anth
em
(Exp(B
))
Iden
tify
as
Asi
an
(Exp(B
))
Low
(Exp(B
))
Med
ium
(Exp(B
))
Hig
h
(Exp(B
))
Tru
stin
g
oth
ers
(Exp(B
))
Mal
e,ag
es20–29,
pri
mar
ysc
hool
educa
tion,
single
,lo
wfa
mil
yin
com
e,
not
unem
plo
yed
,ru
ral
resi
den
t
0.0
00.3
4***
2.3
1***
10.3
9***
6.0
0***
0.3
9***
0.6
71.5
9*
0.0
2***
1.4
1
Gen
der
Fem
ale
1.3
50.0
00.8
31.3
3*
0.8
10.8
90.8
11.2
00.9
20.8
7
Age
cohort
30–39
0.3
3***
0.0
51.8
9***
0.7
80.7
30.8
41.4
10.8
40.8
71.4
3*
40–49
0.4
0*
0.0
41.8
8**
1.4
30.4
8*
1.1
81.2
80.8
70.9
61.9
6***
50–59
0.1
1***
-0.0
71.5
01.1
30.8
61.2
31.5
80.6
4*
1.4
21.7
3***
60–69
0.0
9*
-0.0
63.3
3***
1.3
30.5
51.2
40.9
30.9
31.4
31.7
3**
Educa
tional
att
ain
men
t
Junio
rhig
h–
0.0
51.2
10.6
44.1
3***
1.4
3**
0.5
4***
1.7
3***
0.7
60.8
7
Sen
ior
hig
h/v
oca
tional
school
3.6
10.0
91.4
80.5
8*
10.6
7***
2.0
9***
0.4
2***
1.7
6***
1.0
90.9
2
Ass
oci
ate’
sdeg
ree
16.5
9***
0.1
9***
1.7
5*
0.8
415.8
6***
2.4
3***
0.3
8***
1.7
9**
1.2
51.8
3***
Bac
hel
or’
san
dgra
duat
edeg
ree
77.2
2***
0.3
6***
1.7
90.7
051.5
2***
2.6
7***
0.5
4*
1.5
3*
1.3
42.3
2***
Mari
tal
statu
s
Mar
ried
0.7
2-
0.1
7***
0.9
31.2
20.5
21.2
70.7
40.9
72.0
2*
0.8
2
Div
orc
ed/s
epar
ated
/wid
ow
ed2.2
2-
0.0
80.6
80.7
90.3
81.2
41.9
9*
0.4
6**
1.5
90.9
1
House
hold
inco
me
Med
ium
:20,0
00–40,0
00
Yuan
1.4
10.0
9*
1.2
70.7
81.2
00.9
60.3
3***
1.6
4***
4.7
6***
1.0
9
Hig
h:
40,0
00
and
Yuan
and
above
2.9
9***
0.3
9***
1.7
7***
0.9
71.0
00.7
90.0
8***
1.0
518.2
9***
0.9
7
Unem
plo
yed
0.7
0-
0.1
10.6
80.6
50.5
0**
0.8
42.0
4***
0.5
6***
0.6
40.9
1
The Quality of Life in China 201
123

Ta
ble
3co
nti
nued
Glo
bal
ism
and
loca
lism
Sel
f-ra
ted
stan
dar
dof
livin
gO
ther
Spea
k
Engli
sha
(Exp(B
))
Over
sea
(B)
Iden
tify
as Chin
ese
(Exp(B
))
Pro
ud
tobe
Chin
ese
(Exp(B
))
Mem
ori
ze
anth
em
(Exp(B
))
Iden
tify
as Asi
an
(Exp(B
))
Low
(Exp(B
))
Med
ium
(Exp(B
))
Hig
h
(Exp(B
))
Tru
stin
g
oth
ers
(Exp(B
))
Urb
an
resi
den
t1.1
30.0
41.3
20.7
92.0
1***
1.0
81.7
8***
0.8
50.4
9***
0.8
8
R2
0.1
70.1
30.0
30.0
20.1
40.0
30.1
30.0
40.1
10.0
3
Note
s:In
the
logis
tic
model
for
‘‘S
PE
AK
EN
GL
ISH
’’,‘‘
Junio
rhig
h’’
isuse
das
the
om
itte
dca
tegory
for
Educa
tional
atta
inm
ent.
The
log-o
dds
of
the
logis
tic
regre
ssio
nco
effi
cien
tfo
r‘‘
Pri
mar
y’’
is.0
0
and
not
signifi
cant.
Itis
not
show
nin
the
table
*P
\.0
5,
**
P\
.01,
***
P\
.001
202 X. Shu, Y. Zhu
123

those in their 20s is the largest. Compared with those in their 20s, the 60-year-olds live in
households that are smaller by almost one person (.7), and the odds-ratios of being a
homeowner and having breakfast at home are nearly three-fold greater (2.96 and 2.73
respectively).
Lastly, the family life of urban residents differs from that of rural residents in size,
homeownership, and eating habits. Urban residents live in smaller households and are less
likely to be homeowners with the odds-ratio being only 47% of those of rural residents.
Moreover, the odds-ratio for urbanites to have breakfast at home is only 70% of rural
residents.
5.2 Access to Modern Utilities and Digital Technologies
To what extent do the Chinese people live a modern life? To address this question, the
ABS first asked respondents whether their households were provided with seven utility
services, including water supply, electricity, LPG or piped gas, fixed-line phone, mobile
phone, facsimile, and cable TV. Of these seven utilities surveyed, the Chinese people as a
whole averaged fewer than five (4.9). Nearly three out of five (57%) households have
access to electricity, a public water system, LPG gas, and a fixed phone line. Almost every
household has access to at least one of these four modern utility services (see Table 2).
When asked about access to the Internet, e-mail, and cellular phone service, majorities
reported not having access to these digital telecommunication technologies. More than half
of the Chinese population ‘‘seldom’’ or ‘‘never’’: (1) viewed Internet web pages by
computers (71%); (2) read or wrote emails by computers (83%); or (3) read or wrote
messages by mobile phones (54%). Among the three telecommunication technologies, cell
messaging is the most widely used with 30% of respondents reporting messaging via
mobile phone almost every day, as compared to 15% for the Internet and 5% for email (see
Table 2).
Table 3 shows the effects of demographic characteristics on access to modern utilities
and digital technologies. Education is positively associated with access to modern utility
services. The college educated use the Internet, e-mail, and cellular phones more than do
those with an associate degree, while the latter use these telecommunication technologies
more often than do high school graduates. Higher income and urban residency are asso-
ciated with greater access both in terms of utilities and the modern telecommunication
technologies. Age is, however, negatively associated with the use of Internet, e-mail, and
cellular phone but has no effect on the number of modern utilities accessed. Married people
are less likely than single people to use the Internet, e-mail, and cellular phone, and women
use the Internet and e-mail less than do men.
5.3 Religious and Spiritual Life
The ABS asked respondents about their religious affiliations and their level of spiritual
activity as measured by praying and meditating. Only 20% of the Chinese respondents
reported a religious affiliation with 13% being Buddhists, 4% Christians, and 1% Muslims.
A much smaller minority of about 10% reported praying daily (7%) or weekly (3%). Nine
out of ten Chinese prayed ‘‘never’’ (68%) or only ‘‘on special occasions’’ (22%). Among
those who are more religious are females, the least educated, rural residents, and those with
a high household income. While higher education and urban living tends to detract from
religious life, more income tends to contribute to it.
The Quality of Life in China 203
123

5.4 Political Involvement
In China, popular elections take place only at the village level and local areas in cities.
Only these elected local representatives can then participate in the elections at the next
level. Members of the national legislature, the People’s Congress, are thus elected through
a series of indirect elections. As a result, more than one-third of respondents reported no
experience with either national or local elections. Men, the married, older people, and those
with higher household incomes are more involved in national elections than are their
counterparts. Education is positively associated with voting on the national level. Com-
pared with an elementary school education, a college education increases the odds-ratio of
voting nationally by more than three folds (Exp(B) = 3.06). The unemployed and urban
residents are less likely to vote locally than their counterparts; their odds-ratios to voting
are reduced to 61% and 46% respectively.
5.5 National Identify and Global Life
Chinese identity remains very strong with 84% of respondents identifying themselves as
Chinese, 89% reporting pride in their Chinese identity, and 90% reporting being able to
recite the Chinese national anthem from memory. More than two out of five (44%) also
identify themselves as Asian. In terms of connections to the outside world, 44% of
respondents reported having some form of interaction with overseas people or institutions,
and 4% reported being able to speak English. Older people are less likely to be able to
speak English and are more likely to identify themselves as Chinese. More education and
income are associated with more overseas connections and greater ability to speak English.
More education also results in a higher likelihood of being able to recite the Chinese
national anthem and a greater identification with Asia. Gender, marital status, employment
status, and community size are not significantly associated with either global or local
identity.
5.6 Standard of Living
When asked to rate their own standard of living, more than two-thirds (68%) of respon-
dents rated it as ‘‘average.’’ About one in ten (11%) rated it as ‘‘high’’ or ‘‘very high’’ while
twice as many (21%) rated it ‘‘low’’ and ‘‘very low.’’ As expected, education and income
are associated positively with high ratings of standard of living. The unemployed are more
likely to report a low standard of living. Oddly, urban residents were more likely than rural
residents to report both a high and a low standard of living. Why would more urban
residents than rural residents place themselves in the low category? We see two possible
explanations for this surprising finding. The first reason is that the poor and rich segments
of the Chinese population actually are concentrated in urban areas, an objective fact. The
second reason is that the poor in rural areas compare themselves only with their peers who
are equally poor, while the poor in urban areas have rich neighbors to whom they compare
themselves, creating a subjective difference.
5.7 Trusting Others
To what extent do the Chinese people trust each other? Nearly two-thirds (64%) expressed
trust in other people. Of the six demographic variables, Table 3 shows that only two, age
and education, have significant relationships with trust. Those 40 and older trust people
204 X. Shu, Y. Zhu
123

more than those in their 30s, while those in their 30s trust others more than those in their
20s. Those with some college education trust others more than people without college
education; college education increases the odds-ratio of trusting others to close to two-fold.
6 Value Priorities
What do the Chinese value most for themselves and their country? To explore this
question, the ABS asked respondents to choose their five most important life concerns from
a list of 25. Table 4 lists, in descending order, the percentages of the Chinese who chose
each of the 25 life concerns as one of their five most important. Health tops the list, being
chosen by 84% of respondents. It is followed by having a comfortable home (54%) and
having enough to eat (46%). Having access to good medical care (36%), raising children
(33%), and spending time with family (30%) are among what about one-third of the
Chinese considered important. Among the concerns that the Chinese people value least are
freedom of expression and association (3%), being famous (3%), appreciating art and
culture (2%), being devout (2%), and dressing up (2%). The fact that all of the top three
value—being healthy, having a comfortable home, and having enough to eat—concern the
Table 4 Value priorities by prevalence
Rank Value priorities Percentage
1 Being healthy 84
2 Having a comfortable home 54
3 Having enough to eat 46
4 Having access to good medical care 36
5 Raising children 33
6 Spending time with your family 30
7 Earning a high income 26
8 Being able to live without fear of crime 24
9 Being on good terms with others 23
10 Having a job 22
11 Being successful at work 20
12 Living in a country with a good government 14
13 Safe and clean environment 13
14 Enjoying a pastime 11
15 Expressing your personality or using your talents 11
16 Pleasant community to live 9
17 Having access to higher education 7
18 Winning over others 6
19 Contributing to your local community or to society 5
20 Owning lots of nice things 4
21 Freedom of expression and association 3
22 Being famous 3
23 Appreciating art and culture 2
24 Being devout 2
25 Dressing up 2
The Quality of Life in China 205
123

physical and financial aspects of life indicates that the Chinese people remain, by and
large, firmly attached to the values of materialism rather than post-materialism.
6.1 Value Priorities by Demographic Characteristics
What influences people’s value priorities? Table 5 shows that some demographic char-
acteristics affect the choice of the top ten value priorities. Gender matters, as more women
than men think that raising children and spending time with family are of high priority,
while more men regard being able to live without the fear of crime as important.
Age also makes a difference. People younger than 50 emphasize earning a high income
more than do older cohorts, while older cohorts emphasize having enough to eat, having
access to good medical care, and being able to live without fear of crime. Those in the
oldest age group (60–69) also emphasize having a comfortable home more than those in
the youngest group (20–29). Those in their 20s, on the other hand, value raising children
and having a job much more than other age groups, probably because those in their 20s are
just entering the adult roles of workers and parents.
The top ten value priorities also vary somewhat by education. Education is negatively
associated with a focus on having enough to eat. Compared with the least educated, the
college-educated are less likely to stress having a comfortable home and raising children
and are more likely to care about being on good terms with others.
Marital status also influences value priorities. Compared with single people, the married
and those with marriage experiences are more likely to stress the importance of raising
children (by factors of more than 7 and 4 respectively), while married people also
emphasize being able to live without fear of crime more. Compared with singles, married
people are less likely to emphasize being on good terms with others and having a good job.
Household income also influences value priorities. Compared with the lowest income
group, those in the two higher income groups are less likely to value having enough to eat
and having a job and are more likely to value living without fear of crime. The most
wealthy are also the least likely to highlight the importance of having a comfortable home.
The well-off people in China are less concerned about material issues, which they have
under control, and are more concerned about safety, which is largely beyond their control.
7 Global Assessments of Life
How do the Chinese feel about their overall life experiences? To what degree do they
experience happiness, enjoyment, and achievement, the three components of global life
quality? To explore this question, the ABS asked respondents to rate separately their
experiences of happiness, enjoyment, and achievement. Majorities reported the experience
of these three qualities. Specifically, 74% said that they enjoy life very often or sometimes,
62% are very happy or quite happy, and 58% have achieved a great deal or some of what
they want out of life. However, those who report the most positive ratings constitute
minorities with 23% enjoying life often, 19% feeling very happy, and 9% achieving a great
deal of what they want out of life (Fig. 2).
In terms of these three qualities of life, the Chinese appraise their life quality more
positively than do South Koreans and residents of Hong Kong but slightly less positively
than the Japanese (see this issue). This finding is consistent with data from the 1995 World
Value Survey that showed the Chinese have a greater sense of well-being than do residents
of countries with similar or higher levels of GNP per capita such as Peru, India, Pakistan,
206 X. Shu, Y. Zhu
123

Ta
ble
5O
dds-
rati
oof
logis
tic
regre
ssio
nof
top
ten
val
ue
pri
ori
ties
by
dem
ogra
phic
char
acte
rist
ics
Bei
ng
hea
lthy
(Exp(B
))
Hav
ing
aco
mfo
rtab
lehom
e(E
xp(B
))
Hav
ing
enough
toea
t(E
xp(B
))
Hav
ing
acce
ssto
good
med
ical
care
(Exp(B
))
Rai
sing
chil
dre
n(E
xp(B
))
Spen
din
gti
me
wit
hyour
fam
ily
(Exp(B
))
Ear
nin
ga
hig
hin
com
e(E
xp(B
))
Bei
ng
able
toli
ve
wit
hout
fear
of
crim
e(E
xp(B
))
Bei
ng
on
good
term
sw
ith
oth
ers
(Exp(B
))
Hav
ing
ajo
b(E
xp(B
))
Mal
e,ag
es20–29,
pri
mar
ysc
hool
educa
tion,
single
,lo
wfa
mil
yin
com
e,not
unem
plo
yed
,ru
ral
resi
den
t
2.7
4***
1.7
4***
1.6
7**
0.1
8***
0.0
8***
0.3
1***
0.4
6***
0.1
3***
0.3
4***
0.5
1***
Gen
der
Fem
ale
1.0
20.9
81.0
31.1
21.3
3**
1.3
5***
1.0
10.7
3***
0.9
61.0
0
Age
cohort
30–39
1.4
41.1
51.4
2*
1.5
8**
1.1
30.9
80.8
91.2
80.8
01.2
1
40–49
1.5
31.0
52.0
0***
1.7
0**
1.0
60.7
70.7
41.6
7**
0.9
81.0
3
50–59
1.4
11.2
72.6
7***
2.2
8***
0.9
70.9
40.5
5***
1.9
8***
0.6
3*
0.7
3
60–69
1.6
81.6
9*
2.5
6***
4.8
0***
0.5
6*
1.3
70.1
2***
2.0
5***
0.6
60.5
3*
Educa
tional
att
ain
men
t
Junio
rhig
h1.2
50.9
10.7
3*
1.0
91.0
61.2
80.9
31.0
91.4
11.0
4
Sen
ior
hig
h/v
oca
tional
school
1.4
00.7
2*
0.4
4***
1.2
20.8
51.0
11.3
41.2
11.4
51.2
9
Ass
oci
ate’
sdeg
ree
1.4
30.7
30.3
2***
0.8
90.6
81.3
21.6
0*
1.2
71.4
80.9
7
Bac
hel
or’
san
dgra
duat
edeg
ree
0.9
80.4
4***
0.1
7***
0.7
30.3
5***
1.1
51.4
00.9
41.8
3*
1.2
9
Mari
tal
statu
s
Mar
ried
1.1
50.8
90.7
31.4
27.5
4***
1.1
20.9
61.6
6*
0.6
6*
0.6
4*
Div
orc
ed/s
epar
ated
/wid
ow
ed0.9
10.7
50.8
21.0
54.6
5***
1.1
01.3
81.6
00.6
30.7
1
House
hold
inco
me
Med
ium
:20,0
00–40,0
00
Yuan
0.8
30.8
70.5
5***
0.8
41.1
30.8
50.9
21.3
6*
1.1
20.7
7*
Hig
h:
40,0
00
and
Yuan
and
above
0.8
70.6
6***
0.4
4***
0.9
81.2
71.0
61.0
21.5
4***
1.0
90.5
9***
Unem
plo
yed
0.9
10.9
31.2
21.5
2*
0.9
40.6
6*
0.8
31.2
90.7
31.4
5
Urb
an
resi
den
t1.3
7*
0.9
61.0
71.4
9***
1.0
21.1
60.8
80.8
61.0
20.7
7*
R2
0.0
10.0
40.1
40.0
70.1
00.0
20.0
50.0
30.0
30.0
3
*P
\.0
5,
**
P\
.01,
***
P\
.001
The Quality of Life in China 207
123

Fig. 2 Experience of happiness, enjoyment and accomplishment
208 X. Shu, Y. Zhu
123

Slovakia, and Hungary (Inglehart and Klingemann 2000). One explanation is that the
Chinese still have fresh memories of the economic difficulties they experienced in
childhood and youth, and that their past experiences with poverty, famine, and economic
hardship make them more appreciative of their present circumstances. The finding that
relatively large majorities of the Chinese are experiencing happiness, enjoyment, and
achievement may therefore confirm the hypothesis that rapid growth in income is asso-
ciated with a higher level of subjective well-being (Parducci 1995).
Fig. 3 Percentages of respondents reporting number of positive and negative experiences of happiness,enjoyment and accomplishment
The Quality of Life in China 209
123
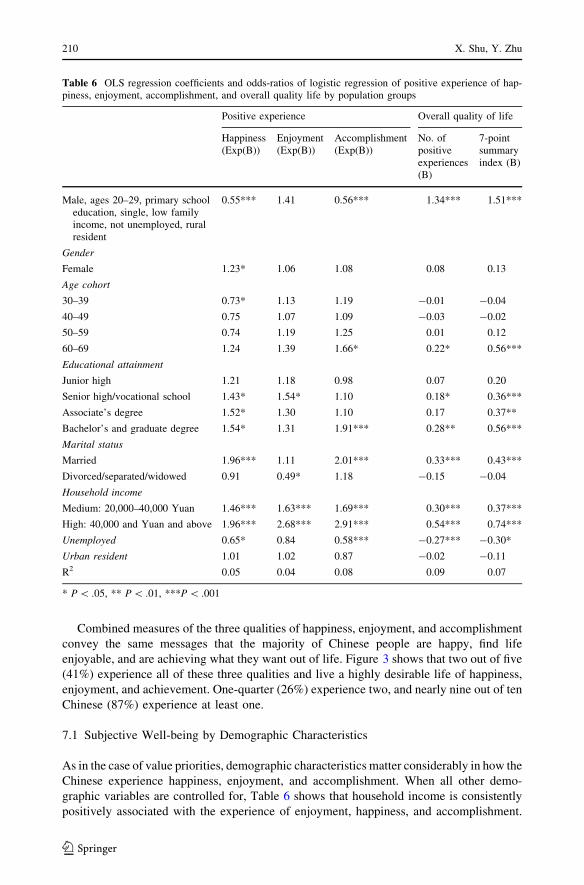
Combined measures of the three qualities of happiness, enjoyment, and accomplishment
convey the same messages that the majority of Chinese people are happy, find life
enjoyable, and are achieving what they want out of life. Figure 3 shows that two out of five
(41%) experience all of these three qualities and live a highly desirable life of happiness,
enjoyment, and achievement. One-quarter (26%) experience two, and nearly nine out of ten
Chinese (87%) experience at least one.
7.1 Subjective Well-being by Demographic Characteristics
As in the case of value priorities, demographic characteristics matter considerably in how the
Chinese experience happiness, enjoyment, and accomplishment. When all other demo-
graphic variables are controlled for, Table 6 shows that household income is consistently
positively associated with the experience of enjoyment, happiness, and accomplishment.
Table 6 OLS regression coefficients and odds-ratios of logistic regression of positive experience of hap-piness, enjoyment, accomplishment, and overall quality life by population groups
Positive experience Overall quality of life
Happiness(Exp(B))
Enjoyment(Exp(B))
Accomplishment(Exp(B))
No. ofpositiveexperiences(B)
7-pointsummaryindex (B)
Male, ages 20–29, primary schooleducation, single, low familyincome, not unemployed, ruralresident
0.55*** 1.41 0.56*** 1.34*** 1.51***
Gender
Female 1.23* 1.06 1.08 0.08 0.13
Age cohort
30–39 0.73* 1.13 1.19 -0.01 -0.04
40–49 0.75 1.07 1.09 -0.03 -0.02
50–59 0.74 1.19 1.25 0.01 0.12
60–69 1.24 1.39 1.66* 0.22* 0.56***
Educational attainment
Junior high 1.21 1.18 0.98 0.07 0.20
Senior high/vocational school 1.43* 1.54* 1.10 0.18* 0.36***
Associate’s degree 1.52* 1.30 1.10 0.17 0.37**
Bachelor’s and graduate degree 1.54* 1.31 1.91*** 0.28** 0.56***
Marital status
Married 1.96*** 1.11 2.01*** 0.33*** 0.43***
Divorced/separated/widowed 0.91 0.49* 1.18 -0.15 -0.04
Household income
Medium: 20,000–40,000 Yuan 1.46*** 1.63*** 1.69*** 0.30*** 0.37***
High: 40,000 and Yuan and above 1.96*** 2.68*** 2.91*** 0.54*** 0.74***
Unemployed 0.65* 0.84 0.58*** -0.27*** -0.30*
Urban resident 1.01 1.02 0.87 -0.02 -0.11
R2 0.05 0.04 0.08 0.09 0.07
* P \ .05, ** P \ .01, ***P \ .001
210 X. Shu, Y. Zhu
123

Compared with those with a low income, those from median- and high-income households
are from one-half to nearly two times more likely to experience the three components of well-
being. Education is also positively correlated with two measures of well-being: those with a
senior high and more education are more likely to experience happiness than are those with
an elementary school education; and those with a bachelor’s degree are more likely to
experience a sense of accomplishment than are those with an elementary school education.
Marital status also has a bearing on those experiences. Compared with single people, married
people have greater odds for experiencing happiness and accomplishment by a factor of 1.96
and 2.01. Divorced/separated/widowed people are half as likely to enjoy life as are single
people. Unemployment also dampens people’s chances of experiencing happiness and
accomplishment; the unemployed are 40% less likely to experience happiness and accom-
plishment than are the employed. Gender, age, and community size have little impact on the
experience of happiness, enjoyment, and accomplishment.
A similar pattern persists when we use the total number of positive experiences and a
7-point summary index of life qualities as the dependent variable (see Table 6). The
Chinese who are in their 60s, who are married, who are employed, who have a college or a
graduate degree, and who command a large income are more likely than their counterparts
to experience a higher overall quality of life as measured by totaling their positive
responses concerning happiness, enjoyment, and achievement. Among age groups, the
oldest group of those in their 60s scores highest on the summary index of life quality.
8 Life Domain Satisfaction
To what extent are the Chinese satisfied or dissatisfied with a variety of their life domains?
The ABS asked Chinese respondents to rate 16 life domains on a 5-point numeric scale
ranging from very dissatisfied to very satisfied. We grouped these domains into the five life
spheres of (1) personal life, (2) interpersonal life, (3) material life, (4) non-material life,
and (5) public life. For the domains in each life sphere, Table 7 reports the mean on the
5-point scale, percentages expressing satisfaction and dissatisfaction, and the percentage
differential index measuring the balance of these two percentages.
In Table 7, we assigned values of -2, -1, 0, 1, 2 to the five categories of being most
dissatisfied, somewhat dissatisfied, neither dissatisfied nor satisfied, somewhat satisfied,
and most satisfied and calculated the mean scores for each of the 16 life domains.
According to the means reported in this table, the top five most satisfying domains are
marriage, friendship, health, family life, and neighbors. The bottom five domains are the
social welfare system, the democratic system, public safety, household income, and job.
Most of the domains in the top five groups belong to the interpersonal life sphere, while
most of those in the bottom five belong to the public life sphere.
Table 7 shows that Chinese people are most satisfied in the sphere of interpersonal life
and least satisfied in that of public life. In the interpersonal life sphere, for example, the
smallest proportion of satisfied respondents is nearly one-half (49%), while the largest is
nearly three-fourths (73%). Moreover, less than 10% reports dissatisfaction with any of the
interpersonal life domains, which include marriage, friendship, family life, and neighbors.
In the public life sphere, on the other hand, minorities ranging from 14 to 31% are satisfied
with the four domains of the environment, public safety, the democratic system, and the
social welfare system. Moreover, those expressing dissatisfaction outnumber those
expressing satisfaction in all of these domains, excepting the environment. Concerning the
social welfare system, the dissatisfied are nearly four times as numerous as the satisfied.
The Quality of Life in China 211
123

In the other three life spheres, personal life, material life, and nonmaterial life, the former
outnumber the latter by a large margin. Same as in other Confucian countries, ordinary
citizens in China are least satisfied with the public sphere of their lives.
In Table 8, we considered together the ratings of all the domains for each life sphere and
calculated the percentages of its domains which the Chinese people rated satisfied and
dissatisfied. As expected, the interpersonal life sphere registers the highest level of satis-
faction and the lowest level of dissatisfaction (57% vs. 7%). The public life sphere registers
the lowest level of satisfaction and the highest level of dissatisfaction (22% vs. 32%).
Regarding all of the other four spheres, the satisfied are more common than the dissatisfied.
Satisfaction is greatest concerning the interpersonal life sphere, where the satisfied out-
number the dissatisfied by a large margin of 52%. The personal life sphere is the next most
satisfying, followed by the material life sphere and the nonmaterial life sphere. In China
today, the quality of public life is in the greatest need of improvement.
8.1 Life-domain Satisfaction by Demographic Characteristics
We now examine how seven demographic characteristics and respondents’ top five value
priorities affect their evaluations of the five life spheres. Table 9 reports OLS regression
Table 7 Assessment of life domains
Domains Scale points (%) Mean Percentages
-2 -1 0 1 2 Satisfied Dissatisfied PDI
Personal life sphere
Health 2.46 6.93 34.10 33.85 22.65 0.67 56.50 9.39 47.11
Education 4.09 17.02 46.41 24.85 7.63 0.15 32.47 21.11 11.36
Job 7.48 18.98 42.81 22.12 8.61 0.05 30.74 26.46 4.28
Interpersonal life sphere
Marriage 0.77 2.62 23.47 33.89 39.26 1.08 73.15 3.39 69.76
Friendship 0.65 1.81 37.08 37.88 22.57 0.80 60.45 2.47 57.98
Family life 1.96 5.94 40.39 33.05 18.66 0.61 51.71 7.90 43.81
Neighbors 1.26 4.72 45.33 32.08 16.62 0.58 48.69 5.97 42.72
Material life sphere
Housing 4.76 11.48 34.95 35.06 13.74 0.42 48.8 16.25 32.55
Standard of living 2.06 10.55 55.33 23.77 8.29 0.26 32.06 12.61 19.45
Household income 5.37 16.17 52.64 20.39 5.42 0.04 25.82 21.55 4.27
Nonmaterial life sphere
Spiritual life 3.88 11.05 45.71 27.04 12.31 0.33 39.35 14.93 24.42
Leisure 5.35 15.09 49.27 23.07 7.22 0.12 30.29 20.44 9.84
Public life sphere
The condition of theenvironment
4.84 16.73 47.13 24.19 7.11 0.12 31.3 21.57 9.73
Public safety 7.25 22.21 45.27 19.64 5.64 -0.06 25.28 29.46 -4.18
The democratic system 10.23 19.29 52.42 13.94 4.12 -0.18 18.07 29.52 -11.45
Social welfare system 18.07 30.71 37.61 9.75 3.86 -0.49 13.6 48.78 -35.18
Notes: -2—very dissatisfied, -1—somewhat dissatisfied, 0—neither satisfied nor dissatisfied, 1—some-what satisfied, 2—very satisfied
212 X. Shu, Y. Zhu
123

coefficients estimating the direct effects of these variables on summary ratings of five
domain sphere indices. Women are significantly more satisfied with material and public
life domains than men. Compared with married and singles, the divorced/separated/wid-
owed are significantly less satisfied with three of the five life spheres: personal, material,
and nonmaterial. Age is positively associated with satisfaction with material and public life
domains, and those in their 60s are the age group most satisfied with all five life domains.
Household income is positively associated with satisfaction in all five life domain spheres.
Compared with those with a low income, those with a middle and high income are
significantly more satisfied with all five life spheres. Education is positively correlated with
satisfaction in all of the domains except public life. The unemployed are significantly less
content than the employed are with their personal, nonmaterial, and public lives. Compared
with rural residents, urban residents are significantly less content with their material life
but are more content with their nonmaterial life.
Prior research has shown that materialism is negatively correlated with subjective well-
being (Kasser 2000; Sirgy 1998). People who view material goods and services as more
important than other resources such as interpersonal relationships and personal growth are
known to be less happy than people with the opposite view (Ryan and Dziurawiec 2001).
This is consistent with our findings. Among the top five value priorities reported in
Table 9, the two indicative of materialism—having a comfortable home and having
enough to eat—are negatively associated with satisfaction levels for all five life spheres.
Too much concern with physical health also appears to detract from satisfaction in all these
spheres.
9 Influences on Subjective Well-being
We use four sets of predictors to estimate the sources of subjective well-being as measured
by happiness, enjoyment, accomplishment, and their combined index. The four sets of
predictors include: (1) demographic characteristics (gender, age, educational attainment,
marital status, household income, employment status, urban/rural residency), (2) lifestyles,
(3) value priorities, and (4) satisfaction with life domains. Table 10 shows the coefficients
estimating the direct and independent effect of each predictor on happiness, enjoyment,
accomplishment, and overall sense of well-being as measured by the index. For happiness,
enjoyment, and accomplishment, we used logistic regression and report odds ratios.
Table 8 Percentage of life domains rated as satisfied and dissatisfied by domain spheres
Domains satisfied Domains dissatisfied Balance N
Personal life spherea 40.2 18.8 21.4 1996
Interpersonal life sphereb 57.4 5.2 52.2 1999
Material life spherec 35.6 16.8 18.9 2000
Non-material life sphered 34.8 17.8 17.0 1986
Public life spheree 22.1 32.3 -10.2 1995
a Personal life sphere includes health; education; and jobb Interpersonal life sphere encompasses friendship; marriage; family; and neighborc Material life sphere encompasses housing; standards of living; and incomed Non-material life sphere encompasses leisure; and spiritual lifee Public life sphere encompasses public safety; environment; welfare; and democratic politics
The Quality of Life in China 213
123

In these estimates, an odds ratio larger than one indicates a positive effect. For the index
measuring overall sense of well-being, we used OLS regression and report regression
coefficients.
How satisfied the Chinese people are with various life domains is an important predictor
of happiness, enjoyment, accomplishment, and overall subjective well-being. Especially
important is satisfaction with the four domains of interpersonal life. For those who are
satisfied with their interpersonal life, their odds to report happiness are 68% higher, and
that to report both enjoyment and accomplishment are 18% higher. Satisfaction with
interpersonal life sphere is also positively associated with the overall index of subjective
well-being; those satisfied with their interpersonal life score a quarter- point higher on
overall subjective well-being than those who are not.
Table 9 OLS regression coefficients for five domain sphere indices by demographic characteristics
Personal Interpersonal Material Nonmaterial Public
Male, ages 20–29, primary schooleducation, single, low family income,not unemployed, rural resident
0.15 0.94*** -0.46** 0.06 -0.68***
Gender
Female -0.05 0.04 0.18** 0.05 0.15*
Age cohort
30–39 0.11 -0.09 0.16 -0.18 0.13
40–49 0.35** 0 0.44*** -0.07 0.38***
50–59 0.11 -0.07 0.39*** -0.18 0.26*
60–69 0.42** 0.24* 0.95*** 0.42* 0.74***
Educational attainment
Junior high 0.37*** 0.21** 0.08 0.03 0.1
Senior high/vocational school 0.53*** 0.44*** 0.30** 0.36** 0.02
Associate’s degree 0.68*** 0.36*** 0.29* 0.41** 0.02
Bachelor’s and graduate degree 0.94*** 0.42*** 0.38* 0.42* 0.26
Marital status
Married -0.04 0.16 0.26* -0.06 0.04
Divorced/separated/widowed -0.62*** -0.25 -0.53** -0.66*** -0.15
Household income
Medium: 20,000–40,000 Yuan 0.21** 0.18*** 0.71*** 0.25** 0.27***
High: 40,000 and Yuan and above 0.58*** 0.37*** 1.23*** 0.58*** 0.35***
Unemployed -0.27* -0.14 -0.21 -0.34* -0.25*
Urban resident 0.04 -0.11 -0.33*** 0.25*** -0.11
Value priorities (top five categories)
Being healthy -0.03 0.17** 0.09 0.14 0.11
Having a comfortable home -0.03 -0.04 -0.06 -0.03 -0.01
Having enough to eat -0.14 -0.08 -0.07 -0.15 -0.14*
Having access to good medical care ifrequired
-0.26*** -0.11* -0.16* -0.16* -0.25***
Raising children -0.11 0.02 0.03 0.12 -0.07
R2 0.11 0.06 0.15 0.08 0.05
* P \ .05, ** P \ .01, *** P \ .001
214 X. Shu, Y. Zhu
123

Table 10 OLS regression coefficients and odds-ratios of logistic regression for Happiness, Enjoyment,accomplishment, Overall measure of quality of life by all explanatory variables
Happiness Enjoyment Accomplishment OverallExp(B) Exp(B) Exp(B) B
Male, ages 20–29, primary school education,single, low family income, not unemployed,rural resident
0.03*** 0.79 0.14*** 0.51
Demographic characteristics
Gender (female = 1) 1.19 1.01 0.96 0.05
Age cohort
30–39 0.72 1.17 1.16 -0.04
40–49 0.64* 0.98 0.86 -0.16
50–59 0.71 1.24 1.1 0.06
60–69 0.98 0.94 1.08 0.2
Educational attainment
Junior high 1.14 0.92 0.96 0.08
Senior high/vocational school 1.11 0.96 0.98 0.08
Associate’s degree 1.16 0.8 1.02 0.08
Bachelor’s and graduate degree 1.1 0.75 2.13** 0.18
Marital status
Married 1.9*** 0.91 1.82*** 0.25*
Divorced/separated/widowed 1.34 0.64 1.77 0.25
Household income
Medium: 20,000–40,000 Yuan 0.98 1.17 1.04 -0.02
High: 40,000 and Yuan and above 0.92 1.36 1.33 0.03
Unemployed 0.79 1.07 0.61* -0.08
Urban resident 1.17 1.2 1.12 0.04
Life domain satisfaction
Personal life sphere 1.03 1.08 0.96 0.04
Interpersonal life sphere 1.68*** 1.18** 1.18*** 0.26***
Material life sphere 1.39*** 1.34*** 1.80*** 0.28***
Nonmaterial life sphere 1.09* 1.19*** 0.98 0.09***
Public life sphere 0.96 1.05 1.01 0.05*
Value priorities
Being healthy 1.06 0.99 0.76 -0.02
Having a comfortable home 0.98 0.99 0.91 -0.07
Having enough to eat 1.13 0.79 0.96 -0.02
Having access to good medical care if required 0.92 0.89 1.17 -0.07
Raising children 1.03 0.99 1.25 0.06
Lifestyles
Household related lifestyles
Household size 1.04 1.00 1.09* 0.04
Home ownership 0.79 1.11 0.85 -0.10
Having meals at home 1.30* 1.13 0.99 0.08
The Quality of Life in China 215
123

Satisfaction with the material life sphere is also positively associated with all four
measures of subjective well-being. For those who are satisfied with their material lives, as
compared to those who are unsatisfied, their odds to be happy are 39% more, the odds to
report enjoyment are 34% higher, and the odds to report a sense of accomplishment are
80% higher; those who are satisfied also report a quarter point higher on the index mea-
suring the overall level of subjective well-being.
Satisfaction with the non-material life sphere is also positively associated with all four
measures of well-being, though at a smaller magnitude than what was observed with the
interpersonal and material life spheres. Those satisfied with their nonmaterial life increase
their odds to be happy by 9%, their odds to have enjoyment by 19%, and score close to a
one-tenth point higher on overall subjective well-being.
Respondents’ subjective ranking of their standard of living is also an important pre-
dictor of subjective well-being. Compared with those who rate their standard of life as low
and average, those who rate their living standard as high increase their odds to have
enjoyment by 30% and their odds to experience a sense of accomplishment by 21%, and
score .15 points higher on overall subjective well-being. This is consistent with the findings
from other similar studies on life satisfaction and happiness that show the subjective
evaluation of income from a relative perspective has a strong effect on happiness and life
satisfaction (see Headey et al. 1984; Fuentes and Rojas 2001; Haller and Hadler 2004).
On the other hand, the amount of actual household income has no significant effect on
any measure of subjective well-being after controlling for the effects of subjective income.
This finding is again consistent with a number of other studies (Frey and Stutzer 2002) and
findings from a series of multilevel regression analyses using data from 41 countries from
the 1995 World Value Survey (Haller and Hadler 2004).
Being married is positively associated with two components of well-being and overall
well-being. Compared with singles, the odds for married people to be happy are 90% more
and those for married people to have a sense of accomplishment are 80% higher. Married
people also score one-quarter point higher on overall subjective well-being than single
people.
Table 10 continued
Happiness Enjoyment Accomplishment OverallExp(B) Exp(B) Exp(B) B
Access to resources
Utility 0.98 1.00 1.00 0.02
Modern telecommunication 1.01 0.99 1.00 -0.01
Religiosity 1.05 0.95 1.16*** 0.03
Participation in local/national elections 0.97 1.19* 1.16* 0.08
Trusting others 1.20 1.03 1.12 0.03
Self-rated living stand high 1.30** 1.20 1.21* 0.15***
Globalism and localism
Global connection 1.08 1.07 0.98 0.06
Nationalism 1.32*** 1.10 1.23* 0.09
Identify oneself as Asian 1.05 1.14 0.79* 0.05
R2 0.24 0.16 0.24 0.34
N 1936 1937 1937 1936
* P \ .05, ** P \ .01, *** P \ .001
216 X. Shu, Y. Zhu
123

Neither gender, age, educational attainment, employment status, urban residency, sat-
isfaction with the personal life and public life spheres, value priorities, household-related
lifestyles, access to resources, religiosity, participation in elections, trusting others, glob-
alization, nor nationalism have consistent and systematic effects on either happiness,
enjoyment, accomplishment, or overall subjective well-being.
10 Conclusion and Discussion
We examined lifestyles, value priorities, satisfaction with life domains, and subjective
well-being in China using a national sample of 2,000 men and women aged 20–69. We
conceptualized subjective well-being as a multidimensional and multilevel phenomenon
and measured it in terms of happiness, enjoyment, and accomplishment. We also
hypothesized it to be shaped by a multitude of forces including demographic character-
istics, lifestyles, value priorities, and satisfaction with various life domains. A summary of
our key findings follows.
10.1 High Levels of Subjective Well-Being in China
The Chinese feel more positive than negative about their lives. Substantial majorities
experience feelings of happiness, enjoyment, and accomplishment. Their sense of well-
being is, moreover, higher than that of South Koreans and residents of Hong Kong who live
in greater prosperity. This finding is consistent with earlier research that also showed the
Chinese tend to hold a greater sense of well-being than people from countries with similar
or higher levels of GNP per capita (Inglehart and Klingemann 2000).
We offer four plausible explanations for relatively high levels of subjective well-being
in China. First, the Chinese evaluate their lives by historical comparison. They compare
their current life, made possible by economic gains achieved in the last few decades, with
what they experienced during childhood and arrive at a favorable assessment of their
present (Parducci 1995). Second, sustained high economic growth gives people a sense of
freedom and optimism. The future economic prospects of a country make people optimistic
about their own situation. Economic growth gives people the feeling that opportunities are
there, and it is within their power to improve their lives. Third, satisfaction with inter-personal life is high in China. Close to 60–70% are happy with their marriages, friendships,
family life, and neighbors. Satisfaction with the interpersonal life sphere is the most
powerful predictor of subjective well-being in China and as a result, it has a strong
favorable impact on overall life quality. This strong relationship between the interpersonal
life sphere and life quality reflects the significance and centrality of social relationships in
Confucian culture. A good life in China is a social one as individuals are embedded in
circles of relationships. Lastly, a high percentage of married people also contributes to a
high degree of subjective well-being in the Chinese population. Extensive evidence shows
that married people tend to evaluate life more positively than do the unmarried. In China,
more than 80% of adults are married, and this is bound to have a positive impact on the
people’s experience of well-being.
10.2 Direct and Indirect Influences on Subjective Well-being
What factors directly and indirectly influence Chinese people’s sense of well-being?
Figure 4 presents statistically significant direct and indirect influences on happiness,
The Quality of Life in China 217
123

enjoyment, accomplishment, and overall subjective well-being. Satisfaction with the
interpersonal life, material life, and nonmaterial life spheres, relative assessments of one’s
living standard, and marital status are three factors with direct influence on subjective well-
being. Value priorities and other demographic characteristics, including education,
household income, being divorced/separated/widowed, employment status, and community
size do not have a direct influence on evaluation of life quality, but they do affect how
satisfied individuals are with various life domains, as well as how they evaluate their
standard of living compared to others, and domain satisfaction and standard of living
evaluation have direct bearings on subjective well-being.
10.2.1 Life Domain Satisfaction
Our results show that of the five spheres of life in China, satisfaction in the interpersonal,
material, and non-material spheres of life contributes directly to the experience of hap-
piness, enjoyment, and accomplishment. Of these three spheres, the interpersonal life
sphere shapes the experience of subjective well-being most powerfully. In China, inter-
personal relationships have the greatest direct bearing on the way in which the Chinese
people appraise their quality of life.
10.2.2 Relative Living Standard
How Chinese people evaluate their own standard of living compared to the standard of
living they perceive others experiencing is another important predictor of subjective well-
being. The more positively the Chinese evaluate their standard of living relative to others’,
the greater the quality of life they experience. It is Chinese people’s subjective ranking of
living standards, not the actual level of income at their disposal, that directly affects their
+
-
+
+
Age
Education
Household Income
Married
Value Priorities: Enough to eat Medical Care
Life Domain Satisfaction:Interpersonal Life
Material LifeNonmaterial Life
Relative Living StandardSubjective Wellbeing:
HappinessEnjoyment
Accomplishment+
+
+
++
60 +
Divorced/Separated/Widowed
Unemployed
Urban Resident
- -
-
-
Fig. 4 Statistically significant influences on happiness, enjoyment, accomplishment and overall subjectivewell-being
218 X. Shu, Y. Zhu
123

perceptions of life quality. This finding also confirms the importance of social life as a
criterion for the appraisal of life quality.
10.2.3 Marriage
Compared with the unmarried, married people perceive their life more positively and
experience more happiness, enjoyment, and accomplishment. This finding is consistent
with a large number of prior studies from different countries and periods (e.g. Diener et al.
2000).
Age, education, household income, being divorced or widowed, and value priorities are
indirect influences on subjective well-being, mostly through satisfaction with life domains.
The oldest age group, those aged 60–69, are the most satisfied with their interpersonal,
material, and nonmaterial life spheres. The better educated and those from households with
higher incomes also have higher levels of life satisfaction for these three spheres. The
divorced/separated/widowed are less satisfied with these three life spheres. In addition,
those who emphasize ‘‘having enough to eat’’ and ‘‘having access to medical care’’ tend to
evaluate their interpersonal, material, and nonmaterial life spheres as less satisfying. Age is
positively associated with value priorities on these aforementioned two value orientations;
older people are more likely to emphasize ‘‘having enough to eat’’ and ‘‘having access to
medical care’’.
Household income, being divorced/separated/widowed, unemployment, and urban
residence also have an indirect influence on subjective well-being by affecting how
Chinese people rate their relative standard of living. Those with a high household income
are more likely to rate themselves as having a relatively higher living standard than those
with a low household income. People who are divorced/separated/widowed are more likely
to see themselves as having a relatively lower living standard, even after controlling for
their real household income. The unemployed and urban residents also tend to rate
themselves lower on relative living standard after controlling for the real income than do
their counterparts. These negative effects of divorce/separation/widowhood, unemploy-
ment, and urban residency demonstrate the power of social comparison. Regardless of their
actual income, these individuals who compare themselves negatively with their peers see
their standard of living as low.
10.3 Predicting Future Change in Subjective Well-being in China
What changes will the future bring to the sense of well-being in China? Will the changes
be mostly for the better or mostly for the worse? Though no one can say for sure, we can
venture an informed guess by identifying the positive and negative forces now affecting
Chinese quality of life and examining their strength and potential future effects.
We begin with five negative forces that are likely to work against rising levels of
subjective well-being. First, increasing inequalities are likely to lead more people to
perceive themselves as having a low income. The relativistic judgment model suggests
that people assess the adequacy of their income in relation to others (Easterlin 1974), and
thus increases in income inequality are likely to bring about decreases in the experience
of well-being (Veenhoven 1993). Second, people’s desires will likely increase as market
competition and advertising cause people to crave more commodities and services. Even
further economic growth will not fulfill these heightened levels of desires, and as a
result, people will grow more dissatisfied. Third, the prevalence of marriage is likely todecline in China as its population is becoming more accepting of divorce, cohabitation,
The Quality of Life in China 219
123

and remaining single. Married people are happier and have higher levels of satisfaction
than single and divorced/separated/widowed people, while divorced/separated/widowed
are more likely to report a low subjective standard of living. Thus a decline in the
marriage rate is likely to push subjective well-being in the negative direction. Fourth, the
sustained rural–urban migration will likely reduce the level of subjective well-being.
Because urban residents are exposed to extreme wealth and commercial advertising more
than are rural residents, they tend to be more negative in their evaluations of their
relative income, which, in turn, leads them to be more negative in their evaluations of
life quality. Last, increased international and domestic competition will likely lead to
more people experiencing unemployment. Unemployed people tend to be more negative
about their standard of living, and this negative evaluation leads to lower levels of
subjective well-being.
On the positive side, three trends are likely to work to increase subjective well-being.
First, if economic growth leads to continued increases in household income, it will likely
also increase the happiness of the Chinese people, as a higher household income is
associated with higher satisfaction levels in the material life sphere. Second, economic
expansion also grants more people education opportunities. Higher education can increase
satisfaction with various life domains and thus increase subjective well-being. Last,
compared with older cohorts, young people in China are less oriented toward materialisticgoals. Because people who focus on material concerns tend to be less satisfied, and
therefore, tend to experience lower subjective well-being, a shift away from materialism is
likely to lead to a higher quality of life.
Appendices
Table A1 Variables used in estimation of subjective well-being
Variable Coding
Demographic variables
Female A dummy variable with 1 = female respondents, 0 = male respondents.
Age cohorts
Cohort 20–29 A dummy variable with 1 indicating that the respondent belongs to this age cohort,and 0 for otherwise.
Cohort 30–39 A dummy variable with 1 indicating that the respondent belongs to this age cohort,and 0 for otherwise.
Cohort 40–49 A dummy variable with 1 indicating that the respondent belongs to this age cohort,and 0 for otherwise.
Cohort 50–59 A dummy variable with 1 indicating that the respondent belongs to this age cohort,and 0 for otherwise.
Cohort 60–69 A dummy variable with 1 indicating that the respondent belongs to this age cohort,and 0 for otherwise.
Educational attainment
Primary schoolor below
A dummy variable for respondent’s educational attainment (1 = primary schoolor below; 0 = else).
Junior high A dummy variable for respondent’s educational attainment (1 = junior high; 0 = else).
220 X. Shu, Y. Zhu
123

Table A1 continued
Variable Coding
Senior high/vocationalschool
A dummy variable for respondent’s educational attainment (1 = senior high orvocational school; 0 = else).
Associate’s degree A dummy variable for respondent’s educational attainment (1 = associatedegree; 0 = else).
Bachelor’s andgraduatedegree
A dummy variable for respondent’s educational attainment (1 = bachelor’sdegree or graduate degree; 0 = else).
Marital status
Married A dummy variable for respondent’s marital status (1 = married; 0 = otherwise).
Single A dummy variable for respondent’s marital status (1 = single; 0 = otherwise).
Divorce/separated/widowed
A dummy variable for respondent’s marital status (1 = divorced/separated/widowed; 0 = otherwise).
Household Income
Low income A dummy variable for respondent’s household income (1 = low: less than 30 k;0 = otherwise).
Medium income A dummy variable for respondent’s household income (1 = median: 30–50 k;0 = otherwise).
High income A dummy variable for respondent’s household income (1 = high: 50 k andabove; 0 = otherwise).
Unemployment A dummy variable with 1 indicating that the respondent is currently unemployed,and 0 otherwise.
Urban resident A dummy variable with 1 indicating that the respondent is an urban resident, and0 otherwise.
Livestyle variables
Family related
Household size Household Size (number of people living in the same household with therespondent).
Home owner A dummy variable for respondent’s home ownership, with 1 = owner,0 = otherwise.
Breakfast at home A dummy variable for eating home-made breakfast at home, with 1 = yes,0 = no.
Dinner at home A dummy variable for eating home-made dinner at home, with 1 = yes, 0 = no.
Access to resources
No. of Utilities Number of utilities the respondent has access to, including public water supply;electricity; LPG or piped gas; fixed-line phone; mobile phone; facsimile; cabletv.
Internet How often do you view Internet web pages by computers? (5 = almost everyday; 4 = several times a week; 3 = several times a month; 2 = seldom;1 = never).
Email How often do you read or write emails by computers? (5 = almost every day;4 = several times a week; 3 = several times a month; 2 = seldom;1 = never).
Cellular phone How often do you read or write messages by mobile phones? (5 = almost everyday; 4 = several times a week; 3 = several times a month; 2 = seldom;1 = never).
Moderntelecommunication
A summary scale that measures the respondent’s access to moderntelecommunications. (sum of INTERNET, EMAIL CELLULAR PHONE)
The Quality of Life in China 221
123

Table A1 continued
Variable Coding
Religious behavior
Religious A dummy variable for respondent’s religious belief (1 = being religious;0 = otherwise).
Pray How often the respondent prays or meditates (5 = daily; 4 = weekly;3 = monthly; 2 = on special occasions; 1 = never).
Religiosity A summary scale that measures the respondent’s degree of religiosity (sum ofReligious pray).
Political involvement
Vote national A dummy variable with 1 indicating the respondent votes in national elections,and 0 otherwise.
Vote local A dummy variable with 1 indicating the respondent votes in local elections, and 0otherwise.
Participation inlocal/nationalelections
A summary scale that measures the respondent’s degree of participation in localand national elections (sum of VOTE NATIONAL, VOTE LOCAL).
Globalism and localism
English A dummy variable with 1 indicating that the respondent is able to speak English,and 0 otherwise.
Oversea Number of interactions the respondent has with people or institutions overseas,including has a member of family or a relative lives in another country; hastraveled abroad at least three times in the past 3 years on holidays or forbusiness purpose; has friends from other country who are in China; oftenwatches foreign-produced programs on TV; often communicates with peoplein other countries view the internet or email; own job involves contact withorganizations or people in other countries).
Global connection A summary scale that measures the degree of the respondent’s global connections(sum of ENGLISH, OVERSEA).
Identify as Chinese A dummy variable with 1 indicating that the respondent thinks of him/herself asbeing Chinese, and 0 otherwise.
Proud to be Chinese A dummy variable with 1 indicating that the respondent is proud of beingChinese, and 0 otherwise.
Memorize anthem Is the respondent able to memorize the national anthem of China? (1 = yes,0 = no). A dummy.
Identify as Asia Does the respondent identify him/herself as being Asian? (1 = yes, 0 = no). Adummy.
Self-rated standard of living
Low A dummy variable with 1 indicating that the respondent rated own standard ofliving as low, and 0 otherwise.
Medium A dummy variable with 1 indicating that the respondent rated own standard ofliving as medium, and 0 otherwise.
High A dummy variable with 1 indicating that the respondent rated own standard ofliving as high, and 0 otherwise.
Trusting others A dummy variable with 1 indicating that the respondent thinks people can betrusted, and 0 otherwise.
222 X. Shu, Y. Zhu
123

Table A1 continued
Variable Coding
Top ten value priorities
Being healthy A dummy variable with 1 indicating that the respondent values this aspect, and0 otherwise.
Having a comfortablehome
A dummy variable with 1 indicating that the respondent values this aspect, and0 otherwise.
Having enough to eat A dummy variable with 1 indicating that the respondent values this aspect, and0 otherwise.
Having access to goodmedical care
A dummy variable with 1 indicating that the respondent values this aspect, and0 otherwise.
Rasing children A dummy variable with 1 indicating that the respondent values this aspect, and0 otherwise.
Spending time with yourfamily
A dummy variable with 1 indicating that the respondent values this aspect, and0 otherwise.
Earning a high income A dummy variable with 1 indicating that the respondent values this aspect, and0 otherwise.
Being able to liveout fearof crime
A dummy variable with 1 indicating that the respondent values this aspect, and0 otherwise.
Being on good terms withothers
A dummy variable with 1 indicating that the respondent values this aspect, and0 otherwise.
Having a job A dummy variable with 1 indicating that the respondent values this aspect, and0 otherwise.
Subjective well-being
Happiness A dummy for positive experience of happiness (1 = very happy and quitehappy; 0 = otherwise).
Enjoyment A dummy for positive experience of enjoyment (1 = enjoy life often andsometimes; 0 = otherwise)
Accomplishment A dummy for positive experience of accomplishment (1 = feel accomplishingsome and a great deal of what one wants in life; 0 = otherwise).
Number of positiveexperiences
Number of positive experiences the respondent reports he/she has experiencedamong happiness, enjoyment, and accomplishment.
7-Point summary index I first construct non-negative indexes for happiness, enjoyment andaccomplishment, 0 = not experiencing happiness, enjoyment oraccomplishment, 1 = experiencing some happiness, enjoyment andaccomplishment, 2 = experiencing a lot happiness, enjoyment andaccomplishment. The overall index is the summation of non-negative valueson these three elements. It ranges from 0–6. It is based on instructionsprovided in Shin’s email on May 15, 2007 (data analysis procedures).
Recode Q4 (1 = 2)(2 = 1)(3,4,5 = 0) (Else = 9) into happy.
Recode Q5 (1 = 2)(2 = 1)(3,4 = 0) (Else = 9) into enjoy.
Recode Q6 (1 = 2)(2 = 1)(3,4 = 0)(Else = 9) into accomplish.
Missing values happy enjoy accomplish (9).
Compute overall 7 = happy ? enjoy ? accomplish.
The Quality of Life in China 223
123

Table A2 Comparison of basic statistics across ABS2006, Women’s 2000, and Chinese Health and FamilyLife Survey
ABS2006 WOMEN2000 CHFLS CENSUS2000
Mean/percentage
Mean/percentage
Mean/percentage
Mean/percentage
Gender
Female respondents 49 54 50 48
Male respondents 51 46 50 52
Age
Respondent’s age 40.77 39.24 38.77
Cohort 20–29 21 20 23
Cohort 30–39 29 34 32
Cohort 40–49 23 26 27
Cohort 50–59 18 14 14
Cohort 60–69 10 6 5
Educational attainment
Primary school or below 18 33 20 28
Junior high 32 37 37 27
Senior high/vocational school 24 22 29 9
Associate’s degree 13 6 10 3
Bachelor’s degree and Graduate degree 13 2 5
Marital status
Single 17 10 11
Married 79 86 86
Divorced and widowed 4 4 3
Household income
Low income households: less than20,000 yuan
49 N/A N/A
Medium income households: 20,000–40,000 yuan
28 N/A N/A
High income households: 40,000 yuanand above
22 N/A N/A
Employment
Employed, retired, student andhomemaker
93 94 89
Unemployed 7 6 11
Urban residence
Urban resident 50 51 80 36
Rural resident 50 49 20 64
224 X. Shu, Y. Zhu
123

References
Bell, D. A. (2006). Beyond liberal democracy: Political thinking for an East Asian context. Princeton, NJ:Princeton University Press.
Bell, D. A., Brown, D., Jayasuriya, K., & Jones, D. M. (1995). Toward illiberal democracy in Pacific Asia.New York: St. Martin’s Press.
China National Bureau of Statistics. (2003). China statistical yearbook. Beijing: China Statistical Press.China National Bureau of Statistics. (2007). China statistical yearbook for regional economy, 2007. Beijing:
China Statistical Press.Compton, R. W. (2000). East Asian democratization: Impact of globalization, culture, and economy.
Westport, CT: Praeger Publishers.Diener, E., Gohm, C. L., Suh, E. M., & Oishi, S. (2000). Similarity of the relations between marital status
and subjective well-being across cultures. Journal of Cross Cultural Psychology, 31(4), 419–436.Easterlin, R. A. (1974). Does economic growth improve the human lot? Some empirical evidence. In P. A.
David & W. R. Melvin (Eds.), Nations and households in economic growth (pp. 98–125). Palo Alto,CA: Stanford University Press.
Frey, B. S., & Stutzer, A. (2002). Happiness and economics. How the economy and institutions affect well-being. Princeton: Princeton University Press.
Fuentes, N., & Rojas, M. (2001). Economic theory and subjective well-being: Mexico. Social IndicatorsResearch, 53, 289–314.
Haller, M., & Hadler, M. (2004). Happiness as an expression of freedom and self-determination: A com-parative multilevel analysis. In W. Glatzer, S. von Below & M. Stoffregen (Eds.), Challenges forquality of life in contemporary world (pp. 207–231). Dordrecht: Kluwer.
Headey, B., Holmstrom, E., & Wearing, A. (1984). Well-being and Ill-being: Different dimensions. SocialIndicators Research, 14, 115–139.
Inglehart, R., & Klingemann, H.-D. (2000). Genes, culture, democracy, and happiness. In E. Diener & E. M.Suh (Eds.), Culture and subjective wellbeing (pp. 165–16184). Cambridge: MIT Press.
Kasser, T. (2000). Two versions of the American DREAM: Which goals and values make for a higherquality of life. In E. Diener & D. R. Rahtz (Eds.), Advances in quality of life theory and research(pp. 3–12). Dordrecht: Kluwer.
Logan, J. R. (Ed.). (2002). The new Chinese city: Globalization and market reform. London: Blackwell.Ma, J. (2004). China’s water crisis. East Bridge.Ma, X., & Ortalano, L. (2000). Environmental regulation in China: Institution, enforcement, and compli-
ance. Rowman and Littlefield.Parducci, A. (1995). Happiness, pleasure, and judgment: The contextual theory and its applications.
Mahwah, NJ: Lawrence Erlbaum.Peng, D. (1996). Does confucianism matter? The role of the oriental tradition in economic development in
East Asia. In A. Ikeo (Ed.), Economic development in twentieth century East Asia: The internationalcontext. Routledge.
Pye, L. W. (1992). The spirit of Chinese politics. Chicago: Harvard University Press.Ravallion, M., & Chen, S. (2004). China’s (Uneven) Progress against Poverty. World Book Policy Research
Working Paper 3408.Ross, H. (2004). China country study in education for all: EFA global monitoring report. Paris: United
Nations Educational, Scientific and Cultural Organization.Ryan, L., & Dziurawiec, S. (2001). Materialism and its relationship to life satisfaction. Social Indicators
Research, 55, 185–197.Sirgy, M. (1998). Materialism and quality of life. Social Indicators Research, 43, 227–260.Tu, W.-M. (Ed.). (1996). Confucian traditions in East Asian modernity: Moral education and economic
culture in Japan and the four mini-dragons. Cambridge: Harvard University Press.United Nations Development Program. (2005). Human Development Report 2005: International coopera-
tion at a crossroads. New York: United Nations Development Program.World Bank and China State Environmental Protection Administration. (2007). Cost of pollution in China:
Economic estimates of physical damages. Washington, DC.World Health Organization. (2008). World Health Statistics.
The Quality of Life in China 225
123