Prolonged the Shelf Life of Different Foods using the Citrus By ...
Upload
khangminh22Category
view
3download
0
EFFECT OF PROCESSING ON
QUALITY AND SHELF LIFE OF LEAFY
VEGETABLES
by
SITI HAJAR ARIFFIN
A thesis submitted to the
University of Birmingham
for the degree of
DOCTOR OF PHILOSOPHY
School of Chemical Engineering
College of Engineering and Physical Sciences
University of Birmingham
May 2018

University of Birmingham Research Archive
e-theses repository This unpublished thesis/dissertation is copyright of the author and/or third parties. The intellectual property rights of the author or third parties in respect of this work are as defined by The Copyright Designs and Patents Act 1988 or as modified by any successor legislation. Any use made of information contained in this thesis/dissertation must be in accordance with that legislation and must be properly acknowledged. Further distribution or reproduction in any format is prohibited without the permission of the copyright holder.

i
ABSTRACT
There is a need to sustain quality of ready-to-eat (RTE) leafy vegetables in order to
improve shelf life of the products during postharvest storage. The main objective of
this thesis was to investigate the effect of compression towards the quality and shelf
life of the RTE leafy vegetables. This thesis focused on spinach leaves as the
representation of the RTE leafy vegetables. For this purpose, uniaxial compression
was chosen as a method to induce damage to the leaves. The effects of
compression towards qualities of RTE spinach were evaluated. The quality
measures in this study focused on mechanical and microstructural properties,
physical appearance, and fresh weight. Organic spinach was found to be the best
type in resisting stress compared to Teen, Salad, and Baby spinach. Population test
was developed to categorise the compressed leaves into degrees of leaf injuries
known as Undamaged, Minor, Halfway, and Complete teared. Force 200N was
suggested to be the minimum required to pick up differences of the leaves
deteriorations before and after storage. Uncompressed spinach leaves were found to
have a shelf life of 14 days. Higher degrees of leaf injuries which are Halfway and
Complete teared showed obvious decay since before storage. Sensory test was also
conducted to study consumers’ evaluations towards visibility of leaf damage and
perceptions in buying the product. Respiration rate of the RTE spinach stored at
different films was also measured using a closed system. Michaelis-Menten and
exponential models were used to study the respiration rate mechanism.

ii
“And I bestowed upon you love from Me (Lord) that
you would be brought up under My (Lord) eye”
(Al-Quran, 20:39)

iii
ACKNOWLEDGEMENTS
In the name of God, The Most Gracious the Most Merciful
All praises to the Almighty for helping me to go through and completed this beautiful,
precious journey. Thank you for guiding me when I was lost, for giving me the
strength when I was weak, for hearing my prayers when I have no one to talk to. I
cannot do this without Your constant Gracious, Love, Mercy and Protection.
Millions thanks to my parents, Hj. Ariffin Yusof and Hjh. Salamah Ismail for believing
in me. I am who I am today due to all the continuous prayers and motivations, the
patience and the never ending love you both have given me. Thank you so much to
my siblings and families as well for the supports and prayers.
I also would like to thank my supervisors, Dr. Kostas Gkatzionis and Professor
Serafim Bakalis for the guidance and support throughout the project. Thank you so
much for the care, trust and always believing in me. Thank you so much for all the
advices regarding the project as well as matters outside the project. I really
appreciate them all.
Special appreciation to post-docs Thomas Moxxon and Hani El-Kadri for always
make time for me whenever I need them. Thank you for the patience in teaching me
things that I could not figure out on my own regarding the project. Your kind helps
and teachings helped me a lot to go through this project. Many thanks as well to my
colleagues and staff, at the School of Chemical Engineering, University of
Birmingham especially Lynn Draper for the helps and supports provided whenever I
need them.

iv
Huge thanks to my close friends here, Mashitah, Naeemah, Faiqa, Anisa, Suaida,
Hafizah, Nursufiah, Gina; for always be with me during my ups and down. Thank you
so much for the love, friendship and making my life in Birmingham even more
beautiful. With God wills, all of you too will end this beautiful journey soon. Have
patience and keep on striving forward. I also would like to extend my sincerest
thanks to Malaysian community in Birmingham for making me feel like we are one
big family here in this foreign land. I cannot mention each of the names here but
rather keep them in my prayers.
Finally, I also would like to acknowledge full funding from the Ministry of Higher
Education Malaysia (MOHE) and Universiti Putra Malaysia (UPM). Thank you so
much for giving me the opportunity to pursue my PhD here at the University of
Birmingham, UK. I am truly honoured and grateful for the trust they have given me

v
TABLE OF CONTENTS
CHAPTER 1 ............................................................................................................... 1
INTRODUCTION ........................................................................................................ 1
1.1 The importance of vegetables ....................................................................... 1
1.2 Current practices in fresh food industry ......................................................... 4
1.3 Research objectives ...................................................................................... 6
1.4 Thesis overview ............................................................................................ 6
CHAPTER 2 ............................................................................................................... 8
LITERATURE REVIEW .............................................................................................. 8
2.1 Vegetables .................................................................................................... 8
2.2 The plant cell ............................................................................................... 10
2.3 Leaf structure .............................................................................................. 12
2.4 Shelf life of leafy vegetables........................................................................ 13
2.5 Postharvest handling and processing ......................................................... 14
2.5.1 Uniaxial compression............................................................................ 22
2.6 Mechanical injury ........................................................................................ 26
2.7 Quality changes of leafy vegetables during postharvest ............................. 28
2.7.1 Mechanical properties of leafy vegetables ............................................ 28
2.7.2 Browning and decay ............................................................................. 31
2.7.3 Colour changes .................................................................................... 33
2.7.4 Fresh weight loss .................................................................................. 34
2.8 Sensory evaluations .................................................................................... 35
vi
2.9 Respiration rate of fresh produce ................................................................ 36
2.9.1 Measuring respiration rate of fresh produce ......................................... 39
2.9.2 Modelling respiration rate of fresh produce........................................... 41
2.9.3 Quality changes of fresh produce stored at different films .................... 43
CHAPTER 3 ............................................................................................................. 45
EXPERIMENTAL PROCEDURES ........................................................................... 45
3.1 Sample preparation ..................................................................................... 45
3.2 Leaves deformation by uniaxial compression ............................................. 47
3.3 Texture analysis by penetration test ............................................................ 48
3.4 Microscopy imaging techniques .................................................................. 52
3.4.1 Light microscopy ................................................................................... 52
3.4.2 Microtome ............................................................................................. 52
3.5 Assessment of leaf injury by Population test ............................................... 54
3.5.1 Acquisition of the leaf image ................................................................. 57
3.5.2 Image analysis ...................................................................................... 58
3.5.3 Contour colour boxes ........................................................................... 58
3.6 Fresh weight loss ........................................................................................ 59
3.7 Moisture content .......................................................................................... 60
3.8 Sensory evaluation ...................................................................................... 61
3.9 Measuring respiration rate of spinach using closed system ........................ 62
3.10 Measuring colour changes of spinach ........................................................ 64
CHAPTER 4 ............................................................................................................. 67
COMPRESSION AND ITS EFFECT TOWARDS MECHANICAL PROPERTIES AND
QUALITIES OF LEAFY VEGETABLES .................................................................... 67
4.1 Introduction ................................................................................................. 67

vii
4.2 Materials and methods ................................................................................ 68
4.3 Results and discussion ............................................................................... 70
4.3.1 The energy of compression .................................................................. 70
4.3.2 Young’s modulus (E) of bulk spinach ................................................... 80
4.3.3 Textural property of individual spinach leaf........................................... 91
4.4 Conclusion .................................................................................................. 94
CHAPTER 5 ............................................................................................................. 98
MECHANICAL LEAF INJURY AND ITS EFFECT ON QUALITY AND SHELF LIFE
OF LEAFY VEGETABLES ....................................................................................... 98
5.1 Introduction ................................................................................................. 98
5.2 Materials and method ................................................................................ 100
5.3 Results and discussions ............................................................................ 101
5.3.1 Distribution of deteriorations ............................................................... 101
5.3.2 Comparison of quality and shelf life of Control and compressed leaves
throughout storage .......................................................................................... 113
5.4 Conclusion ................................................................................................ 123
CHAPTER 6 ........................................................................................................... 125
SENSORY EVALUATIONS BY CONSUMERS TOWARDS VISIBILITY OF LEAF
DAMAGES AND PERCEPTIONS IN BUYING THE PRODUCT ............................ 125
6.1 Introduction ............................................................................................... 125
6.2 Materials and methods .............................................................................. 126
6.3 Results and discussions ............................................................................ 127
6.3.1 Visibility of leaves deteriorations- Ranking test ................................... 127
6.3.2 Acceptance level on buying the product- Acceptance test.................. 130
6.4 Conclusion ................................................................................................ 138
viii
CHAPTER 7 ........................................................................................................... 140
RESPIRATION RATE OF LEAFY VEGETABLES STORED AT DIFFERENT
PACKAGING FILMS .............................................................................................. 140
7.1 Introduction ............................................................................................... 140
7.2 Materials and method ................................................................................ 141
7.3 Results and discussions ............................................................................ 142
7.3.1 Respiration rate of Control and compressed leaves at different
packaging films ............................................................................................... 142
7.3.2 Modelling the respiration rate of spinach ............................................ 148
7.3.3 The effect of packaging films towards quality attributes of spinach .... 154
7.3.4 Developing colour analysis technique to measure colour changes of
spinach… ........................................................................................................ 161
7.4 Conclusion ................................................................................................ 171
CHAPTER 8 ........................................................................................................... 173
CONCLUSIONS AND FUTURE WORK ................................................................. 173
ix
LIST OF FIGURES
Figure 2.1: Derivation of vegetables from different parts of the plant. The letters
indicate the principal origins of representative vegetables as follows: (A) flower bud,
(B) stem sprout, (C) seeds, (D) axillary bud, (E) petiole, (F) bulb (underground bud),
(G) stem tuber, (H) swollen root, (I) swollen root tuber, (J) swollen hypocotyls, (K)
swollen leaf base, (L) leaf blade, (M) fruit, (N) swollen inflorescence, (O) main bud.
Image from (Wills et al. 2007). ................................................................................... 9
Figure 2.2: Plant cell and its constituent organelles (Marques n.d.). ........................ 11
Figure 2.3: Cross section of a leaf (Marques n.d.). .................................................. 13
Figure 2.4: Basic processing line for spinach in the industry. Processing steps
adapted from Femia, France (Femia n.d.). ............................................................... 15
Figure 2.5: Illustration of the bulk spinach inside the bed chamber under the
compression test using Universal Testing Machine (Zwick/Roell UK). ..................... 24
Figure 2.6: Hook's law graph (Williams 2011). ......................................................... 29
Figure 2.7: Simplified diagram of the biochemistry of aerobic and anaerobic
respiration in plants. (Wills et al. 2007) ................................................................ 38
Figure 2.8: Closed system containing spinach samples. .......................................... 40
Figure 3.1: A) Universal testing machine Z030 mechanical tester (Zwick/Roell, UK)
and B) the acryllic chamber and the upper platon. ................................................... 47
Figure 3.2: The position of the spinach leaves inside the chamber A) before
compression; and B) after 100N compression. ........................................................ 48
Figure 3.3: TA-XT texture analyser (Patel & Owen 2016). ....................................... 49
Figure 3.4: Penetration rig and probe. ...................................................................... 50
Figure 3.5: Ad-axial side of the spinach leaf where the penetration took place. ....... 51
Figure 3.6: Series of tissue fixing. First image showed tissue dehydration within
series of ethanol concentrations. Second image showed tissues immersed in
clearing agent, HistoClear. The third image showed leaves tissues were positioned
inside the cassettes before surrounded with additional wax to form the block. The
last image is a ready wax block with the tissue embedded inside the wax. .............. 54
Figure 3.7: Spinach leaves arranged on a white tray inside the black box. .............. 57
x
Figure 3.8: ImageJ detecting the deteriorations on the back side of the leaf. The red
shaded regions were the regions of deteriorations detected by ImageJ................... 58
Figure 3.9: Matlab coding for contour colour boxes. ................................................ 59
Figure 3.10: The spinach leaves were placed on a small aluminium tray to measure
the moisture content. ................................................................................................ 60
Figure 3.11: Spinach leaves inside the closed system. ............................................ 63
Figure 3.12: Matlab coding for conversion of RGB values to L*a*b* values. ............ 65
Figure 3.13: Colour charts of 98 colours. ................................................................. 66
Figure 4.1: The force-displacement curves for Organic, Teen and Salad spinach
before and after storage. .......................................................................................... 72
Figure 4.2: Images of Teen, Organic and Salad spinach. ........................................ 73
Figure 4.3: The microstructures of 3 different types of spinach leaves; A) Teen, B)
Organic, and C) Salad. The average cell sizes were 30.99 µm, 60.75 µm, and 30.10
µm for Teen, Organic, and Salad spinach respectively. – was 50µm. .................... 74
Figure 4.4: Randomly thrown bulk spinach before and after 5 times consecutive
compressions of 200N. ............................................................................................. 75
Figure 4.5: MaxW of five consecutive compressions before and after storage for
Organic, Teen, and Salad spinach. .......................................................................... 77
Figure 4.6: Stacked spinach leaves without stem before and after compressions. .. 78
Figure 4.7: MaxW of five consecutive compressions before and after storage for
stacked Baby spinach with and without stem. .......................................................... 79
Figure 4.8: The microstructures of spinach leaves for A) Control, and after been
compressed with B) 30N, c) 60N, D) 90N, E) 100N, F) 110N, G) 140N, H) 170N, I)
200N. – was 50µm .................................................................................................. 84
Figure 4.9: Cross section of Baby spinach leaves compressed with 200N observed
under light microscope with 10X objective magnification. A) day 0; B) day 7 ........... 86
Figure 4.10: Digital images showed mechanical damage of Baby spinach leaves
after 200N compression A) Front sides; B) Back sides. ........................................... 88
Figure 4.11: Average of Burst strength of Baby spinach between different treatments
(Control, 100N, 150N, 200N) throughout storage days, ± standard deviation. ......... 93
xi
Figure 4.12: Average Burst strength of Young spinach between different treatments
(Control, 100N, 150N, 200N) throughout storage days, ± standard deviation. ......... 94
Figure 5.1: Distribution of deterioration of Control Baby spinach. .......................... 102
Figure 5.2: Contour colour plot of Control spinach leaves throughout storage days.
The number inside each colour box represents the frequency of the leaves that got
more than 1% decays. ............................................................................................ 102
Figure 5.3: : Colour contour plots of different degrees of injuries and force of
compressions at A) Day 1; B) Day 4; C) Day 8; D) Day 11; E) Day 14. The number
inside each colour box represents the frequency of the leaves that got more than 1%
decays. ................................................................................................................... 108
Figure 5.4: Frequency of spinach leaves that got >1% of deterioration after Day 8.
............................................................................................................................... 109
Figure 5.5: Distribution of deteriorations of spinach leaves compressed under 200N.
............................................................................................................................... 111
Figure 5.6: Distribution of deteriorations of spinach leaves compressed under 100N.
............................................................................................................................... 112
Figure 5.7: The frequency of spinach leaves that got more than 1% of total decays
throughout storage for Control and leaves compressed under 50N, 100N, 150N, and
200N. ...................................................................................................................... 114
Figure 5.8: Average of leaves deteriorations between Control and different leaf
injuries compressed under a) 200N, b) 150N, c) 100N, and d) 50N. ...................... 116
Figure 5.9: 1st order modelled of leaf deterioration under 200N. ........................... 118
Figure 5.10: Rate of leaves decays at different leaf injuries between different forces
of compression. ...................................................................................................... 119
Figure 5.11: Percentage of fresh weight loss for leaves compressed under a) 50N, b)
100N, c) 150N, and d) 200N. ................................................................................. 121
Figure 5.12: Moisture content of spinach leaves at day 0. ..................................... 122
Figure 6.1: Scores for Acceptance test on the effect of storage days towards buying
acceptability. .......................................................................................................... 131
Figure 7.1: The percentage of O2 concentration inside the closed jars for Control
spinach treated under Film 1, Film 2, and Film 3. .................................................. 143

xii
Figure 7.2: The percentage of O2 concentration inside the closed jars for 200N-
compressed spinach treated under Film 1, Film 2, and Film 3. .............................. 145
Figure 7.3: The percentage of CO2 concentration inside the closed jars for Control
spinach treated under Film 1, Film 2, and Film 3. .................................................. 147
Figure 7.4: The percentage of CO2 concentration inside the closed jars for 200N-
compressed spinach treated under Film 1, Film 2, and Film 3. .............................. 148
Figure 7.5: Uncompetitive Michaelis-Menten model for 200N-compressed spinach
treated under Film 1. .............................................................................................. 149
Figure 7.6: Exponential model for 200N-compressed spinach treated under Film 1.
............................................................................................................................... 150
Figure 7.7: Uncompetitive Michaelis-Menten model with the OTR term for 200N-
compressed spinach treated under Film 1. ............................................................ 153
Figure 7.8: Exponential model with the OTR term for 200N-compressed spinach
treated under Film 1. .............................................................................................. 153
Figure 7.9: Fresh weight loss for Control and 200N-compressed spinach stored at A)
Film 1; B) Film 2; and C) Film 3. ............................................................................. 155
Figure 7.10: MaxF for Control spinach sample S4 stored under Film 1, Film 2, and
Film 3. .................................................................................................................... 158
Figure 7.11: MaxF for 200N-compressed spinach sample S4 stored under Film 1,
Film 2, and Film 3. .................................................................................................. 158
Figure 7.12: MaxD for Control spinach leaves stored under Film 1, Film 2, and Film
3. ............................................................................................................................ 159
Figure 7.13: MaxD for 200N-compressed spinach leaves stored under Film 1, Film 2,
and Film 3. ............................................................................................................. 160
Figure 7.14: Calibration colour curves for A) L*, B) a*, C) b* for values from
colorimeter against camera. ................................................................................... 165
Figure 7.15: Plots of Lab values measured using both colorimeter and conversion of
RGB images. .......................................................................................................... 170
Figure 8.1: Stomata opening of spinach leaves under light treatment. The image was
observed using SEM. ............................................................................................. 177
xiii
LIST OF TABLES
Table 3.1: Types of spinach used in this project. ..................................................... 46
Table 3.2: Texture analyser settings for penetration test . ........................................ 50
Table 3.3: Characterisation of the leaf injuries. ........................................................ 55
Table 3.4: Front and back side images of spinach sample S4 for Control,
Undamaged, Minor teared, Halfway teared, and Complete teared. ......................... 56
Table 3.5: Camera settings. ..................................................................................... 57
Table 3.6: Types of packaging films. ........................................................................ 63
Table 4.1: MaxW values after compressions before and after storage. ................... 71
Table 4.2: Average MaxW of each five consecutive compressions. ......................... 77
Table 4.3: Average MaxW of stacked spinach. ........................................................ 80
Table 4.4: E values of different types of spinach before and after storage. .............. 81
Table 4.5: Average E values for different types of bulk spinach before and after
storage. .................................................................................................................... 81
Table 4.6: E values of bulk spinach compressed at different forces. ........................ 83
Table 4.7: Average E values of bulk spinach compressed at different forces. ......... 83
Table 4.8: E values of bulk spinach at different weight for both whole and cut Baby
spinach. .................................................................................................................... 90
Table 4.9: Average E values of bulk spinach at different weight for both whole and
cut Baby spinach. ..................................................................................................... 90
Table 5.1: Library of images of Control and 200N compressed spinach leaves
throughout storage. ................................................................................................ 104
Table 5.2: k values of different leaf injuries under 200N, 150N, 100N, and 50N .... 118
Table 6.1: Scores for Ranking test on the effect of storage days towards visibility of
leaves deteriorations. ............................................................................................. 128
Table 6.2: Scores for Ranking test on the effect of degree of leaf injuries towards
visibility of leaves deteriorations. ............................................................................ 130

xiv
Table 6.3: Scores for Acceptance test on the effect of degree of leaf injuries towards
buying acceptability. ............................................................................................... 134
Table 7.1: Predicted parameters for Uncompetitive Michaelis-Menten model equation
of spinach sample S4 for Control and 200N-compressed leaves............................ 151
Table 7.2: Predicted parameters for Exponential model equation of spinach sample
S4 for Control and 200N-compressed leaves. ........................................................ 151
Table 7.3: The percentage of fresh weight loss for Control and 200N-compressed
spinach stored at different packaging films. The data represent the mean of three
replicates ± standard deviation. .............................................................................. 154
Table 7.4: The average values of MaxF, N. The data represent the mean of 20
replicates ± standard deviation. .............................................................................. 159
Table 7.5: The average values of MaxD, mm. The data represent the mean of 20
replicates ± standard deviation. .............................................................................. 160
Table 7.6: L*, a*, b* values measured using colorimeter for Control spinach stored
under Film 1, Film 2, and Film 3. The data represent the mean of 24 replicates ±
standard deviation. ................................................................................................. 162
Table 7.7: L*, a*, b* values measured using colorimeter for 200N-compressed
spinach stored under Film 1, Film 2, and Film 3. The data represent the mean of 24
replicates ± standard deviation. .............................................................................. 162
Table 7.8: L*, a*, b* values converted from RGB values for Control spinach stored
under Film 1, Film 2, and Film 3. The data represent the mean of 24 replicates ±
standard deviation. ................................................................................................. 163
Table 7.9: L*, a*, b* values converted from RGB values for 200N-compressed
spinach stored under Film 1, Film 2, and Film 3. The data represent the mean of 24
replicates ± standard deviation. .............................................................................. 163
Table 7.10: Parameters values for the calibrated colour curves of L*, a*, and b*. .. 164
Table 7.11: L*, a*, b* values from RGB values and converted to the respective
colorimeter values using calibration curves for Control spinach stored under Film 1,
Film 2, and Film 3. The data represent the mean of 24 replicates ± standard
deviation. ................................................................................................................ 167
Table 7.12: L*, a*, b* values from RGB values and converted to the respective
colorimeter values using calibration curves for 200N-compressed spinach stored
under Film 1, Film 2, and Film 3. The data represent the mean of 24 replicates ±
standard deviation. ................................................................................................. 167
xv
Table 7.13: Plots of L*, a*, and b* values measured using A) colorimeter, and B)
RGB converted to L*, a*, b* for both Control and 200N-compressed spinach. ....... 168
Table A.1.1: 2 Way ANOVA- Overall comparisons for Average MaxForce (Burst
Strength) between groups and storage days .......................................................... 180
Table A.1.2: 2 Way ANOVA- Overall comparisons for Average MaxForce (Burst
Strength) between groups and storage days .......................................................... 181

xvi
ABBREVIATIONS
AsA Ascorbic acid
ATP Adenosine triphosphate
AUC Area under the curve
BOPP Biaxially oriented polypropylene
CO2 Carbon dioxide
E Young’s modulus
EOW Electrolysed oxidising water
FADH2 Flavin adenine dinucleotide-reduced form
HPDC High pressure carbon dioxide
LDPE Low-density polyethylene
MAP Modified atmosphere packaging
MaxF Burst strength
MaxD Flexibility
MaxW Maximum work of compression
MinTS Minimum tool separation
NaCl Sodium chloride
NADH Nicotinamide adenine dinucleotide-reduced form
NEW Neutral electrolysed water
O2 Oxygen
OPP Orientated polypropylene
OTR Oxygen transmission rate
PE Polyethylene
RGB Red, Green, and Blue colour space
RSD Relative standard deviation

xvii
RSM Response surface methodology
RTE Ready-to-eat
TCA Tricarboxylic acid
WVTR Water vapour transmission rate
1
CHAPTER 1
INTRODUCTION
1.1 The importance of vegetables
Vegetables play an important role in contributing vitamins, minerals, and
dietary fibre in human diets. They are well known for their benefits in a healthy
lifestyle where the nutritional values contained within the vegetables can protect
against chronic degenerative ailments (Leather 1995; Hartley et al. 2013; Dinnella et
al. 2014) e.g. vitamin K, lutein, 𝛽-carotene, 𝛼-tocopherol, folate, nitrate, and
kaempferol found in green leafy vegetables offer numerous health benefits including
reduced risk of heart disease, obesity, high blood pressure and mental decline
(Enloe 2018; Morris et al. 2018). Folate which is found abundantly in spinach also
plays a role in red blood cell production and prevention of neural tube defects in
pregnancy (Furness et al. 2013) whereas, 𝛽-carotene and lutein have shown to
prevent eye disorders such as cataracts and muscular degeneration (Semba &
Dagnelie 2003; Bone et al. 2007). Sulforaphane which is found in cruciferous
vegetables such as broccoli, Brussels sprouts and cabbages may improve bacterial
gut flora and decrease the risk of cancer and heart disease (Tian et al. 2018).
Cox et al. (1996) reported that in the nineties, many food health campaigns
have been launched to promote the intake of vegetables and fruits where 400g of
vegetables and fruits were suggested as a daily intake by the World Health
2
Organisation (WHO 1990). However, despite these public health campaigns besides
clinical evidence, there was still a lack of vegetable and fruit intake in many countries
where consumption remained below the recommended daily intake. This was due to
the lack of will power to change to a better healthy diet and economic constraints
among lower income groups (Marshall et al. 1994; Anderson et al. 1998). It has been
reported that among the low income groups in the United Kingdom, there was low
intake of vitamin C and carotene which was associated with low intake of
“expensive” vegetables and fruits; this possibly resulted in a higher mortality rate
(Leather 1995). On the other hand, within the higher income groups, constraints
came from the consumers’ social environment where more women got less time for
cooking due to working outside home, lack of interest in cooking and increase in the
consumption of take-out foods (Lambert 2001; Ragaert et al. 2004). This shows that
convenience plays the major motivation for the consumer in buying the product. It
has been reported that health attribute was not as important to be the major
motivation in buying the minimally processed vegetables despite consumers’
awareness on the health benefits (Ragaert et al. 2004). Due to hectic and busy
lifestyles, consumers prefer products that are easy to prepare with convenient
packaging. Time pressure is one of the main factors that lead to consumers
preferring convenience products (Verlegh & Candel 1999; Candel 2001).
Nowadays, ready-to-eat (RTE) vegetables are gaining more attention from
consumers and the food industry (Ragaert et al. 2004). Today’s societies are more
conscious towards healthier diet which leads to the explosive demand of packed
leafy greens and salads (Gilbert 2000). The growing of interest towards RTE
products is due to the practicality while at the same time they are good source of
antioxidants and phytochemicals associated with some disease prevention (Ames et

3
al. 1993). The packed RTE vegetables are very easy to prepare, time saving, lower
shipping cost, and store well (Odumeru et al. 2002). Due to their convenience,
nutrition and fresh-like properties, they become one of the most important food
components in food industry. Wide variety of minimally processed vegetables have
been developed to meet consumers’ demands for quick, convenient, and healthy
products (Ahvenainen 1996; Ragaert et al. 2004). In a study reported by Ragaert et
al. (2004), the demand of the freshly processed vegetables grew approximately 10 –
25% per annum since 1990 in Western Europe, while specifically in Belgium, the
minimally processed vegetables formed more than 50% of the total vegetables and
fruits at the retail level.
RTE or also known as minimally processed vegetables are defined as fresh
vegetables that have undergone minimal processes to increase their functionality
while maintaining their fresh-like properties (Ragaert et al. 2004; Dinnella et al.
2014). Examples of the processes are washing, cutting, mixing and packaging.
Centralised processing system helps in facilitating products from different farms for
the process series. However, these series of processes caused the products to
become highly perishable as they created a longer food chain which exposed the
products to mechanical damage and growth of microorganisms e.g. E.coli,
Salmonella, and Listeria monocytogenes (Jacxsens et al. 2001; Rico et al. 2007;
Oliveira et al. 2010; Anderson et al. 2014). It also helped in any possible distribution
of the potential pathogens to more people in more geographically disperse areas (De
Roever 1998). It is such a challenge for the food industry to maintain and improve
the quality and shelf life of the bagged leafy vegetables as the qualities of the
vegetables are gradually changing throughout postharvest storage due to the
physiological activities involved in tissue senescence (Rico et al. 2007). Therefore,

4
there is a need to sustain the qualities of the RTE vegetables in order to improve the
shelf life of the products during postharvest storage.
1.2 Current practices in fresh food industry
Food industries have invented so many methods and treatments in order to
maintain and improve the shelf life of the RTE vegetables. However, uncontrolled or
excessive treatments caused accidental damage which then leads to quality and
shelf life reduction of the products. Up to date, the industry has been monitoring the
quality of the fresh product varieties before they are ready to be marketed. Quality
inspection has been done extensively in order to provide the best product for the
consumers. The industry usually goes for the best variety for sale. List of criteria was
made to ensure the product that passes the quality inspection is good enough for the
consumer. However, the criteria on choosing the best type was made before the
product undergoes the processing steps. Question arises as does the product
chosen as best variety before processing still remains the best type after
processing? The best variety is not only the one that exhibits good qualities before
processing but also the one that is best in resisting stress even after undergone the
processes. There is still lack of understanding on the effect of processing toward
quality and shelf life between different varieties. In the industry, there is still lack of
understanding between these interactions as the industry did not do this collectively;
rather they assess the quality individually. The industry needs to understand and
able to correlate the impact of mechanical injury that caused during processing as
well as which types of varieties is the best in resisting the stress. In handling quality

5
management, it is important to have understanding on the raw material, the
performance of the raw material during processing and how they connected to each
other. Selection of raw material, effect of processing, and also storage treatment
need to be studied as a whole rather than individual assessment as what the
industry treat them. My work is including compression as one of the impact caused
during processing and how different types of varieties response to it.
Apart from that, the industry also only monitors quality of original fresh leaves,
while they don’t do shelf life study on the compressed leaves. Although quality
inspection has been conducted in choosing the best state of product, situation that
happens inside the packed product especially the fresh one is out of the industry
coverage. Fresh product that already undergone series of processing was packed
and goes straight to the retailers and then consumers. It is important to study the
effect of compressed leaves towards quality and shelf life. Logically speaking, when
comparing between fresh and damage fresh products, people tend to expect that the
fresher the products, the longer the shelf lives. However, that was just from the
logical thinking. Do mechanically injured leaves proven to have shorter shelf life than
intact leaves? In the literature, there is still lacks of data to describe this situation.
Thus having the understanding on the effects of processing which this study focused
on compression, and developing a method to assess different degree of injury and
their effects towards quality and shelf life of the product would be beneficial for the
fresh produce industry. Precaution can be made to minimise damage during
processing thus improve the quality and shelf life of the fresh product. Having this
knowledge also could help to educate consumer as for them to make better decision
in buying the product.
6
1.3 Research objectives
The aim of this thesis was to study the effect of processing on quality and
shelf life of ready-to-eat (RTE) spinach. This thesis focused on compression as one
of the possible situations that occurs during handling of the RTE spinach from the
retailers to the consumers. This thesis comprised of four research objectives:
1. To study the effects of compression towards mechanical property,
microstructural property and quality of RTE spinach.
2. To develop a method to assess different degrees of mechanical leaf injuries
and together with force and degrees of compressions, how they affect quality
and shelf life of RTE spinach during postharvest storage.
3. To investigate consumers’ evaluations on the visibility of leaf damage and
how it affects their perceptions in buying the RTE spinach.
4. To study the effects of the mechanical leaf damage and type of packaging film
towards respiration rate and quality changes of the RTE spinach during
postharvest storage.
1.4 Thesis overview
This thesis covers the effect of processing towards quality and shelf life of
RTE leafy vegetables. Chapter 1 covers the importance of the RTE leafy vegetables.
Research objectives are also included in this chapter. In Chapter 2, all background
studies related to this project are described. The processing and handling of fruits
and vegetables are explained extensively and their effects towards quality changes
7
of the products during postharvest are described. Besides that, background of
sensory test and respiration rate that are conducted in this study are also described.
Chapter 3 combined all the methodologies carried out in this study. From the main
sample preparation, to uniaxial compression method, assessing degree of injury,
measuring quality changes, measuring mechanical property and evaluating
microstructural property, all are included in this chapter. Sensory test and respiration
rate protocols are also described. Chapter 4 is about compression as the
representation of processing that cause mechanical damage to the RTE products
and how it affects the mechanical and microstructural property, and quality of the
RTE leafy vegetables. Chapter 5 describes the effect of degree of mechanical leaf
injury and force of compression towards quality and shelf life of the RTE leafy
vegetables. The responses from the mechanically damaged leaves were compared
to non-damaged leaves based on distribution of deteriorations, kinetic decay, and
fresh weight loss. Chapter 6 covers sensory evaluations by consumers towards
visibility of leaf damages and perceptions in buying the product. Ranking test was
conducted to give rank to the visibility of leaf the damage and Acceptance test was
conducted to study consumer’s acceptance in buying the product. The final chapter
is Chapter 7, where the respiration rates of the RTE leafy vegetables stored at
different packaging films were discussed. The respiration rates between
mechanically injured and intact leaves were also compared. Uncompetitive
Michaelis-Menten and exponential models were used to study the respiration rate
mechanism. The effects of the packaging film towards quality changes of the product
during storage were also included. Finally, Chapter 8 is the conclusion and
recommendations for future study.
8
CHAPTER 2
LITERATURE REVIEW
2.1 Vegetables
Vegetables are derived from various parts of the plant (Figure 2.1). They are
generally grouped into three main categories: fruit, seeds and pods; bulbs, roots and
tubers; flowers, buds, stems and leaves (Wills et al. 2007). Grouping or classification
of the plant parts is necessary as the plant products have varied responses after
harvest. It is beneficial to group together products with similar environmental
requirements after harvest for quality preservation or those that are vulnerable to
chilling or other types of injury (Kays 1991).
The main focus of this thesis is on leafy green vegetables, represented by
RTE spinach (Spinacia oleracea). Spinach is a green leafy vegetable that is rich in
healthy compounds such as vitamin A and C, flavonoids, iron, calcium, and dietary
fibre (Conte et al. 2008). Spinach contains high antioxidant capacity which regular
consumption may be of interest for disease prevention. It ranked third in total
antioxidant capacity after garlic and kale (Cao et al. 1996). Spinach originated from
central and southwestern Asia and it started to be introduced in the UK in the 14th
century. In recent years, the demand for RTE spinach has been increasing, thus the
production increased as well. In 2016, according to analyst from IRI UK, the RTE
spinach placed second top most wanted green vegetables in the UK supermarkets

9
Figure 2.1: Derivation of vegetables from different parts of the plant. The letters indicate the principal origins of representative vegetables as follows: (A) flower bud, (B) stem sprout, (C) seeds, (D) axillary bud, (E) petiole, (F) bulb (underground bud), (G) stem tuber, (H) swollen root, (I) swollen root tuber, (J) swollen hypocotyls, (K) swollen leaf base, (L) leaf blade, (M) fruit, (N) swollen inflorescence, (O) main
bud. Image from (Wills et al. 2007).
with 21% increment of demand, after avocados with sales increment of 31% (IRI
2016). People use spinach for cooking, juicing and it can also be eaten right away as
a salad. Spinach is also very good in promoting healthy skin, giving aids in digestion,
nourishing eyes, building bones, improving nerve function and it also good as
antioxidants and anti-inflammatory (Khaliq 2014).
As spinach consists around 90% of water content, it has high respiration and
water loss rates which made it susceptible to tissue decay (Hodges & Forney 2003),

10
nutrients loss (Pandrangi & Laborde 2004; Bergquist et al. 2006), and microbial
growth (Conte et al. 2008) which then lead to shelf life reduction.
The minimal processes of spinach usually involved washing and cutting
procedures and they have a shelf life of 5-6 days (Cocetta et al. 2014). Although the
processes are mild, the fresh-cut spinach lost its physical and nutritional qualities as
the tissues are damaged. The cutting procedure speed up the senescence process
of the spinach (Cocetta et al. 2014). Senescence is due to the deterioration of
cellular membranes and mainly associated to excessive reactive oxygen species
(ROS) (Hodges et al. 2004). ROS is significant in maintaining abiotic stress response
and physiological process in plants. However, during oxidative stress, when ROS
level increase dramatically, it can lead to significant damage to the cell structures
(Cocetta et al. 2014). Disintegration of cellular membranes, repression of enzyme
activities, and loss of pigments were always demonstrated as shelf life and nutritional
quality reduction of spinach (Hodges et al. 2004).
2.2 The plant cell
Most postharvest quality changes are due to changes at the cellular level,
thus this section provides brief explanation of plant cell and its constituent organelles
(Figure 2.2).
Plant cells vary widely in size, function, organisation, and response after
harvest. Interior to the cell wall is the plasma membrane or plasmalemma that
divides the interior of the cell and its contents from the cell’s external environment.
11
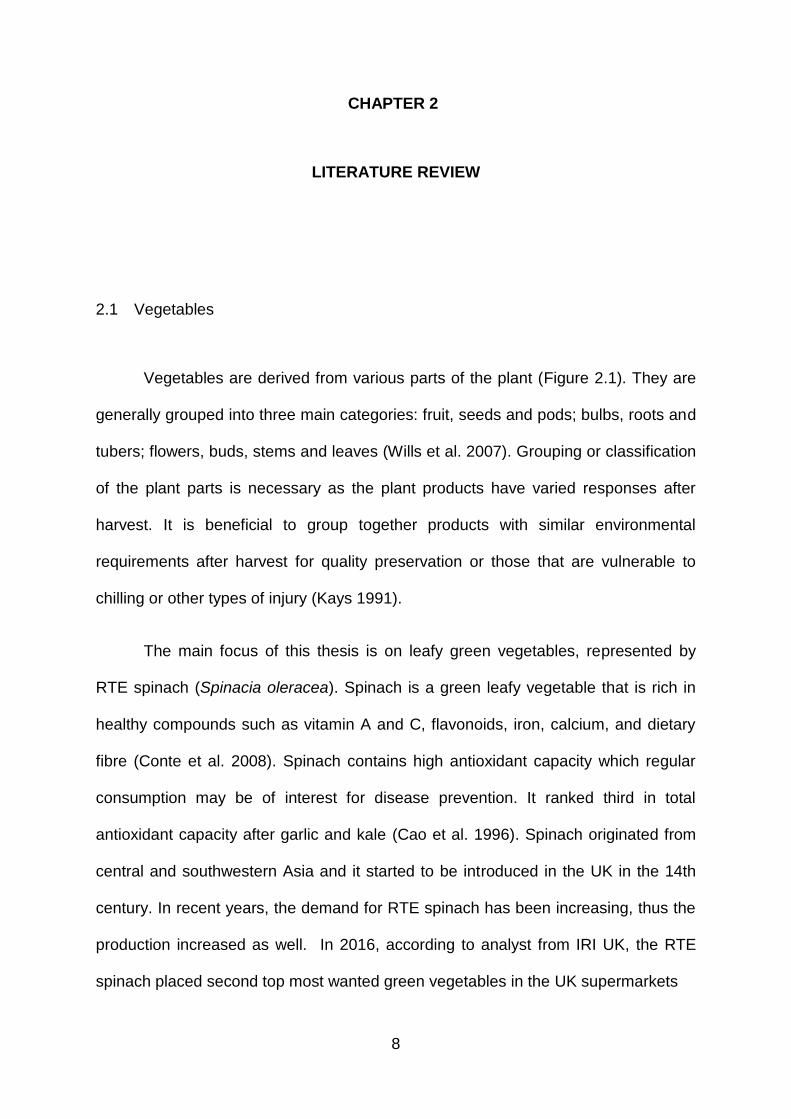
The plasmalemma keeps the vegetables turgid by maintaining pressure inside the
cell. It is this turgidity that keeps the vegetables crisp and firm (Wood et al. 2005).
Plasmodesmata is a series of channels that allows exchange of various substances
Figure 2.2: Plant cell and its constituent organelles (Marques n.d.).
between the cell. Inside the cell, there is a fluid matrix of proteins, solutes and
macromolecules known as cytoplasm. Important processes and reactions that occur
within cytoplasm include cells energy transfer, protein synthesis and breakdown of
storage reserves of carbohydrate by glycolysis (Kays 1991; Wills et al. 2007). Within
the cytoplasm, there are also several important organelles which include the nucleus
that control the activity of the cell, mitochondria that acts as the powerplant of the cell
by breaking down products from sugar into energy, chromoplast which developed
mainly from chloroplast once chlorophyll is degraded and it gives colour to fruits and
vegetables, chloroplast that is responsible for photosynthesis, vacuole the reservoir
of liquid containing sugars, acids and other materials, and amyloplasts that contain
starch grains (Wills et al. 2007).
12
Breaking or crushing the cells allows the compounds inside the cell to mix.
For example, the oxidising enzymes in the cytoplasm mix with phenols held in the
vacuole thus turning them brown. This browning is what we see in bruises and on cut
surfaces. If the cell walls break due to mechanical or chilling injury, then the cell lost
its turgidity and caused the release of the cell’s contents, resulting in tissue softening
(Marques n.d.). An understanding of the structure and function of the cells provides
basis for a thorough understanding of quality changes occur in the product during
postharvest.
2.3 Leaf structure
The main function of leaves is to acquire carbon dioxide for photosynthesis.
The leaves also help to regulate the plant’s temperature by controlling the
transpiration process (Kays 1991). However, these functions no longer operative
after harvest. Therefore, leaves depend on recycled carbon found within the cells for
their maintenance of life. Still, most leaves do not able to store the carbon for a long
term which then caused lack of energy reserves within the leaves leading to shelf life
reduction (Kays 1991).
A cross section of leaf is shown in Figure 2.3. The exterior surface of leaves is
covered with waxy cuticle that helps to decrease water loss where water vapour and
gaseous must pass through the opening of stomata between the guard cells. The
opening of lenticel also allows gaseous exchange inside and outside of the plant
tissue. The epidermis lies beneath the cuticle acts as a border between inner cells
and the surrounding. Spongy mesophyll lies directly beneath the epidermis and this

13
is the important site for supplying the living plant with energy during photosynthesis.
During transpiration, water evaporates from the cell walls of the mesophyll into the
intercellular space that is directly connected to the outside air during the opening of
stomata (Salisbury & Ross 1992). The veins (xylem and phloem) are the vascular
tissue located in the spongy layer. They help to transport fluid and nutrients within
the plant.
Figure 2.3: Cross section of a leaf (Marques n.d.).
2.4 Shelf life of leafy vegetables
The shelf life of a product is defined as the time duration that a product can
maintain a specific quality level under specified storage conditions. The shelf life of a
product must exceed the distribution time from the retailer to the consumer in order
to give reasonable period of usage and home storage (Piagentini & Güemes 2002).
Giménez et al. (2012) defined shelf life as the storage time where the product has
reach above its predetermined deterioration level which is not saleable.
14
Since leafy vegetables are living organisms, there are transformations on the
mechanical and chemical properties of the vegetables during storage because of the
respiration, transpiration, and loss of moisture content to surrounding after harvested
(Jung et al. 2012). These result in unfavourable qualities of the products such as
browning, yellowing, shrinking leaves, releasing bad odours and bad taste (Niemira
& Fan 2006; Neal et al. 2010). The shelf life of the fresh cut vegetables was
significantly limited by appearance changes and odour (Medina et al. 2012; Dinnella
et al. 2014).
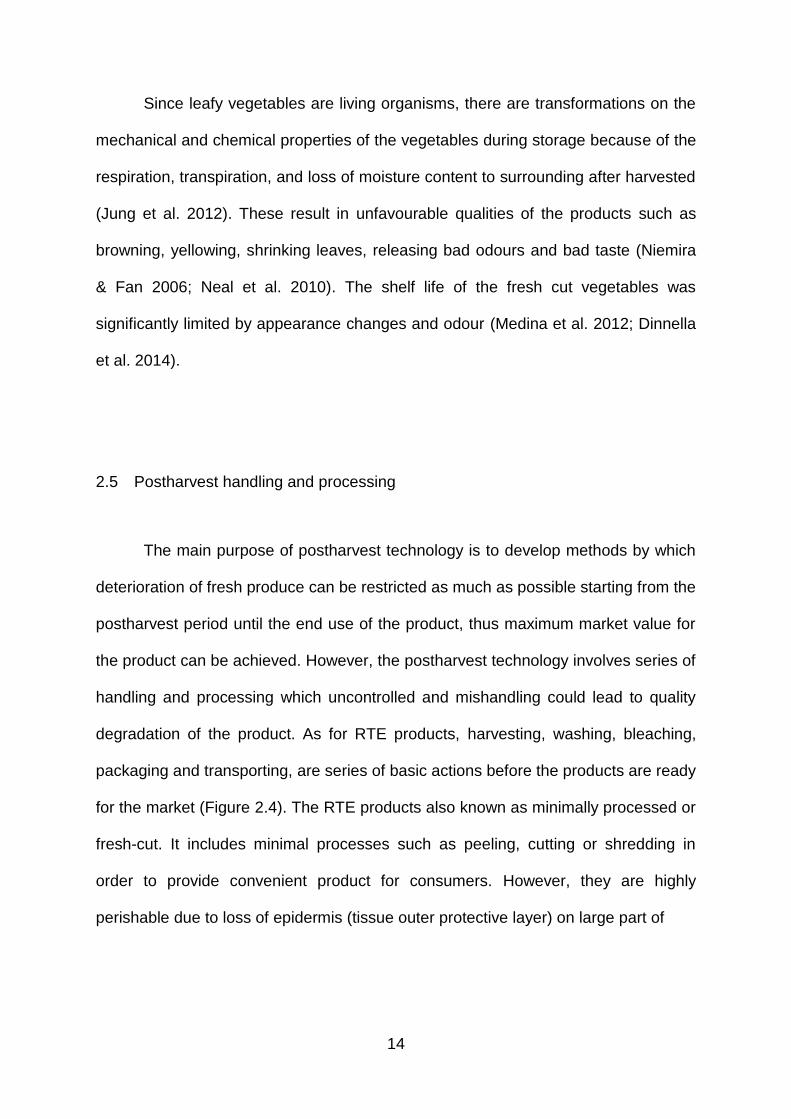
2.5 Postharvest handling and processing
The main purpose of postharvest technology is to develop methods by which
deterioration of fresh produce can be restricted as much as possible starting from the
postharvest period until the end use of the product, thus maximum market value for
the product can be achieved. However, the postharvest technology involves series of
handling and processing which uncontrolled and mishandling could lead to quality
degradation of the product. As for RTE products, harvesting, washing, bleaching,
packaging and transporting, are series of basic actions before the products are ready
for the market (Figure 2.4). The RTE products also known as minimally processed or
fresh-cut. It includes minimal processes such as peeling, cutting or shredding in
order to provide convenient product for consumers. However, they are highly
perishable due to loss of epidermis (tissue outer protective layer) on large part of
15
Figure 2.4: Basic processing line for spinach in the industry. Processing steps adapted from Femia, France (Femia n.d.).

16
their surface area (Watada et al. 1996). Fresh-cut vegetables are susceptible to
decay, tissue softening, discolouration, and development of off-odours (Zagory &
Kader 1988; Bolin & Huxsoll 1991). The ruptured cells due to grating and peeling
caused the release of the oxidising enzymes (Ahvenainen 1996; Almualla et al.
2010). Large number of cut surfaces as well as high humidity are the perfect
conditions for the growth of microorganisms (Ahvenainen 1996). Thus, selecting
proper maturity of products for processing, controlling defects and disorders while
maintaining relative humidity, temperature, and atmosphere are important to produce
high quality fresh-cut products (Watada & Qi 1999). Constant temperature and
proper gas composition maintained throughout the storage helped to extend the
shelf life of spinach (Neal et al. 2010). Optimum atmosphere efficiently delayed the
quality deterioration of the produce during storage (Watada et al. 1996). The fresh-
cuts need to be stored at lower temperature than that recommended for intact
products. Usually, 0°C is the preferable temperature for most fresh cut products,
however, many are prepared, shipped and stored at 5°C and sometimes up to 10°C
which then fasten the deterioration process (Watada et al. 1996). As for spinach,
commercially, they are packed in polypropylene bags and stored close to 0°C,
however, most of the times they are kept in the range of 4-10°C (Bergquist et al.
2006). In a study reported by (Fan et al. 2014), storing spinach at 7.5°C with high
relative humidity (> 90%) can improve the shelf life of the product.
Several studies have been done to determine the effect of washing towards
improving the shelf life of the RTE leafy vegetables. Warm chlorine water was found
effective to improve overall appearance while reducing psychrotrophic
microorganisms that might cause deterioration of RTE packed lettuce (Odumeru et
al. 2003). Several workers have studied the effects of different sanitising agents
17
towards microbial loads, nutritional contents, and sensory quality of fresh-cut
escarole, lettuce, rocket leaves, and baby spinach ( Martínez-Sánchez et al. 2006;
Allende et al. 2008; V. M. Gómez-López et al. 2013). The highest concentration of
vitamin C in baby spinach was found after washed with sodium hypochlorite and
EOW, while product washed with peroxyacetic acid and EOW + NaCl showed
significantly lower values of vitamin C. The increased amount of oxidants produced
in EOW + NaCl and the oxidant action of peroxyacetic acid decreased the content of
vitamin C after washing, although this effect became less relevant during storage. In
fact, after 6 days of storage, baby spinach washed with chlorine-based sanitisers
showed lower vitamin C content than the non-chlorine based sanitisers (V. M.
Gómez-López et al. 2013). Previous studies have also reported the degradation of
vitamin C in rocket leaves washed with peroxyacetic acid was lower than with other
commercial sanitisers such as acidified sodium chlorite and lactic acid (Martínez-
Sánchez et al. 2006). Combination of washing with chlorine dioxide and packaged
under MAP helped to reduce the microbial loads thus improve the safety of spinach
during consumption time (Lee & Baek 2008).
Studies have also been done to determine factors such as temperature and
conductivity of the wash water as well as the packaging method that affecting the
microbial counts for lettuce and spinach during processing lines and postharvest
storage (Bolin & Huxsoll 1991; Barrera et al. 2012). Cocetta et al. (2014) stated that
temperature and cutting methods greatly affected the reduction of ascorbic acid
(AsA) of fresh-cut baby spinach leaves. Similar trend of AsA reduction were also
reported on various fresh-cut fruits and vegetables as reported in the study stored at
different temperatures (Lee & Kader 2000; Fernando Reyes et al. 2006; Gil et al.
2006).

18
Other factor such as low relative humidity could minimise Salmonella in baby
spinach (Gómez-López et al. 2013). Inappropriate use of pesticide could lead to the
increment of microbial loads thus affecting shelf life and safety of vegetables (Ng et
al. 2005). Microbial predictive models have been developed in order to predict the
total microbial count reduction at various conditions. E. coli O157:H7 growth
prediction models of lettuce based on the effect of MAP and storage temperatures
after treated with chlorine water (Posada-Izquierdo et al. 2013) and neutral
electrolysed water (NEW) may be efficiently relevant to be incorporated in the
quantitative risk assessment studies (Posada-Izquierdo et al. 2014). Pirovani et al.
(2001) stated that Response Surface Methodology (RSM) would be sufficient to
predict microbial log count reduction as well as chlorine concentration in wash water
of fresh-cut spinach.
Modified atmosphere packaging (MAP) also has been widely used in the food
industry to control the atmosphere of the packed foods. MAP is widely applied in the
RTE or fresh vegetables industry which it helps in preserving and prolonging the
food produces. Maintaining low CO2 concentration below 5% in the packaging bag
preserves and improves the shelf life of fresh-cut butter head lettuce (Varoquaux et
al. 1996). Exposing fresh-cut Romaine lettuce under light promotes photosynthesis
which resulting in the increment of O2 concentration thus stimulate browning and
loss of quality (Martinez-Sanchez et al. 2011). Maintaining optimum atmosphere
during handling process of fresh-cut kale, and mixed load of snap beans and
strawberries could be effectively achieved by combining the controlled
atmosphere/MA system (Brecht et al. 2003). Jo et al. (2014) tested an active flush
system of the sensor-controlled MA and its effectiveness in maintaining the
atmosphere inside the container compared to a perforated package, thus preserving

19
the quality of the vegetables. MA container with time-controlled gas-diffusion tube
was capable of producing an optimal MA which agrees with the estimation from the
design thus lead to better control of spinach quality (Kwon et al. 2013). Other work
has been done by (Rodriguez-Hidalgo et al. 2010) which helps to preserve the
quality and shelf life of minimally processed baby spinach planted in floating trays
where N2O-enriched atmospheres was used as an alternative to passive MAP.
In addition to that, up to recent postharvest technologies, treatment with low
to moderate UV-C radiation is an effective alternative to sanitisation with chlorine
water to preserve the quality of minimally processed spinach leaves (Artes-
Hernandez et al. 2009). Combinations of UV-C, and super O2 enriched packaging
could be effective to preserve and improve the quality of Tatsoi baby leaves (Tomas-
Callejas et al. 2012) and fresh-cut kalian-hybrid broccoli with pre-treatment with
electrolysed water (Martinez-Hernandez et al. 2013) while minimising water usage.
Apart from that, gamma radiation has also been widely used in the vegetables
handling process to ensure the quality and safety of the products. Rezende et al.
(2014) stated that the quality of spinach leaves could be preserved and improved by
exposing the leaves under appropriate gamma irradiation. Combination of low
irradiation with MAP has also been tested towards RTE baby spinach at different
temperatures (Gomes et al. 2011b) and fresh cut romaine lettuce where it caused
ten percent loss in firmness while maintaining visual appearance, colour, generation
of off-flavour (Prakash et al. 2000). Gamma irradiation has also been practiced with
other foods such as spices (Kirkin et al. 2014), grated carrots (Lacroix & Lafortune
2004), and traditional African cereal (Duodu et al. 1999) as an alternative treatment
to optimise their qualities and shelf lives. Other method such as ozone treatments
were found effective to reduce the microbial loads of spinach, parsley, and lettuce
20
(Karaca & Velioglu 2014), however, significant colour and quality changes after
treatment requires more research (Klockow & Keener 2009). Garcia et al. (2003)
combined chlorine washing and ozone treatment which helps to improve the shelf life
and quality of lettuce salads.
Other novel techniques that lead to favourable results to the products’
qualities were also introduced such as treatment with high pressure carbon dioxide
(HPDC) to preserve fresh-cut carrot slices (Bi et al. 2011), fumigation of sodium
hydrosulfide (NaHS) to reduced leaf yellowing of water spinach (Hu et al. 2015), e-
beam irradiation to reduce bacterial counts and to prolong the shelf life of fresh
spinach (Neal et al. 2010), advantage use of nano-mist as an alternative to
conventional mist humidification during spinach-storage atmosphere (Saenmuang,
Al-Haq, Makino, et al. 2012), effective combination of spraying microencapsulated
antimicrobials with e-beam irradiation to deactivate microorganisms on spinach
(Gomes et al. 2011a), as well as beneficial use of bio-activity of whey fermented
extract towards organic grown lettuce as the other option of sanitiser which gives
good contribution in the organic fresh vegetables industry (Santos et al. 2015).
All the processing and handlings need to be conducted carefully to prevent and
minimise any possible damage to the products. Physical stress during processing
affects physiology and biochemistry of the fresh-cut products which in returns affect
the quality and shelf life of the products (Watada et al. 1996). Due to the series of
processes, the products are opened to such an ideal medium for growth of
microorganisms. Although they are stored in optimum temperature, that low
temperature seems not to inhibit the development of psychrotrophic microorganisms,
specifically saprophytic fluorescent pseudomonads together with other pathogens
21
such as Listeria monocytogenes, and Aeromonas hydrophila and foodborne
pathogenic bacteria such as L.monocytogenes and Salmonella spp. where all these
microorganisms are responsible for the contamination and spoilage of the fresh
products (Babic et al. 1996). Excessive treatments cause breakage or softening of
the cell walls and on the pectins which provide the structural rigidity to plant tissue
(Wood et al. 2005). Change in textural characteristics is due to the spoilage
microorganisms breaking down the pectins which lead to softening (Neal et al.
2010). Quality degradation of fresh-cut product is due to the mechanical damage,
moisture loss, tissue metabolism and microbial contamination (Piagentini et al.
2002). The mechanical damage will elevate the rate of decay of the products thus
affect the sensorial and nutritional qualities of the products, which might lead the
product to be inappropriate for the consumers’ consumptions (Tang et al. 2011).
Processing steps give both advantages and disadvantages impacts towards
products’ qualities during postharvest storage. Regardless of the extensive works
covered on the postharvest handling and processing of vegetables, further research
is still needed to differentiate different degrees of mechanical injuries resulted from
the processing and how they affect the quality and shelf life of RTE spinach.
In this thesis, the processing focused on compression and it effects towards
degree of mechanical leaf injury. The effects of degree of compression and degree
of mechanical leaf injury towards quality and shelf life of the RTE spinach are also
discussed.

22
2.5.1 Uniaxial compression
Uniaxial compression test has been widely used to determine mechanical
properties of fruits and vegetables. To create the degree of compression, peeled
apple was compressed by 20% of its height (Billy et al. 2008), tomato was
compressed by 3% of its diameter (Hu et al. 2005), and cooked potatoes were
compressed at 75% of its height (Thybo & Nielsen 2000). Similar study has also
been early reported on apple, carrot, frankfurter, cream cheese and pretzels, where
the extension cycle control of the Instron was adjusted to give compressions of 50%,
60%, 70%, 80%, 90%, and 93%, corresponding to clearances between the plates at
maximum compression (Bourne & Comstock 1981). Force-deformation testing has
also been done to study the mechanical properties of melon (Emadi et al. 2009) and
lentil-based snack with compression of 100N load cell (Lazou et al. 2011).
Failures on papaya and pineapple have been reported by (Peleg et al. 1976)
under compression, where the authors described the actual failure was caused by
the shear stresses where the samples sliding 45° along the plane to the compressive
load. Tri-axial compression test on cylinder apple flesh caused the sample to slip 45°
from the loading direction; however, most of the cells on either inside or outside or
on the side of the fracture line remained undamaged (Holt & Schoorl 1982). Diehl et
al. (1980) reported on the breakage of apple flesh and shearing of potato flesh under
uniaxial compression. Mohsenin (1977) described the cracking of potatoes as well as
splitting of tomatoes where it expended the fruit diameter due to the stresses. The
author also reported the cracking in cabbage, watermelon, and apple under certain
loading conditions.

23
Apart from that, heat-treated beet and turnip roots were compressed under a
constant force of 30N in a single-cycle compression-decompression test using the
Universal Testing Machine, UTM to evaluate texture properties (Taherian &
Ramaswamy 2008). By performing this test, several mechanical parameters of the
samples could be obtained, e.g. firmness, stress-to strain ration (Young’s modulus)
as a measure of the sample stiffness, and the percentage of recoverability of input
energy (percentage ration of the area under the force-to-deformation curve during
relaxation in relation to the total area) as a measure of sample springiness.
Uniaxial single-cycle loading/unloading compression method was chosen as
the type of compression used throughout this study. The purpose of the compression
was to induce damage to the leaves in the laboratory relative to damage that may
occur during processing and handling in the industry. Before ready to be marketed,
the RTE spinach bags undergone series of actions. Stacking the bags, piling the
trays, grabbing the bags and throwing the bags are examples of actions that caused
the spinach leaves inside the bag to be accidentally compressed, causing the leaves
inside to be mechanically broken and damaged. The external forces exerted on the
plant caused mechanical injuries which then lead to changes of texture, colour,
flavour, physiological, biochemical, and chemical composition of the commodities
(Wills et al. 2007). As the spinach leaves were tested in bulk amount and random
arrangement in the acrylic chamber, having a single complete cycle of
loading/unloading compression would be most suitable to represent the bulk sample
as a whole. The compressions have a standard degree of compression which means
all the compression started at constant starting position and constant sample height.
24
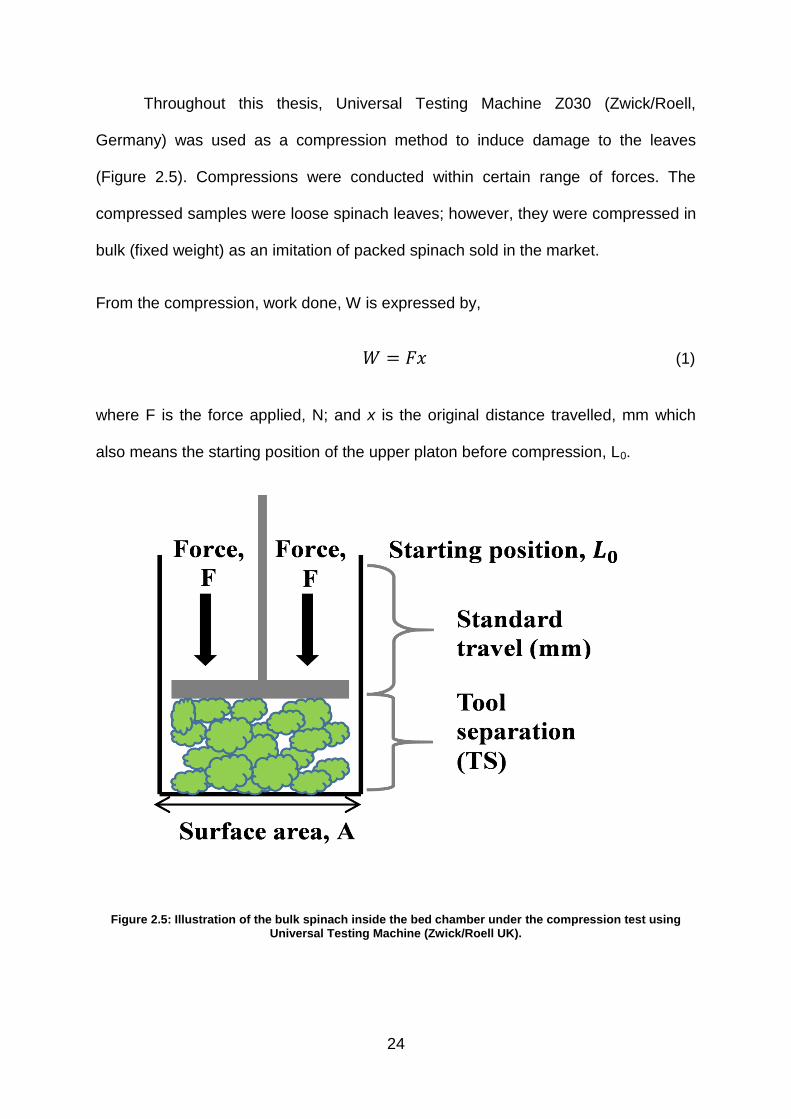
Throughout this thesis, Universal Testing Machine Z030 (Zwick/Roell,
Germany) was used as a compression method to induce damage to the leaves
(Figure 2.5). Compressions were conducted within certain range of forces. The
compressed samples were loose spinach leaves; however, they were compressed in
bulk (fixed weight) as an imitation of packed spinach sold in the market.
From the compression, work done, W is expressed by,
𝑊 = 𝐹𝑥 (1)
where F is the force applied, N; and x is the original distance travelled, mm which
also means the starting position of the upper platon before compression, L0.
Figure 2.5: Illustration of the bulk spinach inside the bed chamber under the compression test using Universal Testing Machine (Zwick/Roell UK).

25
Bed volume inside the chamber, V is expressed by,
𝑉 = 𝐴 × 𝑇𝑆 (2)
where A is the cross sectional area of the sample inside the chamber, mm2; and TS
is the tool separation, mm. Tool separation is the distance between the upper platon
and the surface of the sample after compression which also means the change of
distance after compression, ∆L.
The value of work, W (J) was generated from TestExpert II software. Thus,
maximum work, MaxW (J) was the highest energy required to complete one
loading/unloading compression. Force-displacement curves were also generated
from the TestExpert II software. From the curve, area under the curve, AUC was
calculated. The AUC was calculated by integrating the polynomial equation of the
curve. The curve fits third order of polynomial equation:
𝑦 = 𝐴𝑥3 + 𝐵𝑥2 + 𝐶𝑥 + 𝐷 (3)
The equation was then integrated from the value of maximum force, 𝑎 to the
minimum force, :
∫ 𝐴𝑥3 + 𝐵𝑥2 + 𝐶𝑥 + 𝐷𝑎
𝑏 (4)
After the integration, the equation became:
𝑦 = [𝐴𝑥4 + 𝐵𝑥3 + 𝐶𝑥2 + 𝐷𝑥]𝑥=𝑎 − [𝐴𝑥4 + 𝐵𝑥3 + 𝐶𝑥2 + 𝐷𝑥]𝑥=𝑏 (5)
Here, the minimum force, 𝑏 was assumed to be 0 N as it was the value of the force
at the starting position of the compression. The area under the curve was the sum of
each integrated unknown in equation 5. As the polynomial equation was obtained

26
from the force-displacement curve, it has the unit of N.mm. To convert the unit N.mm
to J, the value was divided by 1000.
2.6 Mechanical injury
Holt & Schoorl (1982) classified mechanical failure of vegetables and fruits in
three categories which are cracking, slipping, and bruising. Cracking is when the
tissue got teared apart due to tensile stresses. On the other hand, slipping is when
two pieces of samples slide relative to each other due to shear stresses, whereas
the third group of failure which is bruising is associated with the extensive damage of
the tissue due to cell bursting. The property of these failures varies depending on the
loading conditions, and ripening state. For example, the failure of potato flesh may
be due to breaking, slipping or bruising depending on the loading conditions (Holt &
Schoorl 1982).
A common failure in fruits and vegetables is bruising. Bruising is defined as
the damaged on the plant tissues caused by external forces which lead to changes
in physical and chemical attributes of the product (Mohsenin 1977). The ruptured
plant cells released the cell contents to the intercellular air space. Due to this, the
enzymes are oxidised and lead to discolouration of the plant tissues. Several studies
have reported on the tissue browning of pears, cherries, apples, grapes, peaches,
apricots and bananas (Mohsenin 1977), papaya, mango, watermelon, and pineapple
(Peleg et al. 1976), due to the cellular oxidation. Holt & Schoorl (1982) stated that
for bulk sample, the bruising could also be associated with shear failure.

27
Gonzalez et al. (1988) studied the effect of leaf injury towards
Ethylenethiourea (ETU) residues where the injuries were induced by crushing the
spinach leaves manually. The author reported that the leaf injury provides more
areas for the fungicide residues to be trapped in the leaves. The mechanically
injured leaves had significantly higher ETU residues level than the non-injured
leaves (Gonzalez et al. 1988).
Mechanical injuries are irreversible plastic deformations that lead to organ
breaking which then lead to cellular and tissue ruptures within the plant (Luengo et
al. 2008). Mohsenin (1977) stated that it is important to understand the mechanical
strength of food through the understanding of the failure mode to reduce mechanical
damage and energy consumption during mechanical processing. The applied stress
and material are the two factors that need to be considered in making the prediction
of failure (Holt & Schoorl 1982).
Regardless of the established works developed on classifying the modes of
failures into cracking, slipping, and bruising, further study is still needed to evaluate
the degree of injury experienced by the fresh produce regardless of the modes of
failures. The study on modes of failures focused on classifying the fresh product into
category that caused the failure whereas the study on different degree of injury is
focusing on evaluating and classifying the degree of injury experienced by the fresh
products that may come from cracking, slipping, and bruising. In this thesis, different
degrees of injuries were evaluated focusing on mechanical injuries due to
compression and their effects towards quality and shelf life of spinach were
investigated.

28
2.7 Quality changes of leafy vegetables during postharvest
2.7.1 Mechanical properties of leafy vegetables
2.7.1.1 Young’s modulus
Young’s modulus, E is an intrinsic property of a material. Elastic and plastic
deformation components of a material are assumed to follow these two fundamental
parameters: an elastic modulus and a “resistance to plastic deformation”. In hard and
compact material such as metal, the elastic deformation is minimal due to the
relatively small resistance to plastic deformation thus hardness can be measured by
the resistance of the plastic deformation. In most other materials including
mineralized tissues, both elastic and plastic deformations contribute equally to the
total deformation, thus the hardness of the material is dependent on the elastic
modulus, E. (Oyen 2006).
Young’s modulus or also known as elastic modulus is the ratio of stress, σ
over strain, ε for elastic deformation.
𝐸 =𝑠𝑡𝑟𝑒𝑠𝑠
𝑠𝑡𝑟𝑎𝑖𝑛 (6)
Hooke’s law stated that stress is directly proportional to strain in the elastic region, σ
= Eε (Figure 2.6). The plastic deformation is due to the movement of atomic
dislocations within the structure of a material. Basically, E is the measure of the
strength between the atoms. Hardness is measured as the ability of the material to
resist the deformation during surface indentation. The higher the value of the elastic
modulus, the harder the material is (Instruments n.d.).

29
Figure 2.6: Hook's law graph (Williams 2011).
Stress is defined as,
𝑠𝑡𝑟𝑒𝑠𝑠 = 𝐹
𝐴 (7)
where 𝐹 is the force exerted on a sample under compression, N; and 𝐴 is the cross
sectional area of the sample inside the chamber through which the force is exerted,
mm2. Strain is defined as,
𝑠𝑡𝑟𝑎𝑖𝑛 = ∆𝐿
𝐿0 (8)
Where ∆𝐿 is the change in length after compression, mm; and 𝐿0 is the starting
position of the platon before compression, which indicates the original height of the
sample inside the chamber before the compression, mm. The mechanical property of
spinach is measured by measuring the Young’s modulus, E,
𝐸 = 𝐹𝐿0
𝐴∆𝐿 (9)
By substituting equation 1 and 2 into equation 9,
30
𝐸 =𝑊
𝑉 (10)
Therefore, E is the measurement of the work done or the energy stored per unit
volume of the sample inside the chamber under compression. The unit for V in this
case was mm3. It was then divided by 1000 and the unit became cm3. The unit for W
is J. 1 J/cm3 is equivalent to 1 MPa. Therefore, the unit of E throughout this study
would be in MPa.
2.7.1.2 Texture
Texture is one of the main factors in quality evaluation of fruits and vegetables
offered in the market (Billy et al. 2008; Desmet et al. 2002; Stoneham et al. 2000;
Rizvi & Tong 1997; Van Buren 1979; De Roeck et al. 2010; Barrett et al. 2010).
In this study, Penetration test was chosen as the method to measure texture
changes of spinach throughout storage. Studies have reported that for both
monocotyledon and eudicotyledons leaves; their mechanical properties, which
connected to their anatomical characteristics, lead to differentiation in choosing the
instrument to be utilised (Aranwela et al. 1999). Due to parallel alignment of veins
along the vertical axis of the leaves, tensile test is ideal to determine the mechanical
properties of monocots. On the other hand, due to its palmate venation and pinnate
patterns, penetration test is ideal to study the eudicot mechanical properties
(Aranwela et al. 1999). Penetration test is commonly used to analyse the mechanical
properties of vegetables (Shiu et al. 2015). Through penetration test, the burst
strength of the leaves comes from shear strength and compressive forces that are

31
spread along the leaves orientation. The technique uses a spherical probe that will
spread force homogeneously across a focus area and cause failure to the products
(Bourne & Comstock 1981). The penetration test generate force-displacement
curves where the mechanical properties such as strength, toughness, stiffness and
displacement can be derived and analysed (Gutiérrez-Rodríguez et al. 2013).
Leafy salads like spinach have tender and soft texture which can easily lead
to damage. It also has a very complex natural system that caused the measurement
of its mechanical properties to be challenging. This resulted in lacking of engineering
mechanical testing on it (Tang et al. 2011). Although there are researches that have
been done to study the mechanical properties of spinach (More et al. 2014; Tang et
al. 2011; Gutiérrez-Rodríguez et al. 2013; Tudela, Marín, Garrido, et al. 2013), there
is still insufficient information in the literature to determine the effect of mechanical
injury towards textural property of the spinach.
2.7.2 Browning and decay
Appearance is the main deciding factors when consumers are selecting fruits
and vegetables (Kader 2002; Ferrante et al. 2004). Consumers ‘buy with their eyes’
to associate quality attributes to their desires in making decision to buy a product.
The physiological changes contribute to the shelf life reduction of the product
(Odumeru et al. 2003). Samples with browning higher than 2% are usually rejected
by consumers (Varoquaux et al. 1996).
32
One of the convenient methods to evaluate the appearance of fresh produce
is by capturing the image with a digital camera. The computer based image software
could be set to specify a consistent evaluation of the produce. This prevents any bias
and inconsistencies of visual assessment by humans. It permits classification and
quantification of the original existence of the sample regardless of the shape, size
and texture (Studman 2001). Papadakis et al. (2000) stated that this technique is
versatile and inexpensive which with additional development of the image analysis, it
could be used in the food industry as a trustable quantitative tool in monitoring the
quality and shelf life of the RTE products (Zhou et al. 2004). Besides that, (Pedreschi
et al. 2005) has also suggested that the quick and easy measurement of image
analysis should be used to determine browning rather than the meticulous
chromatographic methods. Percentage of browning measured by image analysis
showed better indication of lettuce quality compared to the values of colour changes
measured by colorimeter as it closely associated to human visual evaluations (Zhou
et al. 2004). From the digital camera, RGB images are produced. RGB which
represents red, green, and blue colour space describes colour ranges by combining
different amount of red, green, and blue with possible values ranging from 0 to 255
(Luzuriaga et al. 1997; Zhou et al. 2004). Tests have confirmed that image analysis
performed on the RGB images allowed good segmentation, generating images that
showed high difference between values of the leaf and the background (Lunadei et
al. 2012).
Kruse et al. (2014) developed a method for identifying and quantifying leaf
surface injury. However, the study only focused on the study of pixel classification
and the leaf injury was referring to plant diseases and nutrient deficiency. There is
still lack of study in the literature regarding identifying and quantifying mechanical

33
leaf injury due to processing and handling and how it affect quality and shelf life of
RTE spinach during postharvest storage.
2.7.3 Colour changes
The main colour changes in spinach leaves are due to the green colour
degradation. It has been reported that spinach stored at 4°C demonstrated decay on
the surface colour which turned from green to yellow (Lunadei et al. 2012).
Yamauchi & Watada (1991) stated that changes in colour were correlated with the
senescence of the harvested leaves. Polyphenol oxidase is an important enzyme
that is responsible for the browning of the minimally processed vegetables, whereas
lipooxidase is another important enzyme that catalyse peroxidation which caused the
formation of bad-odour ketones and aldehydes (Ahvenainen 1996; Watada & Qi
1999).
Various studies have reported the use of colorimeters to study colour changes
of spinach (Artes-Hernandez et al. 2009; Klockow & Keener 2009; Saenmuang, Al-
Haq, Makino, et al. 2012; V. M. Gómez-López et al. 2013; Gómez-López et al. 2013;
Glowacz et al. 2015), beans (Karathanos et al. 2006), and spices (Kirkin et al. 2014)
during postharvest storage. However, they can only analyse small sections of the
product, therefore repetition of measurement is required in different areas of the
sample. Besides that this method also favours objects with uniform surfaces
whereas irregular surfaces need to be processed or blended in order to get the
uniformity. This only gives the average colour values and do not represent the
original existence of the sample (Abbott 1999). Thus developing a colour analysis
34
technique would be useful to predict the shelf life as well as to understand
consumers acceptance towards the fresh produce (Jolliffe & Lin 1997). The
technique was developed for overcoming colorimeter not able to capture whole
sample equally due to limitations such as aperture size, ambience lighting, and
sample background (Mery & Pedreschi 2005). This technique also would be useful
for measuring colour changes on food product with irregular surface and size
(Valous et al. 2009; Pedreschi et al. 2006; Du & Sun 2005; Mendoza et al. 2006;
Kruse et al. 2014; Zheng et al. 2006; Yam & Papadakis 2004).
In this study, the colour analysis technique is developed. The results from this
technique were then compared to results obtained from colorimeter.
2.7.4 Fresh weight loss
Fresh weight loss is another important quality attributes lead to quality loss of
leafy vegetables. Serrano et al. (2006) reported that high rate of weight loss was the
major problem associated with the quality of broccoli during storage. Decrement of
surface wetness and juiciness over storage days indicated the water loss of the
spinach samples which caused shrivelling and wilting (Neal et al. 2010). Excessive
shrinkage is caused by many factors such as delay before storage, harvest during
hot time and store the hot harvested-product in the cool storage, high temperature,
low relative humidity due to insufficient insulation, excessive air circulation and
packing the products into cartons or dry wooden boxes (Wills et al. 2007).

35
There has been increased in the weight loss as the exposure to the air
increased (Jung et al. 2012). There is study reported on having high initial dry matter
content and ascorbic acid lead to better visual quality of baby spinach during storage
(Bergquist et al. 2006). It has been reported that 5% of weight loss was considered
as acceptable by consumers which interpreted as “Relatively fresh/Fresh”.
Percentage of weight loss can be used as a physical measurement to evaluate the
freshness of spinach as well as to predict the perception of freshness by consumers
(Jung et al. 2012).
2.8 Sensory evaluations
Sensory evaluation is one of the major methods that contribute to the
understanding of a particular food product based on human perceptions. The
deterioration of the product sensory property can be early detected by consumers
before the nutritional and microbial decays occurred (Dinnella et al. 2014).
Various studies have been reported on the sensory evaluations of fresh
products. Jung et al. (2012) studied consumers’ perceptions on freshness of spinach
stored at different storage conditions based on freshness scales and interviews.
Sensory test based on freshness ratings was also done to study consumers’
perceptions on the freshness of strawberry, apple and carrot (Péneau et al. 2007).
Freshness is the main quality attribute for consumers in choosing vegetables n fruits
(Ragaert et al. 2004; Jung et al. 2012). However, freshness degradation of RTE
mixed salads (radicchio, endive, rocket, watercress and lettuce) during storage gave
little relevance towards the hedonic scores (Dinnella et al. 2014). On the other hand,

36
the hedonic scale significantly showed differences between RTE lettuce treated with
different chlorinated water (Odumeru et al. 2003). Survey was also conducted to
study consumers’ perceptions on apple freshness (Péneau et al. 2006). Training and
ballot development sessions have been conducted to determine texture (roughness,
hardness, slimy, surface wetness), basic taste (bitter, sweet, sour), aromatics (nutty,
earthy, green, decay), mouthfeel attributes (burn, astringent) and colour of spinach
(Neal et al. 2010; Medina et al. 2012; Kou et al. 2014; Dermesonluoglu et al. 2015),
arugula and mustard greens (Zhao et al. 2007), cauliflower (Cervera et al. 2007),
and fresh-cut Romaine lettuce (Martinez-Sanchez et al. 2011).
There are many factors affecting consumers’ perceptions and acceptances
towards the fresh products. Besides convenience, the purchase intention was also
affected by the delicious taste of the product. This showed that consumer’s past
experience plays important role for them to repeat the purchase of the product
(Gardial et al. 1994; Bech et al. 2001; Ragaert et al. 2004). The weight of the packed
product and the surface area of the package are also the pre-determine factor to
obtain certain appeal to the consumers in the market (Kim et al. 2004a). In contrast,
brand and organic farming were less important factors for consumers in selecting the
RTE salad (Cardello & Schutz 2003).
2.9 Respiration rate of fresh produce
Respiration rate is an important parameter in postharvest quality. In general,
the deterioration rate of the fresh produce is proportional to its respiration rate
(Yamauchi & Watada 1991). Respiration rate can be used as a shelf life prediction

37
for the fresh produce; however, the physiology of the fresh-cut products is changed
too drastically to make the prediction (Watada et al. 1996).
Respiration is a catabolic reaction in which sugars, fatty acids, amino acids,
and organic acids in the plant cell are oxidised to produce carbon dioxide, water and
energy. The overall reaction for the breakdown of sugars is:
𝐶6𝐻12𝑂6 + 6𝑂2 → 6𝐶𝑂2 + 6𝐻2𝑂 + 686 𝑘𝑐𝑎𝑙
Respiration in living organisms involves three major pathways of chemical reactions
which are glycolysis, Kreb’s cycle (tricarboxylic acid, TCA) and oxidative
phosphorylation (electron transport system) (Figure 2.7) (Kader & Saltveit 2003;
Aworh 2014). Glycolysis is a series of reactions that converts each glucose molecule
to two molecules pyruvate, two molecules ATP and two molecules of NADH. During
aerobic condition, pyruvate is completely oxidised to carbon dioxide and water in the
Kreb’s cycle. The glycolysis and the Kreb’s cycle are linked by the formation of acetyl
coenzyme A from the oxidative decarboxylation of pyruvate. The third pathway,
oxidative phosphorylation involves the electrons transfer from NADH or FADH2 to
oxygen by electron carriers and produces ATP. In living tissue, the complete glucose
oxidation yields 36 ATP with 32 ATP produced by oxidative phosphorylation (Aworh
2014).
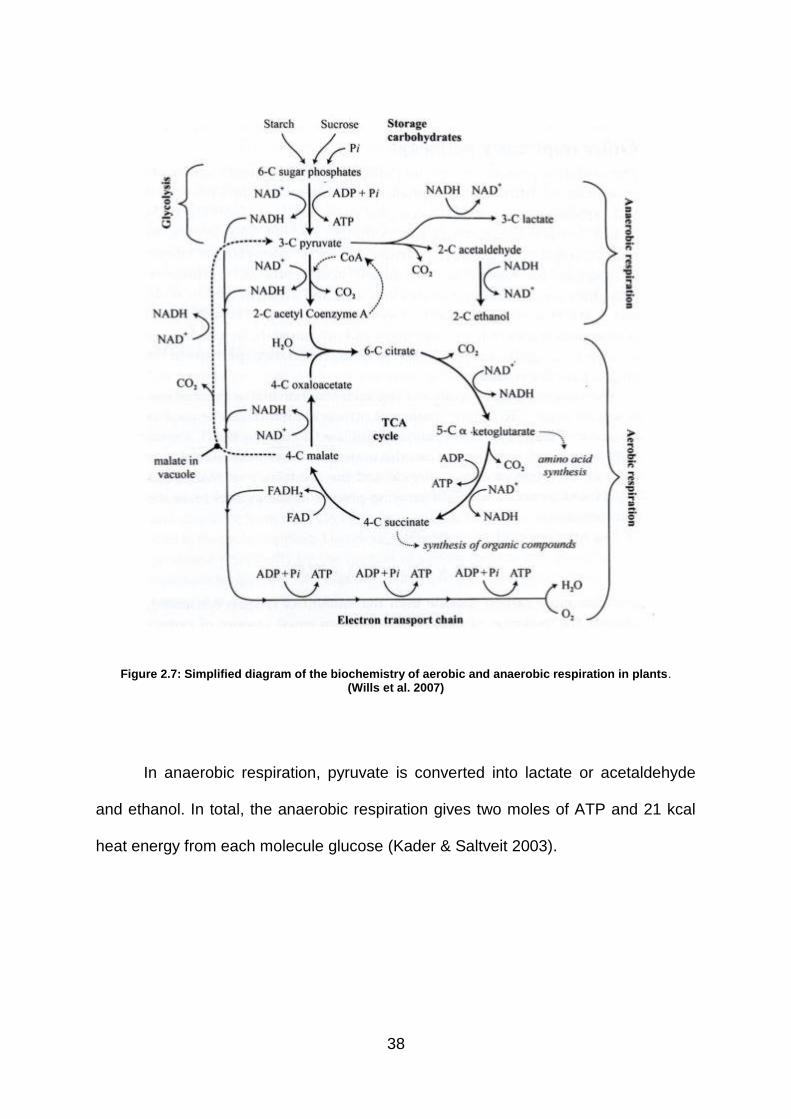
38
Figure 2.7: Simplified diagram of the biochemistry of aerobic and anaerobic respiration in plants. (Wills et al. 2007)
In anaerobic respiration, pyruvate is converted into lactate or acetaldehyde
and ethanol. In total, the anaerobic respiration gives two moles of ATP and 21 kcal
heat energy from each molecule glucose (Kader & Saltveit 2003).

39
2.9.1 Measuring respiration rate of fresh produce
Respiration rate is an overall measure of the metabolic activity. It involves
cellular respiration, gas exchange process and the respiration of microorganisms as
well as any other plant physiological processes that involve O2 and CO2
(photosynthesis, oxidation reactions, synthesis of plant hormones) (Løkke 2012).
Respiration rate is measured as the amount of O2 consumed or CO2 produced
per weight unit per time unit. It is often measured in either a closed or flowing
system. In the closed system, the product is kept in a tightly closed container (Figure
2.8) and changes in O2 and CO2 concentrations are measured over a period of time.
The initial gas composition is usually the atmospheric (Jacxsens et al. 2000;
Escalona et al. 2006) or the container can also be flushed with certain gas
concentrations (Escalona et al. 2006; Torrieri et al. 2009). The respiration rate is
calculated from the difference between two measurements. This system is easy and
quick to set up. Disadvantage of this system is that the gas composition cannot be
controlled during the measurement period (Løkke 2012).
In the flowing system, the container was flushed with gas continuously and
the gas composition was measured at the inlet and outlet. The respiration rate was
calculated from the difference between inlet and outlet. During the experiment, the
gas composition can be varied and be any mixable combination of e.g. O2, CO2, and
N2 (Løkke 2012). However, it should be ensured that the gas flow is constant and the
inlet gas should be humidified (Kader & Saltveit 2003). Thus, this system is more
complicated to setup than the closed system.
In this thesis, closed system was chosen as the method of measuring the
respiration rate as it is convenient to be set up yet efficiently works for various

40
studies on measuring respiration rates of fresh product such as cut broccoli (Hagger
et al. 1992), litchi (Mangaraj & Goswami 2011b), spinach (Saenmuang et al. 2012),
fresh-cut papaya (Rahman et al. 2013), and cherry tomatoes (Sousa et al. 2017).
Figure 2.8: Closed system containing spinach samples.
The O2 respiration rate in the closed system can be calculated by using equation:
[𝑂2] 𝑟𝑒𝑠𝑝𝑖𝑟𝑎𝑡𝑖𝑜𝑛 𝑟𝑎𝑡𝑒 = ([𝑂2]𝑖𝑛𝑖𝑡𝑖𝑎𝑙 𝑡𝑖𝑚𝑒 − [𝑂2]𝑓𝑖𝑛𝑎𝑙 𝑡𝑖𝑚𝑒) × 𝑓𝑟𝑒𝑒 𝑣𝑜𝑙𝑢𝑚𝑒
100 × 𝑚𝑎𝑠𝑠 𝑜𝑓 𝑝𝑟𝑜𝑑𝑢𝑐𝑒 × (𝑓𝑖𝑛𝑎𝑙 𝑡𝑖𝑚𝑒 − 𝑖𝑛𝑖𝑡𝑖𝑎𝑙 𝑡𝑖𝑚𝑒) (11)
[𝐶𝑂2] 𝑟𝑒𝑠𝑝𝑖𝑟𝑎𝑡𝑖𝑜𝑛 𝑟𝑎𝑡𝑒 = ([𝐶𝑂2]𝑖𝑛𝑖𝑡𝑖𝑎𝑙 𝑡𝑖𝑚𝑒 − [𝐶𝑂2]𝑓𝑖𝑛𝑎𝑙 𝑡𝑖𝑚𝑒) × 𝑓𝑟𝑒𝑒 𝑣𝑜𝑙𝑢𝑚𝑒
100 × 𝑚𝑎𝑠𝑠 𝑜𝑓 𝑝𝑟𝑜𝑑𝑢𝑐𝑒 × (𝑓𝑖𝑛𝑎𝑙 𝑡𝑖𝑚𝑒 − 𝑖𝑛𝑖𝑡𝑖𝑎𝑙 𝑡𝑖𝑚𝑒) (12)

41
where [O2] and [CO2] are concentrations of O2 and CO2 respectively.
2.9.2 Modelling respiration rate of fresh produce
The enzyme kinetics, Michaelis-Menten model has been extensively applied
in many studies in giving good fits to experimental data on measuring the respiration
rate of many fresh produces such as chicory, apple, and tomato (Hertog et al. 1998),
apples (Andrich et al. 1991; Andrich et al. 1998; Torrieri et al. 2009), shredded
galega kale (Fonseca et al. 2002), guava (Mangaraj & Goswami 2011a), cut chicory,
asparagus, broccoli, muungbean sprouts (Peppelenbos & van’t Leven 1996), and cut
broccoli (Hagger et al. 1992). This decision was made based on the assumption that
in plant tissue, solubility and diffusivity of O2 and CO2 regulates reactions catalysed
by enzymes.
In this study, uncompetitive inhibition was selected to study the effect of CO2
on the respiration rate of the product. This selection was made by considering CO2
that acts as a respiration inhibitor. During uncompetitive inhibition, the inhibitor (CO2)
does not bind with the enzyme but binds reversely with the enzyme-substrate
complex, thus reduce product formation rate. The increase of O2 concentration at
high CO2 concentrations has no effect on the consumption rate of O2. This means
that maximum respiration rate is not affected at high CO2 concentration.
The uncompetitive Michaelis-Menten model equation is:
𝑅𝑂2=
𝑉𝑚(𝑂2) × [𝑂2]
{{𝐾𝑚(𝑂2) + [𝑂2]} × {1 +[𝐶𝑂2]𝐾𝑖(𝑂2)
}}
(13)
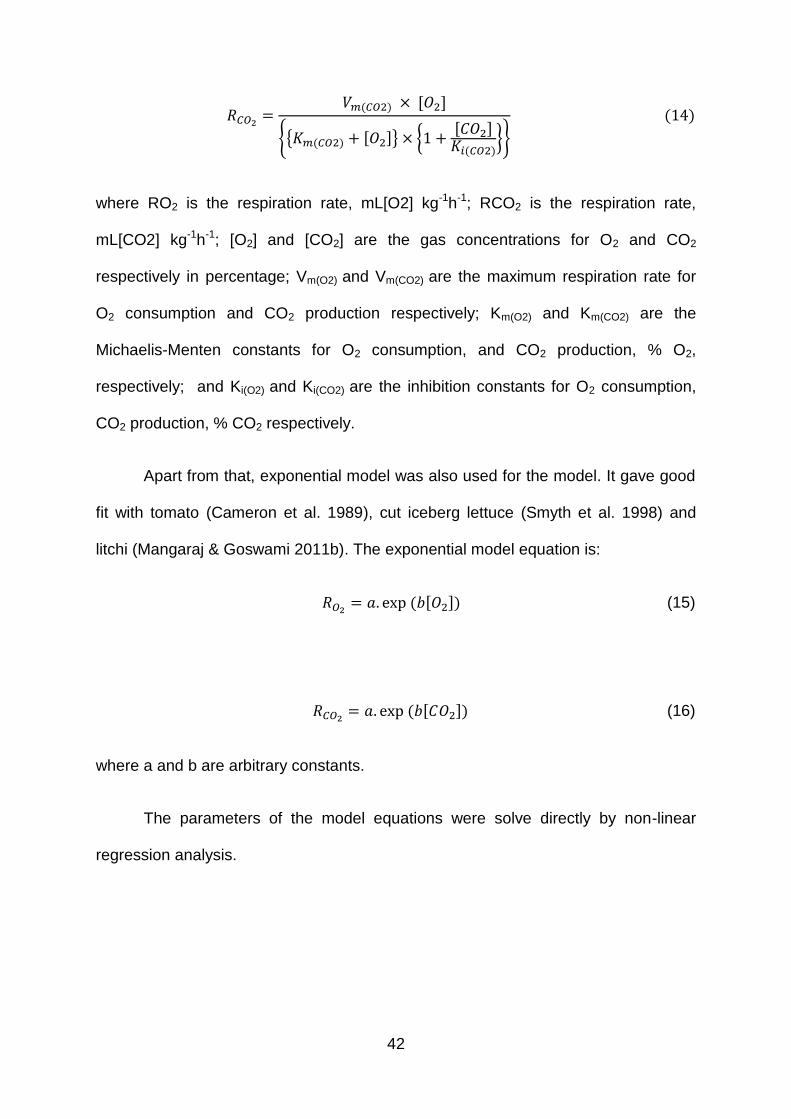
42
𝑅𝐶𝑂2=
𝑉𝑚(𝐶𝑂2) × [𝑂2]
{{𝐾𝑚(𝐶𝑂2) + [𝑂2]} × {1 +[𝐶𝑂2]
𝐾𝑖(𝐶𝑂2)}}
(14)
where RO2 is the respiration rate, mL[O2] kg-1h-1; RCO2 is the respiration rate,
mL[CO2] kg-1h-1; [O2] and [CO2] are the gas concentrations for O2 and CO2
respectively in percentage; Vm(O2) and Vm(CO2) are the maximum respiration rate for
O2 consumption and CO2 production respectively; Km(O2) and Km(CO2) are the
Michaelis-Menten constants for O2 consumption, and CO2 production, % O2,
respectively; and Ki(O2) and Ki(CO2) are the inhibition constants for O2 consumption,
CO2 production, % CO2 respectively.
Apart from that, exponential model was also used for the model. It gave good
fit with tomato (Cameron et al. 1989), cut iceberg lettuce (Smyth et al. 1998) and
litchi (Mangaraj & Goswami 2011b). The exponential model equation is:
𝑅𝑂2= 𝑎. exp (𝑏[𝑂2]) (15)
𝑅𝐶𝑂2= 𝑎. exp (𝑏[𝐶𝑂2]) (16)
where a and b are arbitrary constants.
The parameters of the model equations were solve directly by non-linear
regression analysis.
43
2.9.3 Quality changes of fresh produce stored at different films
Cause of failure is different depending on the packaging film used. The
packaging film used affected the failure attribute associated to the shelf life of
minimally processed cabbage (Pirovani et al. 1997). The respiration of the product
itself and the oxygen transfer rate of the film (Lucera et al. 2011; Allende et al. 2004),
as well as the weight of the packaged product, the respiration surface area, and
storage temperature (Kim et al. 2004a) strongly affected the headspace gas
composition of the fresh vegetables inside the system. The end of shelf life for
minimally processed leek was associated with the texture as well as the type of
packaging films and storage conditions (Ayala et al. 2009).
Perforations of the bags lead to dehydration and the loss of moisture to the
surrounding (Pan & Sasanatayart 2016). Thus alternative packaging systems have
been developed such as laser micro-perforated films, microporous membranes
(Zagory 1997) and perforation-mediated MAP (Fonseca et al. 2000). The number
and size of the micro-perforations affected the rate of gas exchange between the
system and external environment. The micro-perforated film was found to be efficient
in maintaining the sensory quality, and reducing weight loss and wilting of the
produce in longer term. During commercial, the shelf life of baby spinach may not be
prolonged over 7 days at 7°C unless having use of micro-perforated film with high
CO2 permeability (Tudela, Marín, Garrido, et al. 2013).
The salad savoy packaged in the highest oxygen transmission rate (OTR) film
developed higher discolouration than those packaged in the lower OTR film (Kim et
al. 2004a). 6000 OTR PE film caused 0.55 % whereas 3200 OTR PE film produced
0.39% weight loss of bok choy after 25 days of storage (Pan & Sasanatayart 2016).

44
Fresh-cut products are highly prone to weight loss due to the lack skin/cuticle
and exposure of the internal tissue. However, relative humidity is very high in film
bags thus dehydration is not a problem (Watada & Qi 1999). A problem associated
with the packaging films is the condensation of the moisture inside the package
which disturbs the viewing of the products and the droplets opens a site for possible
microbial growth. Another problem is that, insufficient transmission of O2 or CO2 in-
out of the package can cause injury to the product (Watada & Qi 1999). Therefore,
selecting appropriate film with proper gas transmission while at the same time
maintaining the proper RH is important (Watada & Qi 1999).
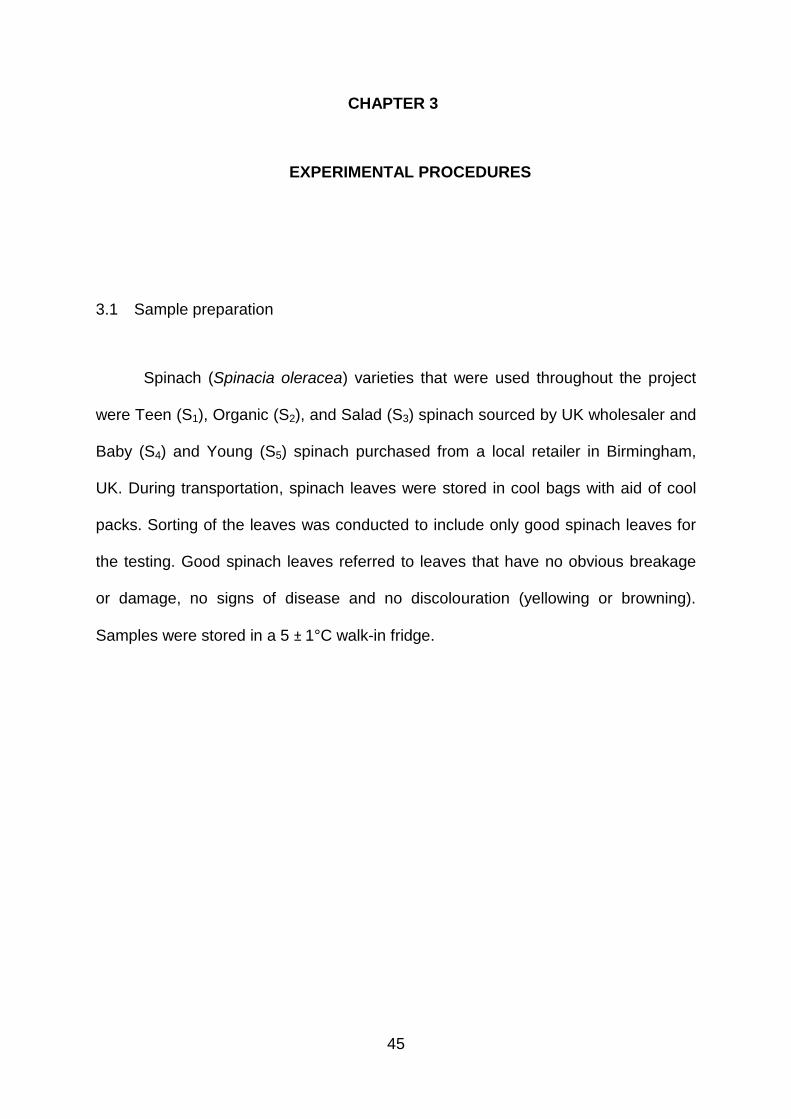
45
CHAPTER 3
EXPERIMENTAL PROCEDURES
3.1 Sample preparation
Spinach (Spinacia oleracea) varieties that were used throughout the project
were Teen (S1), Organic (S2), and Salad (S3) spinach sourced by UK wholesaler and
Baby (S4) and Young (S5) spinach purchased from a local retailer in Birmingham,
UK. During transportation, spinach leaves were stored in cool bags with aid of cool
packs. Sorting of the leaves was conducted to include only good spinach leaves for
the testing. Good spinach leaves referred to leaves that have no obvious breakage
or damage, no signs of disease and no discolouration (yellowing or browning).
Samples were stored in a 5 ± 1°C walk-in fridge.
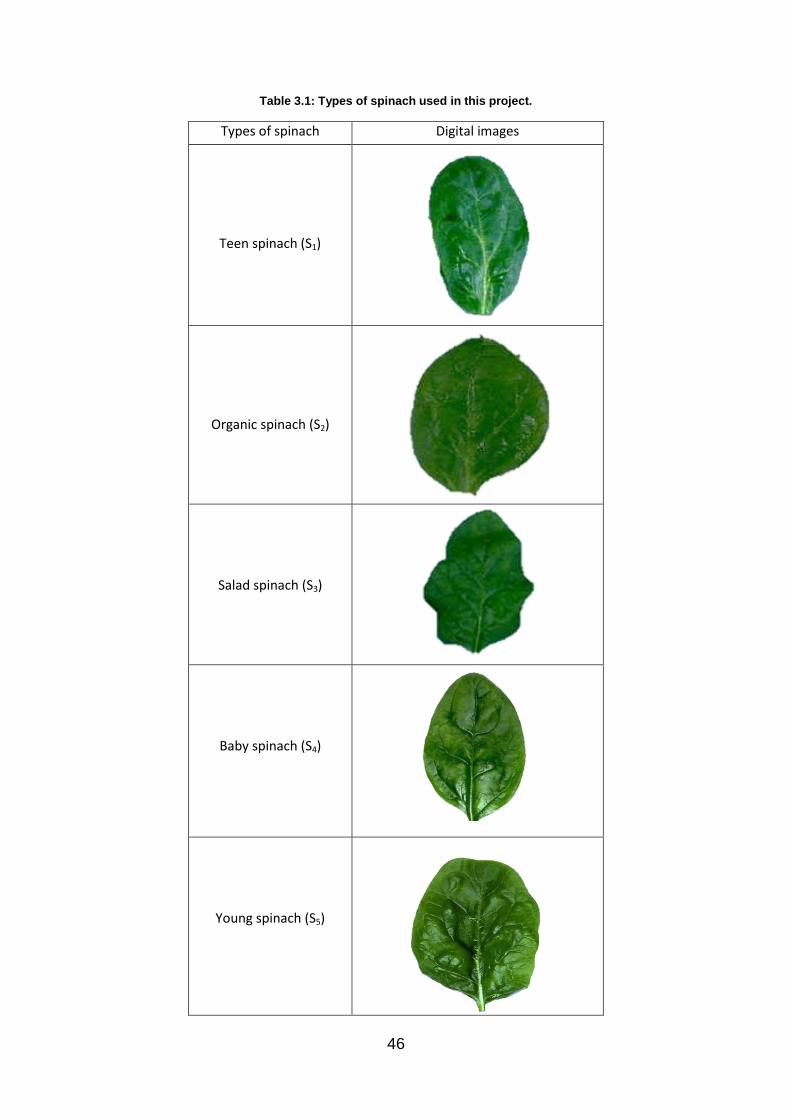
46
Table 3.1: Types of spinach used in this project.
Types of spinach Digital images
Teen spinach (S1)
Organic spinach (S2)
Salad spinach (S3)
Baby spinach (S4)
Young spinach (S5)
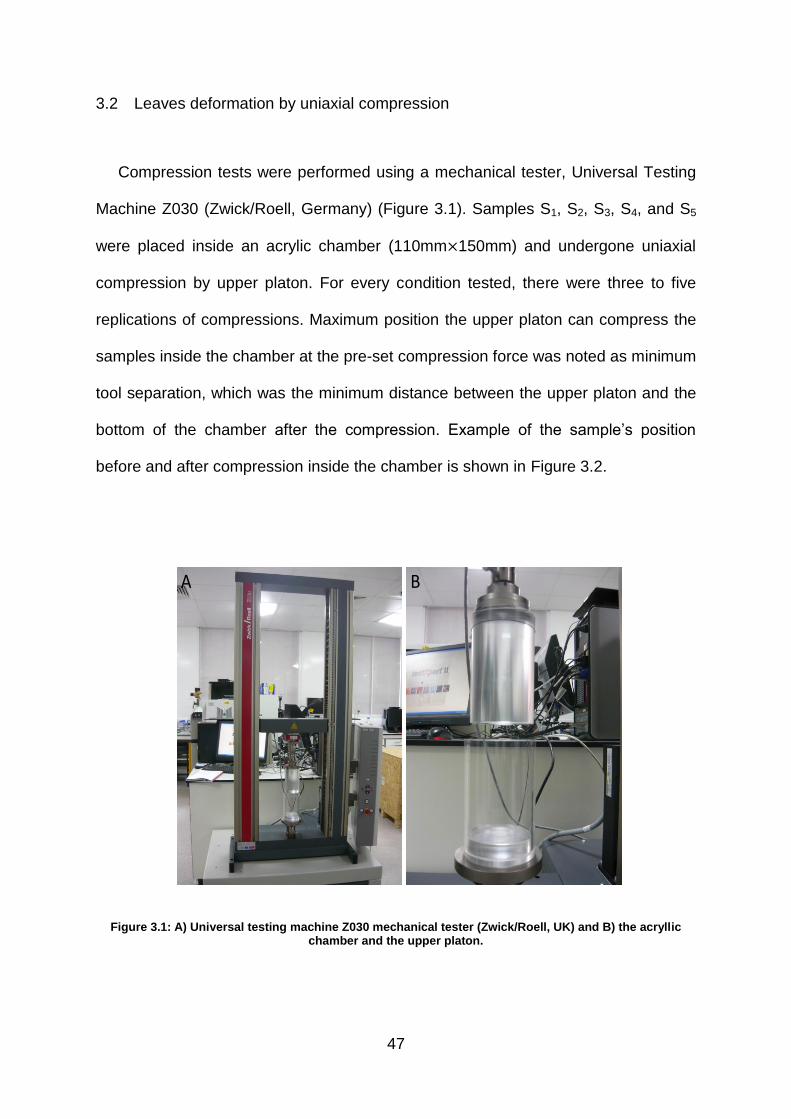
47
3.2 Leaves deformation by uniaxial compression
Compression tests were performed using a mechanical tester, Universal Testing
Machine Z030 (Zwick/Roell, Germany) (Figure 3.1). Samples S1, S2, S3, S4, and S5
were placed inside an acrylic chamber (110mm×150mm) and undergone uniaxial
compression by upper platon. For every condition tested, there were three to five
replications of compressions. Maximum position the upper platon can compress the
samples inside the chamber at the pre-set compression force was noted as minimum
tool separation, which was the minimum distance between the upper platon and the
bottom of the chamber after the compression. Example of the sample’s position
before and after compression inside the chamber is shown in Figure 3.2.
Figure 3.1: A) Universal testing machine Z030 mechanical tester (Zwick/Roell, UK) and B) the acryllic chamber and the upper platon.
A B
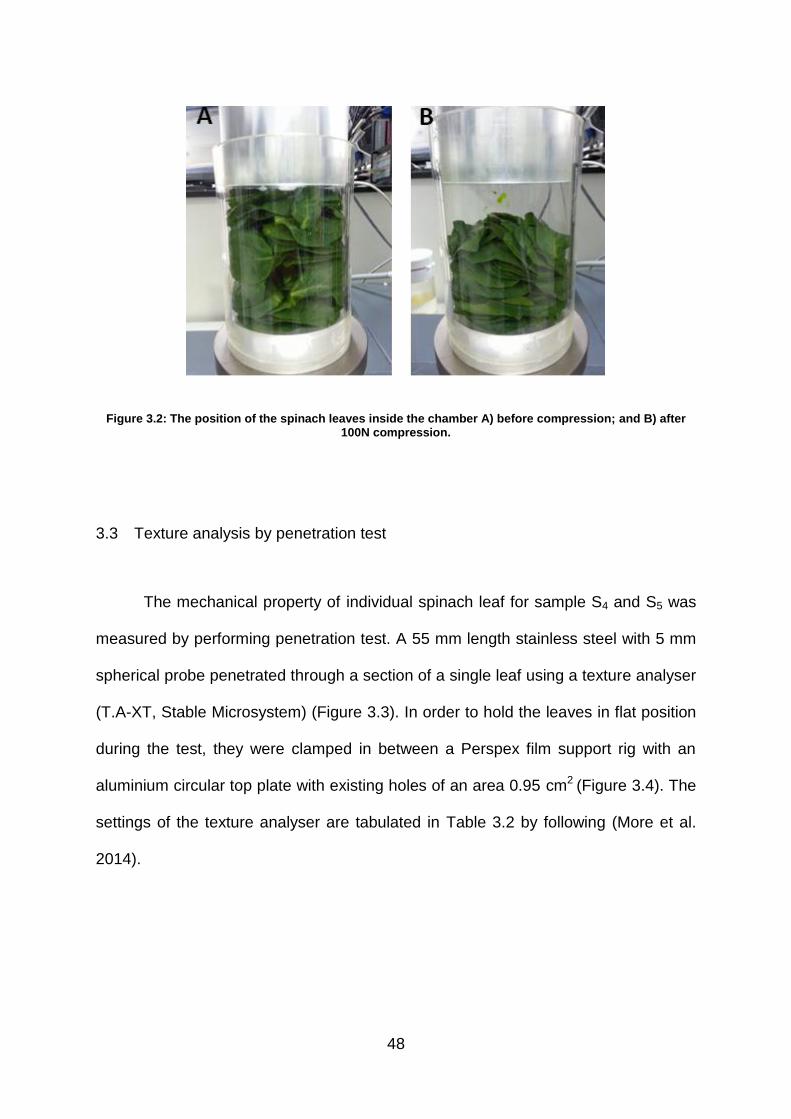
48
Figure 3.2: The position of the spinach leaves inside the chamber A) before compression; and B) after 100N compression.
3.3 Texture analysis by penetration test
The mechanical property of individual spinach leaf for sample S4 and S5 was
measured by performing penetration test. A 55 mm length stainless steel with 5 mm
spherical probe penetrated through a section of a single leaf using a texture analyser
(T.A-XT, Stable Microsystem) (Figure 3.3). In order to hold the leaves in flat position
during the test, they were clamped in between a Perspex film support rig with an
aluminium circular top plate with existing holes of an area 0.95 cm2 (Figure 3.4). The
settings of the texture analyser are tabulated in Table 3.2 by following (More et al.
2014).
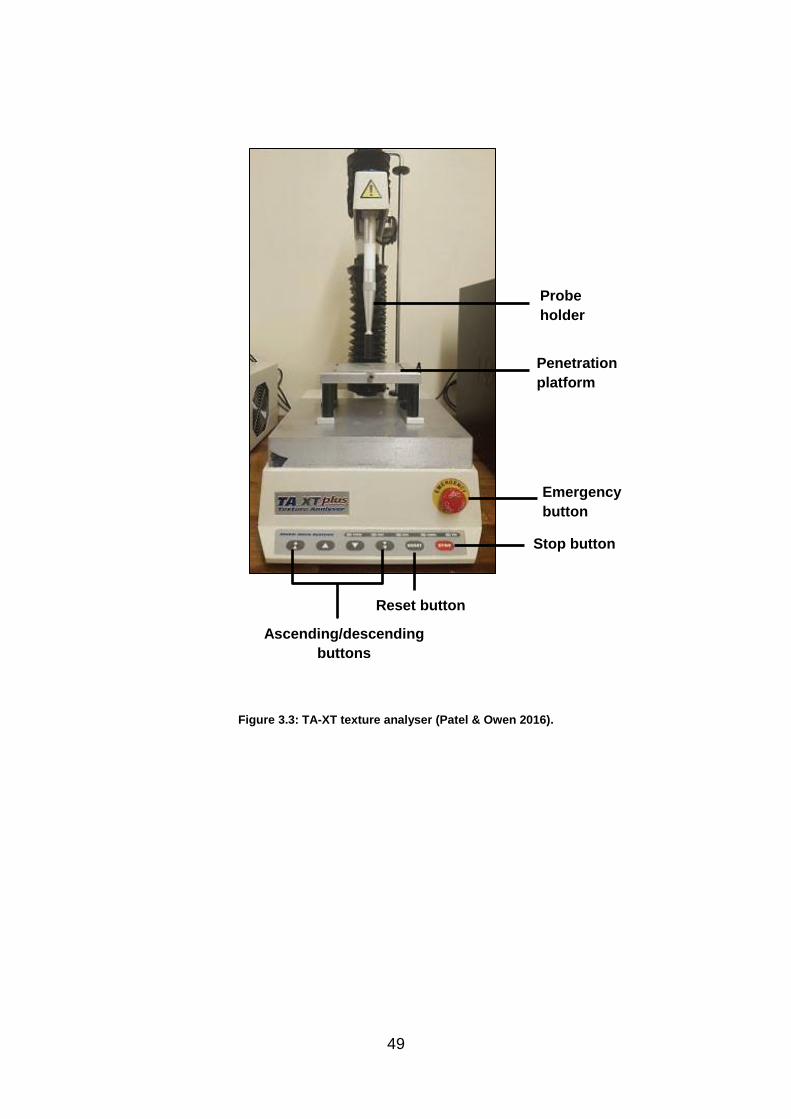
49
Figure 3.3: TA-XT texture analyser (Patel & Owen 2016).
Ascending/descending
buttons
Reset button
Stop button
Emergency
button
Probe
holder
Penetration
platform

50
Figure 3.4: Penetration rig and probe.
Table 3.2: Texture analyser settings for penetration test .
Options
T.A Settings
Library Return to Start
Test Mode Compression
Pre-Test Speed 2.0 mm/s
Test Speed 1.0 mm/s
Post-test Speed 10.0 mm/s
Distance 10 mm
Trigger Type Auto Force
Force 0.049 N
Probe Selection P/5S (5 mm Spherical Probe)
Parameters Undefined
Data Acquisition PPS: 500; Typical Test Time: 1000s
Force-displacement curves were generated by software, Exponent. From the
curves, burst strength (peak force, MaxF) and flexibility (displacement of MaxF )
were determined. As suggested by (Aranwela et al. 1999), the point for the

51
penetration was made consistent to minimise variation between the samples . The
test was conducted on the flat surface of the leaf avoiding major veins as they could
contribute to the variation of the results due to the different texture of the veins and
the lamina parts. Tests were conducted by penetrating either on the left or right ad-
axial sides of the leaves relative to the main vertical vein (Figure 3.5). For
reproducibility, 10-20 replications of spinach leaves were tested for each category.
Figure 3.5: Ad-axial side of the spinach leaf where the penetration took place.
52
3.4 Microscopy imaging techniques
3.4.1 Light microscopy
The microstructure of the leaves was observed under a light microscope, DM
RBE (Leica, Germany). First, the study focused on analysing the microstructure of
different types of spinach samples S1, S2, and S3. Second, the study focused on
analysing the microstructure of spinach sample S4 compressed at different forces.
There were three replicates for each study. About 2 cm of the leaves were finely cut
using a sharp disposable scalpel and placed on a glass slide protected with a thin
cover glass. Images were viewed under 10 x 1.0 x 10 objective lens magnification.
Cell structure and size of the spinach leaves were analysed and measured using
image analysis software, Leica QWin.
3.4.2 Microtome
Spinach sample S4 was cut of approximately 3 mm x 5 mm from the centre of
the leaf lamina near the midrib and parallel to it. The tissues were fixed for 2.5h at
4°C in 0.1M sodium phosphate buffered (pH 7.2) mixture of 2.5% glutaraldehyde and
4% paraformaldehyde (Morales et al. 2001) . Tissues were rinsed with distilled water
for five times to get rid of the phosphate ions. Tissues were then post-fixed with 1%
osmium tetraoxide for 2h (Tudela, Marín, Garrido, et al. 2013). Tissues were rinsed
with distilled water for five times again to get rid of the excessed osmium tetraoxide.
Tissues were then dehydrated with 70%, 80%, 90%,and 100% ethanol

53
concentrations consecutively with ten minutes each treatment (Spurr 1969). In prior
to embed in wax, tissues were immersed in HistoClear (clearing agent) for one hour.
Tissues were then incubated in warm wax for 24 h. Once wax has infiltrated the
sample, the sample was carefully positioned and surrounded with additional wax
using a steel mould to form a block (Rolls n.d.). Next, tissue cassette was attached
to the wax block containing the tissues and ready for sectioning using microtome,
RM2235 (Leica, Germany). The thickness of the sectioning was 5 µm. The sections
are usually on the order of 4-10 µm thick for use with light microscopy. Tissue slices
were first placed into a warmed water bath (48°C) and then lifted out of the water
onto the glass slide and allowed to dry. After thorough drying (usually takes
overnight), the samples on slides are ready for staining with 0.5% toluidine blue for
five minutes. The micro-cut tissues were then observed under the light microscope,
DM RBE (Leica, Germany).

54
Figure 3.6: Series of tissue fixing. First image showed tissue dehydration within series of ethanol concentrations. Second image showed tissues immersed in clearing agent, HistoClear. The third image showed leaves tissues were positioned inside the cassettes before surrounded with additional wax to
form the block. The last image is a ready wax block with the tissue embedded inside the wax.
3.5 Assessment of leaf injury by Population test
Population test is a method developed to evaluate physical appearance of the
sample. Population test was developed with the aim to evaluate different degrees of
mechanical leaf injuries and how they affect the quality attributes of leafy vegetables.
Spinach sample S4 were damaged by compression as described in Section 3.2. The
compressed leaves were categorised into four different degrees of injuries as shown
in Table 3.3 and Table 3.4. Uncompressed leaves (Control) were also prepared. For
each leaf category, 24 replicates of leaves were used for sampling. The categorised
leaves were packed inside packaging bag; biaxially oriented polypropylene (BOPP)
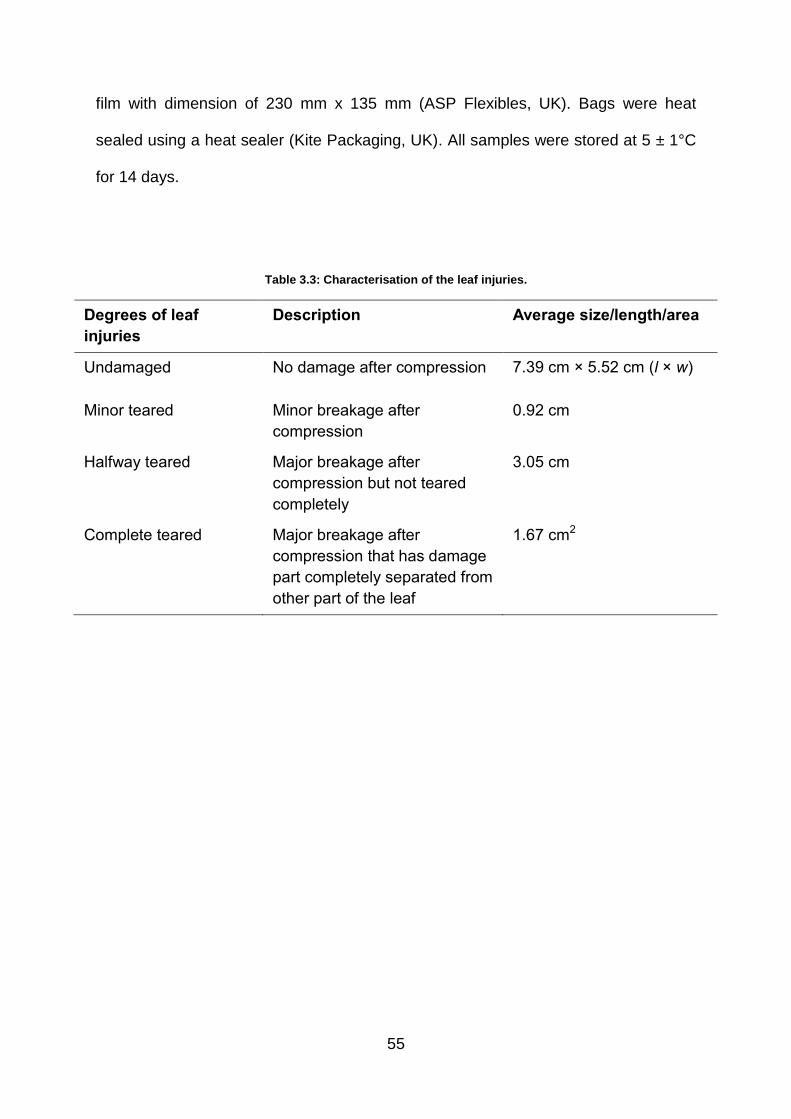
55
film with dimension of 230 mm x 135 mm (ASP Flexibles, UK). Bags were heat
sealed using a heat sealer (Kite Packaging, UK). All samples were stored at 5 ± 1°C
for 14 days.
Table 3.3: Characterisation of the leaf injuries.
Degrees of leaf
injuries
Description Average size/length/area
Undamaged No damage after compression 7.39 cm × 5.52 cm (l × w)
Minor teared Minor breakage after
compression
0.92 cm
Halfway teared Major breakage after
compression but not teared
completely
3.05 cm
Complete teared Major breakage after
compression that has damage
part completely separated from
other part of the leaf
1.67 cm2

56
Table 3.4: Front and back side images of spinach sample S4 for Control, Undamaged, Minor teared, Halfway teared, and Complete teared.
Leaf category Control Undamaged Minor teared Halfway teared Complete teared
Front side
Back side

57
3.5.1 Acquisition of the leaf image
The compressed spinach leaves of sample S4 were arranged on a rectangle
white tray inside a black box with dimension of 65 cm x 40 cm x 40 cm. Two Pro
Series LED video light, LE-130A (Mcoplus, China) were attached inside the top side
of the black box and 9V of direct current supplies were used (Figure 3.7). The
images were captured using digital camera with standard setting (Table 3.5). The
images of Control spinach of sample S4 were also acquired using similar method.
Figure 3.7: Spinach leaves arranged on a white tray inside the black box.
Table 3.5: Camera settings.
Variable Value
Megapixels 8 MP Focal distance 29mm Aperture Av f/2.2 Shutter speed 1/180s ISO 32 Temperature 4900K Flash Off

58
3.5.2 Image analysis
Leaves’ deteriorations were evaluated by analysing the digital images (RGB)
using image processing program, ImageJ. A total of 24 replicates of spinach sample
S4 for each degree of leaf injury were analysed. The black/brown colours of the
decays were detected by the ImageJ by adjusting the ‘Hue, Saturation, and
Brightness’ in the ‘Threshold colour’ box. The detected areas were covered in red
shade and these areas of decays were measured automatically by the software
(Figure 3.8).
Figure 3.8: ImageJ detecting the deteriorations on the back side of the leaf. The red shaded regions were the regions of deteriorations detected by ImageJ.
3.5.3 Contour colour boxes
Contour colour boxes were also generated through a coding developed in
Matlab (R2016b) (Figure 3.9). From this method, the degrees of leaf injuries are
presented with the coloured boxes according to the percentage of deteriorations

59
throughout storage. The colour of the boxes started from blue which represents 0%
of decay to red which represents 100% of decays.
Figure 3.9: Matlab coding for contour colour boxes.
3.6 Fresh weight loss
Packed spinach samples S4 were weighted before and after storage using an
electronic weighing scale, BE610 (Beetle, UK). Water lost from the product to the
environment during storage was measured by measuring fresh weight loss. The
percentage of fresh weight loss of spinach was calculated based on equation:
𝑊𝑙𝑜𝑠𝑠 = 𝑊𝑖𝑛𝑖𝑡𝑖𝑎𝑙−𝑊𝑓𝑖𝑛𝑎𝑙
𝑊𝑖𝑛𝑖𝑡𝑖𝑎𝑙× 100 (17)
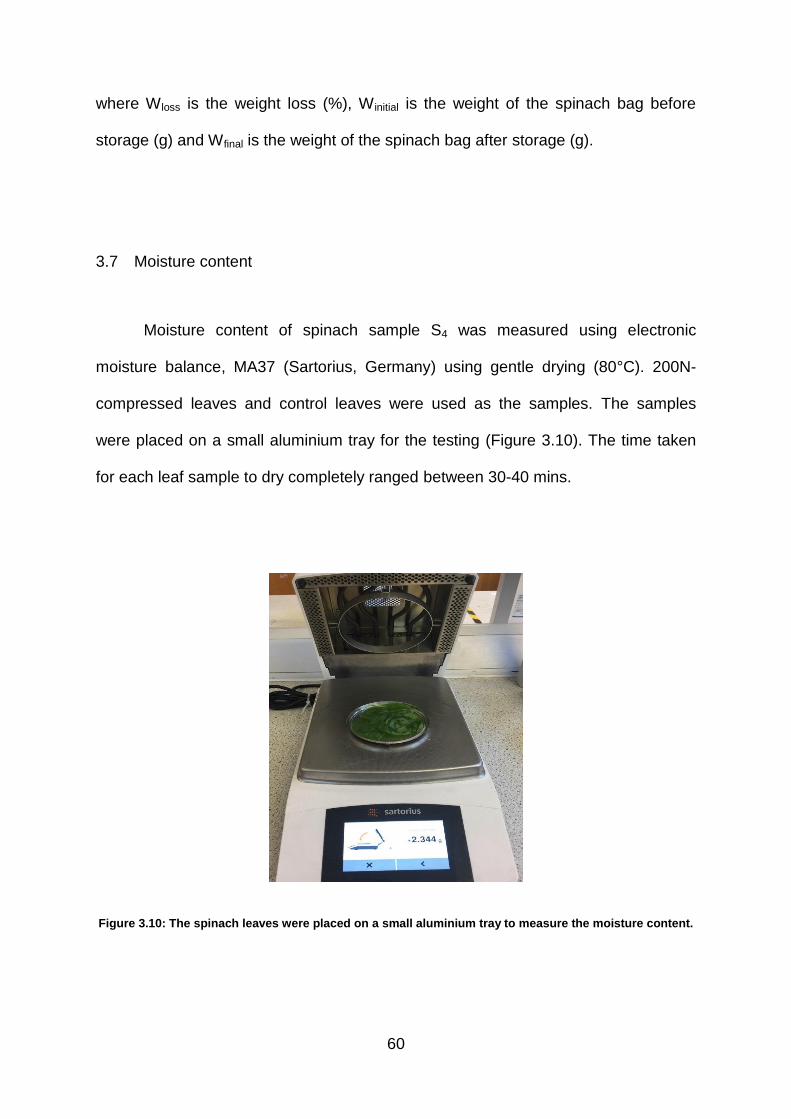
60
where Wloss is the weight loss (%), W initial is the weight of the spinach bag before
storage (g) and Wfinal is the weight of the spinach bag after storage (g).
3.7 Moisture content
Moisture content of spinach sample S4 was measured using electronic
moisture balance, MA37 (Sartorius, Germany) using gentle drying (80°C). 200N-
compressed leaves and control leaves were used as the samples. The samples
were placed on a small aluminium tray for the testing (Figure 3.10). The time taken
for each leaf sample to dry completely ranged between 30-40 mins.
Figure 3.10: The spinach leaves were placed on a small aluminium tray to measure the moisture content.

61
3.8 Sensory evaluation
Sensory test was conducted by a total of 80 non-trained assessors. Since
storage days involved in this study, the bagged spinach were prepared in a reverse
day method. Packaging of the spinach bags began 14 days before the test date.
Bags were prepared on the 14th, 11th, 8th, 4th, and a day before the test date. Spinach
leaves of sample S4 were packed inside BOPP film with dimension of 230 mm x 135
mm (ASP Flexibles, UK). Bags were heat sealed using heat sealer (Kite Packaging,
UK). The packed bags were stored at temperature 5 ± 1°C for 14 days.
The spinach bags were coded with random three digit codes generated by
online digit code number generator (University of Oregon, n.d.). The packed spinach
were provided on white paper plate and placed at individual table during the test.
Ranking test was used to evaluate consumers’ perceptions in evaluating the visibility
of deteriorations of the product. Assessors were asked to rank the visibility of
deterioration on the leaves’ surfaces (5 = most visible; 1 = least visible). ‘Allowing
ties’ or ‘no preference’ option was not allowed as to retain more statistical power
(Kemp et al. 2009). Statistically, both parametric and non-parametric tests were
combined to analyse the data. Fisher LSRD and t-test (p<0.05) were performed to
find significance difference for the visibility of leaves deteriorations between degrees
of leaf injuries throughout storage days. Parameter 𝑡𝛼/2 was taken from table for
Student’s t distribution (see O Mahoney 1986).
To determine consumers’ acceptances in buying the product, acceptance test
was carried out. Assessors were asked to rate their level of liking in buying the
bagged spinach using five levels of hedonic score (5 = I certainly would buy; 4 = I

62
might buy; 3 = I might buy/I might not buy; 2 = I might not buy; 1 = I certainly would
not buy). Assessors were allowed to hold and turn the spinach bags as to make it as
natural as consumers usually behave in the supermarket. The assessors were
allowed to make evaluations based on visual appearance of the samples. Friedman
ANOVA-Wilcoxon with post-hoc Bonferroni test (p<0.017) was conducted to find the
significance difference on consumer’s acceptance in buying the product. Statistical
software IBM SPSS (version 24) was used to conduct the FRIEDMAN ANOVA-
Wilcoxon test.
For both tests, assessors were allowed to give opinions and criticism
regarding the products on the questionnaire used for the sensory evaluation. A set of
questionnaire is available in Appendix A.4.
3.9 Measuring respiration rate of spinach using closed system
Spinach sample S4 was used to study the respiration rate of spinach using a
closed system. Glass jars (1L) containing air as initial gas atmosphere were used as
the closed system. The jars were tightly sealed with micro-perforated BOPP film with
different oxygen transmission rate (OTR) and water vapour transmission rate
(WVTR) (Table 3.6). Oxygen and carbon dioxide concentrations were measured
using gas analyser, Checkmate II (Dansensor, Denmark). Prior to taking gas
measurement, a 15 mm resealable rubber septum was attached on top surface of
each jar to prevent gas leakage into/outside the system (Figure 3.11). The gas
sample was taken using a 0.88 mm stainless steel needle every 1 hour for the first 6
hours of storage, every 6 hours for the next 42 hours and finally every 24 hours for
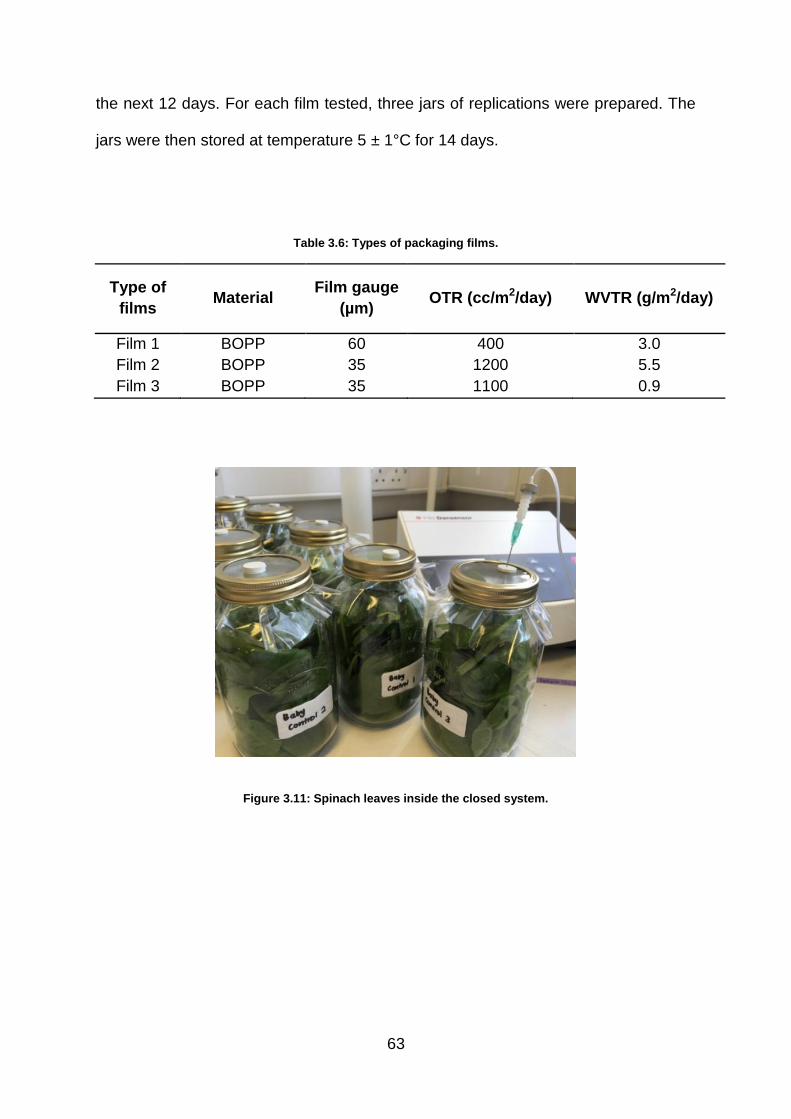
63
the next 12 days. For each film tested, three jars of replications were prepared. The
jars were then stored at temperature 5 ± 1°C for 14 days.
Table 3.6: Types of packaging films.
Type of
films Material
Film gauge
(µm) OTR (cc/m2/day) WVTR (g/m2/day)
Film 1 BOPP 60 400 3.0
Film 2 BOPP 35 1200 5.5
Film 3 BOPP 35 1100 0.9
Figure 3.11: Spinach leaves inside the closed system.

64
3.10 Measuring colour changes of spinach
There are two parts of colour measurements in this study. The first part is
measuring the colour changes using colorimeter, CR-410 (Konica Minolta, Japan)
and the second part is developing a colour analysis technique. In this study, the
colour analysis technique was developed by combining several steps as reported by
(León et al. 2006) and (Pedreschi et al. 2006). The system composed of (i) acquire
the image of the sample in a digital format (Section 3.5.1), (ii) a computer to store the
images, (iii) Matlab coding that converts the RGB values of the sample into L*, a*, b*
units (Figure 3.12), (iv) series of colour charts to calibrate the digital colour system
(Figure 3.13) where L*, a*, b* values of each colour chart was measured using
colorimeter. Additionally, a RGB digital image was also taken from each colour chart
and the RGB values were converted to L*, a*, b* using the image analysis coding
integrated in the Matlab, (v) Calibration curves (L*, a*, b* values from colorimeter vs.
L*, a*, b* values from camera) where the values were obtained from the colour
charts, (vi) Linear equation models obtained from the calibration curves for the
conversion of L*, a*, b* values from camera to L*, a*, b* values of colorimeter. L*
represents changes of Lightness, a* represents changes of Red and Greenness,
whereas b* represents changes of Yellowness and Blueness.

65
Figure 3.12: Matlab coding for conversion of RGB values to L*a*b* values.

66
Figure 3.13: Colour charts of 98 colours.

67
CHAPTER 4
COMPRESSION AND ITS EFFECT TOWARDS MECHANICAL PROPERTIES
AND QUALITIES OF LEAFY VEGETABLES
4.1 Introduction
There have been extensive works reported on the mechanical properties of
fruits and leafy vegetables; however, there is still lack of information to determine the
mechanical behaviour of the leafy vegetables in bulk, as it would be the
representative of the RTE leafy vegetables retailed in packaging bags. Most
mechanical properties reported in the literature were investigated based on individual
sample by performing mechanical tests such as tensile test, compression test,
penetration test, cutting, tearing, puncturing and shearing (Ávila et al. 2007;
Golmohammadi 2013; Toole et al. 2001; Desmet, Van Linden, et al. 2004; Desmet,
Lammertyn, et al. 2004; Vincent 1982; Vincent 1991; Toole et al. 2000; Lucas et al.
1991; Hiller & Jeronimidis 1996; Newman et al. 2005; Read & Sanson 2003; More et
al. 2014; Nabil et al. 2012; Tang et al. 2011; Wang et al. 2010; Al-Sulaiman 2000;
Aranwela et al. 1999).
Compression-induced injury is frequently encountered during handling,
packaging, transporting, and storage (Kays 1991). From grabbing to stacking the
bags for display in the market, the RTE leafy vegetables are vulnerable to
mechanical damage due to the accidental compression throughout the processes.
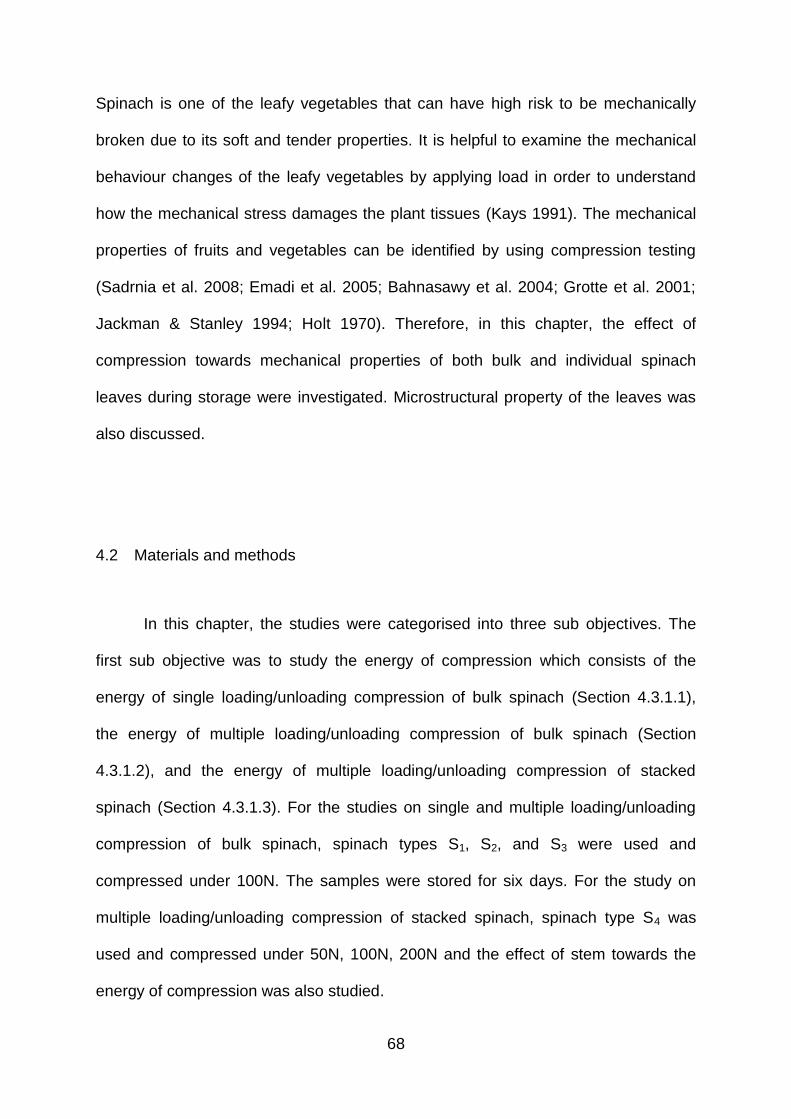
68
Spinach is one of the leafy vegetables that can have high risk to be mechanically
broken due to its soft and tender properties. It is helpful to examine the mechanical
behaviour changes of the leafy vegetables by applying load in order to understand
how the mechanical stress damages the plant tissues (Kays 1991). The mechanical
properties of fruits and vegetables can be identified by using compression testing
(Sadrnia et al. 2008; Emadi et al. 2005; Bahnasawy et al. 2004; Grotte et al. 2001;
Jackman & Stanley 1994; Holt 1970). Therefore, in this chapter, the effect of
compression towards mechanical properties of both bulk and individual spinach
leaves during storage were investigated. Microstructural property of the leaves was
also discussed.
4.2 Materials and methods
In this chapter, the studies were categorised into three sub objectives. The
first sub objective was to study the energy of compression which consists of the
energy of single loading/unloading compression of bulk spinach (Section 4.3.1.1),
the energy of multiple loading/unloading compression of bulk spinach (Section
4.3.1.2), and the energy of multiple loading/unloading compression of stacked
spinach (Section 4.3.1.3). For the studies on single and multiple loading/unloading
compression of bulk spinach, spinach types S1, S2, and S3 were used and
compressed under 100N. The samples were stored for six days. For the study on
multiple loading/unloading compression of stacked spinach, spinach type S4 was
used and compressed under 50N, 100N, 200N and the effect of stem towards the
energy of compression was also studied.
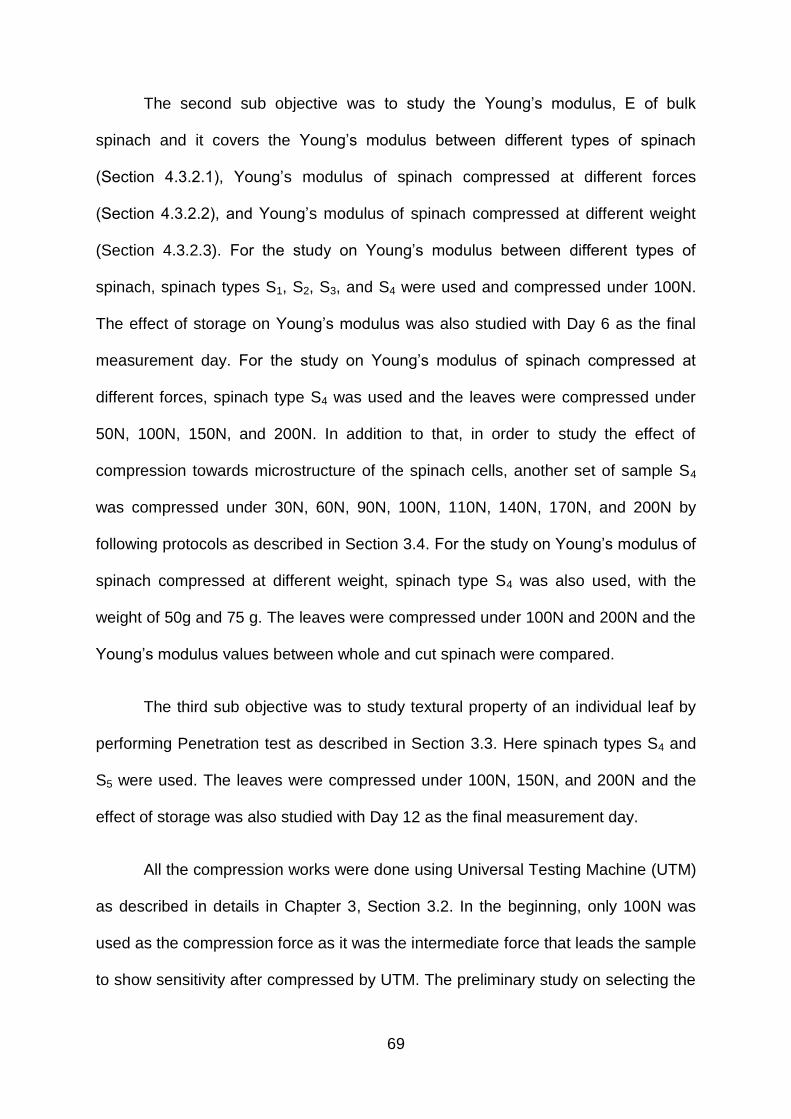
69
The second sub objective was to study the Young’s modulus, E of bulk
spinach and it covers the Young’s modulus between different types of spinach
(Section 4.3.2.1), Young’s modulus of spinach compressed at different forces
(Section 4.3.2.2), and Young’s modulus of spinach compressed at different weight
(Section 4.3.2.3). For the study on Young’s modulus between different types of
spinach, spinach types S1, S2, S3, and S4 were used and compressed under 100N.
The effect of storage on Young’s modulus was also studied with Day 6 as the final
measurement day. For the study on Young’s modulus of spinach compressed at
different forces, spinach type S4 was used and the leaves were compressed under
50N, 100N, 150N, and 200N. In addition to that, in order to study the effect of
compression towards microstructure of the spinach cells, another set of sample S4
was compressed under 30N, 60N, 90N, 100N, 110N, 140N, 170N, and 200N by
following protocols as described in Section 3.4. For the study on Young’s modulus of
spinach compressed at different weight, spinach type S4 was also used, with the
weight of 50g and 75 g. The leaves were compressed under 100N and 200N and the
Young’s modulus values between whole and cut spinach were compared.
The third sub objective was to study textural property of an individual leaf by
performing Penetration test as described in Section 3.3. Here spinach types S4 and
S5 were used. The leaves were compressed under 100N, 150N, and 200N and the
effect of storage was also studied with Day 12 as the final measurement day.
All the compression works were done using Universal Testing Machine (UTM)
as described in details in Chapter 3, Section 3.2. In the beginning, only 100N was
used as the compression force as it was the intermediate force that leads the sample
to show sensitivity after compressed by UTM. The preliminary study on selecting the

70
forces started from the lowest force possible (30N) and went up to 200N. 200N was
the maximum compression force in this study and no further force increment was
made as 200N was the maximum force in the study that showed differences in
responding towards the variable tested. In Section 4.3.1.3, the stem and no stem
spinach were introduced as to study the trend on the presence of stem towards
energy of compression. This could give idea to the fresh vegetable industries to
determine which type (stem or no stem) is the best in resisting stress thus specific
selection of leaves could be proposed for packaging.
4.3 Results and discussion
4.3.1 The energy of compression
4.3.1.1 The energy of single loading/unloading compression
The maximum work (MaxW) is defined as the maximum work generated from
the loading/unloading cycle during the compression. It can also be interpreted as the
maximum energy required to compress the leaves. Among three types of spinach
leaves (Organic, Teen, and Salad), the MaxW required to compress Organic spinach
was found to be the most high followed by Teen and Salad spinach (Table 4.1).
Besides the MaxW, the area under the curve (AUC) was also calculated. AUC
represents the total work required for one complete loading/unloading compression.
Again, Organic spinach shown to have the highest AUC compared to Teen and

71
Salad spinach (Table 4.1). The MaxW and AUC values tabulated in Table 4.1 were
the average values of five replications of compressions.
The MaxW was found to be decreasing after storage. After storage, the
leaves became softer and tender due to the bruising and decay thus less work was
required to compress the leaves. Undesirable loads can be the main reason for
bruising (Emadi et al. 2009). Energy absorbed during compression is strongly
correlated to the bruise volume and thus is a useful parameter to be evaluated in the
handling and packing system of fruits and vegetables (Holt & Schoorl 1977; Holt &
Schoorl 1982). The AUC also decreased after storage which showed that the total
work generated to compress the leaves was reduced due to texture degradation of
the product after storage. This can also be seen from the force-displacement curves
shown in Figure 4.1.
Table 4.1: MaxW values after compressions before and after storage. The data represent the mean of 5 replicates ± standard deviation.
Day 0 Day 6
Teen Organic Salad Teen Organic Salad
MaxW (J) 2.4 ± 0.3 3.0 ± 0.7 2.1 ± 0.3 1.7 ± 0.2 2.0 ± 0.3 1.2 ± 0.2
AUC (J) 7.8 ± 2.7 8.0 ± 0.4 7.0 ± 1.2 7.0 ± 3.0 7.4 ± 3.5 6.0 ± 0.2
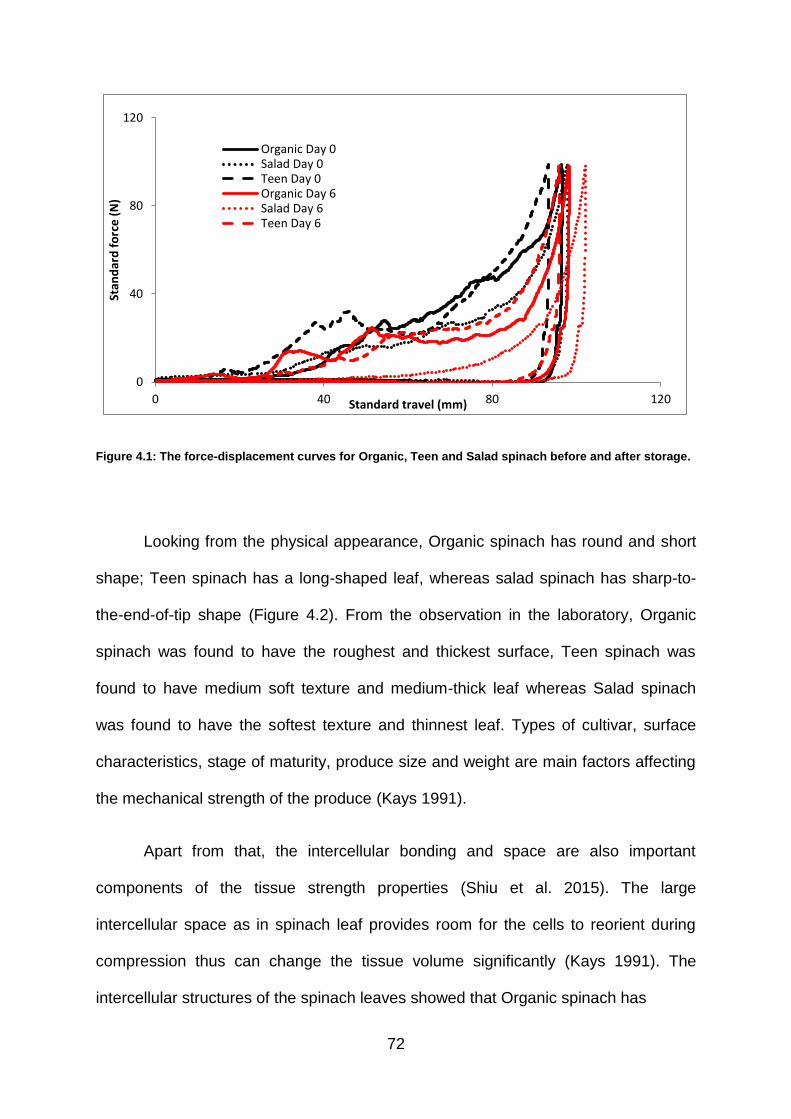
72
Figure 4.1: The force-displacement curves for Organic, Teen and Salad spinach before and after storage.
Looking from the physical appearance, Organic spinach has round and short
shape; Teen spinach has a long-shaped leaf, whereas salad spinach has sharp-to-
the-end-of-tip shape (Figure 4.2). From the observation in the laboratory, Organic
spinach was found to have the roughest and thickest surface, Teen spinach was
found to have medium soft texture and medium-thick leaf whereas Salad spinach
was found to have the softest texture and thinnest leaf. Types of cultivar, surface
characteristics, stage of maturity, produce size and weight are main factors affecting
the mechanical strength of the produce (Kays 1991).
Apart from that, the intercellular bonding and space are also important
components of the tissue strength properties (Shiu et al. 2015). The large
intercellular space as in spinach leaf provides room for the cells to reorient during
compression thus can change the tissue volume significantly (Kays 1991). The
intercellular structures of the spinach leaves showed that Organic spinach has
0
40
80
120
0 40 80 120
Stan
dar
d f
orc
e (
N)
Standard travel (mm)
Organic Day 0Salad Day 0Teen Day 0Organic Day 6Salad Day 6Teen Day 6

73
Figure 4.2: Images of Teen, Organic and Salad spinach.
irregular and larger cell sizes. Teen spinach and Salad spinach have round-shaped
cells where Teen spinach has larger cell size compared to Salad spinach (Figure
4.3). Regardless of the cells arrangement, the irregular shape of the Organic spinach
cells may contribute to the ability of the tissue to resist the mechanical stress exerted
during the compression. A molecule’s shape plays an important role in determining
the physical and mechanical properties of the tissues and the way they interact with
each other (Silberberg 2000; Tro 2008).

74
Figure 4.3: The microstructures of 3 different types of spinach leaves; A) Teen, B) Organic, and C) Salad. The average cell sizes were 30.99 µm, 60.75 µm, and 30.10 µm for Teen, Organic, and Salad spinach
respectively. – was 50µm.
4.3.1.2 The energy of multiple loading/unloading compressions
Apart from single loading/unloading compression, the bulk spinach was also
compressed under multiple consecutive compressions. Previous study on the effect
of degree of compression towards texture profile of apple, carrot, frankfurter,
pretzels, and cream cheese have been conducted (Bourne & Comstock 1981). The
authors controlled the extension cycle to certain range of percentages correspond to
the distance between the plates in order to give different degree of compression
towards the sample (Bourne & Comstock 1981). However, there was so much
variability for each commodity that the method may not be applicable to other
A
C
B

75
compression speeds. It is necessary to standardise the degree of compression and
to report the degree of compression used. Therefore, in this study, the consecutive
multiple compressions under the pre-set force and speed were conducted to study
the behaviour of the work changes required to compress the leaves (Figure 4.4).
Having a standard method could be applicable with other commodities. Plus,
previous studies on the effect of degree of compressions towards mechanical
properties of fruits and vegetables only focused on the individual sample (Shiu et al.
2015; Emadi et al. 2009; Zhu & Melrose 2003; Thybo & Nielsen 2000). Study on the
effect of degree of compression towards mechanical properties of bulk sample as
what RTE leafy vegetables were usually displayed in the market is still lack in the
literature.
Figure 4.4: Randomly thrown bulk spinach before and after 5 times consecutive compressions of 200N.

76
In this study, the bulk spinach was compressed five times consecutively to
create the standard degree of compression. The standard degree of compression
referred to the constant starting position before the compression as well as the
height of the bulk sample. The speed of each compression was 0.5 mm/s, thus the
time taken for each compression depends on the compression force. The higher the
force, the longer the time required for one complete cyclic loading/unloading
compression (i.e. the higher the force of compression, the farther the distance
travelled by the piston to compress the sample). For example, with constant sample
weight, the time required for one complete compression was 135.9 s, 197.6 s, and
214.0 s for sample compressed under 50N, 100N, and 200N respectively.
Four replications were conducted for each variable introduced in this
experiment. As the number of compression increased, the MaxW decreased (Figure
4.5 and Table 4.2). Similar trend was observed at day 6. Another thing to look at is
the MaxW for all the three spinach types were the same at the fifth compression both
before and after storage. This shows that regardless of the spinach types, which,
one type might be rougher or tender to the others, after been compressed
consecutively, they generated similar MaxW which showed that they have reached
the maximum resistance towards stress. This shows that leaf fracture does depend
on the degree of compression where higher degree of compression gave more
prominent effect (Bourne & Comstock 1981). As the leaves were compressed
further, the cell wall that is near to the contact surface reach the elasticity limit
(Thybo & Nielsen 2000). The energy is dissipated through the cell breakage or
stored by distension of the elastic membrane (Holt & Schoorl 1977). Again, the
energy required to compress all types of the spinach leaves after storage was found
to be decreasing due to the texture degradation of the leaves after storage.
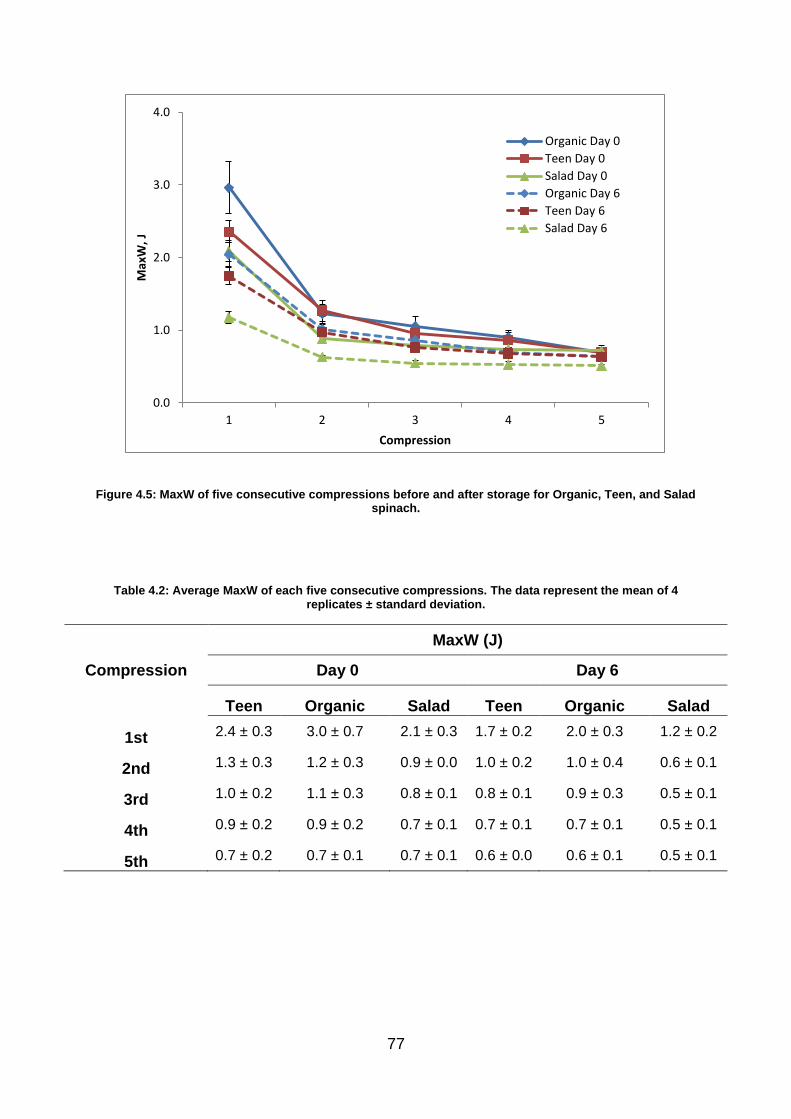
77
Figure 4.5: MaxW of five consecutive compressions before and after storage for Organic, Teen, and Salad spinach.
Table 4.2: Average MaxW of each five consecutive compressions. The data represent the mean of 4 replicates ± standard deviation.
Compression
MaxW (J)
Day 0 Day 6
Teen Organic Salad Teen Organic Salad
1st 2.4 ± 0.3 3.0 ± 0.7 2.1 ± 0.3 1.7 ± 0.2 2.0 ± 0.3 1.2 ± 0.2
2nd 1.3 ± 0.3 1.2 ± 0.3 0.9 ± 0.0 1.0 ± 0.2 1.0 ± 0.4 0.6 ± 0.1
3rd 1.0 ± 0.2 1.1 ± 0.3 0.8 ± 0.1 0.8 ± 0.1 0.9 ± 0.3 0.5 ± 0.1
4th 0.9 ± 0.2 0.9 ± 0.2 0.7 ± 0.1 0.7 ± 0.1 0.7 ± 0.1 0.5 ± 0.1
5th 0.7 ± 0.2 0.7 ± 0.1 0.7 ± 0.1 0.6 ± 0.0 0.6 ± 0.1 0.5 ± 0.1
0.0
1.0
2.0
3.0
4.0
1 2 3 4 5
Max
W, J
Compression
Organic Day 0
Teen Day 0
Salad Day 0
Organic Day 6
Teen Day 6
Salad Day 6

78
4.3.1.3 The energy of multiple loading/unloading compressions of stacked spinach
The work on the multiple compressions was further conducted by stacking the
spinach leaves instead of throwing the bulk spinach into the chamber. The purpose
was to study the behaviour of the sample at different arrangement and to investigate
the resistance between different parts of the sample towards stress. Here, Baby
spinach leaves were used where they were categorised into leaves with stem and
leaves without stem. 20 leaves were stacked and carefully placed inside the
compression chamber (Figure 4.6). Three replications were conducted for each
variable introduced in this experiment.
Figure 4.6: Stacked spinach leaves without stem before and after compressions.
Results show that, under 200N compression, leaves with stem required higher
energy to compress compared to leaves without stem (Figure 4.7 and Table 4.3).
However, for leaves compressed under 50N and 100N, the difference was only
noticed on the first compression and showed similar MaxW between leaves with
stem and without stem starting from the second compression till the fifth
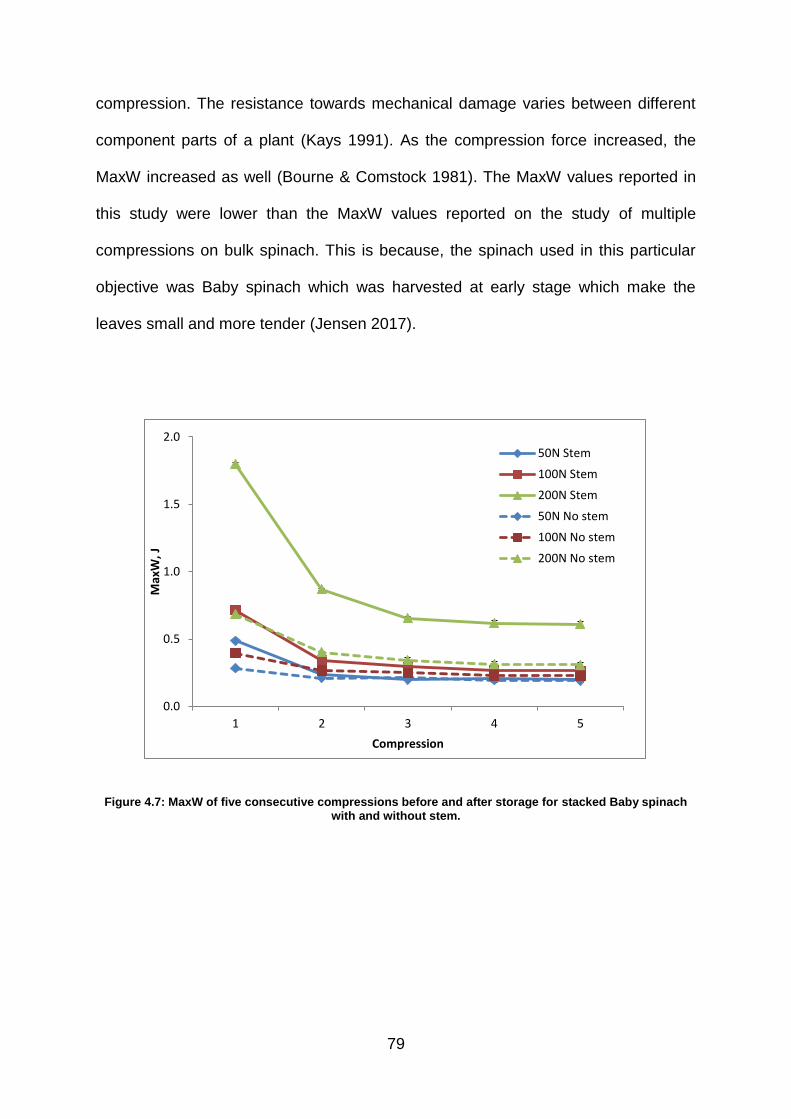
79
compression. The resistance towards mechanical damage varies between different
component parts of a plant (Kays 1991). As the compression force increased, the
MaxW increased as well (Bourne & Comstock 1981). The MaxW values reported in
this study were lower than the MaxW values reported on the study of multiple
compressions on bulk spinach. This is because, the spinach used in this particular
objective was Baby spinach which was harvested at early stage which make the
leaves small and more tender (Jensen 2017).
Figure 4.7: MaxW of five consecutive compressions before and after storage for stacked Baby spinach with and without stem.
0.0
0.5
1.0
1.5
2.0
1 2 3 4 5
Max
W, J
Compression
50N Stem
100N Stem
200N Stem
50N No stem
100N No stem
200N No stem

80
Table 4.3: Average MaxW of stacked spinach. The data represent the mean of 3 replicates ± standard deviation.
Compression
MaxW (J)
Stem Without stem
50N 100N 200N 50N 100N 200N
1st 0.5 ± 0.0 0.7 ± 0.01 1.8 ± 0.03 0.3 ± 0.01 0.4 ± 0.01 0.7 ± 0.03
2nd 0.2 ± 0.01 0.3 ± 0.02 0.9 ± 0.02 0.2 ± 0.01 0.3 ± 0.02 0.4 ± 0.02
3rd 0.2 ± 0.01 0.3 ± 0.03 0.7 ± 0.03 0.2 ± 0.02 0.2 ± 0.03 0.3 ± 0.03
4th 0.2 ± 0.03 0.3 ± 0.03 0.6 ± 0.04 0.2 ± 0.03 0.2 ± 0.03 0.3 ± 0.03
5th 0.2 ± 0.03 0.3 ± 0.01 0.6 ± 0.03 0.2 ± 0.02 0.2 ± 0.01 0.3 ± 0.03
4.3.2 Young’s modulus (E) of bulk spinach
4.3.2.1 Young’s modulus between different types of spinach
The Young’s modulus (E) values for Organic, Teen, Salad, and Baby spinach
before and after storage are shown in Table 4.4. Average E values showed that
Organic spinach has the highest E value compared to Teen, Salad, and Baby
spinach (Table 4.5). Highest E values for Organic spinach showed that organic
spinach was the best in resisting stress and damage compared to Teen, Salad, and
Baby spinach . After storage, the E values decreased. As the leaves were stored
longer, their texture became softer due to the deterioration, thus change of distance
travelled by the upper platon, ∆L to compress the leaves increased causing the work
to decrease.
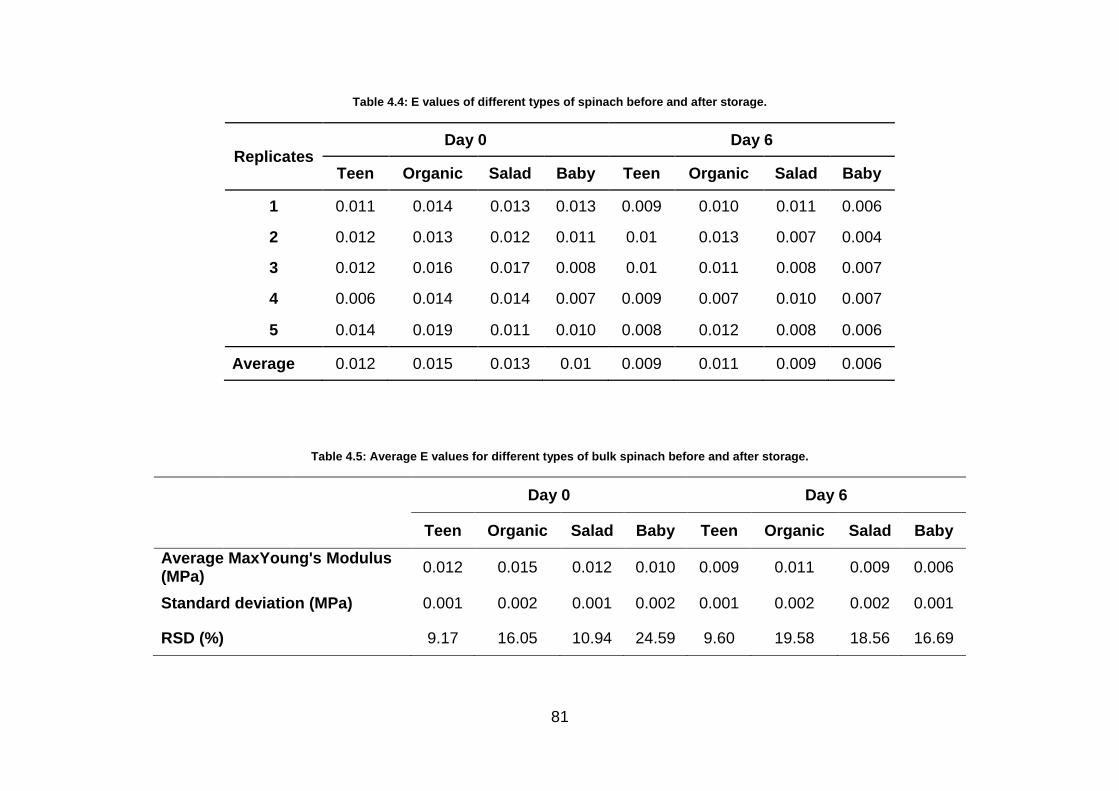
81
Table 4.4: E values of different types of spinach before and after storage.
Replicates Day 0 Day 6
Teen Organic Salad Baby Teen Organic Salad Baby
1 0.011 0.014 0.013 0.013 0.009 0.010 0.011 0.006
2 0.012 0.013 0.012 0.011 0.01 0.013 0.007 0.004
3 0.012 0.016 0.017 0.008 0.01 0.011 0.008 0.007
4 0.006 0.014 0.014 0.007 0.009 0.007 0.010 0.007
5 0.014 0.019 0.011 0.010 0.008 0.012 0.008 0.006
Average 0.012 0.015 0.013 0.01 0.009 0.011 0.009 0.006
Table 4.5: Average E values for different types of bulk spinach before and after storage.
Day 0 Day 6
Teen Organic Salad Baby Teen Organic Salad Baby
Average MaxYoung's Modulus (MPa)
0.012 0.015 0.012 0.010 0.009 0.011 0.009 0.006
Standard deviation (MPa) 0.001 0.002 0.001 0.002 0.001 0.002 0.002 0.001
RSD (%) 9.17 16.05 10.94 24.59 9.60 19.58 18.56 16.69

82
The firmness of the leafy vegetable is influenced by many factors such as
plant structure, type of tissue, cell number, as well as the intercellular volume of the
plant (Luengo et al. 2008). Other factor that greatly influenced the mechanical
properties of the leaves tissues are agronomic treatments, as well as geographic
variations and season (Gutiérrez-Rodríguez et al. 2013; Zhang et al. 2017).
Reductions in strength and stiffness, and increment in failure strain were due to the
lack of plant turgidity. More turgid leaf will be more vulnerable to cracking compared
to wilt leaf. Cell turgidity, water content, and the existence of pectins, lignins,
hemicellulose and cellulose microfibers within cell wall are important factors that
affect plant tissue elasticity and rigidity. This explains the amount of mechanical
damage that may occur during processing and handling of plant material (Newman
et al. 2005; Falk et al. 1958). However, firmness dependent on turgidity only work for
range of compact vegetables and fruits such as potatoes, onions, tomatoes and
mangoes. For non-compact vegetables with low density such as leafy vegetables,
the turgor solely is not adequate to determine the firmness. Especially for the low
apparent density with irregular shape and size such as spinach, direct mathematical
conversion of turgor dependent firmness values are not acceptable. The spatial
arrangement of the layered tissues within these low apparent density commodities
are susceptible to deform which resulted in breakage in the midrib tissue of the leaf
when exposed to above certain capacity it can stand (Luengo et al. 2008). As this
condition is likely favoured for those looking for crisp and crunchy textures, it is also
important to take note on other types of failures experienced by the leaves such as
wilting, bruising and browning which also contribute to the reduction of quality and
shelf lives of the leafy vegetables.

83
4.3.2.2 Young’s modulus for spinach compressed at different forces
Young’s modulus is directly proportional to the force exerted on the sample
under compression. Thus, the higher the force, the higher the E values (Table 4.6).
This means that the work per unit volume required to compress the bulk spinach
inside the chamber increased. The high values of relative standard deviation (RSD)
showed that spinach has a very complex system where there are huge possibilities
of variations between every single spinach leaf (Table 4.7).
Table 4.6: E values of bulk spinach compressed at different forces.
Replicates Young's Modulus (Mpa)
50N 100N 150N 200N
1 0.008 0.023 0.039 0.071
2 0.007 0.031 0.021 0.041
3 0.011 0.026 0.021 0.074
Average 0.009 0.027 0.027 0.062
Table 4.7: Average E values of bulk spinach compressed at different forces.
50N 100N 150N 200N
Average MaxYoung's Modulus (MPa) 0.009 0.027 0.027 0.062
Standard deviation (MPa) 0.002 0.004 0.010 0.019
RSD (%) 21.58 15.45 38.32 29.88

84
The microstructures of the spinach tissues compressed at different forces are
shown in Figure 4.8. The range of the cell sizes was from 43.89 µm – 46.97 µm. Cell
sizes were measured by taking average of 30 cell sizes for each compression force.
The spinach cell sizes did not break although the compression force increased;
however, there were cell bursting releasing it contents which caused the blurry
images. For example, at 200N, the cell’s image was a bit blurred compared to the
leaves compressed under 30N. As the compression force increased, there were
more cell’s bursting among tissue thus caused blurry view when observed under the
light microscope. Within the bruise, the cells ruptured and released the sap into the
air filled interstitial spaces (Holt & Schoorl 1982).
Figure 4.8: The microstructures of spinach sample S4 for A) Control, and after been compressed with B) 30N, c) 60N, D) 90N, E) 100N, F) 110N, G) 140N, H) 170N, I) 200N. – was 50µm.
85
There may be cell ruptures when the magnitude of the stress is great enough,
however if the stress is relatively low and for a short time, the deformation will be
elastic, with the cell recovering its original shape (Kays 1991). Hypothetically, as the
compression force increases, the breakage of the cells was assumed to be
increasing. As the degree of compression increased, one would expect breakdown
of the structural elements of a food and lowered the degree of shape recovery
(Bourne & Comstock 1981). However, in this particular study, after the test was run,
that was not the case. This is because; the leaves were compressed in bulk. After
the compression, not all the leaves inside the chamber were broken. Some partly
broken, some completely broken and some remain intact. In some cases, only the
leaves at the edges of the chamber were damaged while the leaves in the middle
part of the chamber remained intact. Apart from that, the selection of the spinach
samples to be put under the light microscope was done in random where the images
observed under the light microscope may be those from the unbroken part of the
leaves.
Apart from the microstructure of the leaf surface, the cross sections of the
leaves were also micro thinly cut by microtome and observed under the light
microscope. The images were observed under 10X objective magnification. The 10X
objective magnification was chosen as it was able to display the whole cross section
of the leaves when observed under the light microscope. The free areas within the
cells were measured using image processing software, ImageJ with constant
dimension for area of measure. The areas highlighted in red were the free space
areas detected by ImageJ (Figure 4.9). Results showed that there was tissue
breakage observed from the cross section (Figure 4.9). Before storage, the cross
section of the leaves was more connected and there was more volume of tissues

86
presented. After six days of storage, the middle part of the cross section of the
leaves was disintegrated and the tissues seemed to lose most of their cell. From the
ImageJ, using image calibration of 16 pixels/mm (based on calibration image
captured under 10X objective magnification), the average free area of the cells
before storage was found to be 108.1 mm2 whereas after storage, the free area of
the cells was found to be 272.4 mm2. The increased in the free space areas was due
to the cells lost their contents due to compression and the effect was more obvious
after storage as the deterioration of the leaves increased as the storage day
increased.
Figure 4.9: Cross section of spinach sample S4 compressed under 200N observed under light microscope with 10X objective magnification. A) day 0; B) day 7. The areas highlighted in red were the
free space areas detected by ImageJ.
87
Regardless of the microstructural property of the leaves, by looking at the
physical appearance, the leaves did show breakage when compressed under the
pre-set force (Figure 4.10). Physical appearance plays major role in determining the
quality of the product. The quality changes of the produce are depending on both
degree of compression as well as the nature of the produce (Bourne & Comstock
1981).

88
Figure 4.10: Digital images showed mechanical damage of Baby spinach leaves after 200N compression A) Front sides; B) Back sides.

89
4.3.2.3 Young’s modulus for Baby spinach compressed at different weight
Comparing the E values between two different weights, it showed that as the
weight of the sample increased, the E value decreased (Table 4.8 and Table 4.9).
Mass is directly proportional to the bed volume, V. Recalling Equation (7), E is
inversely proportional to the bed volume, V. Thus, increasing the weight of spinach
inside the same package size reduced package-free volume and caused faster
quality changes in the in-pack atmosphere (Kaur et al. 2011). This lead the spinach
to be more vulnerable to damage compared to bag that contain lesser weight of
spinach. This is because, as the weight of spinach increased; there will be more
contacting and overlapping between the leaves. As spinach leaves are soft and
tender, packing necessary weight of spinach will reduce the ‘collision’ between the
leaves in the bag, thus reduce the leaves tendency to be accidentally broken. Pack
with excessive weight increases compression and impact bruising (Wills et al.
2007). Production of water vapour inside the package also increased as the weight
increased which then led to condensation of water vapour inside the package, and
thus quality degradation of the product (Kaur et al. 2011). Poor packaging can lead
to compression among the leafy vegetables which then lead to mechanical injuries
such as cracking, breaking, abrasion, and excessive impact (Luengo et al. 2008; Kim
et al. 2004a; Piagentini & Güemes 2002; Lu 2007).
Comparing E values between whole spinach and cut spinach, it can be clearly
seen that cut spinach has lower E values compared to whole spinach while the force
and weight were kept constant. Lower E values indicate that the leaves were softer
and more susceptible to damage. This is obvious as the leaves were cut before the
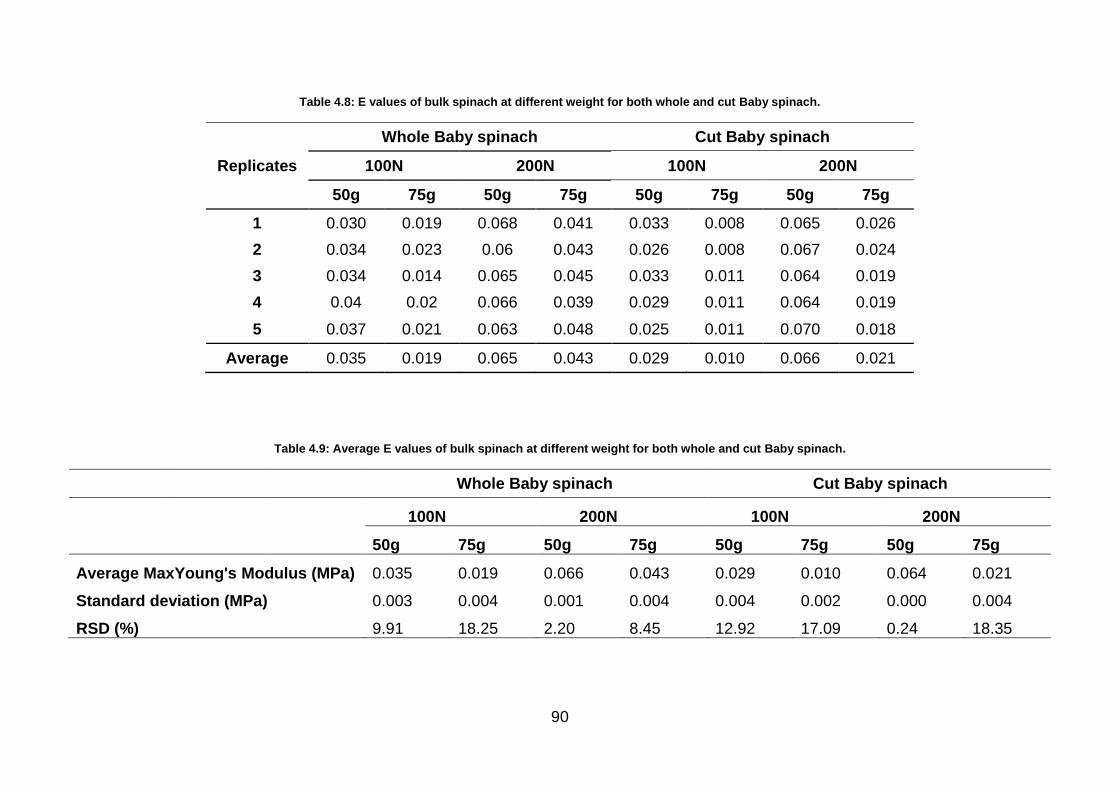
90
Table 4.8: E values of bulk spinach at different weight for both whole and cut Baby spinach.
Replicates
Whole Baby spinach Cut Baby spinach
100N 200N 100N 200N
50g 75g 50g 75g 50g 75g 50g 75g
1 0.030 0.019 0.068 0.041 0.033 0.008 0.065 0.026
2 0.034 0.023 0.06 0.043 0.026 0.008 0.067 0.024
3 0.034 0.014 0.065 0.045 0.033 0.011 0.064 0.019
4 0.04 0.02 0.066 0.039 0.029 0.011 0.064 0.019
5 0.037 0.021 0.063 0.048 0.025 0.011 0.070 0.018
Average 0.035 0.019 0.065 0.043 0.029 0.010 0.066 0.021
Table 4.9: Average E values of bulk spinach at different weight for both whole and cut Baby spinach.
Whole Baby spinach Cut Baby spinach
100N 200N 100N 200N
50g 75g 50g 75g 50g 75g 50g 75g
Average MaxYoung's Modulus (MPa) 0.035 0.019 0.066 0.043 0.029 0.010 0.064 0.021
Standard deviation (MPa) 0.003 0.004 0.001 0.004 0.004 0.002 0.000 0.004
RSD (%) 9.91 18.25 2.20 8.45 12.92 17.09 0.24 18.35

91
compression, it opened the leaves surfaces to the air thus the leaves became soft
and deteriorated faster. The work done per unit volume of the leaves inside the
chamber decreased. This implies that even with small amount of force exerted to the
leaves; they could be easily broken and damaged. The leaf injury provides more
areas for the fungicide residues to be trapped in the leaves (Gonzalez et al. 1988),
causing contamination and spoilage of the products (Babic et al. 1996), which then
lead to softening of the leaf tissue (Neal et al. 2010). Spinach processing line
industry need to be very careful in selecting good leaves only before they are being
packed to reduce the tendency of the whole product inside the bag to deteriorate
faster.
4.3.3 Textural property of individual spinach leaf
In this study, Baby and Young spinach leaves were compressed under 100N,
150N and 200N and the effect of compression force towards spinach texture was
evaluated throughout storage by performing Penetration test.
Analyses of Variances were performed using statistical software SPSS,
considering both One-Way ANOVA and Two-Ways ANOVA with post-hoc tests,
Tukey’s and Bonferroni. The statistical analysis began by using Bonferroni to do the
multiple comparisons following ANOVA. Although Bonferroni test is easy and widely
applicable, it is extremely general and often not powerful. Tukey’s test was then
chosen to do the multiple comparisons as this method is considered the best for all-
possible pairwise comparisons when sample sizes are unequal and very good even
with equal samples sizes. Another good way to perform multiple comparisons of
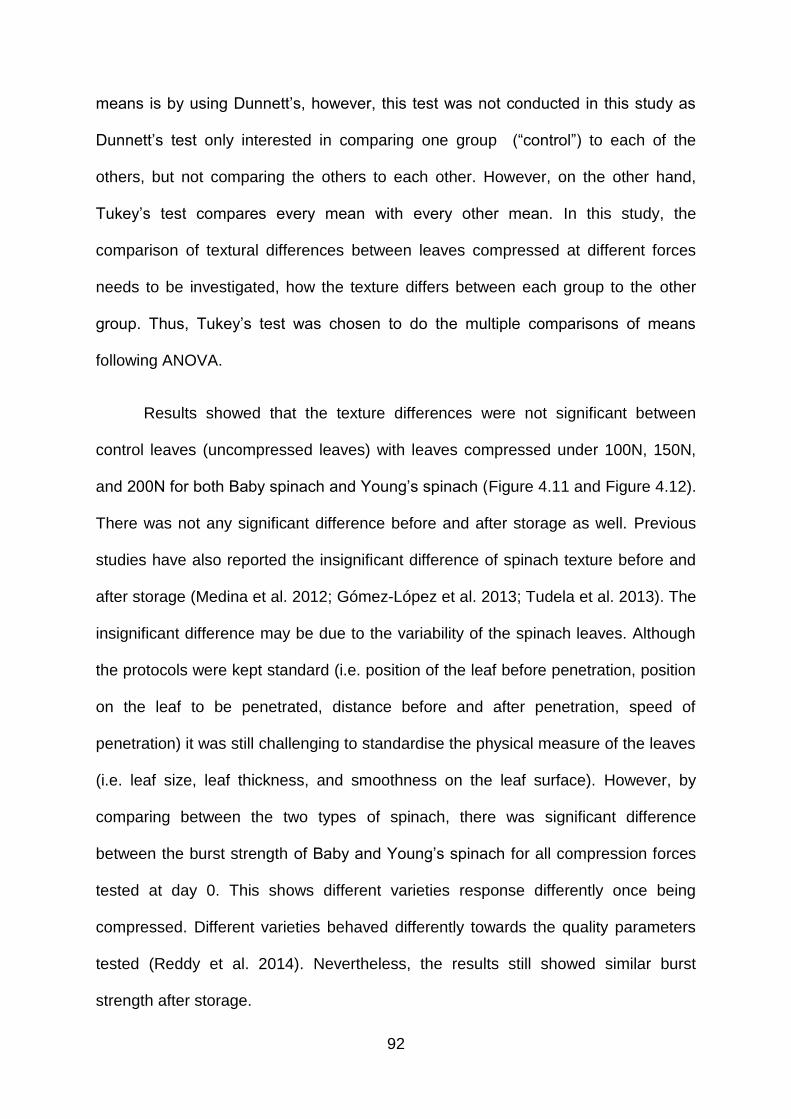
92
means is by using Dunnett’s, however, this test was not conducted in this study as
Dunnett’s test only interested in comparing one group (“control”) to each of the
others, but not comparing the others to each other. However, on the other hand,
Tukey’s test compares every mean with every other mean. In this study, the
comparison of textural differences between leaves compressed at different forces
needs to be investigated, how the texture differs between each group to the other
group. Thus, Tukey’s test was chosen to do the multiple comparisons of means
following ANOVA.
Results showed that the texture differences were not significant between
control leaves (uncompressed leaves) with leaves compressed under 100N, 150N,
and 200N for both Baby spinach and Young’s spinach (Figure 4.11 and Figure 4.12).
There was not any significant difference before and after storage as well. Previous
studies have also reported the insignificant difference of spinach texture before and
after storage (Medina et al. 2012; Gómez-López et al. 2013; Tudela et al. 2013). The
insignificant difference may be due to the variability of the spinach leaves. Although
the protocols were kept standard (i.e. position of the leaf before penetration, position
on the leaf to be penetrated, distance before and after penetration, speed of
penetration) it was still challenging to standardise the physical measure of the leaves
(i.e. leaf size, leaf thickness, and smoothness on the leaf surface). However, by
comparing between the two types of spinach, there was significant difference
between the burst strength of Baby and Young’s spinach for all compression forces
tested at day 0. This shows different varieties response differently once being
compressed. Different varieties behaved differently towards the quality parameters
tested (Reddy et al. 2014). Nevertheless, the results still showed similar burst
strength after storage.
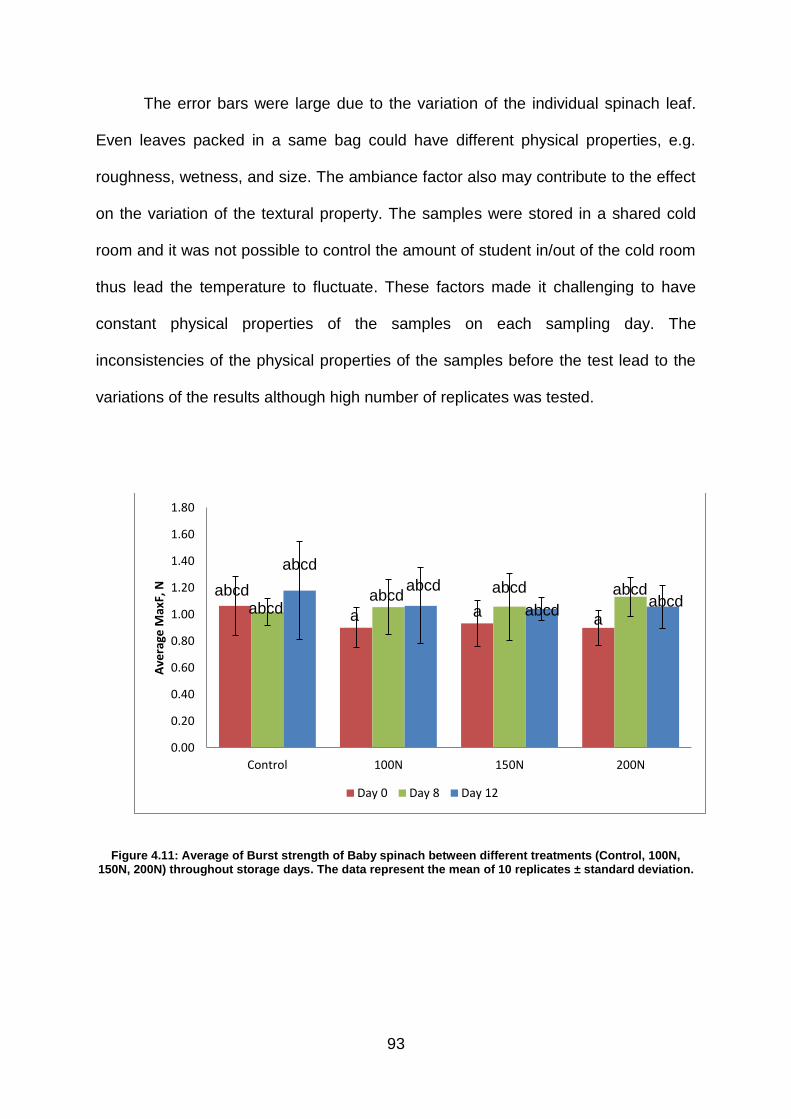
93
The error bars were large due to the variation of the individual spinach leaf.
Even leaves packed in a same bag could have different physical properties, e.g.
roughness, wetness, and size. The ambiance factor also may contribute to the effect
on the variation of the textural property. The samples were stored in a shared cold
room and it was not possible to control the amount of student in/out of the cold room
thus lead the temperature to fluctuate. These factors made it challenging to have
constant physical properties of the samples on each sampling day. The
inconsistencies of the physical properties of the samples before the test lead to the
variations of the results although high number of replicates was tested.
Figure 4.11: Average of Burst strength of Baby spinach between different treatments (Control, 100N, 150N, 200N) throughout storage days. The data represent the mean of 10 replicates ± standard deviation.
0.00
0.20
0.40
0.60
0.80
1.00
1.20
1.40
1.60
1.80
Control 100N 150N 200N
Ave
rage
Max
F, N
Day 0 Day 8 Day 12
a a
abcd
abcd abcd
abcd
a
abcd abcd abcd
abcd
abcd

94
Figure 4.12: Average Burst strength of Young spinach between different treatments (Control, 100N, 150N, 200N) throughout storage days. The data represent the mean of 10 replicates ± standard deviation.
4.4 Conclusion
From the single loading/unloading compression, different types of spinach
resulted in different energy of compression. Organic spinach was found to produce
the highest energy with maximum work, MaxW required to compress the spinach.
Teen spinach followed as second type of spinach that produced the highest MaxW
followed by Salad spinach. This can be concluded that Organic spinach was found to
be the best in resisting stress and damage compared to Teen, and Salad spinach.
The MaxW was found to be decreasing after storage. This is due to the leaves that
became softer after storage thus the energy required to compress the leaves
decreased. Also, as the storage day increased, the area under the curve, AUC which
0.00
0.20
0.40
0.60
0.80
1.00
1.20
1.40
1.60
1.80
Control 100N 150N 200N
Ave
Max
F, N
Day 0 Day 8 Day 12
b bcd
a a
a a a
bc
a a
a
a
95
represents the springiness of the bulk sample decreased as well. This is due to the
bulk sample that became wet after storage and got more attached to each other
inside the bag.
From the multiple loading/unloading compressions, as the number of
compression increased, the MaxW decreased. This trend was found similar between
before and after storage. The MaxW values for all spinach types were found to be
the same after the 5th compression. This is due to the spinach samples that have
reached their maximum resistance towards stress. Again, the MaxW was also found
to be decreasing as the storage day increased due to the texture degradation of
spinach after storage.
From the energy of stacked spinach, spinach with stem always resulted in
higher MaxW compared to spinach without stem. This suggests that leaf with
attached stem resist the ambiance stress better than leaf without stem. Suggestion
could be made to the fresh vegetable industries during the selection process, to help
them choosing leaf criteria that is best in resisting stress.
Results of Young’s modulus, E showed that Organic spinach has the highest E
values compared to Teen, Salad, and Baby spinach. Again, this suggests that
Organic spinach is the best in resisting stress. The E values were found to be
decreasing after storage again due to texture degradation.
Compressing the bulk spinach leaves with increasing force (used in this study)
did not break the cells wholly; however, there were cells bursting their contents
within the intercellular space that caused the blurry image under the microscope.
Although the cell breakage was hardly seen under the light microscope, from the
physical appearance of the leaves, the mechanical breakage can be clearly seen.
96
This shows that physical appearance plays major role in affecting consumer’s
perception while judging the product.
As the weight of spinach increased, the E values decreased. This suggests that
by reducing the weight of spinach inside the packaging bag, while putting
appropriate weight may reduce the possibility of the leaves inside the bag to be
compressed due to crowdedness inside the bag thus lowered the risk for accidental
mechanical leaf damage. Besides that, cut spinach also showed lower E values
compared to whole spinach. This shows that cut leaves have softer texture
compared to whole leaves. As the leaves were cut, it opens the leaves’ surfaces for
more transpiration and respiration which then lead to deterioration.
The E values from this work were smaller than the E values reported from the
literature. This is because, from this work, the E values were measured for spinach
in bulk instead of individual leaf as reported by the literatures. Besides that, from the
uniaxial compression inside the bed chamber, not all the spinach leaves under the
compression got teared or broken completely. As for many works reported by the
literature, the values of E were higher because the leaves had been teared
completely by tensile test or the individual flesh broke and damaged from the
compression test. The E values for baby spinach under tensile test in diagonal,
perpendicular, and parallel directions were reported to be 1.084MPa, 0.3914 MPa
and 2.137MPa respectively (Tang et al. 2011). English round (ER) and Spanish
iceberg (SI) had the range of E values from 1.1 - 2.0 MPa and 2.3 MPa - 4.4 MPa for
ER and SI respectively depending on the orientations of the sample position during
the test (Toole et al. 2000). Leaves (Calophyllum inophyllum L.) have E values range
97
from 186.4 – 240.2 MPa and 49.8 – 67.5 MPa when tested along and across the
veins respectively (Lucas et al. 1991).
From the Penetration test, there was not any textural difference for spinach
before and after storage and also between spinach compressed at different forces.
However, there was texture difference between detected between Baby and Young
spinach at day 0. The variation of the leaves may lead to the insignificant difference
of the spinach texture and this can be seen from the large error bars.
This work provides basis to understand the effect of compression towards
mechanical and microstructural properties of spinach which can be used to improve
the processing and handling of the spinach at the distribution chain and retailer level.
98
CHAPTER 5
MECHANICAL LEAF INJURY AND ITS EFFECT ON QUALITY AND SHELF
LIFE OF LEAFY VEGETABLES
5.1 Introduction
From the farm handling, harvesting, postharvest processing, packaging, and
distributing, RTE leafy vegetables are exposed to various loading conditions. These
loading conditions cause mechanical failure which then lead to undesirable quality
loss of the product. It has been claimed that vegetable types, harvesting season,
package types, brand and distributors did have influence on the quality of the
vegetables (Wisakowsky et al. 1977; Veit et al. 1996; Watada et al. 1996; García-
Gimeno & Zurera-Cosano 1997; Kader 2002; Bergquist et al. 2006; Caponigro et al.
2010; Oliveira et al. 2010; Durand 2013; Tudela et al. 2013;), however, these factors
only accounted for less than 25% towards the quality of the product. On the other
hand, cultivation environment, processing operations as well as delays of
refrigeration had a larger impact on the overall quality of RTE salads (Hodges et al.
2000; Hodges & Forney 2003; Carrasco et al. 2007; Caponigro et al. 2010; Lester et
al. 2010; Gutiérrez-Rodríguez et al. 2013; Kou et al. 2014; Garrido et al. 2015). Most
RTE products are sold within few weeks after packaging as they have a very short
life span.
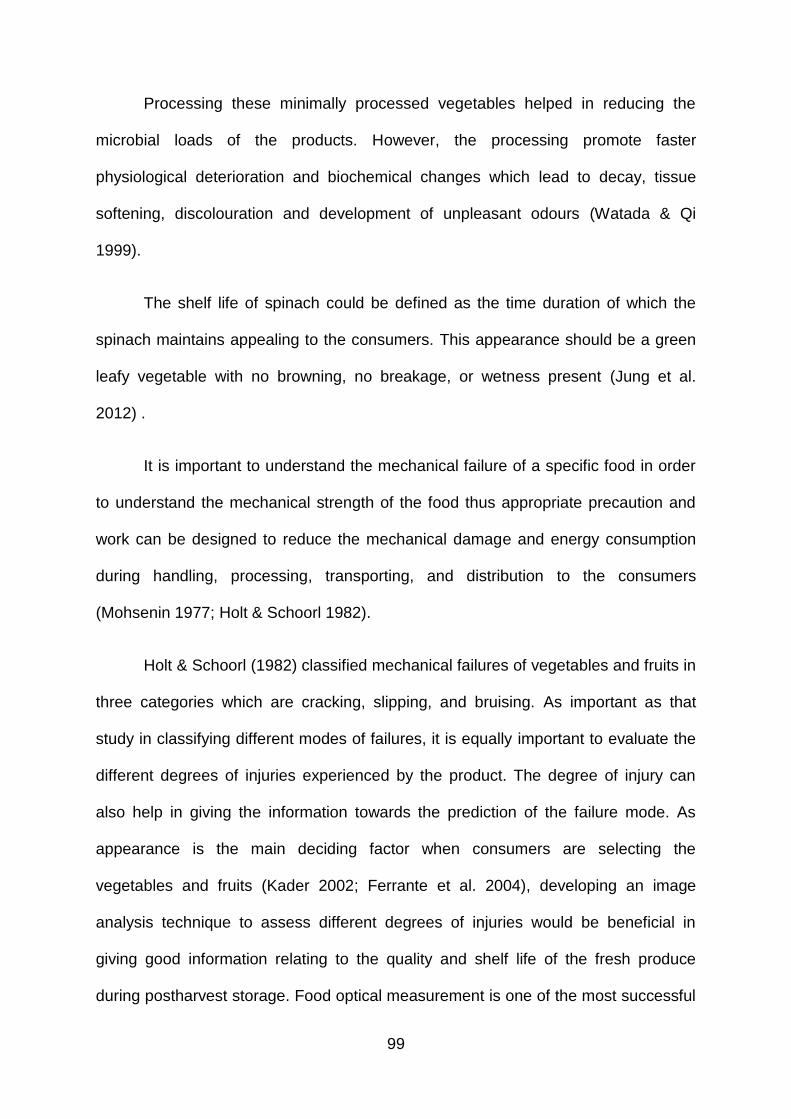
99
Processing these minimally processed vegetables helped in reducing the
microbial loads of the products. However, the processing promote faster
physiological deterioration and biochemical changes which lead to decay, tissue
softening, discolouration and development of unpleasant odours (Watada & Qi
1999).
The shelf life of spinach could be defined as the time duration of which the
spinach maintains appealing to the consumers. This appearance should be a green
leafy vegetable with no browning, no breakage, or wetness present (Jung et al.
2012) .
It is important to understand the mechanical failure of a specific food in order
to understand the mechanical strength of the food thus appropriate precaution and
work can be designed to reduce the mechanical damage and energy consumption
during handling, processing, transporting, and distribution to the consumers
(Mohsenin 1977; Holt & Schoorl 1982).
Holt & Schoorl (1982) classified mechanical failures of vegetables and fruits in
three categories which are cracking, slipping, and bruising. As important as that
study in classifying different modes of failures, it is equally important to evaluate the
different degrees of injuries experienced by the product. The degree of injury can
also help in giving the information towards the prediction of the failure mode. As
appearance is the main deciding factor when consumers are selecting the
vegetables and fruits (Kader 2002; Ferrante et al. 2004), developing an image
analysis technique to assess different degrees of injuries would be beneficial in
giving good information relating to the quality and shelf life of the fresh produce
during postharvest storage. Food optical measurement is one of the most successful

100
non-destructive methods in assessing the quality of food products while providing
several quality details (Diezma et al. 2013).
Regardless of works reported on evaluating failures for many different
vegetables and fruits as described in the literature review, Section 2.5.1 and Section
2.6, there is still lack of research to assess different degrees of mechanical leaf
injuries and how they affect the quality and shelf life of RTE spinach during
postharvest storage. Therefore, the objective of this chapter is to establish a method
that can be used to assess different degrees of leaf injuries and how they affect
qualities degradation and shelf life of RTE spinach.
5.2 Materials and method
In this work, 30g spinach sample S4 were subjected to each 50N, 100N,
150N, and 200N through uniaxial compression using Universal Testing Machine as
described in Section 3.2. Classification of the leaves injuries was carried out by
following the Population test protocols as described in Section 3.5 where leaves
were classified into categories according to the degrees of damage and the RGB
image acquisition and analysis were carried out by following methods described in
Section 3.5.1 and Section 3.5.2 respectively. Colour contoured boxes were also
generated using coding developed in MATLAB (R2016b) (Section 3.5.3).

101
5.3 Results and discussions
5.3.1 Distribution of deteriorations
Visibility of deteriorations is the main concern during postharvest storage of
leafy vegetables (Fan et al. 2014). Generally, consumer assessed the quality of the
vegetables from physical appearance rather than measuring the bacterial load in the
market. In this section, distributions of deteriorations of packed spinach leaves are
discussed.
5.3.1.1 Deterioration of uncompressed (Control) leaves throughout storage
Control leaves were uncompressed leaves which mean the leaves did not
have any breakage or deteriorations to begin with. The distribution of deterioration
for spinach is presented in histogram bars as shown in Figure 5.1. It is easier and
faster to analyse the deterioration for the whole image of each sample by distributing
the original quality values in histogram bars (Lunadei et al. 2012). The bars
represented the frequency of spinach leaves inside the packaging bag that got more
than 1% decays. According to USDA (2006), less than 1% decay on an individual
spinach leaf is allowed for the spinach to be sold in the market. The colours of the
bars went from blue for day 1 up to red for day 14. 100% of the Control leaves had
less than 1% of deteriorations up to 8 days of storage. After 11 days of storage, only
4% of the leaves had more than 1% of the damage whereas after 14 days of
storage, 14% of the leaves had more than 1% of damage which was still way lower
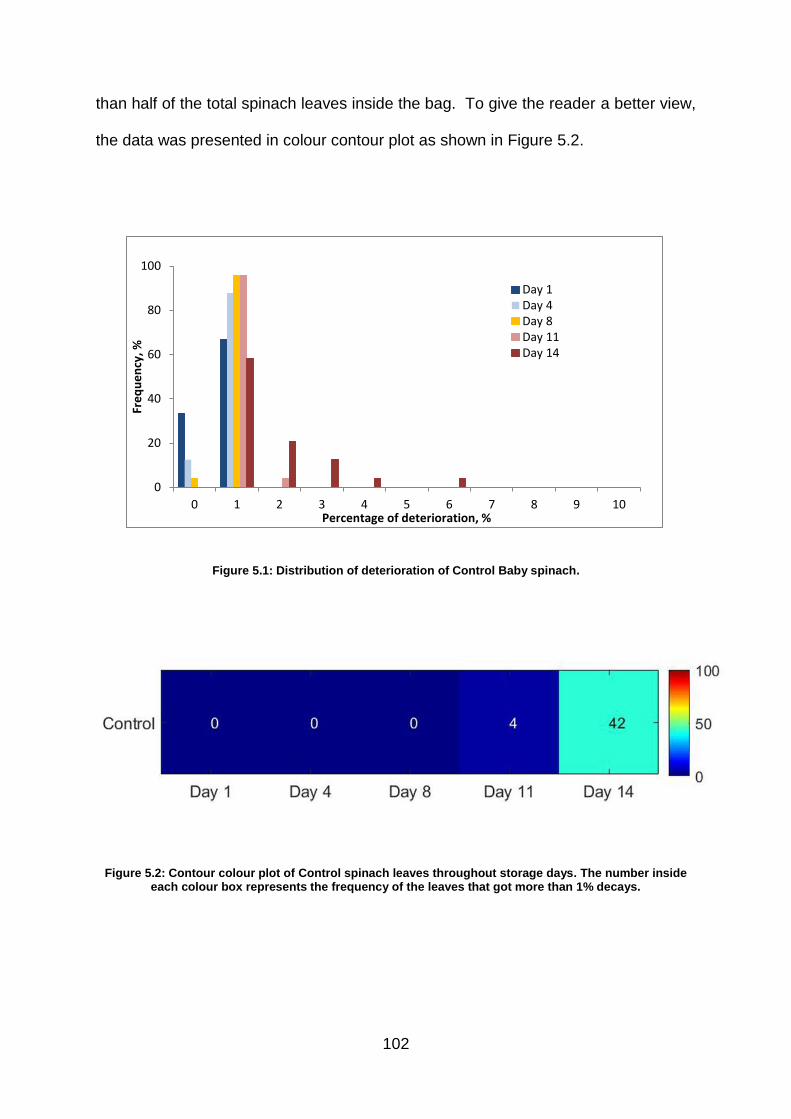
102
than half of the total spinach leaves inside the bag. To give the reader a better view,
the data was presented in colour contour plot as shown in Figure 5.2.
Figure 5.1: Distribution of deterioration of Control Baby spinach.
Figure 5.2: Contour colour plot of Control spinach leaves throughout storage days. The number inside each colour box represents the frequency of the leaves that got more than 1% decays.
0
20
40
60
80
100
0 1 2 3 4 5 6 7 8 9 10
Fre
qu
en
cy, %
Percentage of deterioration, %
Day 1Day 4Day 8Day 11Day 14
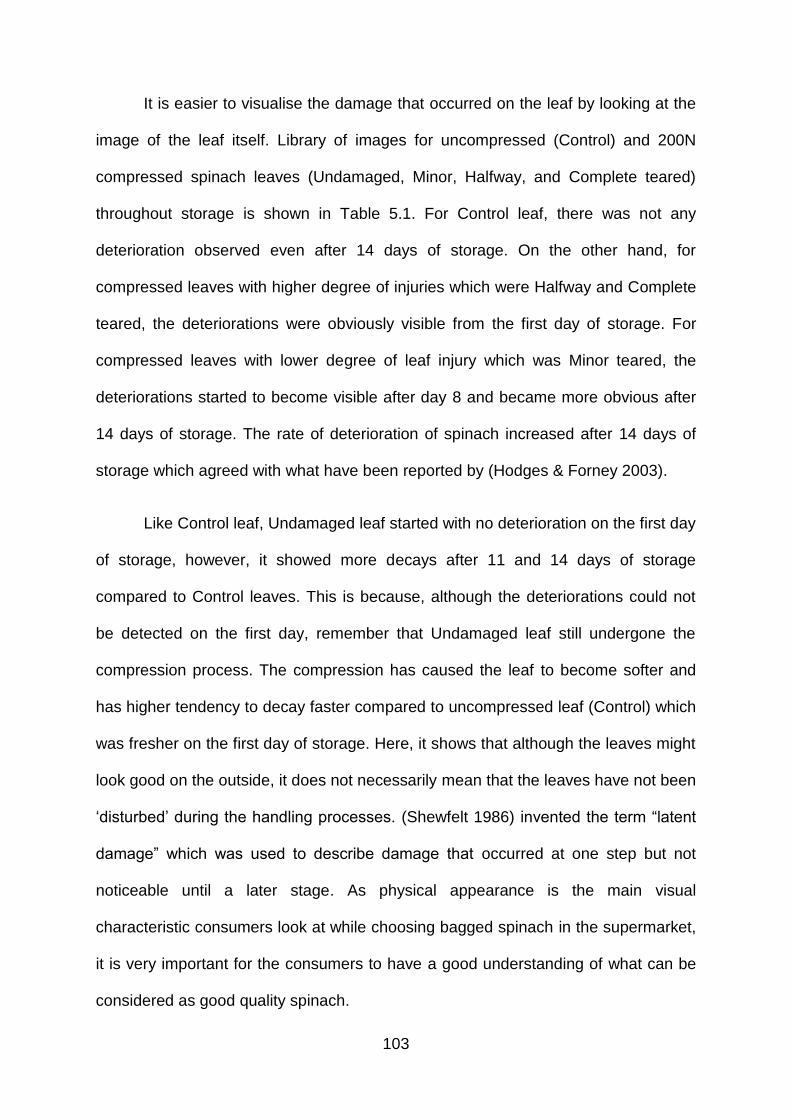
103
It is easier to visualise the damage that occurred on the leaf by looking at the
image of the leaf itself. Library of images for uncompressed (Control) and 200N
compressed spinach leaves (Undamaged, Minor, Halfway, and Complete teared)
throughout storage is shown in Table 5.1. For Control leaf, there was not any
deterioration observed even after 14 days of storage. On the other hand, for
compressed leaves with higher degree of injuries which were Halfway and Complete
teared, the deteriorations were obviously visible from the first day of storage. For
compressed leaves with lower degree of leaf injury which was Minor teared, the
deteriorations started to become visible after day 8 and became more obvious after
14 days of storage. The rate of deterioration of spinach increased after 14 days of
storage which agreed with what have been reported by (Hodges & Forney 2003).
Like Control leaf, Undamaged leaf started with no deterioration on the first day
of storage, however, it showed more decays after 11 and 14 days of storage
compared to Control leaves. This is because, although the deteriorations could not
be detected on the first day, remember that Undamaged leaf still undergone the
compression process. The compression has caused the leaf to become softer and
has higher tendency to decay faster compared to uncompressed leaf (Control) which
was fresher on the first day of storage. Here, it shows that although the leaves might
look good on the outside, it does not necessarily mean that the leaves have not been
‘disturbed’ during the handling processes. (Shewfelt 1986) invented the term “latent
damage” which was used to describe damage that occurred at one step but not
noticeable until a later stage. As physical appearance is the main visual
characteristic consumers look at while choosing bagged spinach in the supermarket,
it is very important for the consumers to have a good understanding of what can be
considered as good quality spinach.
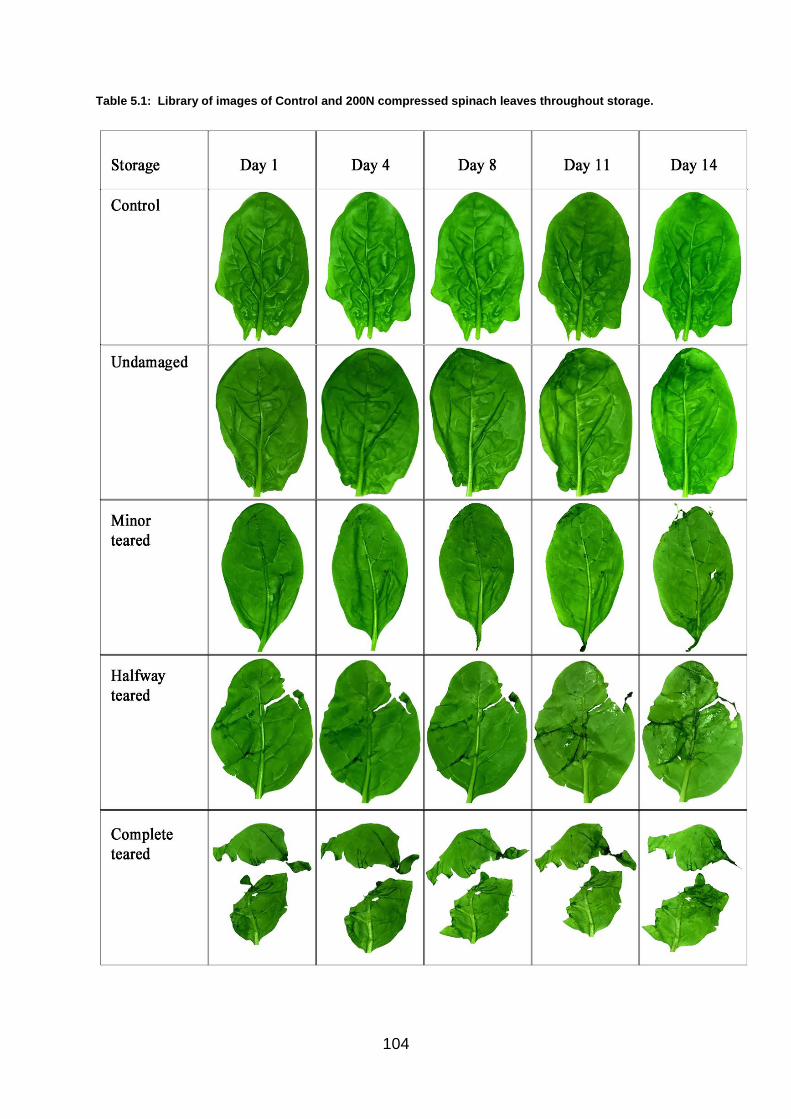
104
Table 5.1: Library of images of Control and 200N compressed spinach leaves throughout storage.

105
Various works have been conducted to determine the shelf life of spinach.
Neal et al. (2010) reported that constant temperature and proper gas composition
maintained throughout storage helped to extend the shelf life of spinach.
Combination of washing with chlorine dioxide and packed under MAP helped to
reduce the microbial loads thus improve the safety of spinach during consumption
time (Lee & Baek 2008). Other novel techniques were introduced to study the shelf
life of spinach such as fumigation of sodium hydrosulfide (NaHS) to reduced leaf
yellowing of water spinach (Hu et al. 2015), use of nano-mist as an alternative to
conventional mist humidification during spinach-storage atmosphere (Saenmuang, et
al. 2012), combination of spraying microencapsulated antimicrobials with e-beam
irradiation to deactivate microorganisms on spinach (Gomes et al. 2011a), e-beam
irradiation to reduce bacterial counts and to prolong the shelf life of fresh spinach
(Neal et al. 2010), and treatment with low to moderate UV-C radiation which was
found effective as an alternative to sanitisation with chlorine water to preserve the
quality of minimally processed spinach leaves (Artes-Hernandez et al. 2009).
The shelf life of fresh vegetables is defined as the storage time at which the
quality attributes have score below 7 (Pirovani et al. 1997). Spinach leaves were
found unacceptable after eight days when stored under 4°C (Pandrangi & Laborde
2004). Piagentini & Güemes (2002) reported that fresh-cut spinach keep at 4°C and
90% HR can be maintained for eight days using LDPE bags and six days using OPP
bags. In this study, 14 days was chosen as the final measurement day to make sure
the study covers the full range of shelf life of spinach.
106
5.3.1.2 Deterioration of compressed leaves throughout storage
Spinach leaves are exposed to different degrees of leaf injuries due to range
of force exertions throughout the handling processes. The colour contour plots for
compressed spinach leaves according to their degrees of leaf injuries as well as the
forces of compressions from day 1 till day 14 are shown in Figure 5.3. The number
inside each colour box represented the total frequency of leaves that had more than
1% decay. The box’s colour started from dark blue for 0% of total leaves that had
decay to red colour for 100% of total leaves that had decay. Going down the column,
as the degree of leaf injury went higher, the percentage of the leaves that had more
than 1% of deteriorations increased. Overall, the boxes were having colour transition
from dark blue to dark red. Going across from left to right, as the compression force
increased, the percentage of leaves that got more than 1% of deterioration increased
as well. Spinach leaves are living organisms thus they continue to respire, transpire,
and lose water after harvest (Jung et al. 2012). These physiological activities lead to
deterioration, senescence, and weight loss of the product (Aked 2000). In addition
to this, the breakage on the spinach leaves due to compression disrupted the
protective epidermal layer of the leaf which caused cells to rupture and expose the
leaf surface to biochemical reactions. These reactions include enzyme and substrate
interactions that lead to tissue browning. Several main enzymes involved in
enzymatic browning are oxidative enzymes such as peroxidase, polyphenyl oxidase
(PPO), and phenylalanine ammonia lysase (PAL). These enzymes oxidised soluble
phenolic compounds and produce orthoquinones, which then undergo
polymerisation and produce insoluble brown pigments (Castaner et al. 1999;
Delaquis et al. 1999; Zhou et al. 2004). The mechanical damage on the spinach
107
leaves also caused the release of the cell contents which allows ‘free-access’ to the
microbes to easily gain nutrients inside the cells, thus promotes positive environment
for bacterial reproduction, which lead to shelf life reduction of the product (Delaquis
et al. 1999; Zhou et al. 2004).
In addition to that, as the storage day increased, the percentage of
deterioration increased as well (Figure 5.3 A-E). This obviously can be seen from the
‘concentration’ of red-coloured boxes for frequency of leaves that had more than 1%
decays at day 14 (Figure 5.3E) compared to ‘concentration’ of blue-coloured boxes
at day 1 (Figure 5.3A). Meanwhile, the coloured boxes for Complete teared and
Halfway teared leaves for all compression forces started to be in orange-red colour
after day 4 (Figure 5.3B). After 8 days of storage, only Minor teared leaves
compressed under 200N started to change colour to orange-red (Figure 5.3C). This
shows that after day 8 with 200N treatment, the Minor teared leaves started to
exhibit similar properties as Complete teared and Halfway teared leaves. This data is
also plotted and shown in Figure 5.4.
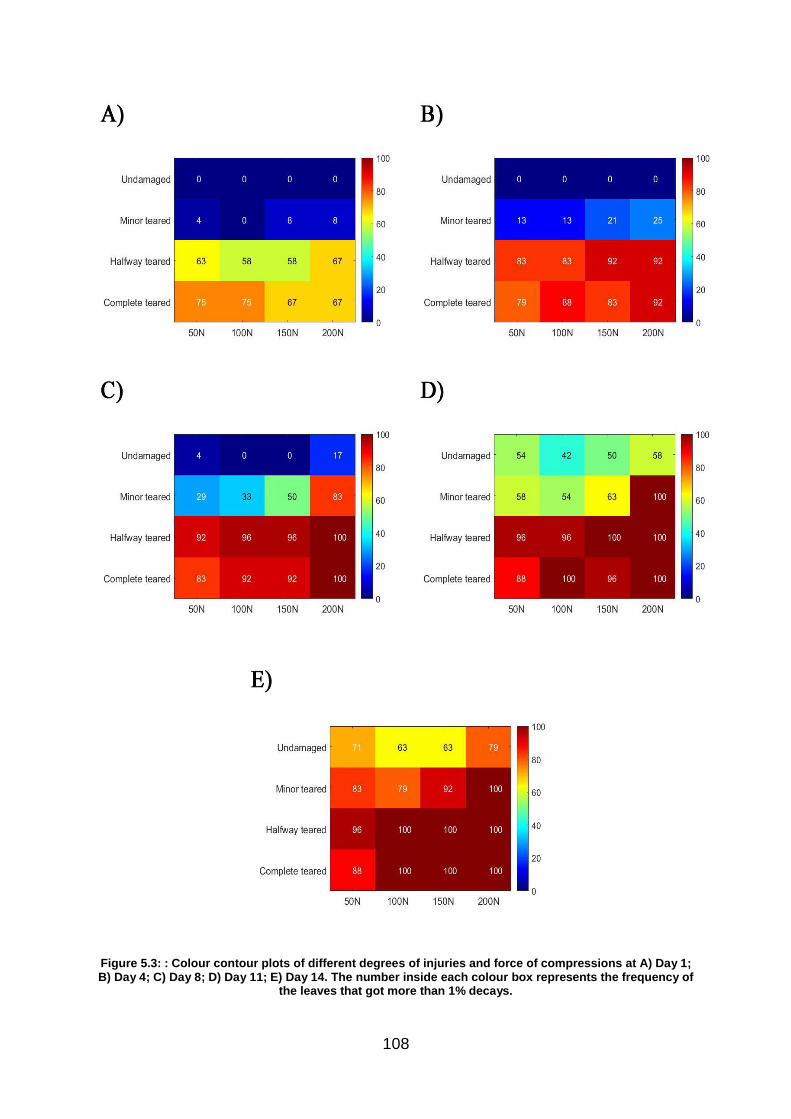
108
Figure 5.3: : Colour contour plots of different degrees of injuries and force of compressions at A) Day 1; B) Day 4; C) Day 8; D) Day 11; E) Day 14. The number inside each colour box represents the frequency of
the leaves that got more than 1% decays.
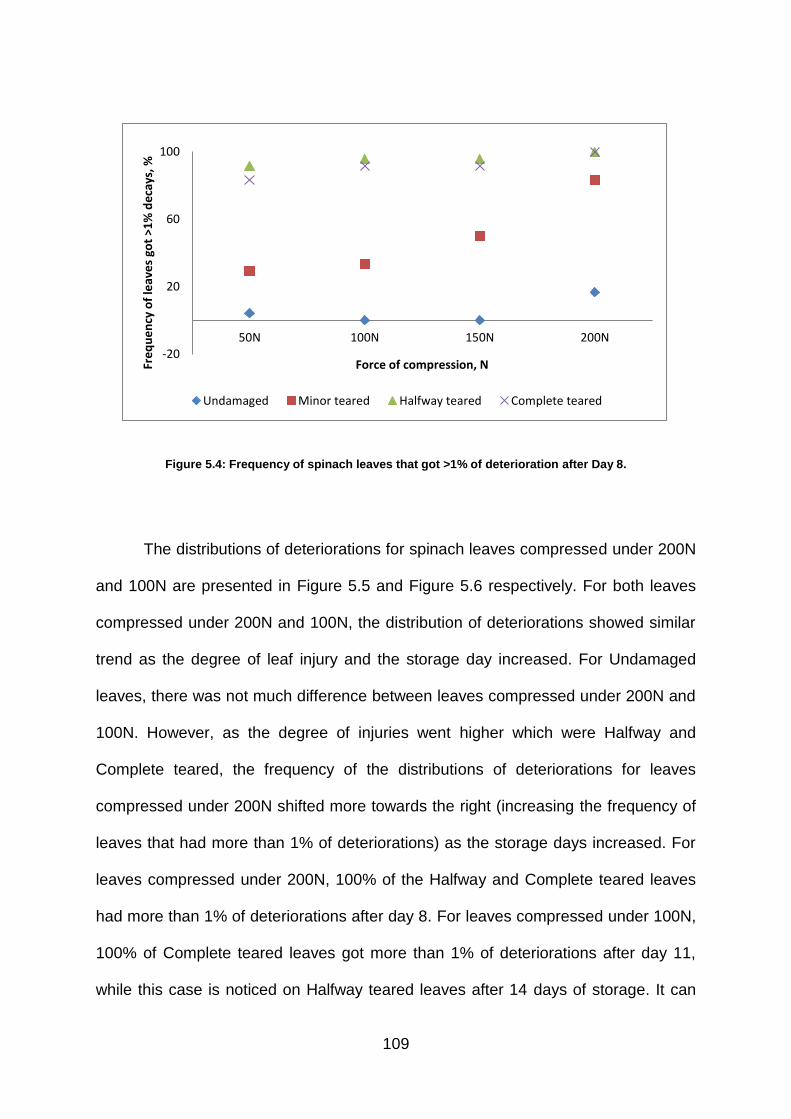
109
Figure 5.4: Frequency of spinach leaves that got >1% of deterioration after Day 8.
The distributions of deteriorations for spinach leaves compressed under 200N
and 100N are presented in Figure 5.5 and Figure 5.6 respectively. For both leaves
compressed under 200N and 100N, the distribution of deteriorations showed similar
trend as the degree of leaf injury and the storage day increased. For Undamaged
leaves, there was not much difference between leaves compressed under 200N and
100N. However, as the degree of injuries went higher which were Halfway and
Complete teared, the frequency of the distributions of deteriorations for leaves
compressed under 200N shifted more towards the right (increasing the frequency of
leaves that had more than 1% of deteriorations) as the storage days increased. For
leaves compressed under 200N, 100% of the Halfway and Complete teared leaves
had more than 1% of deteriorations after day 8. For leaves compressed under 100N,
100% of Complete teared leaves got more than 1% of deteriorations after day 11,
while this case is noticed on Halfway teared leaves after 14 days of storage. It can
-20
20
60
100
50N 100N 150N 200N
Fre
qu
en
cy o
f le
ave
s go
t >1
% d
eca
ys, %
Force of compression, N
Undamaged Minor teared Halfway teared Complete teared

110
be concluded that the degree of leaf injury as well as the force of compression did
affect the quality and shelf life of the spinach. Both mechanical damage as well as
the intensity of the processing injuries accelerate the metabolic processes of the
Swiss chard leaves (Roura et al. 2000). Shredded carrots were found to have
different respiratory rates than sliced carrots (Izumi et al. 1995) and the rate of
ethylene production by cut green bananas was dependent on the thickness of the
slices (McGlasson 1969).
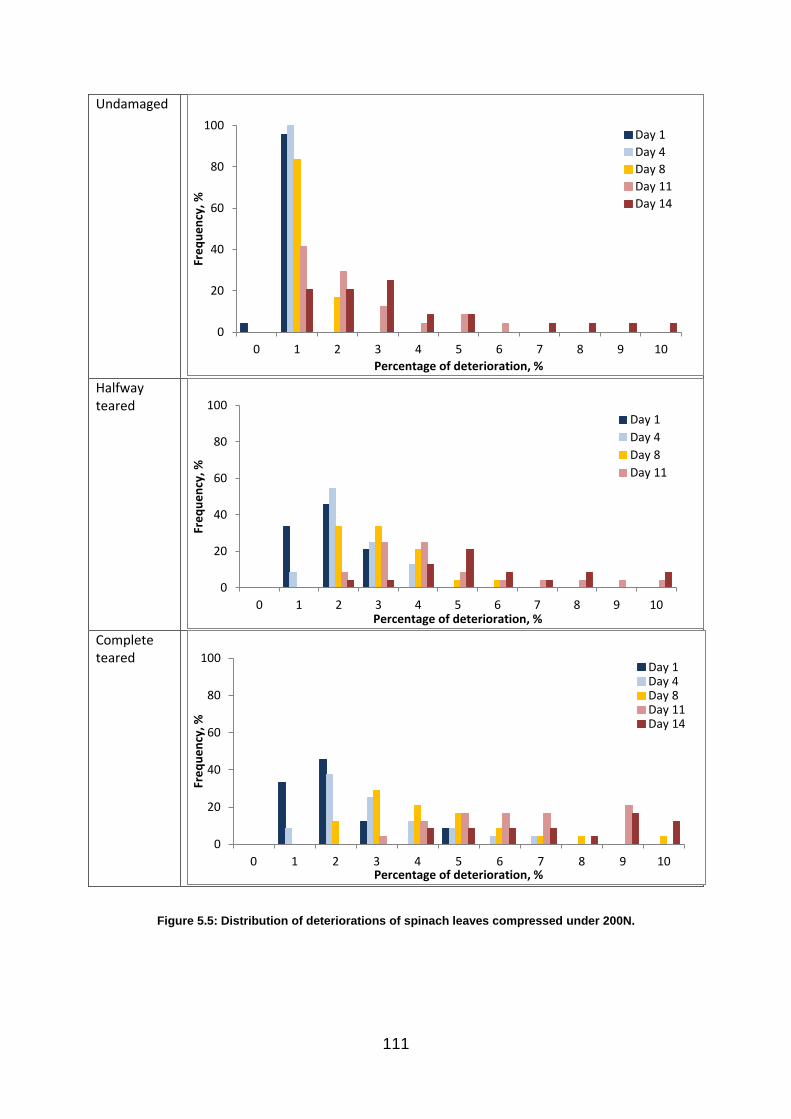
111
Undamaged
Halfway teared
Complete teared
Figure 5.5: Distribution of deteriorations of spinach leaves compressed under 200N.
0
20
40
60
80
100
0 1 2 3 4 5 6 7 8 9 10
Fre
qu
en
cy, %
Percentage of deterioration, %
Day 1
Day 4
Day 8
Day 11
Day 14
0
20
40
60
80
100
0 1 2 3 4 5 6 7 8 9 10
Fre
qu
en
cy, %
Percentage of deterioration, %
Day 1
Day 4
Day 8
Day 11
0
20
40
60
80
100
0 1 2 3 4 5 6 7 8 9 10
Fre
qu
en
cy, %
Percentage of deterioration, %
Day 1Day 4Day 8Day 11Day 14

112
Undamaged
Halfway teared
Complete teared
Figure 5.6: Distribution of deteriorations of spinach leaves compressed under 100N.
0
20
40
60
80
100
0 1 2 3 4 5 6 7 8 9 10
Fre
qu
en
cy, %
Percentage of deterioration, %
Day 1Day 4Day 8Day 11Day 14
0
20
40
60
80
100
0 1 2 3 4 5 6 7 8 9 10
Fre
qu
en
cy, %
Percentage of deterioration, %
Day 1Day 4Day 8Day 11Day 14
0
20
40
60
80
100
0 1 2 3 4 5 6 7 8 9 10
Fre
qu
en
cy, %
Percentage of deterioration, %
Day 1Day 4Day 8Day 11Day 14

113
5.3.2 Comparison of quality and shelf life of Control and compressed leaves
throughout storage
5.3.2.1 The frequency of spinach leaves that got more than 1% of total decays
throughout storage
The data was further analysed by combining the decays from all degrees of
leaf injuries in a same batch of packed spinach. The same batch referred to sample
under one complete compression. The Control group was also considered as one
single batch. This approach was taken as to study the total deteriorations
experienced by the spinach leaves inside the bag as a whole. The frequency of
leaves that got more than 1% of total decays for Control and spinach leaves
compressed under 50N, 100N, 150N, and 200N throughout storage days is shown in
Figure 5.7. Going down the column, starting from Control to the increasing force of
compression, the percentage of total decays increased as the compression force
increased.
Going right across the row, the percentage of the total decays increased as
the storage day increased. For leaves compressed under 200N, the box started to
turn orange-red since day 8, whereas for leaves compressed under 50N, 100N, and
150N, the box started to turn orange-red in colour only after 14 days of storage. As
for Control leaves, the coloured boxes remained blue to light blue after 14 days of
storage which means the leaves could be still consumable/fresh even after 14 days
of storage. Intact spinach remained acceptable after 13 days of storage (Artes-
Hernandez et al. 2009). The mechanically injured squash showed the worst quality
after 15 days of storage affecting physical appearance, chemical parameters and
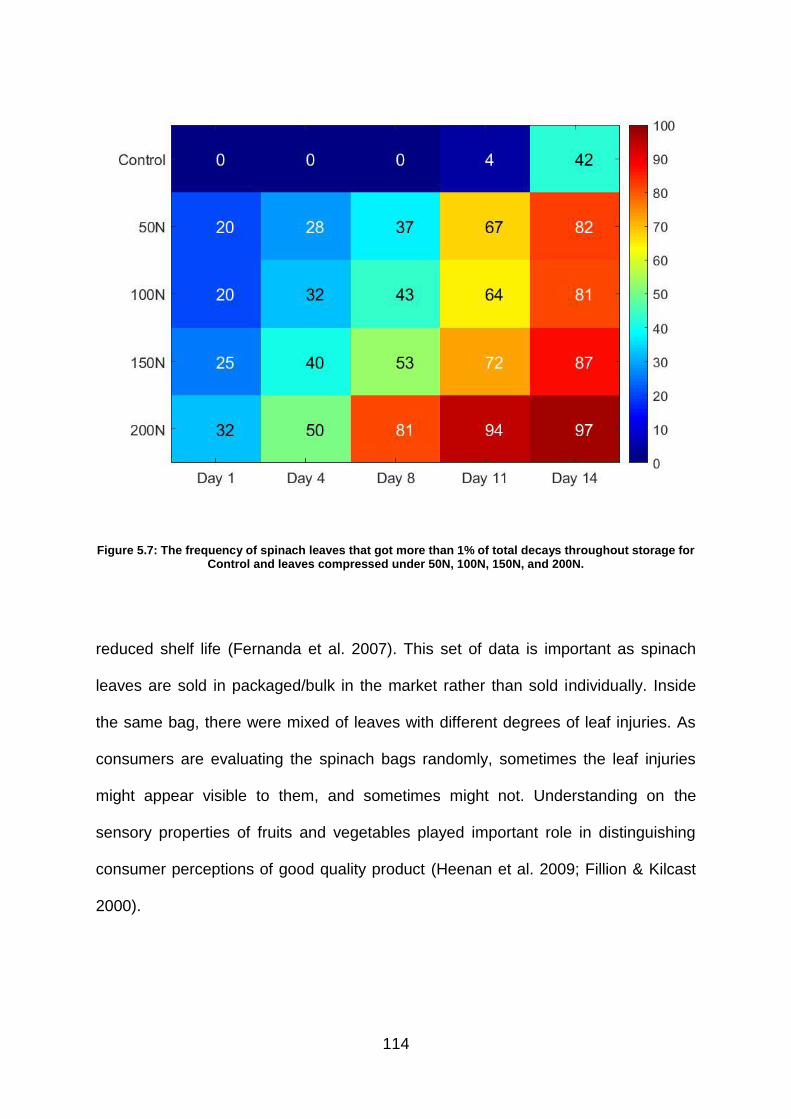
114
Figure 5.7: The frequency of spinach leaves that got more than 1% of total decays throughout storage for Control and leaves compressed under 50N, 100N, 150N, and 200N.
reduced shelf life (Fernanda et al. 2007). This set of data is important as spinach
leaves are sold in packaged/bulk in the market rather than sold individually. Inside
the same bag, there were mixed of leaves with different degrees of leaf injuries. As
consumers are evaluating the spinach bags randomly, sometimes the leaf injuries
might appear visible to them, and sometimes might not. Understanding on the
sensory properties of fruits and vegetables played important role in distinguishing
consumer perceptions of good quality product (Heenan et al. 2009; Fillion & Kilcast
2000).

115
5.3.2.2 Average of leaves deteriorations throughout storage
Apart from the distributions of deteriorations, the averages of leaves decays
were also calculated and analysed. 1-way ANOVA with post-hoc Tukey’s test
(p<0.05) was used to evaluate the significance difference of the leaves decay
between treated samples and Control before and after storage using IBM SPSS
(version 24). The average changes of leaves decays after storage for Control and
compressed leaves is shown in Figure 5.8. In comparison to Control leaves, for
200N, the highest degree of leaf injury which was Complete teared showed
significant increment of decays after 11 days of storage whereas Halfway teared
leaves showed changes of decays increment after 14 days of storage. There was not
any difference in decays changes between Halfway and Complete teared leaves.
Lower degree of leaf injuries which were Undamaged and Minor teared leaves did
not show any differences with Control leaves before and after storage. Leaves
compressed under lower forces (150N and 50N) also showed similar trend as the
leaves compressed under 200N. However, please note the difference between the
magnitude on the percentage of decays’ changes before and after storage. This
shows that the amount of force exerted onto the product surface does affect the
magnitude of the failure of the product. Again, these showed that the degrees of leaf
injuries as well as different force of compressions significantly play important roles in
determining and predicting the quality and shelf life of spinach. There was not any
difference between Control and leaves compressed under 100N which may be due
to the variations of the spinach leaves as well as the rate of metabolic reactions of
the particular leaf itself.

116
Figure 5.8: Average of leaves deteriorations between Control and different leaf injuries compressed under a) 200N, b) 150N, c) 100N, and d) 50N.
0.0
2.0
4.0
6.0
8.0
10.0
12.0
14.0
Control Undamaged Minor teared Half teared Complete teared
Ave
rage
pe
rce
nta
ge o
f d
ete
rio
rati
on
, %
Day 1-4Day 1-8Day 1-11Day 1-14
a a
a
ab a
b a a
ab
ab
a a
c
ab
ab
a
c
bc
ab
a a 0.0
2.0
4.0
6.0
8.0
10.0
12.0
14.0
Control Undamaged Minor teared Half teared Completeteared
Day 1-4Day 1-8Day 1-11Day 1-14
acg
ab
ab a
i
cdij
aefhj
afh
ei
bdfg
afh
afh
cdgh a
g af a
f
cde a
d ab a
0.0
2.0
4.0
6.0
8.0
10.0
12.0
14.0
Control Undamaged Minor teared Half teared Complete teared
Ave
rage
pe
rce
nta
ge o
f d
ete
rio
rati
on
, %
Day 1-4Day 1-8Day 1-11Day 1-14
de a
e ae
a
bce a
bd
a a
be
abcd
a a
abcd
abcd
a a
abcd
a a a 0.0
2.0
4.0
6.0
8.0
10.0
12.0
14.0
Control Undamaged Minor teared Half teared Completeteared
Day 1-4Day 1-8Day 1-11Day 1-14
kl
defg
afg a
ehk
adij a
i a
cghi
adg a a
bcefjl
abcd a a
abcd
a a a
a) b)
c) d)
117
5.3.2.3 Kinetics data of leaf decays
Data on the percentage of leaves deterioration was also modelled using 1st
order model. 1st order model has been widely used in modelling quality degradation
of fruits and vegetables (Labuza 1979; Lau et al. 2000; Ibarz et al. 2000; Aamir &
Ovissipour 2013; Hu et al. 2013; Peng et al. 2014; Dermesonluoglu et al. 2015). The
decay of spinach leaves was modelled using first order model:
𝐷(𝑡) = 𝐷0𝑒𝑘𝑡 (18)
where 𝐷(𝑡) is the percentage of spinach decay at time, t; 𝐷0 is the percentage
spinach decay on the first day; 𝑘 is the rate of spinach decay (day-1) ; and t is the
storage day.
The decay rates of spinach leaves for Control and leaves compressed under
200N were tabulated in Table 5.2. The values of R2 fall between the range of 0.867 –
0.993 which showed that the data gave good fit with the 1st order model (Figure 5.9).
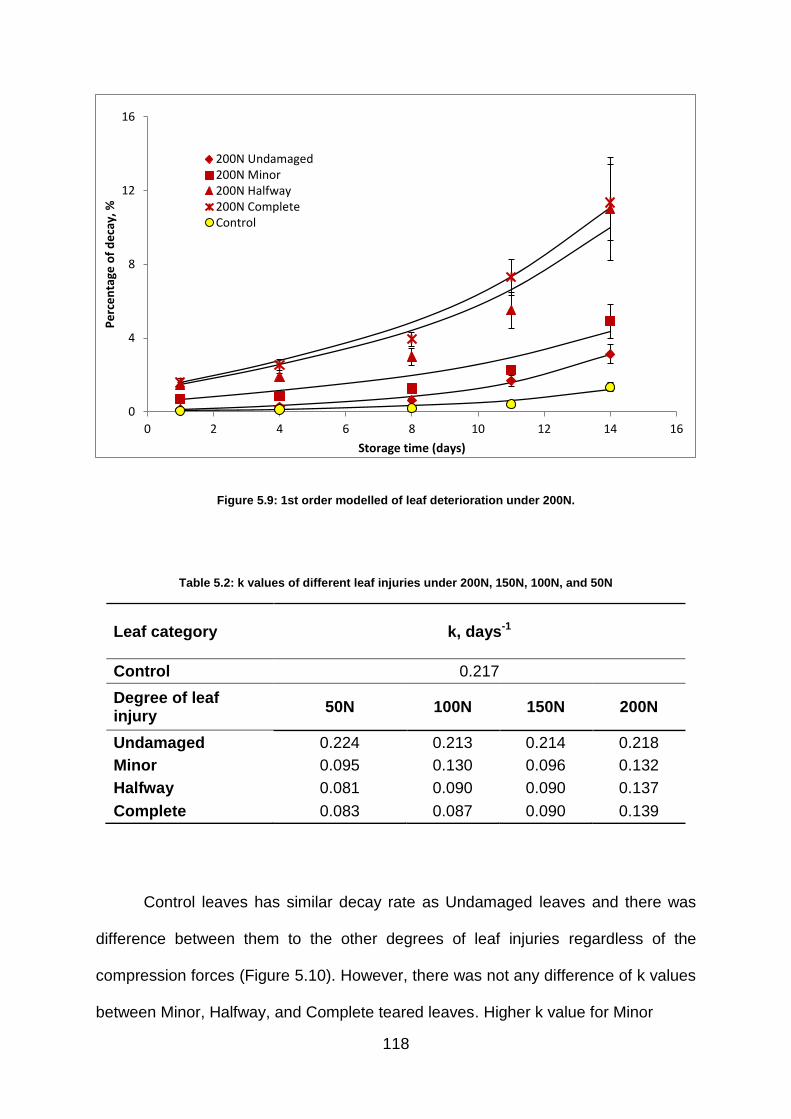
118
Figure 5.9: 1st order modelled of leaf deterioration under 200N.
Table 5.2: k values of different leaf injuries under 200N, 150N, 100N, and 50N
Leaf category k, days-1
Control 0.217
Degree of leaf injury
50N 100N 150N 200N
Undamaged 0.224 0.213 0.214 0.218
Minor 0.095 0.130 0.096 0.132
Halfway 0.081 0.090 0.090 0.137
Complete 0.083 0.087 0.090 0.139
Control leaves has similar decay rate as Undamaged leaves and there was
difference between them to the other degrees of leaf injuries regardless of the
compression forces (Figure 5.10). However, there was not any difference of k values
between Minor, Halfway, and Complete teared leaves. Higher k value for Minor
0
4
8
12
16
0 2 4 6 8 10 12 14 16
Pe
rce
nta
ge o
f d
eca
y, %
Storage time (days)
200N Undamaged200N Minor200N Halfway200N CompleteControl
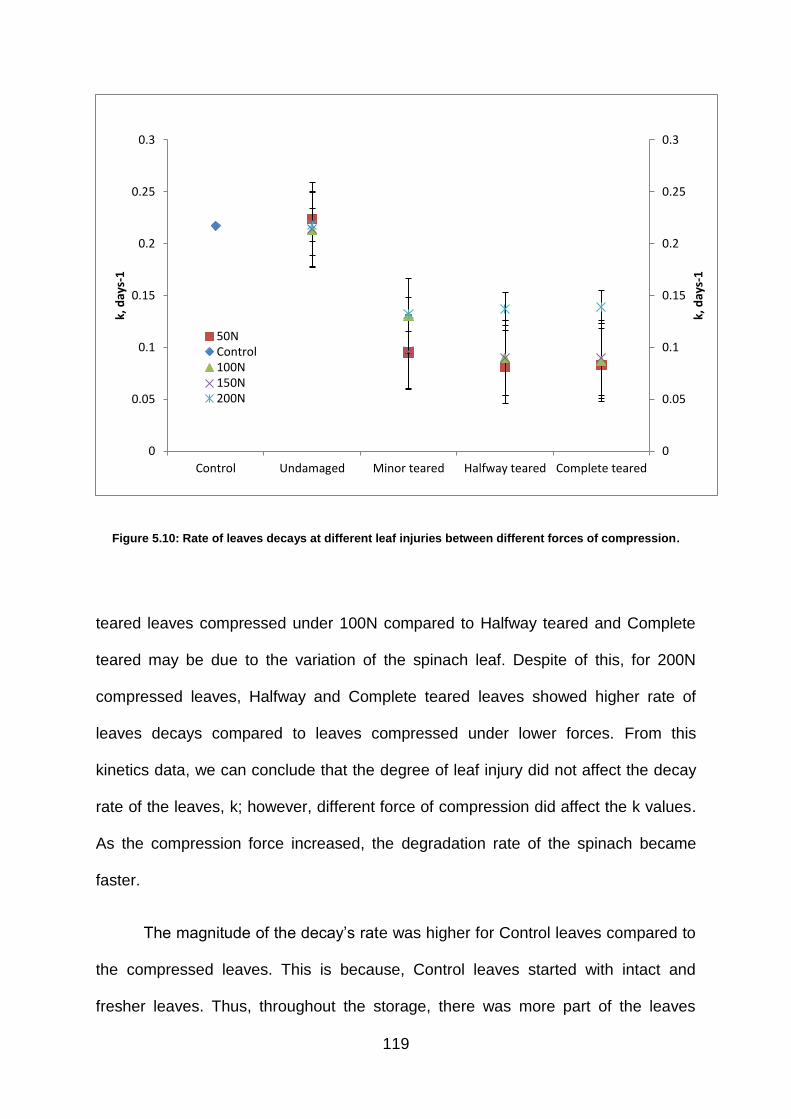
119
Figure 5.10: Rate of leaves decays at different leaf injuries between different forces of compression.
teared leaves compressed under 100N compared to Halfway teared and Complete
teared may be due to the variation of the spinach leaf. Despite of this, for 200N
compressed leaves, Halfway and Complete teared leaves showed higher rate of
leaves decays compared to leaves compressed under lower forces. From this
kinetics data, we can conclude that the degree of leaf injury did not affect the decay
rate of the leaves, k; however, different force of compression did affect the k values.
As the compression force increased, the degradation rate of the spinach became
faster.
The magnitude of the decay’s rate was higher for Control leaves compared to
the compressed leaves. This is because, Control leaves started with intact and
fresher leaves. Thus, throughout the storage, there was more part of the leaves
0
0.05
0.1
0.15
0.2
0.25
0.3
0
0.05
0.1
0.15
0.2
0.25
0.3
Control Undamaged Minor teared Halfway teared Complete teared
k, d
ays-
1
k, d
ays-
1
50NControl100N150N200N
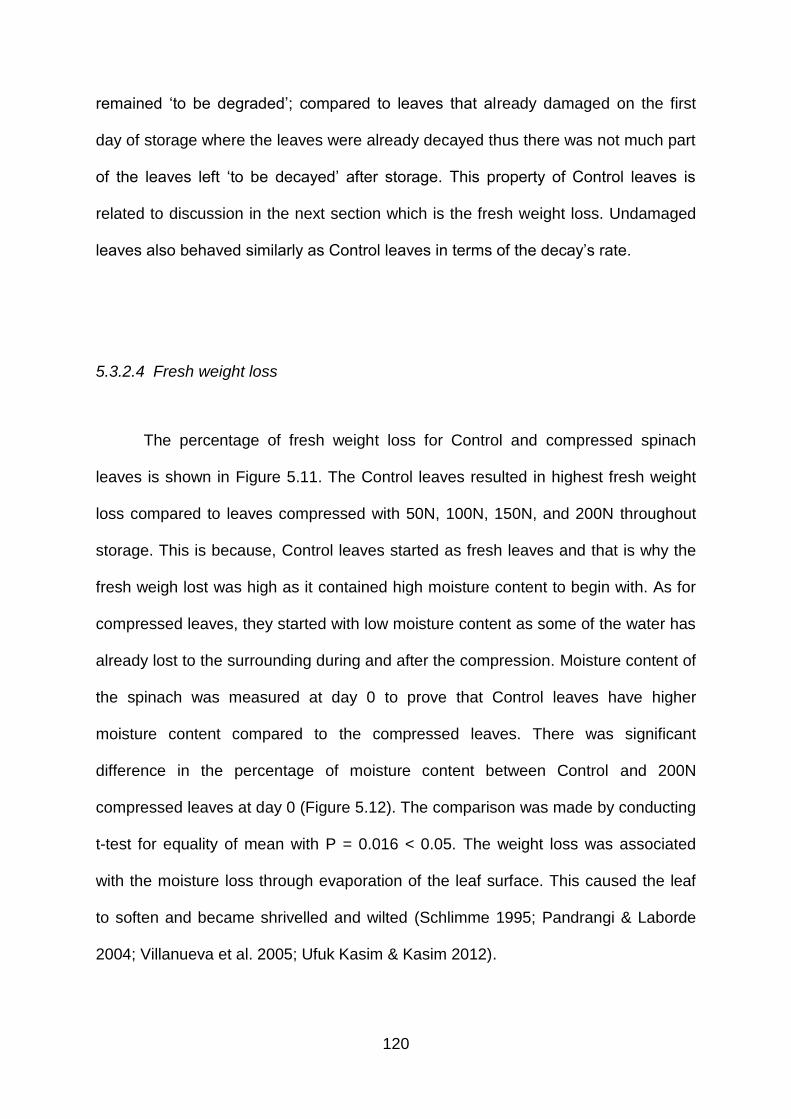
120
remained ‘to be degraded’; compared to leaves that already damaged on the first
day of storage where the leaves were already decayed thus there was not much part
of the leaves left ‘to be decayed’ after storage. This property of Control leaves is
related to discussion in the next section which is the fresh weight loss. Undamaged
leaves also behaved similarly as Control leaves in terms of the decay’s rate.
5.3.2.4 Fresh weight loss
The percentage of fresh weight loss for Control and compressed spinach
leaves is shown in Figure 5.11. The Control leaves resulted in highest fresh weight
loss compared to leaves compressed with 50N, 100N, 150N, and 200N throughout
storage. This is because, Control leaves started as fresh leaves and that is why the
fresh weigh lost was high as it contained high moisture content to begin with. As for
compressed leaves, they started with low moisture content as some of the water has
already lost to the surrounding during and after the compression. Moisture content of
the spinach was measured at day 0 to prove that Control leaves have higher
moisture content compared to the compressed leaves. There was significant
difference in the percentage of moisture content between Control and 200N
compressed leaves at day 0 (Figure 5.12). The comparison was made by conducting
t-test for equality of mean with P = 0.016 < 0.05. The weight loss was associated
with the moisture loss through evaporation of the leaf surface. This caused the leaf
to soften and became shrivelled and wilted (Schlimme 1995; Pandrangi & Laborde
2004; Villanueva et al. 2005; Ufuk Kasim & Kasim 2012).
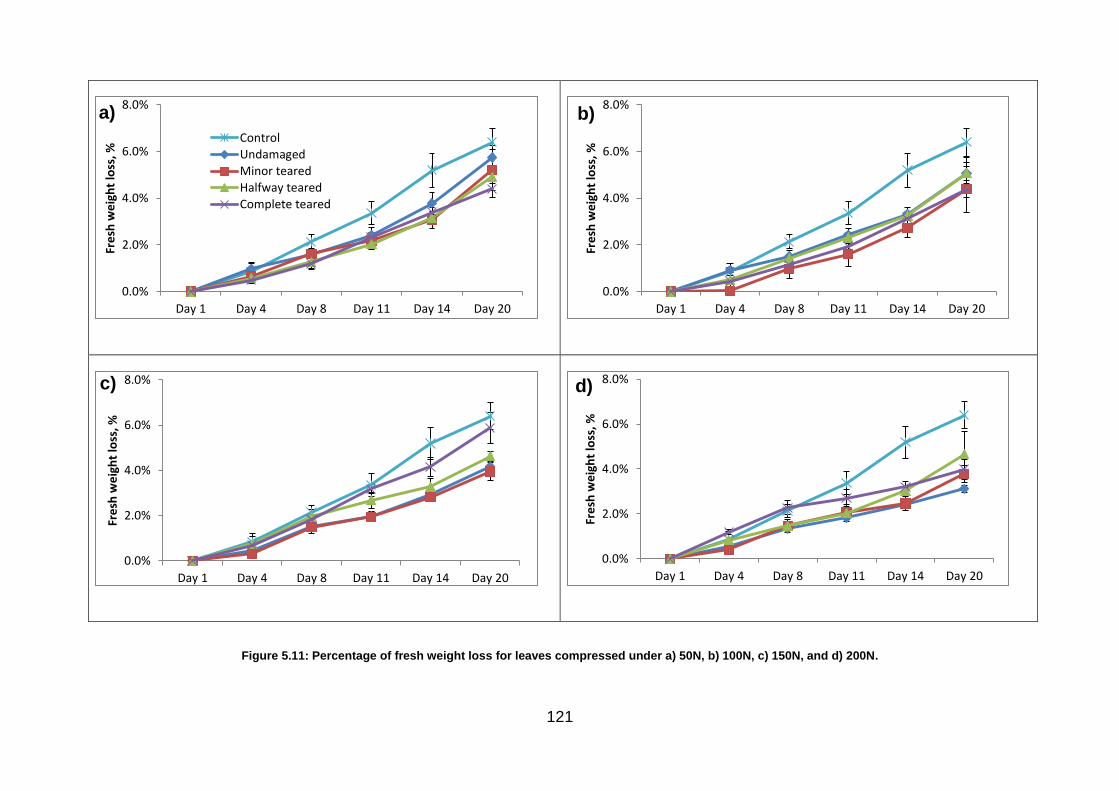
121
Figure 5.11: Percentage of fresh weight loss for leaves compressed under a) 50N, b) 100N, c) 150N, and d) 200N.
0.0%
2.0%
4.0%
6.0%
8.0%
Day 1 Day 4 Day 8 Day 11 Day 14 Day 20
Fre
sh w
eig
ht
loss
, % Control
Undamaged
Minor teared
Halfway teared
Complete teared
0.0%
2.0%
4.0%
6.0%
8.0%
Day 1 Day 4 Day 8 Day 11 Day 14 Day 20
Fre
sh w
eig
ht
loss
, %
0.0%
2.0%
4.0%
6.0%
8.0%
Day 1 Day 4 Day 8 Day 11 Day 14 Day 20
Fre
sh w
eig
ht
loss
, %
0.0%
2.0%
4.0%
6.0%
8.0%
Day 1 Day 4 Day 8 Day 11 Day 14 Day 20Fr
esh
we
igh
t lo
ss, %
a) b)
c) d)

122
Figure 5.12: Moisture content of spinach leaves at day 0.
Roura et al. (2000) reported that samples with higher damaged area per unit
volume caused greater water lost. However, in this study, delay in refrigeration after
processing may contribute to the difference in the trend presented. The processed
leaves were also exposed to light and changes of room temperature while sample
preparation and packaging were taken place. Refrigeration delay, inappropriate light
exposure and temperature variation contribute to the quality degradation of the fresh
product (Carrasco et al. 2007; Martinez-Sanchez et al. 2011; Liping Kou et al. 2014)
Apart from that, as the storage day increased, the fresh weight loss increased
as well. Ageing of vegetation caused the loss of water and chlorophyll reduction
(Diezma et al. 2013). In addition to that, the authors also claimed that the decay
88.00
89.00
90.00
91.00
92.00
93.00
Percentage of moisture, %
Mo
istu
re c
on
ten
t, %
Control
200N
a
b
123
experienced by the packed leaves is different from the deterioration faced by the
leaves during vegetation. The spoilt tissues in the packed leaves were mostly
crushed and wet whereas in vegetation, the deterioration was shown by the leaves
yellowing, water loss, and pigments degradation.
5.4 Conclusion
Control spinach was found to be in good condition until 14 days of storage.
Undamaged spinach showed more decays compared to Control after Day 11 and
Day 14. The decays on Minor teared spinach started to become visible after eight
days of storage. As for higher degree of leaf injuries which are Halfway teared and
Complete teared spinach, the decays were obviously detected since day one. From
this Population test, it can be concluded that degree of injury and force of
compression affect the quality and shelf life of the spinach.
As the storage day increased, the deterioration of the leaves increased. Force
200N was suggested to be the minimum required to pick up differences of the leaves
deteriorations before and after storage. 1st order model was used to model the
quality degradation of spinach leaves. Control leaves showed similar decay rate as
Undamage leaves whereas there was not any difference of decay rate between
Minor, Halfway, and Complete teared leaves. Despite of this, for 200N compressed
leaves, Halfway teared and Complete teared spinach showed higher rate of leaves
decays compered to leaves with similar degree of leaf injury but compressed under
lower forces. From the kinetics data, it can be concluded that the degree of leaf
injury did not affect the decay rate of the leaves, k, however, the force of
124
compression did affect the decay rate of spinach. As the force of compression
increased, the degradation rate of spinach became faster.
The population test developed throughout this study objective was proven to
be beneficial in distinguishing different types of mechanical leaf injuries and their
effects towards quality and shelf life of RTE spinach. This method is practical and
could be applicable to study other injuries experienced by other fruits and leafy
vegetables. Both degree of leaf injury as well as the force of compression have
significant impact towards quality and shelf life of the RTE spinach.
The results from this chapter are also supported with sensory data which is
discussed in the next chapter. Combining the instrument and the sensory data may
provide deeper insights into the properties and sensory attributes of the product
(Kemp et al. 2009). This way, the industry could improve and optimise the
processing and handling steps in a way to maintain the quality and shelf life of the
product while trying to satisfy consumers’ perceptions towards the RTE packed
spinach.

125
CHAPTER 6
SENSORY EVALUATIONS BY CONSUMERS TOWARDS VISIBILITY OF
LEAF DAMAGES AND PERCEPTIONS IN BUYING THE PRODUCT
6.1 Introduction
The qualities of RTE leafy vegetables depend on ways humans perceive
them. These quality attributes include visual appearance (decay, colour, and
freshness), texture (firmness, crispiness, turgidity, and toughness), nutrition values
(fibre, minerals, vitamins), and safety (free of microbial loads and chemical residues).
Due to lack of obvious signs of spoilage, there might be high concentration of
microbial loads presented in the produce without consumers’ consciousness.
Therefore, visual sensory attributes including appearance and freshness level are
the main factors consumers look at in making decision to buy the RTE leafy
vegetables (Cardello & Schutz 2003; Barrett et al. 2010; Jung et al. 2012; Dinnella et
al. 2014). During purchasing decision-making, expiry date also influenced
consumers’ opinions on the healthiness, nutritional value and freshness level of the
fresh products (Ragaert et al. 2004).
Several sensory measurements have been used to evaluate quality attributes
of spinach (Piagentini et al. 2002; A. M. Piagentini & Güemes 2002; Ragaert et al.
2004; Artes-Hernandez et al. 2009; Neal et al. 2010; Jung et al. 2012; Medina et al.
2012; Gómez-López et al. 2013; Kwon et al. 2013; Tudela, Marín, Garrido, et al.
126
2013; Kou et al. 2014; Rezende et al. 2014; Dermesonluoglu et al. 2015; Hu et al.
2015). The quality criteria include degree of browning, fresh appearance, colour
changes and other possible sensing criteria (Castaner et al. 1999; Rocha & Morais
2003). The opinion of individuals varies based on their own understanding and
experience (Bech et al. 2001; Péneau et al. 2007; Péneau et al. 2006). Products in a
same group can also have different freshness perception subjecting to its product
classification (Jung et al. 2012), hence it is important to understand consumers’
perception on the sensory attribute for a specific food product (Heenan et al. 2009).
Despite numerous studies conducted in evaluating sensory attributes of spinach,
there is still lack of work to evaluate consumer perception in evaluating the visibility
of mechanical damage based on the degree of leaf injury and its effect towards
consumer acceptance in buying the product. Therefore, consumer’s evaluation on
the visibility of the mechanical damage and its effect towards consumer’s
acceptance in buying the RTE spinach are discussed in this chapter.
6.2 Materials and methods
In this work, 30g of spinach sample S4 was compressed under 200N through
uniaxial compression using Universal Testing machine (Section 3.2) to provide
damage to the leaves. Control leaves (uncompressed) were also prepared. Sensory
test was conducted as described in details in Section 3.8. The statistics used were
also described in Section 3.8.
127
6.3 Results and discussions
6.3.1 Visibility of leaves deteriorations- Ranking test
For Ranking test, the higher the value, the higher the visibility of deterioration.
It goes from 1 (least deterioration) to 5 (most deterioration). Here, there are two
reasons of leaves failures which are leaves breakage and decay. Leaf decay
includes mushiness and change of leaf colour from green to yellow, brown, or
blackish green.
6.3.1.1 The effect of storage day towards visibility of leaves deteriorations
For each of the leaf injury category, there was significant difference in the
visibility of deterioration throughout storage (Table 6.1). Undamaged and Minor
teared leaves showed significant differences in the visibility of deterioration after day
4. For Halfway and Complete teared, the significant difference was detected after
day 8. This is due to the more obvious damage and completely teared leaves which
caused difficulty for consumers to differentiate the deteriorations between the two
highest degrees of leaf injuries. As for Control leaves, similar trend was detected.

128
Table 6.1: Scores for Ranking test on the effect of storage days towards visibility of leaves deteriorations.
Leaf injury RANK SUM
Day 1 Day 4 Day 8 Day 11 Day 14
Control 82a 65a 152b 163b 138b
Undamaged 86a 55b 143c 181d 135c
Minor 107a 50b 135a 174c 134a
Halfway 59a 69a 144b 181c 147b
Complete 82a 87a 136b 183c 112ab
**similar letter in a same row shows similarity
However, this time consumers were not able to differentiate the intact Control leaves
until day 8 as they found the leaves to be in similar state as before the storage.
At day 14, it can be seen that the ranking scores were lower than the scores
in day 8 and day 11. This is due to the variation of the leaves. Spinach from different
bags behaved differently. Even spinach from the same bag could behave differently
as well. The leaves samples were from different batches as the samples were
prepared by the reverse-storage-day method before the tests were conducted.
6.3.1.2 The effect of degree of leaf injury towards visibility of leaves deteriorations
For each of the measurement day, there was significant difference in the
visibility of deterioration between different degrees of leaf injuries. The deteriorations
129
on Complete teared leaves were significantly visible than all other degrees of leaf
injuries up to day 11. On day 14, the visibility of deterioration between Complete and
Halfway teared leaves was found to be similar. There was not any significant
difference between Minor and Halfway teared leaves on day 1, however, they started
to show differences starting from day 4 till day 14. There was not any significant
difference between Control and Undamaged leaves throughout storage. It was
difficult for the assessors to distinguish the leaves from these two categories as they
almost showed a same appearance; Control was uncompressed leaves, while
Undamaged was leaves that got no damage resulted from the compression. They
began with no breakage and decay before storage thus there was not obvious
deteriorations detected throughout the storage. Throughout storage, Minor, Halfway
and Complete teared leaves showed significant differences in the visibility of
deterioration as compared to Control and Undamaged groups.
The higher the rank sum, the higher the visibility of deterioration. Complete
teared leaves got the highest rank sum for each measurement day compared to the
other degrees of leaf injuries (Table 6.2). During the sensory test, there were
assessors right away rejected bags of spinach leaves that contained Complete
teared leaves. Sometimes, broken and complete teared leaves are totally
unacceptable. However, they were some assessors responded that broken leaves
were still acceptable as long as the leaves did not show any decay, mushiness or
wet. This basically turns back to the consumers’ preferences. Open-cut on the
leaves surface would trigger microorganism growth which could not be seen on bare
eyes. As consumers always make shopping decision based on the visual
appearance of the products as well as the packaging conditions, it is very important
to help to educate the consumers regarding risks that could be faced if the leaves

130
Table 6.2: Scores for Ranking test on the effect of degree of leaf injuries towards visibility of leaves deteriorations.
Days RANK SUM
Control Undamaged Minor Halfway Complete
Day 1 66a 55a 132b 148b 199c
Day 4 63a 58a 119b 160c 200d
Day 8 56a 66a 119b 159c 200d
Day 11 53a 74a 114b 159c 200d
Day 14 67a 61a 114b 167c 191c
**similar letter in a same row shows similarity
safety is disregarded. Halfway teared got the second highest rank sum for all
measurement days, while Minor teared got the third highest rank. As expected,
Undamaged and Control groups both got approximately similar number of rank
sums.
6.3.2 Acceptance level on buying the product- Acceptance test
For Acceptance test, assessors were asked on how they would rate the
bagged spinach based on their acceptance in buying the product. In this test, the
higher the hedonic score, the higher the assessor’s acceptability to buy the product.
It goes form I certainly would buy (5) to I certainly would NOT buy (1).
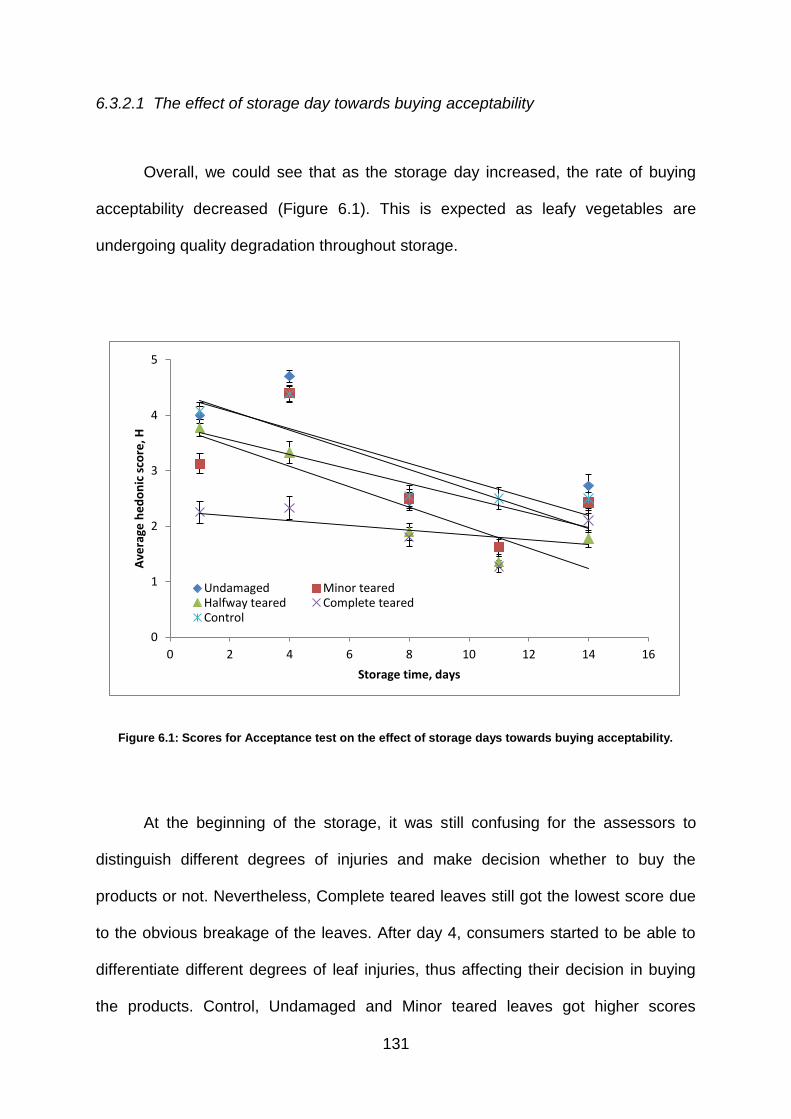
131
6.3.2.1 The effect of storage day towards buying acceptability
Overall, we could see that as the storage day increased, the rate of buying
acceptability decreased (Figure 6.1). This is expected as leafy vegetables are
undergoing quality degradation throughout storage.
Figure 6.1: Scores for Acceptance test on the effect of storage days towards buying acceptability.
At the beginning of the storage, it was still confusing for the assessors to
distinguish different degrees of injuries and make decision whether to buy the
products or not. Nevertheless, Complete teared leaves still got the lowest score due
to the obvious breakage of the leaves. After day 4, consumers started to be able to
differentiate different degrees of leaf injuries, thus affecting their decision in buying
the products. Control, Undamaged and Minor teared leaves got higher scores
0
1
2
3
4
5
0 2 4 6 8 10 12 14 16
Ave
rage
he
do
nic
sco
re, H
Storage time, days
Undamaged Minor tearedHalfway teared Complete tearedControl

132
compared to Halfway and Complete teared leaves. After day 11, Minor teared leaves
and Undamaged got the same scores as Halfway and Complete teared leaves, and
after 14 days of storage, all leaves categories received same scores of buying rate.
The storage time was proven to give unfavourable effects towards sensory attributes
of spinach (Piagentini et al. 2002; Neal et al. 2010) as well as other leafy vegetable
such as romaine lettuce (Prakash et al. 2000). The storage time has an effect
towards texture, aroma, tastes and mouthfeels of the spinach. Neal et al. (2010)
reported that spinach leaves were found to be less juicy, less rough, and drier
surface after 35 days of storage. These effects showed that the water was lost from
spinach during storage which correlated to the senescence of the leaves over time.
Water loss caused the spinach leaves to be shrivelled and wilted which contributed
to the deterioration of spinach. The hardness of the spinach decreased after 11
days of storage whereas the surface roughness decreased after 9 days of storage
(Neal et al. 2010). Storage time caused degradation of green colour, turgidity, and
built-up off-odour (Dinnella et al. 2014).
There were some inconsistencies in the magnitude of the scores throughout
storage because different batch of spinach bags were tested on each measurement
days. However, that was not the main focus of the graph as the main focus here is to
see the overall decrement of the buying scores as the storage day increased as well
as to study the trend on how the consumers ‘grouped’ the acceptance buying rate of
different degree of leaf injuries throughout the storage.

133
6.3.2.2 The effect of degree of leaf injury towards buying acceptability
Going across the row, for each measurement day, it can be concluded that
there was significant difference in liking and acceptance level to buy the spinach
bags among different degrees of leaf injuries (Table 6.3). The higher the mean
values, the higher the acceptance rate to buy the packed spinach. As expected,
overall, Control leaves showed the highest acceptance buying rate compared to the
other leaf categories. Undamaged leaves followed as the second highest liking,
followed by Minor teared and Halfway teared got the third and fourth highest liking
score respectively, while Complete teared spinach had the lowest mean of
acceptance buying rate. During day 1 and day 4, there was not any significant
difference in buying rate between Control and Undamaged. Consumers evaluated
these two categories as similar. However, after day 8 and day 11, the buying rate for
Undamaged leaves was different and lower compared to Control leaves. Please be
reminded that Undamaged leaves were leaves that were found undamaged from the
compression, while as for Control leaves, they were totally intact and unprocessed
leaves to begin with. As the storage day increased, the Undamaged leaves started to
show more deterioration compared to Control leaves due to the invisible
deterioration that was hardly detected on Undamaged leaves before day 8. However,
on day 14, Control and Undamaged leaves showed similar acceptance buying rate
as Control leaves were also started to decay and showed similar deterioration as
Undamaged leaves.

134
Table 6.3: Scores for Acceptance test on the effect of degree of leaf injuries towards buying acceptability.
Days
Mean Median Mode
Control Und Minor Half Comp Control Und Minor Half Comp Control Und Minor Half Comp
1 4.68a 4.80a 3.43b 2.95b 1.25c 5 5 3 3 1 5 5 3 2 1
4 4.85a 4.78a 3.78b 2.60c 1.25d 5 5 4 2 1 5 5 4 2 1
8 4.48a 4.10b 3.05c 1.93d 1.13e 5 4 3 2 1 5 4 3 2 1
11 4.28a 3.80b 2.83c 1.88d 1.05e 5 4 3 2 1 5 4 3 2 1
14 4.35a 4.30a 3.10b 1.93c 1.28d 5 4 3 2 1 5 5 3 2 1
** Read the data row by row. Similar letter in a same row shows similarity
** Und = Undamaged; Comp = Complete

135
For Minor, Halfway and Complete teared leaves, all of them showed significant
differences in buying acceptance rate compared to Control and Undamaged leaves.
Between Minor and Halfway teared, there was not any significant difference at day 1,
but started to show the difference at day 4 onwards.
From the median and mode, Control leaves maintained to be in the average
scores corresponded to ‘I certainly would buy’ from day 1 until day 14 while
Undamaged leaves maintained the trend till day 4 only, and then continued to have
the average scores equivalent to ‘I might buy’. For Minor teared leaves, in general,
consumers were contemplating whether to buy the spinach bags or not as the
average scores were corresponded to category ‘I might buy/I might not buy’. As for
the Halfway teared leaves, due to the more obvious deteriorations and mushiness on
the spinach surfaces, consumers rated them as ‘I might not buy’ category while
consumers gave scores equivalent to ‘I certainly would not buy’ to spinach bags
contained the Complete teared leaves.
Apart from giving scores on buying acceptability, the assessors were also
asked to give feedbacks. From the assessors’ feedbacks, both spinach quality and
ambiance inside packaging bags were important factors that influenced consumers’
decisions in buying the product. Assessors defined damaged leaves as leaves that
were teared, yellowish and brownish, wet, wilted, got white spots and possible insect
bites. The amount of damaged leaves inside the bag needs to be considered. It was
still acceptable to buy spinach bags that contained one or two damaged leaves while
the rest of the leaves inside the bag were still fresh. As expected, Complete teared
leaves with visible crack mark were found to be unacceptable. However, there were
136
still assessors considered to buy the broken leaves as long as the leaves did not
change colour and did not show sign of mushiness.
The assessors also suggested that discolouration of the spinach from perfect
green colour to yellowish and brownish was the main criteria in rejecting the product.
They stated that spinach leaves that were perfect dark green in colour are always
better, fresher and more preferable to buy compared to leaves that got yellowing,
browning and black spots. Allende et al. (2004) reported that discolouration, decay
and development of strong unpleasant odour are the major problems associated with
RTE spinach. During commercial, spinach with green colour received a best price.
Obviously, perfectly intact leaves are such a bonus to buy. It is important to prevent
and slow down the senescence process of the green leafy vegetables such as
spinach to retain its quality and commercial value (Kaur et al. 2011). Attributes that
clearly describe the physiological ageing phenomena of the leaf organ were
associated with the visual appearance that includes green, moisture inside the
package, leaf turgidity and leaf integrity (Lim & Nam 2007). Yellowing, loss of surface
gloss, shrivelled leaves and stems were considered as decrease in freshness of the
vegetables (Aked 2000). It was due to the chlorophyll loss Neal et al. (2010) as well
as ethylene produced during senescence (Aked 2000). The rate and pathway of
chlorophyll degradation is different between minimally and highly processed foods. In
the active metabolic tissue, chlorophyll can degrade itself to non-favoured colourless
or grey-brown compounds such as pheophytin and pheophorbide (Heaton &
Marangoni 1996). Minimally processed vegetables such as packed salad maintained
metabolic activity during storage thus chlorophyll degradation was influenced by
genetic and environmental factors. On the other hand, highly processed vegetables
137
such as blanched spinach lost their metabolic activity thus chlorophyll degradation
was only affected by the environmental factors (Heaton & Marangoni 1996).
Majority of the assessors also agreed to more unlikely to buy spinach bags
that contain high moisture drops which caused the leaves to turn wet, soggy and
greenish-dark in colour immediately. The in-pack condensation caused tissue injury
(leaves turned dark and yellow) and caused the leaves’ decays in the spinach bag to
be less noticeable (Lunadei et al. 2012). Clean packaging is important as it allows
easier visual inspection for the users in order to avoid damaged product (Ragaert et
al. 2004; Dinnella et al. 2014). Nevertheless, the relationship between freshness and
acceptance level was quite weak, despite the expectations of freshness as the
decisive attribute for consumers in making the decision (Péneau et al. 2006 and
Péneau et al. 2007) reported. According to the assessors’ feedbacks, sometimes, it
is still acceptable to buy the product depending on how quick they are planning to
consume them. At times, it is also acceptable to buy bags contain the damaged
leaves when they were at reduced price. In some cases, when there were not many
choices in the market, people tend to buy spinach bags that contain the damaged
leaves. Usually, they will compare few spinach bags and pick the best bag that
contained the least damage.
Apart from the above, the assessors also suggested that previous experience
and shelf life date at purchase also influenced consumers in making overall
judgement on the quality of the product. Similar responses were reported in studies
of consumer’s perception and choice towards minimally processed vegetables
(Ragaert et al. 2004) and consumer’s perception of freshness towards mixed salads
(Dinnella et al. 2014). The consumers tend to look at the shelf life date on the

138
packaging film as credence of freshness, healthiness, and nutritional value and the
highest ratings were given towards products “very close to their original form” (Lund
et al. 2006; Peneau et al. 2009).
6.4 Conclusion
Sensorial data including evaluations and perceptions from consumers helped
in contributing to the knowledge of quality and shelf life of the RTE spinach as a
whole. It is significant for the fresh produce retailer to have better understanding on
consumers’ perceptions regarding the visibility of damage and the buying
acceptance level of a specific product, thus precautions can be made and the quality
of the product can be maintained and preserved throughout handling and distributing
stages.
The degree of leaf injury and storage day significantly affect the visibility of
decays and acceptance rate in buying the product. This shows that the higher the
degree of leaf injury, the lower the shelf life of the fresh product thus the lower the
acceptance rate in buying the product. The longer the storage day, the clearer the
visibility of decays thus the lower the acceptance rate in buying the product. In some
cases, damaged leaves were still acceptable if the product is on sale and it also
depends on the time people plan to consume them.
The first limitation of this study would be a limited background of the
assessors. All the 80 assessors participated in the study were students and staff
from the School of Chemical Engineering, University of Birmingham. Other additional
139
characteristic which may be beneficial in future research is to consider
psychographic factor that include lifestyles, values, and personality (Zeithaml 1988;
Grunert et al. 1993; Candel 2001; Vannoppen et al. 2002). Several other reasons
that effect the perception of consumers towards spinach freshness were natural
variation of spinach at different country of origin, demographic factor, socio-cultural
background, cultural and environmental differences such as difference in cooking
methods (e.g. Asian used to blanch or cook the spinach in soup whereas in the US
or Europe, people consume the spinach more as a salad). As a result, the perception
of quality and freshness differed as people who used the spinach as salad gave
lower score to the freshness compared to those people who cooked the spinach
(Jung et al. 2012). There has been study reported on the difference in freshness
perception between citizen and soldier groups in the US (Cardello & Schutz 2003).
Secondly the study only included non-trained panellist. Having the expert or
experienced consumers gave beneficial addition in the evaluations of the criteria
during purchase well as after consumption (Gardial et al. 1994).
Lastly, during the making-decision process, the consumers depend more on
the extrinsic properties in situation where relevant intrinsic properties cannot be
evaluated in the market (Zeithaml 1988; Jung et al. 2012; Dinnella et al. 2014). As
the visual attributes of the produce was also affected by the packaging system of the
product Del Nobile et al. (2009), it is also necessary to investigate the effect of
different packaging films towards respiration rate of the RTE spinach which is
discussed in details in the next chapter.

140
CHAPTER 7
RESPIRATION RATE OF LEAFY VEGETABLES STORED AT DIFFERENT
PACKAGING FILMS
7.1 Introduction
Spinach is a living material and it continues to respire and modified the
atmosphere during postharvest storage. As spinach is highly perishable, it has high
metabolism rate which leads to high respiration rate (Allende et al. 2004; Artes-
Hernandez et al. 2009). High respiration rate is associated with short shelf life of the
product (Watada et al. 1996). High O2 level accelerates the respiration rate of the
product which then lead to browning, however, too low of O2 level lead to anaerobic
respiration inside the package (Heimdal et al. 1995). The anaerobic respiration
produced ketones, ethanol, and aldehydes (Ahvenainen 1996) where the production
of these volatile compounds is associated with development of off-odour and
microbial growth inside the package which may contribute to serious quality limiting
factors of the products (Caleb et al. 2013; Deza-Durand & Petersen 2014). Thus,
appropriate choice of film is important as to achieve optimum atmosphere within the
system where extremely low O2 or high CO2 which could lead to anaerobic
respiration, anaerobic microorganism growth and off-flavour could be prevented
(Beaudry 2000; Lucera et al. 2011).

141
The O2 and CO2 concentrations inside the system were influenced by the O2
intake and CO2 production by the produce and by the gas diffusion through the
packaging film (Zagory & Kader 1988). Thus, choosing a packaging film with a
proper oxygen transmission rate (OTR) is crucial to develop an effective atmosphere
for the minimally processed vegetables. Poor packaging always lead to the shelf life
reduction of these highly respiring product at the retailer’s levels which caused the
retailer to sell them at huge discounts. Extensive works have been done to evaluate
the respiration rates of fruits and vegetables at different packaging films (Berrang et
al. 1990; McGill et al. 1996; Peppelenbos & van’t Leven 1996; A. M. Piagentini &
Güemes 2002; Piagentini et al. 2003; Kim et al. 2004b; Serrano et al. 2006; Lu 2007;
Ayala et al. 2009; Del Nobile et al. 2009; Lucera et al. 2011; Pan & Sasanatayart
2016). However, there is still lack of information in the literature regarding the
comparison of respiration rates between intact and damaged spinach leaves treated
at different packaging films. It is important for the fresh produce retailers to have the
basic data regarding the effects that the damaged leaves may have towards the
respiration rates of the product, thus quality and shelf life of the product can be
maintained throughout the processing, handling, and distributing stages. Therefore,
in this chapter, the effects of mechanical damage towards respiration rate of RTE
spinach stored under different packaging films are discussed.
7.2 Materials and method
In this work, 50g of spinach sample S4 was compressed with 200N under
uniaxial compression as described in Section 3.2. Besides the compressed leaves,

142
Control leaves were also prepared. Respiration rates of spinach were measured
using closed system as described in details in Section 3.9. Three different films were
used in this study (Table 3.6). The respiration rates of the spinach were modelled
using uncompetitive Michaelis-Menten model and exponential model. The two
models were compared and the best model was determined by performing Akaike
Information Criterion (AIC) test. Besides that, the effects of packaging films towards
quality attributes of the spinach were also measured including fresh weight loss as
described in Section 3.6, texture (Section 3.3), and colour changes (Section 3.10).
7.3 Results and discussions
7.3.1 Respiration rate of Control and compressed leaves at different packaging
films
7.3.1.1 Oxygen consumption of spinach stored at different films
The reduction of O2 concentration for Control spinach treated under three
different packaging films is shown in Figure 7.1. As the storage time increased, the
O2 decreased due to the intake of the O2 for the respiration process. The O2
reduction was divided into three time-segments. From 0th hour to 6th hour, the O2
reduction was pretty linear. This was due to the measurement that was taken in
every 1 hour interval for the first 6 hours. There was not any difference detected
between the different films treatments. The O2 reduction between different films
started to differ starting from 7th hour and remained decreasing (film 1 and film 3) till

143
Figure 7.1: The percentage of O2 concentration inside the closed jars for Control spinach treated under Film 1, Film 2, and Film 3.
48th hour. There was not any O2 decrement for spinach treated with packaging film 2
within this time segment which indicates that the system has reached steady state.
The spinach stored under film 3 reached the steady state starting from 49th hour
whereas for spinach treated under film 1, the O2 kept slightly decreasing until 192th
hour and remained constant right after till the end of the set storage time. Kaur et al.
(2011) reported that the headspace O2 and CO2 concentrations of spinach were in
unsteady state until the first day (24 hours) of storage and reached steady state
afterwards. It is necessary to pack the product as soon as possible as the respiration
rate of the produce at the unsteady state is higher than at the steady state. Fonseca
et al. (2002) also reported the same finding where the respiration rate of Galega kale
at the unsteady state is threefold than that at steady state.
0
5
10
15
20
25
0 50 100 150 200 250 300 350
[O2
], %
Time, h
Film 1 Film 2 Film 3

144
In terms of the magnitude of the O2 concentration, spinach covered with film 2
maintained the highest O2 concentration throughout the storage. This is because,
film 2 has the highest OTR with 1200 cc/m2/day compared to film 1 with 400
cc/m2/day and film 3 with 1100 cc/m2/day. This caused the diffusion rate of the O2
from the outside into the system through film 2 to be the highest compared to film 1
and film 3. Besides the OTR factor, film 1 has the thickest film with 60 µm compared
to film 2 and film 3 which have the film thickness of 35 µm. This caused the diffusion
of O2 from the outside into the system to be the lowest in film 1. This shows that
packaging film type gave significant effect towards the headspace gas composition
of the system (Kaur et al. 2011).
For spinach compressed under 200N, the first six hours showed similar trend
as Control spinach (Figure 7.2). The O2 reduction was linearly proportional to the
storage time. As the storage time increased, the O2 kept on decreasing until the
216th hour, where the O2 started to reach 0% and remained constant at the 288th
hour. This trend happened for spinach treated under all the films and there was not
any difference between them. This shows that the respiration rates of the
mechanically damaged spinach were not influenced by the type of packaging films
used in this study. The ruptured plant cells increased the respiration rate, cut-surface
browning, and ethylene production rate (Smyth et al. 1998). The open-cut surface
leads to decay and yellowing of the leafy vegetables (Pan & Sasanatayart 2016).
Fresh-cut vegetables have higher respiration rates compared to intact vegetables
due to the damaged cells that lead to shelf life reduction (Watada et al. 1996; Kim et
al. 2004a; Allende et al. 2004; Bolin & Huxsoll 1991). The higher respiration rate was
due to the larger surface area on the cut surface (Bastrash et al. 1993) and
physiological response towards the wound (Brecht 1995). The damaged cells and

145
Figure 7.2: The percentage of O2 concentration inside the closed jars for 200N-compressed spinach treated under Film 1, Film 2, and Film 3.
membranes altered the tissue metabolism such as increase the activity of browning
enzymes, CO2 and ethylene production, aroma and volatile profiles, off-flavour
development, and water loss (Kaur et al. 2011). Studies reported that the respiration
rate of shredded Galega kale was 2.8 times that of intact leaves (Fonseca et al.
2002) and 2 to 3 times for apple slices than that of intact fruit (Lakakul et al. 1999).
The O2 concentration of the Control spinach did not reach 0% concentration
within the storage time limit in this study. Longer storage time might be required for
the O2 concentration to reach its minimum limit. This shows that Control spinach has
longer shelf life compared to mechanically broken spinach. Ko et al. (1996)
recommended that spinach should be kept in less than 0.4% but above 0.2% O2 in
5°C to maintain the quality of the spinach. 1-3% O2 and 5-10% CO2 have been
suggested as an effective condition to maintain the quality of many green vegetables
(Saltveit 2003). Hamza et al. (1995) reported that O2 levels reduced to 1% helped to
0
5
10
15
20
25
0 50 100 150 200 250 300 350
[O2
], %
Time, h
Film 1 Film 2 Film 3

146
preserve the quality of minimally processed romaine lettuce due to the high CO2
levels that helped in controlling the browning of the tissue. However, O2 levels below
1% induced anaerobic fermentation of baby spinach (Neal et al. 2010). The
anaerobic respiration caused the quality deterioration of baby spinach (Allende et al.
2004). It is important to have optimum atmosphere during storage to maintain the
product quality as well as to prevent the development of off-odours (Tudela, Marín,
Garrido, et al. 2013).
7.3.1.2 Carbon dioxide production of spinach stored at different films
In response to the intake of O2, CO2 was produced during the respiration. As
the O2 decreased, the CO2 production increased (Figure 7.3). The high CO2 slowed
down the respiration rate of the spinach. Atmosphere with high CO2 significantly
inhibit the growth of aerobic microorganisms in fresh-cut spinach (Babic & Watada
1996) and broccoli (Berrang et al. 1990). High CO2 atmosphere slowed the browning
of lettuce (King et al. 1991) and the yellowing of spinach (Kader et al. 1989).
However, the CO2 concentration must remain below 18% to prevent anaerobic
respiration. CO2 concentration up to 13% developed off-odour in packed spinach
(McGill et al. 1996). Decay, tissue softening, and development of off-odour are the
main problems associated with baby spinach (Medina et al. 2012; Allende et al.
2004). For Control spinach, within the storage time limit in this study, the CO2
concentrations remained below 18% for spinach treated under all the packaging
films.

147
Figure 7.3: The percentage of CO2 concentration inside the closed jars for Control spinach treated under Film 1, Film 2, and Film 3.
For 200N-compressed spinach, the CO2 increased to 18% and then remained
constant started at the 288th hour (Figure 7.4). Further storage could lead the
spinach to undergo anaerobic respiration where the living cells take-in the excessive
CO2 for ‘fermentation’, which causes further deterioration of the leaves. Again, this
confirmed that mechanically damaged spinach has shorter shelf life during storage
compared to intact spinach. CO2 production rate was lower than the O2 consumption
rate of the spinach which indicates that water vapour was also produced along with
the CO2. The water vapour transmission rate as well as the micro perforations may
not be enough to diffuse the water outside the package thus lead to condensation
inside the package and caused deterioration and reduction in sensory quality of the
product (Kaur et al. 2011).
0
5
10
15
20
25
0 50 100 150 200 250 300 350
[CO
2],
%
Time, h
Film 1 Film 2 Film 3
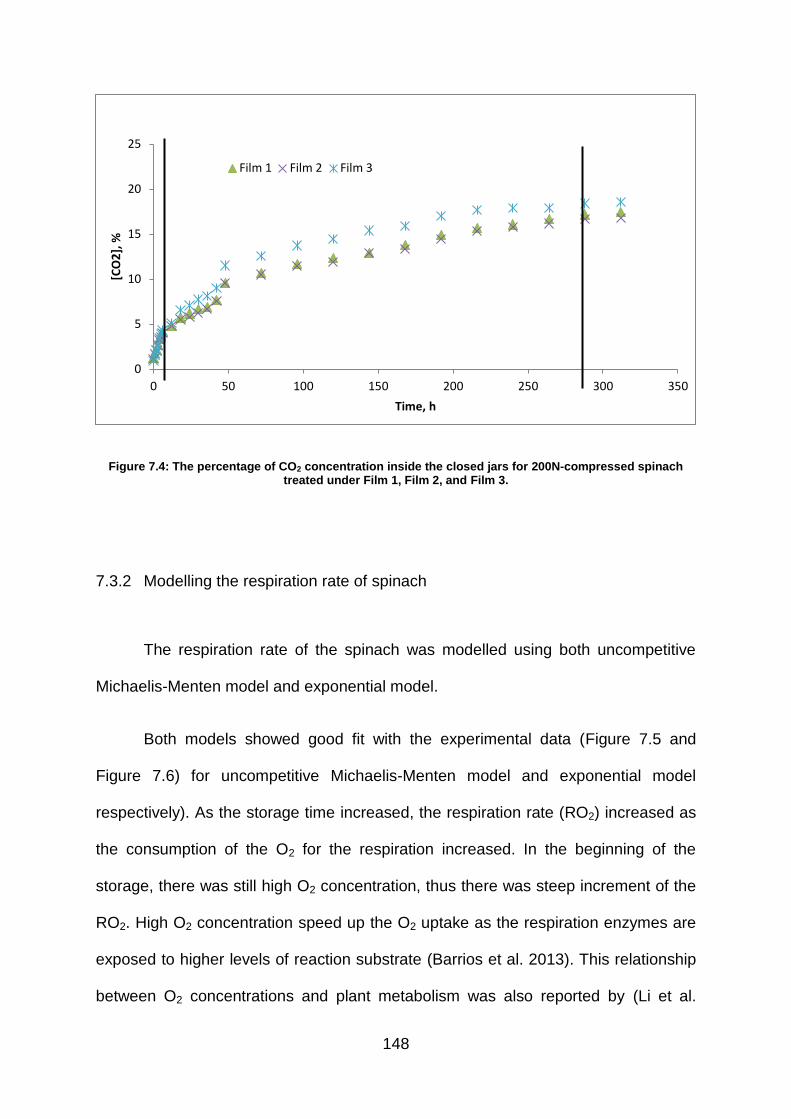
148
Figure 7.4: The percentage of CO2 concentration inside the closed jars for 200N-compressed spinach treated under Film 1, Film 2, and Film 3.
7.3.2 Modelling the respiration rate of spinach
The respiration rate of the spinach was modelled using both uncompetitive
Michaelis-Menten model and exponential model.
Both models showed good fit with the experimental data (Figure 7.5 and
Figure 7.6) for uncompetitive Michaelis-Menten model and exponential model
respectively). As the storage time increased, the respiration rate (RO2) increased as
the consumption of the O2 for the respiration increased. In the beginning of the
storage, there was still high O2 concentration, thus there was steep increment of the
RO2. High O2 concentration speed up the O2 uptake as the respiration enzymes are
exposed to higher levels of reaction substrate (Barrios et al. 2013). This relationship
between O2 concentrations and plant metabolism was also reported by (Li et al.
0
5
10
15
20
25
0 50 100 150 200 250 300 350
[CO
2],
%
Time, h
Film 1 Film 2 Film 3

149
2009). After certain time, the RO2 only increased slightly and remained stagnant as
there was not much O2 left for the respiration to happen. Oxygen availability is a
requirement for the respiration to happen where the higher the respiration rate, the
lower the shelf life of a commodity (Kader & Saltveit 2003). The negative values
showed that the O2 has been used by the spinach for the respiration.
Figure 7.5: Uncompetitive Michaelis-Menten model for 200N-compressed spinach treated under Film 1.
-10000
-8000
-6000
-4000
-2000
0
0 50 100 150 200 250 300 350
RO
2, m
Lkg-
1h
-1
Time, h
Experimental
Uncompetetive Michaelis-menten

150
Figure 7.6: Exponential model for 200N-compressed spinach treated under Film 1.
The parameters for both models are tabulated in Table 7.1 and Table 7.2 for
uncompetitive Michaelis-Menten model and exponential model respectively. The
best model was determined by performing AIC test where model with the lowest AIC
value shows the better fit. The AIC values showed almost similar values for both
uncompetitive Michaelis-Menten model and exponential model. However, most of
the AIC values from the exponential equation were lower than the AIC values from
the uncompetitive Michaelis-Menten equation. This might suggest that exponential
equation gave better fit to model the respiration rate of the spinach in this particular
study.
-10000
-8000
-6000
-4000
-2000
0
0 50 100 150 200 250 300 350
RO
2, m
Lkg-
1h
-1
Time, h
Experimental
Exponential

151
Table 7.1: Predicted parameters for Uncompetitive Michaelis-Menten model equation of spinach sample S4 for Control and 200N-compressed leaves.
Parameters
Control 200N
Film 1 Film 2 Film 3 Film 1 Film 2 Film 3
Vm 2.05E+09 9.19E+09 3.06E+09 2.06E+09 1.96E+09 3.39E+09
Km 2.59E+06 1.88E+04 2.23E+06 2.57E+06 2.70E+06 4.93E+06
Ki 1.98 5.77E-04 0.54 2.05 2.14 4.19
AIC 351.23 377.21 360.15 352.14 352.70 359.96
Table 7.2: Predicted parameters for Exponential model equation of spinach sample S4 for Control and 200N-compressed leaves.
Parameters
Control 200N
Film 1 Film 2 Film 3 Film 1 Film 2 Film 3
a 87.24 33.55 4.59 114.51 102.76 330.03
b 0.24 0.22 0.40 0.23 0.23 0.18
AIC 343.87 379.87 348.53 349.19 350.41 357.47
7.3.2.1 Model validation
For models validation, the oxygen transmission rate (OTR) for each film was
inserted into the model validation equation.
𝑀𝑜𝑑𝑒𝑙 𝑣𝑎𝑙𝑖𝑑𝑎𝑡𝑖𝑜𝑛 = 𝑂𝑇𝑅 𝑡𝑒𝑟𝑚 + 𝑅𝑒𝑠𝑝𝑖𝑟𝑎𝑡𝑖𝑜𝑛 𝑟𝑎𝑡𝑒 (𝑚𝑜𝑑𝑒𝑙𝑙𝑒𝑑 )
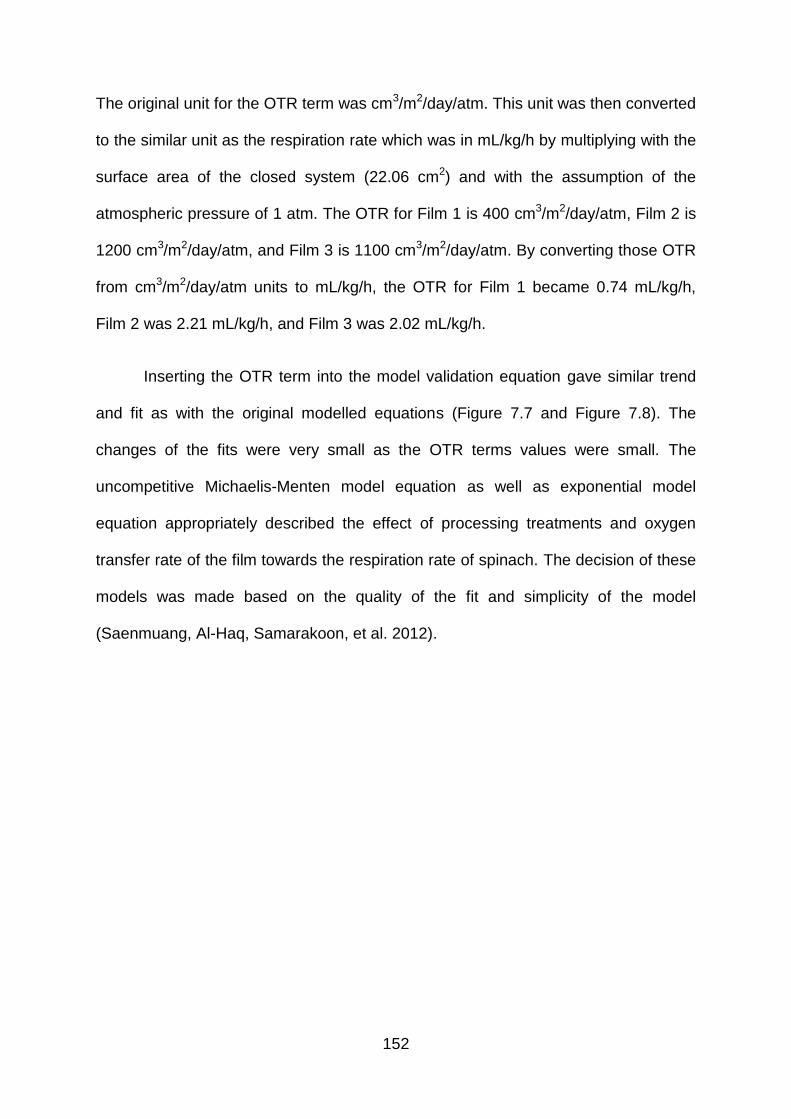
152
The original unit for the OTR term was cm3/m2/day/atm. This unit was then converted
to the similar unit as the respiration rate which was in mL/kg/h by multiplying with the
surface area of the closed system (22.06 cm2) and with the assumption of the
atmospheric pressure of 1 atm. The OTR for Film 1 is 400 cm3/m2/day/atm, Film 2 is
1200 cm3/m2/day/atm, and Film 3 is 1100 cm3/m2/day/atm. By converting those OTR
from cm3/m2/day/atm units to mL/kg/h, the OTR for Film 1 became 0.74 mL/kg/h,
Film 2 was 2.21 mL/kg/h, and Film 3 was 2.02 mL/kg/h.
Inserting the OTR term into the model validation equation gave similar trend
and fit as with the original modelled equations (Figure 7.7 and Figure 7.8). The
changes of the fits were very small as the OTR terms values were small. The
uncompetitive Michaelis-Menten model equation as well as exponential model
equation appropriately described the effect of processing treatments and oxygen
transfer rate of the film towards the respiration rate of spinach. The decision of these
models was made based on the quality of the fit and simplicity of the model
(Saenmuang, Al-Haq, Samarakoon, et al. 2012).

153
Figure 7.7: Uncompetitive Michaelis-Menten model with the OTR term for 200N-compressed spinach treated under Film 1.
Figure 7.8: Exponential model with the OTR term for 200N-compressed spinach treated under Film 1.
-10000
-8000
-6000
-4000
-2000
0
0 50 100 150 200 250 300 350R
O2
, mLk
g-1
h-1
Time, h
Experimental
Uncompetetive Michaelis-menten OTR
-10000
-8000
-6000
-4000
-2000
0
0 50 100 150 200 250 300 350
RO
2, m
Lkg-
1h
-1
Time, h
Experimental
Exponential OTR
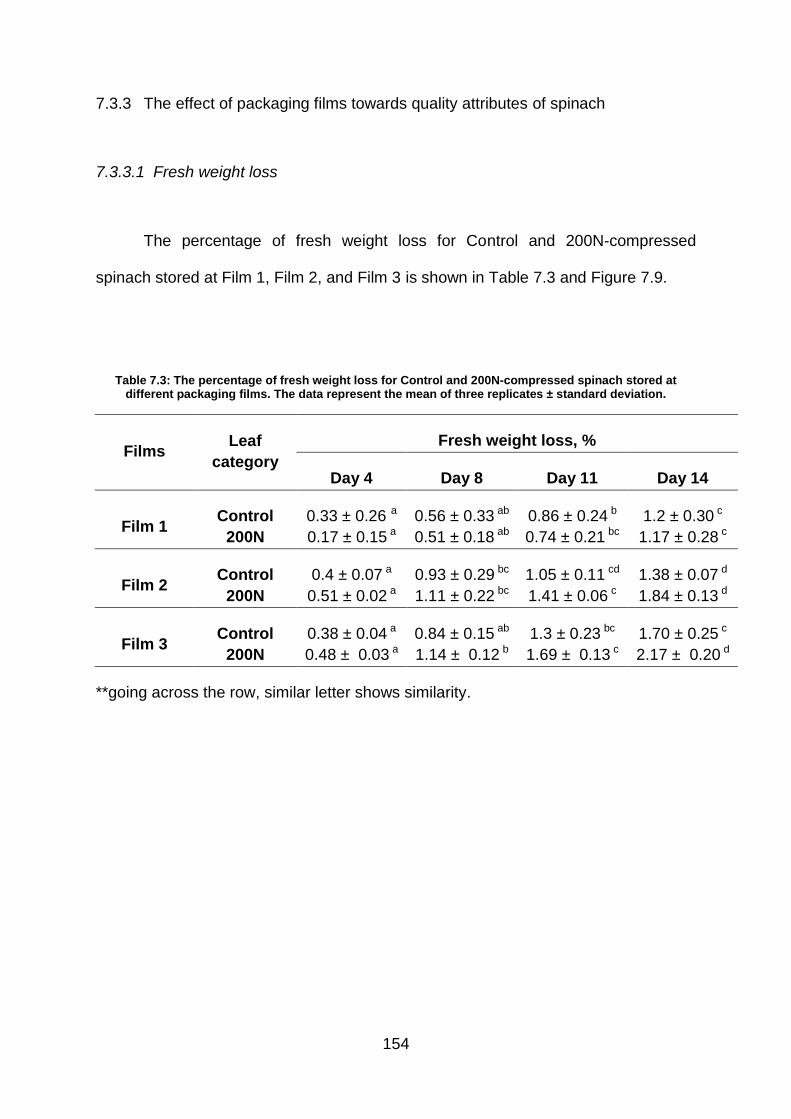
154
7.3.3 The effect of packaging films towards quality attributes of spinach
7.3.3.1 Fresh weight loss
The percentage of fresh weight loss for Control and 200N-compressed
spinach stored at Film 1, Film 2, and Film 3 is shown in Table 7.3 and Figure 7.9.
Table 7.3: The percentage of fresh weight loss for Control and 200N-compressed spinach stored at different packaging films. The data represent the mean of three replicates ± standard deviation.
Films Leaf
category
Fresh weight loss, %
Day 4 Day 8 Day 11 Day 14
Film 1 Control 0.33 ± 0.26 a 0.56 ± 0.33 ab 0.86 ± 0.24 b 1.2 ± 0.30 c
200N 0.17 ± 0.15 a 0.51 ± 0.18 ab 0.74 ± 0.21 bc 1.17 ± 0.28 c
Film 2 Control 0.4 ± 0.07 a 0.93 ± 0.29 bc 1.05 ± 0.11 cd 1.38 ± 0.07 d
200N 0.51 ± 0.02 a 1.11 ± 0.22 bc 1.41 ± 0.06 c 1.84 ± 0.13 d
Film 3 Control 0.38 ± 0.04 a 0.84 ± 0.15 ab 1.3 ± 0.23 bc 1.70 ± 0.25 c
200N 0.48 ± 0.03 a 1.14 ± 0.12 b 1.69 ± 0.13 c 2.17 ± 0.20 d
**going across the row, similar letter shows similarity.

155
Figure 7.9: Fresh weight loss for Control and 200N-compressed spinach stored at A) Film 1; B) Film 2; and C) Film 3.
0.0
0.5
1.0
1.5
2.0
2.5
Day 4 Day 8 Day 11 Day 14
Fre
sh w
eig
ht
loss
, %
Time, day
A
Control
200N
0.0
0.5
1.0
1.5
2.0
2.5
Day 4 Day 8 Day 11 Day 14
Fre
sh w
eig
ht
loss
, %
Time, day
B
Control
200N
0.0
0.5
1.0
1.5
2.0
2.5
Day 4 Day 8 Day 11 Day 14
Fre
sh w
eig
ht
loss
, %
Time, day
C
Control
200N

156
The percentage of weight loss increased as the storage time increased. The
weight loss measured after 14 days of storage was higher than the weight loss
measured after 7 days of storage regardless of the treatment and film used
(Piagentini et al. 2002). One-way ANOVA with post hoc Tukey test (P < 0.05) was
used to find the significant difference for each Control and 200N-compressed leaves
throughout storage. Overall, spinach stored in Film 1 showed the lowest percentage
of fresh weight loss for both Control and 200N-compressed leaves compared to
spinach stored in Film 2 and Film 3. All the packaging films used in this study were
micro-perforated BOPP films with Film 1 with the lowest OTR value. It has been
reported that the micro-perforated film that has the lowest OTR gave the best
performance in prolonging the shelf life of fresh-cut broccoli (Lucera et al. 2011).
For spinach stored in Film 1, the percentage of fresh weight loss for Control
spinach was higher than the damaged spinach throughout the storage. This is in
agreement with the results of fresh weight loss discussed in Chapter 5, Section
5.3.2.4. On the other hand, for spinach stored in Film 2 and Film 3, the percentage of
fresh weight loss for the damaged spinach was higher than Control spinach
throughout the storage. This may be related to the high OTR as well as thinner film
for Film 2 and Film 3 compared to Film 1. Film 1 has thickness of 60 µm, whereas
Film 2 and Film 3 both have film thickness of 35 µm. The high OTR and thin film
allowed high O2 diffusion into the packages thus increased the respiration rates of
the product. OTR and film thickness were found to be significant in affecting the
quality attributes of the packed fresh products (Ayala et al. 2009; Del Nobile et al.
2009; Oliveira et al. 2010; Lucera et al. 2011; Pan & Sasanatayart 2016). As
discussed earlier, mechanically broken leaves have higher respiration rates than
intact leaves. Increased in the respiration rates caused the CO2 production and
157
water vapour to increase which then caused the fresh weight loss to increase.
Weight loss can be limited by using appropriate packaging as well as controlling the
storage humidity and temperature (Kaur et al. 2011).
7.3.3.2 Texture
The maximum forces (MaxF) required to break the leaves under Penetration
test are shown in Figure 7.10 and Figure 7.11 for Control and 200N-compressed
spinach respectively, whereas the maximum distance (MaxD) required to break the
leaves are shown in Figure 7.12 and Figure 7.13 for Control and 200N-compressed
spinach respectively. The MaxF is also known as the burst strength of the leaves
whereas the MaxD is associated with the toughness of the leaves. From the plots,
both storage day and type of packaging film did not have effect towards both burst
strength and toughness of the spinach leaves. Piagentini et al. (2002) reported that
research has been done to study the effect of packaging film towards sensory
qualities of spinach, asparagus and broccoli. The study showed that different
packaging film did not have effect towards visual appearance, browning, colour, and
leaf wilting of the respective products. Film types did affect the development of off-
odour which is related to the headspace gas composition, however, visual sensory
attributes were not affected (Piagentini & Güemes 2002). MaxF was found to be not
vary significantly for spinach stored at different MAP conditions during storage
(Tudela et al. 2013) and fresh-cut Romaine lettuce showed similar crispiness before
and after storage (Martinez-Sanchez et al. 2011). The variations in the increment
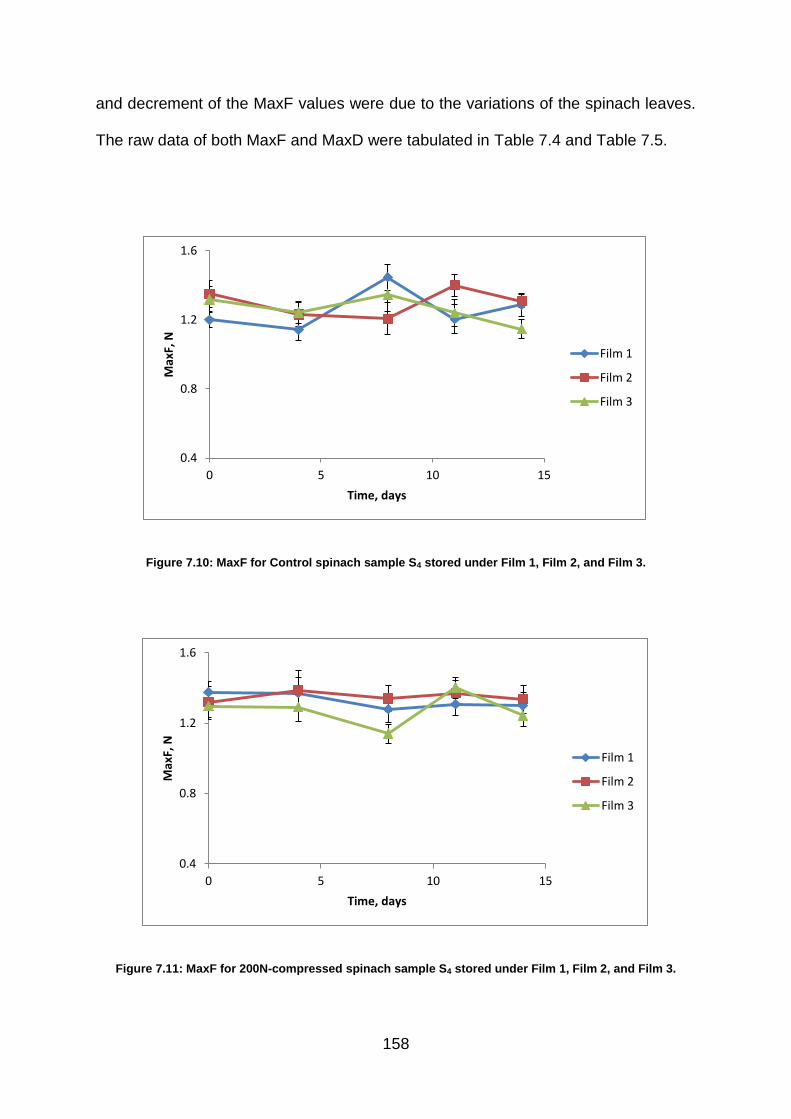
158
and decrement of the MaxF values were due to the variations of the spinach leaves.
The raw data of both MaxF and MaxD were tabulated in Table 7.4 and Table 7.5.
Figure 7.10: MaxF for Control spinach sample S4 stored under Film 1, Film 2, and Film 3.
Figure 7.11: MaxF for 200N-compressed spinach sample S4 stored under Film 1, Film 2, and Film 3.
0.4
0.8
1.2
1.6
0 5 10 15
Max
F, N
Time, days
Film 1
Film 2
Film 3
0.4
0.8
1.2
1.6
0 5 10 15
Max
F, N
Time, days
Film 1
Film 2
Film 3

159
Table 7.4: The average values of MaxF, N. The data represent the mean of 20 replicates ± standard deviation.
Films Leaf
category Day 0 Day 4 Day 8 Day 11 Day 14
Film 1
Control 1.20 ± 0.21 1.14 ± 0.28 1.45 ± 0.34 1.2 ± 0.38 1.29 ± 0.29
200N 1.37 ± 0.27 1.37 ± 0.40 1.28 ± 0.34 1.31 ± 0.29 1.30 ± 0.34
Film 2
Control 1.35 ± 0.34 1.23 ± 0.32 1.21 ± 0.41 1.40 ± 0.29 1.31 ± 0.16
200N 1.32 ± 0.40 1.39 ± 0.49 1.34 ± 0.33 1.37 ± 0.31 1.33 ± 0.36
Film 3
Control 1.32 ± 0.34 1.24 ± 0.29 1.35 ± 0.43 1.24 ± 0.35 1.15 ± 0.25
200N 1.29 ± 0.34 1.29 ± 0.36 1.14 ± 0.24 1.40 ± 0.27 1.24 ± 0.28
Figure 7.12: MaxD for Control spinach leaves stored under Film 1, Film 2, and Film 3.
0.5
1.0
1.5
2.0
2.5
0 5 10 15
Max
D, m
m
Time, days
Film 1
Film 2
Film 3
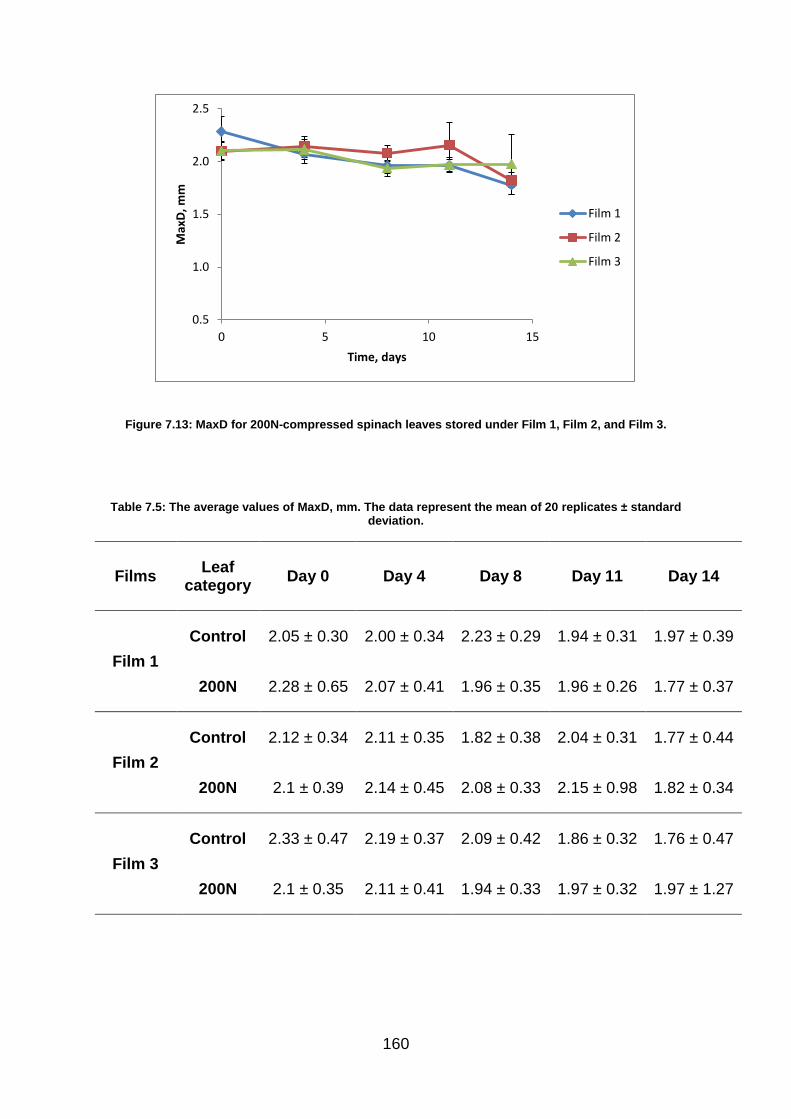
160
Figure 7.13: MaxD for 200N-compressed spinach leaves stored under Film 1, Film 2, and Film 3.
Table 7.5: The average values of MaxD, mm. The data represent the mean of 20 replicates ± standard deviation.
Films Leaf
category Day 0 Day 4 Day 8 Day 11 Day 14
Film 1
Control 2.05 ± 0.30 2.00 ± 0.34 2.23 ± 0.29 1.94 ± 0.31 1.97 ± 0.39
200N 2.28 ± 0.65 2.07 ± 0.41 1.96 ± 0.35 1.96 ± 0.26 1.77 ± 0.37
Film 2
Control 2.12 ± 0.34 2.11 ± 0.35 1.82 ± 0.38 2.04 ± 0.31 1.77 ± 0.44
200N 2.1 ± 0.39 2.14 ± 0.45 2.08 ± 0.33 2.15 ± 0.98 1.82 ± 0.34
Film 3
Control 2.33 ± 0.47 2.19 ± 0.37 2.09 ± 0.42 1.86 ± 0.32 1.76 ± 0.47
200N 2.1 ± 0.35 2.11 ± 0.41 1.94 ± 0.33 1.97 ± 0.32 1.97 ± 1.27
0.5
1.0
1.5
2.0
2.5
0 5 10 15
Max
D, m
m
Time, days
Film 1
Film 2
Film 3
161
7.3.4 Developing colour analysis technique to measure colour changes of spinach
The L*, a*, b* values measured using colorimeter are shown in Table 7.6 and
Table 7.7 for both Control leaves and 200N-compressed leaves respectively.
Overall, as the storage day increased, the L* value which is reflecting lightness and
b* value which is reflecting yellowness increased, and 200N-compressed leaves
always showed higher L* and b* values compared to Control leaves. This showed
that the damaged leaves undergone the yellowing process faster than the intact
leaves. As for the a* value which represents the greenness, the values decreased as
the storage day increased. The decreased in a* values was associated with the
yellowing process of the leafy vegetables (Toivonen & Brummell 2008). There was
non-uniform colour changes which could be associated to the increment of the
enzymatic activity caused from tissue disruption at the cut surfaces, depending on
the local substrate composition and the amount of enzyme that initiate the
discolouration process (Lunadei et al. 2012). There were also inconsistent
increase/decrease of L* and b* values due to either the leaves turned yellow or
turned dark due to the deterioration. The modified atmosphere accumulate
significant levels of volatiles within the headspace area (Kader et al. 1989) such as
released of ammonia due to protein catabolism (Cantwell et al. 2010). The
accumulation of ammonia induced dark deterioration of the leaves (Tudela et al.
2013). The changes of the L*, a*, b* values measured from the colorimeter were also
compared to the L*, a*, b* values converted from the RGB images. The RGB values
were converted to L*, a*, b* values using a coding in MATLAB and the values are
tabulated in Table 7.8 and Table 7.9 for Control and 200N-compressed leaves
respectively.
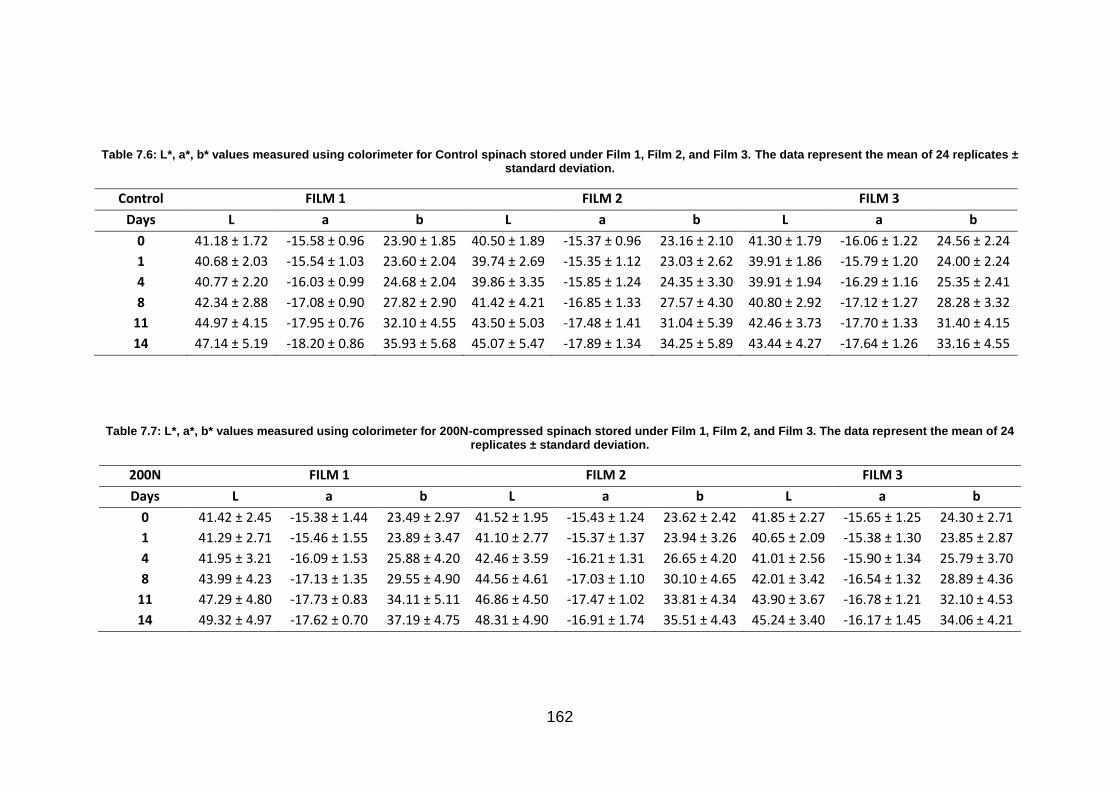
162
Table 7.6: L*, a*, b* values measured using colorimeter for Control spinach stored under Film 1, Film 2, and Film 3. The data represent the mean of 24 replicates ± standard deviation.
Control FILM 1 FILM 2 FILM 3
Days L a b L a b L a b
0 41.18 ± 1.72 -15.58 ± 0.96 23.90 ± 1.85 40.50 ± 1.89 -15.37 ± 0.96 23.16 ± 2.10 41.30 ± 1.79 -16.06 ± 1.22 24.56 ± 2.24
1 40.68 ± 2.03 -15.54 ± 1.03 23.60 ± 2.04 39.74 ± 2.69 -15.35 ± 1.12 23.03 ± 2.62 39.91 ± 1.86 -15.79 ± 1.20 24.00 ± 2.24
4 40.77 ± 2.20 -16.03 ± 0.99 24.68 ± 2.04 39.86 ± 3.35 -15.85 ± 1.24 24.35 ± 3.30 39.91 ± 1.94 -16.29 ± 1.16 25.35 ± 2.41
8 42.34 ± 2.88 -17.08 ± 0.90 27.82 ± 2.90 41.42 ± 4.21 -16.85 ± 1.33 27.57 ± 4.30 40.80 ± 2.92 -17.12 ± 1.27 28.28 ± 3.32
11 44.97 ± 4.15 -17.95 ± 0.76 32.10 ± 4.55 43.50 ± 5.03 -17.48 ± 1.41 31.04 ± 5.39 42.46 ± 3.73 -17.70 ± 1.33 31.40 ± 4.15
14 47.14 ± 5.19 -18.20 ± 0.86 35.93 ± 5.68 45.07 ± 5.47 -17.89 ± 1.34 34.25 ± 5.89 43.44 ± 4.27 -17.64 ± 1.26 33.16 ± 4.55
Table 7.7: L*, a*, b* values measured using colorimeter for 200N-compressed spinach stored under Film 1, Film 2, and Film 3. The data represent the mean of 24 replicates ± standard deviation.
200N FILM 1 FILM 2 FILM 3
Days L a b L a b L a b
0 41.42 ± 2.45 -15.38 ± 1.44 23.49 ± 2.97 41.52 ± 1.95 -15.43 ± 1.24 23.62 ± 2.42 41.85 ± 2.27 -15.65 ± 1.25 24.30 ± 2.71
1 41.29 ± 2.71 -15.46 ± 1.55 23.89 ± 3.47 41.10 ± 2.77 -15.37 ± 1.37 23.94 ± 3.26 40.65 ± 2.09 -15.38 ± 1.30 23.85 ± 2.87
4 41.95 ± 3.21 -16.09 ± 1.53 25.88 ± 4.20 42.46 ± 3.59 -16.21 ± 1.31 26.65 ± 4.20 41.01 ± 2.56 -15.90 ± 1.34 25.79 ± 3.70
8 43.99 ± 4.23 -17.13 ± 1.35 29.55 ± 4.90 44.56 ± 4.61 -17.03 ± 1.10 30.10 ± 4.65 42.01 ± 3.42 -16.54 ± 1.32 28.89 ± 4.36
11 47.29 ± 4.80 -17.73 ± 0.83 34.11 ± 5.11 46.86 ± 4.50 -17.47 ± 1.02 33.81 ± 4.34 43.90 ± 3.67 -16.78 ± 1.21 32.10 ± 4.53
14 49.32 ± 4.97 -17.62 ± 0.70 37.19 ± 4.75 48.31 ± 4.90 -16.91 ± 1.74 35.51 ± 4.43 45.24 ± 3.40 -16.17 ± 1.45 34.06 ± 4.21

163
Table 7.8: L*, a*, b* values converted from RGB values for Control spinach stored under Film 1, Film 2, and Film 3. The data represent the mean of 24 replicates ± standard deviation.
Control FILM 1 FILM 2 FILM 3
Days L a b L a b L a b
1 40.39 ± 5.66 -20.67 ± 2.27 21.00 ± 2.62 40.49 ± 3.60 -21.13 ± 2.05 21.21 ± 2.60 40.37 ± 4.28 -21.03 ± 2.00 21.23 ± 2.56
4 38.90 ± 4.48 -20.34 ± 1.65 21.09 ± 2.27 41.04 ± 6.07 -21.19 ± 1.67 21.61 ± 2.62 39.52 ± 5.68 -20.44 ± 1.98 20.93 ± 2.50
8 41.82 ± 6.02 -20.94 ± 1.96 22.40 ± 2.78 42.02 ± 6.58 -21.14 ± 1.96 22.42 ± 3.18 40.05 ± 7.97 -19.50 ± 1.87 20.77 ± 2.67
11 43.74 ± 3.88 -23.05 ± 1.67 25.61 ± 3.12 43.07 ± 3.78 -22.62 ± 1.85 24.47 ± 3.39 38.03 ± 4.02 -19.84 ± 2.09 21.09 ± 3.00
14 44.77 ± 4.84 -22.92 ± 1.50 26.76 ± 3.34 43.49 ± 3.79 -22.20 ± 2.07 25.00 ± 4.01 42.42 ± 7.55 -20.87 ± 1.89 22.81 ± 3.16
Table 7.9: L*, a*, b* values converted from RGB values for 200N-compressed spinach stored under Film 1, Film 2, and Film 3. The data represent the mean of 24 replicates ± standard deviation.
200N FILM 1 FILM 2 FILM 3
Days L a b L a b L a b
1 42.45 ± 3.60 -21.89 ± 1.76 22.69 ± 2.97 42.17 ± 4.62 -21.60 ± 1.65 22.37 ± 2.44 39.75 ± 4.74 -20.08 ± 2.00 20.57 ± 2.92
4 41.90 ± 5.71 -21.40 ± 2.18 22.77 ± 3.28 42.73 ± 5.50 -21.94 ± 2.02 23.54 ± 3.46 39.24 ± 5.06 -19.91 ± 1.92 20.83 ± 3.14
8 43.76 ± 6.25 -21.94 ± 1.66 24.49 ± 3.46 44.05 ± 6.40 -21.84 ± 1.79 24.51 ± 3.87 40.18 ± 8.86 -18.81 ± 2.19 20.53 ± 3.82
11 45.23 ± 4.12 -23.41 ± 1.80 27.40 ± 3.86 45.45 ± 4.77 -22.92 ± 1.75 26.50 ± 4.06 38.86 ± 4.33 -19.44 ± 1.60 21.41 ± 3.18
14 44.84 ± 7.12 -21.34 ± 1.29 26.22 ± 2.97 45.44 ± 6.68 -22.28 ± 1.58 27.20 ± 4.37 40.81 ± 6.27 -19.55 ± 1.45 22.43 ± 3.13

164
The L*, a*, b* values from the RGB were also converted to the L*, a*, b*
values respective to the original values from colorimeter by using linear models
obtained from the calibrated colour curves (Figure 7.14).
Using linear model,
𝑓(𝑥) = 𝑝1 𝑥 + 𝑝2 (19)
with 95% confidence bounds, the values for the parameters are tabulated in Table
7.10.
Table 7.10: Parameters values for the calibrated colour curves of L*, a*, and b*.
Colour value p1 p2 R2
L* X < 93 0.78 -6.51 0.86
X > 93 2.70 -181.20 0.40
a* 0.91 14.13 0.84
b* 0.92 -6.31 0.85

165
Figure 7.14: Calibration colour curves for A) L*, B) a*, C) b* for values from colorimeter against camera.
A
B
C

166
The converted Lab values to the respective colorimeter values presented in
Table 7.11 and Table 7.12 have around 1.5 times lower than the original colorimeter
values. Overall, majority of the values showed similar trend as values measured
using colorimeter. However, there were quite lots of inconsistencies as well as the
RGB images hardly differentiate the Control and damaged leaves (Table 7.13 and
Figure 7.15). This possibly due to the error that came from the colour charts where
the Lab values for the calibrated colour curves were derived from. The colour charts
used was made of semi-matte material which may affect the reflection of lights when
images were captured using the digital camera.

167
Table 7.11: L*, a*, b* values from RGB values and converted to the respective colorimeter values using calibration curves for Control spinach stored under Film 1, Film 2, and Film 3. The data represent the mean of 24 replicates ± standard deviation.
Control FILM 1 FILM 2 FILM 3
Days L a b L a b L a b
1 24.84 ± 4.40 -4.59 ± 2.06 12.92 ± 2.40 24.91 ± 2.79 -5.00 ± 1.86 13.11 ± 2.38 24.82 ± 3.32 -4.92 ± 1.81 13.14 ± 2.35
4 23.68 ± 3.48 -4.29 ± 1.49 13.00 ± 2.08 25.34 ± 4.71 -5.06 ± 1.51 13.48 ± 2.39 24.15 ± 4.41 -4.38 ± 1.80 12.86 ± 2.29
8 25.95 ± 4.67 -4.83 ± 1.77 14.20 ± 2.54 26.10 ± 5.11 -5.02 ± 1.77 14.23 ± 2.91 24.57 ± 6.18 -3.53 ± 1.69 12.71 ± 2.45
11 27.43 ± 3.01 -6.74 ± 1.51 17.15 ± 2.86 26.91 ± 2.93 -6.35 ± 1.68 16.10 ± 3.10 23.01 ± 3.12 -3.84 ± 1.89 13.01 ± 2.75
14 28.23 ± 3.76 -6.63 ± 1.36 18.19 ± 3.06 27.24 ± 2.94 -5.97 ± 1.87 16.58 ± 3.67 26.41 ± 5.86 -4.77 ± 1.71 14.58 ± 2.89
Table 7.12: L*, a*, b* values from RGB values and converted to the respective colorimeter values using calibration curves for 200N-compressed spinach stored under Film 1, Film 2, and Film 3. The data represent the mean of 24 replicates ± standard deviation.
200N FILM 1 FILM 2 FILM 3
Days L a b L a b L a b
1 26.43 ± 2.79 -5.70 ± 1.59 14.47 ± 2.72 26.22 ± 3.59 -5.43 ± 1.49 14.18 ± 2.23 24.34 ± 3.67 -4.06 ± 1.81 12.53 ± 2.68
4 26.00 ± 4.43 -5.25 ± 1.98 14.55 ± 3.01 26.65 ± 4.27 -5.74 ± 1.83 15.24 ± 3.17 23.94 ± 3.93 -3.90 ± 1.74 12.76 ± 2.88
8 27.45 ± 4.85 -5.74 ± 1.51 16.12 ± 3.17 27.68 ± 4.96 -5.65 ± 1.62 16.13 ± 3.55 24.67 ± 6.88 -2.90 ± 1.98 12.49 ± 3.50
11 28.59 ± 3.20 -7.07 ± 1.63 18.78 ± 3.54 28.76 ± 3.70 -6.63 ± 1.58 17.96 ± 3.72 23.65 ± 3.36 -3.47 ± 1.45 13.30 ± 2.91
14 28.29 ± 5.53 -5.19 ± 1.17 17.70 ± 2.72 28.75 ± 5.18 -6.05 ± 1.43 18.60 ± 4.00 25.16 ± 4.86 -3.57 ± 1.31 14.23 ± 2.87

168
Table 7.13: Plots of L*, a*, and b* values measured using A) colorimeter, and B) RGB converted to L*, a*, b* for both Control and 200N-compressed spinach.
Colorimeter Control Colorimeter 200N
35
40
45
50
0 5 10 15
L*
L* Film 1Film 2Film 3
35
40
45
50
0 5 10 15L*
L* Film 1Film 2Film 3
-19
-18
-17
-16 0 5 10 15
a*
a*
Film 1
Film 2
Film 3
-19
-18
-17
-16 0 5 10 15
a*
a* Film 1Film 2Film 3
20
25
30
35
40
0 5 10 15
b*
b* Film 1Film 2Film 3
20
25
30
35
40
0 5 10 15
b*
b* Film 1Film 2Film 3
A

169
Digital Control Digital 200N
35
40
45
50
0 5 10 15
L*
Film 1Film 2Film 3
35
40
45
50
0 5 10 15
L* Film 1
Film 2
Film 3
-24.00
-23.00
-22.00
-21.00
-20.00
-19.00
0 5 10 15
a*
Film 1
Film 2
Film 3 -25.00
-20.00
-15.00
-10.00
-5.00
0.00
0 5 10 15
a*
Film 1
Film 2
Film 3
20
25
30
35
40
0 5 10 15
b*
Film 1
Film 2
Film 3
20
25
30
35
40
0 5 10 15
b*
Film 1
Film 2
Film 3
B
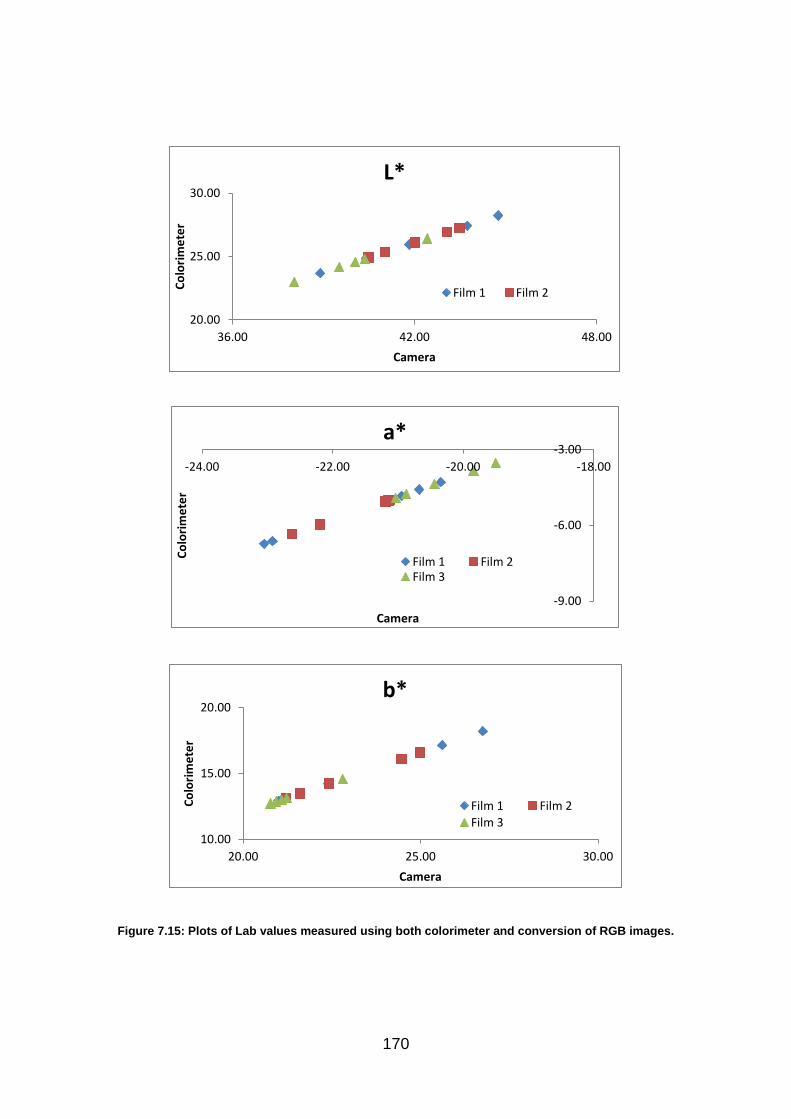
170
Figure 7.15: Plots of Lab values measured using both colorimeter and conversion of RGB images.
20.00
25.00
30.00
36.00 42.00 48.00
Co
lori
me
ter
Camera
L*
Film 1 Film 2
-9.00
-6.00
-3.00
-24.00 -22.00 -20.00 -18.00
Co
lori
me
ter
Camera
a*
Film 1 Film 2Film 3
10.00
15.00
20.00
20.00 25.00 30.00
Co
lori
me
ter
Camera
b*
Film 1 Film 2
Film 3
171
7.4 Conclusion
Mechanically damaged spinach leaves have higher respiration rates
compared to intact leaves; which accelerate quality degradations and shelf life
reduction of the product. The OTR gives effect towards the quality attributes of the
spinach. The OTR significantly affected the package atmosphere where the similar
film material with lower yet appropriate OTR maintained longer shelf-life and higher
product quality during storage (Pan & Sasanatayart 2016; Kim et al. 2004a). The
OTR significantly affected the sensory quality of baby spinach (Allende et al. 2004).
However, this effect may be not applicable to the mechanically damaged leaves,
which showed similar responses when treated under different packaging films.
Surface dehydration, loss of firmness, and loss of green colour to yellowing are
major quality losses which lead to shelf life reduction of the fresh produce. It is
beneficial for the fresh produce industry to have the information regarding the effect
of the mechanical damage towards the respiration rates of the fresh products thus
any accidental damage towards the products could be minimised during processing,
handling and distributing. This help to improve the quality and shelf life of the fresh
product throughout storage.
For the colour analysis technique, there seems to be ‘inaccuracy’ of the
calibration curves as the L*, a*, b* values reported after using the conversion model
equations showed 1.5 times lower than the original L*, a*, b* values from the
colorimeter. This may be due to the effect of light reflection while taking the RGB
digital image. Although the process took place in a control box with controlled light,
as the colour charts used in this study were semi-matte, the surfaces of the colour
charts were partly glossy thus caused the light reflection. This reduced the quality of
172
the RGB images and affected the L*, a*, b* values of the images. Improvement could
be made in the future to use specifically designed matte tiles with several colours as
the colour charts for the calibration of the digital colour system. Those specific tiles
take some time to be made and the price is quite costly which these two reasons
made me took the alternative to use the semi-matte colour charts. This image
analysis technique would be really beneficial in the food industries as they could
apply the technique to any product especially those dealing with irregular shape and
size of food samples while at the same time do not have to worry about unfit
aperture or lens size for the food product as what usually experienced by
colorimeter.
173
CHAPTER 8
CONCLUSIONS AND FUTURE WORK
The compression method was successfully implemented to study the effect of
processing towards quality and shelf life of the RTE leafy vegetables. Findings from
the works have sufficiently met the objectives of the project.
The types of spinach gave effects toward the mechanical properties and
qualities of the spinach. Organic spinach was found to be the best in resisting stress
and damage compared to Teen, Salad and Baby spinach due to its morphology.
Physical appearance was found to be effective in representing damage that occurred
on the leaves. However, microstructure hardly tells the damage occurred within the
leaves. This was due to the compression of bulk spinach where for each
compression, not all the leaves got breakage. The compression caused cell bursting
and released its contents which caused the blurry images found under the
microscope. Appropriate weight of spinach inside the packaging bag reduced the
possibility of the leaves inside the bag to be compressed due to crowdedness inside
the bag thus lowered the risk for accidental mechanical leaf damage. There was not
significant different between texture of spinach before and after storage, however,
the texture was somewhat found to be different between different varieties.
The population test method developed in this study has successfully able to
distinguish different degrees of leaf injuries and their effects towards quality and
shelf life of the RTE spinach during postharvest storage. Force 200N was suggested
174
to be the minimum required to pick up differences of the leaves deteriorations before
and after storage. Uncompressed spinach leaves were found to have a shelf life of
14 days. Higher degrees of leaf injuries which are Halfway teared and Complete
teared showed obvious decay since before storage, whereas Minor teared leaves
started to show decay after eight days of storage. This method is practical and could
be applicable to study the injuries experienced by other fruits and leafy vegetables.
Sensorial data including evaluations and perceptions from assessors helped
in contributing to the knowledge of quality and shelf life of the RTE spinach as a
whole. The degree of leaf injury and storage day significantly affect the visibility of
decays and acceptance rate in buying the product. This shows that the higher the
degree of leaf injury, the lower the shelf life of the fresh product thus the lower the
acceptance rate in buying the product. The longer the storage day, the clearer the
visibility of decays thus the lower the acceptance rate in buying the product. Main
factors affecting assessor’s decision in buying the product include quality of the
spinach inside the bag and ambiance inside the bag. Assessors defined damaged
leaves as leaves that were teared, yellowish and brownish, wet, wilted, got white
spots and possible insect bites. As expected, any Complete teared leaves or visible
crack marks were totally unacceptable. In some cases, damaged leaves were still
acceptable if the product is at reduced price and it also depends on the time people
plan to consume them. Sometimes, the broken leaves were tolerable as long as the
leaves do not change colour and do not show sign of mushiness. Spinach bags that
contained high moisture caused most consumers unlikely to buy the product.
Mechanically damaged spinach leaves was found to have higher respiration
rates compared to intact leaves; which accelerate quality degradations and shelf life
175
reduction of the product. The OTR gives effect towards the quality attributes of the
spinach. However, this effect may be not applicable to the mechanically damaged
leaves, which showed similar responses when treated under different packaging
films. The respiration rate data in this study sufficiently fit the Michaelis-Menten and
exponential models.
Image analysis technique would be really beneficial in the food industries as
they could apply the technique to any product especially those dealing with irregular
shape and size of food samples while at the same time do not have to worry about
unfit aperture or lens size for the food product as what usually experienced by
colorimeter. However, results found in this study showed some ‘inaccuracy’ of the
calibration curves as the L*, a*, b* values reported after using the conversion model
equations showed 1.5 times lower than the original L*, a*, b* values from the
colorimeter. Although the process took place in a controlled-light environment,
because of the semi-glossy surface due to semi-mate property, there was light
reflection which affected the quality of the RGB images.
Data from studies conducted in this thesis could provide basis to both fresh
produce industry and retailer to have understanding on the effect of processing,
which in this case focused on compression, towards the quality and shelf life of the
RTE leafy vegetables. Precaution and optimisation could be made during processing
and handling to prevent and minimise any possible compression thus improve the
quality and shelf life of the product.
176
RESEARCH IMPROVEMENTS
If the research were to start again, few changes could be made for
improvement of overall responses from the experiment. First improvement would be
to plant the spinach in a controlled environment rather than bought the spinach from
the supermarket. This will minimise the variation of the leaves by having standard
and fixed treatment during plantation, harvest, processing, and storage.
Another improvement that could be made is to use specifically designed matte
tiles with several colours as the colour charts for the calibration of the digital colour
system. The full matte tiles could prevent any reflection of light during image capture
thus minimise any technical error that could happen during the image acquisition
process.
Studying the response of the spinach leaves harvested at different season
would also be a beneficial addition to the quality and shelf life of fresh leafy
vegetables area. During winter for example, the ambiance is more wet and cold,
whereas during summer, the ambiance is dry and hot. These two differences in
humidity and temperature could affect the quality and shelf life of the spinach leaves
and their responses are something worth to look at.
Apart from that, a model equation of deterioration due to mechanical damage
experienced by packed spinach could also be built. By having a proper ratio of work
in the lab to the real work in the industry, the industry can straight away use the
model equation to predict the total decay of the leaves in a bag thus precautions
could be made during handling and overall loss could be minimised.
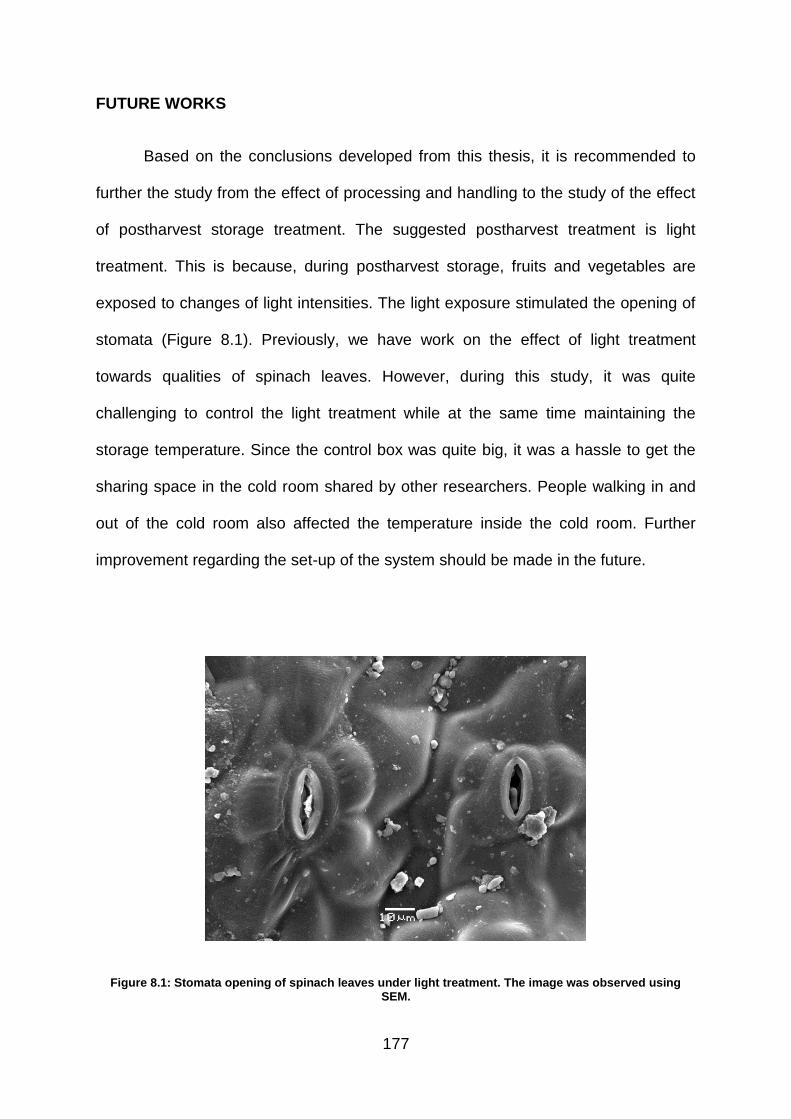
177
FUTURE WORKS
Based on the conclusions developed from this thesis, it is recommended to
further the study from the effect of processing and handling to the study of the effect
of postharvest storage treatment. The suggested postharvest treatment is light
treatment. This is because, during postharvest storage, fruits and vegetables are
exposed to changes of light intensities. The light exposure stimulated the opening of
stomata (Figure 8.1). Previously, we have work on the effect of light treatment
towards qualities of spinach leaves. However, during this study, it was quite
challenging to control the light treatment while at the same time maintaining the
storage temperature. Since the control box was quite big, it was a hassle to get the
sharing space in the cold room shared by other researchers. People walking in and
out of the cold room also affected the temperature inside the cold room. Further
improvement regarding the set-up of the system should be made in the future.
Figure 8.1: Stomata opening of spinach leaves under light treatment. The image was observed using SEM.
178
Light intensities may bring both advantage and disadvantage to the fresh
product. Glowacz et al. (2015) reported that high light exposure resulted in oxidative
stress causing tissue damage; however, low light gave more promising results as it
improved the nutritional value of spinach while maintaining its texture. Lester et al.
(2010) also reported that spinach leaves exposed to continuous light of simulated
retailer were overall more nutritionally dense than leaves stored in continuous
darkness. Further studies should be conducted to identify the threshold of light
intensity that could improve the nutritional value while at the same time does not
compromise the quality of the spinach thus recommendations can be made to the
supply chain and retailers.
Part of this work has been published in:
Ariffin, S.H., Gkatzionis, K. & Bakalis, S., 2017. Leaf injury and its effect towards
shelf-life and quality of ready-to-eat (RTE) spinach. Energy Procedia, 123, pp.105–
112. Available at: http://dx.doi.org/10.1016/j.egypro.2017.07.265.
179
APPENDIX
A.1 SPSS results from ANOVA for textural differences of spinach throughout storage
Baby spinach
ONE WAY ANOVA
Burst Strength
No significant difference throughout storage days for every groups
No significant difference between group Control and group 100N, 150N, and
200N
2 WAY ANOVA
Multiple comparisons between storage days (P = 0.007 < 0.05)
Overall results show that there is AT LEAST ONE significant difference
throughout the storage days
o There is AT LEAST ONE significant difference between Day 0 and Day
8 & Day 12
Multiple comparisons between treatment (P = 0.404 > 0.05)
No significant difference for all comparisons at all
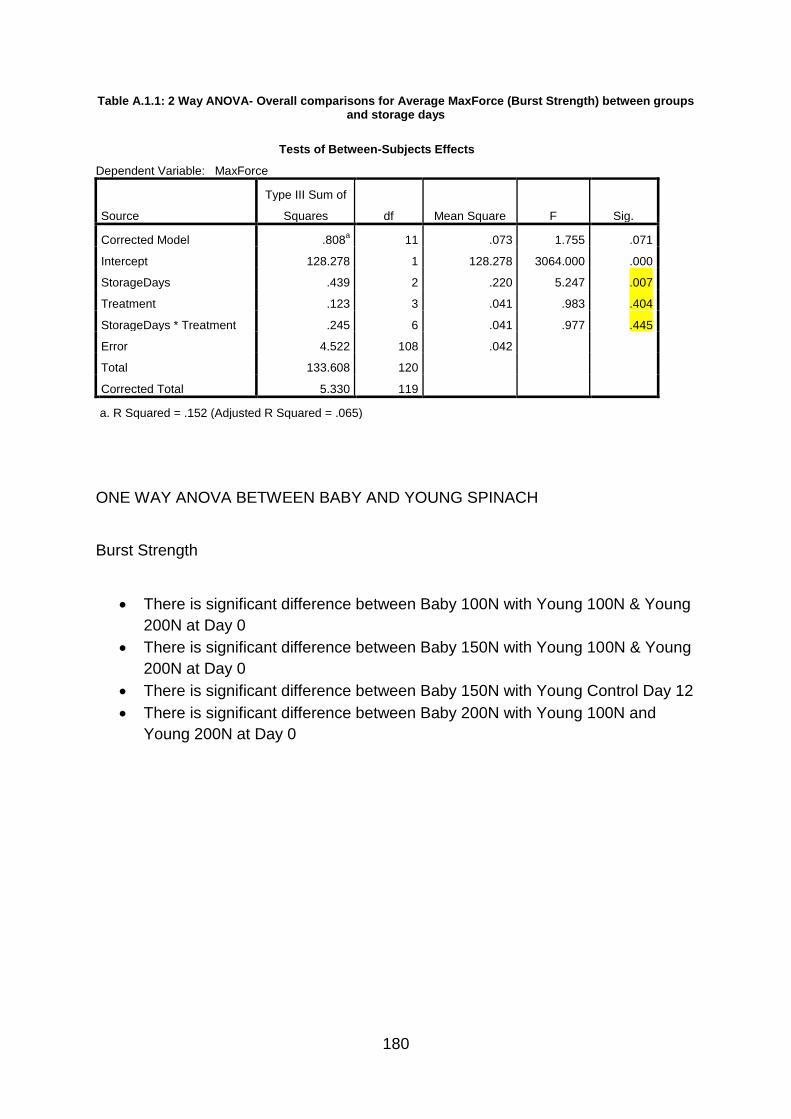
180
Table A.1.1: 2 Way ANOVA- Overall comparisons for Average MaxForce (Burst Strength) between groups and storage days
Tests of Between-Subjects Effects
Dependent Variable: MaxForce
Source
Type III Sum of
Squares df Mean Square F Sig.
Corrected Model .808a 11 .073 1.755 .071
Intercept 128.278 1 128.278 3064.000 .000
StorageDays .439 2 .220 5.247 .007
Treatment .123 3 .041 .983 .404
StorageDays * Treatment .245 6 .041 .977 .445
Error 4.522 108 .042
Total 133.608 120
Corrected Total 5.330 119
a. R Squared = .152 (Adjusted R Squared = .065)
ONE WAY ANOVA BETWEEN BABY AND YOUNG SPINACH
Burst Strength
There is significant difference between Baby 100N with Young 100N & Young
200N at Day 0
There is significant difference between Baby 150N with Young 100N & Young
200N at Day 0
There is significant difference between Baby 150N with Young Control Day 12
There is significant difference between Baby 200N with Young 100N and
Young 200N at Day 0

181
Young spinach
ONE WAY ANOVA
Burst Strength
No significant difference throughout storage days for every groups
No significant difference between group Control and group 100N, 150N, and
200N
2 WAYS ANOVA
Multiple comparisons between groups (P = 0.577 > 0.05)
No significant difference for all comparisons at all
Multiple comparisons between days (P = 0.829 > 0.05)
No significant difference for all comparisons at all
Table A.1.2: 2 Way ANOVA- Overall comparisons for Average MaxForce (Burst Strength) between groups
and storage days
Tests of Between-Subjects Effects
Dependent Variable: MaxForce
Source
Type III Sum of
Squares df Mean Square F Sig.
Corrected Model .355a 11 .032 .679 .756
Intercept 189.908 1 189.908 3994.412 .000
Treatment .094 3 .031 .662 .577
StorageDays .018 2 .009 .188 .829
Treatment * StorageDays .243 6 .040 .850 .534
Error 5.135 108 .048
Total 195.397 120
Corrected Total 5.490 119
a. R Squared = .065 (Adjusted R Squared = -.031)
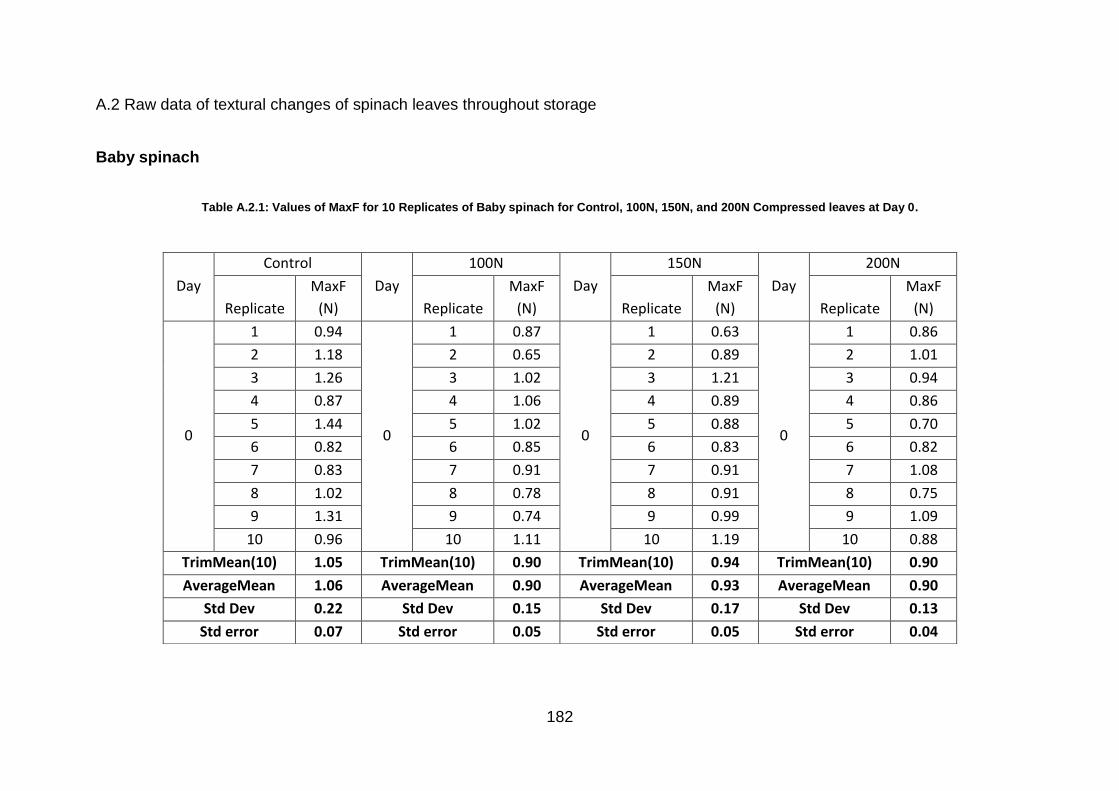
182
A.2 Raw data of textural changes of spinach leaves throughout storage
Baby spinach
Table A.2.1: Values of MaxF for 10 Replicates of Baby spinach for Control, 100N, 150N, and 200N Compressed leaves at Day 0.
Day
Control
Day
100N
Day
150N
Day
200N
Replicate
MaxF
(N) Replicate
MaxF
(N) Replicate
MaxF
(N) Replicate
MaxF
(N)
0
1 0.94
0
1 0.87
0
1 0.63
0
1 0.86
2 1.18 2 0.65 2 0.89 2 1.01
3 1.26 3 1.02 3 1.21 3 0.94
4 0.87 4 1.06 4 0.89 4 0.86
5 1.44 5 1.02 5 0.88 5 0.70
6 0.82 6 0.85 6 0.83 6 0.82
7 0.83 7 0.91 7 0.91 7 1.08
8 1.02 8 0.78 8 0.91 8 0.75
9 1.31 9 0.74 9 0.99 9 1.09
10 0.96 10 1.11 10 1.19 10 0.88
TrimMean(10) 1.05 TrimMean(10) 0.90 TrimMean(10) 0.94 TrimMean(10) 0.90
AverageMean 1.06 AverageMean 0.90 AverageMean 0.93 AverageMean 0.90
Std Dev 0.22 Std Dev 0.15 Std Dev 0.17 Std Dev 0.13
Std error 0.07 Std error 0.05 Std error 0.05 Std error 0.04

183
Table A.2.2: Values of MaxF for 10 Replicates of Baby spinach for Control, 100N, 150N, and 200N Compressed leaves at Day 8.
Day Control
Day 100N
Day 150N
Day 200N
Replicate MaxF
(N) Replicate MaxF
(N) Replicate MaxF
(N) Replicate MaxF
(N)
8
1 0.97
8
1 1.20
8
1 1.06
8
1 1.24
2 1.10 2 0.78 2 1.01 2 1.32
3 0.92 3 1.28 3 0.71 3 0.92
4 1.11 4 1.24 4 0.86 4 1.10
5 0.87 5 0.75 5 0.81 5 1.25
6 1.17 6 0.91 6 1.53 6 1.14
7 1.01 7 1.13 7 1.07 7 1.06
8 1.13 8 1.25 8 1.39 8 1.12
9 0.91 9 0.88 9 1.08 9 0.90
10 1.01 10 1.14 10 1.07 10 1.29
TrimMean(10) 1.02 TrimMean(10) 1.07 TrimMean(10) 1.04 TrimMean(10) 1.14
AverageMean 1.02 AverageMean 1.05 AverageMean 1.06 AverageMean 1.13
Std Dev 0.10 Std Dev 0.21 Std Dev 0.25 Std Dev 0.15
Std error 0.03 Std error 0.06 Std error 0.08 Std error 0.05

184
Table A.2.3: Values of MaxF for 10 Replicates of Baby spinach for Control, 100N, 150N, and 200N Compressed leaves at Day 12.
Day Control
Day 100N
Day 150N
Day 200N
Replicate MaxF
(N) Replicate MaxF
(N) Replicate MaxF
(N) Replicate MaxF
(N)
12
1 1.03
12
1 0.74
12
1 1.02
12
1 1.20
2 1.46 2 0.84 2 1.07 2 1.17
3 1.30 3 0.99 3 1.15 3 1.21
4 0.79 4 1.45 4 1.03 4 0.79
5 1.94 5 0.89 5 1.00 5 1.23
6 1.49 6 1.62 6 1.14 6 1.10
7 1.10 7 1.06 7 0.90 7 0.81
8 0.97 8 0.94 8 1.08 8 1.02
9 0.86 9 1.25 9 1.11 9 0.94
10 0.85 10 0.86 10 0.91 10 1.11
TrimMean(10) 1.13 TrimMean(10) 1.04 TrimMean(10) 1.05 TrimMean(10) 1.07
AverageMean 1.18 AverageMean 1.06 AverageMean 1.04 AverageMean 1.06
Std Dev 0.37 Std Dev 0.29 Std Dev 0.09 Std Dev 0.16
Std error 0.12 Std error 0.09 Std error 0.03 Std error 0.05

185
Young’s spinach
Table A.2.4: Values of MaxF for 10 Replicates of Young spinach for Control, 100N, 150N, and 200N Compressed leaves at Day 0.
Day Control
Day 100N
Day 150N
Day 200N
Replicate MaxF
(N) Replicate MaxF
(N) Replicate MaxF
(N) Replicate MaxF
(N)
0
1 1.00
0
1 1.31
0
1 1.01
0
1 1.53
2 1.03 2 1.23 2 1.19 2 1.25
3 1.18 3 1.52 3 1.24 3 1.15
4 1.47 4 1.29 4 1.11 4 0.96
5 1.68 5 1.21 5 1.34 5 1.33
6 1.21 6 1.25 6 1.06 6 1.17
7 1.06 7 0.85 7 1.22 7 1.01
8 1.22 8 1.29 8 1.25 8 1.84
9 1.32 9 1.51 9 1.26 9 1.61
10 1.13 10 1.44 10 1.04 10 1.07
TrimMean(10) 1.20 TrimMean(10) 1.32 TrimMean(10) 1.19 TrimMean(10) 1.26
AverageMean 1.23 AverageMean 1.29 AverageMean 1.19 AverageMean 1.29
Std Dev 0.21 Std Dev 0.19 Std Dev 0.11 Std Dev 0.29
Std error 0.07 Std error 0.06 Std error 0.03 Std error 0.09

186
Table A.2.5: Values of MaxF for 10 Replicates of Young spinach for Control, 100N, 150N, and 200N Compressed leaves at Day 8.
Day Control
Day 100N
Day 150N
Day 200N
Replicate MaxF
(N) Replicate MaxF
(N) Replicate MaxF
(N) Replicate MaxF
(N)
8
1 1.30
8
1 1.05
8
1 0.91
8
1 0.97
2 1.28 2 1.59 2 1.43 2 1.21
3 1.02 3 1.02 3 1.07 3 1.57
4 1.32 4 1.23 4 1.72 4 1.39
5 0.93 5 1.04 5 1.11 5 1.57
6 1.39 6 1.45 6 1.37 6 0.99
7 1.35 7 1.01 7 1.48 7 1.16
8 1.02 8 1.13 8 1.30 8 1.13
9 1.33 9 1.56 9 1.28 9 1.62
10 1.50 10 1.38 10 0.88 10 1.07
TrimMean(10) 1.25 TrimMean(10) 1.23 TrimMean(10) 1.24 TrimMean(10) 1.26
AverageMean 1.24 AverageMean 1.25 AverageMean 1.25 AverageMean 1.27
Std Dev 0.19 Std Dev 0.23 Std Dev 0.26 Std Dev 0.25
Std error 0.06 Std error 0.07 Std error 0.08 Std error 0.08
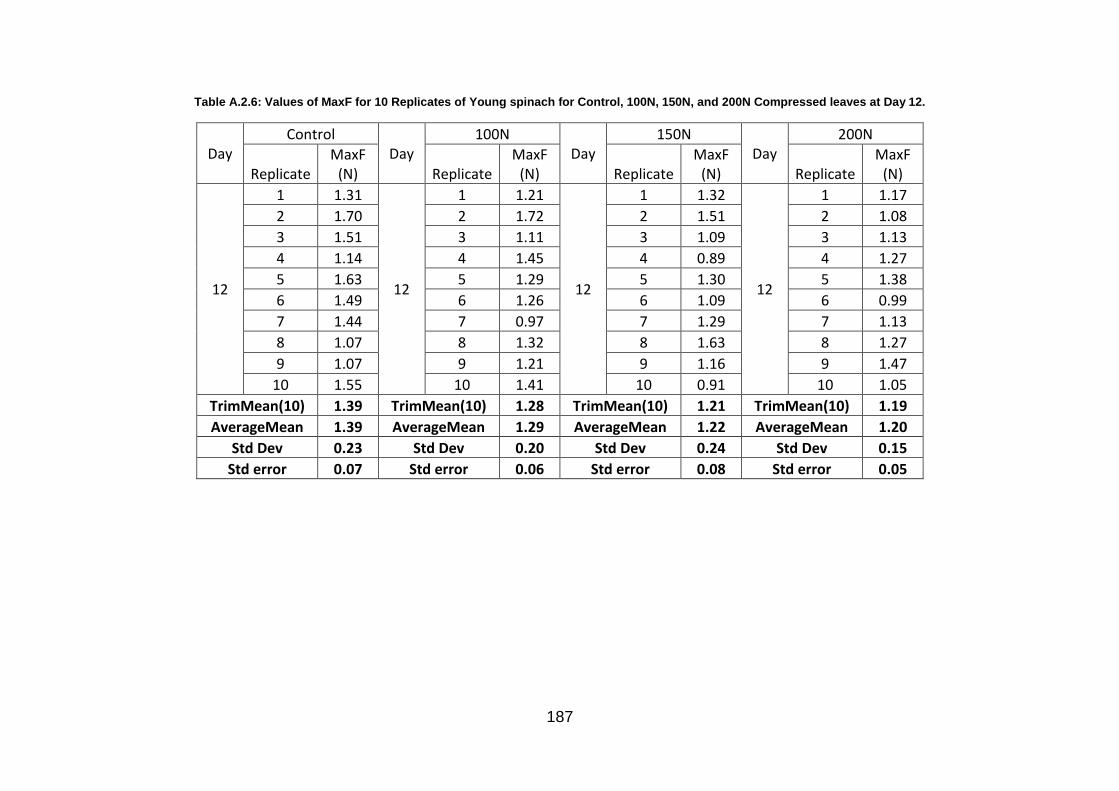
187
Table A.2.6: Values of MaxF for 10 Replicates of Young spinach for Control, 100N, 150N, and 200N Compressed leaves at Day 12.
Day Control
Day 100N
Day 150N
Day 200N
Replicate MaxF
(N) Replicate MaxF
(N) Replicate MaxF
(N) Replicate MaxF
(N)
12
1 1.31
12
1 1.21
12
1 1.32
12
1 1.17
2 1.70 2 1.72 2 1.51 2 1.08
3 1.51 3 1.11 3 1.09 3 1.13
4 1.14 4 1.45 4 0.89 4 1.27
5 1.63 5 1.29 5 1.30 5 1.38
6 1.49 6 1.26 6 1.09 6 0.99
7 1.44 7 0.97 7 1.29 7 1.13
8 1.07 8 1.32 8 1.63 8 1.27
9 1.07 9 1.21 9 1.16 9 1.47
10 1.55 10 1.41 10 0.91 10 1.05
TrimMean(10) 1.39 TrimMean(10) 1.28 TrimMean(10) 1.21 TrimMean(10) 1.19
AverageMean 1.39 AverageMean 1.29 AverageMean 1.22 AverageMean 1.20
Std Dev 0.23 Std Dev 0.20 Std Dev 0.24 Std Dev 0.15
Std error 0.07 Std error 0.06 Std error 0.08 Std error 0.05

188
A.3 Distribution of deteriorations of spinach leaves under compression
Spinach leaves (S4) compressed under 50N
Undamaged
Halfway teared
Complete teared
0
20
40
60
80
100
0 1 2 3 4 5 6 7 8 9 10
Fre
qu
en
cy, %
Percentage of deterioration, %
Day 1Day 4Day 8Day 11Day 14
0
20
40
60
80
100
0 1 2 3 4 5 6 7 8 9 10
Fre
qu
en
cy, %
Percentage of deterioration, %
Day 1Day 4Day 8Day 11Day 14
0
20
40
60
80
100
0 1 2 3 4 5 6 7 8 9 10
Fre
qu
en
cy, %
Percentage of deterioration, %
Day 1Day 4Day 8Day 11Day 14
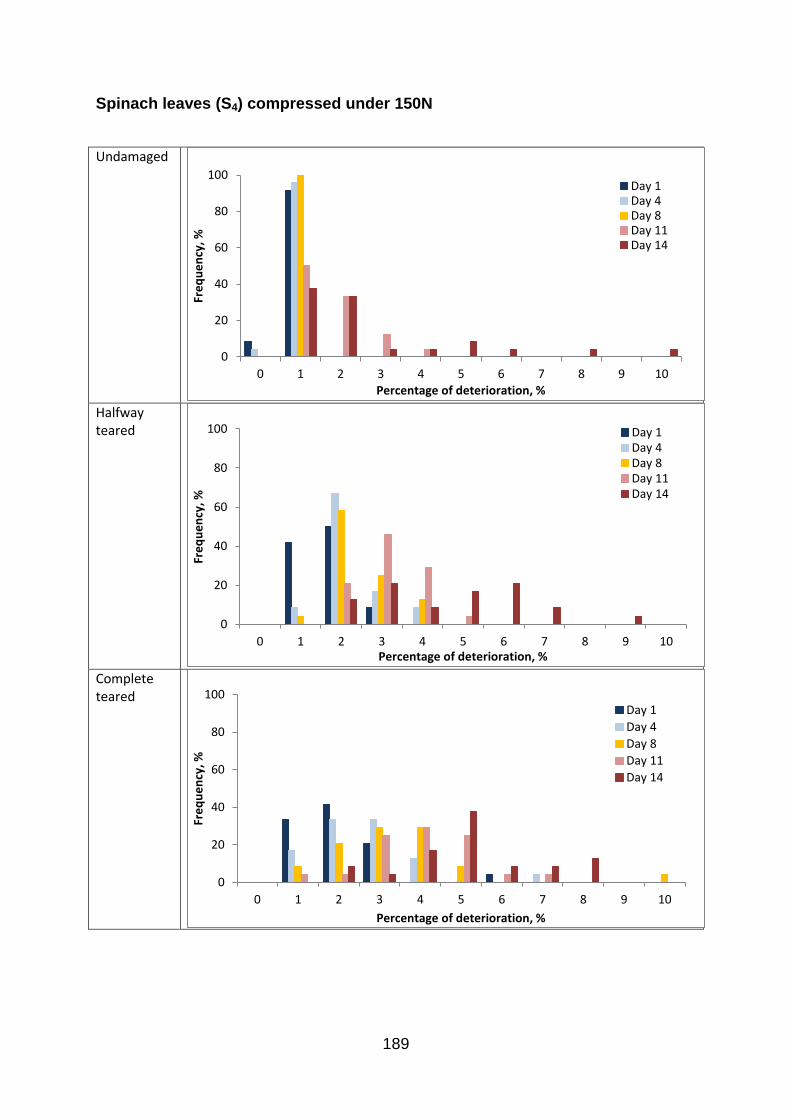
189
Spinach leaves (S4) compressed under 150N
Undamaged
Halfway teared
Complete teared
0
20
40
60
80
100
0 1 2 3 4 5 6 7 8 9 10
Fre
qu
en
cy, %
Percentage of deterioration, %
Day 1Day 4Day 8Day 11Day 14
0
20
40
60
80
100
0 1 2 3 4 5 6 7 8 9 10
Fre
qu
en
cy, %
Percentage of deterioration, %
Day 1Day 4Day 8Day 11Day 14
0
20
40
60
80
100
0 1 2 3 4 5 6 7 8 9 10
Fre
qu
en
cy, %
Percentage of deterioration, %
Day 1
Day 4
Day 8
Day 11
Day 14
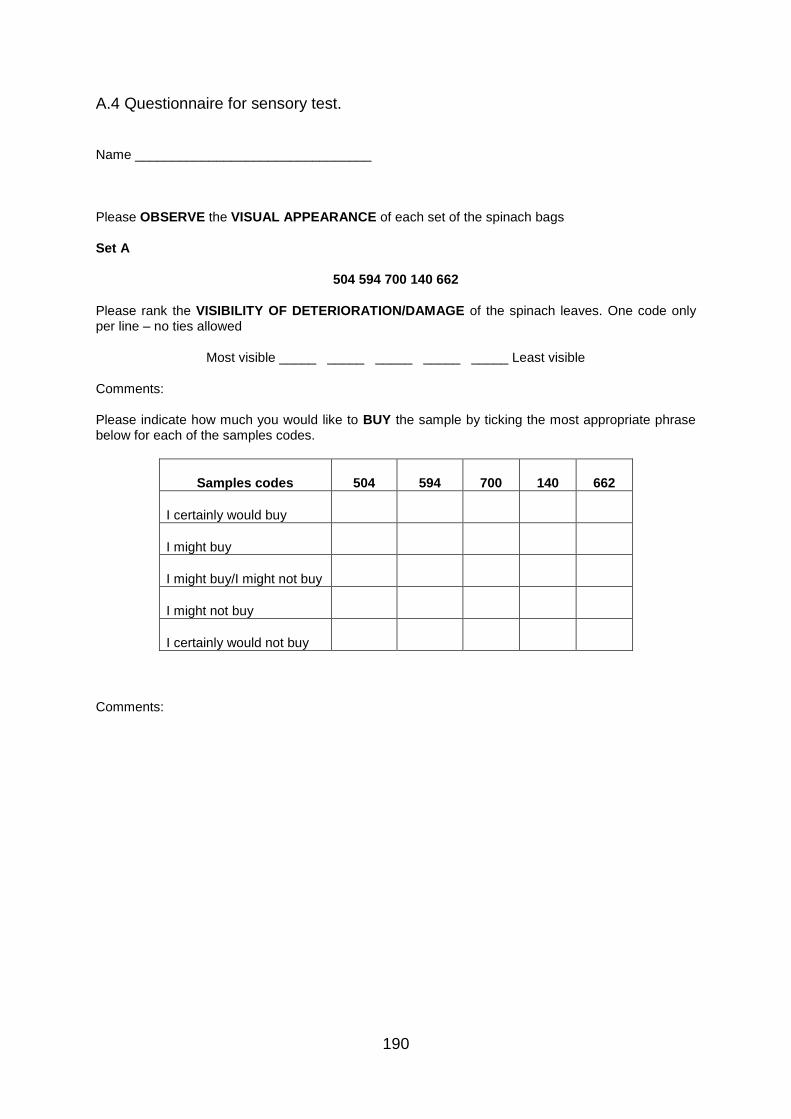
190
A.4 Questionnaire for sensory test.
Name ________________________________
Please OBSERVE the VISUAL APPEARANCE of each set of the spinach bags
Set A
504 594 700 140 662
Please rank the VISIBILITY OF DETERIORATION/DAMAGE of the spinach leaves. One code only per line – no ties allowed
Most visible _____ _____ _____ _____ _____ Least visible
Comments:
Please indicate how much you would like to BUY the sample by ticking the most appropriate phrase below for each of the samples codes.
Samples codes 504 594 700 140 662
I certainly would buy
I might buy
I might buy/I might not buy
I might not buy
I certainly would not buy
Comments:

191
Set B
900 464 156 966 938
Please rank the VISIBILITY OF DETERIORATION/DAMAGE of the spinach leaves. One code only per line – no ties allowed
Most visible _____ _____ _____ _____ _____ Least visible
Comments:
Please indicate how much you would like to BUY the sample by ticking the most appropriate phrase below for each of the samples codes.
Samples codes 900 464 156 966 938
I certainly would buy
I might buy
I might buy/I might not buy
I might not buy
I certainly would not buy
Comments:
Set C
044 878 160 785 866
Please rank the VISIBILITY OF DETERIORATION/DAMAGE of the spinach leaves. One code only per line – no ties allowed
Most visible _____ _____ _____ _____ _____ Least visible
Comments:
Please indicate how much you would like to BUY the sample by ticking the most appropriate phrase below for each of the samples codes.
Samples codes 044 878 160 785 866
I certainly would buy
I might buy
I might buy/I might not buy
I might not buy
I certainly would not buy
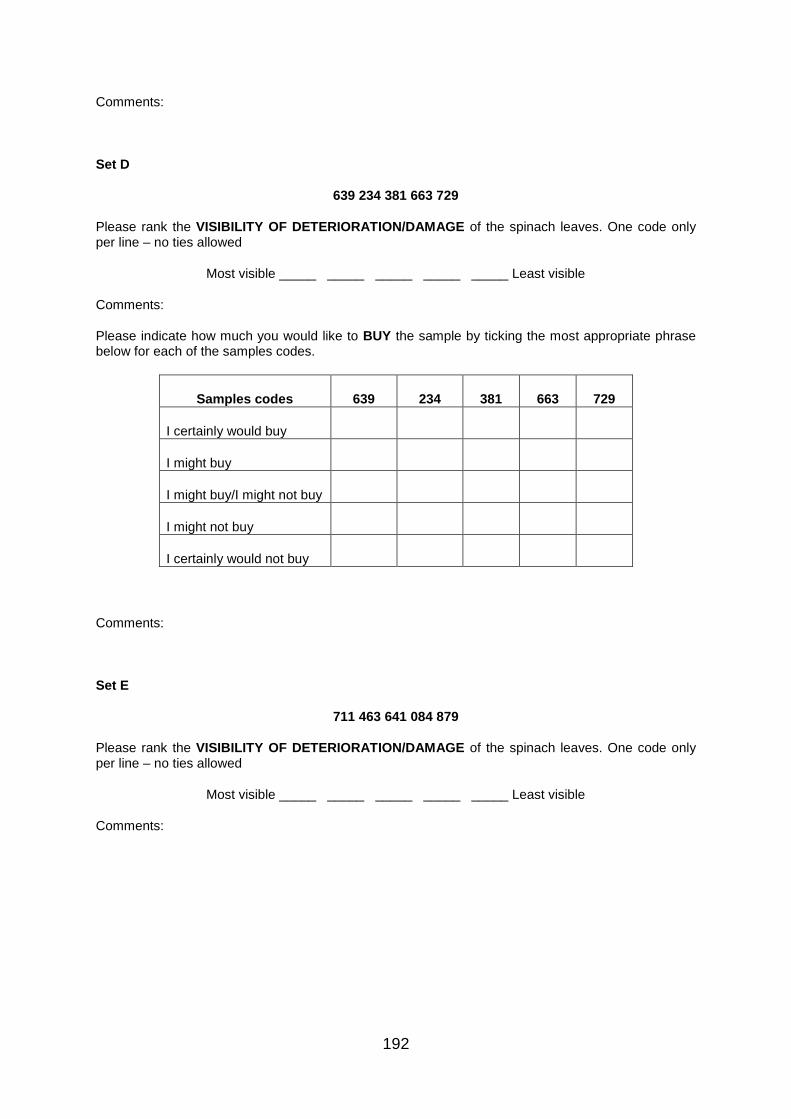
192
Comments:
Set D
639 234 381 663 729
Please rank the VISIBILITY OF DETERIORATION/DAMAGE of the spinach leaves. One code only per line – no ties allowed
Most visible _____ _____ _____ _____ _____ Least visible
Comments:
Please indicate how much you would like to BUY the sample by ticking the most appropriate phrase below for each of the samples codes.
Samples codes 639 234 381 663 729
I certainly would buy
I might buy
I might buy/I might not buy
I might not buy
I certainly would not buy
Comments:
Set E
711 463 641 084 879
Please rank the VISIBILITY OF DETERIORATION/DAMAGE of the spinach leaves. One code only per line – no ties allowed
Most visible _____ _____ _____ _____ _____ Least visible
Comments:

193
Please indicate how much you would like to BUY the sample by ticking the most appropriate phrase below for each of the samples codes.
Samples codes 711 463 641 084 879
I certainly would buy
I might buy
I might buy/I might not buy
I might not buy
I certainly would not buy
Comments:
GENERAL QUESTIONS
1. Nationality/country of origin: __________________
2. Gender: Male _______ Female ________
3. Age: 18-25 26-35 36-45 46-55 56-65 65+
4. How often do you purchase ready-to-eat (RTE) spinach? (Please circle ONLY ONE number under ONLY ONE category)
Per day Per week Per month
1X 2X 3X 1X 2X 3X-4X 5X-6X 1X-3X 4X-6X
5. Do you observe the visual appearance of the spinach before buying?
YES NO SOMETIMES
6. If your answer in 5 is YES, do you mind to buy bag of spinach that contains deteriorated/damaged leaves?
YES NO SOMETIMES
Additional comments:
_________________________________________________________________

194
REFERENCES
Aamir, M. & Ovissipour, M., 2013. Predicting the Quality of Pasteurized Vegetables
Using Kinetic Models: A Review. International Journal of …, 2013. Available at:
http://www.hindawi.com/journals/ijfs/aip/271271/.
Abbott, J.A., 1999. Quality measurement of fruits and vegetables. Postharvest
Biology and Technology, 15(3), pp.207–225.
Ahvenainen, R., 1996. New approaches in improving the shelf life of minimally
processed fruit and vegetables. Food Science & Technology, 71(June), pp.179–
187.
Aked, J., 2000. Fruits and Vegetables. In D. Kilcast & P. Subramaniam, eds. The
Stability and Shelf-life of Food. Boca Raton/Boston/New York/Washington DC:
CRC Press, pp. 249–273.
Al-Sulaiman, F., 2000. Mechanical Properties of Date Palm Leaves. Journal of
Reinforced Plastics and Composites, 19, pp.1379–1388.
Allende, A. et al., 2004. Microbial and quality changes in minimally processed baby
spinach leaves stored under super atmospheric oxygen and modified
atmosphere conditions. Postharvest Biology and Technology, 33, pp.51–59.
Allende, A. et al., 2008. Role of commercial sanitizers and washing systems on
epiphytic microorganisms and sensory quality of fresh-cut escarole and lettuce.
Postharvest Biology and Technology, 49, pp.155–163.
Almualla, N. a et al., 2010. Aspects of the microbiological quality and safety of ready-
to-eat foods in Sharjah supermarkets in the United Arab Emirates. Journal of

195
food protection, 73(7), pp.1328–31. Available at:
http://www.ncbi.nlm.nih.gov/pubmed/20615347.
Ames, B.N., Shigenaga, M.K. & Hagen, T.M., 1993. Oxidants, antioxidants, and the
degenerative diseases of aging. Proceedings of the National Academy of
Sciences of the United States of America, 90(17), pp.7915–7922.
Anderson, A.S. et al., 1998. Take Five, a nutrition education intervention to increase
fruit and vegetable intakes: impact on attitudes towards dietary change. British
Journal of Nutrition, 80(2), pp.133–140.
Anderson, S.S., Franco, B.D.G.M. & Schaffner, D.W., 2014. Risk of infection with
Salmonella and Listeria monocytogenes due to consumption of ready-to-eat
leafy vegetables in Brazil. Food Control, 42, pp.1–8. Available at:
http://dx.doi.org/10.1016/j.foodcont.2014.01.028.
Andrich, G. et al., 1991. A Tentative Model to Describe the Respiration of Stored
Apples. , 116(4), pp.478–481.
Andrich, G. et al., 1998. Aerobic respiration rate of Golden Delicious apples as a
function of temperature and P O 2. , 14, pp.1–9.
Aranwela, N., Sanson, G. & Read, J., 1999. Methods of assessing leaf-fracture
properties. New Phytologist, 144, pp.369–393.
Artes-Hernandez, F. et al., 2009. Effect of UV-C radiation on quality of minimally
processed spinach leaves. Journal of the Science of Food and Agriculture,
89(December 2008), pp.414–421.
Ávila, a F. et al., 2007. Food mechanics: a new device for testign fruits and
196
vegetables. Journal of the Brazilian Society of Mechanical Sciences and
Engineering, 29(1), pp.1–6.
Aworh, O.C., 2014. Post-harvest Handling, Utilization and Nutritional Value 1st
editio., Abuja, Nigeria: Ibadan University Press.
Ayala, F. et al., 2009. Quality characteristics of minimally processed leek packaged
using different films and stored in lighting conditions. International Journal of
Food Science and Technology, 44, pp.1333–1343.
Babic, I. et al., 1996. Changes in microbial populations spinach on fresh cut. Food
Microbiology, 31, pp.107–119.
Babic, I. & Watada, a. E., 1996. Microbial populations of fresh-cut spinach leaves
affected by controlled atmospheres. Postharvest Biology and Technology, 9(96),
pp.187–193.
Bahnasawy, A.H. et al., 2004. Physical and mechanical properties of some Egyptian
onion cultivars. Journal of Food Engineering, 62(3), pp.255–261.
Barrera, M.J., Blenkinsop, R. & Warriner, K., 2012. The effect of different processing
parameters on the efficacy of commercial post-harvest washing of minimally
processed spinach and shredded lettuce. Food Control, 25(2), pp.745–751.
Available at: http://dx.doi.org/10.1016/j.foodcont.2011.12.013.
Barrett, D.M., Beaulieu, J.C. & Shewfelt, R., 2010. Color, Flavor, Texture, and
Nutritional Quality of Fresh-cut Fruits and Vegetables - Desirable Levels,
Instrumental and Sensory Measurement, and the Effects of Processing. Critical
Reviews in Food Science and Nutrition, 50(917969571), pp.369–389.

197
Barrios, S., Lema, P. & Lareo, C., 2013. Modelling Respiration Rate of Strawberry
(cv. San Andreas) for Modified Atmosphere Packaging Design. International
Journal of Food Properties, 2912(December), p.131209125248000. Available at:
http://www.tandfonline.com/doi/abs/10.1080/10942912.2013.784328.
Bastrash, S. et al., 1993. Optimal Controlled Atmosphere Conditions for Storage of
Broccoli Florets. Journal of Food Science, 58(2).
Beaudry, R.M., 2000. Responses of Horticultural Commodities to Low Oxygen :
Modified Atmosphere Packaging. HortTechnology, 10(September), pp.491–500.
Bech, A.C. et al., 2001. Consumer’s Quality Perception. In Food, People and
Society: a European perspective of consumers’ food choices. Berlin: Springer,
pp. 97–113.
Bergquist, S.Å.M., Gertsson, U.E. & Olsson, M.E., 2006. Influence of growth stage
and postharvest storage on ascorbic acid and carotenoid content and visual
quality of baby spinach (Spinacia oleracea L.). Journal of the Science of Food
and Agriculture, 86(April 2005), pp.346–355.
Berrang, M.E., Brackett, R.E. & Beuchat, L.R., 1990. Microbial, color and textural
qualities of fresh asparagus, broccoli, and cauliflower stored under controlled
atmosphere. Journal of food protection, 53(5), pp.391–395. Available at:
http://europepmc.org/abstract/AGR/FNI90000790.
Bi, X. et al., 2011. High pressure carbon dioxide treatment for fresh-cut carrot slices.
Innovative Food Science and Emerging Technologies, 12(3), pp.298–304.
Available at: http://dx.doi.org/10.1016/j.ifset.2011.04.001.

198
Billy, L. et al., 2008. Relationship between texture and pectin composition of two
apple cultivars during storage. Postharvest Biology and Technology, 47,
pp.315–324.
Bolin, H.R. & Huxsoll, C.C., 1991. Effect of Preparation Procedures and Storage
Parameters on Quality Retention of Salad-cut Lettuce. Journal of Food Science,
56(1), pp.60–62. Available at: http://doi.wiley.com/10.1111/j.1365-
2621.1991.tb07975.x.
Bone, R. et al., 2007. Macular pigment response to a supplement containing meso-
zeaxanthin, lutein and zeaxanthin. Nutrition & Metabolism.
Bourne, M.C. & Comstock, S.H., 1981. Effect of Degree of Compression on Texture
Profile Parameters. Journal of Texture Studies, 12(2), pp.201–216.
Brecht, J.K. et al., 2003. Maintaining optimal atmosphere conditions for fruits and
vegetables throughout the postharvest handling chain. Postharvest Biology and
Technology, 27, pp.87–101.
Brecht, J.K., 1995. Physiology of Lightly Processed Fruits and Vegetables. , 30(1),
pp.18–22.
Van Buren, J.P., 1979. The Chemistry of Texture in Fruits and Vegetables. Journal
of Texture Studies, 10(1979), pp.1–23.
Cameron, A.C., Boylan-Pett, W. & Lee, J., 1989. Design of Modified Atmosphere
Packaging Systems : Modeling Oxygen Concentrations Within Sealed Packages
of Tomato Fruits. Journal of Food Sci, 54(6).
Candel, M.J.J.M., 2001. Consumer’s convenience orientation towards meal
199
preparation: Conceptualization and measurement. Appetite, 36(1), pp.15–28.
Cantwell, M., Hong, G. & Nie, X., 2010. Using tissue ammonia and fermentative
volatile concentrations as indicators of beneficial and stressful modified
atmospheres for leafy and floral vegetables. Acta Horticulturae, 876, pp.165–
172.
Cao, G., Sofic, E. & Prior, R.L., 1996. Antioxidant Capacity of Tea and Common
Vegetables. Journal of Agricultural and Food Chemistry, 44(11), pp.3426–3431.
Caponigro, V. et al., 2010. Variation of microbial load and isual quality of ready-to-
eat salads by vegetable type, season, processor and retailer. Food
Microbiology, 27(8), pp.1071–1077. Available at:
http://dx.doi.org/10.1016/j.fm.2010.07.011.
Cardello, A.. & Schutz, H.G., 2003. The Concept of Food Freshness: Uncovering its
Meaning and Importance to Consumers. In K. . Cadwallader & H. Weenen, eds.
Freshness and Shelf Life of Foods. Washington: American Chemical Society,
pp. 22–41.
Carrasco, E. et al., 2007. Survey of temperature and consumption patterns of fresh-
cut leafy green salads: risk factors for listeriosis. Journal of food protection,
70(10), pp.2407–2412.
Castaner, M. et al., 1999. Browning susceptibility of minimally processed Baby and
Romaine lettuces. European Food Research and Technology, 209, pp.52–56.
Cervera, S.S. et al., 2007. Influence of exposure to light on the sensorial quality of
minimally processed cauliflower. Journal of Food Science, 72(1).
200
Cocetta, G. et al., 2014. Effect of cutting on ascorbic acid oxidation and recycling in
fresh-cut baby spinach (Spinacia oleracea L.) leaves. Postharvest Biology and
Technology, 88, pp.8–16. Available at:
http://dx.doi.org/10.1016/j.postharvbio.2013.09.001.
Conte, a. et al., 2008. Influence of growing periods on the quality of baby spinach
leaves at harvest and during storage as minimally processed produce.
Postharvest Biology and Technology, 50, pp.190–196.
Cox, D.N. et al., 1996. Vegetables and fruit: barriers and opportunities for greater
consumption. Nutrition & Food Science, 96(5), pp.44–47.
Delaquis, P.J. et al., 1999. Effect of warm, chlorinated water on the microbial flora of
shredded iceberg lettuce. Food Research International, 32(1), pp.7–14.
Dermesonluoglu, E. et al., 2015. Kinetic study of quality indices and shelf life
modelling of frozen spinach under dynamic conditions of the cold chain. Journal
of Food Engineering, 148, pp.13–23. Available at:
http://dx.doi.org/10.1016/j.jfoodeng.2014.07.007.
Desmet, M., Van Linden, V., et al., 2004. Instrumented sphere prediction of tomato
stem-puncture injury. Postharvest Biology and Technology, 34, pp.81–92.
Desmet, M. et al., 2002. Mechanical Properties of Tomatoes as Related to Punture
Injury Susceptibility. , 33(0), pp.415–429.
Desmet, M., Lammertyn, J., et al., 2004. The relative influence of stem and fruit
properties on stem puncture injury in tomatoes. Postharvest Biology and
Technology, 33, pp.101–109.
201
Deza-Durand, K.M. & Petersen, M.A., 2014. Volatile compounds of modified
atmosphere packaged cut iceberg lettuce: Effect of extremely low O2, season,
cultivar and storage time. Food Research International, 62, pp.254–261.
Available at: http://dx.doi.org/10.1016/j.foodres.2014.02.017.
Diehl, K.C., Hamann, D.D. & Whitfield, J.K., 1980. Structural Failure in Selected Raw
Fruits and Vegetables. Journal of Texture Studies, 10(4), pp.371–400.
Diezma, B. et al., 2013. Examination of the quality of spinach leaves using
hyperspectral imaging. Postharvest Biology and Technology, 85, pp.8–17.
Available at: http://dx.doi.org/10.1016/j.postharvbio.2013.04.017.
Dinnella, C. et al., 2014. An exploratory study of sensory attributes and consumer
traits underlying liking for and perceptions of freshness for ready to eat mixed
salad leaves in Italy. Food Research International, 59, pp.108–116. Available at:
http://dx.doi.org/10.1016/j.foodres.2014.02.009.
Du, C.-J. & Sun, D.-W., 2005. Pizza sauce spread classification using colour vision
and support vector machines. Journal of Food Engineering, 66(April), pp.137–
145. Available at:
http://www.sciencedirect.com/science/article/pii/S0260877404001062.
Duodu, K.G., Minnaar, a. & Taylor, J.R.N., 1999. Effect of cooking and irradiation on
the labile vitamins and antinutrient content of a traditional African sorghum
porridge and spinach relish. Food Chemistry, 66, pp.21–27.
Durand, K.M.D., 2013. Factors important for the shelf-life of minimally processed
lettuce. Available at:
http://curis.ku.dk/ws/files/45261643/THESIS_Factors_important_for_the_shelf_li
202
fe_of_minimally_pro.pdf.
Emadi, B., Abbaspour-Fard, M.H. & Kdv Yarlagadda, P., 2009. Mechanical
properties of melon measured by compression, shear, and cutting modes.
International Journal of Food Properties, 12(4), pp.780–790.
Emadi, B., Kosse, V. & Yarlagadda, P.K., 2005. Mechanical properties of pumpkin.
International Journal of Food Properties, 8(2), pp.277–287.
Enloe, A., 2018. The 14 Healthiest Leafy Green Vegetables. Healthline. Available at:
https://www.healthline.com/nutrition/leafy-green-vegetables [Accessed October
25, 2018].
Escalona, V.H. et al., 2006. Changes in respiration of fresh-cut butterhead lettuce
under controlled atmospheres using low and superatmospheric oxygen
conditions with different carbon dioxide levels. Postharvest Biology and
Technology, 39(1), pp.48–55. Available at:
http://linkinghub.elsevier.com/retrieve/pii/S0925521405001936 [Accessed
February 8, 2014].
Falk, S. et al., 1958. On the Relation between Turgor Pressure and Tissue Rigidity.
II: Theoretical Calculations on Model Systems. Physiologia Plantarum, 11,
pp.818–837.
Fan, D. et al., 2014. Pre-harvest treatment of spinach with Ascophyllum nodosum
extract improves post-harvest storage and quality. Scientia Horticulturae, 170,
pp.70–74. Available at: http://dx.doi.org/10.1016/j.scienta.2014.02.038.
Femia, Our machines-Femia Industrie. Available at: http://www.femia.fr/en/our-

203
machines_34/3/index.html [Accessed August 27, 2015].
Fernanda, M., Durigan, B. & Mattiuz, B., 2007. Efeito de injúrias mecânicas na
qualidade de abobrinhas armazenadas. , pp.291–295.
Fernando Reyes, L., Emilio Villarreal, J. & Cisneros-Zevallos, L., 2006. The increase
in antioxidant capacity after wounding depends on the type of fruit or vegetable
tissue. Food Chemistry, 101(3), pp.1254–1262.
Ferrante, A. et al., 2004. Colour changes of fresh-cut leafy vegetables during
storage. Journal of Food Agriculture Environment, 2, pp.40–44.
Fillion, L. & Kilcast, D., 2000. Concept and measurement of freshness of fruits and
vegetables. Leatherhead Food RA Research Reports, 770.
Fonseca, S.C. et al., 2000. Modelling O2 and CO2 exchange for development of
perforation-mediated modified atmosphere packaging. Journal of Food
Engineering, 43(1), pp.9–15.
Fonseca, S.C., Oliveira, F. a R., Frias, J.M., et al., 2002. Modelling respiration rate of
shredded Galega kale for development of modified atmosphere packaging.
Journal of Food Engineering, 54, pp.299–307.
Fonseca, S.C. et al., 2002. Modelling respiration rate of shredded Galega kale for
development of modified atmosphere packaging. Journal of Food Engineering,
54(4), pp.299–307.
Fonseca, S.C., Oliveira, F. a R. & Brecht, J.K., 2002. Modelling respiration rate of
fresh fruits and vegetables for modified atmosphere packages: A review. Journal
of Food Engineering, 52, pp.99–119.
204
Furness, D. et al., 2013. Folate, vitamin B12, vitamin B6 and homocysteine: impact
on pregnancy outcome. Maternal & Child Nutrition, 9(2).
García-Gimeno, R.M. & Zurera-Cosano, G., 1997. Determination of ready-to-eat
vegetable salad shelf-life. International Journal of Food Microbiology, 36, pp.31–
38.
Garcia, A., Mount, J.R. & Davidson, P.M., 2003. Ozone and Chlorine Treatment of
Minimally Processed Lettuce. Journal of Food Science, 68(9), pp.2747–2751.
Gardial, S.F. et al., 1994. Comparing Consumers’ Recall of Prepurchase and
Postpurchase Product Evaluation Experiences. Journal of Consumer Research,
20(4), pp.548–560.
Gil, M.I., Aguayo, E. & Kader, A.A., 2006. Quality changes and nutrient retention in
fresh-cut versus whole fruits during storage. Journal of Agricultural and Food
Chemistry, 54(12), pp.4284–4296.
Gilbert, L.., 2000. The functional food trend: what’s next and what Americans think
about eggs. Journal of the American Collegeof Nutrition, 19(5), p.507S–512S.
Giménez, A., Ares, F. & Ares, G., 2012. Sensory shelf-life estimation: A review of
current methodological approaches. Food Research International, 49(1),
pp.311–325. Available at: http://dx.doi.org/10.1016/j.foodres.2012.07.008.
Glowacz, M. et al., 2015. High- but not low-intensity light leads to oxidative stress
and quality loss of cold-stored baby leaf spinach. Journal of the science of food
and agriculture, 95(August), pp.1821–9. Available at:
http://www.ncbi.nlm.nih.gov/pubmed/25138063.

205
Golmohammadi, A., 2013. Determination of mechanical properties of potato flesh
during storage. , pp.1273–1278.
Gomes, C., Moreira, R.G. & Castell-Perez, E., 2011a. Microencapsulated
Antimicrobial Compounds as a Means to Enhance Electron Beam Irradiation
Treatment for Inactivation of Pathogens on Fresh Spinach Leaves. Journal of
Food Science, 76(6).
Gomes, C., Moreira, R.G. & Castell-Perez, E., 2011b. Radiosensitization of
Salmonella spp. and Listeria spp. in Ready-to-Eat Baby Spinach Leaves.
Journal of Food Science, 76(1), pp.141–148.
Gómez-López et al., 2013. Postharvest handling conditions affect internalization of
Salmonella in baby spinach during washing. Journal of food protection, 76(7),
pp.1145–51. Available at: http://www.ncbi.nlm.nih.gov/pubmed/23834788.
Gómez-López, V.M. et al., 2013. Generation of trihalomethanes with chlorine-based
sanitizers and impact on microbial, nutritional and sensory quality of baby
spinach. Postharvest Biology and Technology, 85, pp.210–217. Available at:
http://dx.doi.org/10.1016/j.postharvbio.2013.05.012.
Gonzalez, A.R. et al., 1988. EFFECT OF LEAF TYPE, LEAF INJURY, STORAGE
TEMPERATURE AND WASHING SOLUTION ON ETHYLENETHIOUREA
RESIDUES OF CARBAMATE‐TREATED CANNED SPINACH. Journal of Food
Safety, 9(3), pp.155–164.
Grotte, M. et al., 2001. Mechanical properties of the skin and the flesh of apples.
International Journal of Food Properties, 4(1), pp.149–161.

206
Grunert, K.G., Brunso, K. & Bisp, S., 1993. Food-related life style. Development of a
cross-culturally valid instrument for market surveillance. MAPP Working Paper,
12(10), pp.1–44.
Gutiérrez-Rodríguez, E. et al., 2013. Texture, composition and anatomy of spinach
leaves in relation to nitrogen fertilization. Journal of the Science of Food and
Agriculture, 93, pp.227–237.
Hagger, P.., Lee, D.. & Yam, K.., 1992. APPLICATION OF AN ENZYME KINETICS
BASED RESPIRATION MODEL TO CLOSED SYSTEM EXPERIMENTS FOR
FRESH PRODUCE. Journal of Food Process, 15(908), pp.143–157.
Hamza, F., Castaignei, F. & Doyon, G., 1995. STORAGE OF MINIMALLY
PROCESSED ROMAINE LETTUCE UNDER CONTROLLED ATMOSPHERE. ,
19(1996), pp.177–188.
Hartley, L. et al., 2013. Increased consumption of fruit and vegetables for the primary
prevention of cardiovascular diseases. Cochrane Database Systematic
Reviews, (6).
Heaton, J.W. & Marangoni, A.G., 1996. Chlorophyll degradation in processed foods
and senescent plant tissues. Trends in Food Science and Technology, 7(1),
pp.8–15.
Heenan, S.P. et al., 2009. Consumer freshness perceptions of breads, biscuits and
cakes. Food Quality and Preference, 20(5), pp.380–390. Available at:
http://dx.doi.org/10.1016/j.foodqual.2009.02.008.
Heimdal, H. et al., 1995. Biochemical Changes and Sensory Quality of Shredded

207
and MA‐Packaged Iceberg Lettuce. Journal of Food Science, 60(6), pp.1265–
1268.
Hertog, M.L.A.T.M. et al., 1998. A dynamic and generic model of gas exchange of
respiring produce : the effects of oxygen , carbon dioxide and temperature. , 14,
pp.335–349.
Hiller, S. & Jeronimidis, G., 1996. Fracture in potato tuber parenchyma. Journal of
Materials Science, 31, pp.2779–2796. Available at:
http://dx.doi.org/10.1007/BF00355984.
Hodges, D.M. et al., 2004. Oxidative stress: Importance for postharvest quality.
HortScience, 39(5), pp.924–929.
Hodges, D.M. & Forney, C.F., 2003. Postharvest ascorbate metabolism in two
cultivars of spinach differing in their senescence rates. Journal of the American
Society for Horticultural Science, 128(6), pp.930–935.
Hodges, D.M., Forney, C.F. & Wismer, W., 2000. Processing line effects on storage
attributes of fresh-cut spinach leaves. HortScience, 35(7), pp.1308–1311.
Holt, C.B., 1970. Measurement of Tomato Firmness With a Universal Testing
Machine. Journal of Texture Studies, 1(4), pp.491–501.
Holt, J.. & Schoorl, D., 1977. Bruising a n d energy dissipation in apples. Journal of
Textures Studies, 7, pp.421–432.
Holt, J.. & Schoorl, D., 1982. Strawberry Bruising and Energy Dissipation. Journal of
Texture Studies, 13(3), pp.349–357.
208
Holt, J.E. & Schoorl, D., 1982. Mechanics of Failure in Fruits and Vegetables.
Journal of Texture Studies, 13, pp.83–96.
Hu, H. et al., 2015. Hydrogen sulfide delays leaf yellowing of stored water spinach
(Ipomoea aquatica) during dark-induced senescence by delaying chlorophyll
breakdown, maintaining energy status and increasing antioxidative capacity.
Postharvest Biology and Technology, 108, pp.8–20. Available at:
http://dx.doi.org/10.1016/j.postharvbio.2015.05.003.
Hu, X. et al., 2005. Nondestructive Determination Method of Fruit Quantity Detection
Based on Vis/NIR Spectroscopy Technique. Conference proceedings : ...
Annual International Conference of the IEEE Engineering in Medicine and
Biology Society. IEEE Engineering in Medicine and Biology Society.
Conference, 2, pp.1956–9. Available at:
http://www.ncbi.nlm.nih.gov/pubmed/17282605.
Hu, Y. et al., 2013. Building kinetic models for determining vitamin C content in fresh
jujube and predicting its shelf life based on near-infrared spectroscopy. Sensors
(Switzerland), 13(11), pp.15673–15681.
Ibarz, A., Pagán, J. & Garza, S., 2000. Kinetic models of non-enzymatic browning in
apple puree. Journal of the Science of Food and Agriculture, 80(8), pp.1162–
1168.
Instruments, N.S., Elastic Modulus. Available at:
http://www.nanoscience.com/technology/mechanical-testing-
technology/mechanical-properties/elastic-modulus/ [Accessed January 3, 2017].
IRI, 2016. Sales of green vegetables and soft fruits soar as UK consumers get the

209
blending and juicing bug. Available at: https://www.iriworldwide.com/en-
GB/insights/news/Sales-of-green-vegetables-and-soft-fruits-soar-as [Accessed
February 14, 2017].
Izumi, H., Watada, A.E. & Ko, N.P., 1995. Quality changes in carrot slices, sticks and
shreds stored at various temperatures. Food Science and Technology
International, 1, pp.71–73.
Jackman, R.L. & Stanley, D.W., 1994. Influence of the Skin on Puncture Properties
of Chilled and Nonchilled Tomato Fruit. Journal of Texture Studies, 25(2),
pp.221–230.
Jacxsens, L. et al., 2000. Designing Equilibrium Modified Atmosphere Packages for
Fresh-cut Vegetables Subjected to Changes in Temperature. LWT - Food
Science and Technology, 33, pp.178–187. Available at:
http://www.sciencedirect.com/science/article/pii/S002364380090639X.
Jacxsens, L. et al., 2001. Effect of high oxygen modified atmosphere packaging on
microbial growth and sensorial qualities of fresh-cut produce. International
Journal of Food Microbiology, 71, pp.197–210.
Jensen, A., 2017. Baby Spinach Nutrition Information. Livestrong.com. Available at:
https://www.livestrong.com/article/557186-baby-spinach-vs-lettuce/ [Accessed
April 20, 2018].
Jo, Y.H., An, D.S. & Lee, D.S., 2014. Active air flushing in a sensor-controlled fresh
produce container system to maintain the desired modified atmosphere.
Biosystems Engineering, 125, pp.122–127. Available at:
http://dx.doi.org/10.1016/j.biosystemseng.2014.07.003.
210
Jolliffe, P.A. & Lin, W.C., 1997. Predictors of Shelf Life in Long English Cucumber. J.
Amer. Soc. Hort Sci., 122, pp.686–690.
Jung, Y.J. et al., 2012. Consumer freshness perception of spinach samples exposed
to different storage conditions. Postharvest Biology and Technology, 73,
pp.115–121. Available at: http://dx.doi.org/10.1016/j.postharvbio.2012.06.005.
Kader, A.A., 2002. Quality parameters of fresh-cut fruit and vegetable products. In O.
Lamikanra, ed. Fresh-cut Fruits and Vegetables. Boca Raton, FL: CRC Press.
Kader, A. & Saltveit, M., 2003. Respiration and gas exchange. In J. Bartz & J.
Brecht, eds. Postharvest Physiology and Pathology of Vegetables. New York,
USA: Marcel Dekker Inc., pp. 7–32.
Kader, a a, Zagory, D. & Kerbel, E.L., 1989. Modified atmosphere packaging of
fruits and vegetables. Critical reviews in food science and nutrition, 28, pp.1–30.
Karaca, H. & Velioglu, Y.S., 2014. Effects of ozone treatments on microbial quality
and some chemical properties of lettuce, spinach, and parsley. Postharvest
Biology and Technology, 88, pp.46–53. Available at:
http://dx.doi.org/10.1016/j.postharvbio.2013.09.003.
Karathanos, V. et al., 2006. Color Degradation of Beans During Storage.
International Journal of Food Properties, 9(April), pp.61–71.
Kaur, P., Rai, D.R. & Paul, S., 2011. Quality changes in fresh-cut spinach (spinacia
oleracea) under modified atmospheres with perforations. Journal of Food
Quality, 34, pp.10–18.
Kays, S.J., 1991. Postharvest Physiology of Perishable Plant Products, New York:
211
Van Nostrand Reinhold.
Kemp, S.E., Hollowood, T. & Hort, J., 2009. Sensory Evaluation: A Practical
Handbook, West Sussex, United Kingdom: A John Wiley & Sons, Ltd.,
Publication.
Khaliq, A., 2014. 13 Health Benefits of Popeye Magic Food-Spinach. Onlymyhealth.
Available at: https://www.onlymyhealth.com/health-slideshow/health-benefits-of-
aloe-vera-1388128174.html [Accessed March 2, 2017].
Kim, J.G., Luo, Y. & Gross, K.C., 2004a. Effect of package film on the quality of
fresh-cut salad savoy. Postharvest Biology and Technology, 32, pp.99–107.
Kim, J.G., Luo, Y. & Gross, K.C., 2004b. Effect of package film on the quality of
fresh-cut salad savoy. Postharvest Biology and Technology, 32(1), pp.99–107.
Available at: http://linkinghub.elsevier.com/retrieve/pii/S0925521403002254
[Accessed February 8, 2014].
King, A. et al., 1991. Microbial flora and spoilage of partially processed lettuce.
Journal of Food Science, 56(2), pp.459–461.
Kirkin, C. et al., 2014. Combined effects of gamma-irradiation and modified
atmosphere packaging on quality of some spices. Food Chemistry, 154,
pp.255–261. Available at: http://dx.doi.org/10.1016/j.foodchem.2014.01.002.
Klockow, P. a. & Keener, K.M., 2009. Safety and quality assessment of packaged
spinach treated with a novel ozone-generation system. LWT - Food Science and
Technology, 42(6), pp.1047–1053. Available at:
http://dx.doi.org/10.1016/j.lwt.2009.02.011.

212
Ko, N. et al., 1996. Storage of Spinach Under Low Oxygen Atmosphere Above the
Extinction Point. Journal of Food Science, 61(2), pp.398–400.
Kou, L. et al., 2014. Open-refrigerated retail display case temperature profile and its
impact on product quality and microbiota of stored baby spinach. Food Control,
47, pp.686–692. Available at: http://dx.doi.org/10.1016/j.foodcont.2014.07.054.
Kou, L. et al., 2014. Temperature abuse timing affects the rate of quality
deterioration of commercially packaged ready-to-eat baby spinach. Part I:
Sensory analysis and selected quality attributes. Postharvest Biology and
Technology, 91, pp.96–103. Available at:
http://dx.doi.org/10.1016/j.postharvbio.2013.12.025.
Kruse, O.M.O. et al., 2014. Pixel classification methods for identifying and
quantifying leaf surface injury from digital images. Computers and Electronics in
Agriculture, 108, pp.155–165. Available at:
http://dx.doi.org/10.1016/j.compag.2014.07.010.
Kwon, M.J., An, D.S. & Lee, D.S., 2013. Modified atmosphere container with time-
controlled gas-diffusion tube for preserving fresh produce. Journal of Food
Process Engineering, 36, pp.694–703.
Labuza, P., 1979. A Theoretical Comparison of Losses in Foods Under Fluctuating
Temperature Sequences. Journal of Food Science, 44(1162).
Lacroix, M. & Lafortune, R., 2004. Combined effects of gamma irradiation and
modified atmosphere packaging on bacterial resistance in grated carrots
(Daucus carota). Radiation Physics and Chemistry, 71, pp.77–80.
213
Lakakul, R., Beaudry, R.M. & Hernandez, R.J., 1999. Modeling Respiration of Apple
Slices in Modified-Atmosphere Packages. , 64(1), pp.105–110.
Lambert, N., 2001. Food Choice, Phytochemicals and Cancer Prevention. In Food,
People and Society: a European perspective of consumers’ food choices. Berlin:
Springer, pp. 131–154.
Lau, M.H., Tang, J. & Swanson, B.G., 2000. Kinetics of textural and color changes in
green asparagus during thermal treatments. Journal of Food Engineering, 45,
pp.231–236.
Lazou, A. et al., 2011. Lentil-based snacks: Structural and textural evaluation.
Procedia Food Science, 1, pp.1593–1600. Available at:
http://dx.doi.org/10.1016/j.profoo.2011.09.236.
Leather, S., 1995. Fruit and vegetables: consumption patterns and health
consequences. British Food Journal, 97(7), pp.10–17.
Lee, D.S. & Yam, K.L., 1996. Application of an Enzyme Kinetics Based Respiration
Model to Permeable System Experiment of Fresh Produce. , 27, pp.297–310.
Lee, S.K. & Kader, A.A., 2000. Preharvest and postharvest factors influencing
vitamin C content of horticultural crops. Postharvest Biology and Technology,
20(3), pp.207–220.
Lee, S.Y. & Baek, S.Y., 2008. Effect of chemical sanitizer combined with modified
atmosphere packaging on inhibiting Escherichia coli O157:H7 in commercial
spinach. Food Microbiology, 25, pp.582–587.
León, K. et al., 2006. Color measurement in L*a*b* units from RGB digital images.

214
Food Research International, 39, pp.1084–1091.
Lester, G.E., Makus, D.J. & Mark Hodges, D., 2010. Relationship between fresh-
packaged spinach leaves exposed to continuous light or dark and bioactive
contents: Effects of cultivar, leaf size, and storage duration. Journal of
Agricultural and Food Chemistry, 58, pp.2980–2987.
Li, X. et al., 2009. Respiration Rate Models of Agaricus bisporus under Modified
Atmosphere Packaging. International Journal of Food Engineering, 5(4), pp.1–
13.
Lim, P.O. & Nam, H.G., 2007. Aging and senescence of the leaf organ. Journal of
Plant Biology, 50(3), pp.291–300.
Løkke, M.M., 2012. Postharvest quality changes of leafy green vegetables PhD
thesis by. , (March).
Lu, S., 2007. Effect of packaging on shelf-life of minimally processed Bok Choy
(Brassica chinensis L.). LWT - Food Science and Technology, 40(3), pp.460–
464.
Lucas, P.W. et al., 1991. The Fracture Toughness of the Leaf of the Dicotyledon
Calophyllum inophyllum L. (Guttiferae). Philosophical Transactions of the Royal
Society B: Biological Sciences, 334(January 2016), pp.95–106.
Lucera, a. et al., 2011. Fresh-cut broccoli florets shelf-life as affected by packaging
film mass transport properties. Journal of Food Engineering, 102(2), pp.122–
129. Available at: http://dx.doi.org/10.1016/j.jfoodeng.2010.08.004.
Luengo, R.D.F.A., Calbo, A.G. & Jacomino, Â.P., 2008. Vegetable crops deformation

215
assays for package height definition: a new approach. Ciência e Agrotecnologia,
32, pp.180–185. Available at:
http://www.scielo.br/scielo.php?script=sci_arttext&pid=S1413-
70542008000100026&lng=en&nrm=iso&tlng=en.
Lunadei, L. et al., 2012. Monitoring of fresh-cut spinach leaves through a
multispectral vision system. Postharvest Biology and Technology, 63(1), pp.74–
84. Available at: http://dx.doi.org/10.1016/j.postharvbio.2011.08.004.
Lund, C.M. et al., 2006. Tradeoffs between emotional and sensory perceptions of
freshness influence the price consumers will pay for apples: Results from an
experimental market. Postharvest Biology and Technology, 41(2), pp.172–180.
Luzuriaga, D.A., Balaban, M.O. & Yeralan, S., 1997. Analysis of Visual Quality
Attributes of White Shrimp by Machine Vision. Journal of Food Science, 62(1),
pp.113–118. Available at: http://dx.doi.org/10.1111/j.1365-2621.1997.tb04379.x.
Mangaraj, S. & Goswami, T.K., 2011a. Measurement and Modeling of Respiration
Rate of Guava (CV. Baruipur) for Modified Atmosphere Packaging. International
Journal of Food Properties, 14(April 2015), pp.609–628.
Mangaraj, S. & Goswami, T.K., 2011b. Modeling of Respiration Rate of Litchi Fruit
under Aerobic Conditions. Food and Bioprocess Technology, 4, pp.272–281.
Marques, S., Postharvest management of vegetables: Structure and Composition.
Resources for Australian Supply Chain. Available at:
http://www.postharvest.net.au/postharvest-fundamentals/vegetable-
physiology/structure-and-composition/ [Accessed April 29, 2018].

216
Marshall, D. et al., 1994. Healthy eating: fruit and vegetables in Scotland. British
Food Journal, 96(7), pp.18–24.
Martinez-Hernandez, G.B. et al., 2013. Combination of electrolysed water, UV-C and
superatmospheric O2 packaging for improving fresh-cut broccoli quality.
Postharvest Biology and Technology, 76, pp.125–134. Available at:
http://dx.doi.org/10.1016/j.postharvbio.2012.09.013.
Martinez-Sanchez, A. et al., 2011. Low oxygen levels and light exposure affect
quality of fresh-cut Romaine lettuce. Postharvest Biology and Technology, 59,
pp.34–42.
Martínez-Sánchez, A. et al., 2006. Controlled atmosphere preserves quality and
phytonutrients in wild rocket (Diplotaxis tenuifolia). Postharvest Biology and
Technology, 40, pp.26–33.
McGill, J.N., Nelson, A.I. & Steinberg, M.., 1996. Effects of Modified Storage
Atmosphere on Ascorbic Acid and Other Quality Characteristics of Spinach.
Journal of Food Science, 31(4).
McGlasson, W.., 1969. Ethylene production by slices of green banana fruit and
potato tuber tissue during the development of induced respiration. Australian
Journal of Biological Science, 22, pp.249–253.
Mclaughlin, C.P. & Beirne, D.O., 1999. Respiration Rate of a Dry Coleslaw Mix as
Affected by Storage Temperature and. , 64(1), pp.2–5.
Medina, M.S. et al., 2012. Short postharvest storage under low relative humidity
improves quality and shelf life of minimally processed baby spinach (Spinacia
217
oleracea L.). Postharvest Biology and Technology, 67, pp.1–9. Available at:
http://dx.doi.org/10.1016/j.postharvbio.2011.12.002.
Mendoza, F., Dejmek, P. & Aguilera, J.M., 2006. Calibrated color measurements of
agricultural foods using image analysis. Postharvest Biology and Technology,
41, pp.285–295.
Mery, D. & Pedreschi, F., 2005. Segmentation of colour food images using a robust
algorithm. Journal of Food Engineering, 66, pp.353–360.
Mohsenin, N.N., 1977. Characterisation and failure in solid foods with particular
reference to fruits and vegatables. Journal of Texture Studies, 8(1977), pp.169–
193.
Morales, M.A. et al., 2001. Differences in water relations, leaf ion accumulation and
excretion rates between cultivated and wild species of Limonium sp. grown in
conditions of saline stress. Flora, 196(5), pp.345–352.
More, P.G., Kakade, a. S. & Khodke, S.U., 2014. Mechanical Properties of Spinach.
IOSR Journal of Agriculture and Veterinary Science, 7(4), pp.57–61. Available
at: http://www.iosrjournals.org/iosr-javs/papers/vol7-issue4/Version-
1/L07415761.pdf.
Morris, M. et al., 2018. Nutrients and bioactives in green leafy vegetables and
cognitive decline: Prospective study. Neurology, 90(3).
Nabil, S. a N., Azam, M.M. & Amer Eissa, a H., 2012. Mechanical properties of
tomato fruits under storage conditions. Journal of Applied Sciences Research,
8(JUNE 2012), pp.3053–3064. Available at:
218
http://www.scopus.com/inward/record.url?eid=2-s2.0-
84865556397&partnerID=40&md5=315ca06eb1b7becd54535fed45c838e4.
Neal, J. a. et al., 2010. Shelf life and sensory characteristics of baby spinach
subjected to electron beam irradiation. Journal of Food Science, 75(6).
Newman, J.M. et al., 2005. The mechanical properties of lettuce: A comparison of
some agronomic and postharvest effects. Journal of Materials Science, 40,
pp.1101–1104. Available at: http://link.springer.com/10.1007/s10853-005-6923-
3.
Ng, P.J., Fleet, G.H. & Heard, G.M., 2005. Pesticides as a source of microbial
contamination of salad vegetables. International Journal of Food Microbiology,
101, pp.237–250.
Niemira, B.A. & Fan, X., 2006. Low Dose Irradiation of Fresh and Fresh-cut Produce:
Safety, Sensory, and Shelf life. In C. H. Sommers & X. Fan, eds. Food
Irradiation Research and Technology. Ames, Iowa: Blackwell Publishing and the
Institute of Food Technologists, pp. 169–184.
Del Nobile, M.A. et al., 2009. A study on quality loss of minimally processed grapes
as affected by film packaging. Postharvest Biology and Technology, 51(1),
pp.21–26.
Odumeru, J.. et al., 2002. Assessment of a thermal-chemical process to extend the
shelf life of ready-to-use lettuce. Journal of Food Quality, 26, pp.197–209.
Odumeru, J. a et al., 2003. Assessment of a Wash Treatment With Warm
Chlorinated Water To Extend the Shelf–Life of Ready–To–Use Lettuce. Journal
219
of Food Quality, 26(519), pp.197–209. Available at:
http://dx.doi.org/10.1111/j.1745-4557.2003.tb00238.x.
Oliveira, M. et al., 2010. Effects of packaging type and storage temperature on the
growth of foodborne pathogens on shredded “Romaine” lettuce. Food
Microbiology, 27, pp.375–380.
Oyen, M.L., 2006. Nanoindentation hardness of mineralized tissues. Journal of
Biomechanics, 39, pp.2699–2702.
Pan, X.C. & Sasanatayart, R., 2016. Effect of plastic films with different oxygen
transmission rate on shelf-life of fresh-cut bok choy (Brassica rapa var.
chinensis). International Food Research Journal, 23(5), pp.1865–1871.
Pandrangi, S. & Laborde, L.F., 2004. Retention of Folate , Carotenoids , and Other
Quality Characteristics in Commercially Packaged Fresh Spinach. Journal of
Food Science, 69(9).
Papadakis, S.E. et al., 2000. A Versatile and Inexpensive Technique for Measuring
Color of Foods. Food Technology, 54, pp.48–51.
Patel, E. & Owen, C.P., 2016. The use of textural analysis to test the hardness and
penetrability of three types of gutta percha cones when exposed to two
endodontic solvents. , pp.346–350.
Pedreschi, F. et al., 2005. Color changes and acrylamide formation in fried potato
slices. Food Research International, 38(1), pp.1–9.
Pedreschi, F. et al., 2006. Development of a computer vision system to measure the
color of potato chips. Food Research International, 39, pp.1092–1098.

220
Peleg, M., Brito, L.G. & Malevski, Y., 1976. Compressive Failure Patterns of Some
Juicy Fruits. Journal of Food Science, 41(6), pp.1320–1324.
Peneau, S. et al., 2009. Freshness of fruits and vegetables: Consumer language and
perception. British Food Journal, 111(3), pp.243–256.
Péneau, S. et al., 2007. A comprehensive approach to evaluate the freshness of
strawberries and carrots. Postharvest Biology and Technology, 45(1), pp.20–29.
Péneau, S. et al., 2006. Importance and consumer perception of freshness of
apples. Food Quality and Preference, 17(1–2), pp.9–19.
Peng, J. et al., 2014. Kinetics of carrot texture degradation under pasteurization
conditions. Journal of Food Engineering, 122(February), pp.84–91.
Peppelenbos, H.W. & van’t Leven, J., 1996. Evaluation of four types of inhibition for
modelling the influence of carbon dioxide on oxygen consumption of fruits and
vegetables. Postharvest Biology and Technology, 7(1–2), pp.27–40.
Piagentini, A.., Guemes, D.. & Pirovani, M.., 2002. Sensory Characteristics of Fresh-
Cut Spinach by Combined Factors Methodology. Journal of Food Science,
67(4), pp.1544–1549.
Piagentini, A.M. & Güemes, D.R., 2002. Shelf life of fresh-cut spinach as affected by
chemical treatment and type of packaging film. Brazilian Journal of Chemical
Engineering, 19(4), pp.383–389. Available at:
http://www.scielo.br.ezproxy.library.wur.nl/pdf/bjce/v19n4/13378.pdf.
Piagentini, A.M., Guemes, D.R. & Pirovani, M.E., 2003. Mesophilic Aerobic
Population of Fresh- cut Spinach as Affected by Chemical Treatment and Type

221
of Packaging Film. Food Microbiology and Safety, 68(2), pp.1–6.
Piagentini, a. M. & Güemes, D.R., 2002. Shelf life of fresh-cut spinach as affected
by chemical treatment and type of packaging film. Brazilian Journal of Chemical
Engineering, 19(4), pp.383–389.
Pirovani, M.E. et al., 1997. Storage Quality of Minimally Processed Cabbage
Packaged in Plastic Films. , 20, pp.381–389.
Pirovani, M.E., Guemes, D.R. & Piagnetini, a M., 2001. Predictive models for
available chlorine depletion and total microbial count reduction during washing
of fresh-cut spinach. Journal of Food Science, 66(6), pp.860–864.
Posada-Izquierdo, G.D. et al., 2014. Modeling growth of Escherichia coli O157:H7 in
fresh-cut lettuce treated with neutral electrolyzed water and under modified
atmosphere packaging. International Journal of Food Microbiology, 177, pp.1–8.
Available at: http://dx.doi.org/10.1016/j.ijfoodmicro.2013.12.025.
Posada-Izquierdo, G.D. et al., 2013. Modelling growth of Escherichia coli O157:H7 in
fresh-cut lettuce submitted to commercial process conditions: Chlorine washing
and modified atmosphere packaging. Food Microbiology, 33(2), pp.131–138.
Available at: http://dx.doi.org/10.1016/j.fm.2012.08.010.
Prakash, a. et al., 2000. Effects of low-dose gamma irradiation on the shelf life and
quality characteristics of cut Romaine Lettuce packaged under modified
atmosphere. Journal of food science, 65, pp.549–553. Available at:
http://onlinelibrary.wiley.com/doi/10.1111/j.1365-2621.2000.tb16046.x/abstract.
Ragaert, P. et al., 2004. Consumer perception and choice of minimally processed
222
vegetables and packaged fruits. Food Quality and Preference, 15(3), pp.259–
270.
Rahman, E. a a et al., 2013. Modelling the effect of temperature on respiration rate
of fresh cut papaya (Carica papaya L.) fruits. Food Science and Biotechnology,
22(6), pp.1581–1588.
Ratti, C., Raghavan, G.S. V & Garikpy, Y., 1996. Respiration Rate Model and
Modified Atmosphere Packaging of Fresh Cauliflower. , 28, pp.297–306.
Read, J. & Sanson, G.D., 2003. Characterizing sclerophylly: The mechanical
properties of a diverse range of leaf types. New Phytologist, 160, pp.81–99.
Reddy, M.T. et al., 2014. Preliminary Characterization and Evaluation of Landraces
of Indian Spinach ( Basella spp . L .) for Agro-economic and Quality Traits. ,
2014(1), pp.48–63.
Rezende, A.C.B. et al., 2014. Effect of Gamma Radiation on the Reduction of
Salmonella strains, Listeria monocytogenes, and Shiga Toxin-Producing
Escherichia coli and Sensory Evaluation of Minimally Processed Spinach
(Tetragonia expansa). Journal of Food Protection, 77(10), pp.1768–1772.
Rico, D. et al., 2007. Extending and measuring the quality of fresh-cut fruit and
vegetables: a review. Trends in Food Science and Technology, 18, pp.373–386.
Rizvi, a F. & Tong, C.H., 1997. Fractional Conversion for Determining Texture
Degradation Kinetics of Vegetables. Journal of Food Science, 62(1), pp.1–7.
Available at: http://dx.doi.org/10.1111/j.1365-2621.1997.tb04356.x.
Rocha, A.M.C.N. & Morais, A.M.M.B., 2003. Shelf life of minimally processed apple
223
(cv. Jonagored) determined by colour changes. Food Control, 14(1), pp.13–20.
Rodriguez-Hidalgo, S. et al., 2010. Quality of fresh-cut baby spinach grown under a
floating trays system as affected by nitrogen fertilisation and innovative
packaging treatments. Journal of the Science of Food and Agriculture,
90(March), pp.1089–1097.
De Roeck, A. et al., 2010. Carrot texture degradation kinetics and pectin changes
during thermal versus high-pressure/high-temperature processing: A
comparative study. Food Chemistry, 120(4), pp.1104–1112. Available at:
http://dx.doi.org/10.1016/j.foodchem.2009.11.060.
De Roever, C., 1998. Microbiological safety evaluations and recommendations on
fresh produce. Food Control, 9(6), pp.321–347.
Rolls, G., An Introduction to Speciment Preparation. Leica Biosystems. Available at:
https://www.leicabiosystems.com/pathologyleaders/an-introduction-to-specimen-
preparation/ [Accessed June 4, 2015].
Roura, S.I., Davidovich, L.A. & Del Valle, C.E., 2000. Quality Loss in Minimally
Processed Swiss Chard Related to Amount of Damaged Area. LWT - Food
Science and Technology, 33(1), pp.53–59.
Sadrnia, H. et al., 2008. Internal bruising prediction in watermelon compression
using nonlinear models. Journal of Food Engineering, 86(2), pp.272–280.
Saenmuang, S., Al-Haq, M.I., Samarakoon, H.C., et al., 2012. Evaluation of Models
for Spinach Respiratory Metabolism Under Low Oxygen Atmospheres. Food
and Bioprocess Technology, 5(July), pp.1950–1962.
224
Saenmuang, S., Al-Haq, M.I., Makino, Y., et al., 2012. Particle size distribution of
nano-mist in a spinach-storage atmosphere and its effect on respiration and
qualities. Journal of Food Engineering, 112(1–2), pp.69–77. Available at:
http://dx.doi.org/10.1016/j.jfoodeng.2012.03.026.
Salisbury, F.. & Ross, C.., 1992. Plant Physiology, Hormones and Plant Regulator
4th editio. A. and Gibberellins, ed., Belmont: Wadsworth Publishing.
Saltveit, M., 2003. A summary of CA requirements and recommendations for
vegetables. In J. O. & H. W. Peppelenbos, ed. 8th Int. CA Conference.
University of California, Davis.
Santos, M.I.S. et al., 2015. Potential bio-activity of whey fermented extract as
sanitizer of organic grown lettuce. Food Control, 50, pp.477–481. Available at:
http://dx.doi.org/10.1016/j.foodcont.2014.09.032.
Schlimme, D. V, 1995. Marketing Lightly Processed Fruits and Vegetables. , 30(1),
pp.15–17.
Semba, R. & Dagnelie, G., 2003. Are lutein and zeaxanthin conditionally essential
nutrients for eye health? Medical Hypotheses, 61(4).
Serrano, M. et al., 2006. Maintenance of broccoli quality and functional properties
during cold storage as affected by modified atmosphere packaging. Postharvest
Biology and Technology, 39(1), pp.61–68.
Shewfelt, R.., 1986. Postharvest treatment for extending the shelf life of fruits and
vegetables. Food Technology, 40, pp.70–89.
Shiu, J.W. et al., 2015. Effect of the shear-to-compressive force ratio in puncture
225
tests quantifying watermelon mechanical properties. Journal of Food
Engineering, 150, pp.125–131. Available at:
http://dx.doi.org/10.1016/j.jfoodeng.2014.11.007.
Silberberg, M.S., 2000. The Molecular Nature of Matter and Change 2nd editio.,
Boston: McGraw Hill.
Smyth, A.B., Song, J. & Cameron, A.C., 1998. Modified Atmosphere Packaged Cut
Iceberg Lettuce: Effect of Temperature and O2 Partial Pressure on Respiration
and Quality. Journal of Agricultural and Food Chemistry, 46(May 1997),
pp.4556–4562. Available at: http://pubs.acs.org/doi/abs/10.1021/jf980208s.
Song, Y., Kim, H.K. & Yam, K.L., 1992. Respiration Rate of Blueberry in Modified
Atmosphere at Various Temperatures. , 117(6), pp.925–929.
Sousa, a. R., Oliveira, J.C. & Sousa-Gallagher, M.J., 2017. Determination of the
respiration rate parameters of cherry tomatoes and their joint confidence regions
using closed systems. Journal of Food Engineering, 206, pp.13–22. Available at:
http://www.sciencedirect.com/science/article/pii/S0260877417300717.
Spurr, A.R., 1969. A low-viscosity epoxy resin embedding medium for electron
microscopy. Journal of Ultrasructure Research, 26(1–2), pp.31–43.
Stoneham, T.R., Lund, D.B. & Tong, C.H., 2000. The Use of Fractional Conversion
Technique to Investigate the Effects of Testing Parameters on Texture
Degradation Kinetics. Journal of Food Science, 65(6), pp.968–973. Available at:
http://doi.wiley.com/10.1111/j.1365-2621.2000.tb09401.x.
Studman, C.J., 2001. Computers and electronics in postharvest--a review.
226
Computers and Electronics in Agriculture, 30(1/3), pp.109–124.
Taherian, A.R. & Ramaswamy, H.S., 2008. Kinetic Considerations of Texture
Softening in Heat Treated Root Vegetables. International Journal of Food
Properties, 12(September), pp.114–128. Available at:
http://www.tandfonline.com/doi/abs/10.1080/10942910802312207.
Tang, X. et al., 2011. Physical and mechanical properties of spinach for whole-
surface online imaging inspection. Moon, 8027, pp.802711-802711–9. Available
at: http://link.aip.org/link/PSISDG/v8027/i1/p802711/s1&Agg=doi.
Thybo, A.K. & Nielsen, M., 2000. Influence of uniaxial compression rate on
rheological parameters and sensory texture prediction of cooked potatoes.
Journal of Texture Studies, 31(1), pp.25–40. Available at:
file://reinette/bdd/BaseBiblio/Photocopies/10208.pdf.
Tian, S. et al., 2018. Microbiota: a mediator to transform glucosinolate precursors in
cruciferous vegetables to the active isothiocyanates. Journal of Science of Food
and Agriculture, 98(4).
Toivonen, P.M.A. & Brummell, D.A., 2008. Biochemical bases of appearance and
texture changes in fresh-cut fruit and vegetables. Postharvest Biology and
Technology, 48(1), pp.1–14.
Tomas-Callejas, A. et al., 2012. Combined effect of UV-C pretreatment and high
oxygen packaging for keeping the quality of fresh-cut Tatsoi baby leaves.
Innovative Food Science and Emerging Technologies, 14, pp.115–121.
Available at: http://dx.doi.org/10.1016/j.ifset.2011.11.007.

227
Toole, G. a. et al., 2001. Fracture mechanics of the cell wall of Chara corallina.
Planta, 212(July 2000), pp.606–611.
Toole, G. a. et al., 2000. Mechanical properties of lettuce. Journal of Materials
Science, 35, pp.3553–3559.
Torrieri, E., Cavella, S. & Masi, P., 2009. Modelling the respiration rate of fresh-cut
Annurca apples to develop modified atmosphere packaging. International
Journal of Food Science & Technology, 44(5), pp.890–899. Available at:
http://doi.wiley.com/10.1111/j.1365-2621.2007.01615.x [Accessed February 8,
2014].
Tro, N.J., 2008. A Molecular Approach 1st editio., Upper Saddle River: Pearson
Prentice Hall.
Tudela, J.A., Marín, A., Garrido, Y., et al., 2013. Off-odour development in modified
atmosphere packaged baby spinach is an unresolved problem. Postharvest
Biology and Technology, 75, pp.75–85. Available at:
http://dx.doi.org/10.1016/j.postharvbio.2012.08.006.
Tudela, J.A., Marín, A., Martínez-Sánchez, A., et al., 2013. Preharvest and
postharvest factors related to off-odours of fresh-cut iceberg lettuce. Postharvest
Biology and Technology, 86, pp.463–471. Available at:
http://dx.doi.org/10.1016/j.postharvbio.2013.07.028.
Ufuk Kasim, M. & Kasim, R., 2012. Color changes of fresh-cut swiss chard leaves
stored at different light intensity. American Journal of Food Technology, 7(1),
pp.13–21.

228
University of Oregon, Random 3-Digit Code Number Generator. Available at:
https://registrar.uoregon.edu/faculty-staff/random-number-generator.
USDA, 2006. Spinach Plants , Spinach Leaves , and Bunched Spinach,
Valous, N. a. et al., 2009. Colour calibration of a laboratory computer vision system
for quality evaluation of pre-sliced hams. Meat Science, 81(July 2015), pp.132–
141.
Vannoppen, J., Verbeke, W. & Huylenbroeck, G. Van, 2002. Consumer value
structures towards supermarket versus farm shop purchase of apples from
integrated production in Belgium. British Food Journal, 104(10), pp.828–844.
Varoquaux, P., Mazollier, J. & Albagnac, G., 1996. The influence of raw material
characteristics on the storage life of fresh-cut butterhead lettuce. Postharvest
Biology and Technology, 9(96), pp.127–139.
Veit, M. et al., 1996. Diurnal Changes in Flavonoids. Journal of Plant Physiology,
148(3–4), pp.478–482. Available at:
http://linkinghub.elsevier.com/retrieve/pii/S0176161796802823.
Verlegh, P.W.J. & Candel, M.J.J.M., 1999. The consumption of convenience foods:
Reference groups and eating situations. Food Quality and Preference, 10(6),
pp.457–464.
Villanueva, M.J. et al., 2005. Physical, chemical, histological and microbiological
changes in fresh green asparagus (Asparagus officinalis, L.) stored in modified
atmosphere packaging. Food Chemistry, 91, pp.609–619.
Vincent, J.F. V, 1991. Strength and fracture of grasses. Journal of Materials Science,

229
26, pp.1947–1950.
Vincent, J.F. V, 1982. The mechanical design of grass. Journal of Materials Science,
17, pp.856–860.
Wang, S. et al., 2010. Mechanical characteristics of typical plant leaves. Journal of
Bionic Engineering, 7, pp.294–300.
Watada, A.E., Ko, N.P. & Minott, D. a., 1996. Factors affecting quality of fresh-cut
horticultural products. Postharvest Biology and Technology, 9, pp.115–125.
Watada, A.E. & Qi, L., 1999. Quality of fresh-cut produce. Postharvest Biology and
Technology, 15, pp.201–205.
WHO, 1990. Diet, Nutrition, and the Prevention of Chronic Diseases: report of a
WHO study group. World Health Organization technical report series, 797,
p.197.
Williams, H., 2011. No Title. Full Marks. Available at:
http://www.fullmarks.org.za/Members/wllhea002/questions/A001227 [Accessed
May 2, 2018].
Wills, R. et al., 2007. Structure and Composition. In Postharvest: An introduction to
the physiology and handling of fruit, vegetables and ornamentals. Oxfordshire,
UK: UNSW Press, pp. 13–27.
Wisakowsky, E.E., Burns, E.E. & Smith, M.C., 1977. FACTORS AFFECTING THE
QUALITY FREEZE-DRIED COMPRESSED SPINACH the effect of storage
conditions , on raw. , 42(3).

230
Wood, D.F. et al., 2005. Produce degradation: pathways and prevention. In O.
Lamikanra, S. H. Imam, & D. O. Ukuku, eds. Microstructure of produce
degradation. Boca Raton, USA: Taylor & Francis, pp. 529–561.
Yam, K.L. & Papadakis, S.E., 2004. A simple digital imaging method for measuring
and analyzing color of food surfaces. Journal of Food Engineering, 61, pp.137–
142.
Yamauchi, N. & Watada, A.E., 1991. Regulated Chlorophyll Degradation in Spinach
Leaves during Storage. Water, 116(1), pp.58–62.
Zagory, D., 1997. Advances In Modified Atmosphere Packaging ( MAP ) of Fresh
Produce. Packaging (Boston, Mass.), (90), pp.2–4.
Zagory, D. & Kader, A. a., 1988. Modified Atmosphere Packaging of Fresh
Produce.pdf. Food Technology, 42(9), pp.70–74 & 76–77.
Zeithaml, V.A., 1988. Consumer Perceptions of Price, Quality, and Value: A Means-
End model and Synthesis of Evidence. Journal of Marketing, 52, pp.2–22.
Zhang, W., Wang, B. & Niu, X., 2017. Relationship between leaf surface
characteristics and particle capturing capacities of different tree species in
Beijing. Forests, 8(3), pp.1–12.
Zhao, X. et al., 2007. Consumer sensory analysis of organically and conventionally
grown vegetables. Journal of Food Science, 72.
Zheng, C., Sun, D.-W. & Zheng, L., 2006. Recent developments and applications of
image features for food quality evaluation and inspection – a review. Trends in
Food Science & Technology, 17(12), pp.642–655. Available at:

231
http://linkinghub.elsevier.com/retrieve/pii/S0924224406002263.
Zhou, T. et al., 2004. Determination of acceptability and shelf life of ready-to-use
lettuce by digital image analysis. Food Research International, 37(9), pp.875–
881.
Zhu, H.X. & Melrose, J.R., 2003. A mechanics model for the compression of plant
and vegetative tissues. Journal of Theoretical Biology, 221(1), pp.89–101.
Copyright © 2022 FDOKUMEN