Impact of soil matric potential on the fine-scale spatial distribution and activity of specific...
11
RESEARCH ARTICLE Impact of soil matric potential on the fine-scale spatial distribution and activity of specific microbial degrader communities Ce ´ cile Monard 1 , Chokri Mchergui 1 , Naoise Nunan 2 , Fabrice Martin-Laurent 3 & Laure Vieuble ´ -Gonod 4 1 INRA, UMR 1091 Environnement et Grandes Cultures, Ba ˆ timent EGER, Thiverval Grignon, France; 2 BioEMCo, CNRS-UPMC, UMR 7618, Ba ˆ timent EGER, Thiverval Grignon, France; 3 UMR 1347 Agroecologie, INRA, Dijon Cedex, France; and 4 AgroParisTech, UMR 1091 Environnement et Grandes Cultures, Ba ˆ timent EGER, Thiverval Grignon, France [Correction added after online publication 24 May 2012: All author forenames and surnames corrected] Correspondence: Laure Vieuble ´ -Gonod, UMR 1091 Environnement et Grandes Cultures (EGC), Ba ˆ timent EGER, 78850 Thiverval Grignon, France. Tel.: +33 (0) 130815269; fax: +33 (0)130815396; e-mail: [email protected] Present address: Ce ´ cile Monard, SLU, Department of Forest Mycology and Pathology, Uppsala BioCenter, Box 7026, 750 07, Uppsala, Sweden Received 8 November 2011; revised 19 April 2012; accepted 19 April 2012. Final version published online 14 May 2012. DOI: 10.1111/j.1574-6941.2012.01398.x Editor: Cindy Nakatsu Keywords 2,4-D; relative abundance of degraders; water content; glucose; organic substrate mineralization; spatial variability. Abstract The impact of the soil matric potential on the relationship between the relative abundance of degraders and their activity and on the spatial distribution of both at fine scales was determined to understand the role of environmental conditions in the degradation of organic substrates. The mineralization of 13 C-glucose and 13 C-2,4-dichlorophenoxyacetic acid (2,4-D) was measured at different matric potentials (0.001, 0.01 and 0.316 MPa) in 6 9 6 9 6 mm 3 cubes excised from soil cores. At the end of the incubation, total bacterial and 2,4-D degrader abundances were determined by quantifying the 16S rRNA and the tfdA genes, respectively. The mineralization of 2,4-D was more sensitive to changes in matric potential than was that of glucose. The amount and spatial structure of 2,4-D mineralization decreased with matric potential, whilst the spatial variability increased. On the other hand, the spatial variation of glucose mineralization was less affected by changes in matric potential. The relationship between the relative abundance of 2,4-D degraders and 2,4-D mineralization was significantly affected by matric potential: the relative abundance of tfdA needed to be higher to reach a given level of 2,4-D mineralization in dryer than in moister conditions. The data show how microbial interactions with their microhabitat can have an impact on soil processes at larger scales. Introduction Soil is made up of a huge diversity of microhabitats with a range of different properties, such as variable O 2 levels, moisture content and pH (Sextone et al., 1985; Nunan et al., 2006; Young et al., 2008; Franklin & Mills, 2009). This results in highly heterogeneous distributions of soil microorganisms and microbial activity at very fine scales (Parkin, 1993; Ranjard et al., 2000; Nunan et al., 2002; Gonod et al., 2003). The type of spatial distribution (aggregated, homogeneous and random) of microorganisms is thought to affect ecosystem function- ing. For example, it has been shown that even distributions of microbial degraders result in higher 2,4-dichlorophenoxyacetic acid (2,4-D) degradation rates than aggregated distributions (Dechesne et al., 2010). The physical structure of soil regulates the diffusion and the availability of substrates and metabolites to and from microbial cells (Strong et al., 1997; Chenu & Sto- tzky, 2001). Therefore, the spatial localization of micro- organisms in the three-dimensional structure may play an important role in microbial processes and the persis- tence and turnover of organic compounds in soil (Fos- ter, 1988; Strong et al., 1998), by affecting the probability of encounter between degraders and substrate (Pallud et al., 2004). The degradation of organic substrates depends not only of the presence of degraders but also on environmental FEMS Microbiol Ecol 81 (2012) 673–683 ª 2012 Federation of European Microbiological Societies Published by Blackwell Publishing Ltd. All rights reserved MICROBIOLOGY ECOLOGY
Transcript of Impact of soil matric potential on the fine-scale spatial distribution and activity of specific...

R E S EA RCH AR T I C L E
Impact of soil matric potential on the fine-scale spatialdistribution and activity of specific microbial degrader
communities
Cecile Monard1, Chokri Mchergui1, Naoise Nunan2, Fabrice Martin-Laurent3 & LaureVieuble-Gonod4
1INRA, UMR 1091 Environnement et Grandes Cultures, Batiment EGER, Thiverval Grignon, France; 2BioEMCo, CNRS-UPMC, UMR 7618, Batiment
EGER, Thiverval Grignon, France; 3UMR 1347 Agroecologie, INRA, Dijon Cedex, France; and 4AgroParisTech, UMR 1091 Environnement et
Grandes Cultures, Batiment EGER, Thiverval Grignon, France
[Correction added after online publication 24 May 2012: All author forenames and surnames corrected]
Correspondence: Laure Vieuble-Gonod,
UMR 1091 Environnement et Grandes
Cultures (EGC), Batiment EGER, 78850
Thiverval Grignon, France. Tel.: +33 (0)
130815269; fax: +33 (0)130815396; e-mail:
Present address: Cecile Monard, SLU,
Department of Forest Mycology and
Pathology, Uppsala BioCenter, Box 7026,
750 07, Uppsala, Sweden
Received 8 November 2011; revised 19 April
2012; accepted 19 April 2012.
Final version published online 14 May 2012.
DOI: 10.1111/j.1574-6941.2012.01398.x
Editor: Cindy Nakatsu
Keywords
2,4-D; relative abundance of degraders;
water content; glucose; organic substrate
mineralization; spatial variability.
Abstract
The impact of the soil matric potential on the relationship between the relative
abundance of degraders and their activity and on the spatial distribution of
both at fine scales was determined to understand the role of environmental
conditions in the degradation of organic substrates. The mineralization of13C-glucose and 13C-2,4-dichlorophenoxyacetic acid (2,4-D) was measured at
different matric potentials (�0.001, �0.01 and �0.316 MPa) in 6 9 6 9 6 mm3
cubes excised from soil cores. At the end of the incubation, total bacterial and
2,4-D degrader abundances were determined by quantifying the 16S rRNA and
the tfdA genes, respectively. The mineralization of 2,4-D was more sensitive to
changes in matric potential than was that of glucose. The amount and spatial
structure of 2,4-D mineralization decreased with matric potential, whilst the
spatial variability increased. On the other hand, the spatial variation of glucose
mineralization was less affected by changes in matric potential. The relationship
between the relative abundance of 2,4-D degraders and 2,4-D mineralization
was significantly affected by matric potential: the relative abundance of tfdA
needed to be higher to reach a given level of 2,4-D mineralization in dryer
than in moister conditions. The data show how microbial interactions with
their microhabitat can have an impact on soil processes at larger scales.
Introduction
Soil is made up of a huge diversity of microhabitats
with a range of different properties, such as variable O2
levels, moisture content and pH (Sextone et al., 1985;
Nunan et al., 2006; Young et al., 2008; Franklin & Mills,
2009). This results in highly heterogeneous distributions
of soil microorganisms and microbial activity at very
fine scales (Parkin, 1993; Ranjard et al., 2000; Nunan
et al., 2002; Gonod et al., 2003). The type of spatial
distribution (aggregated, homogeneous and random) of
microorganisms is thought to affect ecosystem function-
ing. For example, it has been shown that even
distributions of microbial degraders result in higher
2,4-dichlorophenoxyacetic acid (2,4-D) degradation rates
than aggregated distributions (Dechesne et al., 2010).
The physical structure of soil regulates the diffusion and
the availability of substrates and metabolites to and
from microbial cells (Strong et al., 1997; Chenu & Sto-
tzky, 2001). Therefore, the spatial localization of micro-
organisms in the three-dimensional structure may play
an important role in microbial processes and the persis-
tence and turnover of organic compounds in soil (Fos-
ter, 1988; Strong et al., 1998), by affecting the
probability of encounter between degraders and substrate
(Pallud et al., 2004).
The degradation of organic substrates depends not only
of the presence of degraders but also on environmental
FEMS Microbiol Ecol 81 (2012) 673–683 ª 2012 Federation of European Microbiological SocietiesPublished by Blackwell Publishing Ltd. All rights reserved
MIC
ROBI
OLO
GY
EC
OLO
GY

factors, particularly soil water content. Linn & Doran
(1984) showed that aerobic microbial activity increases
with soil water content up until a maximum point
(�0.01 MPa) before decreasing. Schroll et al. (2006)
demonstrated that the optimal matric potential for the
mineralization of a number of pesticides (isoproturon,
benazolin-ethyl, and glyphosate) was �0.015 MPa and
that, when the soil moisture was close to water-holding
capacity, pesticide mineralization was considerably
reduced. Variations in soil moisture affect the diffusion of
soluble substrates, the motility of microorganisms and the
diffusion of oxygen which, in turn, affect soil microbial
activities (Skopp et al., 1990; Cattaneo et al., 1997; Treves
et al., 2003; Or et al., 2007; Dechesne et al., 2010). By
acting on the physiological status of bacteria, soil mois-
ture content affects their subsequent substrate utilization
response (Harris, 1981; Griffiths et al., 2003). Moreover,
higher moisture contents create connections between dif-
ferent microhabitats, resulting in modifications in interac-
tions between microorganisms and competition among
cells. Changes in soil moisture content therefore sustain
high level of functional diversity (Or et al., 2007; Young
et al., 2008).
A consequence of the heterogeneous nature of soil is
that microbial ‘perception’ of macro-environmental con-
ditions is highly dependent on both location within the
soil pore network and spatial distribution of the microor-
ganisms. For example, at certain matric potentials bacte-
ria in large pores will not have sufficient water for
activity, whilst those in small pores will experience opti-
mal O2 and moisture levels (Young et al., 2008). Widely
and evenly spread microorganisms will, on average, expe-
rience conditions that are very similar to the macro-con-
ditions, but this will not be the case for aggregated
microorganisms, which will be very dependent on their
location within the pore network (in large or small pores
for example). From a functional standpoint, the spatial
distribution of a given functional group may affect the
response of the function to changes in environmental
conditions. Degradation carried out by aggregated
degraders may be more sensitive to changes in environ-
mental conditions as they are likely confined to specific
microhabitats.
The aims of the present study were threefold: (1) to
determine the effect of changes in matric potential
(�0.001, �0.01 and �0.316 MPa corresponding to 0.40,
0.25 and 0.16 g of water per g dry soil, respectively) on
glucose and 2,4-D mineralization rates and on the spatial
variability of both of these processes; (2) to determine
the influence of matric potential on total and degrading
soil bacterial populations and (3) to determine how the
relationship between the relative abundance of 2,4-D
degraders and mineralization was affected by variations
in environmental conditions, in this case moisture levels.
Glucose and 2,4-D were chosen as model substrates. Glu-
cose is a readily metabolized substrate used in different
metabolic pathways (White, 2007). It is assimilated by
many soil microorganisms and shows little spatial varia-
tion at fine scales. Glucose mineralization can therefore
be considered to have a wide niche breadth and to be
present in many microhabitats in soil. 2,4-D, on the
other hand, is a complex substrate degraded either by
specific microorganisms harbouring the genes encoding
for the degradation or by co-metabolism (Soulas, 1993).
2,4-D mineralization may be carried out by one microor-
ganism possessing all the enzymes necessary to degrade
2,4-D or by a consortium of microbial species acting
together (Ou & Thomas, 1994; Vallaeys et al., 1997). The
more limited number of organisms involved in 2,4-D
mineralization suggests that the niche breadth is narrower
than that of glucose degraders, and therefore, the spatial
distribution is more aggregated and confined to specific
microhabitats (Gonod et al., 2003; Hybholt et al., 2011).
It was hypothesized that average glucose degradation
would be less affected by variations in matric potential
than average 2,4-D degradation owing to the widespread
and less aggregated nature of microorganisms able to use
glucose as a substrate. It was also hypothesized that the
spatial distribution of 2,4-D degradation would be more
sensitive to changes in matric potential than that of glu-
cose.
The microplate system recently developed by Monard
et al. (2010), in which the mineralization of 13C-labelled
substrates can be measured in small soil samples
(216 mm3), was used. At the end of the incubations, total
bacterial and 2,4-D degrader abundances were estimated
by quantifying the 16S rRNA gene and the first gene
involved in 2,4-D biodegradation and leading to
2,4-dichlorophenol, tfdA, on the same samples as used to
measure mineralization.
Materials and methods
Soil
Undisturbed soil cores (diameter 80 mm, height
100 mm) were sampled in the Spring of 2009 from the
top 0–30 cm horizon at an INRA (Institut National de
Recherche Agronomique) field experiment in the park of
the Palace of Versailles. The experimental plots from
which samples were taken had been cropped to wheat for
the previous 16 years and had never been treated with
2,4-D during this period. The soil was a silt loam (30%
sand, 53% silt and 17% clay) with a pH of 6.8. Soil cores
were stored at 4 °C before use. The sampling water con-
tent was of 0.15 g g�1 soil.
ª 2012 Federation of European Microbiological Societies FEMS Microbiol Ecol 81 (2012) 673–683Published by Blackwell Publishing Ltd. All rights reserved
674 C. Monard et al.

Preparation of soil samples
To compare substrate mineralization in soil cubes, we
determined whether it was better to work on soil slices
sampled at the same depth in different soil cores or on
soil slices sampled at different depths between 0 and
80 mm in the same soil core. The total soil microbial
biomass was thus measured by fumigation–extraction(Jenkinson & Powlson, 1976; Vance et al., 1987) in slices
sampled at eight different depths for five soil cores, and
the results showed that intra soil core variability was less
important than that among cores (coefficients of variation
of 12% vs. 27%). On this basis, all measurements were
performed using cubes from a single soil core. One entire
slice was used per substrate and matric potential to allow
visual assessment of the spatial distribution of the activity
measured.
Soil cubes were excised from the soil core as described
by Gonod et al. (2003). Briefly, the soil core was sec-
tioned into consecutive slices (thickness 6 mm), and each
slice was divided into 74 undisturbed soil cubes
(6 9 6 9 6 mm3; 418 ± 39 mg dry soil). The relative
location of each cube on the slice was recorded.
Substrate mineralization
Under CO2-free atmosphere, soil cubes (n = 74 per sub-
strate and per matric potential) were amended with solu-
tions of either 13C-glucose (d13Cglucose = 4527, 4414 or
4014&; Euriso-Top, France) or 13C-2,4-D (d13C2,4-
D = 5027, 4778 or 5054&; Dislab’system, France) to
bring them to a matric potential Ψ of �0.001 (pF 1),
�0.01 (pF 2) and �0.316 MPa (pF 3.5) corresponding to
0.40, 0.25 and 0.16 g of water per g dry soil, respectively.
Therefore, the substrates were added to pores with a max-
imum pore neck diameter of 300, 30 and 1 lm, respec-
tively. The loading rate was 13 lg C g�1 dry soil for all
cubes, corresponding to 30 lg 2,4-D g�1 dry soil and
32.6 lg glucose g�1 dry soil. Substrate mineralization in
each soil cube was measured using the experimental
device developed by Monard et al. (2010). This device
consisted of 24-well microtitre plates into which were
placed the soil cubes, one per well. A glass microfiber fil-
ter (Prat-Dumas, France) impregnated with a solution of
sodium hydroxide (0.2 N; Titrisol®, Merck) was then
placed on cylindrical plastic supports in each well to trap
the 12C- and 13C-labelled CO2. The microtitre plate was
covered with a seal made of Viton® and closed with a
clamp designed to apply a homogeneous pressure over
the whole microtitrr plate, ensuring that each well was
closed with an airtight seal. Samples were incubated at
20 °C in the dark during 48 and 96 h for glucose and
2,4-D amended samples, respectively. These two durations
corresponded to the middle of the exponential phase of
the mineralization curves (data not shown).
At the end of the incubation, the microtitre plates were
opened under CO2-free atmosphere and the filters trans-
ferred to 10-mL glass vials with Teflon® septa sealed on
with crimped aluminium seals. Phosphoric acid (500 lL,85%, Merck) was subsequently added through the septum
with a syringe to release the CO2 from the filters. The fil-
ters were left to react with the acid for 24 h at 50 °C,and the resulting CO2 was quantified with a micro-GC
(Agilent 3000A, Qplot column). The isotopic signature of
the C–CO2 was determined using a GC (Hewlett-Packard
5890) coupled to an isotopic ratio mass spectrometer
(Isochrom Optima, Micromass). The analytical variability
of these instruments was always less than 1%. The cubes
of soil were stored at �20 °C for subsequent DNA extrac-
tion.
DNA extraction
DNA was extracted from all cubes that had been incu-
bated with 2,4-D at Ψ = �0.001 MPa (n = 74) and from
20 and 16 cubes incubated with 2,4-D at Ψ = �0.316
and �0.01 MPa, respectively. In the latter two cases, the
soil cubes were chosen to have a range of 2,4-D minerali-
zation activities. DNA extraction was performed using
250 mg of soil according to the ISO standard 11063
(Petric et al., 2011) derived from Martin-Laurent et al.
(2001). DNA was quantified at 260 nm using a Biopho-
tometer (Eppendorf, Hamburg, Germany).
Quantitative PCR assays
Absolute quantifications of 16S rRNA and tfdA genes
were performed in triplicate using standard curves gener-
ated with known copy numbers of the gene of interest as
described by Monard et al. (2008). Prior to quantifica-
tion, the absence of inhibitors was determined by com-
paring the quantification of standard plasmid to that of
soil DNA spiked with known amount standard plasmid.
Quantitative PCR was carried out in an ABI Prism
7900HT (Applied Biosystems) apparatus. The 20-lL reac-
tion mixtures contained 10 lL of ABsoluteTM qPCR
SYBR® Green Mix (Thermo Scientific ABgene, UK),
0.3 lM of 341f (Muyzer et al., 1993) and 515r (Xia et al.,
2000) for amplification of the 16S rRNA gene or TfdAf
(Baelum et al., 2006) and TfdAr (Baelum et al., 2008) for
amplification of the tfdA gene, 2 lL of 10 times diluted
DNA, 1 lL of T4 gp 32 (QBiogene) and 3.5 lL of ultra-
pure water. The thermal cycling conditions for the 16S
rRNA sequence amplification consisted of an initial step
of 15 min at 95 °C followed by 30 cycles at 95 °C for
15 s, 60 °C for 30 s, 72 °C for 30 s and 80 °C for 30 s.
FEMS Microbiol Ecol 81 (2012) 673–683 ª 2012 Federation of European Microbiological SocietiesPublished by Blackwell Publishing Ltd. All rights reserved
Soil matric potential and microbial degraders at fine scale 675

Additional cycles of 95 °C for 15 s, 80 °C for 15 s and
95 °C for 15 s were performed to obtain specific dissocia-
tion curves for the targeted sequence and thereby to
check the purity of the qPCR. Identical thermal cycling
conditions were used to quantify tfdA except that 40
cycles were performed instead of 30 with an annealing
temperature of 64 °C.The calibration curves were as follows:
Ct ¼ �3:2� ðnumber of 16S rRNA sequencesÞþ 37:82 ðR2 ¼ 0:99Þ
Ct ¼ �3:4� ðnumber of tfdA sequencesÞþ 36:78 ðR2 ¼ 0:99Þ
Calculations
The amount of substrate mineralized was determined as
described by Monard et al. (2010) using the following
equation:
CSubstrate ¼ CRespired � d13CRespired � d13CSOM
d13CSubstrate � d13CSOM
� �(1)
where CSubstrate is the amount of added substrate C min-
eralized, CRespired is the amount of C derived from the
mineralization of both soil organic matter (SOM) and
substrate, d13CSubstrate and d13CSOM are the 13C isotopic
signatures of the substrate and the SOM C, respectively.
d13CSOM was determined from control samples incubated
without substrate addition and was equal to �35.5&.
Data and statistical analysis
The extent of spatial autocorrelation was determined
using the SPDEP package (SPDEP, spatial dependence:
weighting schemes, statistics and models, version 0.5-26;
Bivand, 2009) in R (R: A Language and Environment for
Statistical Computing, 2010; http://www.R-project.org/).
Moran’s I coefficient was computed over multiple dis-
tances, and a correlogram was constructed by plotting the
coefficient against neighbour distances.
Treatment effects were tested by analysis of variance.
When testing for treatment effects, the occurrence of spa-
tial autocorrelation had to be accounted for. To achieve
this, the Type I error rate, a, was adjusted to a more con-
servative value, a′ = a/5. With positive spatial autocorre-
lation, there is a lack of independence among sample
neighbours. This reduces within-group variability, artifi-
cially increasing the relative treatment variance (Legendre
& Legendre, 1998). The problem is essentially a reduction
in the effective sample size (Dale & Fortin, 2002). A 1%
significance level was used rather than 5% because the
critical value for 1% with m = 70 (the degrees of freedom)
in these experiments had all samples been independent is
close to the critical value for 5% with m = 6. This means
that even if the effective sample size was reduced by an
order of magnitude owing to spatial autocorrelation, a
Type I error rate of < 0.05 was certain and any detected
significance could be trusted (Dale & Fortin, 2002).
Results
Impact of matric potential on substrate
mineralization and its spatial heterogeneity
Mean glucose mineralization reached 24.7%, 17.1% and
17.4% at Ψ = �0.001, �0.01 and �0.316 MPa, respec-
tively. It was significantly higher in the wettest system
(P < 0.001; Fig. 1). The variability of glucose mineraliza-
tion also changed with moisture content, with coefficients
of variation of 20.9% and 21.7% at Ψ = �0.001 and
�0.01 MPa, respectively, but only of 13.8% at
Ψ = �0.316 MPa. 2,4-D mineralization was significantly
different at all the matric potentials tested (P < 0.001)
and was higher at Ψ = �0.001 MPa (43.7%) than at
Ψ = �0.316 MPa (1.9%) with an intermediate value at
Ψ = �0.01 MPa (16.7%) (Fig. 1). The coefficient of vari-
ation of 2,4-D mineralization ranged between 29% and
65%. The soil water content had a significant impact on
both glucose and 2,4-D mineralization (F = 88.8,
P < 0.01 and F = 365, P < 0.01, respectively, Fig. 1), but
the mineralization of 2,4-D was far more sensitive to
changes in matric potential than was the mineralization
of glucose. There was a 23-fold increase in the mineraliza-
tion of 2,4-D between matric potentials Ψ of �0.316 and
0
10
20
30
40
50
60
Glc
2,4-D
Min 16.7%Max 40.7%CV 20.9%
Min 7.2%Max 28.9%CV 21.7%
Min 11.7%Max 24.4%CV 13.8%
Min 3.1%Max 47.5%CV 59.8%
Min 0.5%Max 9.6%CV 64.7%
Min 11.5%Max 71.4%CV 29.0%
Subs
trate
min
eral
isat
ion
(% o
f tot
al a
dded
subs
trate
)
a
b
c c c
d
= –0.316 MPa= –0.01 MPa= –0.001 MPa
Fig. 1. Mineralisation of glucose (black) and 2,4-D (white) in 74 soil
cubes of one soil core slice at Ψ = �0.001, �0.01 and �0.316 MPa.
Error bars indicate standard deviations. Minimum and maximum
values and coefficients of variation are indicated.
ª 2012 Federation of European Microbiological Societies FEMS Microbiol Ecol 81 (2012) 673–683Published by Blackwell Publishing Ltd. All rights reserved
676 C. Monard et al.
�0.001 MPa whilst glucose mineralization only increased
by a factor of 1.4 (Fig. 1). Furthermore, glucose minerali-
zation only showed a significant difference between the
matric potential Ψ = �0.001 MPa and the other matric
potentials. The coefficients of variation of glucose and
2,4-D mineralizations displayed opposite relationships
with matric potential. As the matric potential decreased,
the variability of 2,4-D mineralization increased whilst
that of glucose was less variable and more stable before
decreasing (Fig. 1). In the dryer system, the mineraliza-
tion of glucose was higher than that of 2,4-D, but the
contrary was observed at Ψ = �0.001 MPa. The minerali-
zation of the two substrates was similar at the intermedi-
ate matric potential.
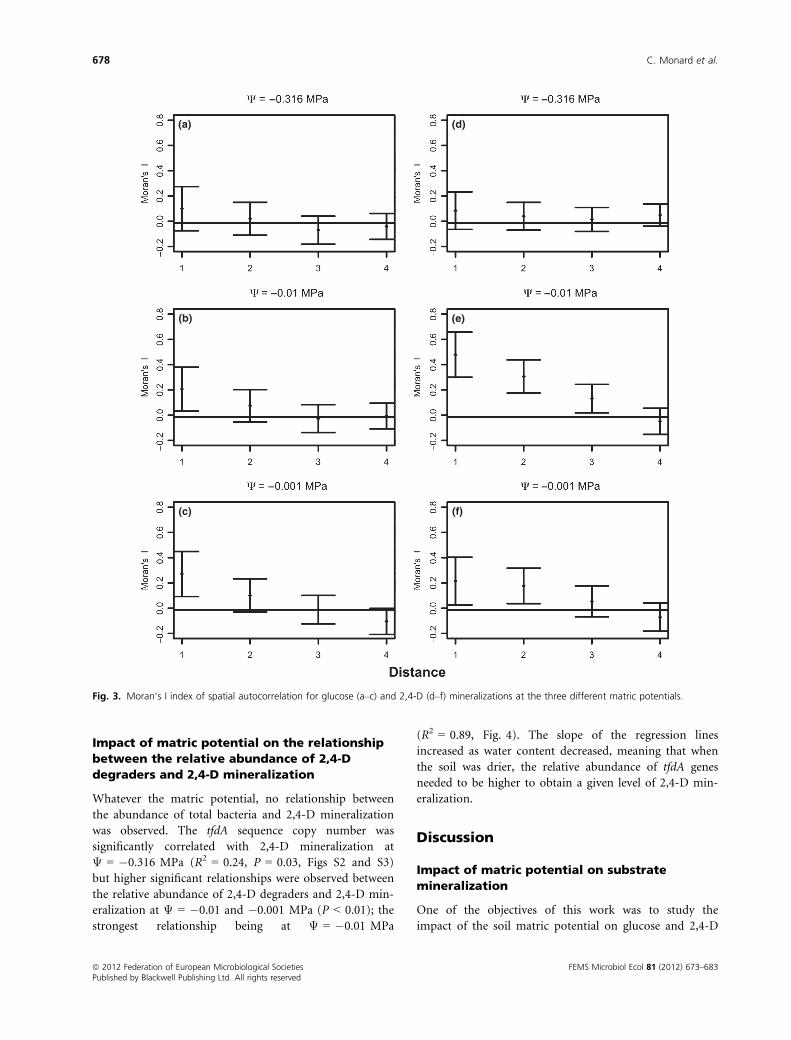
Spatial structure of glucose and 2,4-D
mineralization
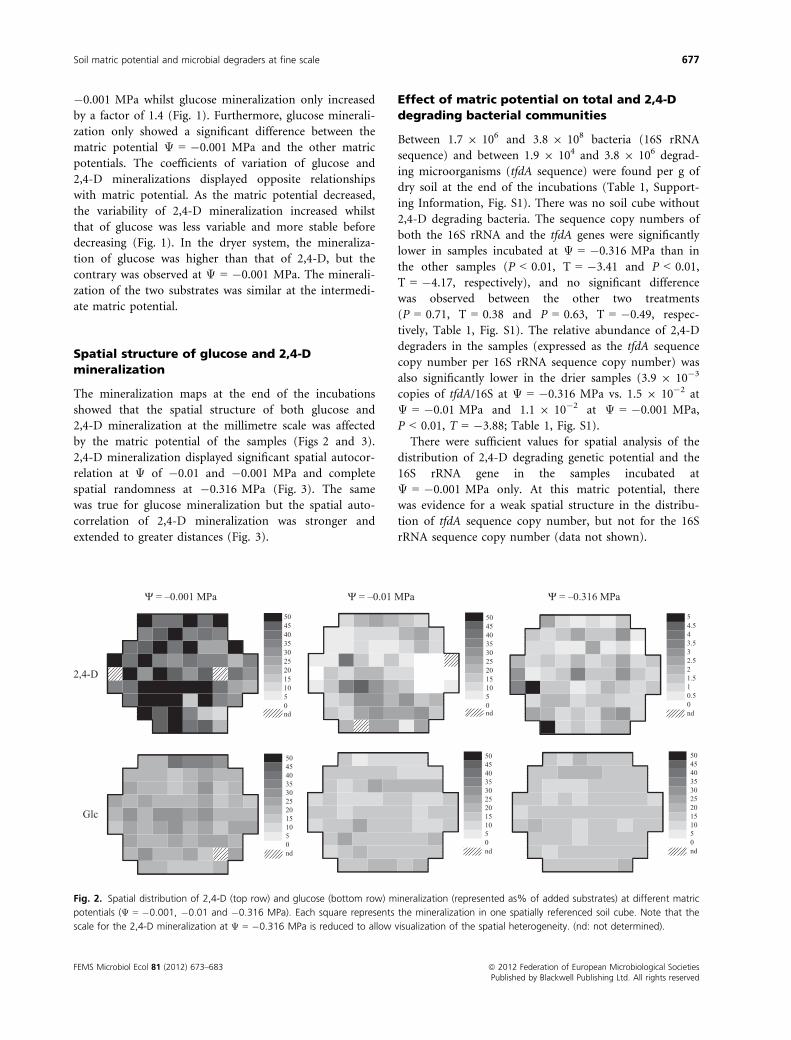
The mineralization maps at the end of the incubations
showed that the spatial structure of both glucose and
2,4-D mineralization at the millimetre scale was affected
by the matric potential of the samples (Figs 2 and 3).
2,4-D mineralization displayed significant spatial autocor-
relation at Ψ of �0.01 and �0.001 MPa and complete
spatial randomness at �0.316 MPa (Fig. 3). The same
was true for glucose mineralization but the spatial auto-
correlation of 2,4-D mineralization was stronger and
extended to greater distances (Fig. 3).
Effect of matric potential on total and 2,4-D
degrading bacterial communities
Between 1.7 9 106 and 3.8 9 108 bacteria (16S rRNA
sequence) and between 1.9 9 104 and 3.8 9 106 degrad-
ing microorganisms (tfdA sequence) were found per g of
dry soil at the end of the incubations (Table 1, Support-
ing Information, Fig. S1). There was no soil cube without
2,4-D degrading bacteria. The sequence copy numbers of
both the 16S rRNA and the tfdA genes were significantly
lower in samples incubated at Ψ = �0.316 MPa than in
the other samples (P < 0.01, T = �3.41 and P < 0.01,
T = �4.17, respectively), and no significant difference
was observed between the other two treatments
(P = 0.71, T = 0.38 and P = 0.63, T = �0.49, respec-
tively, Table 1, Fig. S1). The relative abundance of 2,4-D
degraders in the samples (expressed as the tfdA sequence
copy number per 16S rRNA sequence copy number) was
also significantly lower in the drier samples (3.9 9 10�3
copies of tfdA/16S at Ψ = �0.316 MPa vs. 1.5 9 10�2 at
Ψ = �0.01 MPa and 1.1 9 10�2 at Ψ = �0.001 MPa,
P < 0.01, T = �3.88; Table 1, Fig. S1).
There were sufficient values for spatial analysis of the
distribution of 2,4-D degrading genetic potential and the
16S rRNA gene in the samples incubated at
Ψ = �0.001 MPa only. At this matric potential, there
was evidence for a weak spatial structure in the distribu-
tion of tfdA sequence copy number, but not for the 16S
rRNA sequence copy number (data not shown).
50454035302520151050nd
50454035302520151050nd
54.543.532.521.510.50nd
50454035302520151050nd
50454035302520151050nd
50454035302520151050nd
2,4-D
Glc
Ψ = –0.316 MPaΨ = –0.01 MPaΨ = –0.001 MPa
Fig. 2. Spatial distribution of 2,4-D (top row) and glucose (bottom row) mineralization (represented as% of added substrates) at different matric
potentials (Ψ = �0.001, �0.01 and �0.316 MPa). Each square represents the mineralization in one spatially referenced soil cube. Note that the
scale for the 2,4-D mineralization at Ψ = �0.316 MPa is reduced to allow visualization of the spatial heterogeneity. (nd: not determined).
FEMS Microbiol Ecol 81 (2012) 673–683 ª 2012 Federation of European Microbiological SocietiesPublished by Blackwell Publishing Ltd. All rights reserved
Soil matric potential and microbial degraders at fine scale 677
Impact of matric potential on the relationship
between the relative abundance of 2,4-D
degraders and 2,4-D mineralization
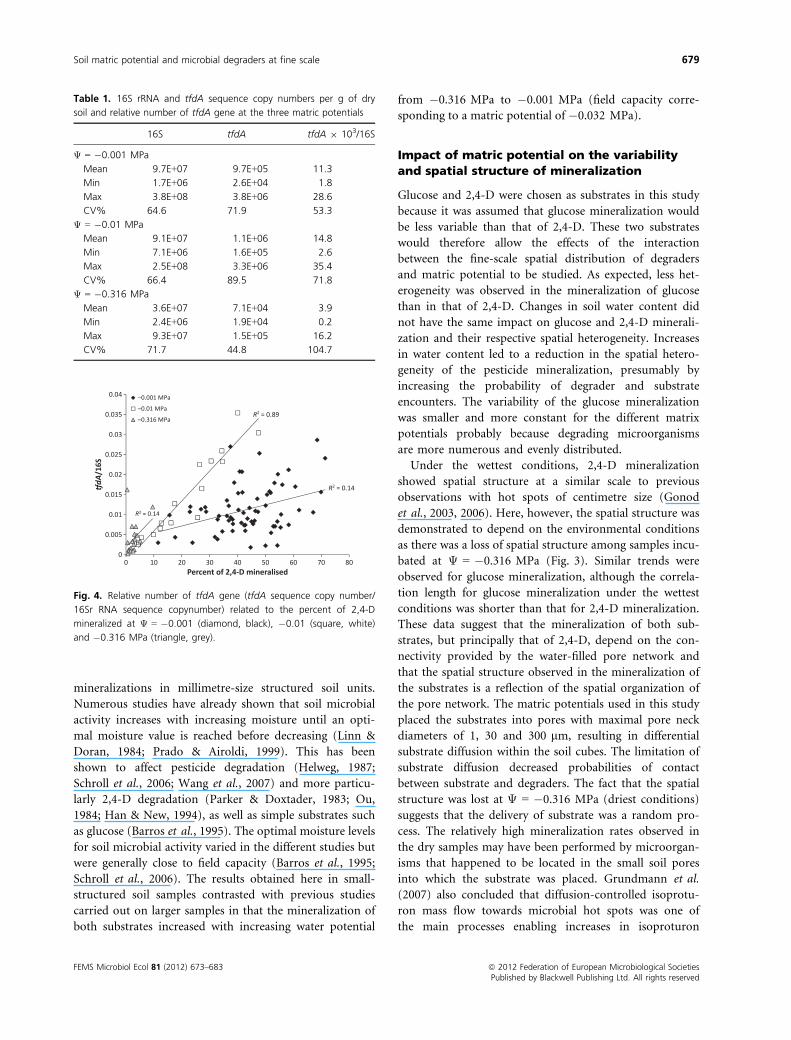
Whatever the matric potential, no relationship between
the abundance of total bacteria and 2,4-D mineralization
was observed. The tfdA sequence copy number was
significantly correlated with 2,4-D mineralization at
Ψ = �0.316 MPa (R2 = 0.24, P = 0.03, Figs S2 and S3)
but higher significant relationships were observed between
the relative abundance of 2,4-D degraders and 2,4-D min-
eralization at Ψ = �0.01 and �0.001 MPa (P < 0.01); the
strongest relationship being at Ψ = �0.01 MPa
(R2 = 0.89, Fig. 4). The slope of the regression lines
increased as water content decreased, meaning that when
the soil was drier, the relative abundance of tfdA genes
needed to be higher to obtain a given level of 2,4-D min-
eralization.
Discussion
Impact of matric potential on substrate
mineralization
One of the objectives of this work was to study the
impact of the soil matric potential on glucose and 2,4-D
(a)
(b)
(c)
(d)
(e)
(f)
Fig. 3. Moran’s I index of spatial autocorrelation for glucose (a–c) and 2,4-D (d–f) mineralizations at the three different matric potentials.
ª 2012 Federation of European Microbiological Societies FEMS Microbiol Ecol 81 (2012) 673–683Published by Blackwell Publishing Ltd. All rights reserved
678 C. Monard et al.
mineralizations in millimetre-size structured soil units.
Numerous studies have already shown that soil microbial
activity increases with increasing moisture until an opti-
mal moisture value is reached before decreasing (Linn &
Doran, 1984; Prado & Airoldi, 1999). This has been
shown to affect pesticide degradation (Helweg, 1987;
Schroll et al., 2006; Wang et al., 2007) and more particu-
larly 2,4-D degradation (Parker & Doxtader, 1983; Ou,
1984; Han & New, 1994), as well as simple substrates such
as glucose (Barros et al., 1995). The optimal moisture levels
for soil microbial activity varied in the different studies but
were generally close to field capacity (Barros et al., 1995;
Schroll et al., 2006). The results obtained here in small-
structured soil samples contrasted with previous studies
carried out on larger samples in that the mineralization of
both substrates increased with increasing water potential
from �0.316 MPa to �0.001 MPa (field capacity corre-
sponding to a matric potential of �0.032 MPa).
Impact of matric potential on the variability
and spatial structure of mineralization
Glucose and 2,4-D were chosen as substrates in this study
because it was assumed that glucose mineralization would
be less variable than that of 2,4-D. These two substrates
would therefore allow the effects of the interaction
between the fine-scale spatial distribution of degraders
and matric potential to be studied. As expected, less het-
erogeneity was observed in the mineralization of glucose
than in that of 2,4-D. Changes in soil water content did
not have the same impact on glucose and 2,4-D minerali-
zation and their respective spatial heterogeneity. Increases
in water content led to a reduction in the spatial hetero-
geneity of the pesticide mineralization, presumably by
increasing the probability of degrader and substrate
encounters. The variability of the glucose mineralization
was smaller and more constant for the different matrix
potentials probably because degrading microorganisms
are more numerous and evenly distributed.
Under the wettest conditions, 2,4-D mineralization
showed spatial structure at a similar scale to previous
observations with hot spots of centimetre size (Gonod
et al., 2003, 2006). Here, however, the spatial structure was
demonstrated to depend on the environmental conditions
as there was a loss of spatial structure among samples incu-
bated at Ψ = �0.316 MPa (Fig. 3). Similar trends were
observed for glucose mineralization, although the correla-
tion length for glucose mineralization under the wettest
conditions was shorter than that for 2,4-D mineralization.
These data suggest that the mineralization of both sub-
strates, but principally that of 2,4-D, depend on the con-
nectivity provided by the water-filled pore network and
that the spatial structure observed in the mineralization of
the substrates is a reflection of the spatial organization of
the pore network. The matric potentials used in this study
placed the substrates into pores with maximal pore neck
diameters of 1, 30 and 300 lm, resulting in differential
substrate diffusion within the soil cubes. The limitation of
substrate diffusion decreased probabilities of contact
between substrate and degraders. The fact that the spatial
structure was lost at Ψ = �0.316 MPa (driest conditions)
suggests that the delivery of substrate was a random pro-
cess. The relatively high mineralization rates observed in
the dry samples may have been performed by microorgan-
isms that happened to be located in the small soil pores
into which the substrate was placed. Grundmann et al.
(2007) also concluded that diffusion-controlled isoprotu-
ron mass flow towards microbial hot spots was one of
the main processes enabling increases in isoproturon
Table 1. 16S rRNA and tfdA sequence copy numbers per g of dry
soil and relative number of tfdA gene at the three matric potentials
16S tfdA tfdA 9 103/16S
Ψ = �0.001 MPa
Mean 9.7E+07 9.7E+05 11.3
Min 1.7E+06 2.6E+04 1.8
Max 3.8E+08 3.8E+06 28.6
CV% 64.6 71.9 53.3
Ψ = �0.01 MPa
Mean 9.1E+07 1.1E+06 14.8
Min 7.1E+06 1.6E+05 2.6
Max 2.5E+08 3.3E+06 35.4
CV% 66.4 89.5 71.8
Ψ = �0.316 MPa
Mean 3.6E+07 7.1E+04 3.9
Min 2.4E+06 1.9E+04 0.2
Max 9.3E+07 1.5E+05 16.2
CV% 71.7 44.8 104.7
0 10 20 30 40 50 60 70 80
dA/1
6S
Percent of 2,4-D mineralised
–0.001 MPa
–0.01 MPa
–0.316 MPa
R2 = 0.14
R2 = 0.89
R2 = 0.14
0.04
0.035
0.03
0.025
0.02
0.015
0.01
0.005
0
Fig. 4. Relative number of tfdA gene (tfdA sequence copy number/
16Sr RNA sequence copynumber) related to the percent of 2,4-D
mineralized at Ψ = �0.001 (diamond, black), �0.01 (square, white)
and �0.316 MPa (triangle, grey).
FEMS Microbiol Ecol 81 (2012) 673–683 ª 2012 Federation of European Microbiological SocietiesPublished by Blackwell Publishing Ltd. All rights reserved
Soil matric potential and microbial degraders at fine scale 679

mineralization. Soil moisture is also essential for bacterial
motility that can only occur if liquid films are of sufficient
thickness (Gammack et al., 1992). Dechesne et al. (2010)
highlighted the potential value of flagellar motility in the
mineralization of benzoate in a model system sufficiently
moist to allow bacterial swimming (�8 and �50 kPa).
Such bacterial motility has already been observed for 2,4-D
degraders, and their spreading was associated with an
increase in 2,4-D biodegradation (Pallud et al., 2004).
Finally, dry conditions may cause a decrease in microbial
activity, a decrease in the number of microorganisms or a
combination of these 2 factors, as shown by Han & New
(1994). Therefore, higher soil water contents, by increasing
both degrader growth, activity and spread as well as the
mass transfer of the 2,4-D, may have increased the proba-
bility of encounter resulting in higher 2,4-D mineralization
rates.
Impact of matric potential on soil total
bacteria and 2,4-D degraders
Total bacterial and 2,4-D degrader abundances were esti-
mated at the end of incubation using the 16S rRNA and
tfdA sequence copy numbers, respectively. Considering
that the gene tfdA is mainly carried on a plasmid which
is present at a single or low copy number per bacterium
(Pemberton & Don, 1981), the tfdA quantity in soil is
likely to reflect the size of the 2,4-D degrading bacterial
communities possessing the tfdA gene.
Dryer conditions affected degrader population size as the
tfdA sequence copy number was far lower at
Ψ = �0.316 MPa than at Ψ = �0.01 MPa and
Ψ = �0.001 MPa: soil contained between 13.7 and 15.5
times more degrading bacteria at Ψ = �0.001 and
�0.01 MPa, respectively, than at Ψ = �0.316 MPa.
Although the 16S rRNA sequence copy number was also
affected by drier conditions, the difference was far smaller
(2.5 times more copies at Ψ = �0.01 MPa and
Ψ = �0.001 MPa than at Ψ = �0.316 MPa). Therefore,
the 2,4-D degrading communities carrying tfdA genes were
much more sensitive to dry conditions than the total bacte-
rial communities. 2,4-D degraders represented 1.0–1.2% of
the total bacteria at Ψ = �0.001 and �0.01 MPa, respec-
tively, but only 0.2% at Ψ = �0.316 MPa. Han & New
(1994) observed similar results, namely that 2,4-D degrad-
ers communities were more affected by dry conditions than
the culturable aerobic heterotrophic microorganisms.
Relationship between 2,4-D degraders and the
mineralization function
The 2,4-D mineralization increases with the matrix poten-
tial appeared to be linked to the relative abundance of
tfdA even if the correlations were not all significant. Both
Vieuble Gonod et al. (2006) and Baelum et al. (2008)
observed a relationship between the tfdA sequence copy
number and the rates of 2,4-D mineralization. It should
be noted that the analysis of tfdA gene abundance was
carried out after the samples (and therefore the microor-
ganisms) had been exposed to 2,4-D. This would have
resulted in an increase in the abundance of the tfdA gene,
which may have affected the relationship between gene
abundance and activity.
The activity per unit tfdA sequence copy number was
significantly affected by matric potential. The data suggest
that for a similar mineralization level to be reached, a
higher proportion of degrading microorganisms among
the total bacterial population is required in drier soils.
The impact of matric potential on the relationship
between the relative abundance of tfdA gene and 2,4-D
mineralization can be explained in three ways. First of
all, through short-term effects on microbial activity,
water content may have a strong impact on gene expres-
sion and thus on the function encoded. This will result
in a weakening of the relationship between degrader
abundance, determined by the amount of functional
genes, and the activity in question. Such differences
between activity and abundance have already been
observed for the total bacterial community and for spe-
cific 2,4-D degraders (Felske & Akkermans, 1998; Baelum
et al., 2008). Soil water content can also affect the rela-
tionship between the relative abundance of 2,4-D degrad-
ers and the 2,4-D mineralization by acting on the relative
proportion and activity of bacteria and fungi in soil. It
has been observed that whereas bacterial activity declines
sharply as water potential falls from �0.05 MPa the rela-
tive fungal activity increases (Griffin, 1981; Orchard &
Cook, 1983). Cattaneo et al. (1997), in an experiment in
which a 2,4-D degrading strain was inoculated into soil,
found that the inoculated strain was the most abundant
microorganism at field capacity (�0.03 MPa) but that
fungal species dominated in drier soil. Furthermore, Han
& New (1994) observed that 2,4-D degrading fungi were
more tolerant of dry conditions than were bacteria and
that bacteria were efficient in degrading 2,4-D at matric
potentials above �1.4 MPa. Even if we did not test such
dry conditions, fungal-bacterial competition may have
been higher at Ψ = �0.316 MPa than at the other matric
potentials we tested. As only the bacterial tfdA gene was
quantified here, the fungal contribution to 2,4-D mineral-
ization was not accounted for, which may explain the
absence of correlation between the relative number of
tfdA gene and 2,4-D mineralization observed at the low-
est water content tested. However, fungi that are more
resistant to dry conditions are generally not able to min-
eralize 2,4-D. They are only capable of carrying out the
ª 2012 Federation of European Microbiological Societies FEMS Microbiol Ecol 81 (2012) 673–683Published by Blackwell Publishing Ltd. All rights reserved
680 C. Monard et al.

initial degradation steps and are responsible of the
production of intermediary metabolites (Han & New,
1994; Vroumsia et al., 2005). Finally, higher water
contents might release and mobilize other organic sub-
strates from soil (Young et al., 2008) and thus enhance
2,4-D by co-metabolism, which does not involve the spe-
cific tfdA gene. Han & New (1994) and Vroumsia et al.
(1999) also showed that 2,4-D degradation by fungi
could be stimulated with a supply of an alternative
source of carbon and energy.
Conclusions
The use of 13C-labelled substrates and the microplate sys-
tem developed by Monard et al. (2010) allowed us to
directly link a mineralization function to the size of the
specific degrader community at a fine scale. The results
highlighted the complex relationship that exists between
degrader communities and their environment at small
scales and how this relationship modulates degrader activ-
ity. As proposed by Crawford et al. (2005), soil should be
viewed as a complex system in which the physical and
biological components and their dynamics have to be
accounted for. Small scale studies bring new insight into
how microbial interactions within their microhabitat can
impact soil processes at larger scale.
Acknowledgements
This work was funded by the Agence Nationale de la Recher-
che under the ‘ANR Jeunes Chercheuses – Jeunes Cherch-
eurs’ programme (project number: ANR-05-JCJC-0021).
References
Baelum J, Henriksen T, Hansen HCB & Jacobsen CS (2006)
Degradation of 4-chloro-2-methylphenoxyacetic acid in top-
and subsoil is quantitatively linked to the class III tfdA gene.
Appl Environ Microbiol 72: 1476–1486.Baelum J, Nicolaisen MH, Holben WE, Strobel BW, Sorensen J
& Jacobsen CS (2008) Direct analysis of tfdA gene
expression by indigenous bacteria in phenoxy acid amended
agricultural soil. ISME J 2: 677–687.Barros N, Gomezorellana I, Feijoo S & Balsa R (1995) The
effect of soil moisture on soil microbial activity studied by
microcalorimetry. Thermochim Acta 249: 161–168.Bivand R, Mueller WG & Reder M (2009) Power calculations
for global and local Moran‘s l. Comput Stat Data An 53:
2859–2872.Cattaneo MV, Masson C & Greer CW (1997) The influence of
moisture on microbial transport, survival and 2,4-D
biodegradation with a genetically marked Burkholderia
cepacia in unsaturated soil columns. Biodegradation 8: 87–96.
Chenu C & Stotzky G (2001) Interactions between
microorganisms and soil particles: an overview. Interactions
Between Soil Particles and Microorganisms: Impact on the
Terrestrial Ecosystem (Huang PM, Bollag JM & Senesi N,
eds), pp. 3–40. John Wiley & Sons Ltd, Chichester, UK.
Crawford JW, Harris JA, Ritz K & Young IM (2005) Towards
an evolutionary ecology of life in soil. Trends Ecol Evol 20:
81–87.Dale MRT & Fortin MJ (2002) Spatial autocorrelation and
statistical tests in ecology. Ecoscience 9: 162–167.Dechesne A, Owsianiak Ma, Bazire A, Grundmann GvL,
Binning PJ & Smets BF (2010) Biodegradation in a partially
saturated sand matrix: compounding effects of water
content, bacterial spatial distribution, and motility. Environ
Sci Technol 44: 2386–2392.Felske A & Akkermans ADL (1998) Spatial homogeneity of
abundant bacterial 16S rRNA molecules in grassland soils.
Microb Ecol 36: 31–36.Foster RC (1988) Microenvironments of soil microorganisms.
Biol Fertil Soils 6: 189–203.Franklin RB & Mills AL (2009) Importance of spatially
structured environmental heterogeneity in controlling
microbial community composition at small spatial scales in
an agricultural field. Soil Biol Biochem 41: 1833–1840.Gammack SM, Paterson E, Kemp JS, Cresser MS & Killham K
(1992) Factors affecting the movement of microorganisms
in soils. Soil Biochemistry, Vol. 7 (Stotzky G & Bollag J,
eds), pp. 263–305. Marcel Dekker, New York.
Gonod LV, Chenu C & Soulas G (2003) Spatial variability of
2,4-dichlorophenoxyacetic acid (2,4-D) mineralisation
potential at a millimetre scale in soil. Soil Biol Biochem 35:
373–382.Gonod LV, Martin-Laurent F & Chenu C (2006) 2,4-D impact
on bacterial communities, and the activity and genetic
potential of 2,4-D degrading communities in soil. FEMS
Microbiol Ecol 58: 529–537.Griffin DM (1981) Water potential as a selective factor in the
microbial ecology of soil. Water Potential Relations in Soil
Microbiology, Vol. 9 (Parr JF, Gardner WR & Elliott LF,
eds), pp. 141–151. Soil Science Society of America,
Madison, WI.
Griffiths RI, Whiteley AS, O’Donnell AG & Bailey MJ (2003)
Physiological and community responses of established
grassland bacterial populations to water stress. Appl Environ
Microbiol 69: 6961–6968.Grundmann S, Fuss R, Schmid M, Laschinger M, Ruth B,
Schulin R, Munch JC & Schroll R (2007) Application of
microbial hot spots enhances pesticide degradation in soils.
Chemosphere 68: 511–517.Han SO & New PB (1994) Effect of water availability
on degradation of 2,4-dichlorophenoxyacetic acid (2,4-
D) by soil-microorganisms. Soil Biol Biochem 26: 1689–1697.
Harris RF (1981) Effect of water potential on microbial growth
and activity. Water Potential Relations in Soil Microbiology
FEMS Microbiol Ecol 81 (2012) 673–683 ª 2012 Federation of European Microbiological SocietiesPublished by Blackwell Publishing Ltd. All rights reserved
Soil matric potential and microbial degraders at fine scale 681

(Parr JF, Gardner WR & Elliott LF, eds), pp. 23–95. SoilScience Society of America, Madison, WI.
Helweg A (1987) Degradation and adsorption of 14C-MCPA in
soil—influence of concentration, temperature and moisture
content on degradation. Weed Res 27: 287–296.Hybholt TK, Aamand J & Johnsen AR (2011) Quantification
of centimeter-scale spatial variation in PAH, glucose and
benzoic acid mineralization and soil organic matter in road-
side soil. Environ Pollut 159: 1085–1091.Jenkinson DS & Powlson DS (1976) The effects of biocidal
treatments on metabolism in soil-I. Fumigation with
chloroform. Soil Biol Biochem 8: 167–177.Legendre P & Legendre L (1998) Numerical Ecology. Elsevier,
BV, Amsterdam.
Linn DM & Doran JW (1984) Effect of water-filled pore space
on carbon dioxide and nitrous oxide production in tilled
and nontilled soils. Soil Sci Soc Am J 48: 1267–1272.Martin-Laurent F, Philippot L, Hallet S, Chaussod R, Germon
JC, Soulas G & Catroux G (2001) DNA extraction from
soils: old bias for new microbial diversity analysis methods.
Appl Environ Microbiol 67: 2354–2359.Monard C, Martin-Laurent F, Vecchiato C, Francez A-J,
Vandenkoornhuyse P & Binet F (2008) Combined effect of
bioaugmentation and bioturbation on atrazine degradation
in soil. Soil Biol Biochem 40: 2253–2259.Monard C, Nunan N, Bardoux G & Vieuble-Gonod L (2010)
A miniaturised method to quantify microbial mineralisation
of 13C-labelled organic compounds in small soil samples.
Soil Biol Biochem 42: 1640–1642.Muyzer G, de Waal EC & Uitterlinden AG (1993) Profiling of
complex microbial populations by denaturing gradient gel
electrophoresis analysis of polymerase chain reaction-
amplified genes coding for 16S rRNA. Appl Environ
Microbiol 59: 695–700.Nunan N, Wu K, Young IM, Crawford JW & Ritz K (2002) In
situ spatial patterns of soil bacterial populations, mapped at
multiple scales, in an arable soil. Microb Ecol 44: 296–305.Nunan N, Ritz K, Rivers M, Feeney DS & Young IM (2006)
Investigating microbial micro-habitat structure using X-ray
computed tomography. Geoderma 133: 398–407.Or D, Smets BF, Wraith JM, Dechesne A & Friedman SP
(2007) Physical constraints affecting bacterial habitats and
activity in unsaturated porous media - a review. Adv Water
Resour 30: 1505–1527.Orchard VA & Cook FJ (1983) Relationship between soil
respiration and soil-moisture. Soil Biol Biochem 15: 447–453.Ou LT (1984) 2,4-D Degradation and 2,4-D degrading
microorganisms in soils. Soil Sci 137: 100–107.Ou LT & Thomas JE (1994) Influence of soil organic-matter
and soil surfaces on a bacterial consortium that mineralizes
fenamiphos. Soil Sci Soc Am J 58: 1148–1153.Pallud C, Dechesne A, Gaudet JP, Debouzie D & Grundmann
GL (2004) Modification of spatial distribution of 2,4-
dichlorophenoxyacetic acid degrader microhabitats during
growth in soil columns. Appl Environ Microbiol 70: 2709–2716.
Parker LW & Doxtader KG (1983) Kinetics of the microbial
degradation of 2,4-D in soil - Effects of temperature and
moisture. J Environ Qual 12: 553–558.Parkin TB (1993) Spatial variability of microbial processes in
soil - A review. J Environ Qual 22: 409–417.Pemberton JM & Don RH (1981) Bacterial plasmids of
agricultural and environmental importance. Agric Environ 6:
23–32.Petric I, Philippot L, Abbate C et al. (2011) Inter-laboratory
evaluation of the ISO standard 11063 “Soil quality —Method to directly extract DNA from soil samples”.
J Microbiol Methods 84: 454–460.Prado AGS & Airoldi C (1999) The influence of moisture on
microbial activity of soils. Thermochim Acta 332: 71–74.Ranjard L, Poly F, Combrisson J, Richaume A, Gourbiere F,
Thioulouse J & Nazaret S (2000) Heterogeneous cell density
and genetic structure of bacterial pools associated with
various soil microenvironments as determined by
enumeration and DNA fingerprinting approach (RISA).
Microb Ecol 39: 263–272.Schroll R, Becher HH, Dorfler U, Gayler S, Grundmann S,
Hartmann HP & Ruoss J (2006) Quantifying the effect of
soil moisture on the aerobic microbial mineralization of
selected pesticides in different soils. Environ Sci Technol 40:
3305–3312.Sextone AJ, Revsbech NP, Parkin TB & Tiedje JM (1985)
Direct measurement of oxygen profiles and denitrification
rates in soil aggregates. Soil Sci Soc Am J 49: 645–651.Skopp J, Jawson MD & Doran JW (1990) Steady-state aerobic
microbial activity as a function of soil-water content. Soil
Sci Soc Am J 54: 1619–1625.Soulas G (1993) Evidence for the existence of different
physiological groups in the microbial community
responsible for 2,4-D mineralization in soil. Soil Biol
Biochem 25: 443–449.Strong DT, Sale PWG & Helyar KR (1997) Use of natural
heterogeneity in a small field site to explore the influence of
the soil matrix on nitrogen mineralisation and nitrification.
Aust J Soil Res 35: 579–590.Strong DT, Sale PWG & Helyar KR (1998) The influence of
the soil matrix on nitrogen mineralisation and nitrification.
II. The pore system as a framework for mapping the
organisation of the soil matrix. Aust J Soil Res 36: 855–872.
Treves DS, Xia B, Zhou J & Tiedje JM (2003) A two-species
test of the hypothesis that spatial isolation influences
microbial diversity in soil. Microb Ecol 45: 20–28.Vallaeys T, PerselloCartieaux F, Rouard N, Lors C, Laguerre G
& Soulas G (1997) PCR-RFLP analysis of 16S rRNA, tfdA
and tfdB genes reveals a diversity of 2,4-D degraders in soil
aggregates. FEMS Microbiol Ecol 24: 269–278.Vance ED, Brookes PC & Jenkinson DS (1987) An extraction
method for measuring soil microbial biomass C. Soil Biol
Biochem 19: 703–707.Vroumsia T, Steiman R, Seigle-Murandi F & Benoit-Guyod JL
(1999) Effects of culture parameters on the degradation of
ª 2012 Federation of European Microbiological Societies FEMS Microbiol Ecol 81 (2012) 673–683Published by Blackwell Publishing Ltd. All rights reserved
682 C. Monard et al.

2,4-dichlorophenoxyacetic acid (2,4-D) and 2,4-
dichlorophenol (2,4-DCP) by selected fungi. Chemosphere
39: 1397–1405.Vroumsia T, Steiman R, Seigle-Murandi F, Benoit-Guyod JL &
Gedexe (2005) Fungal bioconversion of 2,4-
dichlorophenoxyacetic acid (2,4-D) and 2,4-dichlorophenol
(2,4-DCP). Chemosphere 60: 1471–1480.Wang HZ, Liu XM, Wu HJ, Huang PM, Xu JM & Tang CX
(2007) Impact of soil moisture on metsulfuron-methyl
residues in Chinese paddy soils. Geoderma 142: 325–333.White D (2007) The Physiology and Biochemistry of Prokaryotes.
Oxford University Press, New York, NY.
Xia T, Baumgartner JC & David LL (2000) Isolation and
identification of Prevotella tannerae from endodontic
infections. Oral Microbiol Immunol 15: 273–275.Young IM, Crawford JW, Nunan N, Otten W & Spiers A
(2008) Chapter 4. Microbial distribution in soils: physics
and scaling. Adv Agron 100: 81–121.
Supporting Information
Additional Supporting Information may be found in the
online version of this article:
Fig. S1. Box plot representation of the 16S sequence copy
number per g of dry soil (a), tfdA sequence copy number
per g of dry soil (b) tfdA 9 103/16S (c) at Ψ = �0.001,
�0.01 and �0.316 MPa.
Fig. S2. 16S sequence copy number per g of dry soil
related to the percent of 2,4-D mineralised at
Ψ = �0.001 (diamond, black), �0.01 (square, white) and
�0.316 MPa (triangle, grey).
Fig. S3. tfdA sequence copy number per g of dry soil
related to the percent of 2,4-D mineralised at
Ψ = �0.001 (diamond, black), �0.01 (square, white) and
�0.316 MPa (triangle, grey).
Please note: Wiley-Blackwell is not responsible for the
content or functionality of any supporting materials sup-
plied by the authors. Any queries (other than missing
material) should be directed to the corresponding author
for the article.
FEMS Microbiol Ecol 81 (2012) 673–683 ª 2012 Federation of European Microbiological SocietiesPublished by Blackwell Publishing Ltd. All rights reserved
Soil matric potential and microbial degraders at fine scale 683