Ants as biological indicators of Wayana Amerindian land use in French Guiana
Upload
hogeschoolvhlCategory
view
0download
0
Impact of severe dry season on net ecosystem exchangein the Neotropical rainforest of French Guiana
D A M I E N B O N A L *, A L E X A N D R E B O S C w , S T E P H A N E P O N T O N z, J E A N - Y V E S G O R E T *,
B E N O I T B U R B A N *, PA T R I C K G R O S S z, J E A N - M A R C B O N N E F O N D w , J A N E L B E R S § ,
B E R N A R D L O N G D O Z z, D A N I E L E P R O N } , J E A N - M A R C G U E H L z and A N D R E G R A N I E R z*INRA, UMR Ecologie des Forets de Guyane, BP 709, 97387 Kourou Cedex, French Guiana, wINRA, UR Ecologie Fonctionnelle
et Physique de l’Environnement, Domaine de la Grande Ferrade, 71 avenue Edouard Bourlaux – BP 81, 33883 Villenave-d’Ornon
Cedex, France, zINRA, UMR Ecologie et Ecophysiologie Forestieres, 54280 Champenoux, France, §Alterra – Green World Research,
PO Box 47, 6700 AA Wageningen, The Netherlands, }UMR Ecologie et Ecophysiologie forestieres, Faculte des Sciences, Universite
Henri Poincare-Nancy 1, BP 239, 54506 Vandoeuvre, France
Abstract
The lack of information on the ways seasonal drought modifies the CO2 exchange
between Neotropical rainforest ecosystems and the atmosphere and the resulting carbon
balance hinders our ability to precisely predict how these ecosystems will respond as
global environmental changes force them to face increasingly contrasting conditions in
the future. To address this issue, seasonal variations in daily net ecosystem productivity
(NEPd) and two main components of this productivity, daily total ecosystem respiration
(REd) and daily gross ecosystem productivity (GEPd), were estimated over 2 years at a flux
tower site in French Guiana, South America (511605400N, 5215404400W). We compared
seasonal variations between wet and dry periods and between dry periods of contrasting
levels of intensity (i.e. mild vs. severe) during equivalent 93-day periods. During the wet
periods, the ecosystem was almost in balance with the atmosphere (storage of
9.0 g C m�2). Seasonal dry periods, regardless of their severity, are associated with higher
incident radiation and lower REd combined with reduced soil respiration associated with
low soil water availability. During the mild dry period, as is normally the case in this
region, the amount of carbon stored in the ecosystem was 32.7 g C m�2. Severe drought
conditions resulted in even lower REd, whereas the photosynthetic activity was only
moderately reduced and no change in canopy structure was observed. Thus, the severe
dry period was characterized by greater carbon storage (64.6 g C m�2), emphasizing that
environmental conditions, such as during a severe drought, modify the CO2 exchange
between Neotropical rainforest ecosystems and the atmosphere and potentially the
resulting carbon balance.
Nomenclature:
Amax 5 Maximum photosynthetic rate (calculated coefficient)
c0 5 Fluctuations in CO2 concentration
ENSO 5 El Nino Southern Oscillation
Fc 5 CO2 eddy flux (Fco0 denotes ecosystem uptake)
GEE 5 Gross ecosystem exchange (30-min)
GEP 5 Gross ecosystem productivity
GEPd 5 Daily gross ecosystem productivity
h 5 Height above the ground surfaceITCZ 5 Inter-Tropical Convergence Zone
k 5 Initial slope of the photosynthetic curve (calculated coefficient)
NEE 5 Net ecosystem CO2 exchange (30 min) (NEEo0 denotes ecosystem
uptake)
Correspondence: Damien Bonal, tel. 1 (594) 594 32 92 87,
fax 1 (594) 594 32 43 02, e-mail: [email protected]
Global Change Biology (2008) 14, 1917–1933, doi: 10.1111/j.1365-2486.2008.01610.x
r 2008 The AuthorsJournal compilation r 2008 Blackwell Publishing Ltd 1917
NEP 5 Net ecosystem productivity (NEPo0 denotes ecosystem uptake)
NEPd 5 Daily net ecosystem productivity (NEPdo0 denotes ecosystem uptake)
PAI 5 Plant area index
PPFD 5 Photosynthetic photon flux density
PPFDd 5 Daily photosynthetic photon flux density
RE 5 Total ecosystem respirationREd 5 Daily total ecosystem respiration
Sc 5 Rate of change in canopy storage (Sc40 denotes storage in ecosystem)
SR 5 Soil respiration
SRd 5 Daily soil respiration
SWC 5 Volumetric soil water content
SWCd 5 Daily volumetric soil water content
SWCnz 5 Soil water content measurements for tube n at depth zu* 5 Friction velocity
VPD 5 Vapour pressure deficit
VPDd 5 Daytime vapour pressure deficit
w0 5 Fluctuations in vertical wind velocity
wSWCd 5 Daily weighted soil water content
wzn 5 Weighting coefficient for tube n at the depth zz 5 Depth in soil
Keywords: dry season, ecosystem respiration, eddy covariance, gross ecosystem productivity, Neotro-
pical rainforest, net ecosystem productivity, soil drought, solar radiation
Received 19 June 2007; revised version received 5 December 2007 and accepted 28 December 2007
Introduction
The role undisturbed Neotropical rainforest ecosystems
play in the amount of carbon exchanged between the
atmosphere and the biosphere has been a subject of
great debate for more than a decade. The first analyses
conducted in the 1990s on direct CO2 flux measure-
ments (Grace et al., 1995a, b, 1996; Malhi et al., 1998,
1999) using the eddy covariance technique (Aubinet
et al., 2000; Baldocchi, 2003) suggested that these eco-
systems were major carbon sinks. However, recent
measurements (e.g. Saleska et al., 2003) or the re-analy-
sis of already-existing flux data (Kruijt et al., 2004; Sierra
et al., 2007) now lead us to believe that the assessment of
these forest ecosystems as large carbon sinks is not so
clear-cut. Other approaches based on either inventory
plots (e.g. Clark, 2002; Baker et al., 2004), modelling of
the functioning of ecosystems (Tian et al., 1998) or the
inverse modelling of atmospheric CO2 fluxes (Ciais
et al., 2005) reinforced this uncertainty.
At the heart of this issue is the fact that variations in
climatic conditions are now being taken into considera-
tion in these analyses. These variations include inter-
annual environmental changes, particularly the El Nino
Southern Oscillation (ENSO) event, and the alternating
dry/rainy seasons (whose intensities might also de-
pend on ENSO events). Such climatic variations affect
the canopy structure and the flux in total ecosystem
respiration (RE) and gross ecosystem productivity
(GEP), the two components of the net ecosystem pro-
ductivity (NEP), leading to contrasting seasonal varia-
tions in the carbon balance in these regions (Grace et al.,
1995a, b, 1996; Malhi et al., 1998; Williams et al., 1998;
Araujo et al., 2002; Carswell et al., 2002; Loescher et al.,
2003; Saleska et al., 2003; Goulden et al., 2004; Meir &
Grace, 2005; Hutyra et al., 2007). A decrease in RE
during dry periods (months with o100 mm precipita-
tion) related to decreases in both heterotrophic soil
respiration (SR) and litter decomposition has been
described as having a mainly positive effect on NEP
(greater negative values) (Tian et al., 2000; Vourlitis et al.,
2001, 2004; Araujo et al., 2002; Goulden et al., 2004;
Hutyra et al., 2007). In contrast, a decrease in GEP
associated with hydraulic limitations to water transfer
in soil, roots, stems and leaves (Malhi et al., 1998;
Vourlitis et al., 2001, 2004; Goulden et al., 2004; Meir &
Grace, 2005) or a decrease in total ecosystem leaf area
(Vourlitis et al., 2001, 2004; Carswell et al., 2002; Goulden
et al., 2004; Meir & Grace, 2005; Hutyra et al., 2007) have
a negative impact on NEP (lesser negative values)
during dry periods. It has been suggested that the
environmental conditions that best explain differences
in NEP between wet and dry periods are the amount of
precipitation during the dry period (Tian et al., 2000),
the variation in cloud cover that leads to a variation in
total solar radiation (Nemani et al., 2003; Goulden et al.,
1918 D . B O N A L et al.
r 2008 The AuthorsJournal compilation r 2008 Blackwell Publishing Ltd, Global Change Biology, 14, 1917–1933

2004; Ichii et al., 2005) and differences in vapour pres-
sure deficit (VPD) (Williams et al., 1998). In contrast, the
lack of seasonal variations in NEP was usually inter-
preted as evidence that tree roots attain deep soil layers
where soil water content remains high even during the
driest months (Da Rocha et al., 2004; Goulden et al.,
2004; Hutyra et al., 2007) or points to the potential
hydraulic redistribution at night by deep root systems
(Lee et al., 2005).
The problem today, however, is that most of the flux
measurements and carbon balance estimations that
have been made to date, with the exception of a study
undertaken in Mato Grosso, Brazil (Vourlitis et al., 2001,
2004; Priante-Filho et al., 2004), have been conducted in
regions where the dry season remains mild (i.e. less
than 2–3 months with o50 mm precipitation), whereas
most climate change scenarios predict an intensification
in the seasons (Trenberth & Hoar, 1997; Cox et al., 2000;
Neelin et al., 2006). In these Neotropical rainforest
ecosystems, the dry seasons will then become drier
and the rainy seasons wetter. Thus, as suggested by
Goulden et al. (2004), studying forest ecosystems that
are subjected today to contrasting amounts of soil water
content throughout the year might help to give us some
indication of the future response of Neotropical rain-
forest ecosystems to climatic changes and the resulting
carbon balance.
To that end, in 2003 a monitoring site, known as the
‘Guyaflux’ experimental site, was set up in an undis-
turbed tropical rainforest in French Guiana to examine
seasonal variations in the climate and their influence on
the carbon balance in these ecosystems. The Guyaflux
site is located in an area where annual rainfall is high
(3041 mm on the average over the past decade) and
severe seasonal dry periods (at least 4 consecutive
months with o50 mm precipitation) occur every 2–3
years, in association or not with ENSO events (Meteo
France, personal communication). These periods result
in a sharp decrease in the amount of soil water available
in the upper soil layers and could induce a water-
related stress to the trees (Guehl, 1984). Based on data
collected during a mild dry period in 2004 vs. those
collected during a severely dry season in 2005, we
sought to answer the following questions:
� Are there seasonal variations in daily NEP (NEPd) in
the Neotropical rainforest in French Guiana?
� Does the intensity of the seasonal dry periods (mild
vs. severe) influence daily NEPd and its carbon
balance over these periods?
� Are the main components of NEPd (i.e. daily total
ecosystem, REd, and daily gross ecosystem produc-
tivity, GEPd) affected by seasonal variations in cli-
matic conditions and their intensity?
� Which environmental parameters explain these
variations?
Materials and methods
Study site
This study was conducted in French Guiana, South
America (511605400N, 5215404400W; Fig. 1) where the
climate is tropical wet, mainly driven by the north/
south movement of the Inter-Tropical Convergence
Zone (ITCZ). This zone brings heavy rains when it is
above French Guiana (December–February and April–
July); it leads to a short, dry period (March) when
located south of French Guiana and a long, dry period
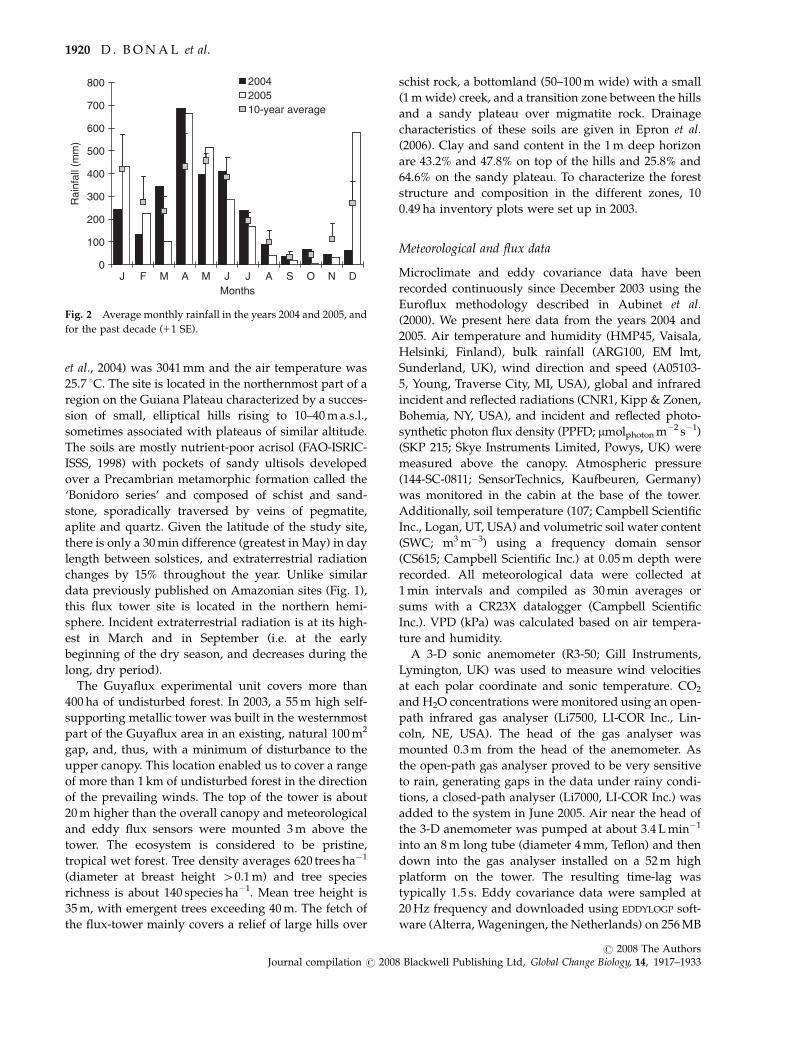
(August–November) when located to the north (Fig. 2).
The severity of this long, dry period is highly variable
from year to year. Some long, dry periods remain mild
(e.g. in 2004), with 50–100 mm precipitation each
month, whereas some dry periods are severe (e.g.
in 2005), with 4 months with o50 mm precipitation
(Fig. 2).
Over the past decade, the average annual rainfall at
the study site (Paracou field station, Gourlet-Fleury
70° 60°80° 50° 40°
10°
0°
10°
20°
30°
W
Fig. 1 Location of the Guyaflux experimental unit, French
Guiana (511605400N, 5215404400W; white triangle). The shaded area
corresponds to the Neotropical rainforest region. The black
triangles represent the main tropical rainforest sites with flux
tower measurements published so far. The grey triangle corre-
sponds to a transitional tropical forest site (Mato Grosso, Brazil)
subjected to strong seasonal dry periods (Vourlitis et al., 2001,
2004; Priante-Filho et al., 2004).
H I G H E R N E P U N D E R S E V E R E D R O U G H T 1919
r 2008 The AuthorsJournal compilation r 2008 Blackwell Publishing Ltd, Global Change Biology, 14, 1917–1933
et al., 2004) was 3041 mm and the air temperature was
25.7 1C. The site is located in the northernmost part of a
region on the Guiana Plateau characterized by a succes-
sion of small, elliptical hills rising to 10–40 m a.s.l.,
sometimes associated with plateaus of similar altitude.
The soils are mostly nutrient-poor acrisol (FAO-ISRIC-
ISSS, 1998) with pockets of sandy ultisols developed
over a Precambrian metamorphic formation called the
‘Bonidoro series’ and composed of schist and sand-
stone, sporadically traversed by veins of pegmatite,
aplite and quartz. Given the latitude of the study site,
there is only a 30 min difference (greatest in May) in day
length between solstices, and extraterrestrial radiation
changes by 15% throughout the year. Unlike similar
data previously published on Amazonian sites (Fig. 1),
this flux tower site is located in the northern hemi-
sphere. Incident extraterrestrial radiation is at its high-
est in March and in September (i.e. at the early
beginning of the dry season, and decreases during the
long, dry period).
The Guyaflux experimental unit covers more than
400 ha of undisturbed forest. In 2003, a 55 m high self-
supporting metallic tower was built in the westernmost
part of the Guyaflux area in an existing, natural 100 m2
gap, and, thus, with a minimum of disturbance to the
upper canopy. This location enabled us to cover a range
of more than 1 km of undisturbed forest in the direction
of the prevailing winds. The top of the tower is about
20 m higher than the overall canopy and meteorological
and eddy flux sensors were mounted 3 m above the
tower. The ecosystem is considered to be pristine,
tropical wet forest. Tree density averages 620 trees ha�1
(diameter at breast height 40.1 m) and tree species
richness is about 140 species ha�1. Mean tree height is
35 m, with emergent trees exceeding 40 m. The fetch of
the flux-tower mainly covers a relief of large hills over
schist rock, a bottomland (50–100 m wide) with a small
(1 m wide) creek, and a transition zone between the hills
and a sandy plateau over migmatite rock. Drainage
characteristics of these soils are given in Epron et al.
(2006). Clay and sand content in the 1 m deep horizon
are 43.2% and 47.8% on top of the hills and 25.8% and
64.6% on the sandy plateau. To characterize the forest
structure and composition in the different zones, 10
0.49 ha inventory plots were set up in 2003.
Meteorological and flux data
Microclimate and eddy covariance data have been
recorded continuously since December 2003 using the
Euroflux methodology described in Aubinet et al.
(2000). We present here data from the years 2004 and
2005. Air temperature and humidity (HMP45, Vaisala,
Helsinki, Finland), bulk rainfall (ARG100, EM lmt,
Sunderland, UK), wind direction and speed (A05103-
5, Young, Traverse City, MI, USA), global and infrared
incident and reflected radiations (CNR1, Kipp & Zonen,
Bohemia, NY, USA), and incident and reflected photo-
synthetic photon flux density (PPFD; mmolphoton m�2 s�1)
(SKP 215; Skye Instruments Limited, Powys, UK) were
measured above the canopy. Atmospheric pressure
(144-SC-0811; SensorTechnics, Kaufbeuren, Germany)
was monitored in the cabin at the base of the tower.
Additionally, soil temperature (107; Campbell Scientific
Inc., Logan, UT, USA) and volumetric soil water content
(SWC; m3 m�3) using a frequency domain sensor
(CS615; Campbell Scientific Inc.) at 0.05 m depth were
recorded. All meteorological data were collected at
1 min intervals and compiled as 30 min averages or
sums with a CR23X datalogger (Campbell Scientific
Inc.). VPD (kPa) was calculated based on air tempera-
ture and humidity.
A 3-D sonic anemometer (R3-50; Gill Instruments,
Lymington, UK) was used to measure wind velocities
at each polar coordinate and sonic temperature. CO2
and H2O concentrations were monitored using an open-
path infrared gas analyser (Li7500, LI-COR Inc., Lin-
coln, NE, USA). The head of the gas analyser was
mounted 0.3 m from the head of the anemometer. As
the open-path gas analyser proved to be very sensitive
to rain, generating gaps in the data under rainy condi-
tions, a closed-path analyser (Li7000, LI-COR Inc.) was
added to the system in June 2005. Air near the head of
the 3-D anemometer was pumped at about 3.4 L min�1
into an 8 m long tube (diameter 4 mm, Teflon) and then
down into the gas analyser installed on a 52 m high
platform on the tower. The resulting time-lag was
typically 1.5 s. Eddy covariance data were sampled at
20 Hz frequency and downloaded using EDDYLOGP soft-
ware (Alterra, Wageningen, the Netherlands) on 256 MB
0
100
200
300
400
500
600
700
800
J F M A M J J A S O
2004200510-year average
Rai
nfal
l (m
m)
MonthsN D
Fig. 2 Average monthly rainfall in the years 2004 and 2005, and
for the past decade (11 SE).
1920 D . B O N A L et al.
r 2008 The AuthorsJournal compilation r 2008 Blackwell Publishing Ltd, Global Change Biology, 14, 1917–1933

memory cards inserted into a HP200LX laptop (Hewlett
Packard, Palo Alto, CA, USA). Data were recorded
weekly and the proper functioning and cleanliness of
the instruments was ensured. The CO2 and H2O analy-
sers were recalibrated using N2 and CO2 reference gases
and a chilled mirror hygrometer (MTS-1; Walz, Effel-
trich, Germany) according to the manufacturers’ in-
structions, typically three to four times a year.
Because turbulent transfer is not always seen within
the ecosystem at night (e.g. calm nights), a CO2 profile
system was used to estimate the 30 min storage or
release of CO2 from the soil level to eddy flux instru-
ment (Aubinet et al., 2000). Atmospheric CO2 concen-
tration was analysed at six different heights (0.5, 6, 13,
23, 32 and 58 m) using a 0.8 L min�1 pump connected to
a six-line solenoid valve and an infrared gas analyser
(Li820, LI-COR Inc.). The system is operated by a
CR10X datalogger (Campbell Scientific Inc.) that re-
cords CO2 concentration data every 15 min.
Soil respiration was measured using a flowthrough,
non-steady-state chamber system multiplexing four
chambers set up in the vicinity of the tower
(i.e. � 100 m). The system started to record continuous
half-hourly measurements from May 3, 2005 with three
chambers only. A fourth chamber was added on June
22. The chambers are fully described in Jassal et al.
(2005). A CR10X datalogger (Campbell Scientific Inc.)
recorded the sequential operation of the chambers and
programmed to sample each chamber for 3.75 min every
half hour (consequently, the lid was kept open 87% of the
time for each chamber). The system measured the in-
crease in CO2 concentration in the headspace by circulat-
ing the air through Synflex 1300 tubing to a closed-path
CO2 infrared gas analyser (Li840; LI-COR Inc.). The flow
rate in the tubing was 2.5–3.0 L min�1 except in the gas
analyser loop where the diverted air circulated at
0.35 L min�1. The gas analyser was calibrated monthly
by sequentially using CO2-free nitrogen gas for the offset
calibration and a gas of known CO2 concentration (ca.
501mmol mol�1) for the gain calibration. Soil CO2 flux
was calculated by a linear regression of the 10 s time
average of the CO2 concentration starting after the first
40 s of measurement. Records characterized by coeffi-
cients of determination of the regression o0.99 were
discarded (i.e. o0.3% of the records).
Flux data processing and gap-filling
The net ecosystem CO2 exchange (NEE) for each 30 min
period was calculated based on the mass exchange
between the ecosystem and the atmosphere following
standard methodologies (Aubinet et al., 2000). NEE was
computed as the sum of CO2 eddy fluxes (Fc 5 covar-
iance between vertical wind velocity fluctuations,
w0, and fluctuations in CO2 concentration, c0) and the
rate of change in canopy storage (second term, Sc) every
30 min:
NEE ¼ w0c0 þ @
@t
Z58
0
cðhÞdh;
where t is the time and h is the height above the ground
surface. Because the vertical coordinate for wind velo-
cities is positive upward, positive values for fluxes
denote CO2 emission to the atmosphere by the ecosys-
tem and negative values denote uptake. Data were
processed with ALTEDDY V2.1 software (Alterra) using
the Euroflux methodology (Aubinet et al., 2000), includ-
ing standard data quality checks (Foken et al., 2004) and
corrections. We also applied the procedure detailed by
Reichstein et al. (2005) to determine the threshold of
friction velocity (u*) below which night-time NEE was
correlated with u*. Thirty-minute data were sorted
according to 0.05 m s�1 classes in u*. This threshold
was calculated as 0.15 m s�1 (Fig. 3) and night-time data
below this threshold were eliminated. This represented
54% of the available night-time data. Eliminated data
were distributed randomly over the night and then did
not induce any bias in night-time C flux estimations.
After all data quality checks were performed, the clean
raw data over the 2 studied years represented 78% and
36% of the 30 min values during daytime and night-
time, respectively. These percentages were 94% and 38%
when considering only the long, dry periods.
Assuming that daytime variations in total ecosystem
respiration are low (low diurnal air temperature ampli-
tude) and that diurnal ecosystem respiration equals
nocturnal respiration [see discussion in Reichstein
FcSc
−2
0
2
4
6
8
10
12
0.0 0.1 0.2 0.3 0.4 0.5 0.6 0.7
NEEFcSc
Flu
x (µ
mol
CO
2 m
−2 s
−1)
Friction velocity (m s−1)
Fig. 3 The relationship between the CO2 eddy flux (Fc, * ), the rate
of change in canopy storage (Sc, �) or the net ecosystem exchange
(NEE, �) and friction velocity (u*) at night. The vertical dotted line
represents the threshold of u* (0.15 m s�1) below which night-time
NEE was correlated with u*, as determined following Reichstein
et al. (2005).
H I G H E R N E P U N D E R S E V E R E D R O U G H T 1921
r 2008 The AuthorsJournal compilation r 2008 Blackwell Publishing Ltd, Global Change Biology, 14, 1917–1933

et al. (2005)], gross ecosystem exchange (GEE) for
each 30 min period was calculated as the difference
between the running mean of RE over 7 days obtained
from NEE values at night and NEE values for each
30 min period.
NEP was computed as the algebraic sum of NEE
values over a given period, mainly 24 h (then becoming
NEPd) or a season. To calculate NEP, missing data were
gap-filled using the following three procedures. (i)
Under dry air conditions, the correlations between
open- and closed-path analysers for CO2 and H2O
fluxes were high (typically with R240.92) and were
used to gap-fill the data from the open-path analyser
from June to December 2005 lost due to wet conditions
(typically rainy half-hours and the following hour). (ii)
Night-time data: air or soil temperature variations at
night are low and no significant empirical model could
be found to relate night-time NEE values with any other
environmental parameter. As such, commonly used
empirical models or look-up tables for data gap-filling
(Falge et al., 2001) could not be used here. Missing
night-time data were then gap-filled using the following
procedure, adapted from Van Dick & Dolman (2004).
For gaps smaller than 2 h in duration, half-hourly
values were estimated as the mean of the flux over
the 2 preceding and that over the 2 following hours for
the considered day and the days before and after. For
larger gaps, the flux was estimated as the mean of the
flux for this time of the night and for the 2 preceding
and 2 following hours over the 3 preceding and that
over the 3 following days, respectively. If the procedure
failed to produce an estimate, we consecutively used
the preceding and following 15, 30 and 60 days instead.
(iii) Daytime data: missing NEE data were gap-filled
using nonlinear multiple regression models that esti-
mated 30 min data as a function of 30 min averages of
PPFD and VPD for each homogeneous climatic period
(adapted from Falge et al., 2001). Meteorological data
covered the full 2004–2005 period, except for 2 days in
2005 (March 18–19) because of a datalogger breakdown.
These data were gap-filled using regressions obtained
with 30 min data from an automatic weather station
(Enerco 407, Cimel Electronique, Paris, France) installed
in grassland 10 km away from the tower. Errors asso-
ciated with these procedures might clearly affect the
absolute magnitude of the fluxes, but fluxes in different
seasons and years should be affected similarly and still
allow pertinent comparisons.
Missing SR values represented o5% of the 30 min
data. The following gap-filling procedure was applied
to each chamber individually. Short gaps (o6 h) were
filled by using a 6 h running mean. For longer gaps,
linear multiple regression models were used to gap-fill a
single chamber dataset from the three others (R2 ranged
from 0.61 to 0.79). No gaps were filled when missing
values concerned more than one chamber at a time.
Weighted soil water content
In July 2003, we set up twenty 3 m long Tecanats tubes
(SDEC France, Reignac, France; external diameter: 42 mm)
along a 1 km long transect that crosses the Guyaflux site
from the tower. The tubes were inserted into holes bored
using a 40 mm wide auger. They were sealed at the base
and could be opened at the top to insert a probe. In the
bottomland, the tubes could not be inserted deeper than
1.3 m because of the presence of the permanent water
table. Soil water content measurements (SWCnz) were
made every 0.2 m in each tube using a time domain
reflectometry probe (TRIME FM3; Imko, Ettlingen,
Germany) at a frequency of about 3 weeks.
To examine the possible impact of soil drought on the
functioning of the ecosystem, we characterized the
weighted soil water content (wSWC, m), which is
representative of the soil water content from the surface
to 2.4 m depth and covers the different soil types in the
Guyaflux area. For a given sampling date, wSWC was
calculated as follows:
wSWC ¼ 0:2�X
z
Xn
ðSWCzn � wznÞ" #
;
where 0.2 is the distance between two consecutive
measurements in each tube, SWCzn is the soil water
content (m3 m�3) recorded on this date for tube n at
depth z and wzn is a weighting coefficient for tube n at
the depth z. wzn takes into account the estimated area
represented by each soil type in the Guyaflux site
(putative average footprint of the eddy fluxes from
the tower) and the number of tubes in each soil type.
In order to estimate the daily wSWC (wSWCd), we used
an empirical regression between wSWC and the aver-
age of SWC measured at 0.05 m depth over the 5 days
before wSWC was measured. No SWCnz measurements
were made between May 27 and October 8, 2004
because of a breakdown in the probe.
Plant area index (PAI) and litter production
Plant area index in the 10 inventory plots was estimated
using two LAI2000 (LI-COR Inc.) during both the wet
and dry periods in 2005, the reference sensor placed on
top of the flux tower. Within each inventory plot, 35–45
randomly distributed measurements were made in the
morning before direct sunlight could reach the sensors.
To reduce the influence of standing trunks in the PAI
calculations, a 381 solid angle was chosen.
1922 D . B O N A L et al.
r 2008 The AuthorsJournal compilation r 2008 Blackwell Publishing Ltd, Global Change Biology, 14, 1917–1933

Estimated litter production (Mg carbon ha�1 yr�1) in
the footprint of the flux tower was calculated based on
40 litter traps (0.67 m� 0.67 m 5 0.45 m2) placed 1.5 m
high above the ground at each corner of the 10 inven-
tory plots. Trap contents were collected on the same day
twice a month and oven-dried at 60 1C for 3 days before
being weighed to the nearest 0.1 g.
Data analysis
Based on daily rainfall and variations in wSWCd, we
defined two different periods (wet vs. long, dry period)
in each year with the same length (93 consecutive days).
We selected ‘Day of the Year’ (DOY) 90–182 for the wet
period and DOY 243–335 for the long, dry period.
The response of GEE to variations in PPFD during
different climatic periods was assessed using nonlinear,
least-square regressions from the SAS program (SAS
Institute, Cary, NC, USA) expressed as follows:
GEE ¼ Amax �PPFD
kþ PPFD;
where Amax and k are coefficients calculated using raw
GEE and PPFD data. Following this expression, Amax is
the maximum photosynthetic rate (mmolCO2 m�2 s�1)
and k is the initial slope of the photosynthetic curve
(mmolphoton m�2 s�1). Each parameter was associated
with a 95% confidence interval and the intercomparison
of the parameter estimates of a given period with the
intervals of the other periods allowed us to discuss
whether the fitted curves differed between the 2005
wet, and the 2004 and 2005 long, dry periods.
We calculated daily sums or averages of ecosystem
and environmental parameters (denoted by the sub-
script suffix ‘d’). Negative NEPd values denote CO2
uptake by the ecosystem from the atmosphere and
positive values carbon emission. GEPd and REd are both
positive. To compare variations in NEPd, GEPd and REd
over time during the long, dry periods, we calculated a
2-week running mean of the daily values (6 consecutive
days before and after the given date). To test the
influence of PPFDd on seasonal variations in GEPd or
REd, linear or nonlinear regression models (Vourlitis
et al., 2001; Granier et al., 2007) were fitted to our data.
Both the linear or nonlinear correlations between the
residuals from these functions and other environmental
variables (i.e. air temperature, wind speed or direction,
VPDd, wSWCd) were tested. We also tested the correla-
tion between NEPd and REd, and between the residuals
of this function and environmental variables, and be-
tween REd and SRd. All these tests were performed
either over the 2-year study period or over the above-
mentioned seasonal periods using SAS software (SAS
Institute).
Results
Seasonal variations in climatic conditions and standcharacteristics
Climatic conditions were characterized by the succes-
sion of wet and dry periods, associated with large
variations in mean daily air temperatures (22.9–
27.2 1C), daytime VPD (0.1–1.4 kPa) and total, daily
global radiation (0.9–26.5 MJ m�2 day�1) (Fig. 4). At
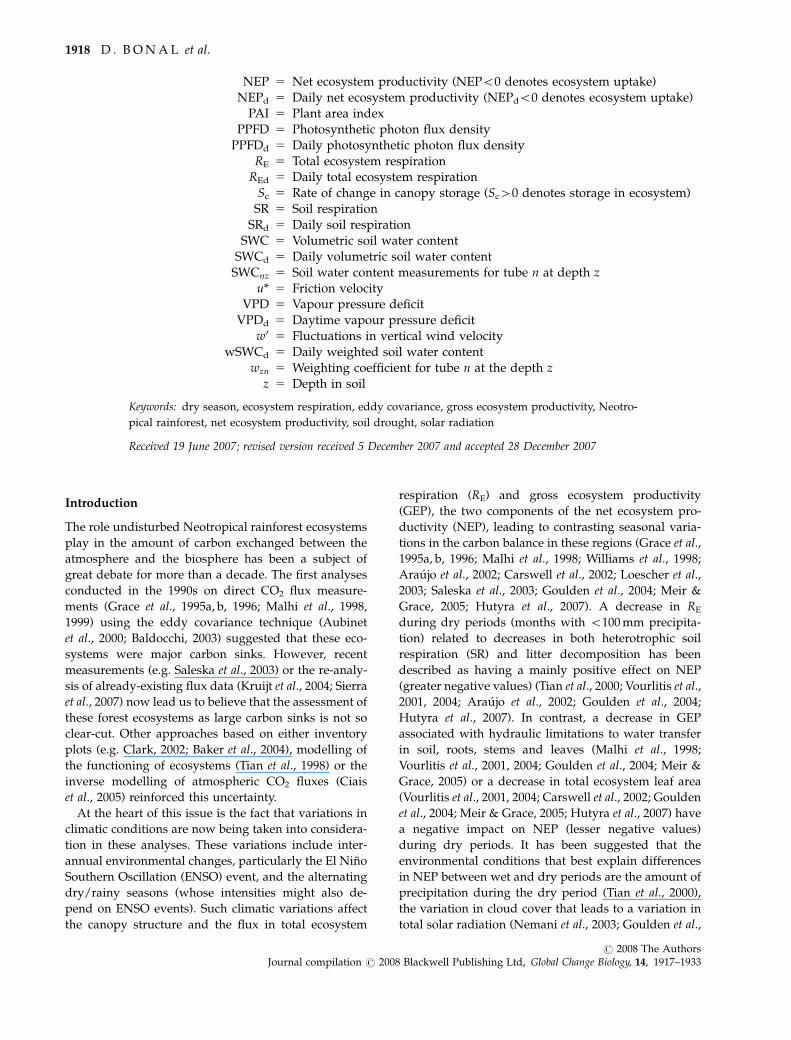
the end of the long, dry period, SWCd at the surface
was lower in 2005 than in 2004 (0.12 and 0:17 m3H2O m�3
soil)
(Fig. 5). The same pattern was observed at 2.4 m depth
(0.17 and 0:23 m3H2O m�3
soil). The decrease in wSWCd
during the 2005 long, dry period was sharper and fell
lower (0.38) than during the 2004 dry period (0.49).
Furthermore, wSWCd in 2005 was lower over a 45-day
period than the minimum values reached in 2004. In
2004, several sporadic rain events during the dry season
induced a succession of increases (and subsequent
decreases) in wSWCd that were not observed in 2005
(Fig. 5).
Daily average air temperature, VPDd and PPFDd
during the long, dry periods were higher than during
the wet season (Table 1), whereas atmospheric pressure,
wind direction, wind speed and soil temperature were
not different. The 2005 long, dry period was character-
ized by a strong deficit in cumulated precipitation as
compared with values averaged over the past 10 years
at this site (Fig. 2), whereas cumulated values during
the 2004 dry period were close to average (i.e. 2.5 times
more than in 2005), except in November. Except for
PPFDd (slightly higher in 2004 than in 2005), there were
no other significant differences in climatic parameters
between the long 2004 and 2005 dry periods.
Average litter production was 4.3 and 4.6 MgC ha�1 yr�1
in 2004 and 2005. The highest values occurred at the
beginning of the long, dry season in 2004 and in the
middle of the long, dry season in 2005 (Fig. 6). PAI did
not differ between the 2005 wet and long, dry periods
(7.0 � 0.2 and 6.9 � 0.3 m2 m�2, respectively) (Fig. 6).
Seasonal variations in CO2 fluxes
There were large seasonal variations in NEPd, GEPd and
REd in 2004 and 2005 (Fig. 7). Whatever the season,
NEPd values were both negative and positive, with
average values of �0.43 and �0.39 g C m�2 day�1 in
2004 and 2005, respectively. The lowest values were
found during the short, dry period in March
(� �4.20 g C m�2 day�1) and the highest during the
wet season (� 6.12 g C m�2 day�1). NEPd was positive
over 41.3% of the days during the 2005 wet period and
over 38.7% and 25.8% of the days during the 2004 and
H I G H E R N E P U N D E R S E V E R E D R O U G H T 1923
r 2008 The AuthorsJournal compilation r 2008 Blackwell Publishing Ltd, Global Change Biology, 14, 1917–1933

2005 long, dry periods, respectively. When periods with
the same duration were compared, cumulated NEPd led
to higher carbon storage (more negative values) in the
ecosystem during the long, dry periods than during the
wet ones (Table 1).
In both years, there was a seasonal trend towards
higher REd and GEPd values during the transition
between the wet and the long, dry period and decreas-
ing values during the long, dry periods (Fig. 7).
The seasonal pattern of SRd paralleled REd, with wet
season values (� 3.5 g C m�2 day�1) intermediate be-
tween the highest fluxes of the transitional periods
(� 4.5 g C m�2 day�1) and the lowest fluxes of the long,
dry season (� 2.5 g C m�2 day�1) (Fig. 8). The observed
increase in SRd during the transitional period (Novem-
ber 26–December 16) was not transferred to REd.
0.0
0.1
0.2
0.3
0.4
j-04 a-04 a-04 d-04 a-05 a-05 d-050.0
0.2
0.4
0.6
0.8
1.0
−0.2 m −2.4 m wSWCdSW
Cd(m
3 H O
m3 so
l−1)
Date
wS
WC
d(m
)
Fig. 5 Seasonal variations in daily average soil water content
(SWCd, m3 m�3) at 0.20 m (�) and 2.40 m (�) depth and weighed
soil water content (wSWCd, m) (grey line). The wSWCd is
representative of the SWC from the soil surface to 2.4 m depth
and covers the spatial variations in soil types in the footprint of
the eddy fluxes in the Guyaflux experimental area (see ‘Materials
and methods’ for details on the calculations). The horizontal
black lines illustrate the periods (93 consecutive days in 2004 and
2005) considered in this study as the long, dry periods.
0
40
80
120
160
200R
ainf
all (
mm
day
−1)
0
5
10
15
20
25
30
Glo
bal r
adat
ion
(MJ
m−2
day−1
)
22
23
24
25
26
27
28
Air
tem
pera
ture
(°C
)(a)
(b)
(c)
0.0
0.2
0.4
0.6
0.8
1.0
1.2
1.4
1.6
j-04 m-04 m-04 j-04 s-04 n-04 j-05 m-05 m-05 j-05 s-05 n-05
Date
Vap
our
pres
sure
def
ict (
KP
a) (d)
Fig. 4 Seasonal variations (2004–2005) in daily (a) rainfall, (b)
global radiation, (c) air temperature and (d) daytime air vapour
pressure deficit at the Guyaflux experimental unit, French Guiana.
Each dot represents 1 day. The lines represent the running mean
(6 days before and 6 days after) of the parameters. The horizontal
black lines illustrate the periods (93 consecutive days in 2004 and
2005) considered in this study as the long, dry periods.
Table 1 Average values or sums of climatic parameters, litter
production, daily net ecosystem productivity (NEPd), daily
total ecosystem respiration (REd) and daily gross ecosystem
productivity (GEPd) during 93 consecutive days in the 2005
wet period [days of the year (DOY) 90–182] and in the 2004
and 2005 (DOY 243–335) long, dry periods
2004 2005 2005
Long, dry
period
Wet
period
Long, dry
period
Air temperature ( 1C) 26.4 25.7 26.6
Soil temperature ( 1C) 25.6 25.3 25.7
Wind direction (1) 116.7 116.1 108.1
Wind speed (m s�1) 2.8 2.6 2.9
Atmospheric pressure
(mbar)
1005.5 1006.3 1006.0
Rainfall (mm) 156.4 1473.4 66.8
VPDd (kPa) 1.10 0.65 1.11
PPFDd (molphoton m�2) 3888.6 2756.3 3677.1
Litter production
(MgC ha�1)
1.15 0.99 1.37
NEPd (g C m�2) �32.7 �9.0 �64.6
REd (g C m�2) 975.6 876.2 888.6
GEPd (g C m�2) 1008.4 885.2 953.2
1924 D . B O N A L et al.
r 2008 The AuthorsJournal compilation r 2008 Blackwell Publishing Ltd, Global Change Biology, 14, 1917–1933

Contrasting patterns between mild and severe dry periods
During the long, dry periods, NEPd was highly variable
(Fig. 9a), mainly displaying negative values. In 2004,
NEPd remained stable until the middle of the dry
period (October 13), when it started to decrease. It
reached its minimum (more negative) values around
November 8 and sharply increased thereafter to reach
positive values by November 24. On the contrary, NEPd
decreased early during the 2005 long, dry period and
then increased until October 22. Another sharp decrease
occurred until November 8 when NEPd reached its
minimum values. After this date, NEPd increased,
nearly reaching positive values on December 1.
The REd was lower under severe (vs. mild) drought
conditions, except in the middle of the dry period when
values between the years were similar (Fig. 9b). At the
end of the long, dry period, the ratio of REd under
severe vs. mild drought conditions was 0.80. Mean-
while, lower GEPd values during severe drought con-
ditions were found only over the last third of the period
(from November 1) (Fig. 9c). At the end of the long, dry
periods, the ratio of GEPd under severe vs. mild
drought conditions was 0.82.
Seasonal, environmental monitoring of GEPd, REd
and NEPd
Daily photosynthetic photon flux density accounted
for 46% and 8% of the seasonal variation in GEPd
(Fig. 10) and REd (data not shown), respectively.
Residuals from this function with GEPd were not
correlated with any other variable (P 5 0.12), whereas
residuals from this function with REd were slightly
correlated with wSWCd and VPDd (R2 5 0.02,
P 5 0.003).
When only considering the long, dry periods, varia-
tions in GEPd in 2004 could not be explained by any
environmental variable (all P-values 40.10). Variations
in REd were only correlated with wSWCd (R2 5 0.09,
0
2
4
6
8
10
Litte
r pr
oduc
tion
(Mg
ha−1
yr−1
) P
lant
are
a in
dex
(m2
m−2
)
Date
Fig. 6 Seasonal variations (�1 SE) in average litter production
(�) calculated from 40 litter traps distributed over the 10 in-
ventory plots in the footprint of the flux tower at the Guyaflux
experimental unit, French Guiana. Additionally, the average
plant area index (PAI, m2 m�2, ^) during the 2005 wet (May
16–18) and long, dry (November 16–18) seasons was estimated
based on � 40 measurements within each inventory plot using
LAI2000 sensors. The horizontal black lines illustrate the periods
(93 consecutive days in 2004 and 2005) considered in this study
as the long, dry periods.
−6
−4
−2
0
2
4
6
8
Date
NE
Pd
(gC
m−2
day
−1)
(a)
0
2
4
6
8
10
12
14
16
RE
d (g
C m
−2 d
ay−1
)
Date
(b)
0
2
4
6
8
10
12
14
16
Date
GE
Pd
(gC
m−2
day
−1) (c)
Fig. 7 Seasonal variations (2004–2005) in (a) daily net ecosys-
tem productivity (NEPd, g C m�2 day�1), (b) daily total ecosys-
tem respiration (REd, g C m�2 day�1) and (c) daily gross
ecosystem productivity (GEPd, g C m�2 day�1) at the Guyaflux
experimental unit, French Guiana. For NEPd, negative values
denote carbon storage in the ecosystem. Each dot represents
1 day. The lines represent the running mean (6 days before and
6 days after). The horizontal black lines illustrate the periods
(93 consecutive days in 2004 and 2005) considered in this study
as the long, dry periods.
H I G H E R N E P U N D E R S E V E R E D R O U G H T 1925
r 2008 The AuthorsJournal compilation r 2008 Blackwell Publishing Ltd, Global Change Biology, 14, 1917–1933

Po0.01). During the 2005 long, dry period, variations in
GEPd were only correlated with wSWCd (R2 5 0.09,
Po0.001) and variations in REd were correlated with
wSWCd and VPDd (R2 5 0.22, Po0.001).
NEPd was slightly linearly correlated with REd
(R2 5 0.07, Po0.001) (Fig. 11a). When only considering
the long, dry periods, this correlation was stronger
(R2 5 0.22 and 0.19 in 2004 and 2005, respectively;
Po0.001) (Fig. 11b). There was a weak linear relation-
ship between REd and SRd (R2 5 0.02, P 5 0.027)
(data not shown). This correlation was stronger
(R2 5 0.19, Po0.001) when considering only the data
from the long, dry season and the days before Novem-
ber 13 when SRd increased without any increase
in REd.
There were significant differences between periods in
the parameters (Amax and k) of the model between GEE
and PPFD (Fig. 12). Amax was lower during both long,
dry periods as compared to the wet period, but it did
not differ between long, dry periods. k was lower in the
2005 long, dry period as compared with the wet and the
2004 long, dry periods.
0
1
2
3
4
5
6
j-05 m-05 m-05 j-05 s-05 n-05
SR
d (g
C m
−2 d
ay−1
)
Date
Fig. 8 Estimated seasonal variations in daily soil respiration
(SRd, g C m�2 day�1) at the Guyaflux experimental unit, French
Guiana, from automatic chambers installed in May 2005. Each
dot represents 1 day. The lines represent the running mean
(6 days before and 6 days after). The horizontal black lines
illustrate the periods (93 consecutive days) considered in this
study as the long, dry periods.
NE
P d (g
C m
−2 d
ay−1
)
−1.6
−1.2
−0.8
−0.4
0.0
0.4
0.8(a)
RE
d (g
C m
−2 d
ay−1
)
8
9
10
11
12
13
14(b)
GE
P d (g
C m
−2 d
ay−1
)
8
9
10
11
12
13
14
a o nDate
(c)
s
wS
WC
d (m
)
0.3
0.4
0.5
0.6
0.7(d)
PP
FD
d (m
olph
oton
m−2
day
−1)
25
30
35
40
45
50
a o nDate
(e)
s
Fig. 9 Left: Running mean (6 days before and 6 days after) of (a) daily net ecosystem productivity (NEPd, g C m�2 day�1), (b) daily total
ecosystem respiration (REd, g C m�2 day�1) and (c) daily gross ecosystem productivity (GEPd, g C m�2 day�1) during the 2004 (black line)
and 2005 (grey line) long, dry periods (93 consecutive days, days of the year 243–335) at the Guyaflux experimental unit, French Guiana.
For NEPd, negative values denote carbon storage in the ecosystem. Right: Running mean (6 days before and 6 days after) of (d) daily
average weighted soil water content (wSWCd, m) and (e) daily sum of photosynthetic photon flux density (PPFDd, molphoton m�2 day�1)
during the 2004 (black line) and 2005 (grey line) long, dry periods (93 consecutive days).
1926 D . B O N A L et al.
r 2008 The AuthorsJournal compilation r 2008 Blackwell Publishing Ltd, Global Change Biology, 14, 1917–1933

Discussion
Seasonal variations in NEPd
Our results were consistent with the strong seasonal
patterns in NEPd observed so far for Neotropical rain-
forests. The studied ecosystem successively acted as a
sink or a source of CO2 on a daily scale during both wet
and dry periods (Fig. 7a), but NEPd patterns varied
between seasons. The frequency and amplitude of these
variations were higher during wet periods, underlying
the fast response of CO2 fluxes to the highly variable
climatic conditions encountered during wet periods
(Fig. 4). Cumulated NEPd values over periods of the
same duration led to higher carbon storage in the
ecosystem during long, dry periods as compared with
wet ones (Table 1). The magnitude of the difference was
2.7 and 5.4 in 2004 and 2005, respectively. Our results
are then consistent with the higher carbon storage
observed during dry periods in Neotropical rainforest
ecosystems located in Central Amazonia (Nepstad et al.,
2002; Goulden et al., 2004; Hutyra et al., 2007).
Contrasting environmental conditions during mild vs.severe dry periods
Both studied years were characterized by a long, dry
period (August–November), but the decrease in preci-
pitation was much higher in 2005, with four months
with o50 mm precipitation (Fig. 2). Although the entire
Neotropical region experienced a severe deficit in rain
during the last quarter of 2005, in French Guiana the
deficit was similar to that observed during years with
ENSO events (i.e. 1997, 2003; M. France, personal com-
munication). There were no major differences in cli-
matic variables other than rainfall between the mild
(2004) and severe (2005) long, dry periods (Table 1). As
expected, the rainfall deficit during the severe dry
period led to lower wSWCd, greatly reducing the
amount of water extractable by the trees in these types
of soil (Guehl, 1984). We conclude that potential differ-
ences in the functioning of the ecosystem between these
two dry periods would mainly be related to different
SWC in the upper layers. Generally, lower SWC is likely
to induce a restriction in tree growth and transpiration
through stomatal closure (e.g. Bonal et al., 2000b; Bonal
& Guehl, 2001) or xylem embolism (e.g. Tyree et al.,
1998), as well as a decrease in autotrophic respiration
(Epron et al., 2004; Salimon et al., 2004; Sotta et al.,
2004, 2006) and/or heterotrophic respiration through
0
2
4
6
8
10
12
14
16
0 10 30 5020
GE
P d (g
C m
−2 d
ay−1
)
PPFDd (molphoton m−2 day−2)
40
Fig. 10 Relationship between daily gross ecosystem productiv-
ity (GEPd, g C m�2 day�1) and daily sum of photosynthetic
photon flux density (PPFDd, molphoton m�2 day�1) in 2004 and
2005. The model that best explained this relationship was
GEPd ¼ 14:41� PPFDd=ð12:85þ PPFDdÞ (R2 5 0.46; Po0.001).
Each dot represents one day.
12 16
−6
−4
−2
0
2
4
6
8
0 2 4 6 8 14
NE
P d (g
C m
−2 d
ay−1
)
(a)
10
REd (gC m−2 day−1)
1
−4
−3
−2
−1
0
1
2
3
1
(b)
REd (gC m−2 day−1)
NE
P d (g
C m
−2 d
ay−1
)
12 160 2 4 6 8 1410
Fig. 11 (a) Relationship between daily net ecosystem produc-
tivity (NEPd, g C m�2 day�1) and daily total ecosystem respira-
tion (REd, g C m�2 day�1) in 2004 and 2005 (R2 5 0.07, Po0.01).
(b) Relationship between daily net ecosystem productivity
(NEPd, g C m�2 day�1) and daily total ecosystem respiration
(REd, g C m�2 day�1) during the 2004 ( * ) and 2005 (�) long, dry
periods (R2 5 0.22 and 0.19 in 2004 and 2005, respectively;
Po0.001). Each dot represents 1 day.
H I G H E R N E P U N D E R S E V E R E D R O U G H T 1927
r 2008 The AuthorsJournal compilation r 2008 Blackwell Publishing Ltd, Global Change Biology, 14, 1917–1933

decreased microbial activity in the soil (Meir et al., 1996;
Li et al., 2006).
The influence of severe drought on NEPd
When comparing mild vs. severe long, dry periods we
expected that different environmental conditions would
result in different NEPd and levels of carbon storage.
Both long, dry periods were characterized by highly
variable NEPd values (succession of positive and nega-
tive values with an amplitude of 4.80 g C m�2 day�1)
(Fig. 9a), associated with variable climatic conditions
encountered during these periods, even though rain
events were infrequent (Fig. 4). Severe drought condi-
tions induced lower NEPd values over the first half of
the dry period, but similar values thereafter.
Both dry periods were characterized by net carbon
storage in the ecosystem (Table 1), but one of the major
conclusions of our study is that environmental condi-
tions such as that during extremely severe drought
double the amount of total carbon stored in the ecosys-
tem (Table 1). The influence of such severe drought
conditions on carbon storage in Neotropical forest eco-
systems has not been reported earlier. Nevertheless, a
throughfall exclusion experiment undertaken in east-
ern-central Amazonia (The ‘Tapajo’ site), Brazil, to
simulate extremely severe dry periods confirmed that
this ecosystem was sensitive to a reduction in rainfall
during dry periods and demonstrated a decline in
annual aboveground net primary productivity under
dry-down conditions (Nepstad et al., 2002; Asner et al.,
2004). Even though we did not estimate intra-annual
aboveground net primary productivity during this
study, Goulden et al. (2004) showed that carbon storage
in the aboveground biomass is not necessarily corre-
lated with that of the entire ecosystem, particularly
during dry periods. Carbon storage depends mainly
on fast turnover pools, such as leaves and litter, rather
than slow turnover pools, such as woody biomass. We
then conclude that a significant reduction in rainfall
during severe seasonal dry periods and the resulting
decrease in available soil water do induce higher carbon
storage in this ecosystem. Accumulated carbon might
not necessarily be stored in woody pools. Further
measurements of wood increments over a fine time
scale will soon be conducted at this site to confirm this
hypothesis.
Seasonal variations in REd and GEPd
We observed strong seasonal variations in both REd and
GEPd (Table 1, Fig. 7b and c). REd varied in a threefold
manner, from 4.7 to 14.9 g C m�2 day�1, with average
values of 10.1 and 9.5 g C m�2 day�1 in 2004 and 2005,
respectively (Fig. 7b). GEPd was also highly variable
(1.9–16.8 g C m�2 day�1), with average values of 10.6
and 10.0 g C m�2 day�1 in 2004 and 2005, respectively
(Fig. 7c). The annual average of 9.84 for REd and
10.22 g C m�2 day�1 for GEPd were in the upper range
of values found at Neotropical rainforest sites (5.6–
9.3 g C m�2 day�1 for REd, 4.2–9.3 g C m�2 day�1 for
GEPd).
Both years were characterized by higher REd values
during the transitional period between wet and dry
conditions and a decrease thereafter. This peak was
associated with the more highly positive NEPd values
found over the year. Furthermore, seasonal variations in
REd were significantly correlated with those of NEPd
(Fig. 11). Then, as previously generalized for temperate
forest ecosystems (Valentini et al., 2000) and discussed
for another Neotropical ecosystem (Goulden et al., 2004;
Hutyra et al., 2007), variations in REd were a main
determinant of seasonal variations in NEPd. The ampli-
tude of REd was in the higher range of other Neotropical
ecosystems (Malhi et al., 1998; Araujo et al., 2002;
Goulden et al., 2004; Hutyra et al., 2007), but was
proportionally lower than in a transitional tropical
forest subjected to long seasonal dry periods (average
seasonal variations: 3.1–6.0 g C m�2 day�1; Vourlitis
et al., 2004). Seasonal variations in REd were then inter-
mediate between previously published data on Neotro-
pical rainforests and a transitional tropical forest,
probably in association with the intermediate level of
drought conditions found here.
Whereas REd was almost constantly lower under
severe (vs. mild) drought conditions, lower GEPd va-
lues were found only over the last third of the dry
0
5
10
15
20
25
30
35
0 500 1000 1500 2000PPFD (µmolphoton m−2 s−1)
549.3315.8
33.930.6
2004-dry506.640.7
kAmax
2005-dry
40.72005-wet
GE
E (
µmol
CO
2 m
−2 s
−1)
Fig. 12 Modelled relationship between 30 min gross ecosystem
exchange (GEE, mmolCO2 m�2s�1) and the photosynthetic photon
flux density (PPFD, mmolphoton m�2 s�1) during the 2005 wet
period (* ) and the 2004 (�) and 2005 (�) long, dry periods. The
model used was GEE ¼ Amax � PPFD=ðkþ PPFDÞ:
1928 D . B O N A L et al.
r 2008 The AuthorsJournal compilation r 2008 Blackwell Publishing Ltd, Global Change Biology, 14, 1917–1933

period (from November 1; Fig. 9c). Consequently, the
impact of a severe reduction in water availability ap-
pears to be stronger on REd than on GEPd and the
consequences of these different variations over time
were higher levels of carbon storage in the ecosystem
during severe dry periods (Table 1).
Which environmental parameters best explain theseseasonal variations?
REd is the sum of various respiration components in the
ecosystem (roots, litter decomposition, soil micro-
organisms and aboveground biomass). The functioning
of these components depends on processes that are
differently influenced by environmental conditions
and whose response to environmental changes might
be asynchronous, and thus probably displaying differ-
ent seasonal patterns. In contrast to most temperate
forest ecosystems (e.g. Valentini et al., 2000; Reichstein
et al., 2002), seasonal variations in REd could not be
clearly explained by any climatic variables. Soil tem-
perature in the upper layers and atmospheric air tem-
perature have been found to control REd in various
forested ecosystems (e.g. Reichstein et al., 2002). In our
study, like in those conducted in other Neotropical
forests (Grace et al., 1996; Malhi et al., 1998; Araujo
et al., 2002; Loescher et al., 2003), no night-time response
of instantaneous NEE to atmospheric air temperature
was found. During the day, the 5–7 1C range of atmo-
spheric air temperature might indeed induce a slight
temperature response in instantaneous NEE. Neverthe-
less, seasonal variations in mean daily atmospheric
temperature were not correlated with seasonal varia-
tions in REd. Because of the dense forest cover
(PAI � 7.0 m2 m�2), very low amounts of energy
reached the ground and variations in soil temperature
at 0.05 m depth did not exceed 1.7 1C throughout the
year. Variations in soil temperature were then neither
sufficient enough to induce any significant seasonal
change in REd.
Differences in REd between mild and severe dry
periods clearly arose from different levels of SWC.
Several authors have previously examined the influence
of SWC on REd in tropical forest ecosystems. Under dry
soil conditions, the decomposition of organic matter on
the forest floor (Meir et al., 1996; Davidson et al., 2000,
2004), autotrophic respiration in the ground (Epron
et al., 2004; Salimon et al., 2004; Sotta et al., 2004, 2006),
coarse woody debris decomposition (Chambers et al.,
2001) and, to a lesser extent, leaf or wood respiration
(Nepstad et al., 2002; Cavaleri et al., 2006) are greatly
reduced. Among these processes, we measured seaso-
nal variations in SR throughout 2005 and observed a
clear reduction in SRd during the dry period. The
seasonal pattern of SRd is likely driven by the dynamics
in fine root systems (Lee et al., 2004; Misson et al., 2006).
The increase in soil efflux at both the beginning and the
end of the long, dry season might be associated with
periods of fine root growth (Trumbore et al., 2006).
Alternatively, they might also correspond to a period
where inputs of fresh labile carbon were high, for
instance after a period when the rate of fine root
mortality was also high and environmental conditions
were favourable to microbial activities. Variations in
REd did not parallel SRd patterns during the dry–wet
transition (November/December), contrary to the wet–
dry transition (July/August). We hypothesized that
while SR was stimulated by the return of water soil
conditions leading to both renewed root growth and a
burst in the microbial decomposition of accumulated
organic matter, the drop in air temperature (from
26.8 1C in October to 24.5 1C in December) induced a
decrease in aboveground respiration (Damesin et al.,
2002), offsetting the trend in belowground respiration.
Further measurements are needed to confirm this
hypothesis.
Available incident radiation was clearly the key factor
that influenced seasonal variations in GEPd, as pre-
viously found for other Neotropical forest ecosystems
(Malhi et al., 1998; Malhi & Grace, 2000; Loescher et al.,
2003; Goulden et al., 2004, Huete et al., 2006; Hutyra
et al., 2007). It was responsible here for about half of
these variations. Seasonal variations in PPFDd are asso-
ciated with annual variations in incident extraterrestrial
radiation (15% throughout the year) and with the cloud
cover related to the oscillation of the ITCZ. The effect of
PPFDd on GEPd was clearly observable when wet and
long, dry periods were compared. Furthermore, this
effect was also observable when comparing mild dry
and severe dry periods. Indeed, there was a good match
between the lower PPFDd values found at the end of the
long, dry season in 2005 when compared with 2004
(� 18%, Fig. 9e) and the lower GEPd values between the
two periods (19%, Fig. 9c).
In our study, the maximum photosynthetic activity
(Amax) for a given instantaneous PPFD was slightly
lower under drought conditions when compared with
wet ones, but rather similar under mild and severe
drought conditions (Fig. 12). This suggests that drier
conditions induced the alteration of photosynthetic
processes, even though this regulation process did not
significantly increase under more severe conditions.
The absence of major photosynthetic regulation under
drier soil conditions has been previously debated (Cars-
well et al., 2002; Goulden et al., 2004; Huete et al., 2006).
It has been suggested to be mainly associated with the
deep rooting system developed by most tropical rain-
forest tree species (Nepstad et al., 1994), which allows
H I G H E R N E P U N D E R S E V E R E D R O U G H T 1929
r 2008 The AuthorsJournal compilation r 2008 Blackwell Publishing Ltd, Global Change Biology, 14, 1917–1933
them to extract water from the deep soil layers that are
less affected by seasonal drought conditions (Bonal
et al., 2000a; Nepstad et al., 2002). Using a remote
sensing approach, Ichii et al. (2007) confirmed that the
depth of the rooting system is a key factor likely to
control seasonal variations in modelled GEP. Our re-
sults suggest that the mean rooting depth in this eco-
system extends below the soil layers investigated here,
(i.e. to 2.4 m depth). This is consistent with the average
maximum rooting depth observed in Neotropical rain-
forests [i.e. 8.0 m (Nepstad et al., 1994)], and with a
study conducted at a nearby site in French Guiana
showing deep water extraction by some tropical tree
species during the dry season (Bonal et al., 2000a).
The similarities in air characteristics (air temperature
and VPD) between mild and severe dry periods (Table
1) precluded the hypothesis that lower GEPd values
during severe dry periods might also be related to the
influence of VPD on stomatal closure during the day,
which could eventually reduce photosynthesis. It has
also been suggested that the lack of certain nutrients,
particularly nitrogen, might be a potential factor reg-
ulating the function of ecosystems experiencing severe
drought conditions. This question was not studied here,
but Williams et al. (1998) concluded that such effect was
minor in another Neotropical forest site.
Other causes for the absence of a significant reduction
in photosynthetic activity in those ecosystems experien-
cing severe drought could be related to the large differ-
ences between tropical rainforest tree species in their
sensitivity to soil water availability. Under similar en-
vironmental conditions, the threshold of soil water
availability that induces a reduction in photosynthetic
activity greatly differs between species (e.g. Bonal et al.,
2000b; Bonal & Guehl, 2001; Engelbrecht & Kursar,
2003); however, this information was obtained for seed-
lings and young trees growing in plantations. To the
best of our knowledge, no such data yet exist on adult
canopy trees; nevertheless, it is reasonable to believe
that independent of the architecture and depth of the
rooting system, contrasting levels of sensibility to soil
drought do exist among mature individuals. Reduced
GEPd under severe drought conditions, while not sig-
nificantly lower, might then also have occurred because
more trees and species during the 2005 long, dry period
reached the SWC threshold at which an alteration in
photosynthetic processes is induced.
Modifications in canopy properties in response to soil
drought have also been described to explain seasonal
variations in GEPd (Vourlitis et al., 2001, 2004; Carswell
et al., 2002; Goulden et al., 2004; Meir & Grace, 2005).
Variations in litter production over the 2-year study
period (Fig. 6) were consistent with the higher cumu-
lated litter production found during dry periods in
other Neotropical forest ecosystems (Malhi et al., 1998;
Williams et al., 1998; Goulden et al., 2004). However, the
increase in litter production occurred at the onset and
not towards the end of the dry period and did not
induce major changes in canopy properties during long,
dry periods (Fig. 6), in contrast to other Neotropical
forests that displayed a lower leaf area index during
seasonal dry periods (Carswell et al., 2002; Saleska et al.,
2003). Large floristic gradients do exist within the
Neotropical rainforests associated with the different
relative ratios of deciduous vs. evergreen species (Ter
Steege et al., 2000). Whether these gradients could
locally lead to different seasonal patterns in canopy
properties is a worthy question. A clear seasonal cycle
in leaf area throughout Amazonia was recently detected
using satellite data (Myneni et al., 2007); unfortunately,
this study did not cover French Guiana and, thus,
comparisons with our data are impossible. A more
thorough and frequent study of seasonal variations in
canopy leaf dynamics will help confirm the punctual
observations made so far.
Conclusions
These results emphasize that environmental conditions
such as during a severe drought, as expected with
global environmental changes, will modify the CO2
exchange between Neotropical rainforest ecosystems
and the atmosphere and the resulting carbon balance.
The main determinants of these changes seem to be the
amount of available incident radiation and the regula-
tion of ecosystem respiration components given low soil
water availability. A change in canopy structure and the
regulation of photosynthetic activity will play a minor
role, if any, in the seasonal variations in NEPd, probably
in relation to the deep rooting system developed by the
trees in these ecosystems.
We focused on the contrast between mild and severe
long, dry periods to underline the potential effects of
climatic changes on NEP, but the carbon balance of this
ecosystem over the long term also greatly depends on
its functioning during transitional periods during
which climatic conditions and soil water availability
change quickly. Further analyses covering longer time
periods (typically 4–5 years) and including these transi-
tional periods will then be necessary to predict the
future CO2 exchange between this ecosystem and the
atmosphere. Our approach did not take into account
possible, rapid changes in the floristic composition in
these ecosystems that could result from environmental
changes. Additional studies on the response of both
young and adult tropical rainforest tree species to long-
er and more severe dry periods are necessary to predict
1930 D . B O N A L et al.
r 2008 The AuthorsJournal compilation r 2008 Blackwell Publishing Ltd, Global Change Biology, 14, 1917–1933

the future floristic compositions of these ecosystems
and their potential role in atmospheric CO2 storage.
Acknowledgements
We wish to thank the Centre Spatial Guyanais (CSG), the CentreNational des Etudes Spatiales (CNES) and the Centre Interna-tional de Recherche en Agronomie et developpement (CIRAD) forallowing us to install the Guyaflux site on their land property. Theinstallation of this site was made possible thanks to funding fromthe Institut National de la Recherche Agronomique (INRA), theFrench Ministry of Research and the European Community in theframework of the 12th CPER Guyane (Research and Environmentprogrammes) in which the GIS-Silvolab, the French GuiananRegion and Prefecture and the DIREN were involved. Thisresearch was supported by a FNS programme (ACI PNBC) fromthe French Ministry of Research. We thank M. Fournier, E. Dreyerand D. Girou for their help in preparing the initial project, J. Chavefor his help to set up the litter traps, V. Freycon for the soilanalyses, N. Breda for lending LAI2000 sensors, E. Marcon and T.Almeras for their help in data analysis, A. Dejean for her greathelp in revising this manuscript and two anonymous reviewers.
References
Araujo AC, Nobre AD, Kruijt B et al. (2002) Comparative
measurements of carbon dioxide fluxes from two nearby
towers in a central Amazonian rainforest: the manaus LBA
site. Journal of Geophysical Research, 107, D20-8090, doi: 10.1029/
2001JD000676.
Asner GP, Nepstad D, Cardinot G, Ray D (2004) Drought stress
and carbon uptake in an Amazon forest measured with space-
borne imaging spectroscopy. Proceedings of the National Acad-
emy of Sciences, 101, 6039–6044.
Aubinet M, Grelle A, Ibrom A et al. (2000) Estimates of the
annual net carbon and water exchange of forests: the euroflux
methodology. Advances in Ecological Research, 30, 113–175.
Baker TR, Phillips OL, Malhi Y et al. (2004) Increasing biomass in
Amazon forests. Philosophical Transactions of the Royal Society of
London, 359, 353–365.
Baldocchi D (2003) Assessing the eddy covariance technique for
evaluating carbon dioxide exchange rates of ecosystems: past,
present and future. Global Change Biology, 9, 479–492.
Bonal D, Atger C, Barigah TS, Ferhi A, Guehl J, Ferry B (2000a)
Water acquisition patterns of two wet tropical canopy trees of
French Guiana as inferred from H218O extraction profiles.
Annals of Forest Science, 57, 717–724.
Bonal D, Barigah TS, Granier A, Guehl J (2000b) Late stage
canopy tree species with extremely low d13C and high stoma-
tal sensitivity to seasonal soil drought in the tropical rainforest
of French Guiana. Plant, Cell and Environment, 23, 445–459.
Bonal D, Guehl J (2001) Contrasting patterns of leaf water
potential and gas exchange responses to drought in seedlings
of tropical rainforest species. Functional Ecology, 15, 490–496.
Carswell FE, Costa AL, Palheta M et al. (2002) Seasonality in CO2
and H2O flux at an eastern Amazonian rain forest. Journal of Geo-
physical Research, 107, D20-8076, doi: 10.1029/2000JD000284.
Cavaleri MA, Oberbauer SF, Ryan MG (2006) Wood CO2 efflux in
a primary tropical rain forest. Global Change Biology, 12, 2442–
2458.
Chambers JQ, Schimel JP, Nobre AD (2001) Respiration from
coarse wood litter in central Amazon forests. Biogeochemistry,
52, 115–131.
Ciais P, Janssens IA, Shvidenko A et al. (2005) The potential for
rising CO2 to account for the observed uptake of carbon by
tropical, temperate, and boreal forest biomes. In: The Carbon
Balance of Forest Biomes (eds Griffiths H, Jarvis PG), pp. 109–
150. Garland Science/BIOS Scientific Publishers, London.
Clark DA (2002) Are tropical forests an important carbon sink?
Reanalysis of the long-term plot data. Ecological Applications,
12, 3–7.
Cox PM, Betts RA, Jones CD et al. (2000) Acceleration of global
warming due to carbon cycle feedbacks in a coupled climate
model. Nature, 408, 184–187.
Damesin C, Ceschia E, Le Goff N, Ottorini J-M, Dufrene E (2002)
Stem and branch respiration of beech: from tree measurements
to estimations at the stand level. New Phytologist, 153, 159–172.
Da Rocha HR, Goulden ML, Miller SD et al. (2004) Seasonality of
water and heat fluxes over a tropical forest in eastern Ama-
zonia. Ecological Applications, 14, 22–32.
Davidson E, Ishida FY, Nepstad DC (2004) Effects of an experi-
mental drought on soil emissions of carbon dioxide, methane,
nitrous oxide, and nitric oxide in a moist tropical forest. Global
Change Biology, 10, 718–730.
Davidson EA, Verchot LV, Cattanio JH et al. (2000) Effects of soil
water content on soil respiration in forests and cattle pastures
of eastern Amazonia. Biogeochemistry, 48, 53–69.
Engelbrecht BMJ, Kursar TA (2003) Comparative drought-resis-
tance of seedlings of 28 species of co-occurring tropical woody
plants. Oecologia, 136, 383–393.
Epron D, Bosc A, Bonal D, Freycon V (2006) Spatial variation
of soil respiration across a topographic gradient in a tropical
rain forest in French Guiana. Journal of Tropical Ecology, 22,
1–10.
Epron D, Nouvellon Y, Roupsard O et al. (2004) Spatial and
temporal variations of soil respiration in a Eucalyptus planta-
tion in Congo. Forest Ecology and Management, 202, 149–160.
Falge E, Baldocchi D, Olson R et al. (2001) Gap filling strategies
for long term energy flux data sets. Agricultural and Forest
Meteorology, 107, 71–77.
Foken T, Gockede M, Mauder M et al. (2004) Post-field data
quality control. In: Handbook of Micrometeorology: A Guide for
Surface Flux Measurement and Analysis (eds Lee X, Massman W,
Law B), pp. 181–208. Kluwer, Dordrecht.
Goulden ML, Miller SD, Da Rocha HR, Menton MC, De Freitas
HC, Silva Figueira AME, De Sousa CAD (2004) Diel and
seasonal patterns of tropical forest CO2 exchange. Ecological
Applications, 14, 42–54.
Gourlet-Fleury S, Laroussinie O, Guehl JM (2004) Ecology and
management of a Neotropical rainforest. Lessons drawn from Para-
cou, a long-term experimental research site in French Guiana.
Elsevier, Paris.
Grace JC, Lloyd J, McIntyre J et al. (1995a) Carbon dioxide uptake
by an undisturbed tropical rain forest in Southwest Amazonia,
1992 to 1993. Science, 270, 778–780.
Grace JC, Lloyd J, McIntyre J et al. (1995b) Fluxes of carbon
dioxide and water vapour over an undisturbed tropical forest
in South-West Amazonia. Global Change Biology, 1, 1–12.
H I G H E R N E P U N D E R S E V E R E D R O U G H T 1931
r 2008 The AuthorsJournal compilation r 2008 Blackwell Publishing Ltd, Global Change Biology, 14, 1917–1933

Grace JC, Malhi Y, Lloyd J et al. (1996) The use of eddy covariance
to infer the net carbon dioxide uptake of Brazilian rain forest.
Global Change Biology, 2, 209–217.
Granier A, Reichstein M, Breda N et al. (2007) Evidence for soil
water control on carbon and water dynamics in European
forests during the extremely dry year: 2003. Agricultural and
Forest Meteorology, 143, 123–145.
Guehl J (1984) Dynamique de l’eau dans le sol en foret tropicale
humide guyanaise. Influence de la couverture pedologique.
Annals of Forest Science, 41, 195–236.
Huete AR, Didan K, Shimabukuro YE et al. (2006) Amazon
rainforests green-up with sunlight in dry season. Geophysical
Research Letters, 33, L06405, doi: 10.1029/2005GL025583.
Hutyra LR, Munger JW, Saleska SC et al. (2007) Seasonal controls
on the exchange of carbon and water in an Amazonian rain
forest. Journal of Geophysical Research, 112, G03008, doi:
10.01029/02006JG000365.
Ichii K, Hashimoto H, Nemani R, White M (2005) Modeling the
interannual variability and trends in gross and net primary
productivity of tropical forests from 1982 to 1999. Global and
Planetary Change, 48, 274–286.
Ichii K, Hashimoto H, White MA et al. (2007) Constrain-
ing rooting depths in tropical rainforests using satellite data
and ecosystem modeling for accurate simulation of gross
primary production seasonality. Global Change Biology, 13,
67–77.
Jassal R, Black A, Novak M, Morgenstern K, Nesic N, Gaumont-
Guay D (2005) Relationship between soil CO2 concentrations
and forest-floor CO2 effluxes. Agricultural and Forest Meteorol-
ogy, 130, 176–192.
Kruijt B, Elbers JA, Von Randow C et al. (2004) The robustness of
eddy correlation fluxes for Amazon rain forest conditions.
Ecological Applications, 14, 101–113.
Lee J-E, Oliveira RS, Dawson TE, Fung I (2005) Root functioning
modifies seasonal climate. Proceedings of the National Academy
of Sciences, 102, 17576–17581.
Lee X, Wu HJ, Sigler J, Oishi C, Siccama T (2004) Rapid and
transient response of soil respiration to rain. Global Change
Biology, 10, 1017–1026.
Li Y, Xu M, Zou X (2006) Heterotrophic soil respiration in
relation to environmental factors and microbial biomass in
two wet tropical forests. Plant and Soil, 281, 193–201.
Loescher HW, Oberbauer SF, Gholz HL, Clark DB (2003) Envir-
onmental controls on net ecosystem-level carbon exchange
and productivity in a Central American tropical wet forest.
Global Change Biology, 9, 396–412.
Malhi Y, Baldocchi DD, Jarvis PG (1999) The carbon balance of
tropical, temperate and boreal forests. Plant, Cell and Environ-
ment, 22, 715–740.
Malhi Y, Grace J (2000) Tropical forests and atmospheric carbon
dioxide. Tree, 15, 332–337.
Malhi Y, Nobre AD, Grace JC et al. (1998) Carbon dioxide transfer
over a central Amazonian rain forest. Journal of Geophysical
Research, 103, 31593–31612.
Meir P, Grace J (2005) The effects of drought by tropical rainforest
ecosystems. In: Tropical Forests and Global Atmospheric Change
(eds Malhi Y, Phillips O), pp. 75–84. Oxford University Press,
UK.
Meir P, Grace J, Miranda A et al. (1996) Soil respiration in a
rainforest in Amazonia and in Cerrado in Central Brazil. In:
Amazonian Deforestation and Climate (eds Gash JHC, Nobre CA,
Roberts JM, Victoria RL), pp. 319–329. John Wiley & Sons Ltd,
Chichester, UK.
Misson L, Gershenson A, Tang J, McKay M, Cheng W, Goldstein
A (2006) Influences of canopy photosynthesis and summer
rain pulses on root dynamics and soil respiration in a young
ponderosa pine forest. Tree Physiology, 26, 833–844.
Myneni RB, Yang W, Nemani RR et al. (2007) Large seasonal
swings in leaf area of Amazon rainforests. Proceedings of the
National Academy of Sciences, 104, 4820–4823.
Neelin JD, Munnich M, Su H et al. (2006) Tropical drying trends
in global warming models and observations. Proceedings of the
National Academy of Sciences, 103, 6110–6115.
Nemani RR, Keeling CD, Hashimoto H et al. (2003) Climate-
driven increases in global terrestrial net primary production
from 1982 to 1999. Nature, 386, 698–702.
Nepstad DC, Carvalho De CR, Davidson EA et al. (1994) The role
of deep roots in the hydrological and carbon cycles of Ama-
zonian forests and pastures. Nature, 372, 666–669.
Nepstad DC, Moutinho P, Dias-Filho MB et al. (2002) The effects
of partial throughfall exclusion on canopy processes, above-
ground production, and biogeochemistry of an Amazon forest.
Journal of Geophysical Research, 107-D20, 8085, doi: 10.1029/
2001JD000360.
Priante-Filho N, Vourlitis GL, Hayashi MMS et al. (2004) Compar-
ison of the mass and energy exchange of a pasture and a mature
transitional tropical forest of the Southern Amazon basin during
a seasonal transition. Global Change Biology, 10, 863–876.
Reichstein M, Falge E, Baldocchi D et al. (2005) On the separation
of net ecosystem exchange into assimilation and ecosystem
respiration: review and improved algorithm. Global Change
Biology, 11, 1424–1439.
Reichstein M, Tenhunen JD, Roupsard O et al. (2002) Severe
drought effects on ecosystem CO2 and H2O fluxes at three
Mediterranean evergreen site: revision of current hypotheses?
Global Change Biology, 8, 999–1017.
Saleska SC, Miller SD, Matross DM et al. (2003) Carbon in
Amazon forests: unexpected seasonal fluxes and distur-
bance-induced losses. Science, 302, 1554–1557.
Salimon CI, Davidson E, Victoria R, Melo AWF (2004) CO2 flux
from soil in pastures and forests in Southwestern Amazonia.
Global Change Biology, 10, 833–843.
Sierra AA, Harmon M, Moreno FH, Orrego SA, del Valle JI (2007)
Spatial and temporal variability of net ecosystem production
in a tropical forest: testing the hypothesis of a significant
carbon sink. Global Change Biology, 13, 1–6.
Sotta ED, Meir P, Malhi Y, Nobre AD, Hodnett M, Grace J (2004)
Soil CO2 efflux in a tropical forest in central Amazon. Global
Change Biology, 10, 601–617.
Sotta ED, Veldkamp E, Guimaraes BR, Paixao RK, Ruivo MLP,
Almeida SS (2006) Landscape and climatic controls on spatial
and temporal variation in soil CO2 efflux in an Eastern
Amazonian Rainforest, Caxiuana, Brazil. Forest Ecology and
Management, 237, 57–64.
Ter Steege H, Sabatier D, Castellanos H et al. (2000) An analysis
of the floristic composition and diversity of Amazonian forests
1932 D . B O N A L et al.
r 2008 The AuthorsJournal compilation r 2008 Blackwell Publishing Ltd, Global Change Biology, 14, 1917–1933

including those of the guiana shield. Journal of Tropical Ecology,
16, 801–828.
Tian H, Melillo JM, Kicklighter DW, McGuire AD, Helfrich JVKI,
Moore BI, Vorosmarty CJ (1998) Effect of interannual climate
variability on carbon storage in Amazonian ecosystems. Nat-
ure, 396, 664–667.
Tian H, Melillo JM, Kicklighter DW, McGuire AD, Helfrich JI,
Moore BI, Vorosmarty CJ (2000) Climatic and biotic controls on
annual carbon storage in Amazonian ecosystems. Global Ecol-
ogy and Biogeography, 9, 315–336.
Trenberth KE, Hoar TJ (1997) El Nino and climate change.
Geophysical Research Letter, 24, 3057–3060.
Trumbore SE, Da Costa ES, Nepstad DC et al. (2006) Dynamics of
fine root carbon in Amazonian tropical ecosystems and the
contribution of roots to soil respiration. Global Change Biology,
12, 217–229.
Tyree MT, Patino S, Becker P (1998) Vulnerability to drought
induced embolism of Bornean heath and Dipterocarp forest
trees. Tree Physiology, 18, 583–588.
Valentini R, Matteucci G, Dolman AJ et al. (2000) Respiration as
the main determinant of carbon balance in european forests.
Nature, 404, 861–865.
Van Dick AIJM, Dolman AJ (2004) Estimates of CO2 uptake and
release among European forests based on eddy correlation
data. Global Change Biology, 10, 1445–1459.
Vourlitis GL, Priante Filho N, Hayashi MMS, de Sousa Nogueira
J, Caseiro FT, Holanda Campelo Jr J (2001) Seasonal variations
in the net ecosystem CO2 exchange of a mature Amazonian
transitional tropical forest (Cerradao). Functional Ecology, 15,
388–395.
Vourlitis GL, Priante Filho N, Hayashi MMS, Nogueira J, Raiter
F, Hoegel W, Campelo JHJ (2004) Effects of meteorological
variations on the CO2 exchange of a Brazilian transitional
tropical forest. Ecological Applications, 14, 89–100.
Williams M, Malhi Y, Nobre AD, Rastetter EB, Grace JC, Pereira
MGP (1998) Seasonal variation in net carbon exchange and
evapotranspiration in a Brazilian rain forest: a modelling
analysis. Plant, Cell and Environment, 21, 953–968.
H I G H E R N E P U N D E R S E V E R E D R O U G H T 1933
r 2008 The AuthorsJournal compilation r 2008 Blackwell Publishing Ltd, Global Change Biology, 14, 1917–1933
Copyright © 2022 FDOKUMEN