Do temperate rainforest trees have a greater ability to acclimate to changing temperatures than...
10
© New Phytologist (2003) 157: 55 – 64 www.newphytologist.com 55 Research Blackwell Science, Ltd Do temperate rainforest trees have a greater ability to acclimate to changing temperatures than tropical rainforest trees? S. C. Cunningham and J. Read School of Biological Sciences, Monash University, VIC 3800, Australia Summary • Photosynthetic responses to acclimation temperature were investigated in seed- lings of eight Australian rainforest tree species. Australian rainforests extend over 33 ° of latitude, providing an opportunity to compare temperature responses of temperate and tropical species. • Net photosynthesis was measured in leaves developed under a constant (22 ° C : 14 ° C) or fluctuating (17 ° C : 9 ° C - 27 ° C : 19 ° C) day/night temperature regime. These leaves were then subjected to a series of constant temperature regimes and net photosynthesis was measured 14 d after acclimation to each new regime. • Acclimation potential was not affected by the contrasting temperature regimes. The temperate species showed at least 80% of maximum net photosynthesis over a larger span of acclimation temperature than the tropical species. • The lack of an effect of the contrasting temperature regimes on acclimation potential may reflect either that adjustments were unnecessary for temperate species, which already have broad photosynthetic responses to temperature, and tropical species were incapable of adjustments, or that in general species respond to the mean temperature regime and not to the amount of fluctuation in the regime. The higher acclimation potential shown by the temperate species is consistent with the larger seasonal and day-to-day variation in temperature of the temperate climate compared with the tropical climate. Key words: climate, latitude, maximum net photosynthesis, optimum temperature, photosynthetic acclimation. © New Phytologist (2003) 157 : 55–64 Author for correspondence: Shaun Cunningham Tel: +61 02 6246 5136 Fax: +61 02 6246 5510 Email: [email protected] Received: 8 July 2002 Accepted: 3 October 2002 Introduction There are many differences in the structure, species diversity and climate of tropical and temperate forests. However, there have been few direct comparisons of the physiology of their component species. Furthermore, these direct comparisons are often complicated by the inclusion of species with different growth forms (Schreiber & Riederer, 1996; Franks & Farquhar, 1999). The predominant changes in climate from temperate to tropical forests are the increase in temperature and the reduction in seasonality of temperatures (Archibold, 1995). Comparisons of species native to temperate and tropical forests will provide an understanding of how plants are adapted to these contrasting climates. Rainforests occur across a latitudinal range of 33° in Aus- tralia, which includes climates from cool-temperate to tropical. These forests have a disjunct distribution along the eastern margin of Australia, being restricted to areas that have a high annual rainfall (> 1300 mm) and low fire frequency (Webb & Tracey, 1994; Specht & Specht, 1999). Therefore, they provide an opportunity to study the temperature responses of temperate and tropical species within the same forest type. A recent study of some Australian rainforest tree species found that temperate species show maximum net photo- synthesis at lower growth temperatures (the temperature at which leaves are developed) but maintain close to this rate over a larger range of growth temperatures than tropical species (Cunningham & Read, 2002). However, in the field, trees do
-
Upload
independent -
Category
Documents
-
view
1 -
download
0
Transcript of Do temperate rainforest trees have a greater ability to acclimate to changing temperatures than...

©
New Phytologist
(2003)
157
: 55–64
www.newphytologist.com
55
Research
Blackwell Science, Ltd
Do temperate rainforest trees have a greater ability to acclimate to changing temperatures than tropical
rainforest trees?
S. C. Cunningham and J. Read
School of Biological Sciences, Monash University, VIC 3800, Australia
Summary
• Photosynthetic responses to acclimation temperature were investigated in seed-lings of eight Australian rainforest tree species. Australian rainforests extend over33
°
of latitude, providing an opportunity to compare temperature responses oftemperate and tropical species.• Net photosynthesis was measured in leaves developed under a constant(22
°
C : 14
°
C) or fluctuating (17
°
C : 9
°
C
−
27
°
C : 19
°
C) day/night temperature regime.These leaves were then subjected to a series of constant temperature regimes andnet photosynthesis was measured 14 d after acclimation to each new regime.• Acclimation potential was not affected by the contrasting temperature regimes.The temperate species showed at least 80% of maximum net photosynthesis overa larger span of acclimation temperature than the tropical species.• The lack of an effect of the contrasting temperature regimes on acclimationpotential may reflect either that adjustments were unnecessary for temperatespecies, which already have broad photosynthetic responses to temperature, andtropical species were incapable of adjustments, or that in general species respond tothe mean temperature regime and not to the amount of fluctuation in the regime. Thehigher acclimation potential shown by the temperate species is consistent with thelarger seasonal and day-to-day variation in temperature of the temperate climatecompared with the tropical climate.
Key words:
climate, latitude, maximum net photosynthesis, optimum temperature,photosynthetic acclimation.
©
New Phytologist
(2003)
157
: 55–64
Author for correspondence:
Shaun Cunningham
Tel:
+61 02 6246 5136
Fax:
+61 02 6246 5510
Email: [email protected]
Received:
8 July 2002
Accepted:
3 October 2002
Introduction
There are many differences in the structure, species diversityand climate of tropical and temperate forests. However, therehave been few direct comparisons of the physiology of theircomponent species. Furthermore, these direct comparisonsare often complicated by the inclusion of species withdifferent growth forms (Schreiber & Riederer, 1996; Franks& Farquhar, 1999). The predominant changes in climatefrom temperate to tropical forests are the increase intemperature and the reduction in seasonality of temperatures(Archibold, 1995). Comparisons of species native totemperate and tropical forests will provide an understandingof how plants are adapted to these contrasting climates.
Rainforests occur across a latitudinal range of 33
°
in Aus-tralia, which includes climates from cool-temperate to tropical.These forests have a disjunct distribution along the easternmargin of Australia, being restricted to areas that have a highannual rainfall (> 1300 mm) and low fire frequency (Webb &Tracey, 1994; Specht & Specht, 1999). Therefore, theyprovide an opportunity to study the temperature responsesof temperate and tropical species within the same forest type.
A recent study of some Australian rainforest tree speciesfound that temperate species show maximum net photo-synthesis at lower growth temperatures (the temperature atwhich leaves are developed) but maintain close to this rate overa larger range of growth temperatures than tropical species(Cunningham & Read, 2002). However, in the field, trees do

www.newphytologist.com
©
New Phytologist
(2003)
157
: 55–64
Research56
not produce leaves continuously. Instead, leaves are producedduring certain periods of the year and then exposed to theseasonal changes of temperature. The few studies of phenologyin rainforest trees of Australia show that tropical species pro-duce new leaves throughout the wet season from late spring toearly autumn, whereas temperate species produce the major-ity of their leaves during spring and early summer (e.g. Read,1989; Lowman, 1992). The ability to acclimate to newtemperature conditions is likely to be more important intemperate trees due to their shorter growth period and thelarger seasonal variation in temperature of their climates.
In the field, temperate species tend to maintain a similarrate of maximum net photosynthesis over the warmer months(e.g. Drew & Ledig, 1981; Pereira
et al
., 1986). In contrast,tropical species commonly show peaks in maximum net photo-synthesis that are related to rainfall and not to temperature(Doley
et al
., 1987; Lugo
et al
., 1978). The seasonal responsesof net photosynthesis in temperate species have been repro-duced in plants exposed to a series of acclimation tempera-tures in controlled environment cabinets (e.g. Strain
et al
.,1976; Slatyer & Ferrar, 1977b; Mooney
et al
., 1978). Manyof these studies have concluded that species from more vari-able climates have a higher acclimation potential – the abilityto maintain maximum net photosynthesis when exposed toa wide range of acclimation temperatures (temperaturesto which leaves are exposed after development, Berry &Björkman, 1980). Therefore, temperate species are likely tohave a higher acclimation potential due to their exposure tolarger seasonal variations in temperature than tropical species.However, most of these studies have only used two to threeacclimation temperatures (e.g. Battaglia
et al
., 1996; Goldstein
et al
., 1996; Teskey & Will, 1999), which does not give anindication of their full acclimation potential.
Previous studies of Australian rainforest trees, using six toeight acclimation temperatures, have shown distinct differ-ences in photosynthetic responses among species from differ-ent latitudes. A study of temperate rainforest trees foundthat species from lower latitudes showed maximum photo-synthesis at higher acclimation temperatures than species fromhigher latitudes (Hill
et al
., 1988). Tropical and temperatespecies of
Nothofagus
showed little difference in the acclima-tion temperature for maximum photosynthesis (Read, 1990).Instead, the difference was the ability of temperate species toacclimate to a wider range of temperatures than tropical spe-cies. This is consistent with the tropical species of
Nothofagus
being from high altitude areas that experience similarmaximum temperatures of the warmest month to temperateregions of Australasia where
Nothofagus
grows, but havesmaller seasonal variation in temperature (Read, 1990). How-ever, there is a positive relationship between the acclimationtemperature for maximum photosynthesis and the maximumtemperature of the warmest month among the temperate andtropical
Nothofagus
species of Australasia (Read & Hope,1996). Whether these trends in acclimation are true of a broad
range of temperate and tropical genera is the focus of thispaper.
The majority of previous studies have used leaves devel-oped under constant temperature conditions. However, in thefield, plants are exposed to variation in day-to-day conditions.In addition, day-to-day variation in temperature is larger intemperate than tropical climates (Table 1). Therefore, leavesof temperate species in particular would be predicted toshow a higher acclimation potential when developed underambient conditions compared with constant conditions. Afew studies have investigated leaves developed under ambientconditions and then exposed to a series of constant acclima-tion temperatures in controlled environment cabinets (e.g.Tranquillini
et al
., 1986; Hill
et al
., 1988). The acclimationpotential of some species has been measured separately inleaves developed under ambient conditions and in controlledenvironment cabinets (e.g. Hill
et al
., 1988; Read & Busby,1990; Gunderson
et al
., 2000). However, the effect of constantand fluctuating temperatures on their acclimation responsescan not be discerned, as other factors besides temperature arelikely to have varied between the growth conditions. There-fore, this study presents the first investigation under carefullycontrolled conditions of the effect of development underfluctuating vs. constant temperature on the acclimationpotential of net photosynthesis. The study aimed to answerthe following two questions:1 Do temperate species show a greater ability to acclimate tonew temperatures than tropical species?2 Do leaves developed under fluctuating temperature condi-tions show a greater ability to acclimate to new temperaturesthan leaves developed under constant temperature conditions?
Materials and Methods
Species selection
Eight species were selected to cover the latitudinal rangeof rainforests in eastern Australia. Collection sites anddistributional ranges of the species are given in Table 2 andtheir climate profiles are given in Table 3. Two species were
Table 1 Weekly standard deviations (WSD) in maximum temperature for different locations in eastern Australia
Maximum temperature (°C)
Location Annual WSD Summer WSD
Strahan (42° S) 2.4 (0.1) 3.0 (0.2)Noojee (38° S) 3.3 (0.0) 4.2 (0.2)Coffs Harbour (30° S) 2.2 (0.1) 2.2 (0.1)Rockhampton (23° S) 2.0 (0.0) 2.1 (0.2)Cairns (17° S) 1.2 (0.1) 1.4 (0.1)
Values are means of 2 yr of meteorological data (1995 and 1996) with standard errors in brackets.

©
New Phytologist
(2003)
157
: 55–64
www.newphytologist.com
Research 57
selected from each of the four rainforest types (cool-temperate, warm-temperate, subtropical and tropical) definedby Webb (1968). Canopy dominants were chosen as previousresearch has shown that subcanopy species can have narrowerphotosynthetic responses to temperature than would bepredicted from the macroclimate of their distribution (Read& Busby, 1990). All species were evergreen, ensuring thattheir leaves are exposed to the full seasonal changes oftemperature. Species from different families were chosenwhere possible to minimise any confounding effects ofphylogenetic relatedness. Species restricted to high altitudeswere not included in this comparison.
Establishment conditions
Seedlings of all species were from natural populations,collected as recently germinated seedlings or in the case ofthe two tropical species
Alstonia scholaris
(L.) R. Br. and
Castanospermum australe
Cunn. & C. Fraser ex Hook. raisedfrom seed. Seedlings were grown in sandy loam soil inglasshouses for 2 yr before the experiments. Seedlings were
watered every 2 d and fertiliser was added every 14 d inthe form of FOGG-IT fish emulsion fertilizer (FOGG-ITNozzle Company, San Francisco, CA, USA) diluted 1 : 500with water to provide 98 mg l
−
1
of nitrogen, 20 mg l
−
1
ofpotassium, and 31 mg l
−
1
of phosphorus.
Response of net photosynthesis whilst growing under constant or fluctuating temperature treatments
Seedlings were grown under two contrasting temperatureregimes in controlled environment cabinets. One set ofseedlings was grown under a constant day/night temperatureregime of 22
°
C : 14
°
C over a 16 : 8-h cycle. The other setof seedlings was grown under a fluctuating temperatureregime in which the day/night temperature was changed dailyto a random temperature regime between 17
°
C : 9
°
C and27
°
C : 19
°
C, always with an 8
°
C diurnal difference. Thetemperature program included an equal number of all unittemperatures (17, 18, 19, 20, 21, 22, 23, 24, 25, 26 and27
°
C), so that the mean day : night temperature over theexperimental period was 22
°
C : 14
°
C. Each treatment was
Table 2 The species used in the study, grouped into climate groups and with details of their collection sites and distributional ranges
Table 3 Climate profiles for the study species
Collection site Distribution range
Latitude LongitudeAltitude(m) Latitude
Altitude(m)
Temperate speciesEucryphia lucida (Labill.) Baill. (Eucryphiaceae) 41°10′ S 144°57′ E 140 41–43.5° S 5–1000Nothofagus cunninghamii (Hook.) Oerst. (Fagaceae) 41°09′ S 145°01′ E 180 37–43.5° S 0–1440Tristaniopsis laurina (Sm.) Wilson & Waterhouse (Myrtaceae) 37°42′ S 147°22′ E 150 25.5–38° S 5–1035Acmena smithii var. smithii (Poir.) Merrill & Perry (Myrtaceae) 37°25′ S 149°49′ E 200 24.5–39° S 0–1270
Tropical speciesSloanea woollsii F. Muell. (Elaeocarpaceae) 30°43′ S 152°43′ E 60 26–32° S 20–1200Heritiera trifoliolata (F. Muell.) Kosterm. (Sterculiaceae) 28°36′ S 152°43′ E 540 17–30° S 10–1075Castanospermum australe Cunn. & C. Fraser ex Hook. (Fabaceae) 26°38′ S 153°38′ E 40 12.5–30° S 5–1150Alstonia scholaris (L.) R. Br. (Apocynaceae) 16°13′ S 145°52′ E 20 10.5–22° S 0–1300
n
Mean annual temperature(°C)
Max. temp.hottest quarter (°C)
Max. temp. coldest month (°C)
Max. temp. annual range (°C)
Max. temp. range hottest 6 months (°C)
Mean diurnal range (°C)
Mean annual precipitation(mm)
E. lucida 112 9.3 (0.1) 18.0 (0.1) 8.7 (0.2) 10.2 (0.1) 6.0 (0.1) 8.6 (0.1) 2072 (52)N. cunninghamii 354 9.2 (0.1) 18.7 (0.1) 7.8 (0.1) 11.7 (0.1) 6.4 (0.1) 8.6 (0.1) 1764 (28)T. laurina 137 16.2 (0.2) 26.1 (0.2) 16.3 (0.2) 10.2 (0.1) 4.0 (0.1) 11.2 (0.2) 1318 (34)A. smithii 291 16.4 (0.1) 26.1 (0.1) 16.0 (0.2) 10.5 (0.1) 4.2 (0.1) 10.7 (0.2) 1320 (24)S. woollsii 140 15.8 (0.2) 26.0 (0.1) 15.9 (0.2) 10.6 (0.1) 3.8 (0.0) 11.6 (0.2) 1395 (27)H. trifoliolata 98 18.3 (0.2) 27.3 (0.2) 18.6 (0.2) 9.1 (0.1) 3.2 (0.1) 10.7 (0.2) 1750 (64)C. australe 123 20.7 (0.2) 29.0 (0.2) 21.4 (0.3) 8.1 (0.1) 2.8 (0.1) 10.4 (0.3) 1655 (59)A. scholaris 61 23.0 (0.3) 30.2 (0.2) 23.5 (0.3) 7.1 (0.2) 2.3 (0.1) 9.0 (0.3) 1978 (94)
Values are means, with standard errors in brackets, of climate variables produced by ANUCLIM 5.0 (Houlder et al., 1999), or calculated from those variables, for n site locations. Species are presented in order from highest to lowest latitudinal origin.

www.newphytologist.com © New Phytologist (2003) 157: 55–64
Research58
replicated in two cabinets with four seedlings of each speciesin each cabinet. The watering and fertilizer regime applied inthe glasshouses was continued in the cabinets. Seedlings wereraised on stands so that the first set of leaves initiated wasexposed to an irradiance (PPFD) of 600–800 µmol quantam−2 s−1 and the desired temperature regime. This also helpedavoid shading of crown leaves by neighbouring seedlings.Plants were grown under these conditions for 8 wk untilenough leaves had fully expanded for the photosyntheticmeasurements to be carried out.
Instantaneous temperature dependence (ITD) curves weremeasured on leaves expanded under the treatment conditions.A total of eight plants were measured for each species withineach treatment. Photosynthesis was measured in the labora-tory using an ADC LCA4 infrared gas analyser (ADC, UnitedKingdom), which is an open gas-exchange system. Eachexperimental leaf was equilibrated in the leaf chamber atan air temperature of 22 ± 0.1°C, a CO2 concentration of350 ± 5 µl l−1, a PPFD of 800 ± 20 µmol quanta m−2 s−1 anda vapour pressure deficit of 1.1 ± 0.1 kPa until a steady ratewas reached. After the initial photosynthetic measurement at22°C, measurements were taken sequentially at 12°C, 17°C,22°C, 27°C and 32°C. The leaf was equilibrated for 10 minat each new temperature before measurement. The VPD wasmaintained at a constant 1.1 kPa at all air temperatures, withthe exception of 32°C at which the lowest VPD that could bemaintained without condensation building up in the lineswas 1.5 kPa. The area of leaf within the gas chamber wastraced and the traces were measured using image analysis(BIOSCANTM Image Analyser).
Response of net photosynthesis to acclimation temperatures
After the initial ITD curves were measured, one seedlingof each species was removed from each cabinet to reducecrowding. Seedlings from both treatments were thensubjected to a sequence of constant temperature regimes(22°C : 14°C, 30°C : 22°C, 26°C : 18°C, 22°C : 14°C,18°C : 10°C, 14°C : 6°C and 22°C : 14°C). It was decidedthat the acclimation temperatures should start at the highesttemperature and then be progressively lowered for severalreasons. First, the lowest temperature was the most likely todamage leaves of the tropical species and therefore wouldaffect acclimation to subsequent temperatures. Second, theinitial change from 22°C to 30°C was the largest andtherefore would give a conservative estimate of how longleaves would take to acclimate. Finally, the sequence isrepresentative of the seasonal changes in temperatureexperienced in climates of the temperate species, that issummer through to winter.
The acclimation response of seedlings was determinedfrom measurements of the maximum rate of net photo-synthesis (Pmax) and the optimum instantaneous temperature
for net photosynthesis (Topt). Pmax and Topt were measured bychanging the air temperature in 1°C increments until a dis-tinct maximum was recorded. The time taken to acclimate toa new temperature regime was determined when seedlingswere exposed to the 30°C : 22°C temperature regime. Previ-ous studies have found full acclimation has taken up to 2 wk(Slatyer & Ferrar, 1977b; Badger et al., 1982; Hill et al.,1988). Consequently, Pmax was measured in the same leaf after10 and 14 d of acclimation to the new temperature regime.Photosynthetic rates of leaves showed no significant difference(F = 0.32, P = 0.60) between readings taken after 10 and 14 d.
After the photosynthetic measurements were taken at theacclimation temperature of 30°C : 22°C, any shoots thatwere shading the measurement leaves were pruned. The seed-lings were then pruned after each measurement period. Partialdefoliation has been found to found to increase the net photo-synthetic rate (Reich et al., 1993; Pinkard & Beadle, 1998)and arrest the effects of aging on net photosynthesis (Mooney& Chiariello, 1984) in the remaining leaves. To determine theeffect of aging and pruning on net photosynthesis, the leaveswere acclimated to 22°C : 14°C three times over the experi-ment and their photosynthetic rate measured. The measure-ment leaves of seedlings of C. australe began to pale and dropoff during the second acclimation to 22°C : 14°C, presumablyin response to pruning. Consequently, seedlings of C. australewere removed from the experiment after photosyntheticmeasurements were taken for the second acclimation to22°C : 14°C.
Data analysis
ITD curves tended to be asymmetrical and the follow-ing regression curve was found to be an appropriate fit(Ratkowsky et al., 1983):
P = {b (T – Tmin) × [1 – exp(c (T – Tmax))]}2 Eqn 1
where P is the net photosynthetic rate (µmol m−2 s−1), T is theair temperature (°K), Tmin and Tmax are the minimum andmaximum temperatures at which the net photosynthetic rateis zero, and b and c are fitting parameters. Tmin and Tmax weresimply parameters estimated to fit the curve and their valueswere believed to have no physiological significance. Theseregression curves were used to estimate Pmax, Topt, and thetemperature span over which at least 80% of Pmax was shown(Tspan). The mean values of these parameters for each specieswithin each treatment were used as replicates for statisticalanalysis of the climate groups.
For each plant, the values of Pmax for each acclimation tem-perature regime were regressed against acclimation temper-ature using the above equation. The maximum rates of Pmax(PATmax), the optimum acclimation temperatures for Pmax(ATopt) and the span of temperatures over which at least 80%of PATmax was shown (ATspan) were determined from these

© New Phytologist (2003) 157: 55–64 www.newphytologist.com
Research 59
regressions. Any plants that showed less than 80% of theiroriginal Pmax at 22°C : 14°C during the second acclimationto 22°C : 14°C were removed from the analysis. This resultedin Heritiera trifoliolata, Sloanea woollsii and Tristaniopsislaurina having only one replicate cabinet for one of thetemperature treatments. Species’ means of parameters foreach treatment were used in statistical analyses of the climategroups. Sloanea woollsii was removed from this analysis as theregression for the fluctuating treatment produce a straight lineand therefore none of parameters could be derived.
Results
Response of net photosynthesis to instantaneous temperatures whilst growing under constant or fluctuating temperature treatments
Overall, there was no significant difference in the response ofnet photosynthesis to instantaneous temperatures shown bythe climate groups between the constant and fluctuatingtemperature regimes (Table 4). However, among the indi-vidual species there were distinct differences in the responseof net photosynthesis to the temperature treatments. Thetemperate species Eucryphia lucida showed a significantlyhigher Pmax when grown under the fluctuating temperatureregime compared with the constant temperature regime(F = 36.7, P = 0.03). In contrast, the tropical speciesCastanospermum australe showed a significantly lower Pmax inleaves grown under the fluctuating temperature regimecompared with leaves grown under the constant temperatureregime (F = 54.7, P = 0.02).
The climate groups had consistently different responses ofnet photosynthesis to instantaneous temperatures under both
the constant and fluctuating temperature regimes (Table 4).Maximum net photosynthesis was shown at 20.4°C by thetemperate group compared with 22.9°C in the tropical group.The temperate group showed at least 80% of maximum netphotosynthesis over an instantaneous temperature span of24.6°C, which was significantly higher than the temperaturespan of 16.7°C shown by the tropical group (F = 21.2,P < 0.001).
Response of net photosynthesis to acclimation temperatures
Most species showed similar responses of net photosyn-thesis to acclimation temperature between the constant andfluctuating temperature regimes (Fig. 1). The most notabledifference was a 63% increase in the maximum rate of netphotosynthesis in E. lucida when grown under the fluctuatingtemperature regime compared with the constant temperatureregime (Table 5). Four species showed increases in thetemperature span over which at least 80% of PATmax wasmaintained (ATspan) but this increase was only significant forAlstonia scholaris. Similarly, Sloanea woollsii showed acurvilinear response when grown under the constanttemperature regime and a broader linear response whengrown under the fluctuating temperature regime (Fig. 1e).The climate groups showed no significant difference in theresponse of net photosynthesis to acclimation temperaturebetween the constant and fluctuating temperature regimes(Table 6). The temperate group showed a significantly largerATspan of 14.5°C than the tropical group, which onlymaintained PATmax over a span of 9.2°C.
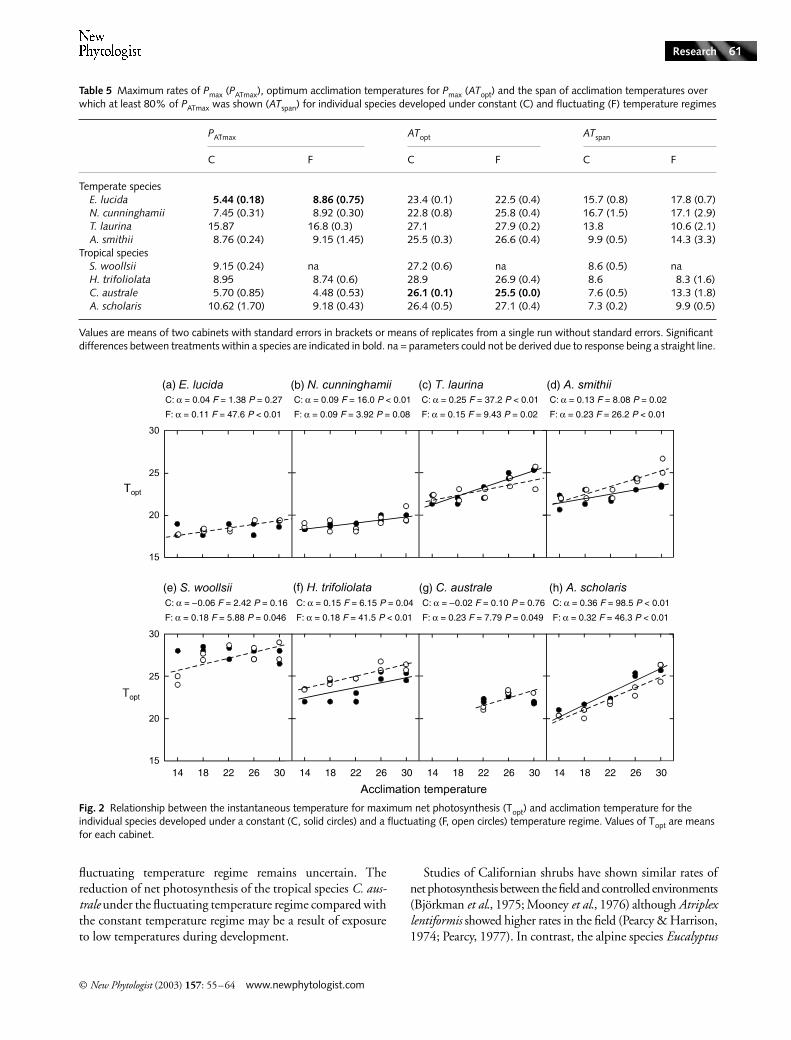
All species showed significant increases in the instantane-ous temperature for maximum net photosynthesis (Topt) withincreasing acclimation temperature in leaves developed underat least one temperature regime (Fig. 2). The exceptions wereE. lucida, S. woollsii and C. australe in the constant temper-ature regime and Nothofagus cunninghamii in the fluctuatingtemperature regime. There was no trend of species showinglarger shifts in Topt when developed under the fluctuatingtemperature regime compared with the constant temperatureregime (F = 1.01, P = 0.33). Furthermore, there was no sig-nificant difference in the magnitude of the shift in Toptbetween the temperate and tropical groups (F = 1.12,P = 0.31).
Discussion
Does development under fluctuating temperatures improve acclimation potential compared with development under constant temperature?
Overall, the temperate and tropical groups showed nodifference in their ability to acclimate to instantaneoustemperatures or new growth temperatures between the
Table 4 Maximum rates of net photosynthesis (Pmax), optimum instantaneous temperatures for net photosynthesis (Topt) and the span of instantaneous temperatures over which at least 80% of Pmax was shown (Tspan) for climate groups grown under constant (C) and fluctuating (F) temperature regimes
Pmax (µmol m−2 s−1) Topt (°C) Tspan (°C)
Temperate C 8.5 (1.9) 20.8 (1.7) 26.0 (1.7)F 9.4 (1.2) 20.0 (1.7) 23.2 (1.4)
Tropical C 6.4 (0.9) 23.0 (0.6) 16.4 (2.2)F 6.0 (1.2) 22.9 (0.9) 16.9 (1.4)
ANOVAClimate F 4.06 4.91 21.6
p 0.07 0.05 <0.001Treatment F 0.05 0.17 0.49
p 0.83 0.68 0.50Climate × treatment F 0.24 0.12 0.95
p 0.63 0.74 0.35
Values are means of the four species in each climate group with standard errors in brackets.

www.newphytologist.com © New Phytologist (2003) 157: 55–64
Research60
constant and fluctuating temperature regimes (Tables 4 and6). However, the temperate species Eucryphia lucida showed a63% increase in maximum net photosynthesis when grownunder the fluctuating temperature regime compared with theconstant temperature regime, whereas the tropical speciesCastanospermum australe showed a 21% decrease.
This increased photosynthetic rate of Eucryphia lucidaunder the fluctuating temperature regime compared with theconstant temperature regime suggests development undermore optimal conditions. The fluctuating temperature regime
included temperatures closer to the growth temperature formaximum net photosynthesis of 19°C shown by E. lucida(Cunningham & Read, 2002) than the constant regime of22°C. However, leaves developed under a temperature regimeof 19°C : 11°C showed maximum net photosynthetic ratesof 5 µmol CO2 m
−2 s−1, which is similar to that shown underthe present constant temperature regime but considerablyless than the 9 µmol CO2 m
−2 s−1 shown under the fluctu-ating temperature regime. Therefore, the mechanism for theenhancement of net photosynthesis in E. lucida under the
Fig. 1 Relationship between maximum net photosynthesis and acclimation temperature for the individual species developed under a constant (C, solid circles) and a fluctuating (F, open circles) temperature regime. Values of Pmax are means for each cabinet with Heritiera trifoliolata, Sloanea woollsii and Tristaniopsis laurina having only one replicate cabinet in one of the treatments. Mean-corrected r2 values are given for each regression.
© New Phytologist (2003) 157: 55–64 www.newphytologist.com
Research 61
fluctuating temperature regime remains uncertain. Thereduction of net photosynthesis of the tropical species C. aus-trale under the fluctuating temperature regime compared withthe constant temperature regime may be a result of exposureto low temperatures during development.
Studies of Californian shrubs have shown similar rates ofnet photosynthesis between the field and controlled environments(Björkman et al., 1975; Mooney et al., 1976) although Atriplexlentiformis showed higher rates in the field (Pearcy & Harrison,1974; Pearcy, 1977). In contrast, the alpine species Eucalyptus
Table 5 Maximum rates of Pmax (PATmax), optimum acclimation temperatures for Pmax (ATopt) and the span of acclimation temperatures over which at least 80% of PATmax was shown (ATspan) for individual species developed under constant (C) and fluctuating (F) temperature regimes
PATmax ATopt ATspan
C F C F C F
Temperate speciesE. lucida 5.44 (0.18) 8.86 (0.75) 23.4 (0.1) 22.5 (0.4) 15.7 (0.8) 17.8 (0.7)N. cunninghamii 7.45 (0.31) 8.92 (0.30) 22.8 (0.8) 25.8 (0.4) 16.7 (1.5) 17.1 (2.9)T. laurina 15.87 16.8 (0.3) 27.1 27.9 (0.2) 13.8 10.6 (2.1)A. smithii 8.76 (0.24) 9.15 (1.45) 25.5 (0.3) 26.6 (0.4) 9.9 (0.5) 14.3 (3.3)
Tropical speciesS. woollsii 9.15 (0.24) na 27.2 (0.6) na 8.6 (0.5) naH. trifoliolata 8.95 8.74 (0.6) 28.9 26.9 (0.4) 8.6 8.3 (1.6)C. australe 5.70 (0.85) 4.48 (0.53) 26.1 (0.1) 25.5 (0.0) 7.6 (0.5) 13.3 (1.8)A. scholaris 10.62 (1.70) 9.18 (0.43) 26.4 (0.5) 27.1 (0.4) 7.3 (0.2) 9.9 (0.5)
Values are means of two cabinets with standard errors in brackets or means of replicates from a single run without standard errors. Significant differences between treatments within a species are indicated in bold. na = parameters could not be derived due to response being a straight line.
Fig. 2 Relationship between the instantaneous temperature for maximum net photosynthesis (Topt) and acclimation temperature for the individual species developed under a constant (C, solid circles) and a fluctuating (F, open circles) temperature regime. Values of Topt are means for each cabinet.

www.newphytologist.com © New Phytologist (2003) 157: 55–64
Research62
pauciflora showed lower rates of photosynthesis in the fieldcompared with rates under constant temperature regimesrepresentative of field temperatures (Slatyer & Ferrar, 1977a;Slatyer & Morrow, 1977). Of course, these differences inphotosynthetic rates between the field and controlled envir-onments may reflect differences in water stress, nutrientavailability, irradiance levels and leaf age rather than temper-ature conditions. Studies where these factors were not limitinghave shown photosynthetic rates of temperate species in thefield are higher or similar in the field compared with con-trolled environments (Battaglia et al., 1996; Gunderson et al.,2000). These findings suggest temperate species commonlyhave higher photosynthetic rates when grown under fluctu-ating temperatures compared with constant temperatures.Therefore, growing species from variable climates, such asE. lucida, under constant temperature regimes is potentiallyunderestimating their maximum net photosynthetic rate. Theenhancement of net photosynthesis in leaves of temperatespecies developed under fluctuating temperature conditions islikely to be an adaptation to the larger day-to-day variationin temperature of temperate climates compared with tropicalclimates (Table 1).
Species showed no significant difference in the span ofinstantaneous temperatures over which maximum net photo-synthesis was maintained (Tspan) between the contrastingor fluctuating temperature regimes (Table 4). In addition,species did not increase the span of acclimation temperaturesover which maximum net photosynthesis was shown (ATspan)when developed under a fluctuating temperature regimecompared with a constant temperature regime (Table 6).Leaves developed under fluctuating temperature conditionswere expected to have larger temperature spans than thosedeveloped under constant temperature conditions, due to the
larger range of temperatures. However, the temperate speciesalready showed close to maximum net photosynthesis overlarge temperature spans in leaves developed under a constanttemperature regime (Tspan = 26°C, ATspan = 14°C), makingadjustments under fluctuating conditions unnecessary. Thetropical species were not expected to adjust to the fluctuatingtemperature regime, as they do not experience such large tem-perature fluctuations in the field.
There was no significant difference in the instantaneoustemperature for maximum net photosynthesis between leavesdeveloped under a constant or a fluctuating temperatureregime (Table 4). Therefore, the Topt of leaves did not respondto the amount of fluctuation in temperature but instead to themean daily temperature. This is consistent with the finding inEucalyptus pauciflora that the temperature for maximum netphotosynthesis was strongly correlated with the mean maxi-mum temperature of the 10 d prior to measurement (Slatyer& Morrow, 1977). Similarly, leaves of Quercus rubra showedthe same Topt when acclimated to three constant temperatureregimes with the same mean daily temperature but differentamplitudes of diurnal change (Chabot & Lewis, 1976). Fur-thermore, when leaves of these species were developed underdifferent constant temperature regimes (Cunningham &Read, 2002), most showed minor shifts in the instantaneoustemperature for maximum net photosynthesis. Therefore, itis unlikely that shifts in the temperature for maximum netphotosynthesis would occur under the daily temperaturechanges of the fluctuating temperature regime.
Do temperate species show a greater ability to acclimate to new temperatures than tropical species?
The temperate group showed maximum net photosynthesisover a 15°C span of acclimation temperatures, which wassignificantly larger than the 9°C span shown by the tropicalgroup (Table 6). A comparison of Nothofagus species alsofound that the temperate species showed maximum photo-synthesis over a larger span of acclimation temperaturesthan the tropical species (Read, 1990). Similarly, the tem-perate group showed close to its highest maximum net photo-synthetic rate over a larger span of growth temperatures thanthe tropical group (Cunningham & Read, 2002).
The tropical species Alstonia scholaris showed the largestshifts in the instantaneous temperature for maximum netphotosynthesis (Topt) with acclimation temperature (Fig. 2).However, these larger shifts in Topt were associated with largerdeclines in maximum net photosynthesis at low acclimationtemperatures than the temperate species. Therefore, theselarger shifts are not a reflection of a higher acclimation poten-tial. A larger span of instantaneous temperatures at whichmaximum net photosynthesis occurs (Tspan) was recorded intemperate species than tropical species, and this diminishesthe importance of shifting Topt towards the new growth tem-perature. The same trend was found for shifts in the instantaneous
Table 6 Maximum rates of Pmax (PATmax), optimum acclimation temperatures for Pmax (ATopt) and the span of acclimation temperatures over which at least 80% of PATmax was shown (GTspan) for climate groups developed under constant (C) and fluctuating (F) temperature regimes
PATmax (µmol m−2 s−1) ATopt (°C) ATspan (°C)
Temperate C 9.4 (2.3) 24.7 (1.0) 14.0 (1.5)F 10.9 (2.0) 25.7 (1.2) 15.0 (1.6)
Tropical C 8.4 (1.4) 27.1 (0.9) 7.8 (0.4)F 7.5 (1.5) 26.5 (0.5) 10.5 (1.5)
ANOVAClimate F 1.25 2.65 13.3
p 0.29 0.14 0.01Treatment F 0.02 0.03 1.51
p 0.88 0.86 0.25Climate × treatment F 0.40 0.68 0.36
p 0.54 0.43 0.56
Values are means of the four species in each climate group with standard errors in brackets.

© New Phytologist (2003) 157: 55–64 www.newphytologist.com
Research 63
temperature for maximum net photosynthesis with growthtemperature (Cunningham & Read, 2002).
It is often argued that acclimation is more likely to occurin evergreen species that occupy a wide range of thermalenvironments or are exposed to large seasonal variations intemperature (Berry & Björkman, 1980). By comparison,species from environments in which growth is restricted toone season, or seasonal temperature variations are small,show a limited ability to acclimate to new temperatures(Kemp & Williams, 1980; Goldstein et al., 1996). Therefore,the greater ability of the temperate species to acclimatemaximum net photosynthesis to new temperatures comparedwith the tropical species is likely to be an adaptation to thelarger seasonal fluctuations in temperature of the temperateclimate. Similarly, the ability of the temperate species tomaintain maximum net photosynthesis over a larger span ofgrowth temperatures than tropical species (Cunningham &Read, 2002) is likely to be an adaptation to the larger tem-perature fluctuations experienced during leaf development inthe field.
Differences in acclimation potential between temperateand tropical species reflect the combination of differences intheir phenology and temperature conditions. Temperaterainforest species of Australia tend to produce new leaves dur-ing spring and early summer (e.g. Ashton & Frankenberg,1976; Read, 1989). By comparison, tropical species produceleaves over a longer period during the wet season from springto autumn (Frith & Frith, 1985; Lowman, 1992). The cli-mates of rainforest species of Australia differ in the largerseasonal and day-to-day variation of temperature experiencedby temperate species compared with tropical species. Con-sequently, leaves of temperate species develop under morevariable temperature conditions, and over their life spanexperience larger divergences from their development condi-tions, than those of tropical species. Therefore, the strategy oftemperate species may be to produce leaves in spring thatcan acclimate to the large temperature changes from springthrough to autumn. In contrast, tropical species may rely lesson acclimation as they are exposed to smaller seasonal varia-tions in temperature and produce new leaves over a muchlonger period.
The present work and other investigations (Read, 1990;Cunningham & Read, 2002) have shown the wider temper-ature tolerance of net photosynthesis in temperate rainforesttrees compared with tropical rainforest trees. Furthermore,temperate rainforest species show maximum growth at tem-peratures higher than the average summer temperatures oftheir native climates (Cunningham & Read, in press). Thesefindings suggest that many temperate trees may adjust ade-quately to the predicted 1°C to 4.5°C temperature increaseby 2100 (Kattenberg et al., 1996). However, the narrowertemperature tolerance of tropical tree species may make themmore susceptible than temperate tree species to the predictedincreases in global temperatures.
Acknowledgements
We thank Alia Thomas and Fiona Clissold for their assistancein data collection. Permission was given to collect seedlings byState Forests of N.S.W. and the Department of NaturalResources and Environment Victoria. This research wassupported by a Monash Postgraduate Research Scholarshipawarded to S.C. and an Australian Research Council LargeGrant awarded to J.R.
ReferencesArchibold OW. 1995. Ecology of world vegetation. London, UK: Chapman
& Hall.Ashton DH, Frankenberg J. 1976. Ecological studies of Acmena smithii
(Poir.) Merrill & Perry with special reference to Wilson’s Promontory. Australian Journal of Botany 24: 453–487.
Badger MR, Björkman O, Armond PA. 1982. An analysis of photosynthetic response and adaptation to temperature in higher plants: temperature acclimation in the desert evergreen Nerium oleander L. Plant, Cell & Environment 5: 85–99.
Battaglia M, Beadle C, Loughhead S. 1996. Photosynthetic temperature responses of Eucalyptus globulus and Eucalyptus nitens. Tree Physiology 16: 81–89.
Berry JA, Björkman O. 1980. Photosynthetic response and adaptation to temperature in higher plants. Annual Review of Plant Physiology 31: 491–543.
Björkman O, Mooney HA, Ehleringer J. 1975. Photosynthetic responses of plants from habitats with contrasting thermal environments: comparison of photosynthetic characteristics of intact plants. Carnegie Institution of Washington Yearbook 74: 743–748.
Chabot BF, Lewis AR. 1976. Thermal acclimation of photosynthesis in Northern Red Oak. Photosynthetica 10: 130–135.
Cunningham SC, Read J. 2002. Comparison of temperate and tropical rainforest tree species: photosynthetic responses to growth temperature. Oecologia 133.
Cunningham SC, Read J. 2003. Comparison of temperate and tropical rainforest tree species: growth responses to temperature. Journal of Biogeography 30 (In press.)
Doley D, Yates DJ, Unwin GL. 1987. Photosynthesis in an Australian rainforest tree, Argyrodendron peralatum, during the rapid development and relief of water deficits in the dry season. Oecologia 74: 441–449.
Drew AP, Ledig FT. 1981. Seasonal patterns of CO2 exchange in the shoot and root of loblolly pine seedlings. Botanical Gazette 142: 200–205.
Franks PJ, Farquhar GD. 1999. A relationship between humidity response, growth form and photosynthetic operating point in C3 plants. Plant, Cell and Environment 22: 1337–1349.
Frith CB, Frith DW. 1985. Seasonality of insect abundance in an Australian upland tropical rainforest. Australian Journal of Ecology 10: 237–248.
Goldstein G, Drake DR, Melcher P. 1996. Photosynthetic gas exchange and temperature-induced damage in seedlings of the tropical alpine species Argyroxiphium sandwicense. Oecologia 106: 298–307.
Gunderson CA, Norby RJ, Wullschleger SD. 2000. Acclimation of photo-synthesis and respiration to stimulated climatic warming in northern and southern populations of Acer saccharum: laboratory and field evidence. Tree Physiology 20: 87–96.
Hill RS, Read J, Busby JR. 1988. The temperature-dependence of photosynthesis of some Australian temperate rainforest trees and its biogeographical significance. Journal of Biogeography 15: 431–449.
Houlder D, Hutchinson M, Nix H, McMahon J. 1999. ANUCLIM User’s Guide. Canberra, Australia: CRES Publications.
Kattenberg A, Giorgi H, Grassl GA, Meehl JFB, Mitvhell RJ, Stouffer T, Tokioka T, Weaver AJ, Wigley TML. 1996. Climate models – projections

www.newphytologist.com © New Phytologist (2003) 157: 55–64
Research64
of future climate. In: Houghton JT, Meira Filho LG, Callander BA, Harris N, Kattenberg A, Maskell K, eds. Climate change 1995: the science of climate change. Cambridge, UK: Cambridge University Press, 285–357.
Kemp PR, Williams I, GJ. 1980. A physiological basis for niche separation between Agropyron smithii (C3) and Bouteloua gracilis. Ecology 61: 846–858.
Lowman MD. 1992. Leaf growth dynamics and herbivory in five species of Australian rainforest canopy trees. Journal of Ecology 80: 433–447.
Lugo AE, Gonzales-Liboy JA, Cintron B, Dugger K. 1978. Structure, productivity and transpiration of a subtropical dry forest in Puerto Rico. Biotropica 10: 278–291.
Mooney HA, Björkman O, Collatz GJ. 1978. Photosynthetic acclimation to temperature in the desert shrub, Larrea divaricata. I. Carbon dioxide exchange characteristics of intact leaves. Plant Physiology 61: 406–410.
Mooney HA, Björkman O, Ehleringer J, Berry J. 1976. Photosynthetic capacity of in situ Death Valley plants. Carnegie Institution of Washington Yearbook 75: 410–413.
Mooney HA, Chiariello NR. 1984. The study of plant function – the plant as a balanced system. In: Dirzo R, Sarukhan J, eds. Perspectives on plant population ecology. Sunderland, MA, USA: Sinauer Associates, Inc. 305–323.
Pearcy RW. 1977. Acclimation of photosynthetic and respiratory carbon dioxide exchange to growth temperature in Atriplex lentiformis (Torr.) Wats. Plant Physiology 59: 795–799.
Pearcy RW, Harrison AT. 1974. Comparative photosynthetic and respiratory gas exchange characteristics of Atriplex lentiformis (Torr.) Wats. in coastal and desert habitats. Ecology 55: 1104–1111.
Pereira JS, Tenhunen JD, Lange OL, Beyschlag W, Meyer A, David MM. 1986. Seasonal and diurnal patterns in leaf gas exchange of Eucalyptus globulus trees growing in Portugal. Canadian Journal of Forest Research 16: 177–184.
Pinkard EA, Beadle CL. 1998. Regulation of photosynthesis in Eucalyptus nitens (Deane and Maiden) Maiden following green pruning. Trees: Structure and Function. 12: 366–376.
Ratkowsky DA, Lowry RK, McMeekin TA, Stokes AN, Chandler RE. 1983. Model for bacterial culture growth rate throughout the entire biokinetic temperature range. Journal of Bacteriology 154: 1222–1226.
Read J. 1989. Phenology and germination in some rainforest canopy species at Mt. Field National Park, Tasmania. Papers and Proceedings of the Royal Society of Tasmania 123: 211–221.
Read J. 1990. Some effects of acclimation temperature on net photosynthesis in some tropical and extra-tropical Australasian Nothofagus species. Journal of Ecology 78: 100–112.
Read J, Busby JR. 1990. Comparative responses to temperature of the major canopy species of Tasmanian cool temperate rainforest and their ecological significance. II. Net photosynthesis and climate analysis. Australian Journal of Botany 38: 185–205.
Read J, Hope GS. 1996. Ecology of Nothofagus forests of New Guinea and New Caledonia. In: Veblen TT, Hill RS, Read J, eds. The Ecology and biogeography of nothofagus forests. London, UK: Yale University Press, 200–256.
Reich PB, Walters MB, Krause SC, Vanderklein DW, Raffa KF, Tabone T. 1993. Growth, nutrition and gas exchange of Pinus resinosa following artificial defoliation. Trees 7: 67–77.
Schreiber L, Riederer M. 1996. Ecophysiology of cuticular transpiration: Comparative investigation of cuticular water permeability of plant species from different habitats. Oecologia 107: 426–432.
Slatyer RO, Ferrar PJ. 1977a. Altitudinal variation in the photosynthetic characteristics of snow gum, Eucalyptus pauciflora Sieb. ex Spreng. II. Effects of growth temperature under controlled conditions. Australian Journal of Plant Physiology 4: 289–299.
Slatyer RO, Ferrar PJ. 1977b. Altitudinal variation in the photosynthetic characteristics of snow gum, Eucalyptus pauciflora Sieb. ex Spreng. V. Rate of acclimation to an altered growth environment. Australian Journal of Plant Physiology 4: 595–609.
Slatyer RO, Morrow PA. 1977. Altitudinal variation in the photosynthetic characteristics of snow gum, Eucalyptus pauciflora Sieb. ex Spreng. I. Seasonal changes under field conditions in the Snowy mountains area of South-eastern Australia. Australian Journal of Botany 25: 1–20.
Specht RL, Specht A. 1999. Australian plant communities. dynamics of structure, growth and biodiversity. Oxford, UK: Oxford University Press.
Strain BR, Higginbotham KO, Mulroy JC. 1976. Temperature precondi-tioning and photosynthetic capacity of Pinus taeda L. Photosynthetica 10: 47–53.
Teskey RO, Will RE. 1999. Acclimation of loblolly pine (Pinus taeda) seedlings to high temperatures. Tree Physiology 19: 519–525.
Tranquillini W, Havranek WM, Ecker P. 1986. Effects of atmospheric humidity and acclimation temperature on the temperature response of photosynthesis in young Larex decidua Mill. Tree Physiology 1: 37–45.
Webb LJ. 1968. Environmental relationships of the structural types of Australian rain forest vegetation. Ecology 49: 296–311.
Webb LJ, Tracey JG. 1994. The rainforests of northern Australia. In: Groves RH, ed. Australian vegetation. Melbourne, Australia: Cambridge University Press, 87–129.