IMPACT OF ORGANIZATIONAL TRUST ON EMPLOYEE MORALE
24
1 http://ssrn.com/abstract=2430035 IMPACT OF ORGANIZATIONAL TRUST ON EMPLOYEE MORALE Kamalachandran Rukshani and Samithamby Senthilnathan Abstract This study attempts to investigate the extent to which the organizational trust of these employees is significantly related to employee morale in comparison between Sri Lanka Telecom and Ceylon Electricity Board in Trincomalee Town and Gravets, Sri Lanka. Findings explore a positive significant relationship between organizational trust and employee morale. Comparatively, correlation coefficient of the relationship is higher for the employees in Sri Lanka Telecom than for the employees in Ceylon Electricity Board. Further, results indicate that all employees in both organizations have high level attributes of organizational trust and employee morale. Comparatively, Sri Lanka Telecom has higher level attribute in organizational trust and Ceylon Electricity Board has higher level attribute in employee morale. Extended analysis confirms that there is a difference between mean values of organizational trust and employee morale in Sri Lanka Telecom and Ceylon Electricity Board in Trincomalee Town and Gravets, Sri Lanka. Key Words: Organizational Trust, Employee Morale, Univariate Analysis, Bivariate Analysis 1. INTRODUCTION Employees are the most valuable asset and main actors in an organization. They are associated with organizational aspects and functionalities, and provide meaning to its performances by achieving organizational objectives and goals. Hence, the degree of employees’ feelings is referred to as their mental status, which is understood as the morale. Employee Morale is an exceptional determinant of organizational health and becomes important, since organizational performance and efficiency depends on it. Morale implies that how employees positively and supportively feel about and to their organization (Haddock, 2010). An organization needs to create some positive impacts on the minds of its employees to have positive morale of employees. These positive impacts make the employees to have initially trust and a strong association with the organization. Therefore, organizational trust of an employee creates positive morale on the organization (e.g., Fard et al., 2010a). Department of Management, Eastern University, Sri Lanka (E-mail: [email protected] ) Freelance Researcher, New Zealand (E-mail: [email protected] )
Transcript of IMPACT OF ORGANIZATIONAL TRUST ON EMPLOYEE MORALE

1 http://ssrn.com/abstract=2430035
IMPACT OF ORGANIZATIONAL TRUST ON EMPLOYEE MORALE
Kamalachandran Rukshani and Samithamby Senthilnathan
Abstract
This study attempts to investigate the extent to which the organizational trust of
these employees is significantly related to employee morale in comparison
between Sri Lanka Telecom and Ceylon Electricity Board in Trincomalee Town
and Gravets, Sri Lanka. Findings explore a positive significant relationship
between organizational trust and employee morale. Comparatively, correlation
coefficient of the relationship is higher for the employees in Sri Lanka Telecom
than for the employees in Ceylon Electricity Board. Further, results indicate that
all employees in both organizations have high level attributes of organizational
trust and employee morale. Comparatively, Sri Lanka Telecom has higher level
attribute in organizational trust and Ceylon Electricity Board has higher level
attribute in employee morale. Extended analysis confirms that there is a
difference between mean values of organizational trust and employee morale in
Sri Lanka Telecom and Ceylon Electricity Board in Trincomalee Town and
Gravets, Sri Lanka.
Key Words: Organizational Trust, Employee Morale, Univariate Analysis,
Bivariate Analysis
1. INTRODUCTION
Employees are the most valuable asset and main actors in an organization. They are
associated with organizational aspects and functionalities, and provide meaning to its
performances by achieving organizational objectives and goals. Hence, the degree of
employees’ feelings is referred to as their mental status, which is understood as the morale.
Employee Morale is an exceptional determinant of organizational health and becomes
important, since organizational performance and efficiency depends on it. Morale implies that
how employees positively and supportively feel about and to their organization (Haddock,
2010). An organization needs to create some positive impacts on the minds of its employees
to have positive morale of employees. These positive impacts make the employees to have
initially trust and a strong association with the organization. Therefore, organizational trust of
an employee creates positive morale on the organization (e.g., Fard et al., 2010a).
Department of Management, Eastern University, Sri Lanka (E-mail: [email protected]) Freelance Researcher, New Zealand (E-mail: [email protected])

2 http://ssrn.com/abstract=2430035
Even though Fard et al. (2010a) indicate positive relationship of organizational trust to
employees’ morale, they question the extent to which the public organizations in electricity
supply and telecommunication industry have created organizational trust of employees with
positive impacts on their minds to have positive morale. This study considers the same and
attempts to investigate the relationship of organizational trust to employee morale,
particularly in relation to Sri Lanka Telecom (SLT) and Ceylon Electricity Board (CEB) in
Trincomalee Town and Gravets, for two reasons: (a) Fard et al. (2010a) endorse significant
relationship between the study variables, and (b) the entities are public organizations.
By focusing on the relationship of organizational trust to employee morale, organizations can
be benefitted to retain best employees for producing their high level performances.
Employees’ high level performances in aggregate can result in improved organizational
performances and this can leads to increase organizational market share. Hence, this study
can facilitate organizational decision makers and managers to explore the factors that
contribute to determine the organizational trust and employee morale.
The results of this study indicate that there is a positive significant relationship between
organizational trust and employee morale. In comparison, correlation is higher for the
employees in SLT than for the employees in CEB. Further, results indicate that all employees
in both organizations have high level attributes of organizational trust and employee morale.
In comparison, SLT has higher level attribute in organizational trust and CEB has higher
level attribute in employee morale. This study has extended to investigate the mean
difference between the organizations. The results confirm that the mean values of
organizational trust in SLT and CEB in Trincomalee Town and Gravets are statistically
significantly different. This is also consistent for the variable of employee morale too.
The rest of the paper is organized with problem statement and objectives of the study,
literature review and conceptualization, methodology and hypotheses, results of data analysis
and interpretation, and conclusion.
2. PROBLEM STATEMENT AND OBJECTIVES OF THE STUDY
Fard et al. (2010b) state that job performance and organizational commitment of a workforce
in public organizations of Iran is low. This implies that low level of employee commitment in

3 http://ssrn.com/abstract=2430035
public organizations can cause for low organizational trust, thus resulting in high employee
turnover. This is similar in Sri Lanka, generally in the government sector and is observed that
employee morale in private sector is higher than the public sector organization. This implies
that government employees have low morale and this might have resulted with low
organisational trust. Therefore, this study considers SLT and CEB in Trincomalee Town and
Gravets in Sri Lanka. SLT and CEB are mostly government owned institutions1. Therefore, it
is questionable the extent to which, the organisational trust has relationship with employee
morale in SLT and CEB in Trincomalee Town and Gravets.
Therefore, the primary objective of this study is to examine the relationship between
Organizational Trust (OT) and Employee Morale (EM) in SLT and CEB in Trincomalee
Town and Gravets. Further, this study also focuses on identifying the level of OT and EM in
SLT and CEB in Trincomalee Town and Gravets, as the secondary objectives of this study.
3. LITERATURE REVIEW AND CONCEPTUALIZATION
Nowadays, organizations always focus on their strategic and overall performances. The
creating morale of employees is important and it becomes an essential component of human
resource management in carrying out business operations, since job performances and
efficiency of an employee depend on the employee’s morale. According to Bowles and
Cooper (2009), the morale is defined as “the state of individual psychological wellbeing
based upon a sense of confidence and usefulness and purpose.”
Child (1941) explains that morale is a condition of mental health; it contributes to a person to
act effectively and confidently; and it highly interests him/her in performing his/her duties.
Simply, morale means how individuals feel about performing tasks at a particular point in
time (Watson, 1988). Guion (1958) considers morale as a personal phenomenon. He states
that the extent to which an employee feels overall satisfaction in his/her job. Ransom (1995)
also states that high morale of employees in organizations leads to more productive than
competition. All of the above definitions imply that attaining high standards of morale is
important to expose the feelings of employees and their abilities in the work. Linz et al.
(2006) indicate positive relationship between expected rewards and morale among the
1 The SLT is a semi-government organization (the ownership shares of SLT are distributed among Sri Lanka government
49.5%, Global Telecommunication Holdings N.V. of Netherlands 44.98%, and the rest 5.52% by the public – source: Sri Lanka Telecom Annual Report, 2011). Similarly, CEB is a board with the ownership by government-Source: Ceylon
Electricity Board Annual Report and Accounts 2010.

4 http://ssrn.com/abstract=2430035
Russian employees. They explore that expected monetary rewards exhibit a greater influence
on morale than expected non-monetary rewards. Their results indicate that there is a strong
positive correlation of morale with performance assessment and work attitudes.
Ngambi (2011) indicates that leadership approaches can influence the staff morale. His
results reveal that the new leadership initiatives have positive impacts on morale and have
significantly reduced the intentions of employees to leave their organization. Neely (1999)
concludes that there is strong direct correlation between morale and productivity. According
to Munck (2001), employee turnover causes a decrease in productivity and often contributes
to low employee morale.2
Fard et al. (2010a) indicate that organizational trust leads to organizational effectiveness and
has impacts on intrapersonal and interpersonal relationships inside and outside of an
organization. Zalabak et al. (2000) define organizational trust as the positive expectation that
the employees have about organizational roles, experiences, and mutual dependency. Gilbert
and Tang (1998) define organizational trust as the feeling of confidence and support in an
organization. Mishra (1996) indicate “Organizational trusts as a unidirectional tendency
toward susceptibility to other party”, where the employees have perceived that their
organization has no lack in reliability, openness and trustworthiness, compared to other
(party) organization concerned.
According to Laschinger et al. (2011), high level of organizational trust requires a change in
organization. However, the organizational change itself, in other way, can dilute the
organizational effectiveness and trust. The increasing level of workload and job insecurity
can lead to: (a) downsizing the number of employees and (b) affecting employee trust and
morale. Laschinger et al. (2011) also indicate that some common characteristics of
organizations with low trust lead to: an increasing rate of absenteeism, extended breaks, lack
of learning habits, unwillingness to accept responsibilities, negative thinking and reactive
behaviour, and low level of creativity.
Though many factors determine organizational trust and employee moral (see Figure 1 of
Senthilnathan and Rukshani, 2013), Fard et al. (2010a) explain that organizational trust leads
2 Senthilnathan and Rukshani (2013) explore the literatures outlines illustratively how the morale of employees
contributes to other aspects of business and management.
5 http://ssrn.com/abstract=2430035
to improvement of an employee’s morale. The study concludes positive correlation (r = 0.71)
between organizational trust and employee morale in public sector organizations. Many
studies have investigated the relationship of organizational trust to other variables:
commitment and involvement (e.g., Bussing, 2002)3, innovation and empowerment (e.g.,
Vineburgh, 2010)4, conflict (e.g., Hoy and Tschannen-Moran)
5, Structural empowerment
(e.g., Laschinger and Finegan, 2005)6, Human Resource Management Practices (e.g.,
Whitener, 1997)7 etc.
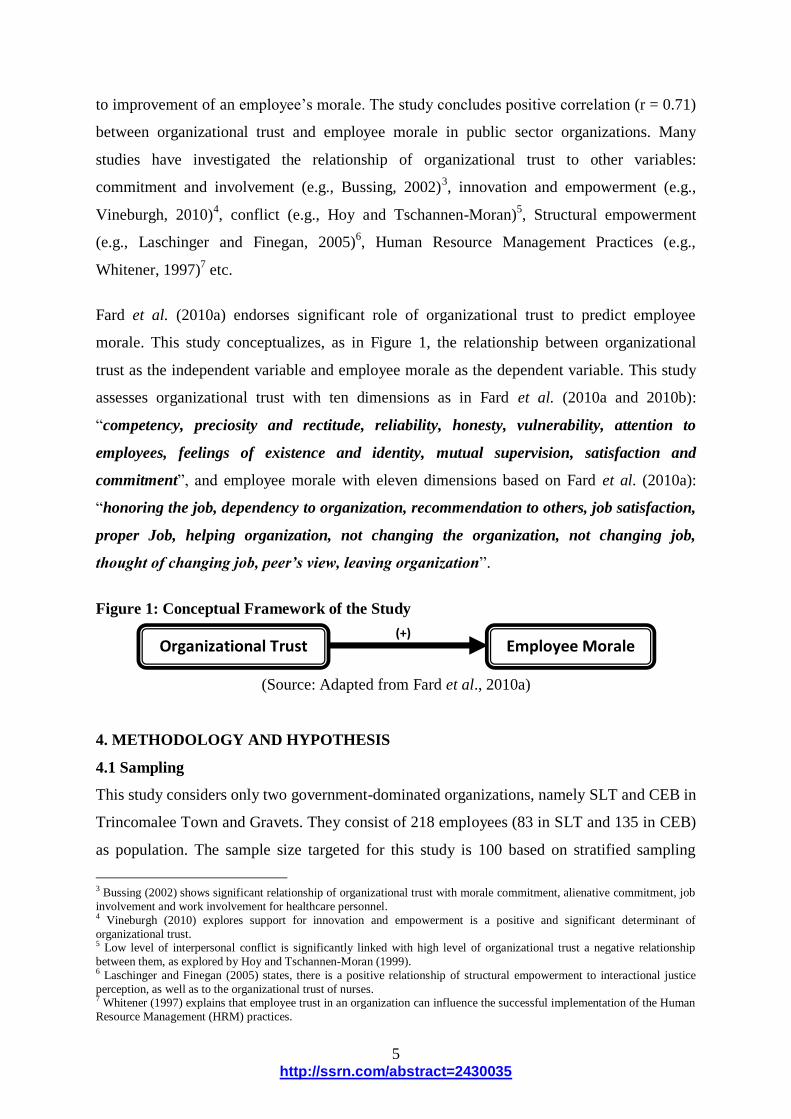
Fard et al. (2010a) endorses significant role of organizational trust to predict employee
morale. This study conceptualizes, as in Figure 1, the relationship between organizational
trust as the independent variable and employee morale as the dependent variable. This study
assesses organizational trust with ten dimensions as in Fard et al. (2010a and 2010b):
“competency, preciosity and rectitude, reliability, honesty, vulnerability, attention to
employees, feelings of existence and identity, mutual supervision, satisfaction and
commitment”, and employee morale with eleven dimensions based on Fard et al. (2010a):
“honoring the job, dependency to organization, recommendation to others, job satisfaction,
proper Job, helping organization, not changing the organization, not changing job,
thought of changing job, peer’s view, leaving organization”.
Figure 1: Conceptual Framework of the Study
(Source: Adapted from Fard et al., 2010a)
4. METHODOLOGY AND HYPOTHESIS
4.1 Sampling
This study considers only two government-dominated organizations, namely SLT and CEB in
Trincomalee Town and Gravets. They consist of 218 employees (83 in SLT and 135 in CEB)
as population. The sample size targeted for this study is 100 based on stratified sampling
3 Bussing (2002) shows significant relationship of organizational trust with morale commitment, alienative commitment, job
involvement and work involvement for healthcare personnel. 4 Vineburgh (2010) explores support for innovation and empowerment is a positive and significant determinant of
organizational trust. 5 Low level of interpersonal conflict is significantly linked with high level of organizational trust a negative relationship
between them, as explored by Hoy and Tschannen-Moran (1999). 6 Laschinger and Finegan (2005) states, there is a positive relationship of structural empowerment to interactional justice
perception, as well as to the organizational trust of nurses. 7 Whitener (1997) explains that employee trust in an organization can influence the successful implementation of the Human
Resource Management (HRM) practices.
(+) Organizational Trust Employee Morale

6 http://ssrn.com/abstract=2430035
technique. About 180 questionnaires are issued and only 126 questionnaires have been
responded and received. A number of 27 responses are found not fully responded, thus
resulting of 99 questionnaires responded. However, the stratified sampling technique has
resulted in zero percentage for one executive of CEB Area Office. Therefore, the study has a
special consideration to make the sample size to 100 (see Table 1) by including the response
from CEB executive, since this study assumes that adding 1 (1%) can result in insignificant
error in results.
Table 1: Sampling
Employee
Category
Ceylon Electricity Board (CEB) Sri Lanka
Telecom Total Area
Office
DGM
Office CEB
Total Pop. Sam. Pop. Sam. Pop. Sam.
Minor Staff 31 15 15 6 21 21 10 31
Clerk 16 7 46 21 28 23 11 39
Technical Staff 8 4 7 3 7 27 12 19
Executive Staff 1 1 11 5 6 12 5 11
Total 56 27 79 35 62 83 38 100
In Table 1, DGM = Deputy General Manager, Pop. = population and Sam. = samples.
4.2 Data
The study basically considers the primary data of questionnaire responses from 100
employees of CEB (62) and SLT (38) in Trincomalee Town and Gravets. The degree of their
individual agreement with every statement in relation to dimensions of study variables is
measured with Likert’s scale (1-5) from every employee’s perception point of view. The
independent variable ‘organizational trust’ is measured with 10 dimensions with each
indicator (statement); and dependent variable ‘employee morale’ is with 11 statements, one
statement (indicator) for each dimension.
4.3 Data Analysis and Evaluation
4.3.1 Reliability test of data
To confirm the righteousness of data applicably in the context of study problem, reliability
test has been carried out, where Cronbach’s Alpha Coefficient (CAC) is calculated for
statements of each of the dimensions and full set of data collected. Their degrees of reliability
are evaluated based on the technique applied in Thusyanthy and Senthilnathan (2012) with
reference of the George and Mallery (2003) as:

7 http://ssrn.com/abstract=2430035
CAC ≥ 0.9 Excellent
0.8 ≤ CAC < 0.9 Good
0.7 ≤ CAC < 0.8 Acceptable
0.6 ≤ CAC < 0.7 Questionable
0.5 ≤ CAC < 0.6 Poor
CAC < 0.5 Unacceptable
However, citing Malhothra (2005) and Godard et al. (2001), Thusyanthy and Senthilnathan
(2012) indicate the data reliability, if the CAC is at least 0.6.
4.3.2 Univariate analysis and evaluation
Central tendency of mean, median and mode is in consideration; and however, the mean
value of every dimension and variable is evaluated with its standard deviation, coefficient of
variance, standard error of mean, maximum and minimum of data, number of variables, and
lower and upper limits of the mean that consist of standard error of the mean and standard
normal deviate (Z-value) at the 95% confidence limit.
The mean value is lying in the range of 1-5; and the value of each respondent for a variable is
compared with the mean/median value 3, since it is assumed that (a) every respondent is
unbiased and represents neutral state of agreement of 3 in the Likert’s scale, which (as
population mean value 3) lies in a normal distribution with the 95% confidence limit; and (b)
the 95% confidence limit is determined with sample standard deviation, since its population
parameter is unknown. Based on the confidence limits, data of the respondents (Xi) for a
dimension/variable can be categorized into three as in Tharmi and Senthilnathan (2012),
Thusyanthy and Senthilnathan (2012) and Thusyanthy and Senthilnathan (2013) as given in
Table 2.
Table 2: Decision Criteria for Univariate Analysis
Range for Decision Criteria Decision Criteria Decision Attribute
Xi < (3-Z σx) Xi < 3 Low Level
(3-Z σx) ≤ Xi ≤ (3+Z σx) Xi = 3 Moderate Level
Xi > (3+Z σx) Xi > 3 High Level
Where Xi = mean value of an indicator/dimension/ variable, σ= standard deviation, Z =
value of the 95% confidence limit in normal distribution and σx = standard error of the
mean.

8 http://ssrn.com/abstract=2430035
4.3.3 Bivariate analysis and evaluation
In this context, the correlation analysis is carried out to measure the strength of relationship
between the study variables organizational trust and employee morale. This study assesses
the significance of relationship variables, if the respective p-value of the correlation
coefficient is less than the 0.05. However, irrespective of the significance level of the
association between the variables, the correlation becomes meaningful to an extent as
indicated in Table 3 as in Senthilnathan and Tharmi (2012).
Table 3: Decision Criteria for Bivariate Analysis
Range Decision Attributes
r = 0.5 to 1.0 Strong positive relationship
r = 0.3 to 0.49 Medium positive relationship
r = 0.1 to 0.29 Weak positive relationship
r = -0.1 to -0.29 Weak negative relationship
r = -0.3 to -0.49 Medium negative relationship
r = -0.5 to -1.0 Strong negative relationship
Note: Table 3 implies no correlation between two variables, if the
range of r is: -0.1 < r < +0.1.
Testing Hypothesis of Correlation
H0: There is no a positive relationship between variables (p ≥ 0.05)
HA: There is a positive relationship between variables (p < 0.05)
Decision: Accept HA, if p < 0.05.
5. RESULTS OF DATA ANALYSIS AND INTERPRETATION
5.1 Data Reliability
The results of Cranach’s alpha test (see Table 4) indicate the reliability of data (all CAC >
0.6) that are consistently meaningful to carry out this study as indicated in Malhothra (2005),
Godard et al. (2001) and Thusyanthy and Senthilnathan (2012) for data reliability.
Table 4: Cronbach’s Alpha Coefficient for Variables
Variable Number of
Elements
Overall
CAC
CAC of
SLT
CAC of
CEB
Organizational Trust (OT) 10 0.850 0.846 0.847
OT as a whole with dimensions 11 0.877 0.874 0.875
Employee Morale (EM) 11 0.694 0.624 0.73
EM as a whole with dimensions 12 0.745 0.686 0.775
Reliability for all dimensions only 21 0.838 0.849 0.841
Overall Reliability 23 0.864 0.874 0.867
In this table, SLT = Sri Lanka Telecom, CEB = Ceylon Electricity Board and CAC= Cronbach’s
Alpha Coefficient

9 http://ssrn.com/abstract=2430035
5.2 Univarate Analysis
5.2.1 Organizational trust (OT)
Overall OT has the mean value 4.376 with standard deviation 0.485 (see Table 5 (a)). This
implies that level of OT of the samples in SLT and CEB in Trincomalee Town and Gravets is
high and it is also noted that about 100 percent of the respondents have the same high level of
attribute of OT. The OT in SLT and CEB reveals mean values 4.497 and 4.302 and standard
deviations 0.443 and 0.497, respectively. Consistently in both mostly government owned
institutions (government dominated organizations), the OT reveals high level of attributes,
individually (see Table 5(b) for SLT and Table 5(c) for CEB). Results further reveal that
mean values for the OT in SLT (4.497) is comparatively higher than the CEB (4.302).
The dimensions of vulnerability (4.560), mutual supervision (4.520) and competency (4.530)
have high level of attribute to influence the overall OT, respectively. This is consistent with
the employees in SLT (4.605, 4.605 and 4.684, respectively). However, the response of the
employees in CEB reveal that dimensions of vulnerability (4.532), mutual supervision
(4.468) and honesty (4.532) has high level of mean value to influence the OT, respectively.
However, the dimension of attention to employees has comparatively lowest mean values in
aggregate (3.930) and for both the organizations SLT (4.211) and CEB individually (3.758).
Fard et al. (2010a) point out that public service organizations have mean value of overall OT
is 3.13 and also states that value of OT is higher than the mean value of 3. This is consistent
with our results of exploring the level of OT. Further, the results of their study reveal that the
dimensions of mutual supervision, vulnerability and reliability have the higher rank in their
mean value, while the dimension of preciosity and rectitude appears to be with low rank.
Notably, our findings are also not much significantly different from Fard et al. (2010a) in
terms of dimension of preciosity and rectitude.
Though both institutions consistently have higher level of attribute of OT, their mean values
are however not approximating to each other (mean value of OT in SLT = 4.497 and CEB =
4.302). Therefore, it is questionable whether the mean values of these institutions for OT are
statistically different, though they imply high level of attribute in both organizations in using
estimation technique.

10 http://ssrn.com/abstract=2430035
Table 5: Organizational Trust and its Dimensions
The Table 5 consists of three sub sets for overall organizational trust (Table 5(a)), organizational trust in SLT (Table 5(b)) and CEB (Table 5(c)).
In these tables, OT1 = Vulnerability, OT2 = Mutual supervision, OT3 = Satisfaction, OT4 = Feelings of existence and identity, OT5 = Attention
to employees, OT6 = Commitment, OT7 = Reliability, OT8 = Honesty, OT9 = Preciosity and rectitude, OT10 = Competency, OT = Overall
organizational trust, CL = Confidence limit, and HIGH = High level attribute.
Table 5(a): Overall organizational trust and its dimensions
Measure OT1 OT2 OT3 OT4 OT5 OT6 OT7 OT8 OT9 OT10 OT
Mean 4.560 4.520 4.400 4.380 3.930 4.270 4.340 4.490 4.340 4.530 4.376
Standard Deviation 0.574192 0.61101 0.778499 0.599326 1.112418 0.827006 0.669992 0.73161 0.684902 0.688359 0.484532
Coefficient of Variance 0.125919 0.135179 0.176932 0.136832 0.283058 0.193678 0.154376 0.162942 0.157812 0.151956 0.110725
Minimum 3 3 1 3 1 2 2 2 3 2 3.2
Maximum 5 5 5 5 5 5 5 5 5 5 5
No of data 100 100 100 100 100 100 100 100 100 100 100
Standard Error of mean 0.057419 0.061101 0.07785 0.059933 0.111242 0.082701 0.066999 0.073161 0.06849 0.068836 0.048453
Z value (95%) CL 1.96 1.96 1.96 1.96 1.96 1.96 1.96 1.96 1.96 1.96 1.96
Low Level of mean (<) 2.887458 2.880242 2.847414 2.882532 2.781966 2.837907 2.868682 2.856605 2.865759 2.865082 2.905032
Upper Level of mean (>) 3.112542 3.119758 3.152586 3.117468 3.218034 3.162093 3.131318 3.143395 3.134241 3.134918 3.094968
Decision Attribute HIGH HIGH HIGH HIGH HIGH HIGH HIGH HIGH HIGH HIGH HIGH

11 http://ssrn.com/abstract=2430035
Table 5(b): Sri Lanka Telecom (SLT) - organizational trust and its dimensions
Measure OT1 OT2 OT3 OT4 OT5 OT6 OT7 OT8 OT9 OT10 OT
Mean 4.605263 4.605263 4.447368 4.552632 4.210526 4.473684 4.473684 4.421053 4.5 4.684211 4.497368
Standard Deviation 0.594546 0.495355 0.760418 0.554947 0.963044 0.76182 0.506009 0.858395 0.647239 0.525319 0.44326
Coefficient of Variance 0.129101 0.107563 0.170982 0.121896 0.228723 0.170289 0.113108 0.194161 0.143831 0.112147 0.09856
Minimum 3 4 2 3 2 2 4 2 3 3 3.5
Maximum 5 5 5 5 5 5 5 5 5 5 5
No of data 38 38 38 38 38 38 38 38 38 38 38
Standard Error of mean 0.096448 0.080357 0.123356 0.090024 0.156226 0.123584 0.082086 0.13925 0.104996 0.085218 0.071906
Z value (95%) CL 1.96 1.96 1.96 1.96 1.96 1.96 1.96 1.96 1.96 1.96 1.96
Low Level of mean (<) 2.810962 2.8425 2.758222 2.823552 2.693796 2.757776 2.839112 2.72707 2.794208 2.832973 2.859064
Upper Level of mean (>) 3.189038 3.1575 3.241778 3.176448 3.306204 3.242224 3.160888 3.27293 3.205792 3.167027 3.140936
Decision Attribute HIGH HIGH HIGH HIGH HIGH HIGH HIGH HIGH HIGH HIGH HIGH
Table 5(c): Ceylon Electricity Board (CEB) - organizational trust and its dimensions
Measure OT1 OT2 OT3 OT4 OT5 OT6 OT7 OT8 OT9 OT10 OT
Mean 4.532258 4.467742 4.370968 4.274194 3.758065 4.145161 4.258065 4.532258 4.241935 4.435484 4.301613
Standard Deviation 0.564459 0.670643 0.794115 0.605152 1.169075 0.846338 0.745159 0.645736 0.693896 0.76009 0.497038
Coefficient of Variance 0.124543 0.150108 0.181679 0.141583 0.311084 0.204175 0.174999 0.142476 0.16358 0.171366 0.115547
Minimum 3 3 1 3 1 2 2 3 3 2 3.2
Maximum 5 5 5 5 5 5 5 5 5 5 5
No of data 62 62 62 62 62 62 62 62 62 62 62
Standard Error of mean 0.071686 0.085172 0.100853 0.076854 0.148473 0.107485 0.094635 0.082009 0.088125 0.096532 0.063124
Z value (95%) CL 1.96 1.96 1.96 1.96 1.96 1.96 1.96 1.96 1.96 1.96 1.96
Low Level of mean (<) 2.859495 2.833063 2.802329 2.849366 2.708993 2.789329 2.814515 2.839263 2.827275 2.810798 2.876277
Upper Level of mean (>) 3.140505 3.166937 3.197671 3.150634 3.291007 3.210671 3.185485 3.160737 3.172725 3.189202 3.123723
Decision Attribute HIGH HIGH HIGH HIGH HIGH HIGH HIGH HIGH HIGH HIGH HIGH

12 http://ssrn.com/abstract=2430035
Hence, this study extends the analyses to examine the difference between the mean values of
OT in these organizations and the following hypotheses are tested.
H0 = There is no difference between the mean values of OT in SLT and CEB.
H1 = There is a significant difference between mean values of OT in SLT and CEB.
Decision rule: Accept H1, if ZC > ZT (= 1.96) or ZC < ZT (= -1.96)
Accept H0, if (-1.96 ≤ ZC ≤ 1.96)
Where ZC = Calculated value of Z using test statistic with normal distribution and
ZT = Table value of Z at 95% confidence limit of normal distribution.
Hypothesis testing concludes that there is statistically significant difference between mean
values of OT in SLT and CEB, where ZC (2.0459) > ZT (1.96) and H1 is therefore accepted at
the 5% significance level (see Table 6).
Table 6: Institutional Mean Difference of Organizational Trust (OT)
Organizational Trust Measures SLT CEB
Mean 4.497368 4.301613
Standard Deviation 0.443260 0.497038
Number of Data 38 62
ZT for two tail 95% confidence ± 1.96
Standard error of mean difference 0.095682478
Test statistic of ZC 2.045881375
Decision (as ZC > ZT) Accept H1
In this table, SLT = Sri Lanka Telecom, CEB = Ceylon Electricity Board,
ZC = calculated value of Z using test statistic with normal distribution and
ZT = table value of Z at 95% confidence limit of normal distribution.
5.2.2 Employee morale (EM)
Overall EM has the mean value 4.436 with standard deviation 0.376. This implies that level
of EM of the samples in Sri Lanka Telecom and CEB in Trincomalee Town and Gravets is
high and it is also noted that about 100 percent of the respondents have the same high level of
attribute of EM (see Table 7(a)). the EM in SLT and CEB reveals mean values 4.342 and
4.493 and standard deviations 0.365 and 0.375, respectively. Consistently in both government
dominated organizations, the EM reveals mostly high level of attributes, individually (see
Tables 7(b) and 7(c)).

13 http://ssrn.com/abstract=2430035
Table 7: Employee Morale and its Dimensions
The Table 7 consists of three sub sets for over all employee morale (Table 7(a)) and employee morale in SLT (Table 7(b)) and in CEB (Table
7(c)). In these tables, EM1 = Honoring the job, EM2 = Dependency to organization, EM3 = Recommendation to others, EM4 = Job satisfaction,
EM5 = Proper job, EM6 = Helping organization, EM7 = Leaving organization, EM8 = Not changing job, EM9 = Thought of changing job,
EM10 = Peer’s view, EM11 = Not changing the organization, EM = Overall employee morale, CL = Confidence limit, HIGH = High level
attribute and MOD = Moderate level attribute.
Table 7(a): Overall employee morale and its dimensions
Measure EM1 EM2 EM3 EM4 EM5 EM6 EM7 EM8 EM9 EM10 EM11 EM
Mean 4.76 4.66 4.55 4.63 4.63 4.62 4.08 4.45 4.68 4.61 3.12 4.4355
Standard Deviation 0.5148 0.5724 0.5925 0.5441 0.5056 0.5646 1.1072 0.5925 0.6176 0.6013 1.4790 0.3763
Coefficient of Variance 0.1082 0.1229 0.1302 0.1175 0.1092 0.1222 0.2714 0.1331 0.1320 0.1304 0.4740 0.0849
Minimum 2 3 3 3 3 3 1 3 2 2 1 3.2727
Maximum 5 5 5 5 5 5 5 5 5 5 5 5
No of data 100 100 100 100 100 100 100 100 100 100 100 100
Standard Error of mean 0.0515 0.0572 0.0592 0.0544 0.0506 0.0565 0.1107 0.0592 0.0618 0.0601 0.1480 0.0376
Z value (95%) CL 1.96 1.96 1.96 1.96 1.96 1.96 1.96 1.96 1.96 1.96 1.96 1.96
Low Level of mean (<) 2.8991 2.8878 2.8839 2.8934 2.9009 2.8893 2.7830 2.8839 2.8790 2.8822 2.7101 2.9262
Upper Level of mean (>) 3.1009 3.1122 3.1161 3.1066 3.0991 3.1107 3.2170 3.1161 3.1210 3.1178 3.2899 3.0738
Decision Attribute HIGH HIGH HIGH HIGH HIGH HIGH HIGH HIGH HIGH HIGH MOD HIGH

14 http://ssrn.com/abstract=2430035
Table 7(b): Sri Lanka Telecom (SLT) – employee morale and its dimensions
Measure EM1 EM2 EM3 EM4 EM5 EM6 EM7 EM8 EM9 EM10 EM11 EM
Mean 4.8158 4.5789 4.5789 4.5526 4.5789 4.4737 3.8421 4.3158 4.6316 4.7105 2.6842 4.3421
Standard Deviation 0.3929 0.6831 0.6423 0.5549 0.5004 0.6872 1.3661 0.5745 0.6747 0.5151 1.4162 0.3651
Coefficient of Variance 0.0816 0.1492 0.1403 0.1219 0.1093 0.1536 0.3556 0.1331 0.1457 0.1093 0.5276 0.08419
Minimum 4 3 3 3 4 3 1 3 2 3 1 3.5455
Maximum 5 5 5 5 5 5 5 5 5 5 5 5
No of data 38 38 38 38 38 38 38 38 38 38 38 38
Standard Error of mean 0.0637 0.1108 0.1042 0.0900 0.0812 0.1115 0.2216 0.0932 0.1094 0.0836 0.2297 0.0592
Z value (95%) CL 1.96 1.96 1.96 1.96 1.96 1.96 1.96 1.96 1.96 1.96 1.96 1.96
Low Level of mean (<) 2.8751 2.7828 2.7958 2.8236 2.8409 2.7815 2.5656 2.8173 2.7855 2.8362 2.5497 2.8839
Upper Level of mean (>) 3.1249 3.2172 3.2042 3.1764 3.1591 3.2185 3.4344 3.1827 3.2145 3.1638 3.4503 3.1161
Decision Attribute HIGH HIGH HIGH HIGH HIGH HIGH HIGH HIGH HIGH HIGH MOD HIGH
Table 7(c): Ceylon Electricity Board (CEB) – employee morale and its dimensions
Measure EM1 EM2 EM3 EM4 EM5 EM6 EM7 EM8 EM9 EM10 EM11 EM
Mean 4.7258 4.7097 4.5323 4.6774 4.6613 4.7097 4.2258 4.5323 4.7097 4.5484 3.3871 4.4927
Standard Deviation 0.5774 0.4921 0.5645 0.5364 0.5103 0.4576 0.8948 0.5928 0.5836 0.6447 1.4638 0.3745
Coefficient of Variance 0.1222 0.1045 0.1245 0.1147 0.1095 0.0972 0.2117 0.1308 0.1239 0.1417 0.4322 0.0834
Minimum 2 3 3 3 3 4 2 3 2 2 1 3.2727
Maximum 5 5 5 5 5 5 5 5 5 5 5 5
No of data 62 62 62 62 62 62 62 62 62 62 62 62
Standard Error of mean 0.0733 0.0625 0.0717 0.06812 0.0648 0.0581 0.1136 0.0753 0.0741 0.0819 0.1859 0.0476
Z value (95%) CL 1.96 1.96 1.96 1.96 1.96 1.96 1.96 1.96 1.96 1.96 1.96 1.96
Low Level of mean (<) 2.8563 2.8775 2.8595 2.8665 2.8730 2.8861 2.7773 2.8524 2.8547 2.8395 2.6356 2.9068
Upper Level of mean (>) 3.1437 3.1225 3.1405 3.1335 3.1270 3.1139 3.2227 3.1476 3.1453 3.1605 3.3644 3.0932
Decision Attribute HIGH HIGH HIGH HIGH HIGH HIGH HIGH HIGH HIGH HIGH HIGH HIGH

15 http://ssrn.com/abstract=2430035
The dimensions of honoring the job (4.760) and thought of changing job (4.680) have high
level of attribute to influence the EM in aggregation, in SLT (4.816 and 4.632) and in CEB
(4.726 and 4.710). The dimension of dependency to organization has high mean value for
overall attribute (4.66) and for CEB (4.710). The mean value of 4.710 is consistently the
same for the dimension of helping organization in the same CEB. Further, SLT also has
higher level of attribute in peer’s view (4.711).
Particularly and comparatively, the dimension “not changing the organization” has lowest
mean values in aggregate (3.120) and for both the organizations SLT (2.684) and CEB
(3.387), individually. Results of this dimension reveal moderate level in SLT and have
affected the high level of attribute in CEB to bring its overall attribute to the moderate level.
However, the level of attributes of EM and its dimensions, except dimension of “not
changing the organization”, fall into high level attribute in aggregation and SLT. Notably,
CEB have higher level attribute for all dimensions. Results further reveal that mean value of
EM in SLT (4.342) is comparatively lower than that in CEB (4.493). Especially in SLT, the
dimension of leaving the organization (3.842) has lower mean of attribute than CEB (4.226).
Results show that except “honoring the job”, “recommendation to others” and “peer’s view”,
all other (8) dimensions of EM in CEB have comparatively higher mean values than in the
SLT. It indicates that CEB has high level of positive EM in order to carry out its business.
Among these dimensions, job satisfaction and leaving organization have reasonably
contributed to result in high level attribute of EM in CEB and this is consistent with
Upadhyay and Gupta (2012) and Munck (2001).
Fard et al. (2010a) point out that public service organizations have overall EM to mean value
of 3.02 as moderate as equal to the expected mean value of 3. Our results are inconsistent
from the findings of Fard et al. (2010a). Further, the results of their study reveal that the
dimensions of not changing job, helping organization and dependency to organization have
the higher rank in their mean values, while the dimension of peer’s view appears to be low in
ranking of mean values. In our study, the results inconsistently indicate that peer’s view
highly support for overall EM.
Though both organizations have higher level of attribute of EM in using estimation
technique, it is not clear whether their mean values approximate to each other (mean value of

16 http://ssrn.com/abstract=2430035
EM in SLT = 4.3421 and CEB = 4.4927). Therefore, it is possible to question statistical
difference of those mean values. Thus, this study extends the analysis to examine the
difference between the mean values of EM in these organizations and the following
hypotheses are tested.
H0 = There is no difference between mean values of EM in SLT and CEB.
H2 = There is a significant difference between mean values of EM in SLT and CEB.
Decision rule: Accept H2, if ZC > ZT (= 1.96) or ZC < ZT (= -1.96)
Accept H0, if (-1.96 ≤ ZC ≤ 1.96)
Where ZC = Calculated value of Z using test statistic with normal distribution and
ZT = Table value of Z at 95% confidence limit of normal distribution
Hypothesis testing concludes that there is statistically significant difference between mean
values of EM in SLT and CEB, where ZC (-1.9826) < ZT (-1.96) and H2 is therefore accepted
at the 5% significance level (see Table 8).
Table 8: Institutional Mean Difference of Employee Morale (EM)
Measures SLT CEB
Mean 4.3421 4.4927
Standard Deviation 0.3651 0.3745
Number of Data 38 62
ZT for two tail 95% confidence ± 1.96
Standard error of mean difference 0.075960142
Test statistic of ZC -1.982618726
Decision (as ZC > ZT) Accept H2
In this table, SLT = Sri Lanka Telecom, CEB = Ceylon Electricity Board,
ZC = calculated value of Z using test statistic with normal distribution and
ZT = table value of Z at 95% confidence limit of normal distribution.
5.3 Bivariate Analysis
5.3.1 Relationship of employee morale (EM) and dimensions of organizational trust (OT)
Correlation analysis shows each of the dimensions of OT has positive significant relationship
with EM. Further, it shows low level of multicollinearity between dimensions of OT and
between dimensions of EM (see Annex 1). Therefore, each dimension is important in
determining the employee morale (see Table 9).

17 http://ssrn.com/abstract=2430035
Further, the correlation analysis of SLT shows each dimension of OT generally has positive
relationship with EM. Dimension ‘competency’ of OT has insignificant relationship with
EM; whereas, other dimensions have significant relationships with EM (see Table 9).
Therefore, it reflects competency is not a key determinant of EM in SLT in particular.
The correlation analysis of CEB demonstrates that dimensions of OT generally have positive
relationship with EM. However, dimensions of mutual supervision, attention to employees,
preciosity and rectitude, and honesty have insignificant relationship with EM (see Table 9).
Results confirm that these dimensions are not statistically significant in determining the EM
particularly in CEB. Comparing with CEB, most of the dimensions of OT in SLT has
statistically significant and positive relationship with EM.
Table 9: Relationship of Employee Morale and Dimensions of Organizational Trust
In This table, OT1 = Vulnerability, OT2 = Mutual supervision, OT3 = Satisfaction, OT4 =
Feelings of existence and identity, OT5 = Attention to employees, OT6 = Commitment, OT7 =
Reliability, OT8 = Honesty, OT9 = Preciosity and rectitude, OT10 = Competency, ** =
Correlation is significant at the 0.01 level (2-tailed) and * = Correlation is significant at the
0.05 level (2-tailed).
Employee Morale and Dimensions
of Organizational Trust Overall SLT CEB
OT1 Pearson Correlation .326**
.001
.480**
.002
.262*
.040 Sig. (2-tailed )
OT2 Pearson Correlation .303**
.002
.631**
.000
.207
.107 Sig. (2-tailed )
OT3 Pearson Correlation .434**
.000
.682**
.000
.323*
.011 Sig. (2-tailed)
OT4 Pearson Correlation .313**
.001
.436**
.006
.341**
.007 Sig. (2-tailed)
OT5 Pearson Correlation .199*
.048
.460**
.004
.144
.264 Sig. (2-tailed)
OT6
Pearson Correlation .318**
.001
.532**
.001
.283*
.026 Sig. (2-tailed)
OT7 Pearson Correlation .361**
.000
.482**
.002
.381**
.002 Sig. (2-tailed)
OT8 Pearson Correlation .268**
.007
.351*
.031
.192
.135 Sig. (2-tailed)
OT9 Pearson Correlation .289**
.004
.587**
.000
.199
.121 Sig. (2-tailed)
OT10 Pearson Correlation .245* .015
.930
.407**
.001 Sig. (2-tailed) .014
Number of responses 100 38 62

18 http://ssrn.com/abstract=2430035
5.3.2 Relationship between organizational trust (OT) and employee morale (EM)
The coefficient of correlation (r) of OT and EM is 0.451 at the 0.01 level. The correlation lies
between 0.3 and 0.49, thus confirming a medium positive significant relationship between the
study variables: OT and EM (see Table 10). Further, it demonstrates (1) the degree of
association between OT and EM is about 45.1%; and (2) the OT is useful to explain about
20.34% variation of EM in both SLT and CEB as a whole in Trincomalee Town and Gravets.
It proves meaningful significant role of the OT to predict EM from a social science
perspective.
Analysis shows significant correlation coefficient between OT and EM in SLT (r = 0.709, p =
0.01). The coefficient is between 0.5 and 1.0 and confirms a strong significant positive
relationship between OT and EM in SLT. CEB has also statistically positive and significant
correlation coefficient (r = 0.405, p < 0.01); and as its correlation is between 0.3 and 0.49, it
confirms a medium significant positive relationship between the OT and EM (see Table 10).
Comparatively in SLT, OT has strong positive relationship with EM. Further, the study
findings demonstrate that OT is useful to explain 50.26% and 16.40% of variations in EM in
SLT and CEB, respectively. Notably, finding confirms that OT is an important predictor of
EM, especially and comparatively in SLT in Trincomalee Town and Gravets. As the
correlation coefficient of the CEB (r = 0.405) for the relationship between OT and EM is
considerably lower than that of SLT (r = 0.709), the overall correlation coefficient of the
variables (r = 0.451) is diluted to closer to the lowest correlation coefficient of CEB. This
implies that there are different employees’ perceptions in relation to the study variables,
though they are government dominated organizations.
Table 10: Correlation between Organizational Trust and Employee Morale
Measure Overall SLT CEB
Pearson Correlation 0.451**
0.709**
0.405**
Significance ( 2- tailed ) 0.000 0.000 0.001
Number of observations 100 38 62
In this table, SLT = Sri Lanka Telecom, CEB = Ceylon Electricity Board and ** =
significance at the 0.01 level (2- tailed)
Fard et al. (2010a) indicates higher level and significant positive correlation between OT and
EM in public sector in Iran (r = 0.71). Our study also consistently indicates positive

19 http://ssrn.com/abstract=2430035
significant correlation between the study variables and inconsistently with (medium) level of
association. However, this study confirms the overall positive relationship of variables as in
Fard et al. (2010a).
5.3.3 Testing hypothesis of correlation
Correlation between organizational trust (OT) and employee morale (EM) is significant at the
5% level (r = 0.451, p=0.00 < 0.05). This demonstrates to accept the hypothesis “HA: There
is a relationship between organizational trust and employee morale”.
Decision: Accept HA, since r = 0.451, p=0.00 < 0.05.
6. CONCLUSION
This study investigates the relationship between organizational trust (OT) and employee
morale (EM), since the previous studies explore low employee morale in public sector due to
low organizational trust. This study considered this as an issue in public sector and attempt to
investigate the relationship of the organizational trust to employee morale from employees’
perspectives in the Sri Lankan context, particularly by considering two government
dominated organizations in Trincomalee Town and Gravets: Sri Lanka Telecom (SLT) and
Ceylon Electricity Board (CEB). The samples of this study are chosen from these two
organizations, in which about 38% of the respondents are from SLT and the rest (62%) are
from CEB.
The results of this study indicate that there is a statistically significant positive relationship
(r=0.451) between organizational trust and employee morale, thus confirming the primary
objective of this study by accepting the hypothesis relating these the study variables.
However, in comparison, the correlation coefficient of the variables is higher for the
employees in SLT (r=0.709) than for the employees in CEB (r=0.405). It confirms that
organizational trust is useful to explain about 20.34%, 50.26% and 16.40% variation of
employee morale in aggregation, and individually in SLT and CEB in Trincomalee Town and
Gravets. This implies that CEB needs to pay attention on improving its present strategy to
transform its employees trust into their moral meaningfully. Our results are consistent with
Fard et al. (2010a) that concludes organizational trust has positive impact on employee
morale.

20 http://ssrn.com/abstract=2430035
Considering the levels of variables (secondary objective), most of the dimensions and the
variables have reflected high level of organizational trust and employee morale in aggregate
and relevant organizations individually. However, in comparison, SLT has higher level of
organizational trust (X11 = 4.4973) and CEB has higher level of employee morale (X23 =
4.4927) in Trincomalee Town and Gravets. Additionally, in order to identify the statistical
difference, this study has extended to investigate the mean difference between the
organizations. The results confirm that the mean values of organizational trust in SLT and
CEB in Trincomalee Town and Gravets are statistically, significantly different. This is also
consistent for the study variable ‘employee morale’ too.
REFERENCES
Bowles, D., & Cooper, C. (2009). Employee morale:Driving performance in challenging
times, Basingstoke, United Kingdom: Palgrave Macmillan
Bussing, A. (2002). Trust and its relations to commitment and involvement in work and
organisations. Sa journal of industrial psychology, Vol. 28, No. 4, 36-42.
Ceylon Electricity Board (2010). Annual Report and Accounts.
Child, I. (1941). Morale: A bibiliographic review. Psychological Bulletin, Vol. 39 , 393-420.
Fard, H. D., Ghatari, A. R., & Hasiri, A. (2010a). Employees morale in public sector: is
organizational trust an important factor? European Journal of Scientific Research ,
Vol. 46, No. 3, 378-390.
Fard, H. D., Ghatari, A. R., & Hasiri, A. (2010b). Organizational trust in public sector:
Explaining the role of managers’ managerial competency. European Journal of
Economics, Finance and Administrative Sciences,Vol. 25 , 29-43.
George, D., & Mallery, P. (2003). SPSS for Windows step by step: A simple guide and
reference. 11.0 update (4 ed.). Boston: Allyn & Bacon.
Gilbert, J. A., & Tang, T. L. P. (1998). An examination of organizational trust antecedents.
Public Personnel Management, Vol. 27, No. 3 , 321-339.

21 http://ssrn.com/abstract=2430035
Guion, R. M (1958). Industrial morale: The problem of terminology. Personnel Psychology,
Vol. 11, No. 1, 59-61.
Haddock, P. (2010). Importance of morale. www.ehow.com. Retrieved from
http://www.ehow.com/facts_5474415_importance-morale.html.(18/1/2012)
Hoy, W. K., & Tschannen-Moran, M. (1999). Five faces of trust: An empirical confirmation
in urban elementary schools. Journal of School Leadership, Vol. 9, No. 3, 184-208.
Laschinger, H.K.S., & Finegan, J. (2005). Using empowerment to build trust and respect in
the workplace: A strategy for addressing the nursing shortage. Nursing Economics,
Vol. 23, No. 1 , 6-13.
Laschinger, H.K.S., Labatt, A., Finegan, J., & Wilk, P. (2011). Testing a multi-level model of
staff nurse organizational commitment, Journal of Healthcare Management, Vol. 56,
No.1, 81-96.
Linz, S. J., Good, L. K., & Huddleston, P. (2006). Worker morale in Russia: an exploratory
study. Journal of managerial psychology, Vol. 21, No. 5, 415- 437.
Malhotra, N. (2005). Marketing research An applied orientation (4 ed.). New Delhi:
Prentice- Hall of India Private Limited.
Mishra, A. (1996). Organizational responses to crisis: The centrality of trust.In
R.M.Kramer,T.R.Tyler(Eds). Trust in organizations: Frontiers of theory and
research. Thousand Oaks, CA: Sage. 261-287.
Munck, B. (2001). Changing a culture of face time. Boston.
Neely, G.H. (1999). The relationship between employee morale and employee productivity,
Fire Service Financial Management, Executive Fire office programe,1-12.
Ngambi, H.C. (2011). The relationship between leadership and employee morale in higher
education. African Journal of Business Management, Vol.5, No.3, 762-776.
Ransom, W. (1995). Building employee morale. Daily reporter .

22 http://ssrn.com/abstract=2430035
Senthilnathan, S., & Rukshani, K. (2013). A review on relationship variables to employee
morale and organizational trust. International Journal of Innovative Research and
Practices, Vol. 1, No. 10, 8-15
Shockley-Zalabak, P., Ellis, K., & Winograd, G. (2000). Organizational trust:what it mean
and why it matters? Organizational Development Journal, Vol. 18, No. 4, 35-48.
Sri Lanka Telecom PLC (2011). Annual Report.
Tharmi, U., & Senthilnathan, S. (2012). The relationship of brand equity to purchase
intention. IUP Journal of Marketing Management, Vol. 11, No. 2, 7-26.
Thusyanthy, V., & Senthilnathan, S. (2012). Customer satisfaction in terms of physical
evidence and employee interaction. IUP Journal of Marketing Management, Vol. 11,
No. 3, 7-24.
Thusyanthy, V., & Senthilnathan, S. (2013). Level of job satisfaction and its association with
demographic variables. IME Journal, Vol. 7, No. 2, 39-45.
Upadhyay, D., & Gupta, A. (2012). Morale, welfare measures, job satisfaction: The key
mantras for gaining competitive edge. International Journal of Physical and Social
Sciences , Vol. 2, No. 7, 80-94.
Vineburgh, J. H. (2010). A study of organizational trust and related variables among faculty
members at HBCUs. 2-131.
Watson, D. (1988). Intraindividual and intraindividual analysis of positive and negative
affect: their relation to health complaints, perceived stress, and daily activities.
Journal of Personality and Social psychology , Vol. 54, No. 6, 1020-1030.
Whitener, E. M. (1997). The impact of human resource activities on employee trust. Human
Resource Management Review, Vol. 7, No. 4, 389-404.

23 http://ssrn.com/abstract=2430035
Annex 1: Correlation between Dimensions of Study Variables The correlation analyses show that there is no high level of multicollinearity between the dimensions of each study variable. The predetermined
multicollinearity level (approximately r ≥ 0.9) does not allow eliminating any of the dimensions. Therefore, there is no substitutability between
each of the dimensions of a study variable. It implies that the respondents have understood each statement in the questionnaire without
perceiving the dimensions in the same context, rather they found then differently. Conclusively, this implies that each dimension is considered
important in this study.
Panel A: Correlation between dimensions of organizational trust
In this table, OT1 = Vulnerability, OT2 = Mutual supervision, OT3 = Satisfaction, OT4 = Feelings of existence and identity, OT5 = Attention to employees, OT6 =
Commitment, OT7 = Reliability, OT8 = Honesty, OT9 = Preciosity and rectitude, OT10 = Competency, OT = Overall organizational trust, ** = Correlation is significant at
the 0.01 level (2-tailed) and * = Correlation is significant at the 0.05 level (2-tailed).
Correlations OT1 OT2 OT3 OT4 OT5 OT6 OT7 OT8 OT9 OT10 OT
OT1 Pearson Correlation 1
.400**
.000
.511**
.000
.491**
.000
.283**
.004
.317**
.001
.340**
.001
.254*
.011
.204*
.041
.238*
.017
.579**
.000 Sig. (2-tailed)
OT2 Pearson Correlation .400**
.000 1
.663**
.000
.393**
.000
.351**
.000
.319**
.001
.501**
.000
.260**
.009
.587**
.000
.419**
.000
.715**
.000 Sig. (2-tailed)
OT3 Pearson Correlation .511**
.000
.663**
.000 1
.385**
.000
.418**
.000
.270**
.007
.414**
.000
.220*
.028
.519**
.000
.449**
.000
.722**
.000 Sig. (2-tailed)
OT4 Pearson Correlation .491**
.000
.393**
.000
.385**
.000 1
.449**
.000
.484**
.000
.530**
.000
.170
.091
.371**
.000
.364**
.000
.682**
.000 Sig. (2-tailed)
OT5 Pearson Correlation .283**
.004
.351**
.000
.418**
.000
.449**
.000 1
.482**
.000
.358**
.000
.192
.056
.535**
.000
.313**
.002
.711**
.000 Sig. (2-tailed)
OT6 Pearson Correlation .317**
.001
.319**
.001
.270**
.007
.484**
.000
.482**
.000 1
.380**
.000
.363**
.000
.407**
.000
.225*
.024
.659**
.000 Sig. (2-tailed)
OT7 Pearson Correlation .340**
.001
.501**
.000
.414**
.000
.530**
.000
.358**
.000
.380**
.000 1
.440**
.000
.516**
.000
.481**
.000
.729**
.000 Sig. (2-tailed)
OT8 Pearson Correlation .254*
.011
.260**
.009
.220*
.028
.170
.091
.192
.056
.363**
.000
.440**
.000 1
.269**
.007
.181
.071
.501**
.000 Sig. (2-tailed)
OT9 Pearson Correlation .204*
.041
.587**
.000
.519**
.000
.371**
.000
.535**
.000
.407**
.000
.516**
.000
.269**
.007 1
.407**
.000
.731**
.000 Sig. (2-tailed)
OT10 Pearson Correlation .238*
.017
.419**
.000
.449**
.000
.364**
.000
.313**
.002
.225*
.024
.481**
.000
.181
.071
.407**
.000 1
.602**
.000 Sig. (2-tailed)
OT Pearson Correlation .579**
.000
.715**
.000
.722**
.000
.682**
.000
.711**
.000
.659**
.000
.729**
.000
.501**
.000
.731**
.000
.602**
.000 1
Sig. (2-tailed)

24 http://ssrn.com/abstract=2430035
Panel B: Correlation between dimensions of employee morale
In this table, EM1 = Honoring the job, EM2 = Dependency to organization, EM3 = Recommendation to others, EM4 = Job satisfaction, EM5 = Proper Job, EM6 = Helping
organization, EM7 = Leaving organization, EM8 = Not changing job, EM9 = Thought of changing job, EM10 = Peer’s view, EM11 = Not changing the organization, EM =
Overall employee morale, ** = Correlation is significant at the 0.01 level (2-tailed) and * = Correlation is significant at the 0.05 level (2-tailed).
Correlations EM1 EM2 EM3 EM4 EM5 EM6 EM7 EM8 EM9 EM10 EM11 EM
EM1 Pearson Correlation 1
.440**
.000
.470**
.000
.149
.140
.509**
.000
.239*
.017
-.001
.989
.258**
.009
.169
.093
.249*
.012
.078
.440
.493**
.000 Sig. (2-tailed)
EM2 Pearson Correlation .440**
.000 1
.497**
.000
.468**
.000
.468**
.000
.315**
.001
.235*
.019
.337**
.001
.318**
.001
.198*
.049
.001
.992
.613**
.000 Sig. (2-tailed)
EM3 Pearson Correlation .470**
.000
.497**
.000 1
.356**
.000
.518**
.000
.208*
.038
.225*
.025
.353**
.000
.320**
.001
.353**
.000
-.053
.600
.599**
.000 Sig. (2-tailed)
EM4 Pearson Correlation .149
.140
.468**
.000
.356**
.000 1
.452**
.000
.360**
.000
.268**
.007
.428**
.000
.305**
.002
.265**
.008
-.007
.945
.584**
.000 Sig. (2-tailed)
EM5 Pearson Correlation .509**
.000
.468**
.000
.518**
.000
.452**
.000 1
.564**
.000
.324**
.001
.359**
.000
.232*
.020
.185
.065
.155
.125
.715**
.000 Sig. (2-tailed)
EM6 Pearson Correlation .239*
.017
.315**
.001
.208*
.038
.360**
.000
.564**
.000 1
.453**
.000
.426**
.000
.256*
.010
.124
.218
.116
.252
.635**
.000 Sig. (2-tailed)
EM7 Pearson Correlation -.001
.989
.235*
.019
.225*
.025
.268**
.007
.324**
.001
.453**
.000 1
.314**
.001
.200*
.046
.047
.640
.013
.901
.555**
.000 Sig. (2-tailed)
EM8 Pearson Correlation .258**
.009
.337**
.001
.353**
.000
.428**
.000
.359**
.000
.426**
.000
.314**
.001 1
.204*
.041
.328**
.001
-.074
.466
.566**
.000 Sig. (2-tailed)
EM9 Pearson Correlation .169
.093
.318**
.001
.320**
.001
.305**
.002
.232*
.020
.256*
.010
.200*
.046
.204*
.041 1
.667**
.000
.054
.597
.562**
.000 Sig. (2-tailed)
EM10 Pearson Correlation .249*
.012
.198*
.049
.353**
.000
.265**
.008
.185
.065
.124
.218
.047
.640
.328**
.001
.667**
.000 1
-.072
.478
.462**
.000 Sig. (2-tailed)
EM11 Pearson Correlation .078
.440
.001
.992
-.053
.600
-.007
.945
.155
.125
.116
.252
.013
.901
-.074
.466
.054
.597
-.072
.478 1
.384**
.000 Sig. (2-tailed)
EM Pearson Correlation .493**
.000
.613**
.000
.599**
.000
.584**
.000
.715**
.000
.635**
.000
.555**
.000
.566**
.000
.562**
.000
.462**
.000
.384**
.000 1
Sig. (2-tailed)