Impact of Openings on the In-Plane Strength of Confined and ...
24
Citation: Mughal, U.A.; Qazi, A.U.; Ahmed, A.; Abbass, W.; Abbas, S.; Salmi, A.; Sayed, M.M. Impact of Openings on the In-Plane Strength of Confined and Unconfined Masonry Walls: A Sustainable Numerical Study. Sustainability 2022, 14, 7467. https://doi.org/10.3390/ su14127467 Academic Editor: Marc A. Rosen Received: 4 April 2022 Accepted: 15 June 2022 Published: 18 June 2022 Publisher’s Note: MDPI stays neutral with regard to jurisdictional claims in published maps and institutional affil- iations. Copyright: © 2022 by the authors. Licensee MDPI, Basel, Switzerland. This article is an open access article distributed under the terms and conditions of the Creative Commons Attribution (CC BY) license (https:// creativecommons.org/licenses/by/ 4.0/). sustainability Article Impact of Openings on the In-Plane Strength of Confined and Unconfined Masonry Walls: A Sustainable Numerical Study Ubaid Ahmad Mughal 1 , Asad Ullah Qazi 1 , Ali Ahmed 1 , Wasim Abbass 1, *, Safeer Abbas 1 , Abdelatif Salmi 2 and Mohamed Mahmoud Sayed 3 1 Department of Civil Engineering, University of Engineering and Technology, Lahore 54890, Pakistan; [email protected] (U.A.M.); [email protected] (A.U.Q.); [email protected] (A.A.); [email protected] (S.A.) 2 Department of Civil Engineering, College of Engineering, Prince Sattam bin Abdulaziz University, Al-Kharj 16273, Saudi Arabia; [email protected] 3 Architectural Engineering, Faculty of Engineering and Technology, Future University in Egypt, New Cairo 11745, Egypt; [email protected] * Correspondence: [email protected] Abstract: While openings are an essential requirement in buildings as a source of access, fresh air and sunlight, these openings cause a reduction in the lateral stiffness and torsional resistance of masonry wall units. A detailed numerical investigation was carried out to explore the impact of the opening percentage on the in-plane stiffness and lateral strength of unconfined and confined masonry wall panels prepared using calcium silicate bricks, for sustainable masonry structures. A commercially available FEM package (ANSYS) was used to carry out comparative analysis of ten wall panels, five of each type (confined and unconfined masonry walls) with concentrically located openings of varying sizes (0% to 16.5%). A simplified micro-modeling technique following the Newton Raphson Algorithm was adopted. Results revealed that the confined masonry approach unveiled a more reliable anti-seismic response along with improved in-plane strength in the case of confined masonry walls. The failure type shifted from pure flexural to more of a blend of shear and flexure after the opening percentage increased to 10.09% in unconfined masonry walls, which was not the case where confinement was provided. Based on the outcomes, it is strongly recommended to adopt confined masonry in highly seismic-prone areas to avoid catastrophic damage caused by earthquakes. Keywords: openings; masonry walls; confined masonry walls; finite element modeling; ANSYS 1. Introduction The housing sector is one of the most important sections of the construction industry due to the need of shelter for humans. Although the overall geometry of a house experiences variations and improvements, important components of a house such as openings in the form of windows and doors remained permanent features of the structures as they provide access for humans and air, etc. The opening size has continuously kept on varying from one architectural plan to the other, but with time, larger size openings have gained more attraction as compared to smaller ones. The provision on large-sized openings may compromise the strength of masonry walls, especially in seismic-prone areas. This may be attributed to the provision of unsymmetrical openings in load-bearing walls, which may cause a reduction in the in-plane stiffness and lateral strength of masonry walls [1,2]. The construction of masonry houses is being practiced not only in Pakistan but throughout the world. According to media reports [3], in the 2005 Kashmir earthquake around 87,000 people including 19,000 children died and 3.5 million people were rendered homeless. Therefore, one needs to carefully consider the effect of these seismic forces in the structural design as mentioned in the latest seismic codes [4,5]. With the increase in Sustainability 2022, 14, 7467. https://doi.org/10.3390/su14127467 https://www.mdpi.com/journal/sustainability
-
Upload
khangminh22 -
Category
Documents
-
view
3 -
download
0
Transcript of Impact of Openings on the In-Plane Strength of Confined and ...

Citation: Mughal, U.A.; Qazi, A.U.;
Ahmed, A.; Abbass, W.; Abbas, S.;
Salmi, A.; Sayed, M.M. Impact of
Openings on the In-Plane Strength of
Confined and Unconfined Masonry
Walls: A Sustainable Numerical
Study. Sustainability 2022, 14, 7467.
https://doi.org/10.3390/
su14127467
Academic Editor: Marc A. Rosen
Received: 4 April 2022
Accepted: 15 June 2022
Published: 18 June 2022
Publisher’s Note: MDPI stays neutral
with regard to jurisdictional claims in
published maps and institutional affil-
iations.
Copyright: © 2022 by the authors.
Licensee MDPI, Basel, Switzerland.
This article is an open access article
distributed under the terms and
conditions of the Creative Commons
Attribution (CC BY) license (https://
creativecommons.org/licenses/by/
4.0/).
sustainability
Article
Impact of Openings on the In-Plane Strength of Confined andUnconfined Masonry Walls: A Sustainable Numerical StudyUbaid Ahmad Mughal 1 , Asad Ullah Qazi 1, Ali Ahmed 1 , Wasim Abbass 1,*, Safeer Abbas 1, Abdelatif Salmi 2
and Mohamed Mahmoud Sayed 3
1 Department of Civil Engineering, University of Engineering and Technology, Lahore 54890, Pakistan;[email protected] (U.A.M.); [email protected] (A.U.Q.); [email protected] (A.A.);[email protected] (S.A.)
2 Department of Civil Engineering, College of Engineering, Prince Sattam bin Abdulaziz University,Al-Kharj 16273, Saudi Arabia; [email protected]
3 Architectural Engineering, Faculty of Engineering and Technology, Future University in Egypt,New Cairo 11745, Egypt; [email protected]
* Correspondence: [email protected]
Abstract: While openings are an essential requirement in buildings as a source of access, fresh air andsunlight, these openings cause a reduction in the lateral stiffness and torsional resistance of masonrywall units. A detailed numerical investigation was carried out to explore the impact of the openingpercentage on the in-plane stiffness and lateral strength of unconfined and confined masonry wallpanels prepared using calcium silicate bricks, for sustainable masonry structures. A commerciallyavailable FEM package (ANSYS) was used to carry out comparative analysis of ten wall panels,five of each type (confined and unconfined masonry walls) with concentrically located openings ofvarying sizes (0% to 16.5%). A simplified micro-modeling technique following the Newton RaphsonAlgorithm was adopted. Results revealed that the confined masonry approach unveiled a morereliable anti-seismic response along with improved in-plane strength in the case of confined masonrywalls. The failure type shifted from pure flexural to more of a blend of shear and flexure after theopening percentage increased to 10.09% in unconfined masonry walls, which was not the case whereconfinement was provided. Based on the outcomes, it is strongly recommended to adopt confinedmasonry in highly seismic-prone areas to avoid catastrophic damage caused by earthquakes.
Keywords: openings; masonry walls; confined masonry walls; finite element modeling; ANSYS
1. Introduction
The housing sector is one of the most important sections of the construction industrydue to the need of shelter for humans. Although the overall geometry of a house experiencesvariations and improvements, important components of a house such as openings inthe form of windows and doors remained permanent features of the structures as theyprovide access for humans and air, etc. The opening size has continuously kept on varyingfrom one architectural plan to the other, but with time, larger size openings have gainedmore attraction as compared to smaller ones. The provision on large-sized openingsmay compromise the strength of masonry walls, especially in seismic-prone areas. Thismay be attributed to the provision of unsymmetrical openings in load-bearing walls,which may cause a reduction in the in-plane stiffness and lateral strength of masonrywalls [1,2]. The construction of masonry houses is being practiced not only in Pakistan butthroughout the world. According to media reports [3], in the 2005 Kashmir earthquakearound 87,000 people including 19,000 children died and 3.5 million people were renderedhomeless. Therefore, one needs to carefully consider the effect of these seismic forces inthe structural design as mentioned in the latest seismic codes [4,5]. With the increase in
Sustainability 2022, 14, 7467. https://doi.org/10.3390/su14127467 https://www.mdpi.com/journal/sustainability

Sustainability 2022, 14, 7467 2 of 24
population and recent seismic activities including large magnitude earthquakes, moreemphasis should be placed on the earthquake resistance of masonry structures.
In the recent past, the concept of performance-based design has gained more attention.Further, the numerical modeling of masonry has gained importance due to the need tounderstand the role of masonry in earthquake-resistant structures. With the advent ofdigital computers and the availability of sophisticated analytical tools, the complex behaviorof structures can be simulated to understand and predict failure mechanisms, which is acost-effective solution. There are various types of numerical modeling approaches availablesuch as simplified micro-modeling, macro-modeling, and detailed micro-modeling asshown in Figure 1.
Sustainability 2022, 14, x FOR PEER REVIEW 2 of 25
structural design as mentioned in the latest seismic codes [4,5]. With the increase in pop-ulation and recent seismic activities including large magnitude earthquakes, more empha-sis should be placed on the earthquake resistance of masonry structures.
In the recent past, the concept of performance-based design has gained more atten-tion. Further, the numerical modeling of masonry has gained importance due to the need to understand the role of masonry in earthquake-resistant structures. With the advent of digital computers and the availability of sophisticated analytical tools, the complex be-havior of structures can be simulated to understand and predict failure mechanisms, which is a cost-effective solution. There are various types of numerical modeling ap-proaches available such as simplified micro-modeling, macro-modeling, and detailed mi-cro-modeling as shown in Figure 1.
(a)
(b)
(c)
Figure 1. Finite Element Approaches. (a) Macro-modeling approach, (b) Simplified micro-modeling, (c) Detailed micro-modeling approach.
The macro modeling approach is utilized due to fewer data processing time require-ments, but at the same time it is relatively less accurate. In this technique, the whole wall is considered as one complete homogenous element with mesh size equal to the size of a brick element and the properties assigned to a masonry wall in place of brick and mortar
Figure 1. Finite Element Approaches. (a) Macro-modeling approach, (b) Simplified micro-modeling,(c) Detailed micro-modeling approach.
The macro modeling approach is utilized due to fewer data processing time require-ments, but at the same time it is relatively less accurate. In this technique, the whole wallis considered as one complete homogenous element with mesh size equal to the size of abrick element and the properties assigned to a masonry wall in place of brick and mortarseparately [6]. Where detailed accuracy is not a major concern, the macro-modeling tech-nique can be employed, for instance, for larger structures. In contrast to macro-modeling, in
Sustainability 2022, 14, 7467 3 of 24
the detailed micro-modeling approach brick elements and mortar are modeled separately,having their own individual properties. Therefore, this technique requires more time toprocess data. However, simplified micro-modeling takes less time compared to detailedmicro-modeling and is feasible for this sort of analysis. To assign the compressive and shearstress properties of mortar, springs are used, and for the bond between the brick and mortar,contact elements are utilized. Several researchers have performed finite element analyses ofmasonry walls to perceive the intricate performance of masonry and have presented theirsuggestions regarding the simplified methods [7–12]. Similarly, the failure mechanism of abrick wall with openings has been reported in the literature by many researchers [13–16].To predict the possible failure pattern of a masonry wall, various numerical modelingtechniques such as the applied element method [15], the discrete element method, the finiteelement method [13,14] etc., have been used by researchers. Arya and Hegemier [17] andPage [18] used the simplified approach to model masonry in which they considered thebricks as continuum elements, while they used mortar joints with masonry units for theinterface elements. Lotfi and Shing [19] used an identical approach for the simulation of thecracks of the mortar joints with shear and normal stresses but did not get rewarding resultsin high compression cases. Finite element analysis of partially grouted masonry shearwalls was carried out by Shing and Cao [20] and it was reported that the lateral strengthof walls obtained experimentally was less than compared to the numerical approach. Thesimulation of the initiation of cracks in masonry was performed by Kumar et. al. [21]and Citto [22] in both shear and normal directions. To define a constitutive behavior auser-defined subroutine was made. All the above-mentioned studies have performedanalysis on two-dimensional models and the loading conditions were in-plane and mono-tonic, whereas a three-dimensional analysis was performed by Aref and Dolatshahi [23]on Abaqus. The types of loading used on masonry walls were cyclic, in-plane, and out-of-plane. In order to study the mortar joints, Abdullah et al. [14] performed simplifiedmicro-modeling by including the surface-based cohesion in Abaqus. For the simulationof masonry under compression, they used the Druker Prager model. The propositionof a combination of plasticity-based and extended finite elements for the simulation ofthree-dimensional non-linear masonry models was reported. The loading conditions usedwere monotonic in-plane, cyclic, and out of the plane. The analysis was carried out byusing the Newton Raphson solution and no user-defined subroutines were used. Severalresearchers have assessed different parameters like ductility, energy absorption, failuremechanism, reinforcement type, aspect ratios, etc. [6,24–29]. Ahmed and Shahzada [30]assessed the seismic vulnerability of confined masonry structures using a case study bymacro-modeling approach in ATENA. They performed parametric analysis on masonrystrength, wall density, confining elements, and precompression loads and concluded thatby increasing the masonry strength from 2 MPa to 4 Mpa, the lateral strength increasedabout 80%. The increase in lateral capacity was found to be 18.6% when the wall densitywas increased from 4.5% to 7.5%. Similarly, by increasing the steel ratio of the longitudinalreinforcement in confining elements from 0.05 to 0.4, a 26% increase in lateral capacitywas observed. In some of the major seismic events such as the earthquakes of Manjil in1990 [31], 1994 Northridge in 1994 [32], and San Fernando in 1971, it was observed thatmasonry structures were subjected to severe damage as compared to concrete construction,which dominated the use of reinforced concrete construction as sustainable structuraldesign. Ahmed et al. [33] performed the validation of confined and unreinforced masonrystructures by macro-modeling. The report compared already tested unreinforced masonryand confined masonry structures with their numerical results and found them to be in closecomparison. It was concluded that the confined masonry structures are more suitable forseismic-prone areas because the confinement increases the ductility of masonry structuresconsiderably. Cruz and Gavilan [34] performed an experimental study on the effect of jointreinforcement and aspect ratio on the seismic performance of confined masonry walls. Theyused a total of eight samples with aspect ratios of 1.46, 1, 0.59, and 0.4 with two differentamounts of reinforcements in each aspect ratio. They concluded that the shear strength of

Sustainability 2022, 14, 7467 4 of 24
walls was increased by increasing the joint reinforcement. They also concluded that thelonger walls depicted a more brittle behavior. Singhal and Rai [35] performed an experi-mental study on eight half-scaled wall models to study the effect of toothing and openingson the in and out of plane strength of confined masonry walls. Cyclic drifts and shake tabletests were performed to conclude that the interaction between the confining elements andmasonry walls was enhanced by the toothing connections. They also concluded that theconfinement provided around the openings was very much beneficial in terms of uniformdistribution of cracks which ultimately lead to enhanced strength and deformability.
The seismic response of a structural element can be smartly approximated by the useof non-linear push-over analysis because the computation time is higher in dynamic timehistory analysis [36–38]. A prior primitive effort was made by the author to investigatethe effects of openings on unconfined masonry walls. It was observed that the provisionof openings reduces the lateral stiffness of unconfined masonry walls immensely [39].Therefore, as an extension to the same work, in this article, an attempt has been made toinvestigate the effect of the size of openings on the lateral performance of confined andunconfined brick masonry walls, prepared using calcium silicate bricks, having an aspectratio of 1.78 with loading applied as in-plane and quasi-static and by means of a simpli-fied finite element approach, Figure 1b. The calcium-silicate bricks are usually preferredas they require less mortar for plastering as well as having uniform color and accuratesizes. Furthermore, these bricks offer better resistance to efflorescence and heat. Differentcomputational strategies for masonry structures are explained in detail by Lourenco [40].ANSYS APDL was used for numerical modeling and analysis of walls. Numerical andexperimental validation of the wall model was done by using the research work publishedby Barraza [13]. The calibrated model was then modified with openings by changingthe percentage from 1.85% to 16.5%. All the walls were also confined to see the changein the in-plane strength of masonry walls having openings. The effect on the in-planestrength and stiffness was observed, compared, and reported. Peak loads, stress diagrams,and load-displacement curves were produced and a comparative analysis of results ispresented here.
2. Methodology2.1. Numerical Modeling
A total of ten three-dimensional slender masonry wall panels having an aspect ratioof 1.78 including five unconfined and five confined wall panels were modeled in ANSYSAPDL using a simplified micro-modeling approach. Of the unconfined masonry walls(Figure 2), the first wall (MW AR1.78–0%) had no opening and the remaining four un-confined masonry walls (MW AR1.78–1.85%, MW AR1.78–3.66%, MW AR1.78–10.91%,and MW AR1.78–16.5%) had openings of 1.85%, 3.66%, 10.91%, and 16.5%, respectively.In a similar pattern, for comparison purposes, the confined walls were also modeled offive types (CMW AR1.78–1.85%, CMW AR1.78–3.66%, CMW AR1.78–10.91%, and CMWAR1.78–16.5%) with the same percentage of openings. Schematic diagrams of the confinedmasonry walls are presented in Figure 3.
Solid 65 was used as the brick element because of having three degrees of freedom atevery node and the property of crushing in compression and cracking in tension. The shearand compression properties of mortar were assigned to spring elements while COMBIN39was used as the type of spring element. COMBIN39 possesses two degrees of freedomat each node and is non-linear and uni-directional with a generalized multilinear force-deflection law. To have more realistic results, in each direction, individual and separatespring elements were assigned to each node for the compression and shear. To representthe sliding and contact between the nodes in ANSYS, the element CONTA178 was used,which can be seen in Figure 4.

Sustainability 2022, 14, 7467 5 of 24Sustainability 2022, 14, x FOR PEER REVIEW 5 of 25
Figure 2. Schematics of unconfined masonry walls with varying opening percentages. (a) MW AR1.78–0%, (b) MW AR1.78–1.85%, (c) MW AR1.78–3.66%, (d) MW AR1.78–10.91%, (e) MW AR1.78–16.5%.
Figure 3. Schematics of confined masonry walls with varying opening percentages. (a) CMW AR1.78–0%, (b) CMW AR1.78–1.85%, (c) CMW AR1.78–3.66%, (d) CMW AR1.78–10.91%, (e) CMW AR1.78–16.5%.
Solid 65 was used as the brick element because of having three degrees of freedom at every node and the property of crushing in compression and cracking in tension. The shear and compression properties of mortar were assigned to spring elements while COMBIN39 was used as the type of spring element. COMBIN39 possesses two degrees of freedom at each node and is non-linear and uni-directional with a generalized multilinear force-deflection law. To have more realistic results, in each direction, individual and sep-arate spring elements were assigned to each node for the compression and shear. To rep-resent the sliding and contact between the nodes in ANSYS, the element CONTA178 was used, which can be seen in Figure 4.
Figure 2. Schematics of unconfined masonry walls with varying opening percentages. (a) MWAR1.78–0%, (b) MW AR1.78–1.85%, (c) MW AR1.78–3.66%, (d) MW AR1.78–10.91%, (e) MWAR1.78–16.5%.
Sustainability 2022, 14, x FOR PEER REVIEW 5 of 25
Figure 2. Schematics of unconfined masonry walls with varying opening percentages. (a) MW AR1.78–0%, (b) MW AR1.78–1.85%, (c) MW AR1.78–3.66%, (d) MW AR1.78–10.91%, (e) MW AR1.78–16.5%.
Figure 3. Schematics of confined masonry walls with varying opening percentages. (a) CMW AR1.78–0%, (b) CMW AR1.78–1.85%, (c) CMW AR1.78–3.66%, (d) CMW AR1.78–10.91%, (e) CMW AR1.78–16.5%.
Solid 65 was used as the brick element because of having three degrees of freedom at every node and the property of crushing in compression and cracking in tension. The shear and compression properties of mortar were assigned to spring elements while COMBIN39 was used as the type of spring element. COMBIN39 possesses two degrees of freedom at each node and is non-linear and uni-directional with a generalized multilinear force-deflection law. To have more realistic results, in each direction, individual and sep-arate spring elements were assigned to each node for the compression and shear. To rep-resent the sliding and contact between the nodes in ANSYS, the element CONTA178 was used, which can be seen in Figure 4.
Figure 3. Schematics of confined masonry walls with varying opening percentages. (a) CMWAR1.78–0%, (b) CMW AR1.78–1.85%, (c) CMW AR1.78–3.66%, (d) CMW AR1.78–10.91%, (e) CMWAR1.78–16.5%.
For steel, the element type used was Link180 and the type of material chosen wasbilinear isotropic with a yield strength of 280 MPa. To predict the actual behavior, twoseparate springs along with a single contact element were used between brick nodes.Element properties used have been summarized in Table 1.

Sustainability 2022, 14, 7467 6 of 24Sustainability 2022, 14, x FOR PEER REVIEW 6 of 25
Figure 4. Schematics of connection between brick elements using springs and contact elements.
For steel, the element type used was Link180 and the type of material chosen was bilinear isotropic with a yield strength of 280 MPa. To predict the actual behavior, two separate springs along with a single contact element were used between brick nodes. Ele-ment properties used have been summarized in Table 1.
Table 1. Properties of Elements used.
Maximum Compressive Strength of Brick = fb= 26,500 kN/m2 Maximum compressive strength of mortar = fm= 12,300 kN/m2
Initial elastic modulus of bricks = Eb= 9,407,500 kN/m2 Initial elastic modulus of mortar = Em= 2,460,000 kN/m2
Poisson’s coefficient for brick elements = νb= 0.2 Poisson’s coefficient for mortar = νm= 0.15
Normal Stiffness = kN= 66,727,500 kN/m Tangential Stiffness = Ks= 28,973,783 kN/m
Yield Strength of Reinforcement = σy = 280 MPa
Element units modeled were of the size 0.248 m × 0.248 m × 0.175 m while the thick-ness of mortar used was kept 2 mm. These values were selected based on the experimental values used for the validation of the numerical model which was discussed in Section 2.2. Simplified stress-strain curves of brick and mortar elements were drawn and given as an input in ANSYS. See [13].
Brick elements were meshed by dividing them equally into two parts vertically. This was done to connect them with the nodes of the upper and lower layers. To predict the capacity of brick masonry walls numerically, it is better to use a running bond for the modeling of masonry walls because of the better cinematic behavior of bricks [13]. In order to input the force-deflection curves, the force was calculated from the tributary area of every node by dividing the surface of the brick into eight equal parts as shown in Figure 5.
Figure 4. Schematics of connection between brick elements using springs and contact elements.
Table 1. Properties of Elements used.
Maximum Compressive Strength of Brick = fb = 26,500 kN/m2
Maximum compressive strength of mortar = fm = 12,300 kN/m2
Initial elastic modulus of bricks = Eb = 9,407,500 kN/m2
Initial elastic modulus of mortar = Em = 2,460,000 kN/m2
Poisson’s coefficient for brick elements = νb = 0.2Poisson’s coefficient for mortar = νm = 0.15
Normal Stiffness = kN = 66,727,500 kN/mTangential Stiffness = Ks = 28,973,783 kN/m
Yield Strength of Reinforcement = σy = 280 MPa
Element units modeled were of the size 0.248 m × 0.248 m × 0.175 m while the thick-ness of mortar used was kept 2 mm. These values were selected based on the experimentalvalues used for the validation of the numerical model which was discussed in Section 2.2.Simplified stress-strain curves of brick and mortar elements were drawn and given as aninput in ANSYS. See [13].
Brick elements were meshed by dividing them equally into two parts vertically. Thiswas done to connect them with the nodes of the upper and lower layers. To predict thecapacity of brick masonry walls numerically, it is better to use a running bond for themodeling of masonry walls because of the better cinematic behavior of bricks [13]. In orderto input the force-deflection curves, the force was calculated from the tributary area ofevery node by dividing the surface of the brick into eight equal parts as shown in Figure 5.
Sustainability 2022, 14, x FOR PEER REVIEW 7 of 25
Figure 5. Tributary area.
The deflection was calculated by multiplying the strain with the length of the spring element. The length of the spring element was included as ninety percent (9/10th) of the thickness of the joint and the contact element’s length was calculated as one-tenth (1/10th) of the thickness of the joint. This was done to accommodate the insertion of the springs. The capacity of mortar in tension was added as one-tenth (1/10th) of the compressive strength and its behavior in compression was taken as tri-linear until it reached its peak, and after that the behavior was seen turning to ideal plastic.
The contact algorithm followed the pure penalty method. To incorporate the shear strength of the mortar, a value of one-tenth (1/10th) of the mortar’s compressive strength was used. It was possible to control the numerical model either by displacement or by force. In the laboratory, it is normally preferred to perform displacement control tests as compared to force control to better perform the test and to investigate the failure mecha-nism, which is why the analysis performed in this research followed the displacement-controlled method. The application of loads took two steps, first being the gravity load for initial compression and then the second as the lateral load. To avoid instability, the UZ direction of the model was constrained but was allowed to move freely in the UX and UY directions. In order to have a uniform distribution of gravity load, a rigid beam was pro-vided at the top. The top surface area of the beam was utilized in the application of gravity load as load step one, whereas, in load step two, the left surface area of the beam was used for the application of a 0.05 m displacement. The solution took some time and then it con-verged successfully. A pushover curve was drawn and was in good agreement with the numerical and experimental curves of Barraza [13] and Magenes [41], which has been pre-sented in Figure 6.
Figure 6. Pushover curves comparison between numerical and experimental results.
After calibrating the numerical model with experimental results, the research was extended by adding openings with varying percentages from 0% to 16.5% of the surface area of the walls. The opening percentages were decided considering the brick element
Figure 5. Tributary area.

Sustainability 2022, 14, 7467 7 of 24
The deflection was calculated by multiplying the strain with the length of the springelement. The length of the spring element was included as ninety percent (9/10th) of thethickness of the joint and the contact element’s length was calculated as one-tenth (1/10th)of the thickness of the joint. This was done to accommodate the insertion of the springs.The capacity of mortar in tension was added as one-tenth (1/10th) of the compressivestrength and its behavior in compression was taken as tri-linear until it reached its peak,and after that the behavior was seen turning to ideal plastic.
The contact algorithm followed the pure penalty method. To incorporate the shearstrength of the mortar, a value of one-tenth (1/10th) of the mortar’s compressive strengthwas used. It was possible to control the numerical model either by displacement or by force.In the laboratory, it is normally preferred to perform displacement control tests as comparedto force control to better perform the test and to investigate the failure mechanism, which iswhy the analysis performed in this research followed the displacement-controlled method.The application of loads took two steps, first being the gravity load for initial compressionand then the second as the lateral load. To avoid instability, the UZ direction of the modelwas constrained but was allowed to move freely in the UX and UY directions. In orderto have a uniform distribution of gravity load, a rigid beam was provided at the top.The top surface area of the beam was utilized in the application of gravity load as loadstep one, whereas, in load step two, the left surface area of the beam was used for theapplication of a 0.05 m displacement. The solution took some time and then it convergedsuccessfully. A pushover curve was drawn and was in good agreement with the numericaland experimental curves of Barraza [13] and Magenes [41], which has been presented inFigure 6.
Sustainability 2022, 14, x FOR PEER REVIEW 7 of 25
Figure 5. Tributary area.
The deflection was calculated by multiplying the strain with the length of the spring element. The length of the spring element was included as ninety percent (9/10th) of the thickness of the joint and the contact element’s length was calculated as one-tenth (1/10th) of the thickness of the joint. This was done to accommodate the insertion of the springs. The capacity of mortar in tension was added as one-tenth (1/10th) of the compressive strength and its behavior in compression was taken as tri-linear until it reached its peak, and after that the behavior was seen turning to ideal plastic.
The contact algorithm followed the pure penalty method. To incorporate the shear strength of the mortar, a value of one-tenth (1/10th) of the mortar’s compressive strength was used. It was possible to control the numerical model either by displacement or by force. In the laboratory, it is normally preferred to perform displacement control tests as compared to force control to better perform the test and to investigate the failure mecha-nism, which is why the analysis performed in this research followed the displacement-controlled method. The application of loads took two steps, first being the gravity load for initial compression and then the second as the lateral load. To avoid instability, the UZ direction of the model was constrained but was allowed to move freely in the UX and UY directions. In order to have a uniform distribution of gravity load, a rigid beam was pro-vided at the top. The top surface area of the beam was utilized in the application of gravity load as load step one, whereas, in load step two, the left surface area of the beam was used for the application of a 0.05 m displacement. The solution took some time and then it con-verged successfully. A pushover curve was drawn and was in good agreement with the numerical and experimental curves of Barraza [13] and Magenes [41], which has been pre-sented in Figure 6.
Figure 6. Pushover curves comparison between numerical and experimental results.
After calibrating the numerical model with experimental results, the research was extended by adding openings with varying percentages from 0% to 16.5% of the surface area of the walls. The opening percentages were decided considering the brick element
Figure 6. Pushover curves comparison between numerical and experimental results.
After calibrating the numerical model with experimental results, the research wasextended by adding openings with varying percentages from 0% to 16.5% of the surfacearea of the walls. The opening percentages were decided considering the brick elementsize and are quite close to the conventional sizes used for windows. The position of theopening in all walls was also kept in the diagonal position as the extreme reduction inlateral strength takes place when the window is at the diagonal center of a masonry wall.Pushover curves were made for all walls and the effect of stiffness and strength reductiondue to the percentage of openings was studied and correlated. Because the load was appliedin two steps, a lintel was provided above the openings in walls ‘d’ and ‘e’ of Figure 3 for thesafe transfer of the gravity load to the sides. A comparative analysis of the pushover curvesof unconfined masonry walls generated by the numerical modeling depicted the maximumstrength reduction due to larger-sized openings and to eliminate this reduction, all thewalls were confined by giving proper toothing in alternate layers. The connection betweenthe confining elements and bricks was also made with the help of spring elements so that itcould give more realistic results. Reinforcement provided in the confining columns andbeam was bonded with concrete.

Sustainability 2022, 14, 7467 8 of 24
2.2. Experimental Tests and Validation
A research study based on a numerical model needs experimental validation of thenumerical model to ascertain that the parameters used in the model are correct. To validatethe numerical model used in this study, the experimental work reported by Barraza [13]and Magenes [41] was used. In-plane cyclic tests were performed on twenty-eight walls inthe EUCENTRE laboratory for seismic testing of large structures. The walls were built on a400 mm thick reinforced concrete floor and were clamped from the bottom with steel bars.The loading was applied with the help of servo-hydraulic actuators. Two actuators in thevertical direction applied the vertical load on the wall and one horizontal actuator was usedto apply the horizontal load on the top beam. A load cell was also placed in the directionof the horizontal actuator to measure the horizontal load. The wall was restrained fromout of plane bending and the displacement was measured with the help of displacementtransducers. A total of twenty-five displacement transducers were installed on each wall.Due to the similarity in dimensions, out of all the walls, the wall ‘CS05′ was selected forthis study. The comparison of our numerical model and experimental work reported byBarraza [13] is presented in Figure 6. From the figure, it is clear that the numerical modelused in this study can be used to validate the results of other masonry walls as well. Aftervalidation, the research was extended to model further walls with different openings tosee the impact of the change in the percentage of openings in unconfined and confinedmasonry walls. All the walls had the same loading and boundary conditions.
3. Results and Discussion3.1. Performance of Unconfined Masonry Walls against Lateral Loading3.1.1. MW AR1.78–0%
The pushover curve along with the stress distributions at all the three parts of theload-displacement curve has been presented in Figure 7.
Sustainability 2022, 14, x FOR PEER REVIEW 8 of 25
size and are quite close to the conventional sizes used for windows. The position of the opening in all walls was also kept in the diagonal position as the extreme reduction in lateral strength takes place when the window is at the diagonal center of a masonry wall. Pushover curves were made for all walls and the effect of stiffness and strength reduction due to the percentage of openings was studied and correlated. Because the load was ap-plied in two steps, a lintel was provided above the openings in walls ‘d’ and ‘e’ of Figure 3 for the safe transfer of the gravity load to the sides. A comparative analysis of the push-over curves of unconfined masonry walls generated by the numerical modeling depicted the maximum strength reduction due to larger-sized openings and to eliminate this re-duction, all the walls were confined by giving proper toothing in alternate layers. The connection between the confining elements and bricks was also made with the help of spring elements so that it could give more realistic results. Reinforcement provided in the confining columns and beam was bonded with concrete.
2.2. Experimental Tests and Validation A research study based on a numerical model needs experimental validation of the
numerical model to ascertain that the parameters used in the model are correct. To vali-date the numerical model used in this study, the experimental work reported by Barraza [13] and Magenes [41] was used. In-plane cyclic tests were performed on twenty-eight walls in the EUCENTRE laboratory for seismic testing of large structures. The walls were built on a 400 mm thick reinforced concrete floor and were clamped from the bottom with steel bars. The loading was applied with the help of servo-hydraulic actuators. Two actu-ators in the vertical direction applied the vertical load on the wall and one horizontal ac-tuator was used to apply the horizontal load on the top beam. A load cell was also placed in the direction of the horizontal actuator to measure the horizontal load. The wall was restrained from out of plane bending and the displacement was measured with the help of displacement transducers. A total of twenty-five displacement transducers were in-stalled on each wall. Due to the similarity in dimensions, out of all the walls, the wall ‘CS05′ was selected for this study. The comparison of our numerical model and experi-mental work reported by Barraza [13] is presented in Figure 6. From the figure, it is clear that the numerical model used in this study can be used to validate the results of other masonry walls as well. After validation, the research was extended to model further walls with different openings to see the impact of the change in the percentage of openings in unconfined and confined masonry walls. All the walls had the same loading and bound-ary conditions.
3. Results and Discussion 3.1. Performance of Unconfined Masonry Walls against Lateral Loading 3.1.1. MW AR1.78–0%
The pushover curve along with the stress distributions at all the three parts of the load-displacement curve has been presented in Figure 7.
Figure 7. Pushover curve with stress distributions of MWAR 1.78–0%.
The linear part of the curve up to the value of 82.8 kN indicates that the load wastaken by the masonry unit and no cracks had developed yet. At 82.8 kN, crack initiationcan be seen in the masonry wall, and then the curve changes from linear to parabolic. Inthis region, some more cracks can be seen as the maximum mortar strength is about tobe utilized. The curve goes up to a maximum value of 117 kN and then softening starts.The displacement keeps on increasing but the load remains almost the same. The crackwidens and the wall tilts to the right side, creating compression on the right bottom ofthe wall and tension on the left bottom of the wall causing a flexural failure, which can beseen in the same figure. Similar patterns of load-displacement curves were explained byLourenco in 1996. From the constitutive relationships in it, it is clear that the cracks willnot pass through the bricks as the mortar strength is less and the crack initiation will bealong the mortar joints. Similarly, by increasing the percentage of openings, a reduction inlateral load-carrying capacity was observed in all the walls. A comparison of the push-over

Sustainability 2022, 14, 7467 9 of 24
curves of unconfined masonry walls having different percentages of openings is presentedin Figure 8 and stress distributions in all the walls are presented in Figures 9–13.
Sustainability 2022, 14, x FOR PEER REVIEW 9 of 25
Figure 7. Pushover curve with stress distributions of MWAR 1.78–0%.
The linear part of the curve up to the value of 82.8 kN indicates that the load was taken by the masonry unit and no cracks had developed yet. At 82.8 kN, crack initiation can be seen in the masonry wall, and then the curve changes from linear to parabolic. In this region, some more cracks can be seen as the maximum mortar strength is about to be utilized. The curve goes up to a maximum value of 117 kN and then softening starts. The displacement keeps on increasing but the load remains almost the same. The crack widens and the wall tilts to the right side, creating compression on the right bottom of the wall and tension on the left bottom of the wall causing a flexural failure, which can be seen in the same figure. Similar patterns of load-displacement curves were explained by Lourenco in 1996. From the constitutive relationships in it, it is clear that the cracks will not pass through the bricks as the mortar strength is less and the crack initiation will be along the mortar joints. Similarly, by increasing the percentage of openings, a reduction in lateral load-carrying capacity was observed in all the walls. A comparison of the push-over curves of unconfined masonry walls having different percentages of openings is pre-sented in Figure 8 and stress distributions in all the walls are presented in Figures 9–13.
Figure 8. Pushover Curves of MWAR 1.78 with Openings.
Figure 9. Third Principle Stresses MW AR1.78–0%.
Figure 8. Pushover Curves of MWAR 1.78 with Openings.
Sustainability 2022, 14, x FOR PEER REVIEW 9 of 25
Figure 7. Pushover curve with stress distributions of MWAR 1.78–0%.
The linear part of the curve up to the value of 82.8 kN indicates that the load was taken by the masonry unit and no cracks had developed yet. At 82.8 kN, crack initiation can be seen in the masonry wall, and then the curve changes from linear to parabolic. In this region, some more cracks can be seen as the maximum mortar strength is about to be utilized. The curve goes up to a maximum value of 117 kN and then softening starts. The displacement keeps on increasing but the load remains almost the same. The crack widens and the wall tilts to the right side, creating compression on the right bottom of the wall and tension on the left bottom of the wall causing a flexural failure, which can be seen in the same figure. Similar patterns of load-displacement curves were explained by Lourenco in 1996. From the constitutive relationships in it, it is clear that the cracks will not pass through the bricks as the mortar strength is less and the crack initiation will be along the mortar joints. Similarly, by increasing the percentage of openings, a reduction in lateral load-carrying capacity was observed in all the walls. A comparison of the push-over curves of unconfined masonry walls having different percentages of openings is pre-sented in Figure 8 and stress distributions in all the walls are presented in Figures 9–13.
Figure 8. Pushover Curves of MWAR 1.78 with Openings.
Figure 9. Third Principle Stresses MW AR1.78–0%. Figure 9. Third Principle Stresses MW AR1.78–0%.
Sustainability 2022, 14, x FOR PEER REVIEW 10 of 25
Figure 10. Third Principle Stresses MWAR 1.78–1.85%.
Figure 11. Third Principle Stresses MW AR1.78–3.66%.
Figure 12. Third Principle Stresses MW AR1.78–10.91%.
Figure 10. Third Principle Stresses MWAR 1.78–1.85%.

Sustainability 2022, 14, 7467 10 of 24
Sustainability 2022, 14, x FOR PEER REVIEW 10 of 25
Figure 10. Third Principle Stresses MWAR 1.78–1.85%.
Figure 11. Third Principle Stresses MW AR1.78–3.66%.
Figure 12. Third Principle Stresses MW AR1.78–10.91%.
Figure 11. Third Principle Stresses MW AR1.78–3.66%.
Sustainability 2022, 14, x FOR PEER REVIEW 10 of 25
Figure 10. Third Principle Stresses MWAR 1.78–1.85%.
Figure 11. Third Principle Stresses MW AR1.78–3.66%.
Figure 12. Third Principle Stresses MW AR1.78–10.91%. Figure 12. Third Principle Stresses MW AR1.78–10.91%.
Sustainability 2022, 14, x FOR PEER REVIEW 11 of 25
Figure 13. Third Principle Stresses MW AR1.78–16.5%.
3.1.2. MW AR1.78–1.85% The load-displacement curve of the unconfined masonry wall having an opening of
1.85% followed a similar trend (Figure 8), but with an approximate reduction of 28% in the lateral load-carrying capacity. The linear part of the load-displacement curve up to around 50 kN shows that the load was being taken by the masonry unit with no cracks yet developed. Soon after that, the curve starts changing to parabolic with some initial cracks, and then it goes up to a maximum value of 84.44 kN. This reduction in the maxi-mum lateral load-carrying capacity is due to the small opening present in the diagonal compression of the masonry wall, shifting the diagonal compression a little to the right side of the masonry wall (Figure 10) with a reduction of 28.5% in the lateral stiffness. To calculate the stiffness, the slope was obtained from the first elastic part of the stress-strain curves. The failure in this wall remains flexural and the place of the crack opening also remains the same as that of the MW AR1.78–0%. It can be seen that even a small opening can make a difference in the in-plane load-carrying capacity of slender masonry walls. However, this effect may be less in masonry walls with an aspect ratio equal to one or more.
3.1.3. MW AR1.78–3.66% In masonry wall MW AR1.78–3.66%, the opening size was increased to 3.66% of the
wall area. The load-displacement curve in Figure 8 follows a straight line up to a value of 41.27 kN, and after that it changes to parabolic and cracking starts. It further goes higher to a maximum value of 59.89 kN. Once the maximum capacity is achieved, the wall starts tilting to the right side, causing the crack to widen at the toe of the wall. At the same time, concrete crushing can also be seen at the heel of the wall. The stress distribution in Figure 11 shows that due to the increase in this opening percentage, the width of diagonal com-pression decreased and it shifted to the right side of the opening. The failure type re-mained flexural. The percentage reduction in stiffness was calculated as 50.83%, which indicates that an opening of around 4% can decrease the stiffness by up to 50% in slender masonry walls.
3.1.4. MW AR1.78–10.91% In MW AR1.78–10.91%, the opening area became higher than the wall area present
on each side of the opening. The load-displacement curve of MW AR1.78–10.91% in Figure 8 remained straight only up to 20 kN, and after that the crack initiation started. This wall
Figure 13. Third Principle Stresses MW AR1.78–16.5%.

Sustainability 2022, 14, 7467 11 of 24
3.1.2. MW AR1.78–1.85%
The load-displacement curve of the unconfined masonry wall having an opening of1.85% followed a similar trend (Figure 8), but with an approximate reduction of 28% inthe lateral load-carrying capacity. The linear part of the load-displacement curve up toaround 50 kN shows that the load was being taken by the masonry unit with no cracks yetdeveloped. Soon after that, the curve starts changing to parabolic with some initial cracks,and then it goes up to a maximum value of 84.44 kN. This reduction in the maximum lateralload-carrying capacity is due to the small opening present in the diagonal compression ofthe masonry wall, shifting the diagonal compression a little to the right side of the masonrywall (Figure 10) with a reduction of 28.5% in the lateral stiffness. To calculate the stiffness,the slope was obtained from the first elastic part of the stress-strain curves. The failure inthis wall remains flexural and the place of the crack opening also remains the same as thatof the MW AR1.78–0%. It can be seen that even a small opening can make a difference inthe in-plane load-carrying capacity of slender masonry walls. However, this effect may beless in masonry walls with an aspect ratio equal to one or more.
3.1.3. MW AR1.78–3.66%
In masonry wall MW AR1.78–3.66%, the opening size was increased to 3.66% of thewall area. The load-displacement curve in Figure 8 follows a straight line up to a value of41.27 kN, and after that it changes to parabolic and cracking starts. It further goes higherto a maximum value of 59.89 kN. Once the maximum capacity is achieved, the wall startstilting to the right side, causing the crack to widen at the toe of the wall. At the sametime, concrete crushing can also be seen at the heel of the wall. The stress distribution inFigure 11 shows that due to the increase in this opening percentage, the width of diagonalcompression decreased and it shifted to the right side of the opening. The failure typeremained flexural. The percentage reduction in stiffness was calculated as 50.83%, whichindicates that an opening of around 4% can decrease the stiffness by up to 50% in slendermasonry walls.
3.1.4. MW AR1.78–10.91%
In MW AR1.78–10.91%, the opening area became higher than the wall area present oneach side of the opening. The load-displacement curve of MW AR1.78–10.91% in Figure 8remained straight only up to 20 kN, and after that the crack initiation started. This wallgave a maximum lateral load-carrying capacity of 33.22 kN. The stress distribution inFigure 12 does not indicate a pure diagonal compression as the stresses are distributedover the whole wall area. The maximum and minimum principal stress locations are alsoshifted upwards to the window corners. The place of the crack opening also changedfrom the lower left bottom of the masonry wall to the right bottom corner of the window.One thing that can be noted here is that, when the wall area present at both sides of theopening was more than the opening area, the failure remained flexural and the place ofcrack opening also remained the same, but when the wall area present at both sides of theopening became less than the opening area, the place of the crack initiation changed andshifted to the corner of the window, which can be seen in Figure 12. The failure type nowchanged to a combination of shear and flexure. The percentage reduction in stiffness alsoincreased to 61.93%.
3.1.5. MW AR1.78–16.5%
MW AR1.78–16.5% gave the minimum lateral load-carrying capacity due to the maxi-mum opening percentage (16.5%). There was much less wall area present at each side ofthe opening, which was not able to take much load, and due to the larger opening presentin the diagonal compression area, the load transfer did not take place to the lower area ofthe wall. It can be seen from Figure 13 that the upper portion of the wall slides to the rightside and the lower portion of the wall remains at its position. We can say that the failurehas now shifted to sliding shear form flexure. The position of crack openings is also clearly

Sustainability 2022, 14, 7467 12 of 24
visible at the right upper corner of the window and left lower corner of the window. Themaximum lateral load-carrying capacity of MW AR1.78–16.5% was obtained as 23.32 kNand the stiffness degradation was calculated as 76.4%, which was the maximum out of allthe walls.
3.2. Performance of Confined Masonry Walls against Lateral Loading
Since openings are essential and we cannot avoid them, one option to increase thecapacity of a masonry wall with openings is the use of confined masonry. This studywas extended to see the increase in capacity after confining the same walls with openingswith confining elements like columns and beams. The column size was kept equal to thethickness of the wall (0.175 m × 0.175 m). The amount of reinforcement provided in thetop beam and confining columns was around 1% of the cross-sectional area of the member,which was according to the building code of Pakistan. For the beam and columns, foursteel bars of 10 mm were used along with stirrups of 6 mm at a distance of 126 mm fromcenter to center while maintaining a clear cover of 20 mm. All the walls were analyzedagain by keeping the boundary conditions and loading criteria the same.
3.2.1. CMW AR1.78–0%
In confined masonry walls, the load is first taken by the confining elements and thenit is transferred to the inner elements. The pushover curves are presented in Figure 14.
Sustainability 2022, 14, x FOR PEER REVIEW 13 of 25
Figure 14. Pushover curves of Confined Masonry Walls with varying percentages of openings.
The CMW AR1.78–0% shows a little higher initial stiffness, the curve keeps on going higher up to a value of 130 kN with some small deviations, but at 130 kN the yielding can be seen in the curve. The curve then changes its slope and small crack initiation takes place at the toe of the wall where compressive forces are greater. The in-plane shear capacity of confined masonry walls is dependent on the strength of the masonry strut [42]. So, the higher the strength of the masonry strut, the higher the combined capacity of confined masonry walls. The curve goes higher to a value of 150 kN and then drops down to 139.6 kN, indicating some cracking at the lower right side of the confined masonry wall. It then starts moving up once again to a maximum value of 193 kN, and after that the failure takes place due to a sudden large drop in the curve. The load path which was observed from the stress diagrams in the case of confined masonry walls was from the left column to the top beam and then it was transferred to the right column as well as the right side of the inner masonry wall. The stress was then spread to the inner masonry wall and the toe of the wall. Maximum compression can be seen at the base of the right column of the ma-sonry wall, which is the toe of the wall. The lateral load capacity of a confined masonry wall with no opening was found to be greater than that of the unconfined masonry wall, which is discussed later in this research.
3.2.2. CMW AR1.78–1.85% The load-displacement curve of CMW AR1.78–1.85% changes four times before
yielding and only a small initial part remained straight. The reason for this can be that when the load reached the right side of the confined masonry wall and the confining col-umn, maximum compressive stresses were observed at the junction of the bottom-right element of the masonry wall and the upper face of the foundation. The compressive stress was more than the mortar’s compressive strength and hence we can say that the spring’s maximum capacity was utilized there. The curve then goes higher by adopting a parabolic trend and then at about 140 kN the curve remains at the same load with small deviations, but displacement keeps on increasing, this is the part where the brick elements are re-transferring load to the intact springs. The curve goes higher by following a straight line up to a maximum value of 165 kN, then it drops down. The stiffness of CMW AR1.78–1.85% was found to be reduced by around 37% as compared to the lateral strength, which was reduced by only around 14%. From the stress contours, it was observed that due to the yielding of steel in the left confining column and crushing of concrete at the right col-umn or toe of the wall, a flexural type of failure took place.
3.2.3. CMW AR1.78–3.66%
Figure 14. Pushover curves of Confined Masonry Walls with varying percentages of openings.
The CMW AR1.78–0% shows a little higher initial stiffness, the curve keeps on goinghigher up to a value of 130 kN with some small deviations, but at 130 kN the yielding canbe seen in the curve. The curve then changes its slope and small crack initiation takes placeat the toe of the wall where compressive forces are greater. The in-plane shear capacityof confined masonry walls is dependent on the strength of the masonry strut [42]. So, thehigher the strength of the masonry strut, the higher the combined capacity of confinedmasonry walls. The curve goes higher to a value of 150 kN and then drops down to139.6 kN, indicating some cracking at the lower right side of the confined masonry wall. Itthen starts moving up once again to a maximum value of 193 kN, and after that the failuretakes place due to a sudden large drop in the curve. The load path which was observedfrom the stress diagrams in the case of confined masonry walls was from the left columnto the top beam and then it was transferred to the right column as well as the right sideof the inner masonry wall. The stress was then spread to the inner masonry wall and thetoe of the wall. Maximum compression can be seen at the base of the right column of themasonry wall, which is the toe of the wall. The lateral load capacity of a confined masonry

Sustainability 2022, 14, 7467 13 of 24
wall with no opening was found to be greater than that of the unconfined masonry wall,which is discussed later in this research.
3.2.2. CMW AR1.78–1.85%
The load-displacement curve of CMW AR1.78–1.85% changes four times before yield-ing and only a small initial part remained straight. The reason for this can be that whenthe load reached the right side of the confined masonry wall and the confining column,maximum compressive stresses were observed at the junction of the bottom-right elementof the masonry wall and the upper face of the foundation. The compressive stress was morethan the mortar’s compressive strength and hence we can say that the spring’s maximumcapacity was utilized there. The curve then goes higher by adopting a parabolic trendand then at about 140 kN the curve remains at the same load with small deviations, butdisplacement keeps on increasing, this is the part where the brick elements are retransfer-ring load to the intact springs. The curve goes higher by following a straight line up toa maximum value of 165 kN, then it drops down. The stiffness of CMW AR1.78–1.85%was found to be reduced by around 37% as compared to the lateral strength, which wasreduced by only around 14%. From the stress contours, it was observed that due to theyielding of steel in the left confining column and crushing of concrete at the right columnor toe of the wall, a flexural type of failure took place.
3.2.3. CMW AR1.78–3.66%
In CMW AR1.78–3.66% the pushover curve gives a linear trend at the start and goesup to a value of 77.5 kN, after which small crack initiation takes place at the interface ofthe lower right corner of the brick element and the left face of the right confining column.Since toothing is provided in all the walls, the second last tooth of the right column alsoexperiences some compressive stresses just after the previous time step. The curve againgoes higher up to a value of 141 kN and then suddenly drops, when checked from themodel, it was found out to be due to the vertical loading, where some compression tookplace due to the toothing. The curve then again starts taking load but now in a parabolictrend, and after that yielding of steel starts. After yielding, the curve reaches a maximumvalue of 162 kN before dropping again. The lateral strength reduction was found to bearound 16%, whereas the stiffness reduction was calculated at 52.35%. In this wall, morecracks were visible in the left column due to the yielding of steel and at the right columnbase due to the toe crushing and also in the toothing of the left column. The failure henceremained flexural.
3.2.4. CMW AR1.78–10.91%
If we talk about CMW AR1.78–10.91%, the pushover curve gives a linear trend upto 72 kN, after which crack initiation takes place, after which it again goes higher to avalue of 96.6 kN, and then the curve drops down to 74.4 kN. This was due to the largerpercentage of openings. More stress contours were observed around the opening in the3D model with maximum stresses observed at the lower right corner of the opening alongwith the right column or toe of the wall. In the wall, stresses were also observed at thecentral tooth of the left confining column, indicating the stress concentrations around theopening, whereas more of them were transferred to the base of the inner masonry elementsand the right confining column. The same thing happened at the junction of the foundationwith the brick elements as was discussed in CMW AR1.78–1.85% with the addition ofstresses at the corners of the opening. After the load was redistributed on the intact springs,the curve again goes higher up to a maximum value of 129.56 kN and then it drops. Thebehavior of the pushover curve going down and up was observed and also verified fromthe stress contours. The strength and stiffness degradation of the CMW AR1.78–10.91%was calculated as 32.93% and 60.26%, respectively. In this wall the failure was not purelyflexural, it was a combination of flexural and shear as more cracks were seen around the

Sustainability 2022, 14, 7467 14 of 24
opening as well as the base of both confining columns, however, the yielding of steel onlytook place in the left confining column.
3.2.5. CMW AR1.78–16.5%
CMW AR1.78–16.5% had the maximum opening size making it the least stiff wall of allthe others, but the first crack load, i.e., 80.37 kN, obtained from the pushover curve of CMWAR1.78–16.5% gave a higher value. This was due to the continuous lintel present at thetop of the opening. Out of all the walls, only this wall experienced stresses at the completeface of the wall with maximum tension observed at the top left corner and bottom rightcorner of the opening. Crack openings were easily seen in these places. More variationsin stresses were observed around the opening as well as in the left and right confiningcolumns as the lateral load continued to be applied. After this, the curve again startedgoing up to a value of 109.4 kN and then more cracking took place and it went down.Due to the much lower stiffness present in the diagonal strut of the wall, the stresses weretransferred to the confining columns. Maximum compressive stresses were seen at the toeof the wall and minimum tensile stresses at the last tooth of the left confining column. Thecurve once again goes higher to a maximum value of 120.87 kN and then drops. This isthe only wall in which yielding took place in both the left and right column steels. Therewere many cracks seen at the left top corner of the window as well as the left tooth of theconfining column and at the right bottom corner of the opening with the tooth of the rightconfining column present at that place. The number of cracks at the foundation beam alsoincreased in this wall. The strength and stiffness degradation were calculated as 37.43%and 68.92%, respectively.
3.3. Impact of Openings on the Unconfined Masonry Walls3.3.1. Peak Load and Lateral Strength
Table 2 summarizes the peak loads of unconfined masonry walls.
Table 2. Openings vs. Stiffness and Strength for unconfined masonry walls.
Masonry Walls Opening Size (m) Peak Load (kN) % Reduction inStrength
Initial Stiffness(kN/m)
% Reduction inStiffness
MW AR1.78–0% 0.00 117.17 0.00 43,448.24 0.00MW AR1.78–1.85% 0.25 × 0.25 84.44 27.93 31,049.80 28.54MW AR1.78–3.66% 0.25 × 0.5 59.89 48.88 21,365.52 50.83
MW AR1.78–10.91% 0.5 × 0.75 33.22 71.65 16,538.58 61.93MW AR1.78–16.5% 0.75 × 0.75 23.32 80.10 10,253.75 76.40
It can be seen that the maximum load-carrying capacity obtained while testing the MWAR1.78–0% was at maximum at 117 kN. Furthermore, the peak load observed in the case ofMW AR1.78–1.85% was observed as 84.44 kN, which accounts for a reduction of 27.93%,which means that even a small opening can compromise the lateral strength of an uncon-fined masonry wall. Similarly, the peak load value obtained for MW AR1.78–3.66% was59.89 kN, which was 48.88% less. The reduction continued to increase as the opening sizeincreased. When the opening increased from 3.66% to 10.91%, the percentage reduction inpeak load of MW AR1.78–10.91% also increased to 71.65%. Similarly, in MW AR1.78–16.5%the maximum peak load obtained was 23.32 kN and this reduction was equal to 80.10%. Bytaking all the above information, a graph between the percentage strength reduction andthe opening percentage was plotted, which is presented in Figure 15 and which indicatesa steepness in the slope until around 50% of the lateral strength reduction, after that thesteepness decreases.

Sustainability 2022, 14, 7467 15 of 24
Sustainability 2022, 14, x FOR PEER REVIEW 15 of 25
increased in this wall. The strength and stiffness degradation were calculated as 37.43% and 68.92%, respectively.
3.3. Impact of Openings on the Unconfined Masonry Walls 3.3.1. Peak Load and Lateral Strength
Table 2 summarizes the peak loads of unconfined masonry walls.
Table 2. Openings vs. Stiffness and Strength for unconfined masonry walls.
Masonry Walls Opening Size (m) Peak Load (kN)
% Reduction in Strength
Initial Stiffness (kN/m)
% Reduction in
Stiffness MW AR1.78–0% 0.00 117.17 0.00 43,448.24 0.00
MW AR1.78–1.85% 0.25 × 0.25 84.44 27.93 31,049.80 28.54 MW AR1.78–3.66% 0.25 × 0.5 59.89 48.88 21,365.52 50.83
MW AR1.78–10.91% 0.5 × 0.75 33.22 71.65 16,538.58 61.93 MW AR1.78–16.5% 0.75 × 0.75 23.32 80.10 10,253.75 76.40
It can be seen that the maximum load-carrying capacity obtained while testing the MW AR1.78–0% was at maximum at 117 kN. Furthermore, the peak load observed in the case of MW AR1.78–1.85% was observed as 84.44 kN, which accounts for a reduction of 27.93%, which means that even a small opening can compromise the lateral strength of an unconfined masonry wall. Similarly, the peak load value obtained for MW AR1.78–3.66% was 59.89 kN, which was 48.88% less. The reduction continued to increase as the opening size increased. When the opening increased from 3.66% to 10.91%, the percentage reduc-tion in peak load of MW AR1.78–10.91% also increased to 71.65%. Similarly, in MW AR1.78–16.5% the maximum peak load obtained was 23.32 kN and this reduction was equal to 80.10%. By taking all the above information, a graph between the percentage strength reduction and the opening percentage was plotted, which is presented in Figure 15 and which indicates a steepness in the slope until around 50% of the lateral strength reduction, after that the steepness decreases.
Figure 15. Lateral Strength Reduction in unconfined masonry walls.
3.3.2. Stiffness Reduction The initial part of the load-displacement curves was used to calculate the stiffness of
all the unconfined walls. The stiffness reduction of all the unconfined masonry walls was calculated with respect to MW AR1.78–0% and is summarized in Table 2. MW AR1.78–0% gave a maximum stiffness of 43,448.24 kN/m, while the stiffness kept decreasing with the increase in opening percentage. The initial stiffness value obtained for MW AR1.78–1.85% was 31,049.80 kN/m, which was 28.54% less. Similarly, the initial stiffness values of
Figure 15. Lateral Strength Reduction in unconfined masonry walls.
3.3.2. Stiffness Reduction
The initial part of the load-displacement curves was used to calculate the stiffness ofall the unconfined walls. The stiffness reduction of all the unconfined masonry wallswas calculated with respect to MW AR1.78–0% and is summarized in Table 2. MWAR1.78–0% gave a maximum stiffness of 43,448.24 kN/m, while the stiffness kept decreas-ing with the increase in opening percentage. The initial stiffness value obtained for MWAR1.78–1.85% was 31,049.80 kN/m, which was 28.54% less. Similarly, the initial stiffnessvalues of MW AR1.78–3.66% and MW AR1.78–10.91% were obtained as 21,365.52 kN/mand 16,538.58 kN/m, respectively, and the reductions were calculated as 50.83% and 61.93%respectively. The maximum stiffness reduction took place in MW AR1.78–16.5% due to themaximum percentage of opening. The initial stiffness and strength reductions obtainedwere 10,253.75 kN/m and 76.40%, respectively. The strength and stiffness reductions werefairly close to each other, which can be seen in Figure 16. It is evident that with the increasein the opening percentage, the stiffness of the unconfined masonry walls decreases. How-ever, this decrease is rapid until 50% of the wall’s lateral stiffness, and after that the slopebecomes gentle.
Sustainability 2022, 14, x FOR PEER REVIEW 16 of 25
MW AR1.78–3.66% and MW AR1.78–10.91% were obtained as 21,365.52 kN/m and 16,538.58 kN/m, respectively, and the reductions were calculated as 50.83% and 61.93% respectively. The maximum stiffness reduction took place in MW AR1.78–16.5% due to the maximum percentage of opening. The initial stiffness and strength reductions ob-tained were 10,253.75 kN/m and 76.40%, respectively. The strength and stiffness reduc-tions were fairly close to each other, which can be seen in Figure 16. It is evident that with the increase in the opening percentage, the stiffness of the unconfined masonry walls de-creases. However, this decrease is rapid until 50% of the wall’s lateral stiffness, and after that the slope becomes gentle.
Figure 16. Strength and Stiffness reduction in Unconfined Masonry Walls.
3.3.3. Failure Type The opening percentage may change the type of failure of an unconfined slender ma-
sonry wall. Stress distribution of all the unconfined masonry walls with minimum and maximum stresses are presented in this paper from Figures 9–13. The left side face of the unconfined masonry wall is seen in tension and the bottom right side face is seen in com-pression. Figure 9 shows the crushing pattern of the wall at the bottom right side and a crack opening at the interface of brick courses of the wall at the bottom left is also visible, which indicates its flexural or bending failure. This is due to the effect of the aspect ratio (1.78) of the wall as slender walls inherently exhibit a flexural failure mode. Figure 10 indicates a similar flexural failure with a small opening at the center of the wall. Diagonal compression can also be seen in Figures 9–13, while in Figure 12, the failure changes to a combination of shear and flexure from being flexural. Excessive displacement can cause crushing at the right toe of the wall. The minimum and maximum stresses change their position as the opening size increases from 3.66% to 10.91% of the area of the wall as indi-cated in Figures 9–13. In Figure 13, the failure changes to sliding shear as it can be seen that the opening size is more than the thickness of bricks available on both sides of the opening, which becomes the weak point and failure takes place from there.
3.4. Impact of Openings on the Confined Masonry Walls 3.4.1. Peak Load and Lateral Strength
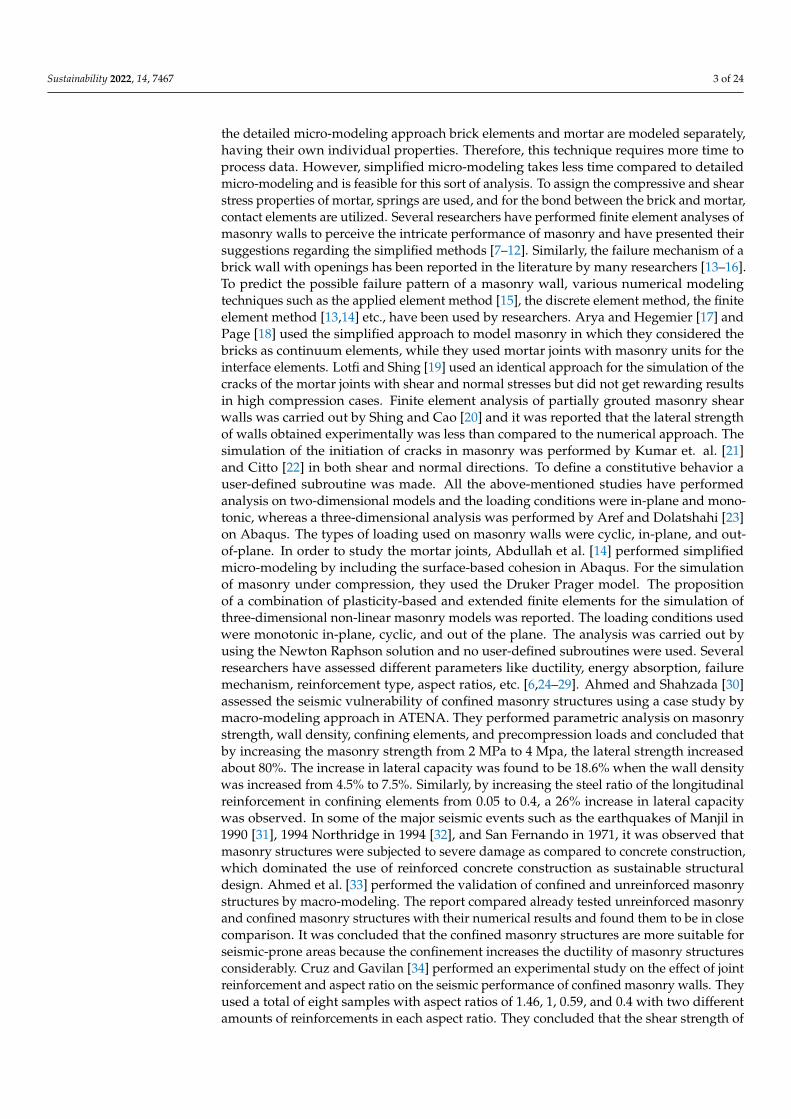
Table 3 summarizes the peak loads, strength, and stiffness of confined masonry walls.
Table 3. Openings vs. Stiffness and Strength for Confined Masonry Walls.
Confined Masonry Walls
Opening Size (m)
Peak Load (kN)
% Reduction in Strength
Initial Stiffness (kN/m)
% Reduction in Stiffness
CMW AR1.78–0% 0.00 193.17 0.00 52,808.06 0.00 CMW AR1.78–1.85% 0.25 × 0.25 165.57 14.29 33,437.00 36.68
Figure 16. Strength and Stiffness reduction in Unconfined Masonry Walls.
3.3.3. Failure Type
The opening percentage may change the type of failure of an unconfined slendermasonry wall. Stress distribution of all the unconfined masonry walls with minimumand maximum stresses are presented in this paper from Figures 9–13. The left side faceof the unconfined masonry wall is seen in tension and the bottom right side face is seen
Sustainability 2022, 14, 7467 16 of 24
in compression. Figure 9 shows the crushing pattern of the wall at the bottom right sideand a crack opening at the interface of brick courses of the wall at the bottom left is alsovisible, which indicates its flexural or bending failure. This is due to the effect of the aspectratio (1.78) of the wall as slender walls inherently exhibit a flexural failure mode. Figure 10indicates a similar flexural failure with a small opening at the center of the wall. Diagonalcompression can also be seen in Figures 9–13, while in Figure 12, the failure changes to acombination of shear and flexure from being flexural. Excessive displacement can causecrushing at the right toe of the wall. The minimum and maximum stresses change theirposition as the opening size increases from 3.66% to 10.91% of the area of the wall asindicated in Figures 9–13. In Figure 13, the failure changes to sliding shear as it can be seenthat the opening size is more than the thickness of bricks available on both sides of theopening, which becomes the weak point and failure takes place from there.
3.4. Impact of Openings on the Confined Masonry Walls3.4.1. Peak Load and Lateral Strength
Table 3 summarizes the peak loads, strength, and stiffness of confined masonry walls.
Table 3. Openings vs. Stiffness and Strength for Confined Masonry Walls.
Confined MasonryWalls Opening Size (m) Peak Load (kN) % Reduction in
StrengthInitial
Stiffness (kN/m)% Reduction in
Stiffness
CMW AR1.78–0% 0.00 193.17 0.00 52,808.06 0.00CMW AR1.78–1.85% 0.25 × 0.25 165.57 14.29 33,437.00 36.68CMW AR1.78–3.66% 0.25 × 0.5 162.35 15.95 25,165.07 52.35
CMW AR1.78–10.91% 0.5 × 0.75 129.56 32.93 20,987.00 60.26CMW AR1.78–16.5% 0.75 × 0.75 120.87 37.43 16,412.80 68.92
It can be seen that the maximum load-carrying capacity of CMW AR1.78–0% wasobtained as 193.17 kN, whereas the peak load value of CMW AR1.78–1.85% was obtained as165.5 kN. The reduction in the peak load value of CMW AR1.78–1.85% was observed as only14.29%, which means that the impact of a small opening in the case of confined masonrywalls is slightly lower. Similarly, the peak load value obtained for CMW AR1.78–3.66% was162.35 kN and the reduction obtained was 15.95%, which means that the increase in theopening size from 1.85% to 3.66% did not affect the lateral strength of confined masonrywall that much, but when the opening size was increased from 3.66% to 10.91%, the lateralstrength reduction was found to be 32.93% with the peak load value of 129.56 kN. This wasthe maximum difference observed between the opening percentages and lateral strength.When the percentage of the opening was further increased to 16.5%, the reduction in thepeak load was found to be 37.43% with a peak load value of 120.87 kN. We can see that thetotal reduction which took place in the case of confined masonry walls was found to beonly 37.43% even with the maximum percentage of opening (16.5%).
3.4.2. Stiffness Reduction
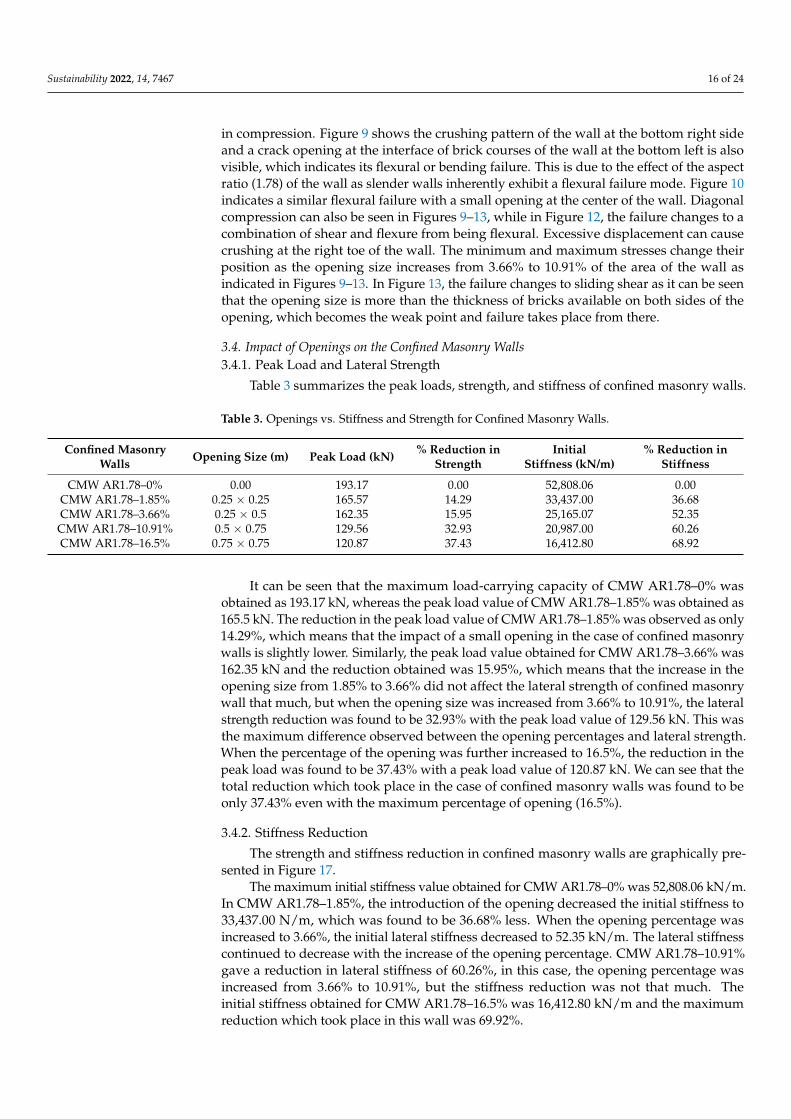
The strength and stiffness reduction in confined masonry walls are graphically pre-sented in Figure 17.
The maximum initial stiffness value obtained for CMW AR1.78–0% was 52,808.06 kN/m.In CMW AR1.78–1.85%, the introduction of the opening decreased the initial stiffness to33,437.00 N/m, which was found to be 36.68% less. When the opening percentage wasincreased to 3.66%, the initial lateral stiffness decreased to 52.35 kN/m. The lateral stiffnesscontinued to decrease with the increase of the opening percentage. CMW AR1.78–10.91%gave a reduction in lateral stiffness of 60.26%, in this case, the opening percentage wasincreased from 3.66% to 10.91%, but the stiffness reduction was not that much. Theinitial stiffness obtained for CMW AR1.78–16.5% was 16,412.80 kN/m and the maximumreduction which took place in this wall was 69.92%.
Sustainability 2022, 14, 7467 17 of 24
Sustainability 2022, 14, x FOR PEER REVIEW 17 of 25
CMW AR1.78–3.66% 0.25 × 0.5 162.35 15.95 25,165.07 52.35 CMW AR1.78–10.91% 0.5 × 0.75 129.56 32.93 20,987.00 60.26 CMW AR1.78–16.5% 0.75 × 0.75 120.87 37.43 16,412.80 68.92
It can be seen that the maximum load-carrying capacity of CMW AR1.78–0% was obtained as 193.17 kN, whereas the peak load value of CMW AR1.78–1.85% was obtained as 165.5 kN. The reduction in the peak load value of CMW AR1.78–1.85% was observed as only 14.29%, which means that the impact of a small opening in the case of confined masonry walls is slightly lower. Similarly, the peak load value obtained for CMW AR1.78–3.66% was 162.35 kN and the reduction obtained was 15.95%, which means that the in-crease in the opening size from 1.85% to 3.66% did not affect the lateral strength of con-fined masonry wall that much, but when the opening size was increased from 3.66% to 10.91%, the lateral strength reduction was found to be 32.93% with the peak load value of 129.56 kN. This was the maximum difference observed between the opening percentages and lateral strength. When the percentage of the opening was further increased to 16.5%, the reduction in the peak load was found to be 37.43% with a peak load value of 120.87 kN. We can see that the total reduction which took place in the case of confined masonry walls was found to be only 37.43% even with the maximum percentage of opening (16.5%).
3.4.2. Stiffness Reduction The strength and stiffness reduction in confined masonry walls are graphically pre-
sented in Figure 17.
Figure 17. Strength and Stiffness reduction in Confined Masonry Walls.
The maximum initial stiffness value obtained for CMW AR1.78–0% was 52808.06 kN/m. In CMW AR1.78–1.85%, the introduction of the opening decreased the initial stiff-ness to 33437.00 N/m, which was found to be 36.68% less. When the opening percentage was increased to 3.66%, the initial lateral stiffness decreased to 52.35 kN/m. The lateral stiffness continued to decrease with the increase of the opening percentage. CMW AR1.78–10.91% gave a reduction in lateral stiffness of 60.26%, in this case, the opening percentage was increased from 3.66% to 10.91%, but the stiffness reduction was not that much. The initial stiffness obtained for CMW AR1.78–16.5% was 16,412.80 kN/m and the maximum reduction which took place in this wall was 69.92%.
3.4.3. Failure Type In the case of confined masonry walls, the load was first taken by the confining frame
and then it was transferred to the inner brick elements, due to which the steel present in the left column of all the walls yielded first, and only in the confined masonry wall with a 16.5% opening did the steel in the right confining column also yield. The failure type in
Figure 17. Strength and Stiffness reduction in Confined Masonry Walls.
3.4.3. Failure Type
In the case of confined masonry walls, the load was first taken by the confining frameand then it was transferred to the inner brick elements, due to which the steel present inthe left column of all the walls yielded first, and only in the confined masonry wall witha 16.5% opening did the steel in the right confining column also yield. The failure typein the first three confined masonry walls remained flexural, but in CMW AR1.78–10.91%and CMW AR1.78–16.5% the failure changed to a combination of shear and flexure. Thesliding shear was prevented due to the confinement present on both sides. The minimumand maximum stresses also kept changing with the loading. The position of steel yieldingin the confining columns and the stresses in walls can be seen from Figures 18–22.
Sustainability 2022, 14, x FOR PEER REVIEW 18 of 25
the first three confined masonry walls remained flexural, but in CMW AR1.78–10.91% and CMW AR1.78–16.5% the failure changed to a combination of shear and flexure. The slid-ing shear was prevented due to the confinement present on both sides. The minimum and maximum stresses also kept changing with the loading. The position of steel yielding in the confining columns and the stresses in walls can be seen from Figures 18–22.
Figure 18. Third Principle Stresses CMW AR1.78–0%.
Figure 19. Third Principle Stresses CMW AR1.78–1.85%.
Figure 18. Third Principle Stresses CMW AR1.78–0%.
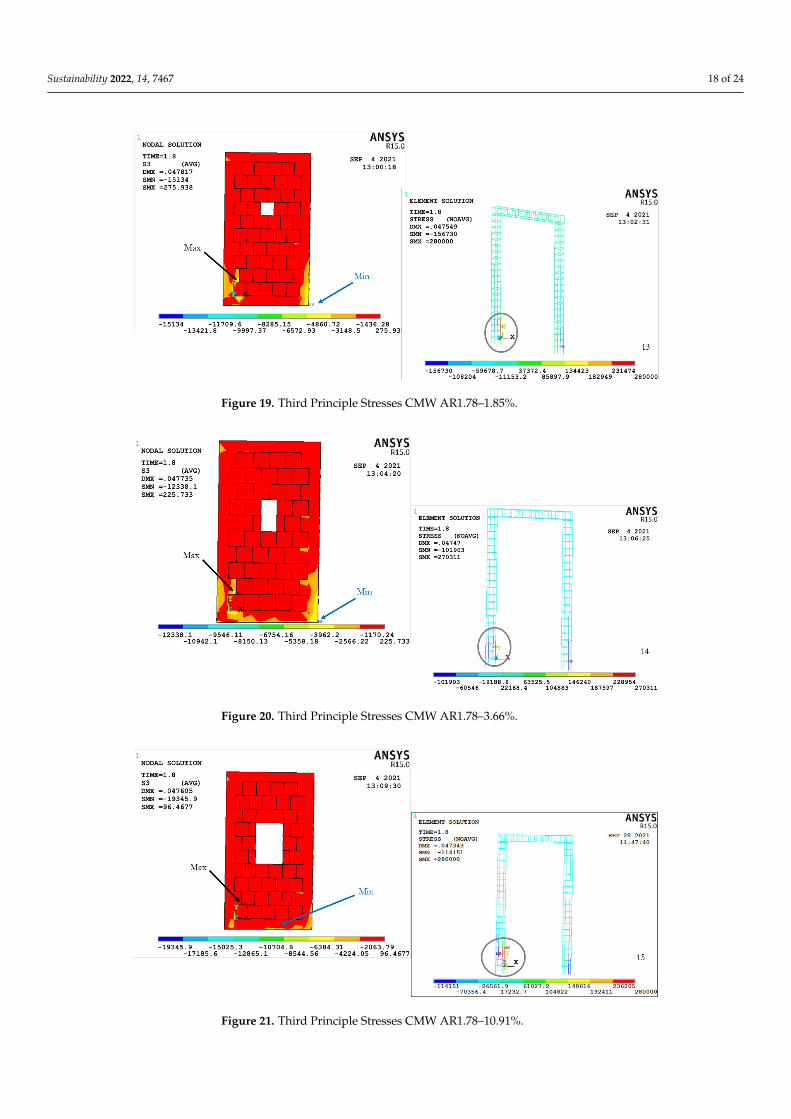
Sustainability 2022, 14, 7467 18 of 24
Sustainability 2022, 14, x FOR PEER REVIEW 18 of 25
the first three confined masonry walls remained flexural, but in CMW AR1.78–10.91% and CMW AR1.78–16.5% the failure changed to a combination of shear and flexure. The slid-ing shear was prevented due to the confinement present on both sides. The minimum and maximum stresses also kept changing with the loading. The position of steel yielding in the confining columns and the stresses in walls can be seen from Figures 18–22.
Figure 18. Third Principle Stresses CMW AR1.78–0%.
Figure 19. Third Principle Stresses CMW AR1.78–1.85%. Figure 19. Third Principle Stresses CMW AR1.78–1.85%.Sustainability 2022, 14, x FOR PEER REVIEW 19 of 25
Figure 20. Third Principle Stresses CMW AR1.78–3.66%.
Figure 21. Third Principle Stresses CMW AR1.78–10.91%.
Figure 20. Third Principle Stresses CMW AR1.78–3.66%.
Sustainability 2022, 14, x FOR PEER REVIEW 19 of 25
Figure 20. Third Principle Stresses CMW AR1.78–3.66%.
Figure 21. Third Principle Stresses CMW AR1.78–10.91%.
Figure 21. Third Principle Stresses CMW AR1.78–10.91%.
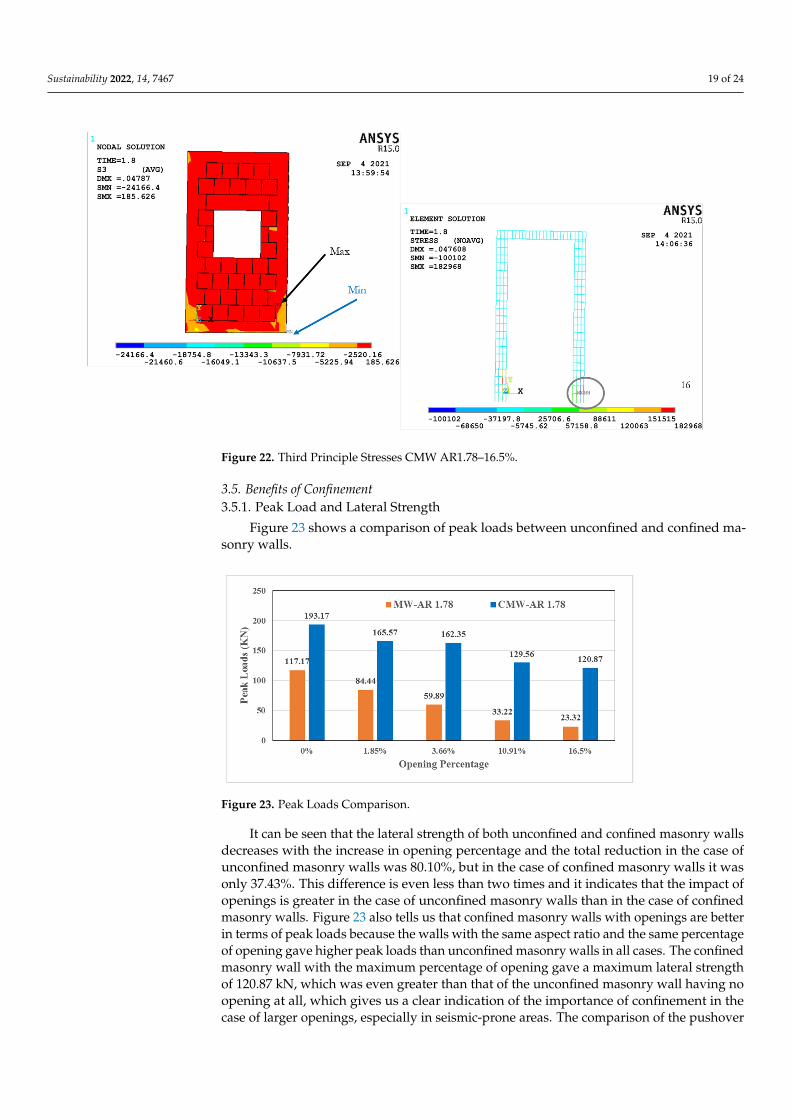
Sustainability 2022, 14, 7467 19 of 24Sustainability 2022, 14, x FOR PEER REVIEW 20 of 25
Figure 22. Third Principle Stresses CMW AR1.78–16.5%.
3.5. Benefits of Confinement 3.5.1. Peak Load and Lateral Strength
Figure 23 shows a comparison of peak loads between unconfined and confined ma-sonry walls.
Figure 23. Peak Loads Comparison.
It can be seen that the lateral strength of both unconfined and confined masonry walls decreases with the increase in opening percentage and the total reduction in the case of unconfined masonry walls was 80.10%, but in the case of confined masonry walls it was only 37.43%. This difference is even less than two times and it indicates that the impact of openings is greater in the case of unconfined masonry walls than in the case of confined masonry walls. Figure 23 also tells us that confined masonry walls with openings are bet-ter in terms of peak loads because the walls with the same aspect ratio and the same per-centage of opening gave higher peak loads than unconfined masonry walls in all cases. The confined masonry wall with the maximum percentage of opening gave a maximum lateral strength of 120.87 kN, which was even greater than that of the unconfined masonry wall having no opening at all, which gives us a clear indication of the importance of con-finement in the case of larger openings, especially in seismic-prone areas. The comparison of the pushover curves can be seen in Figures 24–28 and the strength reduction compari-son is presented in Figure 29.
Figure 22. Third Principle Stresses CMW AR1.78–16.5%.
3.5. Benefits of Confinement3.5.1. Peak Load and Lateral Strength
Figure 23 shows a comparison of peak loads between unconfined and confined ma-sonry walls.
Sustainability 2022, 14, x FOR PEER REVIEW 20 of 25
Figure 22. Third Principle Stresses CMW AR1.78–16.5%.
3.5. Benefits of Confinement 3.5.1. Peak Load and Lateral Strength
Figure 23 shows a comparison of peak loads between unconfined and confined ma-sonry walls.
Figure 23. Peak Loads Comparison.
It can be seen that the lateral strength of both unconfined and confined masonry walls decreases with the increase in opening percentage and the total reduction in the case of unconfined masonry walls was 80.10%, but in the case of confined masonry walls it was only 37.43%. This difference is even less than two times and it indicates that the impact of openings is greater in the case of unconfined masonry walls than in the case of confined masonry walls. Figure 23 also tells us that confined masonry walls with openings are bet-ter in terms of peak loads because the walls with the same aspect ratio and the same per-centage of opening gave higher peak loads than unconfined masonry walls in all cases. The confined masonry wall with the maximum percentage of opening gave a maximum lateral strength of 120.87 kN, which was even greater than that of the unconfined masonry wall having no opening at all, which gives us a clear indication of the importance of con-finement in the case of larger openings, especially in seismic-prone areas. The comparison of the pushover curves can be seen in Figures 24–28 and the strength reduction compari-son is presented in Figure 29.
Figure 23. Peak Loads Comparison.
It can be seen that the lateral strength of both unconfined and confined masonry wallsdecreases with the increase in opening percentage and the total reduction in the case ofunconfined masonry walls was 80.10%, but in the case of confined masonry walls it wasonly 37.43%. This difference is even less than two times and it indicates that the impact ofopenings is greater in the case of unconfined masonry walls than in the case of confinedmasonry walls. Figure 23 also tells us that confined masonry walls with openings are betterin terms of peak loads because the walls with the same aspect ratio and the same percentageof opening gave higher peak loads than unconfined masonry walls in all cases. The confinedmasonry wall with the maximum percentage of opening gave a maximum lateral strengthof 120.87 kN, which was even greater than that of the unconfined masonry wall having noopening at all, which gives us a clear indication of the importance of confinement in thecase of larger openings, especially in seismic-prone areas. The comparison of the pushover

Sustainability 2022, 14, 7467 20 of 24
curves can be seen in Figures 24–28 and the strength reduction comparison is presented inFigure 29.
Sustainability 2022, 14, x FOR PEER REVIEW 21 of 25
Figure 24. Pushover curves of walls with 0% opening.
Figure 25. Pushover curves of walls with 1.85% opening.
Figure 26. Pushover curves of walls with 3.66% opening.
Figure 24. Pushover curves of walls with 0% opening.
Sustainability 2022, 14, x FOR PEER REVIEW 21 of 25
Figure 24. Pushover curves of walls with 0% opening.
Figure 25. Pushover curves of walls with 1.85% opening.
Figure 26. Pushover curves of walls with 3.66% opening.
Figure 25. Pushover curves of walls with 1.85% opening.
Sustainability 2022, 14, x FOR PEER REVIEW 21 of 25
Figure 24. Pushover curves of walls with 0% opening.
Figure 25. Pushover curves of walls with 1.85% opening.
Figure 26. Pushover curves of walls with 3.66% opening. Figure 26. Pushover curves of walls with 3.66% opening.

Sustainability 2022, 14, 7467 21 of 24Sustainability 2022, 14, x FOR PEER REVIEW 22 of 25
Figure 27. Pushover curves of walls with 10.91% opening.
Figure 28. Pushover curves of walls with 16.5% opening.
Figure 29. Comparison of Strength Reduction.
3.5.2. Stiffness The difference in the initial stiffness between the unconfined and confined masonry
walls can be seen in Figures 24–28. It is clear that the confined masonry walls give more initial stiffness as compared to the unconfined masonry walls, but the stiffness reduction was comparable with confined masonry walls with a little less on the opening sides. A comparison of the reduction in stiffness can be seen in Figure 30.
Figure 27. Pushover curves of walls with 10.91% opening.
Sustainability 2022, 14, x FOR PEER REVIEW 22 of 25
Figure 27. Pushover curves of walls with 10.91% opening.
Figure 28. Pushover curves of walls with 16.5% opening.
Figure 29. Comparison of Strength Reduction.
3.5.2. Stiffness The difference in the initial stiffness between the unconfined and confined masonry
walls can be seen in Figures 24–28. It is clear that the confined masonry walls give more initial stiffness as compared to the unconfined masonry walls, but the stiffness reduction was comparable with confined masonry walls with a little less on the opening sides. A comparison of the reduction in stiffness can be seen in Figure 30.
Figure 28. Pushover curves of walls with 16.5% opening.
Sustainability 2022, 14, x FOR PEER REVIEW 22 of 25
Figure 27. Pushover curves of walls with 10.91% opening.
Figure 28. Pushover curves of walls with 16.5% opening.
Figure 29. Comparison of Strength Reduction.
3.5.2. Stiffness The difference in the initial stiffness between the unconfined and confined masonry
walls can be seen in Figures 24–28. It is clear that the confined masonry walls give more initial stiffness as compared to the unconfined masonry walls, but the stiffness reduction was comparable with confined masonry walls with a little less on the opening sides. A comparison of the reduction in stiffness can be seen in Figure 30.
Figure 29. Comparison of Strength Reduction.
3.5.2. Stiffness
The difference in the initial stiffness between the unconfined and confined masonrywalls can be seen in Figures 24–28. It is clear that the confined masonry walls give moreinitial stiffness as compared to the unconfined masonry walls, but the stiffness reductionwas comparable with confined masonry walls with a little less on the opening sides.A comparison of the reduction in stiffness can be seen in Figure 30.

Sustainability 2022, 14, 7467 22 of 24Sustainability 2022, 14, x FOR PEER REVIEW 23 of 25
Figure 30. Comparison of Stiffness Reduction.
3.5.3. Failure Type The failure type remained flexural in both cases in the first three walls, but when the
percentage of the opening increased to 10.91%, the failure shifted to more of a mixture of shear and flexure. Confinement prevented the sliding shear failure in the wall with a 16.5% percentage of opening.
4. Conclusions A comparative study on the numerical investigation of the impact of openings on the
in-plane stiffness and strength of confined and unconfined masonry walls was carried out. The results revealed that the confined masonry walls provide better resistance against seismic activities as compared to unconfined masonry walls with openings. The stiffness of the unconfined masonry can reduce drastically due to openings in walls, while this reduction is very little in the case of confined masonry. It was observed that the lateral load-carrying capacity of unconfined masonry walls may be reduced by up to 28.5% when incorporating only a 1.85% opening. This reduction increases to 76.5% with a 16.5% open-ing. However, in the case of confined masonry wall panels, the reduction of lateral load-carrying capacity was limited to 14% with a 1.85% opening and 37.5% with a 16.5% open-ing. This corresponds to around a 50% improvement in the case of confined masonry walls. Furthermore, it was observed that on providing confinement in masonry wall pan-els with large openings, the failure mode shifts from flexural cracking to a hybrid failure mode including both flexural and shear cracking. This may help in the absorption of more seismic energy. Based on these outcomes, it can be concluded that the use of a confined masonry approach may be strongly recommended (especially in seismically active zones).
Author Contributions: Conceptualization, U.A.M., A.A. and A.U.Q.; Data curation, A.A., U.A.M., S.A. and W.A.; Formal analysis, U.A.M., A.S. and M.M.S.; Funding acquisition, W.A., A.S. and M.M.S.; Investigation, A.A., U.A.M., S.A., W.A., A.S. and M.M.S.; Methodology, A.A., A.U.Q. and U.A.M.; Resources, S.A., W.A., A.S. and M.M.S.; Software, U.A.M.; Supervision, A.A. and A.U.Q.; Validation, S.A. and W.A.; Visualization, U.A.M. and A.U.Q.; Writing—original draft, U.A.M. and A.A.; review & editing, A.A., S.A. and W.A. All authors have read and agreed to the published version of the manuscript.
Funding: This research received no external funding.
Institutional Review Board Statement: Not Applicable.
Informed Consent Statement: Not Applicable.
Data Availability Statement: Not Applicable.
Conflicts of Interest: The authors declare no conflict of interest.
References
Figure 30. Comparison of Stiffness Reduction.
3.5.3. Failure Type
The failure type remained flexural in both cases in the first three walls, but when thepercentage of the opening increased to 10.91%, the failure shifted to more of a mixture ofshear and flexure. Confinement prevented the sliding shear failure in the wall with a 16.5%percentage of opening.
4. Conclusions
A comparative study on the numerical investigation of the impact of openings onthe in-plane stiffness and strength of confined and unconfined masonry walls was carriedout. The results revealed that the confined masonry walls provide better resistance againstseismic activities as compared to unconfined masonry walls with openings. The stiffnessof the unconfined masonry can reduce drastically due to openings in walls, while thisreduction is very little in the case of confined masonry. It was observed that the lateralload-carrying capacity of unconfined masonry walls may be reduced by up to 28.5%when incorporating only a 1.85% opening. This reduction increases to 76.5% with a 16.5%opening. However, in the case of confined masonry wall panels, the reduction of lateralload-carrying capacity was limited to 14% with a 1.85% opening and 37.5% with a 16.5%opening. This corresponds to around a 50% improvement in the case of confined masonrywalls. Furthermore, it was observed that on providing confinement in masonry wall panelswith large openings, the failure mode shifts from flexural cracking to a hybrid failure modeincluding both flexural and shear cracking. This may help in the absorption of more seismicenergy. Based on these outcomes, it can be concluded that the use of a confined masonryapproach may be strongly recommended (especially in seismically active zones).
Author Contributions: Conceptualization, U.A.M., A.A. and A.U.Q.; Data curation, A.A., U.A.M.,S.A. and W.A.; Formal analysis, U.A.M., A.S. and M.M.S.; Funding acquisition, W.A., A.S. andM.M.S.; Investigation, A.A., U.A.M., S.A., W.A., A.S. and M.M.S.; Methodology, A.A., A.U.Q. andU.A.M.; Resources, S.A., W.A., A.S. and M.M.S.; Software, U.A.M.; Supervision, A.A. and A.U.Q.;Validation, S.A. and W.A.; Visualization, U.A.M. and A.U.Q.; Writing—original draft, U.A.M. andA.A.; review & editing, A.A., S.A. and W.A. All authors have read and agreed to the publishedversion of the manuscript.
Funding: This research received no external funding.
Institutional Review Board Statement: Not applicable.
Informed Consent Statement: Not applicable.
Data Availability Statement: Not applicable.
Conflicts of Interest: The authors declare no conflict of interest.

Sustainability 2022, 14, 7467 23 of 24
References1. Giordano, A.; Guadagnuolo, M.; Faella, G. Pushover analysis of plan irregular masonry buildings. In Proceedings of the 14th
World Conference on Earthquake Engineering, Beijing, China, 12–17 October 2008.2. Gokdemir, H.; Özbasaran, H.; Dogan, M.; Ünlüoglu, E.; Albayrak, U. Effects of torsional irregularity to structures during
earthquakes. Eng. Fail. Anal. 2013, 35, 713–717. [CrossRef]3. Wikipedia Report. Kashmir Earthquake. Available online: https://en.wikipedia.org/wiki/2005_Kashmir_earthquake (accessed
on 13 March 2022).4. EN 1998-1:2004; Eurocode 8: Design of Structures for Earthquake Resistance—Part 1: General Rules, Seismic Actions, and Rules
for Buildings. European Committee for Standardization: Brussels, Belgium, 2004.5. EN 1998-3:2005; Eurocode 8: Design of Structures for Earthquake Resistance—Part 3: Assessment and Retrofitting of Buildings.
European Committee for Standardization: Brussels, Belgium, 2005.6. Brzev, S. Earthquake-Resistant Confined Masonry Construction; National Information Center of Earthquake Engineering, Indian
Institute of Technology: Kanpur, India, 2007; ISBN 8190419099.7. Caliò, I.; Marletta, M.; Pantò, B. A new discrete element model for the evaluation of the seismic behavior of URM buildings. Eng.
Struct. 2012, 40, 327–338. [CrossRef]8. Raka, E.; Spacone, E.; Sepe, V.; Camata, G. Advanced frame element for seismic analysis of masonry structures: Model formulation
and validation. Earthq. Eng. Struct. Dyn. 2015, 44, 2489–2506. [CrossRef]9. Tomaževic, M. The Computer Program POR; Report ZRMK; ZRMK: Ljubljana, Slovenia, 1978. (In Slovenian)10. Lagomarsino, S.; Penna, A.; Galasco, A.; Cattari, S. TREMURI program: An equivalent frame model for the nonlinear seismic
analysis of masonry buildings. Eng. Struct. 2013, 56, 1787–1799. [CrossRef]11. Magenes, G.; Della Fontana, A. Simplified non-linear seismic analysis of masonry buildings. In Proceedings of the 5th International
Masonry Conference, London, UK, 13–15 October 1998; pp. 190–195.12. Vanin, A.; Foraboschi, P. Modelling of masonry panels by truss analogy—Part 1. Mason. Int. 2009, 22, 1–10.13. Barraza, J.A.C. Numerical Model for Nonlinear Analysis of Masonry Walls. Ph.D. Thesis, Aachen University, La Serena,
Chile, 2012.14. Abdullah, K.F.; Cuningham, L.S.; Gillie, M. Simulating masonry wall behaviour using a simplified micro-model approach. Eng.
Struct. 2017, 151, 349–365. [CrossRef]15. Panday, B.H.; Meguro, K. Simulation of brick masonry wall behavior under in-plane lateral loading using applied element
method. In Proceedings of the 13th World Conference on Earthquake Engineering, Vancouver, BC, Canada, 1–6 August 2004.16. Erdal, M.; Isik, N.S.; Can, O.; Kopraman, Y.; Buyukkaragozet, A. Lateral Strength of Masonry Walls with Openings: Analytical
Approach. In Proceedings of the Conference on Application of Efficient & Renewable Energy Technologies in Low Cost Buildingsand Construction, Ankara, Turkey, 16–18 September 2013.
17. Arya, S.K.; Hegemier, G.A. Non-linear response predictions of concrete masonry assemblies. In Proceedings of the ConferenceNorth American Masonry, Boulder, CO, USA, 14–16 August 1978; pp. 19.1–19.24.
18. Page, A.W. A Finite Element Model for Masonry. J. Struct. Div. 1978, 104, 1267–1285. [CrossRef]19. Lotfi, H.R.; Shing, P.B. Interface model applied to fracture of masonry structures. J. Struct. Eng. 1994, 120, 63–80. [CrossRef]20. Shing, P.; Cao, L. Analysis of Partially Grouted Masonry Shear Walls; US Department of Commerce: Washington, DC, USA, 1997;
pp. 97–710.21. Kumar, N.; Amirtham, R.; Pandey, M. Plasticity based approach for failure modelling of unreinforced masonry. Eng. Struct. 2014,
80, 40–52. [CrossRef]22. Citto, C. Two-Dimensional Interface Model Applied to Masonry Structures. Master’s Thesis, University of Bologna, Bologna,
Italy, 2008.23. Aref, A.J.; Dolatshahi, K.M. A three-dimensional cyclic meso-scale numerical procedure for simulation of unreinforced masonry
structures. Comput. Struct. 2013, 120, 9–23. [CrossRef]24. Alcocer, S.M.; Zepeda, J.A. Behavior of multi-perforated clay brick walls under earthquake type loading. In Proceedings of the
8th North American Masonry Conference, Austin, TX, USA, 16–19 June 1999; pp. 235–246.25. Alcocer, S.M.; Arias, J.G.; Vazquez, A. Response assessment of Mexican confined masonry structures through shaking table tests.
In Proceedings of the 13th World Conference on Earthquake Engineering, Vancouver, BC, Canada, 1–6 August 2004; p. 2130.26. Aguilar, G.; Meli, R.; Diaz, R.; Vazquez-del-Mercado, R.S. Influence of the horizontal reinforcement on the behavior of confined
masonry walls. In Proceedings of the 11th World Conference on Earthquake Engineering, Acapulco, Mexico, 23–28 June 1996.27. Gostic, S.; Zarnic, R. Cyclic lateral response of masonry infilled RC frames and confined masonry walls. In Proceedings of the 8th
North American Masonry Conference, Austin, TX, USA, 16–19 June 1999; pp. 477–488.28. Gouveia, J.; Lourenço, P. Masonry shear walls subjected to cyclic loading: Influence of confinement and horizontal reinforcement.
In Proceedings of the 10th North American Masonry Conference (10NAMC), Saint Louis, MO, USA, 3–5 June 2007.29. Irimies, M.T. Confined Masonry Walls: The influence of the tie-column vertical reinforcement ratio on the seismic behaviour. In
Proceedings of the 12th European Conference on Earthquake Engineering, London, UK, 9–13 September 2002.30. Ahmed, A.; Shahzada, K. Seismic vulnerability assessment of confined masonry structures by macromodeling approach. Structures
2020, 27, 639–649. [CrossRef]31. Moghaddam, H.A. Seismic Design of Masonry Building; Sharif University Press: Tehran, Iran, 2006. (In Persian)
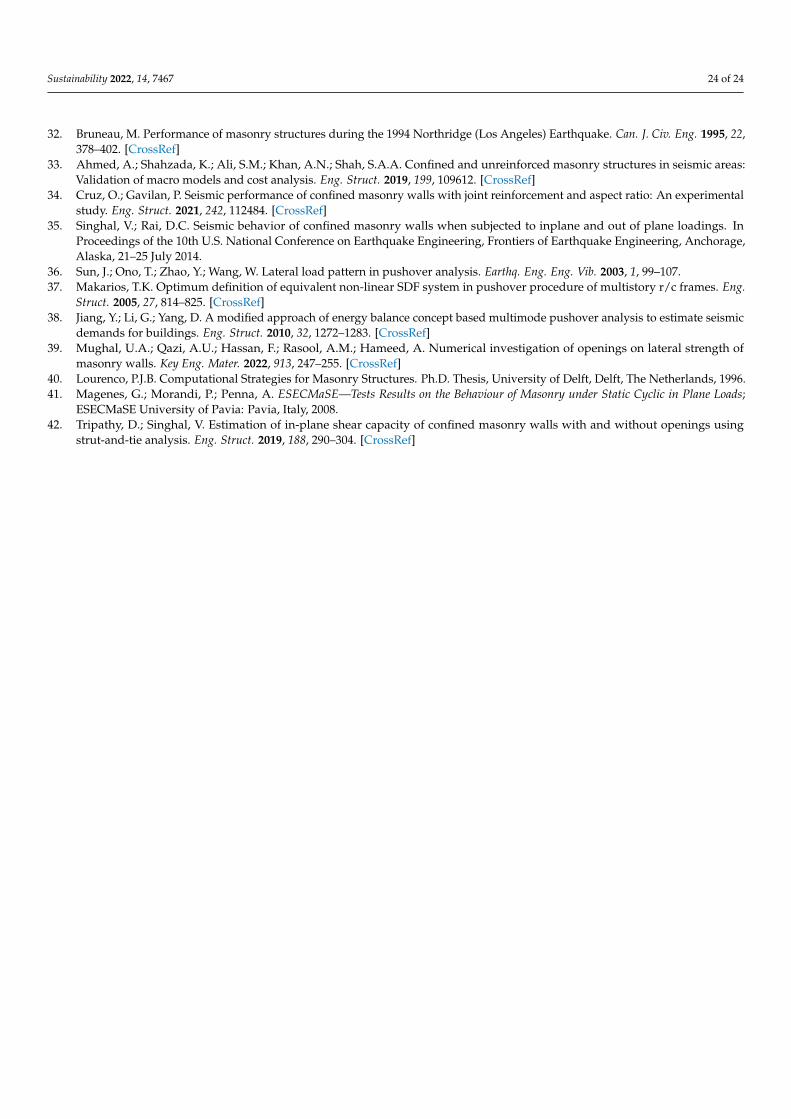
Sustainability 2022, 14, 7467 24 of 24
32. Bruneau, M. Performance of masonry structures during the 1994 Northridge (Los Angeles) Earthquake. Can. J. Civ. Eng. 1995, 22,378–402. [CrossRef]
33. Ahmed, A.; Shahzada, K.; Ali, S.M.; Khan, A.N.; Shah, S.A.A. Confined and unreinforced masonry structures in seismic areas:Validation of macro models and cost analysis. Eng. Struct. 2019, 199, 109612. [CrossRef]
34. Cruz, O.; Gavilan, P. Seismic performance of confined masonry walls with joint reinforcement and aspect ratio: An experimentalstudy. Eng. Struct. 2021, 242, 112484. [CrossRef]
35. Singhal, V.; Rai, D.C. Seismic behavior of confined masonry walls when subjected to inplane and out of plane loadings. InProceedings of the 10th U.S. National Conference on Earthquake Engineering, Frontiers of Earthquake Engineering, Anchorage,Alaska, 21–25 July 2014.
36. Sun, J.; Ono, T.; Zhao, Y.; Wang, W. Lateral load pattern in pushover analysis. Earthq. Eng. Eng. Vib. 2003, 1, 99–107.37. Makarios, T.K. Optimum definition of equivalent non-linear SDF system in pushover procedure of multistory r/c frames. Eng.
Struct. 2005, 27, 814–825. [CrossRef]38. Jiang, Y.; Li, G.; Yang, D. A modified approach of energy balance concept based multimode pushover analysis to estimate seismic
demands for buildings. Eng. Struct. 2010, 32, 1272–1283. [CrossRef]39. Mughal, U.A.; Qazi, A.U.; Hassan, F.; Rasool, A.M.; Hameed, A. Numerical investigation of openings on lateral strength of
masonry walls. Key Eng. Mater. 2022, 913, 247–255. [CrossRef]40. Lourenco, P.J.B. Computational Strategies for Masonry Structures. Ph.D. Thesis, University of Delft, Delft, The Netherlands, 1996.41. Magenes, G.; Morandi, P.; Penna, A. ESECMaSE—Tests Results on the Behaviour of Masonry under Static Cyclic in Plane Loads;
ESECMaSE University of Pavia: Pavia, Italy, 2008.42. Tripathy, D.; Singhal, V. Estimation of in-plane shear capacity of confined masonry walls with and without openings using
strut-and-tie analysis. Eng. Struct. 2019, 188, 290–304. [CrossRef]