Impact of OATP1B1, MDR1, and CYP3A4 expression in liver and intestine on interpatient...
8
ARTICLES nature publishing group Cytochrome P450 (CYP) enzymes and transporter proteins are recognized as important pharmacokinetic determinants of many drugs. 1,2 Although variability in CYP3A phenotype is believed to aect presystemic and systemic metabolism of many drugs, expression and function of multidrug resistance protein 1 (MDR1) and the organic anion-transporting polypeptide 1B1 (OATP1B1) may impact interpatient dierences in drug trans- port in the body. CYP3A4 is the most abundant CYP enzyme expressed in the liver and the small intestine. 3–5 Many drugs metabolized by CYP3A are also substrates of MDR1, 6 which is expressed in sev- eral human tissues, including the apical membrane of the intes- tines and the apical membrane of hepatocytes. 7 OATP1B1 shows a liver-specic expression 8,9 and mediates uptake of many acidic substances from the circulation into the liver. 10,11 e high inter- individual variability in the expression of CYP3A4, MDR1, and OATP1B1 is well recognized, 12–18 as well as intraindividual vari- ation depending on factors such as drug interactions 2,19 and inammatory disease. 20 Furthermore, specic single-nucleotide polymorphisms in the genes encoding MDR1 (ABCB1) 21 and OATP1B1 (SLCO1B1) 22,23 have also been associated with altered expression and/or function that may aect drug disposition. 24,25 The HMG-CoA reductase inhibitor atorvastatin, one of the most prescribed cholesterol-lowering agents, shows low oral bioavailability and is a substrate for CYP3A4, MDR1, and OATP1B1. 26–30 Atorvastatin is administered in the pharmaco- dynamic active acid form but is partly interconverted in vivo to an inactive lactone metabolite. 28 Although the lactone form is inactive toward HMG-CoA reductase, its systemic levels have been linked as a marker of myotoxicity of atorvastatin treatment. Both atorvastatin acid and lactone exhibit highly variable phar- macokinetics. 27,31,32 e acid form is the primary substrate for OATP1B1, 33,34 whereas the lactone form exhibits higher anity for both CYP3A4 and MDR1. 34,35 Given its extensive CYP3A metabolism, as well as MDR1- and OATP1B1-mediated transport, atorvastatin is a suitable model drug for investigating the relation- ship between hepatic and intestinal expression of these proteins and the interindividual variation in drug pharmacokinetics. In this study, we measured 24-h atorvastatin pharmacokinetics and the expression of CYP3A4, MDR1, and OATP1B1 in paired Individual variability in expression and function of organic anion-transporting polypeptide 1B1 (OATP1B1), multidrug resistance protein 1 (MDR1), and/or cytochrome P450 3A4 (CYP3A4) may impact the clinical response of many drugs. We investigated the correlation between expression of these proteins and pharmacokinetics of atorvastatin, a substrate of all three, in 21 obese patients with paired biopsies from liver and intestinal segments. The patients were also screened for the SLCO1B1 c.521T→C variant alleles. Approximately 30% (r 2 = 0.28) of the variation in oral clearance (CL/F) of atorvastatin was explained by hepatic OATP1B1 protein expression (P = 0.041). Patients carrying the SLCO1B1 c.521C variant allele (homozygous, n = 4; heterozygous, n = 2) exhibited 45% lower CL/F of atorvastatin than the c.521TT carriers (P = 0.067). No association between hepatic and intestinal expression of MDR1 or CYP3A4 and atorvastatin pharmacokinetics was found (P > 0.149). In conclusion, this study suggests that OATP1B1 phenotype is more important than CYP3A4 and MDR1 phenotypes for the individual pharmacokinetic variability of atorvastatin. Received 7 August 2012; accepted 10 December 2012; advance online publication 30 January 2013. doi:10.1038/clpt.2012.261 Impact of OATP1B1, MDR1, and CYP3A4 Expression in Liver and Intestine on Interpatient Pharmacokinetic Variability of Atorvastatin in Obese Subjects M Ulvestad 1,2 , IB Skottheim 1 , GS Jakobsen 3 , S Bremer 4 , E Molden 1 , A Åsberg 1 , J Hjelmesæth 3 , TBAndersson 2 , R Sandbu 3 and H Christensen 1 1 Department of Pharmaceutical Biosciences, School of Pharmacy, University of Oslo, Oslo, Norway; 2 DMPK Innovative Medicines, AstraZeneca R&D Mölndal, Mölndal, Sweden; 3 Morbid Obesity Center, VestfoldHospital Trust, Tønsberg, Norway; 4 Department of Medical Biochemistry, Oslo University Hospital, Oslo, Norway. Correspondence: H Christensen ([email protected]) CLINICAL PHARMACOLOGY & THERAPEUTICS | VOLUME 93 NUMBER 3 | MARCH 2013 275
Transcript of Impact of OATP1B1, MDR1, and CYP3A4 expression in liver and intestine on interpatient...

ARTICLESnature publishing group
Cytochrome P450 (CYP) enzymes and transporter proteins are recognized as important pharmacokinetic determinants of many drugs.1,2 Although variability in CYP3A phenotype is believed to a!ect presystemic and systemic metabolism of many drugs, expression and function of multidrug resistance protein 1 (MDR1) and the organic anion-transporting polypeptide 1B1 (OATP1B1) may impact interpatient di!erences in drug trans-port in the body.
CYP3A4 is the most abundant CYP enzyme expressed in the liver and the small intestine.3–5 Many drugs metabolized by CYP3A are also substrates of MDR1,6 which is expressed in sev-eral human tissues, including the apical membrane of the intes-tines and the apical membrane of hepatocytes.7 OATP1B1 shows a liver-speci"c expression8,9 and mediates uptake of many acidic substances from the circulation into the liver.10,11 #e high inter-individual variability in the expression of CYP3A4, MDR1, and OATP1B1 is well recognized,12–18 as well as intraindividual vari-ation depending on factors such as drug interactions2,19 and in$ammatory disease.20 Furthermore, speci"c single-nucleotide polymorphisms in the genes encoding MDR1 (ABCB1)21 and
OATP1B1 (SLCO1B1)22,23 have also been associated with altered expression and/or function that may a!ect drug disposition.24,25
The HMG-CoA reductase inhibitor atorvastatin, one of the most prescribed cholesterol-lowering agents, shows low oral bioavailability and is a substrate for CYP3A4, MDR1, and OATP1B1.26–30 Atorvastatin is administered in the pharmaco-dynamic active acid form but is partly interconverted in vivo to an inactive lactone metabolite.28 Although the lactone form is inactive toward HMG-CoA reductase, its systemic levels have been linked as a marker of myotoxicity of atorvastatin treatment. Both atorvastatin acid and lactone exhibit highly variable phar-macokinetics.27,31,32 #e acid form is the primary substrate for OATP1B1,33,34 whereas the lactone form exhibits higher a%nity for both CYP3A4 and MDR1.34,35 Given its extensive CYP3A metabolism, as well as MDR1- and OATP1B1-mediated transport, atorvastatin is a suitable model drug for investigating the relation-ship between hepatic and intestinal expression of these proteins and the interindividual variation in drug pharmacokinetics.
In this study, we measured 24-h atorvastatin pharmacokinetics and the expression of CYP3A4, MDR1, and OATP1B1 in paired
Individual variability in expression and function of organic anion-transporting polypeptide 1B1 (OATP1B1), multidrug resistance protein 1 (MDR1), and/or cytochrome P450 3A4 (CYP3A4) may impact the clinical response of many drugs. We investigated the correlation between expression of these proteins and pharmacokinetics of atorvastatin, a substrate of all three, in 21 obese patients with paired biopsies from liver and intestinal segments. The patients were also screened for the SLCO1B1 c.521T!C variant alleles. Approximately 30% (r2 = 0.28) of the variation in oral clearance (CL/F) of atorvastatin was explained by hepatic OATP1B1 protein expression (P = 0.041). Patients carrying the SLCO1B1 c.521C variant allele (homozygous, n = 4; heterozygous, n = 2) exhibited 45% lower CL/F of atorvastatin than the c.521TT carriers (P = 0.067). No association between hepatic and intestinal expression of MDR1 or CYP3A4 and atorvastatin pharmacokinetics was found (P > 0.149). In conclusion, this study suggests that OATP1B1 phenotype is more important than CYP3A4 and MDR1 phenotypes for the individual pharmacokinetic variability of atorvastatin.
Received 7 August 2012; accepted 10 December 2012; advance online publication 30 January 2013. doi:10.1038/clpt.2012.261
Clinical Pharmacology & #erapeutics
10.1038/clpt.2012.261
Articles
30January2013
93
3
7August2012
102012
Impact of OATP1B1, MDR1, and CYP3A4 Expression in Liver and Intestine on Interpatient Pharmacokinetic Variability of Atorvastatin in Obese SubjectsM Ulvestad1,2, IB Skottheim1, GS Jakobsen3, S Bremer4, E Molden1, A Åsberg1, J Hjelmesæth3, TB!Andersson2, R Sandbu3 and H Christensen1
1Department of Pharmaceutical Biosciences, School of Pharmacy, University of Oslo, Oslo, Norway; 2DMPK Innovative Medicines, AstraZeneca R&D Mölndal, Mölndal, Sweden; 3Morbid Obesity Center, Vestfold!Hospital Trust, Tønsberg, Norway; 4Department of Medical Biochemistry, Oslo University Hospital, Oslo, Norway. Correspondence: H Christensen ([email protected])
CLINICAL PHARMACOLOGY & THERAPEUTICS | VOLUME 93 NUMBER 3 | MARCH 2013 275

ARTICLES
liver and small-intestinal biopsies in 21 obese patients. #e main aim was to investigate the impact of expression levels of CYP3A4, MDR1, and OATP1B1 on the pharmacokinetics of atorvastatin and its inactive lactone form. Secondary aims were to study the association between body mass index (BMI) and expression levels of these proteins, and the intraindividual cor-relation between hepatic and intestinal expression of CYP3A4 and MDR1.
RESULTSSubject characteristicsInformation about demographics, atorvastatin pharmacokinet-ics, and SLCO1B1 c.521T&C genotype distribution is shown in Table 1. Twelve females and nine males were included in the study. #e daily doses of atorvastatin administered were 20 mg
(n = 12), 40 mg (n = 6), and 80 mg (n = 3). Comorbidities present in at least three patients were type 2 diabetes mellitus, hyperten-sion, hypercholesterolemia, sleep apnea, hypothyroidism, and osteoarthritis. None of the patients received drugs known to interact with atorvastatin pharmacokinetics.
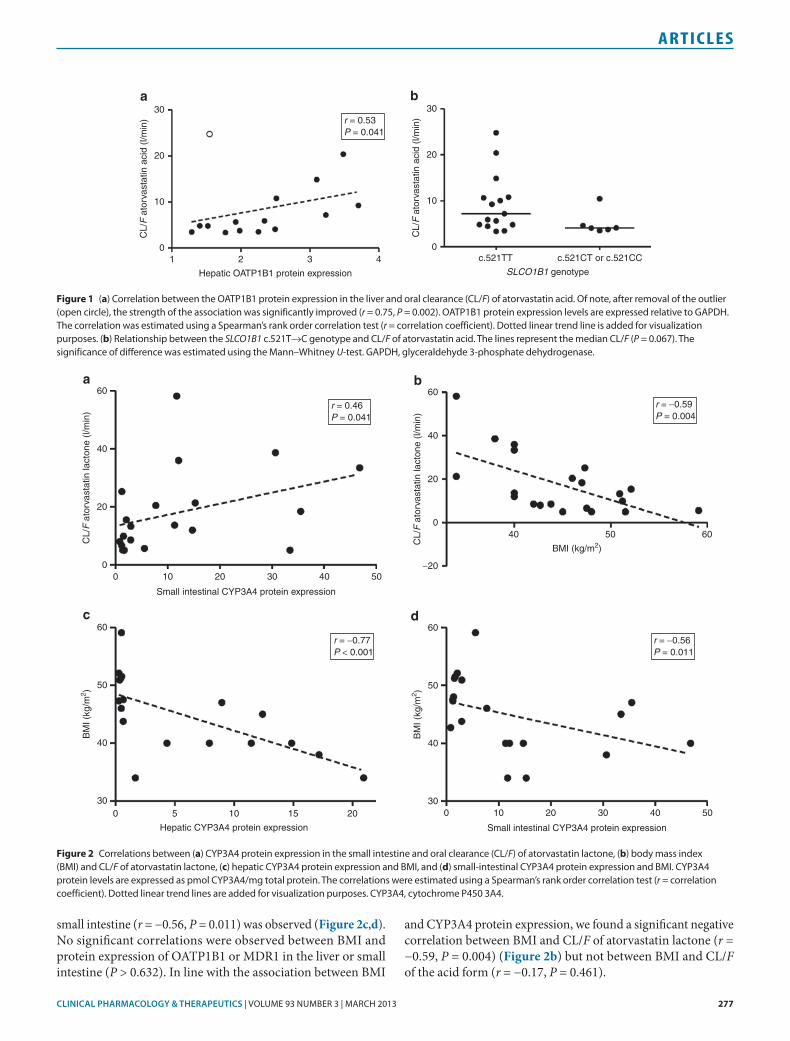
Correlations between protein expression and atorvastatin pharmacokinetics#ere was a signi"cant positive correlation between OATP1B1 protein expression in the liver and CL/F of atorvastatin acid (r = 0.53, P = 0.041) (Table 2, Figure 1a) but not between OATP1B1 expression and elimination rate constant (kel) of atorvastatin acid (r = '0.17, P = 0.550). #e estimated correlation indicated that OATP1B1 expression explained ~30% of the interindividual variability in CL/F of atorvastatin acid (r2 = 0.28). Of note, a(er removal of the outlying patient (Figure 1a), who did not dis-play any aberrant characteristics, the strength of the association between OATP1B1 protein expression and CL/F of atorvastatin acid was enhanced (r = '0.75, P = 0.002). For the lactone form of atorvastatin, no signi"cant correlation was observed between OATP1B1 protein expression and CL/F (r = 0.33, P = 0.260), whereas there tended to be a negative correlation between the OATP1B1 expression and kel (r = '0.51, P = 0.054) (Table 2).
Evaluation of the relationships between CYP3A4 protein expression and atorvastatin pharmacokinetic parameters showed no signi"cant correlations for hepatic or small-intes-tinal samples (P > 0.149) (Table 2). For atorvastatin lactone, a signi"cant positive correlation was observed between CL/F and CYP3A4 expression in the small intestine (r = 0.46, P = 0.041) (Figure 2a) but not between CL/F and hepatic expres-sion of CYP3A4 (r = 0.23, P = 0.364). No signi"cant correla-tions between hepatic or small-intestinal CYP3A4 expression and kel of atorvastatin lactone were observed (P > 0.673). Neither hepatic nor intestinal MDR1 protein expression was associated with any of the pharmacokinetic parameters of atorvastatin acid or lactone (Table 2).
Correlations between BMI and protein expressionA signi"cant negative correlation between BMI and protein expression of CYP3A4 in both the liver (r = '0.77, P < 0.001) and
Table 1 Demographics, atorvastatin pharmacokinetics, and genotype distribution among the included patients Demographic Median (range)
Age (years) 50 (29–64)
BMI (kg/m2) 45 (34–59)
Dose (mg/day) 20 (20–80)
Atorvastatin pharmacokinetics
Atorvastatin acid
CL/F (l/min) 5.7 (3.4–24.8)
kel (h"1) 0.04 (0.02–0.21)
t1/2 (h) 9.9 (3.3–30.2)
Atorvastatin lactone
CL/F (l/min) 13.3 (5.0–58.2)
kel (h"1) 0.10 (0.03–0.16)
t1/2 (h) 6.6 (4.3–21.4)
SLCO1B1 c.521T!C genotype n
T/T 15
C/T 2
C/C 4
BMI, body mass index; CL/F, oral clearance; kel, elimination rate constant; t1/2, elimination half-life.
Table 2 Correlations between individual protein expression levels of OATP1B1, CYP3A4, and MDR1 in liver and small intestine and pharmacokinetic parameters of atorvastatin acid and the inactive lactone metabolite in obese patients
Protein Tissue
Atorvastatin acid Atorvastatin lactone
CL/F (l/min) kel (h!1) CL/F (l/min) kel (h
!1)
r P value r P value r P value r P value
OATP1B1 Liver 0.53 0.041* "0.17 0.550 0.33 0.260 "0.51 0.054
CYP3A4 Liver "0.09 0.723 "0.35 0.149 0.23 0.364 0.01 0.971
Small intestine 0.05 0.835 "0.06 0.811 0.46 0.041* 0.10 0.673
MDR1 Liver "0.27 0.305 0.08 0.772 "0.30 0.244 0.27 0.300
Small intestine 0.09 0.710 0.00 0.990 "0.01 0.975 0.28 0.235
The correlations were estimated using a Spearman’s rank order correlation test.
CL/F, oral clearance; CYP3A4, cytochrome P450 3A4; kel, elimination rate constant; MDR1, multidrug resistance protein 1; OATP1B1, organic anion-transporting polypeptide 1B1; r,!Spearman’s rank correlation coefficient.
*P < 0.05.
276 VOLUME 93 NUMBER 3 | MARCH 2013 | www.nature.com/cpt
ARTICLES
small intestine (r = '0.56, P = 0.011) was observed (Figure!2c,d). No signi"cant correlations were observed between BMI and protein expression of OATP1B1 or MDR1 in the liver or small intestine (P > 0.632). In line with the association between BMI
and CYP3A4 protein expression, we found a signi"cant negative correlation between BMI and CL/F of atorvastatin lactone (r = '0.59, P = 0.004) (Figure 2b) but not between BMI and CL/F of the acid form (r = '0.17, P = 0.461).
Figure 1 (a) Correlation between the OATP1B1 protein expression in the liver and oral clearance (CL/F) of atorvastatin acid. Of note, after removal of the outlier (open circle), the strength of the association was significantly improved (r = 0.75, P = 0.002). OATP1B1 protein expression levels are expressed relative to GAPDH. The correlation was estimated using a Spearman’s rank order correlation test (r = correlation coefficient). Dotted linear trend line is added for visualization purposes. (b) Relationship between the SLCO1B1 c.521T!C genotype and CL/F of atorvastatin acid. The lines represent the median CL/F (P = 0.067). The significance of difference was estimated using the Mann–Whitney U-test. GAPDH, glyceraldehyde 3-phosphate dehydrogenase.
30
20
r = 0.53P = 0.041
CL/
F a
torv
asta
tin a
cid
(l/m
in)
10
0
30
20
CL/
F a
torv
asta
tin a
cid
(l/m
in)
10
0c.521TT c.521CT or c.521CC
SLCO1B1 genotype1 2 3
Hepatic OATP1B1 protein expression4
a b
Figure 2 Correlations between (a) CYP3A4 protein expression in the small intestine and oral clearance (CL/F) of atorvastatin lactone, (b) body mass index (BMI) and CL/F of atorvastatin lactone, (c) hepatic CYP3A4 protein expression and BMI, and (d) small-intestinal CYP3A4 protein expression and BMI. CYP3A4 protein levels are expressed as pmol CYP3A4/mg total protein. The correlations were estimated using a Spearman’s rank order correlation test (r = correlation coefficient). Dotted linear trend lines are added for visualization purposes. CYP3A4, cytochrome P450 3A4.
r = 0.46P = 0.041
030
40
50
BM
I (kg
/m2 )
60
30
40
50
BM
I (kg
/m2 )
60
5 10 15 20Hepatic CYP3A4 protein expression
r = !0.59P = 0.004
r = !0.77P < 0.001
r = !0.56P = 0.011
20
40
60
CL/
F a
torv
asta
tin la
cton
e (l/
min
)
00 10 20
Small intestinal CYP3A4 protein expression
30 40 50
0 10 20
Small intestinal CYP3A4 protein expression
30 40 50
a
20
40
60
CL/
F a
torv
asta
tin la
cton
e (l/
min
)
0
!20
40 50BMI (kg/m2)
60
b
c d
CLINICAL PHARMACOLOGY & THERAPEUTICS | VOLUME 93 NUMBER 3 | MARCH 2013 277

ARTICLES
Atorvastatin pharmacokinetics in genotype subgroupsFour patients were homozygous for the SLCO1B1 c.521C vari-ant (19%), two were heterozygous (10%), and the remaining 15 patients were homozygous c.521TT carriers (Table 1). Although no signi"cant di!erence in OATP1B1 expression was observed between carriers and noncarriers of SLCO1B1 c.521C (P = 0.943), CL/F of atorvastatin acid was on aver-age 45% lower in the combined group of heterozygous and homozygous c.521C carriers as compared with c.521TT car-riers (P = 0.067) (Figure 1b). Similarly, the observed dose-adjusted peak plasma concentration values showed the same trend, with a 42% increase in c.521C carriers as compared with the homozygous wild-type subgroup (P = 0.150). By contrast, no association was found between the c.521C variant and kel of atorvastatin acid (P = 0.533). For the lactone form of atorva-statin, no signi"cant di!erence in CL/F was observed between c.521C carriers and c.521TT carriers (P = 0.969), whereas kel was 35% lower in the combined group of heterozygous and homozygous c.521C carriers as compared with c.521TT carriers (P = 0.039).
Correlations between mRNA and protein expression of OATP1B1, MDR1, and CYP3A4A large interindividual variability was observed in the mRNA and protein expression in all tissues (Supplementary Table S1 online). In the liver, expression of SLCO1B1, ABCB1, and CYP3A4 varied 3.5-, 5.3-, and 14-fold, respectively, whereas in the small-intestinal segments, fold variation of ABCB1 and CYP3A4 expression ranged from 3.6 to 80 and from 43 to 812, respectively. #e OATP1B1, MDR1, and CYP3A4 protein expression in the liver varied 2.9-, 48-, and 78-fold, respectively, whereas in the small-intestinal segments, fold variation of MDR1 and CYP3A4 protein expression ranged from 8.3 to 30 and from 7.3 to 128, respectively. #ere were no signi"cant correlations between the mRNA and protein expression of OATP1B1 (r = '0.11, P = 0.755), MDR1 (r = '0.17, P = 0.245), or CYP3A4 (r = 0.07, P = 0.618) in the liver and small intestine.
Comparison of protein expression in the paired samples from liver and small intestine showed a signi"cant positive correlation between the CYP3A4 protein expression in the liver and in the small intestine (r = 0.81, P < 0.001) (Figure 3). #ere was no signi"cant correlation between the MDR1 protein expression in the liver and small intestine in individual patients (r = '0.21, P = 0.428).
Patients with available samples from all three segments of the small intestine (n = 10) showed a signi"cant decrease in)CYP3A4 protein expression from duodenum to jejunum (P)= 0.027) and ileum (P = 0.002) but not between jejunum and ileum (P = 0.250). However, there tended to be a decrease in the CYP3A4 expression from jejunum to ileum in samples from all patients (P = 0.080, n = 19) (Supplementary Table S1 online). For MDR1, no signi"cant di!erences were observed between the protein expression in duodenum, jejunum, and ileum (P > 0.433) (Supplementary Table S1 online).
DISCUSSIONTo our knowledge, this is the "rst study to investigate the rela-tionship between individual expression of OATP1B1, MDR1, and CYP3A4 in paired liver and small-intestinal biopsies and the pharmacokinetics of atorvastatin. #e main "nding was a signi"cant correlation between OATP1B1 protein expres-sion in the liver and CL/F of atorvastatin in obese patients, indicating that OATP1B1 phenotype is a major determinant of the individual variability in pharmacokinetics of atorvas-tatin. #is was supported by the almost 50% lower CL/F of atorvastatin observed in carriers of the SLCO1B1 c.521C vari-ant allele, which is associated with impaired transport func-tion,26,36 as compared with that of homozygous carriers of the wild-type allele, and is in line with a previous study investigat-ing the impact of SLCO1B1 genetics on systemic exposure of atorvastatin.25
Previous in vitro "ndings have been somewhat inconsistent regarding the e!ect of the SLCO1B1 521)T&C polymorphism on the protein expression of OATP1B1.26 However, our in vivo data clearly indicate that this mutation a!ects activity rather than expression of OATP1B1. #e proportion of homozygous c.521C carriers in the current obese population was higher than one would have expected, but given that the allelic frequency of the c.521C variant was as expected, we believe that the higher pro-portion of homozygous c.521C carriers might have occurred by chance. However, we also acknowledge the possibility that this genotype may be associated with development of obesity per se.
Approximately 30% of the variation in CL/F of active ator-vastatin could be explained by hepatic OATP1B1 protein expression (r2 = 0.28). #ere was no signi"cant correlation between atorvastatin CL/F and any of the other tested variables (e.g., CYP3A4 or MDR1 expression in liver and intestine), but it should be mentioned that our evaluation was solely based on univariate statistical analyses. Given that multivariate analyses enable adjustment for potential covariates (e.g., age, BMI, and gender), application of such tests might potentially have iden-ti"ed other signi"cant determinants of atorvastatin CL/F as well. However, multivariate analyses were not carried out in
Figure 3 Correlation between CYP3A4 protein expression in the liver and small intestine in obese patients. CYP3A4 protein levels are expressed as pmol CYP3A4/mg total protein. The correlation was estimated using a Spearman’s rank order correlation test (r = correlation coefficient). Dotted linear trend line is added for visualization purposes. CYP3A4, cytochrome P450 3A4.
r = 0.81P < 0.001
030
10
20
Sm
all i
ntes
tinal
CY
P3A
4 pr
otei
n ex
pres
stio
n
30
40
50
5 10 15 20Hepatic CYP3A4 protein expression
278 VOLUME 93 NUMBER 3 | MARCH 2013 | www.nature.com/cpt

ARTICLES
the current study due to the limited number of observations. Nevertheless, "ndings from the univariate analyses provide clear evidence that hepatic OATP1B1 is more important than intestinal or hepatic CYP3A4 and MDR1 for the individual pharmacokinetic variability of atorvastatin.
#e positive correlation with CL/F was consistent with the expectation that patients with higher OATP1B1 protein expres-sion levels exhibit greater rates of OATP1B1-mediated hepatic uptake of atorvastatin, and hence higher atorvastatin clear-ance. However, no association was observed between hepatic OATP1B1 expression and kel of atorvastatin. #is might sug-gest that the individual variability in OATP1B1 phenotype selectively a!ects the presystemic clearance of atorvastatin. Another potential explanation is a corresponding impact of hepatic OATP1B1-mediated uptake on clearance and appar-ent volume of distribution of atorvastatin. Nevertheless, our "ndings show that the individual expression level of OATP1B1 determines presystemic clearance but not elimination half-life of atorvastatin in obese patients.
#e lactone metabolite of atorvastatin is pharmacologically inactive, but the level of this metabolite has been linked to the risk of muscular side e!ects.37 Due to its high lipophilicity, the lactone form of atorvastatin penetrates passively across cell membranes into peripheral tissues, where it can be converted to active atorvastatin acid by hydrolysis.28 We found no asso-ciation between the OATP1B1 expression level and CL/F of atorvastatin lactone in the current study, which is in line with the low a%nity to OATP1B1 for the lactone form.33,34 However, regarding a%nity to CYP3A4, the situation is opposite; i.e., atorvastatin lactone displays a much higher a%nity to CYP3A4 than atorvastatin acid.35 In accordance with this, a signi"cant association was observed between CYP3A4 expression in the small intestine and the pharmacokinetics of atorvastatin lactone but not atorvastatin acid. With respect to protein expression of MDR1, no signi"cant correlation was observed for atorvastatin or for its lactone metabolite. #us, it seems evident that indi-vidual variability in MDR1-mediated e*ux in the intestine or liver is not of clinical relevance for atorvastatin pharmacokinet-ics, at least at therapeutic doses in obese patients.
Obesity is a rapidly growing health-care problem in modern societies, and it is o(en associated with various comorbidi-ties and need of drug therapy (e.g., cardiovascular drugs).38,39 However, little is known about the regulation of drug-metab-olizing enzymes and transporters in obese patients. Of note, we observed that the CYP3A4 expression in both liver and small intestine was strongly associated with BMI in the cur-rent population; i.e., the higher the BMI, the lower the CYP3A4 expression. #is observation is in line with a signi"cant nega-tive correlation between BMI and CL/F of atorvastatin lac-tone. Obesity has previously been shown to suppress CYP3A4 activity,40 and reduced clearance of midazolam, a well-known CYP3A4 probe drug, has been reported in obese subjects.41 CYP3A4 is quantitatively the most important enzyme in drug metabolism, and the low expression of this enzyme in obese patients likely implies higher bioavailability and lower clearance of many drugs. #us, obese patients might be at risk of being
overexposed to several drugs. However, additional studies are required to investigate pharmacokinetic alterations and dose requirements in obese patients in more detail.
Consistent with previous studies, we found large interindi-vidual variabilities in both the mRNA and protein expression of OATP1B1, CYP3A4, and MDR1 in the liver and of CYP3A4 and MDR1 in all three regions of the small intestine.12–18 #ere were no signi"cant correlations between the mRNA and pro-tein levels. #ese "ndings underscore one of the strengths of the current study given that protein expression data were related to clinical outcome.
Overall, the intraindividual di!erence in protein expres-sion of CYP3A4 and MDR1 along the small intestine in obese patients was comparable with previous "ndings in nonobese patients.15,16,42–45 A decrease in CYP3A4 expression from proxi-mal to distal parts of the small intestine was observed, which is in agreement with previous reports.16,44,45 By contrast to the observations for CYP3A4, MDR1 protein expression has been shown to increase distally.15,43,44 However, in the current study, no signi"cant di!erences between MDR1 protein expression levels in the small-intestinal segments were observed.
In the current study, CYP3A4 protein expression was determined in tissue homogenates, presented per milligram total protein, and the respective absolute concentrations were substantially lower than previously reported.4,5,13,16,18 Reasons for this discrepancy are probably multifactorial, but it could be explained by the fact that all biopsies in the cur-rent study were true-cut biopsies and that they were obtained from obese patients, who are associated with lower CYP3A4 expression levels, as previously discussed, in contradiction to some previous studies.18,46 In addition, our liver biopsies were obtained from the edge of the liver, and hence may contain lower CYP3A4 levels than biopsies obtained from central liver tissue.
In summary, this study suggests that the hepatic expression of OATP1B1 is more important than CYP3A4 and MDR1 expression in small intestine and liver for the individual vari-ability in pharmacokinetics of atorvastatin in obese patients. Moreover, high BMI is associated with low CYP3A4 expression in both the liver and small intestine, which decreases the CL/F of atorvastatin lactone, a metabolite of potential importance for the risk of myotoxicity. Finally, our "ndings indicate that CYP3A4 expression in the liver and small intestine is coordi-nately regulated.
METHODSPatient population. Briefly, patients >18 years assigned to undergo gas-tric surgery by the laparoscopic gastric bypass procedure (n = 11) or biliopancreatic diversion with duodenal switch (n = 10) were included. The study was approved by the regional ethics committee and regis-tered at ClinicalTrials.gov (NCT00331565). Written informed consent was obtained from all participants.
Atorvastatin (Lipitor, P"zer, NY) was administered once daily (each morning). #e individual doses ranged from 20 to 80 mg and were kept unchanged during the study period. Pharmacokinetic investigations were performed the day before surgery. Blood samples were collected before atorvastatin administration (0 h) and 0.5, 1, 1.5, 2, 3, 5, 6, 8, 10, 12, 22, and 24 h a(er the dose. Atorvastatin and its lactone metabolite were analyzed
CLINICAL PHARMACOLOGY & THERAPEUTICS | VOLUME 93 NUMBER 3 | MARCH 2013 279

ARTICLES
by high-performance liquid chromatography/mass spectrometry and the area under the plasma concentration vs. time curve from 0 to 24 h a(er the dose (AUC0–24) was calculated.
At the day of surgery, biopsies were obtained from the liver, jejunum, and ileum in the patients undergoing gastric bypass, whereas in the patients undergoing biliopancreatic diversion with duodenal switch, biopsies were obtained from the liver, duodenum, jejunum, and ileum.
Tissue sample preparation. The biopsies were divided on an RNAse-free plate. One piece of tissue was transferred to a sterile Eppendorf vial containing Trizol (Invitrogen, Carlsbad, CA) and frozen at !70 °C until mRNA analyses. The second piece of tissue was homogenized in 0.32 mol/l sucrose, 10 mmol/l Tris (pH 7.4), and 1.0 mmol/l EDTA by Precellys 24 (Bertin Technologies, Montigny-le-Bretonneux, France) to a final concentration of 50 mg tissue/ml buffer. The samples were homogenized four times at 5,000 rpm for 50 s separated by 3 min cool-ing on ice. Total protein concentration in each sample was determined using the Bio-Rad Protein Assay (Bio-Rad Laboratories, Hercules, CA) based on the method of Bradford47 according to manufacturer’s instructions, with bovine serum albumin as standard. The homogen-ates were frozen at !70 °C until further analyses.
Gene expression. Extraction of total RNA from the biopsies was per-formed using the Agilent Total RNA Isolation Mini Kit (Agilent Technologies, Austin, TX) according to the manufacturer’s instruc-tions. Total RNA was reverse-transcribed into complementary DNA using the Transcriptor First Strand cDNA Synthesis Kit (Roche Diagnostics, Mannheim, Germany) and a combination of random hexamer and oligo d(T) (oligo deoxythymidine) primers according to the manufacturer’s instructions. MS2 RNA (Roche) was used as carrier RNA in all steps at a final concentration of 10 µg/ml.
#e expression of the SLCO1B1, ABCB1, and CYP3A4 genes was determined by real-time quantitative PCR on a LightCycler 480 instrument (Roche Applied Science, Penzberg, Germany). Sequences of the)target genes and three reference genes, aminolevulinate delta-synthase 1 (ALAS1), +-2-microglobulin (B2M), and ribosomal protein L13a (RPL13A), were ampli"ed in separate reactions. Oligonucleotide sequences, reaction mixtures, and ampli"cation conditions are listed in Supplementary Tables S2–S4 online.
Results of the real-time quantitative PCR assays were analyzed using the LightCycler 480 So(ware v.1.5 (Roche Applied Science). Quanti"-cation cycles were de"ned by the second derivative maximum method, and all quanti"cation-cycle measurements were performed in triplicate. Target gene expressions were calculated relative to the geometric mean expression of the reference genes and normalized to a calibrator. #e calculations included PCR e%ciency correction based on standard curves as previously described.48
Protein expression. All materials used in the western blot analyses of OATP1B1, MDR1, and CYP3A4 are provided in Supplementary Table S5 online.
OATP1B1 analysis. Samples were diluted in Laemmli bu!er (Bio-Rad Laboratories) containing 10% (vol/vol) +-mercaptoethanol and 0.5% (vol/vol) dithiothreitol (1 mol/l), and protein aliquots of 2.25 µg (15 µl) were loaded onto 9% (vol/vol) sodium dodecyl sulfate (SDS)-pol-yacrylamide gels. Proteins were separated by SDS-polyacrylamide gel electrophoresis and transferred to polyvinylidene $uoride membranes. Membranes were blocked with 5% (wt/vol) nonfat dry milk in tris-bu!-ered saline with 0.1% (vol/vol) Tween-20 (TBST, pH 7.2) for 1 h at room temperature, and incubated with primary antibody diluted in TBST (pH 7.2) (rabbit anti-OATP1B1 (1:2,000) and horseradish peroxidase (HRP)-conjugated antiglyceraldehyde 3-phosphate dehydrogenase (1:1,000)) at 4 °C overnight. Membranes were washed four times with TBST (pH 7.4) for 15 min, blocked with 5% (wt/vol) nonfat dry milk in TBST (pH 7.2) for 30 min, and incubated with secondary antibody diluted in TBST (pH 7.2) (HRP-conjugated goat antirabbit immunoglobulin G (1:1,000))
for 2 h at room temperature. Membranes were washed four times with TBST (pH 7.4) for 15 min and two times with puri"ed water for 2 min. For the internal standard glyceraldehyde 3-phosphate dehydrogenase, a primary antibody conjugated to HRP was used, and no incubation with secondary antibody was performed. Protein–antibody complexes were visualized by chemiluminescence using the ECL Plus Western Blotting Detection Reagents (GE Healthcare, Buckinghamshire, UK) according to the manufacturer’s instructions. #e signal intensities of the protein–antibody complexes were quanti"ed by Quantity One v. 4.4.0 (Bio-Rad Laboratories) and normalized against the intensity of the internal standard.
MDR1 analysis. Samples and standards were diluted in Laemmli bu!er containing 10% (vol/vol) +-mercaptoethanol and 5% (vol/vol) bromo-phenol blue, and protein aliquots of 6.3–73.3 µg (15 µl) were loaded onto 6.5% (vol/vol) SDS-polyacrylamide gel. Proteins were separated by SDS-polyacrylamide gel electrophoresis and transferred to nitrocel-lulose membranes. Membranes were blocked with 5% (wt/vol) nonfat dry milk in 0.05% (vol/vol) TBST (pH 7.5) for 1 h at room temperature and incubated with primary antibody diluted in TBST (mouse anti-MDR1 (1:200)) at 4 °C overnight. Membranes were washed three times with TBST for 10 min and incubated with secondary antibody diluted in TBST (HRP-conjugated goat antimouse immunoglobulin G (1:1,500)) for 1 h at room temperature. Membranes were washed three times with TBST for 10 min. Protein–antibody complexes were visualized by chemiluminescence using the ECL Plus Western Blotting Detection Reagents (GE Healthcare) according to the manufacturer’s instructions. #e signal intensities of the protein–antibody complexes were quanti"ed by GeneTools (SynGene, Cambridge, UK). Quanti"cation of MDR1 was based on comparison with an internal blotting standard (homogenate from an intestinal biopsy) that showed a linear relationship with the amount of membrane protein fractions applied on the gels. #e MDR1 amount was expressed in arbitrary units (MDR1 units), and the results were normalized against the total protein amount loaded.
CYP3A4 analysis. #e CYP3A4 concentrations were determined by immunoblotting using the 96-well Bio-Dot Micro"ltration Apparatus (Bio-Rad Laboratories). Baculovirus-infected insect cell microsomes expressing CYP3A4 enzymes were applied as CYP3A4 standard. Sam-ples and standards were diluted in Laemmli bu!er containing 10% (vol/vol) +-mercaptoethanol and 5% (vol/vol) bromophenol blue and boiled for 5 min at 90 °C. #e nitrocellulose membrane was soaked in TBS for 10 min, and the Bio-Dot Micro"ltration Apparatus was assembled according to the manufacturer’s instructions. TBS (100 µl) was added to each well and removed by vacuum. Protein aliquots (samples and standards) of 0.04–1.27 µg (15 µl) were added to each well. A(er 30 min, vacuum was applied to remove the solution. Each well was washed twice with 200 µl TBST (pH 7.5). #e membrane was detached from the Bio-Dot Micro"ltration Apparatus, blocked with 5% (wt/vol) nonfat dry milk in TBST for 1 h at room temperature, and incubated with primary anti-body diluted in TBST (rabbit anti-CYP3A4 (1:10,000)) for 1–2 h at room temperature or at 4 °C overnight. Membranes were washed three times with TBST for 10 min and incubated with HRP-conjugated secondary antibody (goat antirabbit immunoglobulin G (1:3,000)) for 1 h at room temperature. Membranes were washed three times with TBST for 10 min. Protein–antibody complexes were visualized by chemiluminescence using the ECL Plus Western Blotting Detection Reagents (GE Health-care) according to the manufacturer’s instructions. #e signal intensities of the protein–antibody complexes were quanti"ed by GeneTools. #e amount of CYP3A4 in the unknown samples was calculated from the recombinant CYP3A4 standard curve and normalized against the total protein amount loaded.
Genotyping procedures. DNA was extracted from whole blood by QIAamp (Qiagen, Valencia, CA). The single-nucleotide variation c.521T&C (p.Val174Ala, rs4149056) in SLCO1B1 was determined as previously described.49
280 VOLUME 93 NUMBER 3 | MARCH 2013 | www.nature.com/cpt

ARTICLES
Calculations. AUC0–24 for atorvastatin acid and lactone were deter-mined using the trapezoidal method. The apparent CL/F was calcu-lated by dividing the atorvastatin dose by AUC0–24. kel was determined by the slope of the log-linear terminal phase of the curve, and elimina-tion half-life was calculated by dividing ln 2 by kel.
#e total abundance of MDR1 and CYP3A4 in the small intestine was estimated by the following equation:
where the length of the small-intestinal segment was determined by the equation published by Darwich et al.:50
Body surface area was determined using the DuBois and DuBois formula:
Biopsies from duodenum were available from only 10 patients, and the total MDR1 or CYP3A4 abundance in the small intestine was esti-mated as the total protein abundance in jejunum and ileum. #e length of duodenum is minor as compared with the jejunum and ileum50 and does not contribute considerably to the total amount of MDR1/CYP3A4 in the small intestine.
#e correlations between variables were estimated using the non-parametric Spearman’s rank order correlation test (r = correlation coef-"cient), which was determined by IBM SPSS Statistics v. 19 (SPSS, an IBM Company, Armonk, NY). #e signi"cance of di!erence in protein expression levels between the small-intestinal segments was estimated by the Wilcoxon signed rank test, and the signi"cance of di!erence in CL/F and kel of atorvastatin acid and lactone between groups expressing di!erent SLCO1B1 genotypes was estimated using the Mann–Whitney U test, using GraphPad Prism v. 5.02 (GraphPad So(ware, La Jolla, CA). Two-tailed signi"cance levels were assessed, and P values <0.05 were considered statistically signi"cant.
SUPPLEMENTARY MATERIAL is linked to the online version of the paper at http://www.nature.com/cpt
ACKNOWLEDGMENTSWe thank Tone Oftedahl, Solveig Vist, Marit Nordeng, Duy-Chinh Thuy Huynh, and Siri Johannesen for performing the immunoblotting of CYP3A4 and western blot analysis of MDR1, and Beata U. Mohebi for performing the RNA extraction, DNA extraction, and genotyping. Furthermore, we thank Patrik Lundquist at AstraZeneca R&D Södertälje, Sweden, for technical support in the western blot analysis of OATP1B1. We are also grateful to Bruno Stieger, University Hospital Zurich, Zurich, Switzerland, for kindly providing the human OATP1B1 antibody, and to Rob Edwards, Imperial College School of Medicine, Hammersmith Hospital, London, UK, for providing the rabbit monoclonal CYP3A4 antibody.
AUTHOR CONTRIBUTIONSM.U., I.B.S., G.S.J., S.B., E.M., A.Å., J.H., T.B.A., R.S., and H.C. wrote the manuscript. I.B.S., A.Å., J.H., R.S., and H.C. designed the research. M.U., I.B.S., G.S.J., S.B., R.S., and H.C. performed the research. M.U., E.M., A.Å., T.B.A., and H.C. analyzed the data.
CONFLICT OF INTERESTThe authors declared no conflict of interest.
© 2013 American Society for Clinical Pharmacology and Therapeutics
1. Guengerich, F.P. Characterization of human microsomal cytochrome!P-450!enzymes. Annu. Rev. Pharmacol. Toxicol. 29, 241–264 (1989).
2. International Transporter Consortium et al. Membrane transporters in drug development. Nat. Rev. Drug Discov. 9, 215–236 (2010).
3. Guengerich, F.P. Cytochrome P-450 3A4: regulation and role in drug metabolism. Annu. Rev. Pharmacol. Toxicol. 39, 1–17 (1999).
4. Paine, M.F., Hart, H.L., Ludington, S.S., Haining, R.L., Rettie, A.E. & Zeldin, D.C. The human intestinal cytochrome P450 “pie”. Drug Metab. Dispos. 34, 880–886 (2006).
5. Shimada, T., Yamazaki, H., Mimura, M., Inui, Y. & Guengerich, F.P. Interindividual variations in human liver cytochrome P-450 enzymes involved in the oxidation of drugs, carcinogens and toxic chemicals: studies with liver microsomes of 30 Japanese and 30 Caucasians. J. Pharmacol. Exp. Ther. 270, 414–423 (1994).
6. Wacher, V.J., Wu, C.Y. & Benet, L.Z. Overlapping substrate speci#cities and tissue distribution of cytochrome P450 3A and P-glycoprotein: implications for drug delivery and activity in cancer chemotherapy. Mol. Carcinog. 13, 129–134 (1995).
7. Thiebaut, F., Tsuruo, T., Hamada, H., Gottesman, M.M., Pastan, I. & Willingham, M.C. Cellular localization of the multidrug-resistance gene product P-glycoprotein in normal human tissues. Proc. Natl. Acad. Sci. U.S.A. 84, 7735–7738 (1987).
8. Abe, T. et al. Identi#cation of a novel gene family encoding human liver-speci#c organic anion transporter LST-1. J. Biol. Chem. 274, 17159–17163 (1999).
9. Hsiang, B. et al. A novel human hepatic organic anion transporting polypeptide (OATP2). Identi#cation of a liver-speci#c human organic anion transporting polypeptide and identi#cation of rat and human hydroxymethylglutaryl-CoA reductase inhibitor transporters. J. Biol. Chem. 274, 37161–37168 (1999).
10. Maeda, K. et al. E$ects of organic anion transporting polypeptide 1B1 haplotype on pharmacokinetics of pravastatin, valsartan, and temocapril. Clin. Pharmacol. Ther. 79, 427–439 (2006).
Study HighlightsWHAT IS THE CURRENT KNOWLEDGE ON THE TOPIC?
! CYP enzymes and transporter proteins are recognized as important pharmacokinetic determinants of many drugs, and individual variability in expression and func-tion of these proteins may impact clinical response.
WHAT QUESTION DID THIS STUDY ADDRESS?
! In the current study, we investigated the impact of expression levels of CYP3A4, MDR1, and OATP1B1 in the liver and small intestine on the pharmacokinetics of atorvastatin and its inactive lactone form in obese patients.
WHAT THIS STUDY ADDS TO OUR KNOWLEDGE
! In summary, this study suggests that OATP1B1 phenotype is more important than CYP3A4 and MDR1 phenotypes for the individual pharmacokinetic variability of atorvastatin. Of note, we found that high BMI is associated with low CYP3A4 expression in both the liver and small intestine, which decreases the oral clearance of atorvastatin lactone and possibly also of other CYP3A4 substrates.
HOW THIS MIGHT CHANGE CLINICAL PHARMACOLOGY AND THERAPEUTICS
! #ese "ndings may be of clinical importance for drug treatment in obese patients.
Lengthof jejunumandileum 5.231 BSA= ! 0 414.
BSA m 0.007184 height(m) weight(kg)2 0.725 0.425( ) = ! !
TotalMDR1orCYP3A4abundance
=
proteinamount jejunummg total proteein jejunum
proteinamount ileummg total proteinileum
2l
+
!
"#$
%&'
eengthof jejunumand ileum
CLINICAL PHARMACOLOGY & THERAPEUTICS | VOLUME 93 NUMBER 3 | MARCH 2013 281

ARTICLES
11. Nakagomi-Hagihara, R. et al. OATP1B1, OATP1B3, and mrp2 are involved in hepatobiliary transport of olmesartan, a novel angiotensin II blocker. Drug Metab. Dispos. 34, 862–869 (2006).
12. Ho, R.H. et al. Drug and bile acid transporters in rosuvastatin hepatic uptake: function, expression, and pharmacogenetics. Gastroenterology 130, 1793–1806 (2006).
13. Lin, Y.S. et al. Co-regulation of CYP3A4 and CYP3A5 and contribution to hepatic and intestinal midazolam metabolism. Mol. Pharmacol. 62, 162–172 (2002).
14. Lown, K.S. et al. Role of intestinal P-glycoprotein (mdr1) in interpatient variation in the oral bioavailability of cyclosporine. Clin. Pharmacol. Ther. 62, 248–260 (1997).
15. Mouly, S. & Paine, M.F. P-glycoprotein increases from proximal to distal regions of human small intestine. Pharm. Res. 20, 1595–1599 (2003).
16. Paine, M.F. et al. Characterization of interintestinal and intraintestinal variations in human CYP3A-dependent metabolism. J. Pharmacol. Exp. Ther. 283, 1552–1562 (1997).
17. Schuetz, E.G., Furuya, K.N. & Schuetz, J.D. Interindividual variation in expression of P-glycoprotein in normal human liver and secondary hepatic neoplasms. J. Pharmacol. Exp. Ther. 275, 1011–1018 (1995).
18. von Richter, O., Burk, O., Fromm, M.F., Thon, K.P., Eichelbaum, M. & Kivistö, K.T. Cytochrome P450 3A4 and P-glycoprotein expression in human small intestinal enterocytes and hepatocytes: a comparative analysis in paired tissue specimens. Clin. Pharmacol. Ther. 75, 172–183 (2004).
19. Rendic, S. Summary of information on human CYP enzymes: human P450 metabolism data. Drug Metab. Rev. 34, 83–448 (2002).
20. Christensen, H. & Hermann, M. Immunological response as a source to variability in drug metabolism and transport. Front. Pharmacol. 3, 8 (2012).
21. Ho$meyer, S. et al. Functional polymorphisms of the human multidrug-resistance gene: multiple sequence variations and correlation of one allele with P-glycoprotein expression and activity in vivo. Proc. Natl. Acad. Sci. U.S.A. 97, 3473–3478 (2000).
22. Ieiri, I. et al. SLCO1B1 (OATP1B1, an uptake transporter) and ABCG2 (BCRP, an e%ux transporter) variant alleles and pharmacokinetics of pitavastatin in healthy volunteers. Clin. Pharmacol. Ther. 82, 541–547 (2007).
23. Niemi, M. et al. High plasma pravastatin concentrations are associated with single nucleotide polymorphisms and haplotypes of organic anion transporting polypeptide-C (OATP-C, SLCO1B1). Pharmacogenetics 14, 429–440 (2004).
24. Hedman, M. et al. Pharmacokinetics and response to pravastatin in paediatric patients with familial hypercholesterolaemia and in paediatric cardiac transplant recipients in relation to polymorphisms of the SLCO1B1 and ABCB1 genes. Br. J. Clin. Pharmacol. 61, 706–715 (2006).
25. Pasanen, M.K., Fredrikson, H., Neuvonen, P.J. & Niemi, M. Di$erent e$ects of SLCO1B1 polymorphism on the pharmacokinetics of atorvastatin and rosuvastatin. Clin. Pharmacol. Ther. 82, 726–733 (2007).
26. Kameyama, Y., Yamashita, K., Kobayashi, K., Hosokawa, M. & Chiba, K. Functional characterization of SLCO1B1 (OATP-C) variants, SLCO1B1*5, SLCO1B1*15 and SLCO1B1*15+C1007G, by using transient expression systems of HeLa and HEK293 cells. Pharmacogenet. Genomics 15, 513–522 (2005).
27. Kantola, T., Kivistö, K.T. & Neuvonen, P.J. E$ect of itraconazole on the pharmacokinetics of atorvastatin. Clin. Pharmacol. Ther. 64, 58–65 (1998).
28. Kearney, A.S., Crawford, L.F., Mehta, S.C. & Radebaugh, G.W. The interconversion kinetics, equilibrium, and solubilities of the lactone and hydroxyacid forms of the HMG-CoA reductase inhibitor, CI-981. Pharm. Res. 10, 1461–1465 (1993).
29. Lennernäs, H. Clinical pharmacokinetics of atorvastatin. Clin. Pharmacokinet. 42, 1141–1160 (2003).
30. Wu, X., Whit#eld, L.R. & Stewart, B.H. Atorvastatin transport in the Caco-2 cell model: contributions of P-glycoprotein and the proton-monocarboxylic acid co-transporter. Pharm. Res. 17, 209–215 (2000).
31. Hermann, M., Asberg, A., Christensen, H., Holdaas, H., Hartmann, A. & Reubsaet, J.L. Substantially elevated levels of atorvastatin and metabolites in cyclosporine-treated renal transplant recipients. Clin. Pharmacol. Ther. 76, 388–391 (2004).
32. Lilja, J.J., Kivistö, K.T. & Neuvonen, P.J. Grapefruit juice increases serum concentrations of atorvastatin and has no e$ect on pravastatin. Clin. Pharmacol. Ther. 66, 118–127 (1999).
33. Amundsen, R., Christensen, H., Zabihyan, B. & Asberg, A. Cyclosporine A, but not tacrolimus, shows relevant inhibition of organic anion-transporting protein 1B1-mediated transport of atorvastatin. Drug Metab. Dispos. 38, 1499–1504 (2010).
34. Chen, C. et al. Di$erential interaction of 3-hydroxy-3-methylglutaryl-coa reductase inhibitors with ABCB1, ABCC2, and OATP1B1. Drug Metab. Dispos. 33, 537–546 (2005).
35. Jacobsen, W. et al. Lactonization is the critical #rst step in the disposition of the 3-hydroxy-3-methylglutaryl-CoA reductase inhibitor atorvastatin. Drug Metab. Dispos. 28, 1369–1378 (2000).
36. Tirona, R.G., Leake, B.F., Merino, G. & Kim, R.B. Polymorphisms in OATP-C: identi#cation of multiple allelic variants associated with altered transport activity among European- and African-Americans. J. Biol. Chem. 276, 35669–35675 (2001).
37. Skottheim, I.B., Gedde-Dahl, A., Hejazifar, S., Hoel, K. & Asberg, A. Statin induced myotoxicity: the lactone forms are more potent than the acid forms in human skeletal muscle cells in vitro. Eur. J. Pharm. Sci. 33, 317–325 (2008).
38. Obesity: preventing and managing the global epidemic. Report of a WHO consultation. World Health Organ. Tech. Rep. Ser. 894, i–xii, 1–253 (2000).
39. Barness, L.A., Opitz, J.M. & Gilbert-Barness, E. Obesity: genetic, molecular, and environmental aspects. Am. J. Med. Genet. A 143A, 3016–3034 (2007).
40. Cheng, P.Y. & Morgan, E.T. Hepatic cytochrome P450 regulation in disease states. Curr. Drug Metab. 2, 165–183 (2001).
41. Greenblatt, D.J., Abernethy, D.R., Locniskar, A., Harmatz, J.S., Limjuco, R.A. & Shader, R.I. E$ect of age, gender, and obesity on midazolam kinetics. Anesthesiology 61, 27–35 (1984).
42. Berggren, S. et al. Gene and protein expression of P-glycoprotein, MRP1, MRP2, and CYP3A4 in the small and large human intestine. Mol. Pharm. 4, 252–257 (2007).
43. Canaparo, R. et al. Expression of cytochromes P450 3A and P-glycoprotein in human large intestine in paired tumour and normal samples. Basic Clin. Pharmacol. Toxicol. 100, 240–248 (2007).
44. Bruyere, A. et al. E$ect of variations in the amounts of P-glycoprotein (ABCB1), BCRP (ABCG2) and CYP3A4 along the human small intestine on PBPK models for predicting intestinal #rst pass. Mol. Pharm. 7, 1596–1607 (2010).
45. de Waziers, I., Cugnenc, P.H., Yang, C.S., Leroux, J.P. & Beaune, P.H. Cytochrome P 450 isoenzymes, epoxide hydrolase and glutathione transferases in rat and human hepatic and extrahepatic tissues. J. Pharmacol. Exp. Ther. 253, 387–394 (1990).
46. Kolars, J.C. et al. CYP3A gene expression in human gut epithelium. Pharmacogenetics 4, 247–259 (1994).
47. Bradford, M.M. A rapid and sensitive method for the quantitation of microgram quantities of protein utilizing the principle of protein-dye binding. Anal. Biochem. 72, 248–254 (1976).
48. Bremer, S., Rootwelt, H. & Bergan, S. Real-time PCR determination of IMPDH1 and IMPDH2 expression in blood cells. Clin. Chem. 53, 1023–1029 (2007).
49. Ulvestad, M., Björquist, P., Molden, E., Asberg, A. & Andersson, T.B. OATP1B1/1B3 activity in plated primary human hepatocytes over time in culture. Biochem. Pharmacol. 82, 1219–1226 (2011).
50. Darwich, A.S., Neuho$, S., Jamei, M. & Rostami-Hodjegan, A. Interplay of metabolism and transport in determining oral drug absorption and gut wall metabolism: a simulation assessment using the “Advanced Dissolution, Absorption, Metabolism (ADAM)” model. Curr. Drug Metab. 11, 716–729 (2010).
282 VOLUME 93 NUMBER 3 | MARCH 2013 | www.nature.com/cpt