Impact of Corporate Diversification on the Market Value of Firms: A study of Deposit Money Banks...
11
European Journal of Business and Management www.iiste.org ISSN 2222-1905 (Paper) ISSN 2222-2839 (Online) Vol 4, No.8, 2012 47 Impact of Corporate Diversification on the Market Value of Firms: A study of Deposit Money Banks Nigerian Ugwuanyi Georgina Obinne Ph.D 1 Ani Wilson UchennaPh.D 2 Ugwu Joy Nonye Ph.D 3 Ugwunta David Okelue M.Sc 4 * 1. Department of Accountancy, Institute of Management and Technology Enugu, Enugu State, Nigeria. 2. Department of Accountancy, Institute of Management and Technology Enugu, Enugu State, Nigeria. 3. Department of Business Administration, Institute of Management and Technology Enugu, Enugu State, Nigeria. 4. Department of Banking and Finance, Renaissance University Ugbawka, Enugu State, Nigeria. * E-mail of the corresponding author: [email protected] Abstract This paper investigates the impact of diversification on banks market value. Many studies have been conducted on the effect of diversification on firm value. From a theoretical view point, it is commonly accepted that if the costs of diversification exceed its benefits, the market will discount the share price of diversified firms. The paper hypothesized that diversification does not impact significantly on market value of banks in Nigeria. Adopting an Ex- post facto research design and applying OLS, the regression results at 5% significant level of significance rejected the null hypothesis and thereby accepting the alternate. This suggests that corporate diversification impacts significantly on the market value of banks, implying that diversification in Nigerian banks impacts significantly on the market value of the diversified banks. Keywords: Diversification; market value; regression; banks. 1. Introduction Many studies have been conducted on the effect of diversification on firm value. Even theoretical arguments still suggest that diversification has both value-enhancing (benefits) and value reducing (costs) effects. From a theoretical view point, it is commonly accepted that if the costs of diversification exceed its benefits, the market will discount the share price of diversified firms (Boubaker, et. al., 2001). Empirically, however, results of prior researches are rather inconclusive. Indeed, several works suggested that diversified firms create value tanks to economies of scale, greater debt capacity, greater debt capacity due to risk reduction and a great number of profitable activities (Stein, 1997). These diversified firms are said to be more profitable because of their ability to pool internally generated funds and allocate them properly; and such efficient allocation of resources and economies of scale are expected to have a positive impact on valuation (Stein, 1997; Teece 1990). Based on a similar argument, Meyer, et. al., (1992) argued that a failing firm when standing alone cannot have a value less than zero but under the conglomerate structure the failing firm might have a negative value. The profitable division(s) carrying the failing division(s) will ultimately reduce the value of the conglomerate. In contrast, other studies document value losses following corporate diversification; for instance, Berger and Ofek (1995) reported that the value loss is smaller when the segments of the diversified firms are in related industries. Recent studies focusing on the data of various developed countries generally reach similar results (Mansi and Rebb, 2002; Denis, et. al.2002, Barnes and Hardie – Brown, 2006). In emerging markets, Lins and Servaes (2002) also found that diversified firms trade at a discount of approximately 7% compared with single –segment firms and they are also less profitable than single-segment firms. The results of Chakrabarti, et. al., (2007) for East Asian firms are somewhat mitigated because diversification negatively impacts performance in more developed institutional environments while improving performance in the least developed environments. As far as the firm size is concerned, the majority of previous studies assess that the size of a firm has many effects on its performance, and indirectly on its growth opportunities and share prices. These benefits from diversification which increase the value of a diversified firm may arise from many sources such as: - From management economies of scale as proposed by Chandler (1977);
Transcript of Impact of Corporate Diversification on the Market Value of Firms: A study of Deposit Money Banks...
European Journal of Business and Management www.iiste.org
ISSN 2222-1905 (Paper) ISSN 2222-2839 (Online)
Vol 4, No.8, 2012
47
Impact of Corporate Diversification on the Market Value of Firms:
A study of Deposit Money Banks Nigerian
Ugwuanyi Georgina Obinne Ph.D1 Ani Wilson UchennaPh.D
2 Ugwu Joy Nonye Ph.D
3 Ugwunta David Okelue
M.Sc4*
1. Department of Accountancy, Institute of Management and Technology Enugu, Enugu State, Nigeria.
2. Department of Accountancy, Institute of Management and Technology Enugu, Enugu State, Nigeria.
3. Department of Business Administration, Institute of Management and Technology Enugu, Enugu State,
Nigeria.
4. Department of Banking and Finance, Renaissance University Ugbawka, Enugu State, Nigeria.
* E-mail of the corresponding author: [email protected]
Abstract
This paper investigates the impact of diversification on banks market value. Many studies have been conducted on
the effect of diversification on firm value. From a theoretical view point, it is commonly accepted that if the costs of
diversification exceed its benefits, the market will discount the share price of diversified firms. The paper
hypothesized that diversification does not impact significantly on market value of banks in Nigeria. Adopting an Ex-
post facto research design and applying OLS, the regression results at 5% significant level of significance rejected
the null hypothesis and thereby accepting the alternate. This suggests that corporate diversification impacts
significantly on the market value of banks, implying that diversification in Nigerian banks impacts significantly on
the market value of the diversified banks.
Keywords: Diversification; market value; regression; banks.
1. Introduction
Many studies have been conducted on the effect of diversification on firm value. Even theoretical arguments still
suggest that diversification has both value-enhancing (benefits) and value reducing (costs) effects. From a theoretical
view point, it is commonly accepted that if the costs of diversification exceed its benefits, the market will discount
the share price of diversified firms (Boubaker, et. al., 2001). Empirically, however, results of prior researches are
rather inconclusive. Indeed, several works suggested that diversified firms create value tanks to economies of scale,
greater debt capacity, greater debt capacity due to risk reduction and a great number of profitable activities (Stein,
1997). These diversified firms are said to be more profitable because of their ability to pool internally generated
funds and allocate them properly; and such efficient allocation of resources and economies of scale are expected to
have a positive impact on valuation (Stein, 1997; Teece 1990). Based on a similar argument, Meyer, et. al., (1992)
argued that a failing firm when standing alone cannot have a value less than zero but under the conglomerate
structure the failing firm might have a negative value. The profitable division(s) carrying the failing division(s) will
ultimately reduce the value of the conglomerate. In contrast, other studies document value losses following corporate
diversification; for instance, Berger and Ofek (1995) reported that the value loss is smaller when the segments of the
diversified firms are in related industries. Recent studies focusing on the data of various developed countries
generally reach similar results (Mansi and Rebb, 2002; Denis, et. al.2002, Barnes and Hardie – Brown, 2006). In
emerging markets, Lins and Servaes (2002) also found that diversified firms trade at a discount of approximately 7%
compared with single –segment firms and they are also less profitable than single-segment firms.
The results of Chakrabarti, et. al., (2007) for East Asian firms are somewhat mitigated because diversification
negatively impacts performance in more developed institutional environments while improving performance in the
least developed environments. As far as the firm size is concerned, the majority of previous studies assess that the
size of a firm has many effects on its performance, and indirectly on its growth opportunities and share prices. These
benefits from diversification which increase the value of a diversified firm may arise from many sources such as:
- From management economies of scale as proposed by Chandler (1977);

European Journal of Business and Management www.iiste.org
ISSN 2222-1905 (Paper) ISSN 2222-2839 (Online)
Vol 4, No.8, 2012
48
- More efficient resource allocation through internal capital markets by Stulz (1990) and Stein
(1997);
- Diversified firm’s ability to internalize market failures evidenced by Khanna and Palepu (2000); or
- Higher productivity of diversified firms suggested by Schoar (2002).
There are also many sources from which costs of diversification, which reduce the value of a diversified firm, may
arise such as from:
- Inefficient allocation of capital among divisions of a diversified firm (Lamont and Polk, 2001;
Scharfstein and Stein, 2000; Rajan, et. al., 2000);
- Agency problems in a diversified firm can also generate costs of diversification.
Given the above, this paper tends to explore the effect of corporate diversification on the market value of firms while
concentrating on the banking industry. Based on this, some critical questions need to be asked and answered by this
paper. Such questions include: Has bank diversification affected the market value of Nigeria banks in any way? The
objective of this paper is to investigate the impact of diversification on banks market value; and the paper
hypothesizes Diversification does not impact significantly on market value of banks.
The rest of the paper is divided into four sections. Section 2 highlights the review of related literature.
Methodological issues are the concern of section 3. Section 4 is devoted to presentation of the data and results. We
present conclusions in section 5.
2. Review of Related Literature.
Lang and Stulz (1994) shows Tobin’s q, a surrogate for a firm value, and firm diversification are negatively related
through the 1980’s. They also show that diversified firms have lower q’s than comparable portfolios of pure play
firms; and firms that choose diversification are poor performers relative to firms that do not. Berger and Ofek (1995)
also finds a value loss from diversification (about 15 percent loss) in 1980’s, while Servaes (1996) finds a
diversification loss in the 1960’s, and a lesser extent in the 1970,s
Using an econometric technique that remedies the measurement error problem in Tobin’s q, Whited (2001) finds no
evidence of inefficient capital allocations in diversified firms and in value reductions by diversifications. Mansi and
Rebb (2002) also find that diversification is insignificantly related to excess firm value. Thus, value discount by
diversification in many studies may be artifacts of measurement errors in using Tobin’s q as a firm value proxy. In
sum, results from previous studies on the diversification effect are neither consistent nor conclusive, which may be
due to econometric problems (Li and Jin, 2006). In line with the above studies, Li and Jin, (2006) investigated the
marginal effect of diversification on firm returns (in the chemical and oil industry) by resolving these econometric
problems and controlling for influencing factors on returns other than diversification. Three-factor asset pricing
models developed by Fama and French (1996) are used to avoid these econometric problems and control for other
influencing factors on equity returns. Among independent variables in the model is market return (market effect),
firm size (industry effect) and effect of endogenous variables (e.g. book value to market value) of a sample firm that
lead the firm to decide to diversify or focus on stock returns. These regression models were estimated in chemical
industry and oil industry, separately to control for the effect of industry specific characteristics on firm returns. The
findings revealed that diversified firms have significantly higher returns than focused firms in both chemical and oil
industries. It may be because the investor in the market view diversified firm riskier than focused firm and hence
expect higher rate of return on invest in diversified firms than in the pure-play firms. As a result the value of a
diversified firm is discounted upon acquisition of new division to preserve the higher rate of returns on investment in
diversified firms. The results are robust across different diversification measures, methodologies and industries.
Some researchers have argued that diversification increases the information asymmetry between managers and
shareholders (Harris, et. al., 1982). They contend that increased diversification makes it more difficult to get
information about the firm. So, information asymmetry costs are higher in conglomerates than in more focused firms.
Examination of the relationship between information asymmetry and market reaction to the announcement of
seasoned equity offerings reveals that as the level of information asymmetry increases, the greater is the value loss to
the firm (Dierkens, 1991). In a more recent work, Karim, et. al., (2000) documented that market reaction to seasoned
equity offering is consistently negatively related to the level of information asymmetry.

European Journal of Business and Management www.iiste.org
ISSN 2222-1905 (Paper) ISSN 2222-2839 (Online)
Vol 4, No.8, 2012
49
Fee and Thomas (1999) studied the effect of corporate diversification on firm value based on asymmetric
information. In this study, Fee and Thomas (1999), investigated-comparing stock market based measures of
asymmetric information for diversified firms with those they could reasonably expect to exhibit if they were split
along industry lines into separately traded entities. Their findings revealed that approximately 74% of the diversified
firms in their sample have less severe asymmetric information problems as conglomerates than they could expect to
experience as separately traded pure-play firms. They also found evidence that diversified firms with low levels of
information asymmetric trade at significant diversification discounts.
Amihud and Lev (1981) mentioned that managers prefer diversification in order to protect the value of their human
capital. In the context of both Jensen’s (1986) free “cash flow theory and ‘agency theory’, managers’ benefit from
managing larger, diversified firms since such firms have relatively larger debt capacity. So, the management might
tend to indulge them in value decreasing investment projects (Berger and Ofek, 1995). Agency problems resulting
from sub-optimal behaviour of divisional managers (agents) for the firm as a whole may occur in a diversified firm
due to opportunistic behaviour of divisional managers, informational asymmetries between central management and
divisional managers, and the difficulty of designing optimal incentive compensation scheme to eliminate agency
costs (Denis, et. al., 2002; Aggarwal and Samwick, 2003).
Anderson, et. al., (2000), equally made a study on corporate governance and firms diversification. They empirically
investigated whether corporate governance structure is different between focused and diversified firms, and whether
any differences in corporate governance are associated with the value loss from diversification. Their findings reveal
that relative to focused firms, CEOS in diversified firms have lower stock ownership and lower pay-for-performance
sensitivities. Diversified companies, however, have more outside directors, no difference in independent block-
holdings, and sensitivity of CEO turnover to performance similar to that in single-segment firms. Moreover, they
found no compelling evidence that internal governance failures are associated with the decision to diversify, or that
governance characteristics explain the value loss from diversification. These their findings argue that the structure of
corporate governance varies systematically with the degree of diversification and suggest that diversified firms use
alternative governance mechanisms as substitute for low pay-for-performance sensitivities and CEO ownership.
They concluded that agency costs do not provide a complete explanation for the magnitude and persistence of the
diversification discount. They therefore added to the existing literature on “diversification and firm performance by
providing a comprehensive analysis of differences in the overall structure of corporate governance between
diversified and focused firms, and addressing how these differences are related to firm performance since most prior
studies have focused on a single governance characteristic.
3. Methodological Framework.
This paper employed the Ex-post facto research design. Onwumere (2009:113) opined that Ex-post facto research
involves events that have already taken place (already exists) and as such no attempt was made to control or
manipulate relevant independent and dependent variables. Also, an analytical research, all manners of tools
(mathematical, econometric, statistical etc,) were employed in the appraisal of data with the aim of establishing
relationships (Onwumere, 2009:42). The population of this study is presumed to cover the twenty five (25) banks
which emerged (out of 89 banks) having met the minimum capitalization requirement, at the close of the first phase
of the consolidation programme on 31st December, 2005 but for the analysis, eighteen (18) banks selected through
the Yaro Yamane (1964) formula constitutes our sample. The study relied on historic accounting data generated from
financial (annual) reports and accounts of sampled banks between the period 1998 and 2007 (a ten-year period).
3.1 The Test Statistic
To test the hypothesis which states that diversification does not impact significantly on market value of banks, two
model equations were used. The first model equation used is written below:
Evit, = βo + β1 ODi,t + β2GDi,t + β3LogTA + β4LRi,t + β50Ei,t + цi,t ……………………. …(1)
Where: Evi,t = Excess value of banki at time t..
OD = Operational Diversification
GD = Geographical Diversification

European Journal of Business and Management www.iiste.org
ISSN 2222-1905 (Paper) ISSN 2222-2839 (Online)
Vol 4, No.8, 2012
50
LogTA = Log of Total Assets
LR = Liquidity Ratio
OE = Operational Efficiency
βo = Constant of regression
β1 - β5 = Coefficients of the independent variables
µ = The stochastic error term.
The second model equation to test the above hypothesis is as written below:
Ev = bo + b1 DD + b2 LogTA + b3 CEGI + b4 GD + b5 OIGI + ε ………………………….(2)
Where Ev = Excess value
DD = Diversification Dummy
LogTA = Log of Total Assets
CEGI = ratio of Capital expenditure to Gross – income.
GD = Geographical Diversification
OIGI = Ratio of operational income To Gross income
bo = constant of regression
b1 = b5 = coefficients of the independent variables
ε = the stochiastic error term
The essence of using these two model equations, equation 1 and equation 2 in regressing for Excess value in this
work is to check for the fitness of the modified form (equation 2) of Berger and Ofek (1995) and Lins and Servaes
(2002). The modification of the equation3.1 is purposely for it to suit this work which is focused on institutions
offering financial services while the researches of the Berger and Ofek (1995), and Lins and Servaes (2002) were
based on non- financial firms.
3.1 The Test Variables
Firm Valuation Measures: According to Wild et al (2004:603), the two widely cited valuation measures are the price-
to-book (PB) and price-to-earnings (PE) ratios and users often base investment decisions on the observed values of
these ratios. These PB and P/E ratios are as such called fundamental ratios. For companies whose shares are not
traded in active markets, the fundamental ratios serve as a means for estimating equity value. The formulae for these
ratios are:
(i) Price-to-book (PB) Ratio = Market Value of equity ……………………… 3.
Book Value of equity
(ii) Price-to-Earnings Ratio = Market Value of equity ……………………...... 4.
Net Income
OR
P/E = Market Value Per Share ……………………………………. 5.
Earnings per share
Other measures that past researchers had used in measuring value of firms are return on Total Assets, Percentage
growth rate in Total Assets and Excess Value of the firm. This percentage growth Rate in Total Assets can be
expressed as:
Percentage Growth Rate in Total Assets = Current Value of Assets minus Base Value of Assets x 100 … 6.
Base Value of Assets
All these value measurement instruments were used in this research in one way or the other. In using the % growth

European Journal of Business and Management www.iiste.org
ISSN 2222-1905 (Paper) ISSN 2222-2839 (Online)
Vol 4, No.8, 2012
51
rate in total Assets for the ten-year-period of this study, 1998 was used as a base year whereas the picking of the
current value of Total Assets started with 1999 year.
For the Excess Value, it is expressed in this study as Market Value Per share minus Book Value Per share. Whereas
the Book Value Per Share is obtained from Net Profit Value After Tax divided by the number of Outstanding shares
i.e
Book Value per share = Net Value After Tax …………………… 7.
The Number of Outstanding shares
Liquidity Ratio: This is defined as the ratio of Total specified liquid assets to Total Current liabilities of each bank
which must be held by the bank. It can be calculated thus:
Liquidity Ratio = Total Specified Liquid Assets …………………………………….. 8.
Total current liabilities
Firm size: Although there exist two measures of firm size – namely Total Assets and Turnover (Pandey, 2004:85,
Barclay and Smith 1996:16), this research adopts Total Assets for firm size.
Thus firm size = Average level of log of Total Assets (log TA)……….…………….. 9.
Because firm (bank) size and excess value may be correlated (Morck, Shleifer and Vishny, 1988) we include firm
(bank) size, which we measure by total assets as a control variable in all our models.
Operational efficiency: According to Wild et al (2004) and Pandey (2004), a good measure of operational efficiency
is the ratio of expenditure (operating expenses) to income.
OE = Operational Expenses ………………………………………………………….. 10.
Income
In this paper just as in Lin and Serveas (20002), the operational efficiency has been proxied by capital expenditure to
Gross income
That is, OE = Capital expenditure …………………………………………………. … 11.
Gross income
Ownership: Two main sets of ownership characteristics are adopted in the general regression models: Firstly, in
terms of Operational diversification (OD) or diversification dummy (DD) whereby an indicator variable is set equal
to one if the bank has subsidiaries/Affiliates; and/or conducts GROUP ANNUAL reports and accounts but equal to
zero if the bank has no subsidiaries/Affiliates and thus has only the ‘BANK’ annual reports and accounts. Secondly,
in terms of Geographical diversification (GD) an indicator variable is set equal to one if the bank has dominant
foreign interest (51% and above) but equal to zero for banks with dominant local interests.
4. Findings
Test for Hypothesis.
H0 Diversification does not impact significantly on market value of banks.
HA Diversification impacts significantly on market value of banks.
This hypothesis was tested using two model equations:
(a) The first model equation used is as follows:
Evit = β0 + β1 ODi,t + β2 GDi, t + β3 logTai,t + β4 LRi,t + β5 0Ei,t + µI,t ……………………. (1)
Excess value is the dependent variable. Evi,t = Excess value of bank i at time t and the other variables are as defined
above.
The regression results in table 1 shows that the regression is significant at 5 percent level of significance. Thus, the
null hypothesis is rejected thereby accepting. As per the influence of the variables, the coefficient of the geographical
diversification remains significantly positive meaning a positive relationship between internationalization and bank
value whereas operational diversification was significantly negative. The result for operational efficiency under
European Journal of Business and Management www.iiste.org
ISSN 2222-1905 (Paper) ISSN 2222-2839 (Online)
Vol 4, No.8, 2012
52
Panel Model was positive but non-significant. This is equally an indication that not all the banks included in the
study sample had the same level of efficiency, and hence value. Some might actually be inefficient. For both models,
also, loan-to-deposit ratio proves to have positive but non-significant relationship with bank performance. The non-
significance nature of the coefficient of loan-to-deposit ratio is understandable especially considering the high
volume of non-performing credits carried by the banks during the periods covered in this study. In terms of the R2
value, the results show that about 10.8 to 11.5 percent of the changes in the performance of a bank can be explained
by changes in the levels of operating efficiency, geographical and operational diversifications, and loan-to-deposit
ratio. The results are not also by chance considering the probability of F-value at just 0.00 percent.
The second model equation is the modified form of multiple linear regression equation used by Berger and Ofek
(1995) Lins and Servaes (2002) which is shown below and as defined in section three:
Ev = bo + bi DD +b2 logTA +b3 CEGI + b4 GD + b5 OIGI + e ………………..(2)
The individual parameters of the regression model are tested through t-test for parameters.
For the analysis Excess Value is defined thus:
Where the imputed market value is obtained as the median actual market value of stand-alone banks times the actual
market value of diversified banks. No restriction is given to excess values; all the excess values that were obtained
were used in the analysis. The regression results are described thus.
The ANOVA in table 3 tests the acceptability of the model from a statistical perspective. The Regression row
displays information about the variation accounted for by the model. The Residual row displays information about
the variation that is not accounted for by the model. The regression and residual sums of squares are not equal, which
indicates that about 90% of the variation in excess value is explained by the model. The significant value of the F
statistic is less than 0.05 and to be more precise is 0.00: which means that the variation explained by the model is not
due to chance. While the ANOVA table is a useful test of the model's ability to explain any variation in the dependent
variable, it does not directly address the strength of that relationship.
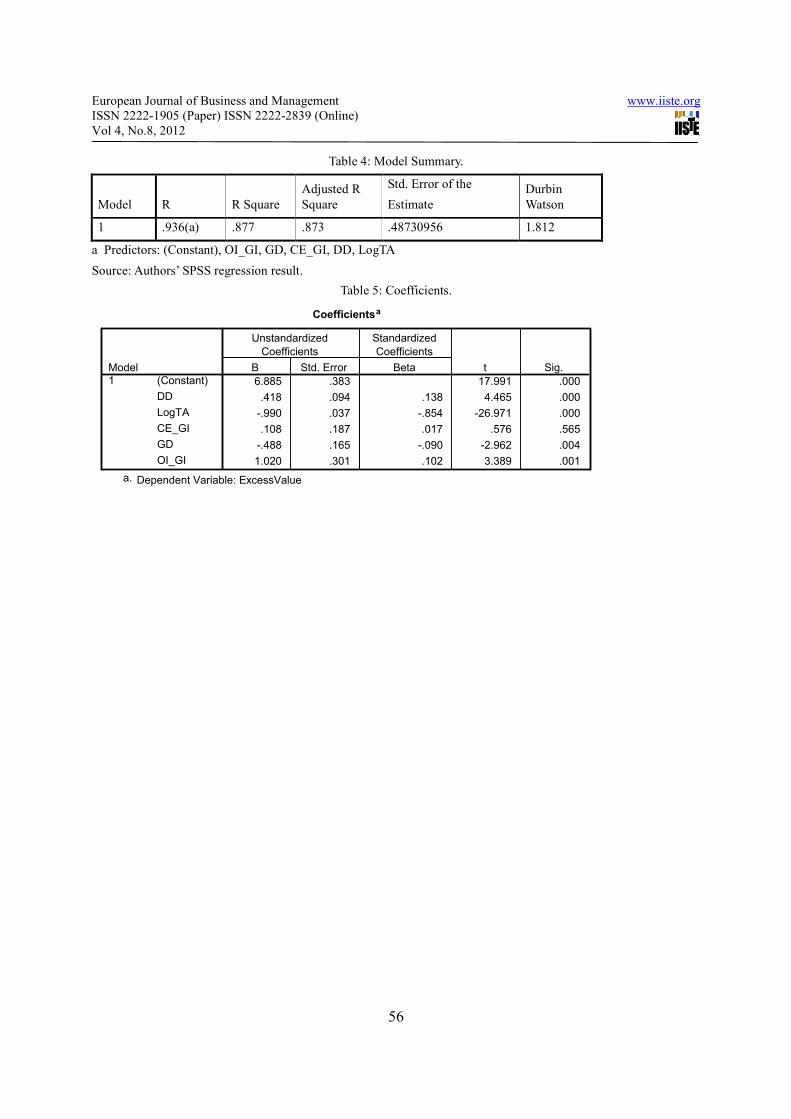
The model summary table (table 4) reports the strength of the relationship between the model and the dependent
variable. R, the multiple correlation coefficients is the linear correlation between the observed and model-predicted
values of the dependent variable = .936. This indicates a strong relationship. R Square, the coefficient of
determination, is the squared value of the multiple correlation coefficients = .88. It shows that about 88% of the
variation in excess value is explained by the model. Equally, the work relied on the adjusted coefficient of the
multiple determinants because of the number (five) of explanatory variables used in the study. This is to harmonize
the numerator with the denominator in the coefficient formula. Accordingly from Table 4, adjusted coefficient =
87.3% and indicates that 87.3% of changes in the dependent variable (Excess Value) are explained by change in the
five explanatory variables in the model. This is a high value and can be relied upon as a proper fit for the model.
Although the model fit looks positive in table 5, the coefficients shows that (CEGI) ratio of Capital expenditure to
Gross – income in the model is not significant and does not impact on the dependent variable (Excess Value). All
other predictor variables have significant coefficients as follows: at .000 for total assets and the ratio of capital
expenditure to gross expenditure each; .004 and 001 for Geographical Diversification and Ratio of operational
income To Gross income respectively. These indicates that the explanatory variables contributed to the model and
impacts on the value of banks.
With reference to the analytical results obtained in the two regression results above, the hypothesis that
diversification does not impact significantly on market value of banks is rejected, thereby accepting the alternate.
This then implies that diversification impacts significantly on market value of banks.
5. Conclusion
The objective of this research is to investigate the impact of diversification on banks market values and was
achieved. Here the regression results is significant at 5 percent level of significance, thus the null hypothesis is
rejected and thereby accepting the alternate. This means that diversification in Nigerian Deposit Money Banks
impacts significantly on the market value of such banks. The benefits from diversification which increases the value
logactual market value
Excess valueimputed market value
=
European Journal of Business and Management www.iiste.org
ISSN 2222-1905 (Paper) ISSN 2222-2839 (Online)
Vol 4, No.8, 2012
53
of a diversified firm may arise from many sources such as: from management economies of scale as proposed by
Chandler (1977); more efficient resource allocation through internal capital markets as opined by (Stulz, 1990, and
Stein, 1997); diversified firm’s ability to internalize market failures (Khanna and Palepu, 2000); or higher
productivity of diversified firms as suggested by (Schoar, 2002).
References
Aggarwal, R. and Samwick, A. A. (2003). “Why do Managers Diversify their Firms? Agency Reconsidered”,
Journal of Finance, Vol. 58; 71 - 118.
Amihud. Y. and Lev, B. (1981). “Risk Reduction as Managerial Motive for Conglomerate Mergers”, The Bell
Journal of Economics 12, 605 – 617.
Anderson, R. C.; Thomas, W. B., John, M. B. , and Michael, L. L. (2000). Corporate Governance and Firm
Diversification. Financial Management (Financial Management Association) 29, 5 – 22.
Anyanwaokoro, M. (1996). Banking Methods and Processes, Enugu: Hosanna Publication
Barnes, E.; and Hardie – Brown, G. (2006). “The Diversification Puzzle: Revisiting the Value Impact of
Diversification for UK Firms” Journal of Business Finance & Accounting 33, 1508 – 1534.
Berger, P. and Ofek, E. (1995). “Diversification’s Effect on Firm Value”, New York: Journal of Financial
Economics 37, 39 – 65.
Boubaker, A., Mensi, W. and Nguyen, D. K. (2008). “More on Corporate Diversification, Firm Size and Value
Creation”, Economics Bulletin, Vol. 7, No. 3, 1-7 URL: http://economicsbulletin.vanderbilt.edu/2008/volume7/EB-
07G30007A.pdf Retrieved on 4/5/08
Chakrabarti, A., Singh, K. and Mahmood, I. (2007). “Diversification and Performance: Evidence from East Asian
Firm’s” Strategic Management Journal 28, 101 – 120.
Chandler, A. (1977): The Visible Hand, Belknap Press, Cambridge, M. A.
Denis, D. J., Denis, D. K. and Yost, K. (2002). “Global Diversification, Industrial Diversification, and Firm
Value”, Journal of Finance, Vol. 57, 1951 – 79.
Dierkens, N. (1991). “Information Asymmetry and Equity Issues”, Journal of Financial and Quantitative
Analysis 26, 181 – 200.
Fama, E. F. and French, K. R. (1996). “Multi-factor Explanations of Asset Pricing Anomalies”, Journals of Finance,
Vol. 57, 55 – 84.
Fee, C. E. and Thomas, S. (1999). Corporate Diversification, Asymmetric Information, and Firm Value: Evidence
from Stock Market Trading Characteristics. filst://c:\DocuME~1,\MEKDIV~1\LOCALS~1\TEMP\RCFRBX6M.htm
. Retrieved on 230/3/07
Harris, M., Kriebel, C. H. and Raviv, A. (1982). “Asymmetric Information, Incentives and Intra-Firm Resource
Allocation”, Management Science, 604 – 620.
Jensen, M. C. (1986). Agency Costs of Free Cash Flow, Corporate Finance and Takeovers”, American
Economic Review 76, 323 – 339.
Karim, K., Ahmed, M. U. and Rutledge, R. W. (2000). The Impact of Growth Opportunities versus
Information Asymmetry on Seasoned Equity Offerings: Some Empirical Evidence”, Advances in Quantitative
Analysis of Finance and Accounting 8, 25 – 44.
Khanna, T. and Palepu, K. (2000). “Is Group Affiliation Profitable in Emerging Markets”, An Analysis of
Diversified Indian Business Groups”, Journal of Finance 55, 867 – 891.
Lamont, O. A; and Polk, C. (2001). “Diversification Discount: Cash Flows Vs Returns”, Journal of Finance, Vol.
56, 1693 – 721.
Lang, L. and Stulz, R. (1994). “Tobin’s G; Corporate Diversification, and Firm Performance”, Journal of Political
Economy Vol. 102, 1248 – 80.

European Journal of Business and Management www.iiste.org
ISSN 2222-1905 (Paper) ISSN 2222-2839 (Online)
Vol 4, No.8, 2012
54
Li, D. and Jin, J. (2006). The Effect of Diversification on Firm Returns in Chemical and Oil
Industries”. Review of Accounting and Finance, Emerald Group Publishing Ltd. Vol. 5, No. 1, 20 – 29.
Lins, V. K. V. and Serveas, H. (2002). “Is Corporate Diversification Beneficial in emerging Markets? Finance
Management, Vol. 31, 5 - 31 Issue 2.
Mansi, S. and Rebb, D. M. (2002). Corporate Diversification: what Gets Discounted? Journal of Finance 57, 2167
– 2183.
Meyer, M., Milgron, P. and Roberts, J. (1992): “Organizational Projects, Influence Costs, and Ownership
Changes”, Journal of Economics and Management Strategy 1, 9 – 35.
Onwumere, J. U. J. (2005). Business and Economic Research Methods, Lagos: Don-Vinton Limited.
Pandey, M. (2004). “Capital Structure, Profitability and Market Structure: Evidence from Malaysia” Asia Pacific”,
Journal of Economics and Business, 8(2)
Rajan, R., Servaes, H. and Zingales (2000). “The Theory of Diversity: the Diversification Discount and Inefficient
Investment”, Journal of Finance, Vol. 55, 35 – 80.
Servaes, H. (1996). “The Value of Diversification during the conglomerate Merger Wave”, Journal of Finance, Vol. 5
Scharfstein, D. and Stein, J. (2000). “The Darkside of Internal Capital Market II: Divisional Rent Setting and
Inefficient Investment”, Journal of Finance, Vol. 55 2537 – 67.
Schoar, A. (2002). “Effects of Corporate Diversification on Productivity”, Journal of Finance, Vol. 57, 2379 – 403.
Stein, J. C. (1997). “Internal Capital Markets and the Competition for Corporate Resources,” Journal of
Finance 52, 111 – 133.
Stulz, R. M. (1990). “Management Discretion and Optional Financing Policies”, Journal of Financial Economics 26,
3 – 27.
Teece, D. J. (1990). “Economics of Scope and the Scope of the Enterprise”. Journal of Economic Behaviour and
Organization, 1., 223 –247.
Whited, T. M. (2001). “Is it Inefficient Investment that Causes the Diversification Discount?”, Journal of Finance,
Vol. 56, 1667 – 91.
Wild, J. J., Subramanyam, K. R. and Halsey, R. F. (2004). Financial Statement Analysis, 8th
Ed. New York, McGraw
Hill.
Yamane, Yaro (1964) Statistics: An Introductory Analysis, New York: Hamper.

European Journal of Business and Management www.iiste.org
ISSN 2222-1905 (Paper) ISSN 2222-2839 (Online)
Vol 4, No.8, 2012
55
Table 1: Estimated coefficients for both Pooled and Panel Regression Models – with Excess Value as the
Endogenous Factor
Pooled Panel
Variables Co efficient t-value Coefficient t-value
Operating efficiency 0.254* 3.01 0.822* 2.18
Geographical Diversification 0.010 0.14 0.882* 2.71
Operational Diversification -0.119* -2.65* -0.632* -3.66
Liquidity ratio 0.999* 241.75* 0.020 1.04
Constant -0.177* -3.51 7.222* 37.81
R2 Within - - 0.123
Between - - 0.255 -
Overall 0.998 - 0.115 -
F-test 14,662.79 - 22.79 - -
Prob>F 0.000 - 0.000 -
No of observation 149 - 179 -
* Regression is significant at 5 percent level of significance.
Source: Authors SPSS computation.
Table 2: Descriptive Statistics
Mean Std. Deviation N
Excess Value .9273070 1.36482769 150
DD .72 .451 150
LogTA 7.0643558 1.17679398 150
CE_GI .3382433 .21769220 150
GD .07 .250 150
OI_GI .7163866 .13675944 150
Source: Authors SPSS result.
Table 3: The ANOVA
ANOVAb
243.355 5 48.671 204.956 .000a
34.196 144 .237
277.550 149
Regression
Residual
Total
Model
1
Sum of
Squares df Mean Square F Sig.
Predictors: (Constant), OI_GI, GD, CE_GI, DD, LogTAa.
Dependent Variable: ExcessValueb.
European Journal of Business and Management www.iiste.org
ISSN 2222-1905 (Paper) ISSN 2222-2839 (Online)
Vol 4, No.8, 2012
56
Table 4: Model Summary.
Model R R Square
Adjusted R
Square
Std. Error of the
Estimate
Durbin
Watson
1 .936(a) .877 .873 .48730956 1.812
a Predictors: (Constant), OI_GI, GD, CE_GI, DD, LogTA
Source: Authors’ SPSS regression result.
Table 5: Coefficients.
Coefficientsa
6.885 .383 17.991 .000
.418 .094 .138 4.465 .000
-.990 .037 -.854 -26.971 .000
.108 .187 .017 .576 .565
-.488 .165 -.090 -2.962 .004
1.020 .301 .102 3.389 .001
(Constant)
DD
LogTA
CE_GI
GD
OI_GI
Model
1
B Std. Error
Unstandardized
Coefficients
Beta
Standardized
Coefficients
t Sig.
Dependent Variable: ExcessValuea.

This academic article was published by The International Institute for Science,
Technology and Education (IISTE). The IISTE is a pioneer in the Open Access
Publishing service based in the U.S. and Europe. The aim of the institute is
Accelerating Global Knowledge Sharing.
More information about the publisher can be found in the IISTE’s homepage:
http://www.iiste.org
The IISTE is currently hosting more than 30 peer-reviewed academic journals and
collaborating with academic institutions around the world. Prospective authors of
IISTE journals can find the submission instruction on the following page:
http://www.iiste.org/Journals/
The IISTE editorial team promises to the review and publish all the qualified
submissions in a fast manner. All the journals articles are available online to the
readers all over the world without financial, legal, or technical barriers other than
those inseparable from gaining access to the internet itself. Printed version of the
journals is also available upon request of readers and authors.
IISTE Knowledge Sharing Partners
EBSCO, Index Copernicus, Ulrich's Periodicals Directory, JournalTOCS, PKP Open
Archives Harvester, Bielefeld Academic Search Engine, Elektronische
Zeitschriftenbibliothek EZB, Open J-Gate, OCLC WorldCat, Universe Digtial
Library , NewJour, Google Scholar