FEDERAL DEPOSIT INSURANCE CORPORATION ...
171
FEDERAL DEPOSIT INSURANCE CORPORATION Washington, D.C. 20429 FORM 10-K ANNUAL REPORT PURSUANT TO SECTION 13 OR 15(d) OF THE SECURITIES EXCHANGE ACT OF 1934 For the fiscal year ended December 31, 2020 FDIC Insurance Certificate Number: 35095 (Exact name of registrant as specified in its charter) VIRGINIA 54-1910608 (State or other jurisdiction of incorporation or organization) (I.R.S. Employer Identification Number) 5716 High Street, Portsmouth, VA 23703 (Address of principal executive offices) (Zip Code) (757) 638-7500 (Registrant's telephone number, including area code) Securities registered pursuant to Section 12(b) of the Act: Title of each class Trading Symbol(s) Name of each exchange on which registered Common Stock, par value $1.667 per share TOWN The Nasdaq Global Select Market Securities registered pursuant to Section 12(g) of the Act: None Indicate by check mark if the registrant is a well-known seasoned issuer, as defined in Rule 405 of the Securities Act. YES [ ] NO [ X ] Indicate by check mark if the registrant is not required to file reports pursuant to Section 13 or Section 15(d) of the Act. YES [ ] NO [ X ] Indicate by check mark whether the registrant (1) has filed all reports required to be filed by Section 13 or 15(d) of the Securities Exchange Act of 1934 during the preceding 12 months (or for such shorter period that the registrant was required to file such reports) and (2) has been subject to such filing requirements for the past 90 days. YES [ X ] NO [ ] Indicate by check mark whether the registrant has submitted electronically every Interactive Data File required to be submitted pursuant to Rule 405 of Regulation S-T (§232.405 of this chapter) during the preceding 12 months (or for such shorter period that the registrant was required to submit such files). YES [ ] NO [ ] Indicate by check mark whether the registrant is a large accelerated filer, an accelerated filer, a non-accelerated filer, smaller reporting company, or an emerging growth company. See the definitions of "large accelerated filer," "accelerated filer," "smaller reporting company," and "emerging growth company" in Rule 12b-2 of the Exchange Act. Large accelerated filer ý Accelerated filer o Non-accelerated filer o Smaller reporting company o Emerging growth company o If an emerging growth company, indicate by check mark if the registrant has elected not to use the extended transition period for complying with any new or revised financial accounting standards provided pursuant to Section 13(a) of the Exchange Act. o Indicate by check mark whether the registrant has filed a report on and attestation to its management's assessment of the effectiveness of its internal control over financial reporting under Section 404(b) of the Sarbanes-Oxley Act (15 U.S.C. 7262(b)) by the registered public accounting firm that prepared or issued its audit report. [ X ] Indicate by check mark whether the registrant is a shell company (as defined in Rule 12b-2 of the Exchange Act). YES [ ] NO [ X ] The aggregate market value of the common equity held by non-affiliates computed by reference to the price at which the common equity was last sold as of the last business day of the registrant's most recently completed second fiscal quarter was approximately $1.25 billion. Number of shares of common stock outstanding at February 19, 2021: 72,638,290 shares DOCUMENTS INCORPORATED BY REFERENCE (1) Portions of the Registrant's 2020 Annual Report to Shareholders are incorporated by reference into Parts I, II, and IV; and (2) Portions of the Registrant's 2021 Proxy Statement for its Annual Meeting of Shareholders to be held June 2, 2021, are incorporated by reference into Part III.
-
Upload
khangminh22 -
Category
Documents
-
view
0 -
download
0
Transcript of FEDERAL DEPOSIT INSURANCE CORPORATION ...

FEDERAL DEPOSIT INSURANCE CORPORATIONWashington, D.C. 20429
FORM 10-K
ANNUAL REPORT PURSUANT TO SECTION 13 OR 15(d) OF THESECURITIES EXCHANGE ACT OF 1934
For the fiscal year ended December 31, 2020
FDIC Insurance Certificate Number: 35095
(Exact name of registrant as specified in its charter)
VIRGINIA 54-1910608(State or other jurisdiction of incorporation or organization) (I.R.S. Employer Identification Number)
5716 High Street, Portsmouth, VA 23703(Address of principal executive offices) (Zip Code)
(757) 638-7500(Registrant's telephone number, including area code)
Securities registered pursuant to Section 12(b) of the Act:
Title of each class Trading Symbol(s) Name of each exchange on which registeredCommon Stock, par value $1.667 per share TOWN The Nasdaq Global Select Market
Securities registered pursuant to Section 12(g) of the Act:None
Indicate by check mark if the registrant is a well-known seasoned issuer, as defined in Rule 405 of the Securities Act. YES [ ] NO [ X ]
Indicate by check mark if the registrant is not required to file reports pursuant to Section 13 or Section 15(d) of the Act. YES [ ] NO [ X ]
Indicate by check mark whether the registrant (1) has filed all reports required to be filed by Section 13 or 15(d) of the Securities Exchange Act of 1934 during the preceding 12 months (or for such shorter period that the registrant was required to file such reports) and (2) has been subject to such filing requirements for the past 90 days. YES [ X ] NO [ ]
Indicate by check mark whether the registrant has submitted electronically every Interactive Data File required to be submitted pursuant to Rule 405 of Regulation S-T (§232.405 of this chapter) during the preceding 12 months (or for such shorter period that the registrant was required to submit such files). YES [ ] NO [ ]
Indicate by check mark whether the registrant is a large accelerated filer, an accelerated filer, a non-accelerated filer, smaller reporting company, or an emerging growth company. See the definitions of "large accelerated filer," "accelerated filer," "smaller reporting company," and "emerging growth company" in Rule 12b-2 of the Exchange Act.
Large accelerated filer ý Accelerated filer oNon-accelerated filer o Smaller reporting company o
Emerging growth company o
If an emerging growth company, indicate by check mark if the registrant has elected not to use the extended transition period for complying with any new or revised financial accounting standards provided pursuant to Section 13(a) of the Exchange Act. o
Indicate by check mark whether the registrant has filed a report on and attestation to its management's assessment of the effectiveness of its internal control over financial reporting under Section 404(b) of the Sarbanes-Oxley Act (15 U.S.C. 7262(b)) by the registered public accounting firm that prepared or issued its audit report. [ X ]
Indicate by check mark whether the registrant is a shell company (as defined in Rule 12b-2 of the Exchange Act). YES [ ] NO [ X ]
The aggregate market value of the common equity held by non-affiliates computed by reference to the price at which the common equity was last sold as of the last business day of the registrant's most recently completed second fiscal quarter was approximately $1.25 billion.
Number of shares of common stock outstanding at February 19, 2021: 72,638,290 shares
DOCUMENTS INCORPORATED BY REFERENCE(1) Portions of the Registrant's 2020 Annual Report to Shareholders are incorporated by reference into Parts I, II, and IV; and(2) Portions of the Registrant's 2021 Proxy Statement for its Annual Meeting of Shareholders to be held June 2, 2021, are incorporated by reference into
Part III.

Cross Reference Index
FORM 10-K
Part I
Item 1. Business...................................................................................................................................................... 1Item 1A. Risk Factors............................................................................................................................................... 16Item 1B. Unresolved Staff Comments..................................................................................................................... 28Item 2. Properties................................................................................................................................................... 28Item 3. Legal Proceedings..................................................................................................................................... 28Item 4. Mine Safety Disclosures............................................................................................................................ 26
Part II
Item 5. Market for Registrant's Common Equity, Related Stockholder Matters, and Issuer’s Purchases .of Equity Securities 29
Item 6. Selected Financial Data............................................................................................................................ 30Item 7. Management's Discussion and Analysis of Financial Condition .........................................................
and Results of Operations .................................................................................................................. 30Item 7A. Quantitative and Qualitative Disclosures About Market Risk............................................................. 30Item 8. Financial Statements and Supplementary Data ................................................................................... 31Item 9. Changes in and Disagreements With Accountants on Accounting and Financial Disclosure........... 31Item 9A. Controls and Procedures ......................................................................................................................... 31Item 9B. Other Information.................................................................................................................................... 31
Part III
Item 10. Directors, Executive Officers, and Corporate Governance ................................................................. 32Item 11. Executive Compensation ......................................................................................................................... 33Item 12. Security Ownership of Certain Beneficial Owners and Management and Related Stockholder......
Matters.................................................................................................................................................. 33Item 13. Certain Relationships, Related Transactions, and Director Independence........................................ 33Item 14. Principal Accounting Fees and Services ................................................................................................ 33
Part IV
Item 15. Exhibits and Financial Statement Schedules ......................................................................................... 34Item 16. Form 10-K Summary................................................................................................................................ 36
Signatures ................................................................................................................................................................... 38

Forward-Looking Statements
This Annual Report on Form 10-K contains certain forward-looking statements as defined by the Private Securities Litigation Reform Act of 1995. Forward-looking statements are not historical facts, but instead represent only the beliefs, expectations, or opinions of TowneBank and its management regarding future events, many of which, by their nature, are inherently uncertain. Forward-looking statements may be identified by the use of such words as: "believe," "expect," "anticipate," "intend," "plan," "estimate," or words of similar meaning, or future or conditional terms, such as "will," "would," "should," "could," "may," "likely," "probably," or "possibly." These statements may address issues that involve significant risks, uncertainties, estimates, and assumptions made by management. Factors that may cause actual results to differ materially from those contemplated by such forward-looking statements include the impact of the COVID-19 pandemic and the associated efforts to limit its spread; competitive pressures in the banking industry that may increase significantly; changes in the interest rate environment that may reduce margins and/or the volumes and values of loans made or held as well as the value of other financial assets held; changes in the creditworthiness of customers and the possible impairment of the collectability of loans; general economic conditions, either nationally or regionally, that may be less favorable than expected, resulting in, among other things, a deterioration in credit quality and/or a reduced demand for credit or other services; changes in the legislative or regulatory environment, including changes in accounting standards and tax laws, that may adversely affect our business; costs or difficulties related to the integration of the businesses we have acquired may be greater than expected; expected cost savings associated with pending or recently completed acquisitions may not be fully realized or realized within the expected time frame; cybersecurity threats or attacks, the implementation of new technologies, and the ability to develop and maintain reliable electronic systems; our competitors may have greater financial resources and develop products that enable them to compete more successfully; changes in business conditions; changes in the securities market; and changes in our local economy with regard to our market area. Any forward-looking statements made by us or on our behalf speak only as of the date they are made or as of the date indicated, and we do not undertake any obligation to update forward-looking statements as a result of new information, future events, or otherwise. For additional information on factors that could materially influence forward-looking statements included in this report, see the risk factors in "Item 1A, Risk Factors" in this report.
Item 1. BUSINESS
Overview
TowneBank began operations as a Virginia chartered bank in April 1999. We offer retail and commercial banking services to numerous markets in Virginia and North Carolina. We place special emphasis on serving the financial needs of individuals, commercial enterprises, and professionals.
Our foundation was built on providing banking services and, since inception, we have expanded to provide our members with complete residential real estate services, mortgage, personal and commercial insurance services, title-related services for both residential and commercial transactions, employee benefit services, and investment services. We offer a diversified range of financial services through our banking and non-banking subsidiaries. Additionally, through two controlled divisions, we provide investment and asset management services and
PART I
1

originate mortgage loans, the majority of which are sold to investors on the national secondary market. Unless indicated otherwise, the terms "Company," "we," "us," and "our" refer to TowneBank and our consolidated subsidiaries.
Our common stock is listed on the Nasdaq Global Select Market under the symbol TOWN. Our bank's main office is located at 5716 High Street, Portsmouth, Virginia 23703 (telephone number 757-638-7500), and our Corporate Administration and Member Service Center is located at 6001 Harbour View Boulevard, Suffolk, Virginia 23435 (telephone number 757-638-6700). We have established banking offices in Chesapeake, Chesterfield County, Glen Allen, Hampton, James City County, Mechanicsville, Newport News, Norfolk, Portsmouth, Richmond, Suffolk, Virginia Beach, Williamsburg, and York County in Virginia, along with Camden County, Cary, Charlotte, Corolla, Duck, Grandy, Greensboro, Greenville, Moyock, Nags Head, Raleigh, and Southern Shores in North Carolina. These locations are centrally located in core areas of each community, providing convenient access for both individual and business members.
A list of our subsidiaries is filed as Exhibit 21, and additional information relating to our business and our subsidiaries is included in the 2020 Annual Report to Shareholders ("Annual Report") filed as Exhibit 13 and incorporated herein by reference.
Organization
We were organized and incorporated under the laws of the Commonwealth of Virginia on September 3, 1998, and commenced operations on April 8, 1999. We have three reportable segments: Banking, Realty, and Insurance.
Banking Segment. The Banking segment provides loan and deposit services to retail and commercial customers. We also provide commercial mortgage brokerage services and a variety of investment and asset management services.
Realty Segment. The Realty segment provides residential real estate services and originations of a variety of mortgage loans. We also provide resort property management and residential and commercial title insurance.
Insurance Segment. The Insurance segment provides solutions for businesses, individuals and community organizations. As an independent agency, Towne Insurance works with a variety of carriers to provide a wide array of insurance products, including property, casualty, life and health insurance.
Operating Strategy
Our business strategy focuses on building strong relationships with our members, employees, and communities, while maintaining disciplined underwriting standards and continuing our focus on operational efficiency. We emphasize the making of marketing and member decisions at the local level (within centrally mandated and monitored control standards) with administrative and operational decisions at the central Company level. In order to accomplish this, we have established a "TowneBanking Group" ("Banking Group") for each of our targeted markets.
We maintain a "Hometown" banking image by providing each Banking Group with its own president, commercial loan officers, and local board of directors who are active and visible in their respective communities. It is the responsibility of each local board, acting under delegated authority of the Company's Board of Directors, to direct our overall development in their respective markets. The separate Banking Groups, with local decision-making authority, allow us to more effectively identify and respond to the financial needs of our members.
PART I
2

The Board of Directors believes the separate Banking Groups strategy facilitates member service by ensuring senior management is actively involved in each community and is available on a day-to-day basis to respond to the needs of the members in each community. From a member perspective, each TowneBanking Group is positioned as a separate bank headquartered in its respective community.
Our business model is unique, with revenues from our Realty and Insurance segments providing a counter cyclical balance to our Banking revenues. Our strategic plan places increased emphasis on developing and generating noninterest, or fee, income. Such development involves looking for opportunities to grow that income source, including acquisitions of non-bank financial service providers. Noninterest income includes income generated by our subsidiaries and divisions, as well as service charges on deposit accounts and other fee income.
Services
We provide our members with high-quality, responsive, and technologically advanced services. Members have easy access to our decision-makers and enjoy continuity in service relationships, allowing a fast response to meet their needs. We plan to continue to pursue economically advantageous acquisitions and other strategic opportunities to grow our businesses.
Banking and Other Financial Services. The foundation of our banking services is built on being a reliable and consistent source of credit with loans that are priced based upon the overall banking relationship. Our capitalization provides a lending capacity to meet the credit needs of our targeted market segment. Further, we have various loan participation agreements with other financial institutions should the need arise to meet the additional credit needs of our members.
Through our Banking segment, we offer a full range of deposit products, including checking accounts, savings accounts, and various types of time deposit services, which range from daily money market accounts to long-term certificates of deposit. The transaction accounts and certificates of deposit are tailored by market area at rates competitive to those offered in the area. In addition, we offer retirement account services, such as Individual Retirement Accounts. All deposit accounts are insured by the Deposit Insurance Fund of the Federal Deposit Insurance Corporation ("FDIC") up to the maximum amount allowed by law and are solicited from individuals, businesses, associations and organizations, and governmental authorities.
Other services offered include safe deposit boxes, treasury management services, direct deposit of payroll and Social Security checks, and automatic drafts for various accounts. In addition, services to facilitate access to banking information and transactions, such as online banking, mobile banking, and on-call banking, are offered.
We also offer a full range of short- to medium-term personal and commercial loans. Personal loans include secured and unsecured loans for financing automobiles, home improvements, education, and personal investments. Commercial loans include secured and unsecured loans for working capital (including inventory and receivables), business expansion (including acquisition of real estate and improvements), and equipment and machinery purchases. Additionally, we originate fixed- and floating-rate mortgage loans, as well as real estate acquisition, development, and construction loans. Through TowneBank Commercial Mortgage, LLC, we broker larger commercial loans that are not intended to remain in our portfolio.
Through Towne 1031 Exchange, LLC, we offer the ability to serve as a qualified intermediary assisting investors with tax-deferred exchanges under Section 1031 of the Internal Revenue Code. We provide all necessary documentation to accomplish tax deferral while the investors' proceeds are safely held in accounts established at TowneBank awaiting reinvestment as required by Internal Revenue Service regulations.
PART I
3

Through Towne Investment Group and Towne Wealth Management, we offer other financial services, such as financial, retirement, and estate planning. We also offer assistance on a variety of investment options, including alternative investments, annuities, margin accounts, convertible bonds, and pension and profit-sharing plans. Towne Investment Group and Towne Wealth Management employ full-service financial advisors supported by an affiliation with Raymond James Financial, Inc., a full-service broker-dealer.
Realty Services. The full spectrum of services offered in our Realty segment allows us to realize certain operational synergies in providing quality residential real estate services, originations of a variety of residential mortgages, and title services for residential and commercial title transactions.
We assist customers with the process of buying or selling a home. Additionally, we also provide other realty-related services, including relocation services for individuals and families, including those in the military; and property management services for single-family homes, condominiums, townhomes, apartments, offices, vacation rentals, and retail establishments. Our vacation rentals business specializes in resort property management, offering vacation rentals with many of the most distinctive resort properties in Hilton Head, South Carolina; McHenry, Maryland; and Oak Island, North Carolina.
TowneBank Mortgage processes residential mortgage loans, from application acceptance to loan closing and funds disbursement. Once finalized, they are packaged and sold principally in the secondary market through purchase commitments from investors that subject us to only market risk. In addition to relocation and property management services, we offer title and settlement services, perform real estate closings for residential properties, and issue title insurance policies for both residential and commercial transactions.
Insurance Services. The Insurance segment provides individual and business members with a wide array of insurance products, including life, property, casualty, and health insurance. Through Towne Insurance, we offer a full line of commercial and consumer insurance products and financial services. Through Towne Benefits, we offer individual and group life and health insurance. The Company sold Red Sky Travel Insurance ("Red Sky"), a travel insurance joint venture, in third quarter 2020. Prior to that sale, through Red Sky we offered travel, medical, and baggage protection insurance for travelers via vacation property management companies.
Competition
Because we offer a wide variety of financial services, we compete with other financial institutions as well as other financial service providers, real estate companies, mortgage loan originators, and insurance companies. Competition is generally based on pricing and quality of products and services offered, level of service, convenience, availability of services, and the degree of expertise and personal manner in which services are offered.
There is significant competition within the banking and financial services industry in our market areas. We face competition from other banks, savings institutions, credit unions, consumer finance companies, insurance companies, real estate companies, and other financial institutions in our targeted market areas. Many of our larger competitors have broader geographic markets and substantially greater resources and can offer more diversified products and services. Increasingly, we compete with other companies based on financial technology and capabilities. Competition among providers of financial products and services continues to increase as technology advances have lowered the barriers to entry for financial technology companies, with customers having the opportunity to select from a growing variety of traditional and nontraditional alternatives, including crowdfunding, digital wallets and money transfer services. The ability of non-banking financial institutions to provide services previously limited to commercial banks has intensified competition. Because non-bank financial institutions are not subject to the same regulatory restrictions as banks and bank holding companies, they can often operate with greater flexibility and lower cost structures.
PART I
4
Despite the intense level of competition, we believe the existing and future banking and financial services market in our market areas represents excellent opportunities for a locally owned and managed financial services company with a strong community philanthropic philosophy, such as Towne. Among other factors, the economic outlook for the areas and the size and growth potential of existing markets for banking and other financial services point to a growing demand for such services. Further, in view of the continuing trend in the financial services industry toward consolidations into larger, sometimes impersonal, national institutions, our company fulfills a market demand for the personal and customized financial services an independent, locally run company can offer.
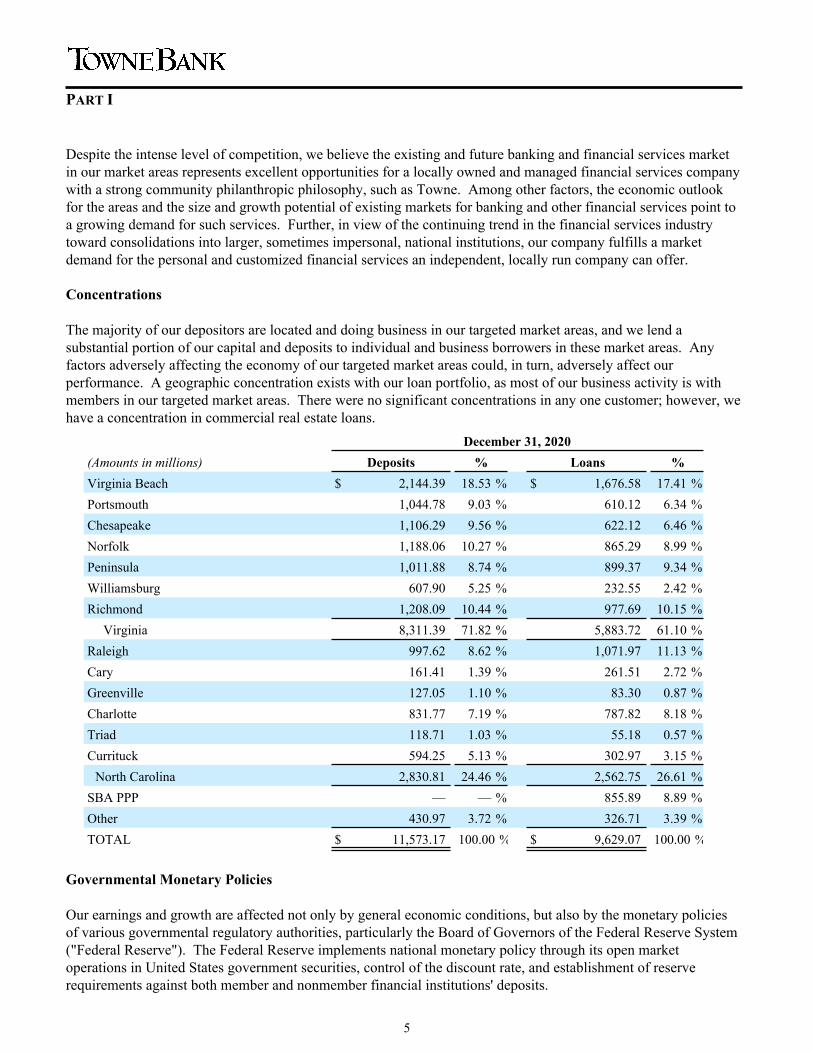
Concentrations
The majority of our depositors are located and doing business in our targeted market areas, and we lend a substantial portion of our capital and deposits to individual and business borrowers in these market areas. Any factors adversely affecting the economy of our targeted market areas could, in turn, adversely affect our performance. A geographic concentration exists with our loan portfolio, as most of our business activity is with members in our targeted market areas. There were no significant concentrations in any one customer; however, we have a concentration in commercial real estate loans.
December 31, 2020(Amounts in millions) Deposits % Loans %Virginia Beach $ 2,144.39 18.53 % $ 1,676.58 17.41 %Portsmouth 1,044.78 9.03 % 610.12 6.34 %Chesapeake 1,106.29 9.56 % 622.12 6.46 %Norfolk 1,188.06 10.27 % 865.29 8.99 %Peninsula 1,011.88 8.74 % 899.37 9.34 %Williamsburg 607.90 5.25 % 232.55 2.42 %Richmond 1,208.09 10.44 % 977.69 10.15 %
Virginia 8,311.39 71.82 % 5,883.72 61.10 %Raleigh 997.62 8.62 % 1,071.97 11.13 %Cary 161.41 1.39 % 261.51 2.72 %Greenville 127.05 1.10 % 83.30 0.87 %Charlotte 831.77 7.19 % 787.82 8.18 %Triad 118.71 1.03 % 55.18 0.57 %Currituck 594.25 5.13 % 302.97 3.15 %
North Carolina 2,830.81 24.46 % 2,562.75 26.61 %SBA PPP — — % 855.89 8.89 %Other 430.97 3.72 % 326.71 3.39 %TOTAL $ 11,573.17 100.00 % $ 9,629.07 100.00 %
Governmental Monetary Policies
Our earnings and growth are affected not only by general economic conditions, but also by the monetary policies of various governmental regulatory authorities, particularly the Board of Governors of the Federal Reserve System ("Federal Reserve"). The Federal Reserve implements national monetary policy through its open market operations in United States government securities, control of the discount rate, and establishment of reserve requirements against both member and nonmember financial institutions' deposits.
PART I
5
These actions have a significant effect on the overall growth and distribution of loans, investments, and deposits, as well as rates earned on loans or paid on deposits. Federal Reserve monetary policies have had a significant effect on the operating results of commercial banks in the past and are expected to do so in the future. Management is unable to predict the effect of possible changes in monetary policies upon our future operating results.
Development of Business
The following is a summary of developments in our business since January 1, 2020:
• During fourth quarter 2020, we completed a core banking system conversion to allow the Company to drive revenue growth and provide a greater variety of financial services to our members through new technologies and enhanced digital solutions.
• Through our participation in the CARES Act, we originated over 6,700 PPP loans totaling approximately $1.10 billion in 2020.
• Effective December 31, 2020, the Company acquired George Johnson Insurance Inc., an independent insurance agency, which was merged into the operations of Towne Insurance Agency, LLC
• TowneBank remained in first place in the latest Virginia Beach-Norfolk-Newport News, VA-NC Metropolitan Statistical Area ("MSA") Annual Deposit Market Share Report released by the FDIC. The report ranks institutions by share of FDIC-insured deposits in the Hampton Roads area as of June 30, 2020. TowneBank had a 25.6% share of deposits in Hampton Roads and was the only community bank with a share greater than 5%. TowneBank was in sixth place in the Richmond, VA MSA in the FDIC's Annual Deposit Market Share Report with $1.20 billion in deposits as of June 30, 2020. In our North Carolina markets, TowneBank ranked seventh in the Raleigh, NC MSA with a 3.2% market share, ninth in the Greenville, NC MSA with a 4.5% market share, and 11th in the Charlotte, NC MSA with a 0.2% market share.
Prior to 2020, our most significant acquisitions included the following:
• On January 26, 2018, the Company acquired Paragon and its wholly owned bank subsidiary, Paragon Commercial Bank, a Raleigh, North Carolina-based bank with three banking offices servicing Raleigh, Cary, and Charlotte, North Carolina. The acquisition added approximately $1.43 billion in loans and assumed approximately $1.25 billion in deposits.
• On June 24, 2016, TowneBank acquired Monarch Financial Holdings, Inc., and its wholly owned bank subsidiary, Monarch Bank, headquartered in Chesapeake, Virginia. The acquisition added approximately $808.14 million in loans and approximately $1.06 billion in deposits.
• On January 2, 2015, TowneBank acquired Franklin Financial Corporation and its wholly owned subsidiary, Franklin Federal Savings Bank, based in Richmond, Virginia. The acquisition added eight office locations, approximately $491.96 million in loans and approximately $682.95 million in deposits.
We anticipate concentrating on the further development of our markets by seeking mergers and acquisitions opportunities or opening additional banking offices as business and other conditions warrant, and by expanding into new markets as opportunities arise. The regulatory approval process for the opening of additional banking offices takes into account a number of factors, including, among others, a determination that we have capital in an amount deemed necessary to warrant additional expansion, and a finding that the public interest will be served.
PART I
6

Additionally, we will continue to place a focus on the development of noninterest income sources and will look for growth opportunities, which could include additional acquisitions of non-bank financial service providers.
Supervision and Regulation
We are regulated extensively under both federal and state law. The following is a brief summary of the material statutes, acts, rules, and regulations that affect us. This summary is qualified in its entirety by reference to the full text of the statutes, acts, rules, regulations, and policies referenced below. Changes in statutes, acts, rules, regulations, or regulatory policies could have a material effect on our business.
General. We are organized as a Virginia chartered banking corporation and are regulated and supervised by the Bureau of Financial Institutions of the Virginia State Corporation Commission ("Bureau of Financial Institutions"). In addition, we are regulated and supervised by the FDIC, which serves as our primary federal regulator. The Bureau of Financial Institutions and the FDIC conduct regular examinations of us, reviewing the adequacy of our loan loss reserves, the quality of our loans and investments, the appropriateness of management practices, compliance with laws and regulations, and other aspects of our operations. In addition to these regular examinations, we must furnish to the FDIC quarterly and annual reports containing detailed financial statements and schedules. Federal and Virginia banking laws and regulations govern all areas of our operations, including reserves, loans, mortgages, capital, issuance of securities, payment of dividends, and establishment of branches. The FDIC and the Bureau of Financial Institutions have authority to impose penalties, initiate civil and administrative actions, and take other steps intended to prevent us from engaging in unsafe or unsound practices. In this regard, the FDIC has adopted capital adequacy requirements.
We are also subject to the enforcement and rule-making authority of the Consumer Financial Protection Bureau ("CFPB") regarding consumer financial products. The CFPB has the authority to create and enforce consumer protection rules and regulations and has the power to examine us for compliance with such rules and regulations. The CFPB also has the authority to prohibit "unfair, deceptive or abusive" acts and practices. The CFPB has examination and enforcement authority over all banks and their affiliates, such as TowneBank, with more than $10 billion in assets.
Capital Requirements. Federal bank regulatory agencies have adopted risk-based capital requirements for assessing bank capital adequacy. Virginia chartered banks must also satisfy the capital requirements adopted by the Bureau of Financial Institutions. The federal capital standards define capital and establish minimum capital requirements in relation to assets and off-balance-sheet exposure as adjusted for credit risk.
In July 2013, the FDIC and other federal bank regulatory agencies approved final rules known as the "Basel III Capital Rules," which substantially revised the risk-based capital and leverage capital requirements applicable to bank holding companies and depository institutions, including the Company. The Basel III Capital Rules went into effect for the Company on January 1, 2015 (subject to a phase-in period that ended on January 1, 2019).
The Basel III Capital Rules, among other things, (i) introduced as a new capital measure "Common Equity Tier 1" ("CET1"), (ii) specified that Tier 1 capital consists of CET1 and "Additional Tier 1 capital" instruments meeting specified requirements, (iii) defined CET1 narrowly by requiring that most adjustments to regulatory capital measures be made to CET1 and not to the other components of capital, and (iv) expanded the scope of the adjustments as compared to existing regulations. CET1 capital consists of common stock instruments that meet eligibility criteria in the final rules, retained earnings, and common equity Tier 1 minority interest. The capital rules require banks to include accumulated other comprehensive income ("AOCI") into CET1 unless the bank used a one-time election to exclude AOCI from its regulatory capital metrics. We elected to exclude AOCI from CET1.
PART I
7

The Basel III Capital Rules require banking organizations to maintain (i) a minimum ratio of CET1 to risk-weighted assets of at least 4.5%, plus a 2.5% "capital conservation buffer" (which is added to the 4.5% CET1 ratio, effectively resulting in a minimum ratio of CET1 to risk-weighted assets of at least 7.0%); (ii) a minimum ratio of Tier 1 capital to risk-weighted assets of at least 6.0%, plus the capital conservation buffer (which is added to the 6.0% Tier 1 capital ratio, effectively resulting in a minimum Tier 1 capital ratio of 8.5%); (iii) a minimum ratio of total capital (that is, Tier 1 plus Tier 2 capital) to risk-weighted assets of at least 8.0%, plus the capital conservation buffer (which is added to the 8.0% total capital ratio, effectively resulting in a minimum total capital ratio of 10.5%); and (iv) a minimum leverage ratio of 4.0%, calculated as the ratio of Tier 1 capital to adjusted average quarterly assets.
The aforementioned capital conservation buffer is designed to absorb losses during periods of economic stress. Banking institutions that fail to meet the effective minimum ratios once the capital conservation buffer is taken into account, as detailed above, will face limitations on the payment of dividends, common stock repurchases, and discretionary cash payments to executive officers based on the amount of the shortfall and the institution's "eligible retained income" (the greater of: four quarter trailing net income and four quarter trailing net income, net of distributions and tax effects not reflected in net income).
The Basel III Capital Rules provide for a number of deductions from and adjustments to CET1. In July 2019, the federal banking agencies adopted final rules (the "Capital Simplification Rules") that, among other things, revised these deductions and adjustments. Following the adoption of the Capital Simplification Rules, certain deferred tax assets and significant investments in non-consolidated financial entities must be deducted from CET1 to the extent that any one such category exceeds 25% of CET1. Prior to the adoption of the Capital Simplification Rules, amounts were deducted from CET1 to the extent that any one such category exceeded 10% of CET1 or all such items, in the aggregate, exceeded 15% of CET1. The Capital Simplification Rules took effect for the Company as of January 1, 2020. These limitations did not impact our regulatory capital during any of the reported periods.
The Basel III Capital Rules prescribe a standardized approach for risk weightings that expanded the risk-weighting categories from the general risk-based capital rules to a much larger and more risk-sensitive number of categories, depending on the nature of the assets, generally ranging from 0% for U.S. government and agency securities, to 600% for certain equity exposures (and higher percentages for certain other types of interests), resulting in higher risk weights for a variety of asset categories. In November 2019, the federal banking agencies adopted a rule revising the scope of commercial real estate mortgages subject to a 150% risk weight.
In December 2017, the Basel Committee on Banking Supervision (the "Basel Committee") published standards that it described as the finalization of the Basel III post-crisis regulatory reforms (the standards are commonly referred to as "Basel IV"). Among other things, these standards revise the Basel Committee's standardized approach for credit risk (including by recalibrating risk weights and introducing new capital requirements for certain "unconditionally cancellable commitments," such as unused credit card lines of credit) and provides a new standardized approach for operational risk capital. Under the Basel framework, these standards will generally be effective on January 1, 2022, with an aggregate output floor phasing in through January 1, 2027. Under current U.S. capital rules, operational risk capital requirements and a capital floor apply only to advanced approaches institutions, and not to the Company. The impact of Basel IV on us will depend on the manner in which it is implemented by the federal bank regulatory agencies.
In response to COVID-19, the joint federal bank regulatory agencies issued an interim final rule that allows banking organizations that adopt CECL in 2020 to mitigate the effects of the standard in their regulatory capital for two years. This two-year delay is in addition to the three-year transition period the agencies had already made available. The Company has elected to adopt the option provided by the interim final rule, which will largely delay the effects of CECL on its regulatory capital for the next two years, after which time the effects will be phased in over a three-year period from January 1, 2022, through December 31, 2024. Under the interim final rule, the
PART I
8

amount of the adjustments to regulatory capital deferred until the phase-in period will include both the initial impact of the adoption of CECL at January 1, 2020, and 25% of subsequent changes in the allowance for credit losses during each quarter of the two-year period ended December 31, 2021.
Prompt Corrective Action. The Federal Deposit Insurance Act, as amended ("FDIA"), requires among other things, the federal bank regulatory agencies to take "prompt corrective action" against depository institutions that do not meet minimum capital requirements. The FDIA includes the following five capital tiers: "well capitalized," "adequately capitalized," "undercapitalized," "significantly undercapitalized," and "critically undercapitalized."
In order to be adequately capitalized for purposes of the prompt corrective action rules, a banking organization is required to have at least an 8% total risk-based capital ratio, a 6% Tier 1 risk-based capital ratio, a 4.5% CET1 risk-based capital ratio, and a 4% Tier 1 leverage ratio. To be well-capitalized, a banking organization is required to have at least a 10.5% total risk-based capital ratio, an 8.5% Tier 1 risk-based capital ratio, a 7% CET1 risk-based capital ratio, and a 5% Tier 1 leverage ratio. An institution may be downgraded to, or deemed to be in, a capital category that is lower than indicated by its capital ratios if it is determined to be in an unsafe or unsound condition or if it receives an unsatisfactory examination rating with respect to certain matters. A bank's capital category is determined solely for the purpose of applying prompt corrective action regulations, and the capital category may not constitute an accurate representation of the bank's overall financial condition or prospects for other purposes.
At December 31, 2020, we had the following risk-based capital and leverage ratios relative to regulatory minimums.
WellRatio TowneBank Minimum Capitalized
Common equity Tier 1 11.87% 4.50% 7.00%Tier 1 risk-based capital 12.04% 6.00% 8.50%Total risk-based capital 15.42% 8.00% 10.50%Tier 1 leverage 8.99% 4.00% 5.00%
The FDIC is authorized by federal legislation and regulations to take various enforcement actions against any undercapitalized insured depository institution and any insured depository institution that fails to submit an acceptable capital restoration plan or fails to implement a plan accepted by the FDIC. These powers include, among other things, requiring a bank to be recapitalized, prohibiting asset growth, restricting interest rates paid, requiring prior approval of capital distributions, requiring divestiture by the institution of its subsidiaries, requiring new election of directors, and requiring the dismissal of directors and officers.
Dividends. The amount of dividends payable depends upon our earnings and capital position and is limited by federal and state laws, regulations, and policies. In addition, under Virginia law, the Bureau of Financial Institutions may limit the ability of the bank to pay dividends. No dividend may be declared or paid that would impair a bank's paid-in capital.
The Bureau of Financial Institutions and the FDIC have the general authority to limit dividends paid if such payments are deemed to constitute an unsafe and unsound practice. In particular, Section 38 of the Federal Deposit Insurance Act would prohibit us from making a dividend if we were "undercapitalized" or if such dividend would result in us becoming "undercapitalized."
The Dodd-Frank Wall Street Reform and Consumer Protection Act (the "Dodd-Frank Act"). On July 21, 2010, the Dodd-Frank Act was signed into law. The Dodd-Frank Act implemented significant changes to the regulation of
PART I
9

the financial services industry and affected the lending, investment, trading, and operating activities of financial institutions. The legislation directed federal bank regulatory agencies to implement new leverage and capital requirements. These requirements take into account off-balance-sheet activities and other risks, including risks relating to securitized products and derivatives. The Dodd-Frank Act created a new Financial Stability Oversight Council to identify systemic risks in the financial system and gives federal regulators new authority to take control of and liquidate financial firms. In addition, the Dodd-Frank Act contains a wide variety of provisions affecting the regulation of depository institutions, including restrictions related to mortgage originations, risk retention requirements as to securitized loans, establishment of the CFPB, and restrictions on proprietary trading.
Because our assets exceed $10 billion, we are subject to the Durbin Amendment promulgated under the Dodd-Frank Act. Under the rule, the maximum permissible interchange fee for an electronic debit transaction is the sum of 21 cents per transaction and five basis points multiplied by the value of the transaction. The rules also allow for an upward adjustment of no more than 1 cent to an issuer's debit card interchange fee if the issuer develops and implements policies and procedures reasonably designed to achieve certain fraud-prevention standards. This limitation on interchange fees began impacting our noninterest income in the third quarter of 2019.
The Dodd-Frank Act created the CFPB, an independent federal agency with broad rule-making, supervisory, and enforcement powers under various federal consumer financial protection laws. The CFPB has examination and primary enforcement authority with respect to depository institutions with $10 billion or more in assets, such as the Company. Smaller institutions are subject to rules promulgated by the CFPB, but are examined and supervised by federal banking regulatory agencies for consumer compliance purposes.
The Economic Growth, Regulatory Relief and Consumer Protection Act of 2018, which was signed into law on May 24, 2018 (the "EGRRCPA"), amended the Dodd-Frank Act to provide regulatory relief for certain smaller and regional financial institutions. The EGRRCPA, among other things, exempted banks with less than $250 billion in total consolidated assets, such as the Company, from the enhanced prudential standards and the company-run and supervisory stress tests previously required under the Dodd-Frank Act. The amendments to the Dodd-Frank Act were effective for the Company in November 2019.
The Dodd-Frank Act has had, and may in the future have, a material impact on the Company's operations, particularly through increased compliance costs resulting from new and possible future consumer and fair lending regulations. See Part I, Item 1A, "Risk Factors" for additional discussion of this topic.
FDIC Insurance Assessments. Substantially all of our members' deposit accounts are insured up to applicable limits by the Deposit Insurance Fund (the "DIF") of the FDIC. As such, the Company is subject to insurance assessments on member deposits to maintain the DIF.
The Dodd-Frank Act permanently increased the maximum deposit insurance amount for banks, savings institutions, and credit unions to $250,000 per depositor, per insured depository institution, for each account ownership category.
The Dodd-Frank Act also broadened the base for FDIC insurance assessments. Assessments are now based on average consolidated total assets less tangible equity capital of a financial institution. The Dodd-Frank Act required the FDIC to increase the reserve ratio of the DIF from 1.15% to 1.35% of insured deposits by 2020, and eliminated the requirement that the FDIC pay dividends to insured depository institutions when the reserve ratio exceeded certain thresholds. On September 30, 2018, the DIF reserve ratio reached 1.36%, exceeding the statutorily required minimum reserve ratio of 1.35% ahead of the 2020 deadline, which ended surcharges on insured depository institutions with assets greater than $10 billion. Banks with assets of less than $10 billion were awarded assessment credits for their portion of their assessments that contributed to the growth in the reserve ratio from 1.15% to 1.35%. Beginning in the second quarter of 2019, when the reserve ratio exceeded 1.38%, the FDIC
PART I
10

applied credits to TowneBank's assessment invoices because our assessments contributing to the growth in the reserve ratio occurred prior to our total assets exceeding $10 billion. The Company's total assessment credit in 2019 was $2.53 million. No additional credits are expected.
FDIC insurance expense totaled $3.87 million, $0.85 million, and $2.89 million in 2020, 2019, and 2018. FDIC insurance expense previously included deposit insurance assessments and Financing Corporation ("FICO") assessments related to outstanding FICO bonds. These assessments have ceased as all FICO bonds matured in 2019.
Because our total consolidated assets exceed $10 billion, the FDIC uses a performance score and a loss-severity score to calculate our assessment rate. In calculating these scores, the FDIC uses a bank's capital level and regulatory supervisory ratings and certain financial measures to assess an institution's ability to withstand asset-related stress and funding-related stress. The FDIC also has the ability to make discretionary adjustments to the total score based upon significant risk factors that are not adequately captured in the calculations. In addition to ordinary assessments described above, the FDIC has the ability to impose special assessments in certain instances.
Historically, deposit insurance premiums we have paid to the FDIC have been deductible for federal income tax purposes; however, the Tax Cuts and Jobs Act of 2017 disallowed the deduction of such premium payments for banking organizations with total consolidated assets of $50 billion or more. For banks with less than $50 billion in total consolidated assets, such as the Company, the premium deduction is being phased out based on the proportion of a bank's assets exceeding $10 billion. The premium expense disallowed in 2020 was insignificant.
Community Reinvestment Act. Banks are subject to the provisions of the Community Reinvestment Act of 1977 ("CRA") that requires the appropriate federal bank regulatory agency, the FDIC in our case, to assess our record in meeting the credit needs of the communities we serve.
The CRA assessment is required by any bank that has applied to, among other things, establish a new branch office which will accept deposits; relocate an existing office; or merge, consolidate with, acquire the assets of, or assume the liabilities of a federally-regulated financial institution. We received an "Outstanding" rating in our last CRA examination.
In December 2019, the FDIC and the Office of the Comptroller of the Currency jointly proposed rules that would significantly change existing CRA regulations. The proposed rules are intended to increase bank activity in low- and moderate-income communities where there is significant need for credit, more responsible lending, greater access to banking services, and improvements to critical infrastructure. The proposals change four key areas: (i) clarifying what activities qualify for CRA credit; (ii) updating where activities count for CRA credit; (iii) providing a more transparent and objective method for measuring CRA performance; and (iv) revising CRA-related data collection, recordkeeping, and reporting. In May 2020, the Office of the Comptroller of the Currency released its rules, without the FDIC. Officials at the FDIC were concerned with the rules' timing in reference to the COVID-19 pandemic although they supported CRA modernization. The FDIC has not finalized the revisions to its CRA rule. We are continuing to evaluate what impact these proposed rules, if implemented, may have on the Company.
Federal Deposit Insurance Corporation Improvement Act. The Federal Deposit Insurance Corporation Improvement Act of 1991 ("FDICIA") became effective July 2, 1993. FDICIA requires insured institutions with $500 million or more in total assets at the beginning of their fiscal year to submit independently audited annual reports to the FDIC and the appropriate agency.
These publicly available reports must include: (i) annual financial statements prepared in accordance with accounting principles generally accepted in the United States ("GAAP") and such other disclosure requirements as required by the FDIC or the appropriate agency, and (ii) a management report signed by the Chief Executive
PART I
11

Officer and the Chief Financial Officer or Chief Accounting Officer of the institution that contains a statement of management's responsibilities for: (a) preparing the annual financial statements, (b) establishing and maintaining an adequate internal control structure and procedures for financial reporting, and (c) complying with the laws and regulations designated by the FDIC relating to safety and soundness, and an assessment of: (1) the effectiveness of the system of internal control and procedures for financial reporting as of the end of the fiscal year, and (2) the institution's compliance during the fiscal year with applicable laws and regulations designated by the FDIC relating to safety and soundness.
With respect to any internal control report, the institution's independent public accountants must attest to, and report separately on, certain assertions of the institution's management contained in such report for institutions with $1 billion or more in total assets.
Privacy Legislation. Several laws, including the Privacy of Consumer Financial Information (Part V of the Gramm-Leach-Bliley Act) and related regulations issued by federal bank regulatory agencies, provide protections against the transfer and use of customer information by financial institutions. A financial institution must provide to its customers information regarding its policies and procedures with respect to the handling of customers' personal information. Each institution must conduct an internal risk assessment of its ability to protect customer information. These privacy provisions generally prohibit a financial institution from providing a customer's personal financial information to unaffiliated parties without prior notice and approval from the customer.
Anti-Money Laundering Laws and Regulations. The Company is subject to several federal laws that are designed to combat money laundering, terrorist financing, and transactions with certain persons, companies or foreign governments designated by U.S. authorities ("AML laws"). This category of laws includes the Bank Secrecy Act of 1970, the Money Laundering Control Act of 1986, the USA PATRIOT Act of 2001, and the Anti-Money Laundering Act of 2020.
The AML laws and their implementing regulations require insured depository institutions, broker-dealers, and certain other financial institutions to have policies, procedures, and controls to detect, prevent, and report money laundering and terrorist financing. The AML laws and their regulations also provide for information sharing, subject to conditions, between federal law enforcement agencies and financial institutions, as well as among financial institutions, for counter-terrorism purposes. Federal banking regulators are required, when reviewing bank holding company acquisition and bank merger applications, to take into account the effectiveness of the anti-money laundering activities of the applicants. To comply with these obligations, the Company has implemented appropriate internal practices, procedures, and controls.
Incentive Compensation. In June 2010, the federal bank regulatory agencies issued comprehensive final guidance on incentive compensation policies intended to ensure that the incentive compensation policies of financial institutions do not undermine the safety and soundness of such institutions by encouraging excessive risk-taking. The Interagency Guidance on Sound Incentive Compensation Policies, which covers all employees who have the ability to materially affect the risk profile of a financial institution, either individually or as part of a group, is based upon the key principles that a financial institution's incentive compensation arrangements should (i) provide incentives that do not encourage risk-taking beyond the institution's ability to effectively identify and manage risks, (ii) be compatible with effective internal controls and risk management, and (iii) be supported by strong corporate governance, including active and effective oversight by the financial institution's board of directors.
Section 956 of the Dodd-Frank Act requires the federal bank regulatory agencies and the Securities and Exchange Commission to establish joint regulations or guidelines prohibiting incentive-based payment arrangements at specified regulated entities that encourage inappropriate risk-taking by providing an executive officer, employee, director, or principal shareholder with excessive compensation, fees, or benefits, or that could lead to material financial loss to the entity. The federal bank regulatory agencies issued such proposed rules in March 2011 and
PART I
12

issued a revised proposed rule in June 2016 implementing the requirements and prohibitions set forth in Section 956. The revised proposed rule would apply to all banks, among other institutions, with at least $1 billion in average total consolidated assets, for which it would go beyond the existing Interagency Guidance on Sound Incentive Compensation Policies to (i) prohibit certain types and features of incentive-based compensation arrangements for senior executive officers, (ii) require incentive-based compensation arrangements to adhere to certain basic principles to avoid a presumption of encouraging inappropriate risk, (iii) require appropriate board or committee oversight, (iv) establish minimum recordkeeping, and (v) mandate disclosures to the appropriate federal bank regulatory agency. These proposed rules have not yet been finalized.
Consumer Financial Protection. We are subject to a number of federal and state consumer protection laws that extensively govern our relationship with our customers. These laws include the Equal Credit Opportunity Act, the Fair Credit Reporting Act, the Truth in Lending Act, the Truth in Savings Act, the Electronic Fund Transfer Act, the Expedited Funds Availability Act, the Home Mortgage Disclosure Act, the Fair Housing Act, the Real Estate Settlement Procedures Act, the Fair Debt Collection Practices Act, the Service Members Civil Relief Act, laws governing flood insurance, federal and state laws prohibiting unfair and deceptive business practices, foreclosure laws, and various regulations that implement some or all of the foregoing. These laws and regulations mandate certain disclosure requirements and regulate the manner in which financial institutions must deal with customers when taking deposits, making loans, collecting loans, and providing other services. If we fail to comply with these laws and regulations, we may be subject to various penalties. Failure to comply with consumer protection requirements may also result in failure to obtain any required bank regulatory approval for merger or acquisition transactions we may wish to pursue, or being prohibited from engaging in such transactions even if approval is not required.
The Dodd-Frank Act centralized responsibility for consumer financial protection by creating a new agency, the CFPB, and giving it responsibility for implementing, examining, and enforcing compliance with federal consumer protection laws. The CFPB focuses on (i) risks to consumers and compliance with federal consumer financial laws, (ii) the markets in which firms operate and risks to consumers posed by activities in those markets, (iii) depository institutions that offer a wide variety of consumer financial products and services, and (iv) non-depository companies that offer one or more consumer financial products or services.
The CFPB has broad rule-making authority for a wide range of consumer financial laws that apply to all banks, including, among other things, the authority to prohibit "unfair, deceptive or abusive" acts and practices. Abusive acts or practices are defined as those that materially interfere with a consumer's ability to understand a term or condition of a consumer financial product or service or take unreasonable advantage of a consumer's (i) lack of financial savvy, (ii) inability to protect himself in the selection or use of consumer financial products or services, or (iii) reasonable reliance on a covered entity to act in the consumer's interests. The CFPB can issue cease-and-desist orders against banks and other entities that violate consumer financial laws. The CFPB may also institute a civil action against an entity in violation of federal consumer financial law in order to impose a civil penalty or injunction.
Ability-to-Repay and Qualified Mortgage Rule. Pursuant to the Dodd-Frank Act, the CFPB issued a final rule, amending Regulation Z as implemented by the Truth in Lending Act, requiring mortgage lenders to make a reasonable and good faith determination based on verified and documented information that a consumer applying for a mortgage loan has a reasonable ability to repay the loan according to its terms. Mortgage lenders are required to determine consumers' ability to repay in one of two ways. The first alternative requires the mortgage lender to consider the following eight underwriting factors when making the credit decision: (i) current or reasonably expected income or assets; (ii) current employment status; (iii) the monthly payment on the covered transaction; (iv) the monthly payment on any simultaneous loan; (v) the monthly payment for mortgage-related obligations; (vi) current debt obligations, alimony, and child support; (vii) the monthly debt-to-income ratio or residual income; and (viii) credit history. Alternatively, the mortgage lender can originate "qualified mortgages," which are entitled
PART I
13

to a presumption that the creditor making the loan satisfied the ability-to-repay requirements. In general, a "qualified mortgage" is a mortgage loan without negative amortization, interest-only payments, balloon payments, or terms exceeding 30 years. In addition, to be a qualified mortgage the points and fees paid by a consumer cannot exceed 3% of the total loan amount. Qualified mortgages that are "higher-priced" (e.g., subprime loans) garner a rebuttable presumption of compliance with the ability-to-repay rules, while qualified mortgages that are not "higher-priced" (e.g., prime loans) are given a safe harbor of compliance. The Company is predominantly an originator of compliant qualified mortgages.
Cybersecurity. Several regulatory statements have been issued regarding cybersecurity. Statements include that financial institutions should design multiple layers of security controls to establish lines of defense and to ensure their risk management processes address the risk posed by electronic banking platforms, interbank messaging, payments and cloud technologies. Cybersecurity controls should include the identification of compromised customer credentials, including security measures to reliably authenticate customers accessing internet-based services of the financial institution. A financial institution's management is expected to maintain sufficient business continuity planning processes to ensure the rapid recovery, resumption, and maintenance of the institution's operations after a cyberattack involving destructive malware. A financial institution is also expected to develop appropriate processes to enable recovery of data and business operations, address rebuilding network capabilities, and restoring data if the institution or its critical service providers fall victim to this type of cyber-attack. If the Company fails to observe the regulatory guidance, it could be subject to various regulatory sanctions, including financial penalties.
In December 2020, the federal banking agencies issued a notice of proposed rulemaking that would require banking organizations to notify their primary regulator within 36 hours of becoming aware of a "computer-security incident" or a "notification incident." The proposed rule also would require specific and immediate notifications by bank service providers that become aware of similar incidents.
To date, we have not experienced a significant compromise, significant data loss or any material financial losses related to cybersecurity attacks, but our systems and those of our customers and third-party service providers are under constant threat and it is possible that we could experience a significant event in the future. Risks and exposures related to cybersecurity attacks are expected to remain high for the foreseeable future due to the rapidly evolving nature and sophistication of these threats, as well as due to the expanding use of Internet banking, mobile banking and other technology-based products and services by us and our customers.
Reporting Obligation Under Securities Laws. We are subject to the periodic reporting requirements of the Securities Exchange Act of 1934 ("Exchange Act") as adopted by the FDIC, including the filing of annual, quarterly, and other reports with the FDIC. As an Exchange Act reporting bank with over $500 million in assets, we are directly affected by the Sarbanes-Oxley Act of 2002 and regulations promulgated thereunder, which are aimed at improving corporate governance and reporting procedures. We are also subject to the rules and listing standards adopted by The Nasdaq Stock Market, LLC. We are complying with the rules and regulations implemented pursuant to the Sarbanes-Oxley Act and by The Nasdaq Stock Market, LLC, and intend to comply with any applicable rules and regulations implemented in the future.
Coronavirus Aid, Relief, and Economic Security Act and Consolidated Appropriations Act, 2021. In response to the COVID-19 pandemic, the Coronavirus Aid, Relief, and Economic Security Act ("CARES Act") was signed into law on March 27, 2020 and the Consolidated Appropriations Act, 2021 ("Appropriations Act") was signed into law on December 27, 2020. Among other things, the CARES Act and Appropriations Act include the following provisions impacting financial institutions:
• Temporary Troubled Debt Restructurings Relief. The CARES Act allowed banks to elect to suspend requirements under GAAP for loan modifications related to the COVID-19 pandemic (for loans that were not more than 30 days past due as of December 31, 2019) that would otherwise be categorized as a troubled debt
PART I
14

restructuring, including impairment for accounting purposes, until the earlier of 60 days after the termination date of the national emergency or December 31, 2020. Federal banking agencies are required to defer to the determination of the banks making such suspension. The Appropriations Act extended this temporary relief until the earlier of 60 days after the termination date of the national emergency or January 1, 2022.
• Small Business Administration Paycheck Protection Program. The CARES Act created the Small Business Administration’s Paycheck Protection Program ("PPP") and it was extended by the Appropriations Act. Under the PPP, money was authorized for small business loans to pay payroll and group health costs, salaries and commissions, mortgage and rent payments, utilities, and interest on other debt. The loans are provided through participating financial institutions, such as TowneBank, that process loan applications and service the loans.
Future Legislation and Regulation. Congress may enact legislation from time to time that affects the regulation of the financial services industry, and state legislatures may enact legislation from time to time affecting the regulation of financial institutions chartered by or operating in those states. Federal and state regulatory agencies also periodically propose and adopt changes to their regulations or change the manner in which existing regulations are applied. The substance or impact of pending or future legislation or regulation, or the application thereof, cannot be predicted, although enactment of the proposed legislation could impact the regulatory structure under which we operate and may significantly increase costs, impede the efficiency of internal business processes, require an increase in regulatory capital, require modifications to business strategy, and limit the ability to pursue business opportunities in an efficient manner.
Human Capital
The success of the Company is directly attributed to an exceptional team of people who are clearly committed to a caring and nurturing environment centered on serving others. Continuing to build a passionate team with adherence to our culture of caring, vision, and opportunity for all will be the cornerstone of our ongoing success.
We have a strategic focus on designing our compensation and incentive programs to ensure they are competitive and effective in attracting and retaining diverse talent across all lines of business. In addition to competitive base and incentive compensation plans, the Company offers competitive benefits including paid vacation and sick leave, 401(k) plan, health, dental, and vision plans, life and disability coverage, wellness plan, paid training opportunities, pre-tax flexible spending accounts, and tuition reimbursement.
As part of the Company's governance framework for human capital, the Board of Directors has a Compensation Committee composed of independent directors. Pursuant to the written charter of the Compensation Committee, the primary function of the committee is to provide independent oversight of TowneBank's compensation practices and to determine compensation or provide recommendations to the Board for the compensation of the Executive Chairman, the President and Chief Executive Officer, and all other executive officers of TowneBank. The committee also monitors all incentive and equity compensation plans for the benefit of Company officers and directors eligible to participate in such plans.
The Company's strategic plan has dedicated objectives and tactics to ensure we recruit, retain, and develop a diverse and talented team, with a specific focus on enhancing diversity, equity, and inclusion. We have established a Diversity Council with support at the highest level of leadership to ensure we meet its goals for a diverse, equitable, and inclusive workplace.
Towne has an active learning and development program designed to provide ongoing opportunities for teams to grow in existing roles and to be prepared for future opportunities. For over 13 consecutive years, the Company has had a management development program designed to develop leadership and managerial talent for the future. Over this time, 146 employees have participated in this program, and many of these graduates have moved into leadership roles in the Company.
PART I
15

As of December 31, 2020, we had 2,490 full-time equivalent employees, excluding real estate sales agents. There were 407 real estate sales agents at December 31, 2020. Our real estate agents are independent contractors and not included as our employees. None of our employees are represented by any collective bargaining agreements, and relations with employees are considered good.
Available Information
Our Annual Reports on Form 10-K, Quarterly Reports on Form 10-Q, Current Reports on Form 8-K, and amendments to those reports are filed or furnished pursuant to Section 13(a) or 15(d) of the Exchange Act and are accessible at no cost on our website, www.townebank.com, as soon as reasonably practicable after those reports have been filed with or furnished to the FDIC. These materials are available free of charge in print to shareholders who request them by writing to: TowneBank, 6001 Harbour View Boulevard, Suffolk, Virginia 23435. A copy of the statements of beneficial ownership of our equity securities filed by our directors, officers, and 10% or greater shareholders under Section 16 of the Exchange Act may also be obtained through our website. The information contained on our website is not a part of or included in this Form 10-K.
The public may read and copy any of the reports filed with the FDIC at the FDIC's Accounting and Securities Disclosure Section, Division of Risk Management Supervision, 550 17th Street, N.W., Washington, D.C. 20429. The public may contact the FDIC at 202-898-8913 should they require a copy of a filing be sent directly to them.
Item 1A. RISK FACTORS
In addition to the other information contained in this report, the following risks may affect us. This listing should not be considered all-inclusive. Additional risks and uncertainties, including those not presently known to us or that we currently consider immaterial, may also impair our business, financial condition, or operating results.
Strategic Risk
The value of our goodwill and other intangible assets may decline in the future.
As of December 31, 2020, we had $497.86 million of goodwill and other intangible assets. A significant decline in our expected future cash flows, a significant adverse change in the business climate, slower growth rates, or a significant and sustained decline in the price of our common stock may necessitate taking charges in the future related to the impairment of our goodwill and other intangible assets. If we were to conclude that a future write-down of goodwill and other intangible assets is necessary, we would record the appropriate charge, which could have a material adverse effect on our financial condition and results of operations.
Loss of any of our key personnel could disrupt our operations and result in reduced revenues.
We are a relationship-driven organization. A key aspect of our business strategy is for our senior officers to have primary contact with our customers. Our growth and development to date have been, in large part, a result of these personalized relationships with our customer base. The success of our acquisitions also often depends on our ability to retain and integrate the senior officers of acquired businesses.
Our senior officers have considerable experience in the banking industry and related financial services and are extremely valuable and would be difficult to replace. The loss of the services of these officers could have a material adverse effect upon future prospects. Although we have entered into employment contracts with our Executive Chairman, Chief Executive Officer, and our other senior executive officers, and purchased key man life insurance policies to mitigate the risk of an unforeseen departure or death of certain of our senior executive
PART I
16

officers, we cannot offer any assurance that they and other key employees will remain employed by us. The unexpected loss of services of one or more of these key employees could have a material adverse effect on operations and possibly result in reduced revenues.
Our risk management framework may not be effective in mitigating risk and loss.
We maintain an enterprise risk management program that is designed to identify, quantify, monitor, report, and control the risks that we face. These risks include: strategic, reputational, credit, liquidity, interest rate, operational, compliance, pricing, legal, and cybersecurity. While we assess and improve this program on an ongoing basis, there can be no assurance that our approach and framework for risk management and related controls will effectively mitigate all risk and limit losses in our business. If conditions or circumstances arise that expose flaws or gaps in our risk management program, or if our controls break down, our results of operations and financial condition may be adversely affected.
Our methods for reducing risk exposures may not be effective.
Instruments, systems, and strategies used, particularly in relation to our mortgage business, to hedge or otherwise manage exposure to various types of market, credit, or liquidity risks could be less effective than anticipated. As a result, the Company may not be able to effectively mitigate its risk exposures in particular market environments or against particular types of risk, which could have a material adverse impact on our business, financial condition, or results of operations.
Risks associated with acquisitions and the resulting integrations may affect costs and revenue.
A component of our business strategy includes growth through acquisitions. Costs or difficulties related to integrating the acquired business with the Company might be greater than expected. Further, expected revenue and/or operational synergies and cost savings associated with pending or recently completed acquisitions may not be fully realized or realized within the expected time frame. We cannot provide assurance that we will be successful in overcoming these risks or any other issues encountered in connection with acquisitions.
Attractive acquisition or expansion opportunities may not be available to us in the future.
We may consider acquiring other businesses or expanding into new product lines or markets that we believe will help us fulfill our strategic objectives. We expect that other banking and financial companies, some of which have significantly greater resources, will compete with us to acquire financial services businesses. Our target base of attractive candidates may be limited, and competition could increase prices for potential acquisitions that we believe are attractive. Acquisitions may also be subject to various regulatory approvals. If we fail to receive the appropriate regulatory approvals, we will not be able to consummate acquisitions that we believe are in our best interests.
Operational Risk
There are risks resulting from the use of models in our business.
We rely on quantitative models to measure risks and to estimate certain financial values. Models may be used in such processes as determining the pricing of various products, grading loans and extending credit, measuring interest rate and other market risks, predicting or estimating losses, assessing capital adequacy and calculating economic and regulatory capital levels, as well as to estimating the value of financial instruments and balance sheet items. Poorly designed or implemented models present the risk that our business decisions based on information incorporating model output would be adversely affected due to the inadequacy of that information. Also,
PART I
17

information we provide to the public or to our regulators based on poorly designed or implemented models could be inaccurate or misleading.
Failure of our internal and disclosure controls and procedures could have a material adverse effect on our results of operations and financial condition.
Effective internal and disclosure controls and procedures are necessary to provide reliable financial reports and effectively prevent fraud and to operate successfully as a public company. Our management regularly reviews and updates our internal controls, disclosure controls and procedures, and corporate governance policies and procedures. Any system of controls, no matter how well designed and operated, is based in part on certain assumptions and can provide only reasonable, not absolute, assurances that the objectives of the system are met. Any failure or circumvention of our controls and procedures or failure to comply with regulations related to controls and procedures could have a material adverse effect on our results of operations and financial condition.
Reliance on certain external vendors could adversely affect our operations.
We are reliant upon certain external vendors to provide products and services necessary to maintain our day-to-day operations. Accordingly, our operations are exposed to risk that these vendors will not perform in accordance with the contracted arrangements under service-level agreements. We maintain a system of comprehensive policies and a control framework designed to monitor vendor risks including, among other things, (i) changes in the vendor's financial condition, (ii) changes in the vendor's support for existing products and services, and (ii) changes in the vendor's strategic focus. While we believe these policies and procedures help to mitigate risk, the failure of an external vendor to perform in accordance with contracted arrangements under service-level agreements could be disruptive to our operations, which could have a material adverse impact on our business and, in turn, our financial condition and results of operations.
The operational functions of business counterparties over which we may have limited or no control may experience disruptions that could adversely impact our operations.
Every year, retailers and service providers are the target of data systems incursions which result in the thefts of credit and debit card information, online account information, and other financial data of tens of millions of their customers and users. These incursions affect cards issued and deposit accounts maintained by many banks, including the Company. Although our systems are not breached in such incursions, these events can cause us to reissue a significant number of cards and take other costly steps to avoid significant theft loss to us and our customers. In some cases, we may be required to reimburse customers for the losses they incur. Other possible points of intrusion or disruption not within our control include internet service providers, electronic mail portal providers, social media portals, distant-server ("cloud") service providers, electronic data security providers, telecommunications companies, and smartphone manufacturers.
We continually encounter technological change.
The financial services industry is continually undergoing rapid technological change with frequent introductions of new technology-driven products and services, which increases efficiency and enables financial institutions to better serve customers and to reduce costs. Our future success depends, in part, upon our ability to address the needs of our customers by using technology to provide products and services that will satisfy customer demands, as well as to create additional efficiencies in our operations. We may not be able to effectively implement new technology-driven products and services or be successful in marketing these products and services to our customers. Service interruptions, transaction processing errors, and system conversion delays may cause us to fail to comply with applicable laws. Such failure could have a material adverse effect on our business, financial condition, or results of operations.
PART I
18

Credit Risk
Transition away from the benchmark rate London Interbank Offered Rate ("LIBOR") to another benchmark rate could adversely affect operations.
In 2017, the United Kingdom's Financial Conduct Authority announced that after 2021 it would no longer compel banks to submit the rates required to calculate LIBOR. In November 2020, the administrator of LIBOR announced it will consult on its intention to extend the retirement date of certain offered rates, whereby the publication of the one week and two month LIBOR offered rates will cease after December 31, 2021; but, the publication of the remaining LIBOR offered rates will continue until June 30, 2023. Given consumer protection, litigation, and reputation risks, the bank regulatory agencies have indicated that entering into new contracts which use LIBOR as a reference rate after December 31, 2021, would create safety and soundness risks and that they will examine bank practices accordingly. Therefore, the agencies encouraged banks to cease entering into new contracts that use LIBOR as a reference rate as soon as practicable, and in any event by December 31, 2021. At this time, it is impossible to predict whether and to what extent banks will continue to provide submissions for the calculation of LIBOR. Similarly, it is impossible to predict whether LIBOR will continue to be viewed as an acceptable market benchmark, what rate or rates may become accepted alternatives to LIBOR, or what effects any such changes in views or alternatives may have on the markets for LIBOR-indexed financial instruments.
Regulators, industry groups, and others have, among other things, published recommended replacement language for LIBOR-linked financial instruments, identified recommended alternatives for certain LIBOR rates (e.g., the Secured Overnight Financing Rate), and proposed implementations of the recommended alternatives in floating rate instruments. There is not yet any consensus on what recommendations and proposals will be broadly accepted.
We have a significant number of loans, borrowings, and other financial instruments with attributes that are either directly or indirectly dependent on LIBOR. The transition from LIBOR could create considerable costs and additional risk. Since proposed alternative rates are calculated differently, payments under contracts referencing new rates will differ from those referencing LIBOR. The transition will change our market risk profiles, requiring changes to risk and pricing models, valuation tools, product design, and hedging strategies. Furthermore, failure to adequately manage this transition process with our customers could adversely impact our reputation. Although we are currently unable to assess what the ultimate impact of the transition from LIBOR will be, failure to adequately manage the transition could have a material adverse effect on our business, financial condition, and results of operations.
We are subject to environmental liability risk associated with our lending activities.
A significant portion of our loan portfolio is secured by real property. During the ordinary course of business, we may foreclose on and take title to properties securing certain loans. In doing so, there is a risk that hazardous or toxic substances could be found on these properties. If hazardous or toxic substances are found, we may be liable for remediation costs, as well as for personal injury and property damage. Environmental laws may require us to incur substantial expenses and may materially reduce the affected property's value or limit our ability to use or sell the affected property. In addition, future laws or more stringent interpretations or enforcement policies with respect to existing laws may increase our exposure to environmental liability. Environmental reviews of real property before initiating foreclosure actions may not be sufficient to detect all potential environmental hazards. Remediation costs and any other financial liabilities associated with an environmental hazard could have a material adverse effect on our financial condition and results of operations.
PART I
19

Focus on commercial loans may increase the risk of substantial credit losses.
We offer a variety of loan products, including residential mortgage, consumer, construction, and commercial loans. At December 31, 2020, approximately 15.45% of loans were commercial and industrial loans and commercial loans secured by commercial real estate. It is expected that, as we grow, this percentage will remain fairly constant.
Commercial lending generally involves more risk than mortgage and consumer lending because loan balances are greater, and the borrower's ability to repay is contingent on the successful operation of a business. Risk of loan defaults is unavoidable in the banking industry. We attempt to limit exposure to this risk by monitoring carefully the amount of loans in specific industries and by exercising prudent lending practices. However, the risk that substantial credit losses could result in reduced earnings or losses cannot be eliminated.
The Company's focus on lending to small to mid-sized community-based businesses may increase its credit risk.
Most of our commercial business and commercial real estate loans are made to small business or middle-market customers. These businesses generally have fewer financial resources in terms of capital or borrowing capacity than larger entities and have a heightened vulnerability to economic conditions. Additionally, these loans may increase concentration risk as to industry or collateral securing our loans. If general economic conditions in the market areas in which we operate negatively impact this important customer sector, our results of operations and financial condition may be adversely affected. Moreover, a portion of these loans have been made by the Company recently, and the borrowers may not have experienced a complete business or economic cycle. The deterioration of the borrowers' businesses may hinder their ability to repay their loans with the Company, which could have a material adverse effect on our financial condition and results of operations.
Our allowance for credit losses may prove to be insufficient.
We maintain allowances for credit losses on loans, securities, and off-balance-sheet credit exposures. In the case of loans and securities, allowances for credit losses are contra-asset valuation accounts that are deducted from the amortized cost basis of these assets to present the net amount expected to be collected. In the case of off-balance-sheet credit exposures, the allowance for credit losses is a liability account reported as a component of other liabilities in our Consolidated Balance Sheets. The amount of each allowance account represents management's best estimate of current expected credit losses on these financial instruments considering available information, from internal and external sources, relevant to assessing exposure to credit loss over the contractual term of the instrument. Relevant available information includes historical credit loss experience, current conditions, and reasonable and supportable forecasts. As a result, the determination of the appropriate level of allowance for credit losses inherently involves a high degree of subjectivity and requires us to make significant estimates related to current and expected future credit risks and trends, all of which may materially change.
Factors that may impact the allowance for credit losses on loans, securities, and off-balance-sheet credit exposures include the following:
• Deterioration in economic conditions affecting borrowers and securities issuers • New information regarding existing loans, credit commitments, and securities holdings• Identification of additional problem loans• Ratings downgrades and other factors, both within and outside of our control
In addition, bank regulatory agencies periodically review our allowance for credit losses and may require an increase in credit loss expense or the recognition of further loan charge-offs, based on judgments different than those of management. Furthermore, if any charge-offs related to loans, securities, or off-balance-sheet credit
PART I
20

exposures in future periods exceed our allowances for credit losses on loans, securities, or off-balance-sheet credit exposures, we will need to recognize additional credit loss expense to increase the applicable allowance. Any increase in the allowance for credit losses on loans, securities, and off-balance-sheet credit exposures will result in a decrease in net income and, possibly, capital, and may have a material adverse effect on our business, financial condition, and results of operations. See "Recent accounting pronouncements" contained in Note 1 of the Consolidated Financial Statements for additional information.
Our credit standards and ongoing credit assessment processes might not protect us from significant credit losses.
We take credit risk by virtue of making loans and leases and extending loan commitments and letters of credit. We manage credit risk through a program of underwriting standards, the review of certain credit decisions, and an ongoing process of assessment of the quality of the credit already extended. Our exposure to credit risk is managed through the use of consistent underwriting standards that emphasize local lending while avoiding highly leveraged transactions as well as excessive industry and other concentrations. Our credit administration function employs risk management techniques to help ensure that problem loans and leases are promptly identified. While these procedures are designed to provide us with the information needed to implement policy adjustments where necessary and to take appropriate corrective actions, there can be no assurance that such measures will be effective in avoiding undue credit risk.
We rely upon independent appraisals to determine the value of real estate that secures a significant portion of our loans, and the values indicated by such appraisals may not be realizable if we are forced to foreclose upon such loans.
A significant portion of our loan portfolio consists of loans secured by real estate. We rely upon independent appraisers to estimate the value of such real estate. Appraisals are only estimates of value, and the independent appraisers may make mistakes of fact or judgment that adversely affect the reliability of their appraisals. In addition, events occurring after the initial appraisal may cause the value of the real estate to increase or decrease. As a result of any of these factors, the real estate securing some of our loans may be more or less valuable than anticipated at the time the loans were made. If a default occurs on a loan secured by real estate that is less valuable than originally estimated, we may not be able recover the outstanding balance of the loan.
We depend on the accuracy and completeness of information about clients and counterparties, and our financial condition could be adversely affected if we rely on misleading information.
In deciding whether to extend credit or to enter into other transactions with clients and counterparties, we may rely on information furnished to us by or on behalf of clients and counterparties, including financial statements and other financial information, which the Company does not independently verify. We also may rely on representations of clients and counterparties as to the accuracy and completeness of that information and, with respect to financial statements, on reports of independent auditors. For example, in deciding whether to extend credit to clients, we may assume that a customer's audited financial statements conform with accounting principles generally accepted in the United States and present fairly, in all material respects, the financial condition, results of operations, and cash flows of the customer. Our financial condition and results of operations could be negatively impacted to the extent we rely on financial statements that do not comply with GAAP or are materially misleading.
PART I
21
Liquidity Risk
Liquidity could be impaired by an inability to access the capital markets or an unforeseen outflow of cash.
Liquidity is essential to our businesses. Due to circumstances that we may be unable to control, such as a general market disruption or an operational problem that affects third parties or the Company, our liquidity could be impaired by an inability to access the capital markets or an unforeseen outflow of cash or deposits which could constrain our ability to make new loans or meet our existing lending commitments and could ultimately jeopardize our overall liquidity and capitalization.
Our credit ratings are also important to our liquidity. These ratings are based on a number of factors, including our overall financial strength, as well as factors not entirely within our control, such as conditions affecting the financial services industry generally. As a result, there can be no assurance that we will maintain our current ratings. A reduction in our credit ratings could adversely affect our liquidity and competitive position, increase our borrowing costs, or limit our access to capital markets.
Changes in interest rates could have a negative impact on our results of operations.
Our profitability is dependent to a large extent on our net interest income, which is the difference between interest income on interest-earning assets and interest expense on interest-bearing liabilities. Our net interest income is impacted by changes in market rates of interest, changes in credit spreads, changes in the shape of the yield curve, the interest rate sensitivity of our assets and liabilities, prepayments on our loans and investments, and the mix of our funding sources and assets.
Our interest-earning assets and interest-bearing liabilities may react in different degrees to changes in market interest rates. Interest rates on some types of assets and liabilities may fluctuate prior to changes in broader market interest rates, while rates on other types may lag behind. The result of these changes to rates may cause differing spreads on interest-earning assets and interest-bearing liabilities. Any substantial, unexpected, or prolonged change in market interest rates could have a material adverse effect on our business, financial condition, and results of operations. While we take measures, such as hedging our mortgage loans held for sale, intended to manage risks from changes in market interest rates, we cannot control or accurately predict changes in the rates of interest or be sure our protective measures are adequate.
Loss of deposits or a change in deposit mix could increase our funding costs.
Deposits are a low-cost and stable source of funding. We compete with banks and other financial institutions for deposits. Funding costs may increase because we may lose deposits and replace them with more expensive sources of funding, clients may shift their deposits into higher cost products, or we may need to raise interest rates to avoid losing deposits. Higher funding costs reduce our net interest margin, net interest income, and net income.
Our mortgage revenue is cyclical and sensitive to the level of interest rates, changes in economic conditions, decreased economic activity, and slowdowns in the housing market, any of which could adversely impact our profits.
The success of our mortgage business is dependent upon our ability to originate loans and sell them to investors at or near current volumes. Loan production levels are sensitive to changes in the level of interest rates, product availability, and changes in economic conditions. Loan production levels may suffer if we experience a slowdown in the housing markets in the regions in which we do business, or tightening credit conditions. Any sustained period of decreased activity caused by fewer home sales or refinancing transactions, higher interest rates, housing price pressure, or loan underwriting restrictions would adversely affect our mortgage originations and,
PART I
22

consequently, could significantly reduce our income from mortgage activities. As a result, these conditions would also adversely affect our results of operations.
We may be required to repurchase residential mortgage loans or reimburse investors and others as a result of breaches in contractual representations and warranties.
We sell residential mortgage loans to various parties, which may include government-sponsored entities and other bank and non-bank financial institutions that purchase residential mortgage loans for investment or private label securitization. We may be required to repurchase residential mortgage loans, indemnify the securitization trust, investor or insurer, or reimburse the securitization trust, investor or insurer for credit losses incurred on loans in the event of a breach of contractual representations or warranties that is not remedied within a specified period (usually 60 days or less) after we receive notice of the breach. Contracts for residential mortgage loan sales to these entities include various types of specific remedies and penalties that could be applied to inadequate responses to repurchase requests. If economic conditions and the housing market deteriorate or future investor repurchase demand and our success at appealing repurchase requests differ from past experience, we could have increased repurchase obligations and increased loss severity on repurchases, which could adversely affect operations.
Financial Risk
Economic and other conditions may cause volatility in the price of our common stock.
In the current economic environment, the prices of publicly traded stocks in the financial services sector have been volatile. However, even in a more stable economic environment, the price of our common stock can be affected by a variety of factors, such as expected or actual results of operations, changes in analysts' recommendations or projections, announcements of developments related to our businesses, operating and stock performance of other companies deemed to be peers, news or expectations based on the performance of others in the financial services industry, and expected impacts of a changing regulatory environment. These factors not only impact the price of our common stock, but could also affect the liquidity of the stock, given the Company's size, geographical footprint, and industry. The price for shares of our common stock may fluctuate significantly in the future, and these fluctuations may be unrelated to the Company's performance. General market price declines or market volatility in the future could adversely affect the price for shares of our common stock, and the current market price of such shares may not be indicative of future market prices.
Security breaches and other disruptions could compromise our information and expose us to liability or result in the loss of money, which could damage our reputation and our business.
We rely on the secure processing, storage, and transmission of confidential and other information in our computer systems and networks. While we have policies and procedures designed to prevent or limit the effect of a possible security breach, our computer systems, software, and networks may be vulnerable to unauthorized access, computer viruses, or other malicious code, and other events that could have a security impact. If one or more such events occur, this potentially could jeopardize our or our customers' confidential and other information processed and stored in, and transmitted through, our computer systems and networks, or otherwise cause interruptions or malfunctions in our or our customers' operations, or result in the loss of money. We may be required to expend significant additional resources to modify our protective measures or to investigate and remediate vulnerabilities or other exposures, and we may be subject to litigation and financial losses that are either not insured against or not fully covered through any insurance maintained by us.
Security breaches in our internet banking activities could further expose us to possible liability, financial loss, and damage to our reputation. Any compromise of our security also could deter customers from using our internet banking services that involve the transmission of confidential information. We have implemented security systems
PART I
23

to provide the security and authentication necessary to effect secure transmission of data. These precautions may not protect our systems from compromises or breaches of our security measures, which could result in damage to our reputation and our business.
Negative perception of the Company through media may adversely affect our reputation and business.
The Company's reputation is critical to the success of its business. We believe that our brand image has been well received by customers, reflecting the fact that the brand image, like our business, is based in part on trust and confidence. Our reputation and brand image could be negatively affected by rapid and widespread distribution of publicity through social and traditional media channels. Our reputation could also be affected by our association with clients affected negatively through media distribution, or other third parties, or by circumstances outside of our control. Negative publicity, whether true or untrue, could affect our ability to attract or retain customers, or cause us to incur additional liabilities or costs, or result in additional regulatory scrutiny.
Restrictions relating to the acquisition of our common stock may discourage an acquisition.
Certain provisions of our articles of incorporation and bylaws could delay or frustrate the removal of incumbent directors and could make a merger, tender offer, or proxy contest more difficult, even in instances where shareholders deem the proposed transaction to be beneficial to their interests. These provisions, among others, provide for staggered terms for the Board of Directors and that a plan of merger, share exchange, sale of all or substantially all of our assets, or similar transaction must be approved and recommended by the affirmative vote of at least two-thirds of the directors in office or, if not so approved and recommended, by the affirmative vote of the holders of 80% of our outstanding shares, and limit the ability of shareholders to call a special meeting. In addition, certain provisions of state and federal law may also have the effect of discouraging or prohibiting a future takeover attempt in which our shareholders might otherwise receive a substantial premium for their shares over then-current market prices. To the extent that these provisions discourage or prevent takeover attempts, they may tend to reduce the market price for our common stock.
Continued growth may require raising additional capital, which may dilute current shareholders' ownership percentage.
In order to meet applicable regulatory capital requirements, we may, from time to time, need to raise additional capital to support continued growth. If we sell our equity securities to raise additional funds, the relative ownership interests of our existing shareholders would likely be diluted.
Our quarterly financial results may fluctuate as a result of seasonality, which may make it difficult to predict our future performance and may adversely affect our common stock price.
We engage in certain lines of business that are historically subject to seasonal trends. These include mortgage banking and real estate brokerage services that reflect the general patterns of housing sales, which typically peak in the spring and summer seasons. Our non-mortgage and real estate-related businesses have various seasonality trends that may create further fluctuations in our quarterly operating results. Any of these seasonal trends, or the combination of them, may negatively impact the price of our common stock.
Potential downgrades of U.S. government securities by one or more of the credit ratings agencies could have a material adverse effect on our operations, earnings, and financial condition.
A possible future downgrade of the sovereign credit ratings of the U.S. government and/or a decline in the perceived creditworthiness of U.S. government-related obligations could impact our ability to obtain funding that
PART I
24

is collateralized by affected instruments, as well as affect the pricing of that funding when it is available. A downgrade may also adversely affect the market value of such instruments. We cannot predict if, when, or how any changes to the credit ratings or perceived creditworthiness of these obligations will affect economic conditions. A downgrade of the sovereign credit ratings of the U.S. government or the credit ratings of related institutions, agencies, or instruments could have a material adverse effect our business, financial condition, and results of operations.
General Business Risk
The outbreak of the COVID-19 pandemic has caused a significant global economic downturn that has adversely affected, and is expected to continue to adversely affect, our business and results of operations, and the future impacts of the COVID-19 pandemic on the global economy and our business, results of operations, liquidity, and financial condition remain uncertain.
COVID-19 continues to cause economic disruption both worldwide and in the markets we operate, as well as a destabilization effect on financial markets. The ultimate impacts of COVID-19 are uncertain and could have a material adverse effect on our business, financial condition, liquidity, and results of operations. The extent of these impacts will depend on future developments, including among others, governmental, regulatory, and private sector actions and responses, new information that may emerge concerning COVID-19, and actions taken to contain or prevent further spread, each of which are highly uncertain and cannot be predicted.
Our business is dependent upon the ability and willingness of our customers to conduct banking and other financial transactions, including the payment of loan obligations. COVID-19 has and continues to disrupt the business, activities, and operations of our customers, which may cause a decline in demand for our products and services, which may, in turn, result in a significant decrease in our business, negatively impacting our liquidity position and financial results. Our financial results could also be impacted due to an inability of our customers to meet their loan commitments because of their losses associated with the effects of COVID-19, resulting in increased risk of delinquencies, defaults, foreclosures, declining collateral values, and other losses to TowneBank. Moreover, current and future governmental action may temporarily require the Company to conduct business differently with respect to foreclosures, repossessions, payments, deferrals, and other customer-related transactions.
Although the Company has established a pandemic response plan and procedures, our workforce has been, is, and may continue to be impacted by COVID-19. We are taking precautions to protect the safety and well-being of our employees and customers, including temporary branch and office closures, but no assurance can be given that our actions will be adequate or appropriate, nor can we predict the level of disruption which will occur to our employees' ability to provide customer support and service. The spread could also negatively impact availability of key personnel and employee productivity, as well as the business and operations of third-party service providers who perform critical services for us, which could adversely impact our ability to deliver products and services to our customers.
Changes in the federal, state, or local tax laws may negatively impact our financial performance.
Changes in tax law could increase our effective tax rates. Such changes may be retroactive to previous periods and, as a result, could negatively affect our current and future financial performance. Similarly, our customers are likely to experience varying effects from both the individual and business tax provisions of new tax laws, and such effects, whether positive or negative, may have a corresponding impact on our business and the economy as a whole.
PART I
25

Strong competition in our primary market area and from non-traditional financial institutions may limit asset growth and profitability.
We encounter strong competition from other financial institutions in our primary market area. In addition, established financial institutions not already operating in our primary market area may open branches at future dates. In the conduct of certain aspects of our business, we also compete with savings institutions, credit unions, mortgage banking companies, consumer finance companies, insurance companies, real estate companies, and other institutions, some of which are not subject to the same degree of regulation or restrictions as are imposed upon us. Also, technology and other changes have lowered barriers to entry and made it possible for non-banks to offer products and services traditionally provided by banks. In particular, the activity of financial technology ("fintech") companies has grown significantly over recent years and is expected to continue to grow. Fintech companies have and may continue to offer bank or bank-like products and some fintech companies have applied for bank charters. In addition, other fintech companies have partnered with existing banks to allow them to offer deposit products to their customers. Many of these competitors have substantially greater resources and lending limits than we have and offer services that we do not provide. In addition, many of these competitors have numerous branch offices located throughout their extended market areas that provide them with a competitive advantage. Finally, these institutions may have differing pricing and underwriting standards, which may adversely affect our Company through the loss of business or cause a misalignment in our risk-return relationship. No assurance can be given that such competition will not have an adverse impact on our financial condition, and results of operations.
Legislative reforms, such as the Dodd-Frank Act, can result in our business becoming subject to significant and extensive additional regulations, which could adversely affect our results of operations and financial condition.
The Dodd-Frank Act may continue to result in significant changes in the regulation of financial institutions. As disclosed earlier in this Form 10-K, the Act contains numerous provisions that affect all banks and bank holding companies. Some of these provisions under the Dodd-Frank Act have the consequence of increasing our expenses, decreasing our revenues, and changing the activities in which we choose to engage. Other legislative and regulatory changes affecting capital, liquidity, taxes, supervision, permissible activities, corporate governance and compensation, fiscal policy, and steps to eliminate government support for banking organizations may have long-term effects on the business model and profitability of banking organizations that cannot now be foreseen. The specific impact of the Dodd-Frank Act on our current activities or new financial activities we may consider in the future, our financial performance, and the markets in which we operate will depend on the manner in which the relevant agencies develop and implement required rules and the reaction of market participants to these regulatory developments.
Increased capital standards may have an adverse effect on our profitability, lending, and ability to pay dividends on our securities.
In July 2013, the FDIC released its interim final rules that implement in the United States the Basel III regulatory capital reforms from the Basel Committee and certain changes required by the Dodd-Frank Act. Under the Basel III Capital Rules, minimum requirements have increased for both the quality and quantity of capital held by banking organizations. The rules became effective January 1, 2015, and were fully phased in on January 1, 2019. The potential impact of the Basel III Capital Rules includes, but is not limited to, reduced lending and negative pressure on profitability and return on equity due to higher capital requirements. To the extent the Company is required to increase capital in the future to comply with the Basel III Capital Rules, our ability to pay dividends may be reduced.
In December 2017, the Basel Committee published standards that it described as the finalization of the Basel III post-crisis regulatory reforms (the standards are commonly referred to as "Basel IV"). Among other things, these standards revise the Basel Committee's standardized approach for credit risk (including by recalibrating risk
PART I
26

weights and introducing new capital requirements for certain "unconditionally cancellable commitments," such as unused credit card lines of credit) and provides a new standardized approach for operational risk capital. Under the Basel framework, these standards will generally be effective on January 1, 2022, with an aggregate output floor phasing in through January 1, 2027. Under the current U.S. capital rules, operational risk capital requirements and a capital floor apply only to advanced approaches institutions, and not to the Company. The impact of Basel IV on us will depend on the manner in which it is implemented by the federal bank regulatory agencies.
Regulations issued by the Consumer Financial Protection Bureau could adversely affect our earnings.
The CFPB has broad rule-making authority to administer and carry out the provisions of the Dodd-Frank Act with respect to financial institutions that offer covered financial products and services to consumers. Pursuant to the Dodd-Frank Act, the CFPB has established a rule effective January 10, 2014, requiring mortgage lenders to make a reasonable and good-faith determination based on verified and documented information that a consumer applying for a mortgage loan has a reasonable ability to repay the loan according to its terms, or to originate "qualified mortgages" that meet specific requirements with respect to terms, pricing, and fees. The rule also contains disclosure requirements at mortgage loan origination and in monthly statements. These requirements could limit our ability to make certain types of loans or loans to certain borrowers, or could make it more expensive and/or time-consuming to make these loans, which could adversely impact our profitability
Extensive government regulation and monetary policy could adversely affect operations.
As part of the financial services industry, we are subject to extensive governmental supervision, regulation, and control that have materially affected the business of financial institutions in the past and are likely to do so in the future. Regulations affecting the financial services industry and, therefore, us may be changed at any time, and the interpretation of those regulations by examining authorities of the financial services industry is also subject to change. There can be no assurance that future changes in legislation, administrative regulations, or governmental policy will not adversely affect the financial services industry and our business.
Our business is concentrated in the Mid-Atlantic region and the deterioration of economic conditions in the markets in which we operate could have a material adverse impact on our financial condition and results of operations.
We do business primarily in the Richmond, Virginia region, the Greater Hampton Roads region in southeastern Virginia, northeastern North Carolina, and the Charlotte, Greensboro, Greenville, and Raleigh metropolitan areas in North Carolina. Since we are a community-focused financial institution, our business is particularly sensitive to the local economic conditions in those markets. Adverse changes in economic conditions in our market areas would likely impair our ability to collect loans and could otherwise have a material adverse effect on our business, financial condition and results of operations.
In addition, the U.S. military has a major presence in Greater Hampton Roads and is an important aspect of the Greater Hampton Roads economy. Actual and proposed cuts to defense and other security spending could have an adverse impact on the Greater Hampton Roads economy, which could adversely affect our business, financial condition and results of operations.
Severe weather, natural disasters, sea level rise, acts of war or terrorism, and other external events could significantly impact our business.
Severe weather, natural disasters, sea level rise and other environmental risks, acts of war or terrorism, and other adverse external events could have a significant impact on our ability to conduct business. In addition, such events could affect the stability of our deposit base, impair the ability of borrowers to repay outstanding loans, impair the
PART I
27

value of collateral securing loans, cause significant property damage, result in loss of revenue, and/or cause us to incur additional expenses. The occurrence of any such event in the future could have a material adverse effect on our business, which, in turn, could have a material adverse effect on our financial condition and results of operations.
Item 1B. UNRESOLVED STAFF COMMENTS
None.
Item 2. PROPERTIES
Our bank's main office is located in Portsmouth, Virginia, and our Corporate Administration and Member Service Center is located in Suffolk, Virginia; we own both of these locations. As of December 31, 2020, we occupied an additional 150 properties, of which we own 39, in the cities and counties in which we operate. We consider our properties to be suitable and adequate for our present needs. Additional information with respect to the amounts at which company premises and equipment are carried and commitments under long-term leases is set forth in Note 7 - Premises and Equipment and Note 8 - Leases in the Annual Report and incorporated herein.
Item 3. LEGAL PROCEEDINGS
In the ordinary course of operations, we are a party to various legal proceedings. Based upon information currently available, management believes that such legal proceedings, in the aggregate, will not have a material adverse effect on our business, financial condition, or results of operations.
Item 4. MINE SAFETY DISCLOSURES
Not applicable.
PART I
28

Item 5. MARKET FOR REGISTRANT'S COMMON EQUITY, RELATED STOCKHOLDER MATTERS, AND ISSUER'S PURCHASES OF EQUITY SECURITIES
Market Information
Our common stock is listed on the Nasdaq Global Select Market under the symbol TOWN.
Holders
As of December 31, 2020, we had issued and outstanding 72,667,541 shares of common stock. These shares were held by approximately 12,525 shareholders of record.
Dividends
Beginning in the first quarter of 2020 through the first quarter of 2021, we declared quarterly cash dividends of $0.18 per common share. In the first quarter of 2019, the Company declared a quarterly cash dividend of $0.16 per common share. In May, August, and November 2019, the Company declared quarterly cash dividends of $0.18 per common share. All dividends paid are limited by the requirement to meet capital guidelines issued by regulatory authorities, and future declarations are subject to financial performance and regulatory guidelines.
Our future dividend policy is subject to the discretion of the Board of Directors and will depend upon a number of factors, including future earnings, financial condition, cash requirements, and general business conditions. We are also subject to certain restrictions imposed by the reserve and capital requirements of federal and Virginia banking statutes and regulations. See Part I, Item 1, "Business - Supervision and Regulation," for information on regulatory restrictions on dividends.
Stock Performance Graph
The following stock performance graph presents the cumulative total return comparison through December 31, 2020, of stock appreciation for our common stock, the Nasdaq Composite Index measuring all Nasdaq domestic and international-based common type stocks listed on the Nasdaq Stock Market ("Nasdaq Composite"), the SNL Securities Index including banks greater than $10 billion in total assets ("SNL Bank > $10B Index"), and the SNL Securities Index including only banks in the Southeast ("SNL Southeast Bank Index"). Returns assume an initial investment of $100 at the market close of December 31, 2015, and reinvestment of dividends.
PART II
29

Period Ending
Inde
x V
alue
Total Return PerformanceTowneBank Nasdaq Composite IndexSNL Bank > $10B Index SNL Southeast Bank Index
12/31/15 12/31/16 12/31/17 12/31/18 12/31/19 12/31/20100
150
200
250
300
Index 12/31/2015 12/31/2016 12/31/2017 12/31/2018 12/31/2019 12/31/2020
TowneBank $ 100.00 $ 162.86 $ 153.23 $ 121.97 $ 145.40 $ 127.60
Nasdaq Composite Index 100.00 108.87 141.13 137.12 187.44 271.64
SNL Bank > $10B Index 100.00 124.93 149.05 123.15 167.83 134.58
SNL Southeast Bank Index 100.00 132.75 164.21 135.67 191.06 172.07
Item 6. SELECTED FINANCIAL DATA
Reference is made to the information in the section entitled, "Selected Financial Highlights," of our Annual Report for the year ended December 31, 2020, which is incorporated herein by reference.
Item 7. MANAGEMENT'S DISCUSSION AND ANALYSIS OF FINANCIAL CONDITION AND RESULTS OF OPERATIONS
Reference is made to the information in the section entitled, "Management's Discussion and Analysis," of our Annual Report, which is incorporated herein by reference.
Item 7A. QUANTITATIVE AND QUALITATIVE DISCLOSURES ABOUT MARKET RISK
Reference is made to the information in the section entitled, "Management's Discussion and Analysis," under subsections "Interest Sensitivity," "Market Risk Management," "Earnings Simulation Analysis," "Market Value Simulation," and "Credit Risk Elements," of our Annual Report, which is incorporated herein by reference.
PART II
30
Item 8. FINANCIAL STATEMENTS AND SUPPLEMENTARY DATA
Reference is made to the information in the sections entitled, "Management's Report on Internal Control," "Report of Independent Registered Public Accounting Firm," and "Consolidated Financial Statements and Notes," of our Annual Report, which is incorporated herein by reference.
Item 9. CHANGES IN AND DISAGREEMENTS WITH ACCOUNTANTS ON ACCOUNTING AND FINANCIAL DISCLOSURES
None.
Item 9A. CONTROLS AND PROCEDURES
Disclosure Controls and Procedures. An evaluation of our disclosure controls and procedures (as defined in Rule 13a-15(e) under the Exchange Act) was carried out as of December 31, 2020, under the supervision and with the participation of our Chief Executive Officer, Chief Financial Officer, and several other members of our senior management. Based upon that evaluation, the Chief Executive Officer and Chief Financial Officer concluded that the disclosure controls and procedures were effective as of the end of the period covered by this report.
Management's Report on Internal Control Over Financial Reporting. The annual report of management on the effectiveness of our internal control over financial reporting and the attestation report thereon issued by our independent registered public accounting firm are set forth under "Management's Report on Internal Control" and "Report of Independent Registered Public Accounting Firm" of our Annual Report, which is incorporated herein by reference.
Changes in Internal Control Over Financial Reporting. There were no changes in our internal controls over financial reporting that occurred during the last fiscal quarter that have materially affected, or are reasonably likely to materially affect, our internal control over financial reporting.
Item 9B. OTHER INFORMATION
None.
PART II
31

Item 10. DIRECTORS, EXECUTIVE OFFICERS, AND CORPORATE GOVERNANCE
Reference is made to the information in the sections entitled, "Election of Directors," "Delinquent Section 16(a) Reports," and "Board of Directors and Committees," of our definitive Proxy Statement for the Annual Meeting of Shareholders to be held June 2, 2021 ("2021 Proxy Statement"), which sections are incorporated herein by reference. The following information is provided, as of February 28, 2021, for those executive officers who are not directors.
Name (Age) Principal Occupation During Past Five Years
Matt Davis (53) Senior Executive Vice President and Chief Strategy and Risk Officer since September 2019; President, NC Region of TowneBank from February 2019 to August 2019; Chief Operating Officer Paragon Bank from December 2012 to January 2019; Chief Credit Officer Paragon Bank from June 2002 to November 2012.
Kevin L. Fly (55) Senior Executive Vice President and Chief Accounting Officer since May 2018; Executive Vice President - Financial Reporting, Tax, and Policy from June 2013 to May 2018; Senior Vice President and Director of Financial Reporting from December 2007 to June 2013.
Dawn Glynn (53) President- Hampton Roads and Northeastern North Carolina since August 2020, President, Retail and Private Banking since January 2019; President and Regional Executive Officer for Portsmouth/Chesapeake/Suffolk from 2016 to 2018; President for Portsmouth/Chesapeake/Suffolk from 2013 to 2016; President for Chesapeake from 2010 to 2013.
William B. Littreal (50) Senior Executive Vice President and Chief Financial Officer since March 2018; Senior Executive Vice President and Chief Strategy Officer and Director of Investor Relations since June 2016; Senior Executive Vice President and Chief Operating Officer from April 2011 to June 2016; Executive Vice President and Director of Finance from April 2008 to April 2011.
Brian Skinner (50) Senior Executive Vice President and Chief Banking Officer since January 2019; Regional Executive Officer of Peninsula/Williamsburg from 2007 to 2018.
George P. Whitley (68) Senior Executive Vice President and Chief Legal Officer since October 2016; Partner, LeClairRyan, Richmond, Virginia, from May 1994 to September 2016.
Code of Ethical Conduct
We have adopted a Code of Ethical Conduct that applies to our Executive Chairman, Chief Executive Officer and other executive officers and senior financial officers, including our Chief Financial Officer, Chief Accounting Officer, Chief Audit Executive, any person Executive Vice President and above in a Corporate Accounting position, any Regulation O executive officers along with any person serving in an equivalent position regardless of whether or not they are designated as executive officers for Regulation O purposes, or any persons serving in equivalent positions within the Company. The Code of Ethical Conduct is included as Exhibit 14. Any changes in or waivers from our Code of Ethical Conduct applicable to the Executive Chairman, Chief Executive Officer and any other executive officer or senior financial officer shall be promptly disclosed through a filing with the FDIC on Form 8-K.
PART III
32

A written copy of our Code of Ethical Conduct is available free of charge to shareholders who request it by writing to: TowneBank, 6001 Harbour View Boulevard, Suffolk, Virginia 23435. We also provide this information on our website, www.townebank.com, under Investor Relations, Governance Documents, Code of Conduct.
Item 11. EXECUTIVE COMPENSATION
Reference is made to the information in the sections entitled, "Compensation Committee Report," "Compensation Discussion and Analysis," "Named Executive Officers Compensation," "Compensation of Directors," and "Board of Directors and Committees," of the 2021 Proxy Statement, which sections are incorporated herein by reference.
Item 12. SECURITY OWNERSHIP OF CERTAIN BENEFICIAL OWNERS AND MANAGEMENT AND RELATED STOCKHOLDER MATTERS
Reference is made to the information in the section entitled, "Ownership of Company Common Stock," of the 2021 Proxy Statement, which section is incorporated herein by reference.
The following table summarizes information, as of December 31, 2020, relating to our stock incentive plans, pursuant to which grants of options to acquire shares of common stock may be awarded from time to time.
Number of securities to be issued upon exercise of
outstanding options, warrants, and rights
Weighted average exercise price of outstanding options,
warrants, and rights
Number of securities remaining available for
future issuance under equity compensation plans (1)
(A) (B) (C)Equity compensation plans approved by security holders 1,287 $14.12 1,844,419Equity compensation plans not approved by security holders — — —Total 1,287 $14.12 1,844,419
(1) Consists of shares available for future issuance under TowneBank's equity compensation plans.
Item 13. CERTAIN RELATIONSHIPS, RELATED TRANSACTIONS, AND DIRECTOR INDEPENDENCE
Reference is made to the information in the sections entitled, "Related Party Transactions," "Election of Directors," and "Board of Directors and Committees," of the 2021 Proxy Statement, which sections are incorporated herein by reference.
Item 14. PRINCIPAL ACCOUNTING FEES AND SERVICES
Reference is made to the information in the section entitled, "Accounting Firm Fees," of the 2021 Proxy Statement, which section is incorporated herein by reference.
PART III
33

Item 15. EXHIBITS AND FINANCIAL STATEMENT SCHEDULES
a) The following documents are filed as part of this report.
(1) Financial StatementsThe following documents are included in the 2020 Annual Report to Shareholders and are incorporated by reference in this report:
Report of Independent Registered Public Accounting FirmManagement's Report on Internal ControlConsolidated Balance SheetsConsolidated Statements of IncomeConsolidated Statements of Comprehensive IncomeConsolidated Statements of EquityConsolidated Statements of Cash FlowsNotes to Consolidated Financial Statements
(2) Financial Statement SchedulesAll financial statement schedules as required by Item 8 and Item 15 of Form 10-K have been omitted because the information requested is not required, not applicable, or is shown in the Consolidated Financial Statements or Notes thereto.
(3) ExhibitsThe following exhibits are filed as part of this Form 10-K and this list includes the Exhibit Index.
Exhibit No. Description
1.1 Purchase Agreement, dated July 12, 2017, by and between TowneBank and Sandler O'Neill + Partners, L.P. (incorporated herein by reference to Exhibit 1.1 to our Form 8-K, previously filed with the FDIC on July 14, 2017).
2.1 Agreement and Plan of Reorganization, dated April 26, 2017, by and among TowneBank, TB Acquisition, LLC, Paragon Commercial Corporation and Paragon Commercial Bank (incorporated herein by reference to Exhibit 2.1 to our Form 8-K, previously filed with the FDIC on May 2, 2017).
3.1 Articles of Incorporation, as amended (incorporated herein by reference to Exhibit 3.1 to our Form 10-Q, previously filed with the FDIC on August 6, 2014).
3.2 Articles of Amendment to the Articles of Incorporation (incorporated herein by reference to Exhibit 3.1 to our Form 8-K, previously filed with the FDIC on December 14, 2018).
3.3 Bylaws, as amended (incorporated herein by reference to Exhibit 3.2 to our Form 8-K, previously filed with the FDIC on March 31, 2020).
PART IV
34

Exhibits continued
4.1 Form of Global 4.50% Subordinated Note due 2027 (incorporated herein by reference to Exhibit 4.1 to our Form 8-K, previously filed with the FDIC on July 17, 2017).
4.2 Description of TowneBank's Securities.10.1 Employment Agreement, dated October 1, 2005, between TowneBank and
Jacqueline B. Amato (incorporated herein by reference to Exhibit 10 to our Form 8-K, previously filed with the FDIC on February 15, 2006).
10.2 Form of Employment Agreement entered into between TowneBank and each of G. Robert Aston, Jr., J. Morgan Davis, and Philip M. Rudisill (incorporated herein by reference to Exhibit 10.5 to our 2002 Form 10-K, previously filed with the FDIC on March 26, 2003).
10.3 Form of Employment Agreement entered into between TowneBank and each of William I. Foster, III, Thomas L. Hasty, III, and Keith D. Horton, (incorporated herein by reference to Exhibit 10.4 to our 2002 Form 10-K, previously filed with the FDIC on March 26, 2003).
10.4 Form of Change in Control Agreement entered into between TowneBank and each of G. Robert Aston, Jr., J. Morgan Davis, and Philip M. Rudisill (incorporated herein by reference to Exhibit 10.4 to our 2003 Form 10-K, previously filed with the FDIC on February 25, 2004).
10.5 First Amendment to the Amended and Restated Change in Control Employment Agreement, dated May 15, 2019, between TowneBank and G. Robert Aston, Jr. (incorporated herein by reference to Exhibit 10.1 to our Form 8-K, previously filed with the FDIC on May 15, 2019).
10.6 First Amendment to the Amended and Restated Change in Control Employment Agreement, dated May 15, 2019, between TowneBank and J. Morgan Davis (incorporated herein by reference to Exhibit 10.2 to our Form 8-K, previously filed with the FDIC on May 15, 2019).
10.7 Form of Change in Control Agreement entered into between TowneBank and each of William I. Foster, III, Thomas L. Hasty, III, and Keith D. Horton (incorporated herein by reference to Exhibit 10.5 to our 2004 Form 10-K, previously filed with the FDIC on February 23, 2005).
10.8 Amended and Restated Employment Agreement, dated November 27, 2019, between TowneBank and William B. Littreal (incorporated herein by reference to Exhibit 10.1 to our Form 8-K, previously filed with the FDIC on November 27, 2019).
10.9 Change in Control Employment Agreement, dated November 27, 2019, by and between TowneBank and William B. Littreal (incorporated herein by reference to Exhibit 10.2 to our Form 10-Q, previously filed with the FDIC on November 27, 2019).
10.10 Form of Supplemental Executive Retirement Plan (incorporated herein by reference to Exhibit 10.7 to our 2008 Form 10-K, previously filed with the FDIC on March 13, 2009).
10.11 TowneBank 2008 Stock Incentive Plan (incorporated herein by reference to Exhibit 10.8 to our 2008 Form 10-K, previously filed with the FDIC on March 13, 2009).
PART IV
35

Exhibits continued
10.12 TowneBank 2017 Stock Incentive Plan (incorporated herein by reference to Appendix A to the Proxy Statement for the 2017 Annual Meeting of Shareholders on Schedule 14A, previously filed with the FDIC on April 21, 2017).
10.13 TowneBank Annual Incentive Compensation Plan (incorporated herein by reference to Appendix B to the Proxy Statement for the 2017 Annual Meeting of Shareholders on Schedule 14A, previously filed with the FDIC on April 21, 2017).
10.14 Amended and Restated Split Dollar Life Insurance Agreement, dated as of August 24, 2016, entered into between TowneBank and the trustees of two separate irrevocable life insurance trusts established by G. Robert Aston, Jr., for the benefit of certain family members (incorporated herein by reference to Exhibit 10.1 to our Form 8-K, previously filed with the FDIC on August 30, 2016).
10.15 Transition and Consulting Agreement, dated as of November 9, 2016, entered into between TowneBank and Jacqueline B. Amato (incorporated herein by reference to Exhibit 10.1 to our Form 8-K, previously filed with the FDIC on November 15, 2016).
10.16 Employment Agreement, dated December 16, 2015, by and between TowneBank and Brad E. Schwartz (incorporated herein by reference to Exhibit 10.1 to our Form 10-Q, previously filed with the FDIC on August 9, 2016).
10.17 Employment Agreement, dated December 16, 2015, by and between TowneBank and William T. Morrison (incorporated herein by reference to Exhibit 10.3 to our Form 10-Q, previously filed with the FDIC on August 9, 2016).
10.18 Change in Control Employment Agreement, dated December 16, 2015, by and between TowneBank and Brad E. Schwartz (incorporated herein by reference to Exhibit 10.4 to our Form 10-Q, previously filed with the FDIC on August 9, 2016).
10.19 Change in Control Employment Agreement, dated December 16, 2015, by and between TowneBank and William T. Morrison (incorporated herein by reference to Exhibit 10.6 to our Form 10-Q, previously filed with the FDIC on August 9, 2016).
10.20 Retirement Agreement, dated February 5, 2018, by and between TowneBank and Clyde E. McFarland, Jr. (incorporated herein by reference to Exhibit 10.1 to our Form 8-K, previously filed with the FDIC on February 9, 2018).
10.21 Consulting Agreement, dated February 5, 2018, by and between TowneBank and Clyde E. McFarland, Jr. (incorporated herein by reference to Exhibit 10.2 to our Form 8-K, previously filed with the FDIC on February 9, 2018).
10.22 Employment and Consulting Agreement, dated April 26, 2017, by and between TowneBank and Robert C. Hatley (incorporated herein by reference to Exhibit 10.21 to our Form 10-K, previously filed with the FDIC on March 1, 2018).
13 2020 Annual Report to Shareholders.14 Code of Ethical Conduct.21 Subsidiaries of TowneBank.
PART IV
36

Exhibits continued
31.1 CEO Certification Pursuant to Section 302 of the Sarbanes-Oxley Act of 2002.
31.2 CFO Certification Pursuant to Section 302 of the Sarbanes-Oxley Act of 2002.32 Certification Pursuant to 18 U.S.C. Section 1350, as adopted by Section 906
of the Sarbanes-Oxley Act of 2002.
b) See (a)(3) above for all exhibits filed herewith and the Exhibit Index.
c) All schedules are omitted as the required information is not applicable or the information is presented in the Consolidated Financial Statements or related Notes.
Item 16. FORM 10-K SUMMARY
Not applicable.
PART IV
37

Pursuant to the requirements of Section 13 or 15(d) of the Securities Exchange Act of 1934, the registrant has duly caused this report to be signed on its behalf by the undersigned, thereunto duly authorized.
Registrant
February 26, 2021 /s/ J. Morgan Davis Date By: J. Morgan Davis
President/Chief Executive Officer
Pursuant to the requirements of the Securities Exchange Act of 1934, this report has been signed below by the following persons on behalf of the registrant and in the capacities indicated on February 26, 2021:
SIGNATURES
/s/ Jacqueline B. AmatoJacqueline B. Amato Director
/s/ G. Robert Aston, Jr.G. Robert Aston, Jr. Executive Chairman of the Board, Director
/s/ E. Lee BaynorE. Lee Baynor Director
/s/ Jeffrey F. BensonJeffrey F. Benson Vice Chairman of the Board, Director
/s/ Richard S. BrayRichard S. Bray Lead Director
Thomas C. Broyles Director
SIGNATURES

/s/ Bradford L. CherryBradford L. Cherry Director
/s/ J. Morgan DavisJ. Morgan Davis President and Chief Executive Officer, Director (principal
executive officer)
/s/ Douglas D. EllisDouglas D. Ellis Director
/s/ John W. FailesJohn W. Failes Vice Chairman of the Board, Director
Andrew S. Fine Director
/s/ Kevin L. FlyKevin L. Fly Senior Executive Vice President and Chief Accounting Officer
(principal accounting officer)
/s/ William I. Foster, IIIWilliam I. Foster, III President, Central Virginia and the Carolinas, Director
Robert C. Hatley Director
/s/ Howard J. JungHoward J. Jung Director
SIGNATURES

/s/ John R. Lawson, IIJohn R. Lawson, II Director
/s/ Harry T. LesterHarry T. Lester Director
/s/ W. Ashton LewisW. Ashton Lewis Director
/s/ William B. LittrealWilliam B. Littreal Senior Executive Vice President and Chief Financial Officer
(principal financial officer)
/s/ Stephanie J. MarioneauxStephanie J. Marioneaux Director
/s/ Juan M. Montero, IIJuan M. Montero, II Director
/s/ R. Scott MorganR. Scott Morgan Director
/s/ William T. MorrisonWilliam T. Morrison Chairman and Chief Executive Officer of TowneBank Mortgage
and Realty Group, Director
/s/ Thomas K. Norment, Jr.Thomas K. Norment, Jr. Director
/s/ Robert M. OmanRobert M. Oman Director
SIGNATURES

/s/ R.V. Owens, IIIR.V. Owens, III Director
/s/ Elizabeth T. PattersonElizabeth T. Patterson Director
/s/ Elizabeth W. RobertsonElizabeth W. Robertson Director
/s/ Dwight C. SchaubachDwight C. Schaubach Director
/s/ Brad E. SchwartzBrad E. Schwartz Senior Executive Vice President and Chief Operating Officer,
Director
/s/ Richard B. ThurmondRichard B. Thurmond Director
/s/ Alan S. WittAlan S. Witt Director
/s/ F. Lewis WoodF. Lewis Wood Director
SIGNATURES

2020 Annual Report
KEHousto
Typewritten Text
Exhibit 13

TowneBankTABLE OF CONTENTS
GLOSSARY............................................................................................................................................ 2
BUSINESS PROFILE AND CORPORATE MISSION STATEMENT................................................. 4
SELECTED FINANCIAL HIGHLIGHTS.............................................................................................. 5
MANAGEMENT'S DISCUSSION AND ANALYSIS.......................................................................... 7
REPORT OF INDEPENDENT REGISTERED PUBLIC ACCOUNTING FIRM................................ 41
MANAGEMENT'S REPORT ON INTERNAL CONTROL................................................................. 45
CONSOLIDATED FINANCIAL STATEMENTS AND NOTES......................................................... 46
SHAREHOLDER INFORMATION....................................................................................................... 116

As used in this report, the terms "Company," "we," "us," and "our" refer to TowneBank and our consolidated subsidiaries. The following list of acronyms and abbreviations are used in various sections of this Report, including the Notes to Consolidated Financial Statements and Management's Discussion and Analysis of Financial Condition and Results of Operations.
ACL Allowance for Credit LossAFS Available-for-SaleALCO Asset/Liability Management CommitteeALLL Allowance for Loan and Lease LossesAngel Angel Insurance and Financial Services, Inc.AOCI Accumulated Other Comprehensive Income (Loss)Appropriations Act Consolidated Appropriations Act 2021ASC Accounting Standard CodificationASU Accounting Standards UpdateBasel III Basel Committee on Banking Supervision’s Capital Guidelines for U.S. BanksBOLI Bank-Owned Life Insurancebp Basis PointsBSA Bank Secrecy ActC&I Commercial and IndustrialCARES Act Coronavirus Aid, Relief, and Economic Security ActCDA Collateral-Dependent AssetCDARS Certificate of Deposit Account Registry ServiceCECL Current Expected Credit LossCETI Common Equity Tier ICRE Commercial Real EstateDCF Discounted Cash FlowEAD Exposure at DefaultECL Expected Credit LossEPS Earnings Per ShareFASB Financial Accounting Standards BoardFDIC Federal Deposit Insurance CorporationFederal Reserve Board of Governors of the Federal Reserve SystemFHLB Federal Home Loan Bank of AtlantaFHLMC The Federal Home Loan Mortgage CorporationFNMA The Federal National Mortgage AssociationFOMC Federal Reserve Open Market CommitteeFRB - Richmond Federal Reserve Bank of RichmondFTE Full-time Equivalent EmployeeGAAP Accounting Principles Generally Accepted in the United States of AmericaG. C. Johnson George C. Johnson Insurance AgencyGNMA Government National Mortgage AssociationGSE Government Sponsored EnterpriseHELOC Residential Home Equity Lines of CreditHTM Held-to-Maturity
TOWNEBANKGLOSSARY OF ACRONYMS AND DEFINED TERMS
2

LGD Loss Given DefaultLHFS Loans Held for SaleLIBOR London InterBank Offered RateLIHTC Low Income Housing Tax CreditsMonarch Monarch Financial Holdings, Inc.MBS Mortgage-backed SecurityN/M Not meaningfulOCI Other Comprehensive IncomeOIS Overnight Index SwapOREO Other Real Estate OwnedOTTI Other Than Temporary ImpairmentParagon Paragon Commercial CorporationParagon Bank Paragon Commercial BankPCD Purchase Credit DeterioratedPCI Purchase Credit ImpairedPD Probability of DefaultPPP Paycheck Protection ProgramRed Sky Red Sky Travel InsuranceREPO Retail Repurchase AgreementResi-Mort Residential MortgageRJFS Raymond James Financial Services, Inc.ROA Annualized Return on Average AssetsROE Annualized Return on Average EquitySBA U.S. Small Business AdministrationSCC Virginia State Corporation CommissionSEC Securities and Exchange CommissionSERP Supplemental Executive Retirement PlanSIL Straus, Itzkowitz & LeCompte Insurance Agency, Inc.TCJA or Tax Act Tax Cuts and Jobs Act of 2017TBA To Be AnnouncedTDR Troubled Debt RestructuringTIG Towne Investment GroupTWM Towne Wealth ManagementU.S. United States of AmericaVIE Variable Interest Entity
TOWNEBANKGLOSSARY OF ACRONYMS AND DEFINED TERMS
3

BUSINESS PROFILE
TowneBank was organized in 1998 under the laws of the Commonwealth of Virginia to engage in a general retail and commercial banking business and began operations on April 8, 1999. We place special emphasis on serving the financial needs of individuals, commercial enterprises, and professionals in Richmond, Virginia, the Greater Hampton Roads region in southeastern Virginia, northeastern North Carolina, Raleigh, Charlotte, Greensboro, and Greenville, North Carolina.
We offer a full range of banking and related financial services through our controlled divisions and subsidiaries. Unless indicated otherwise, the terms "Company," "we," "us," and "our" refer to TowneBank and our consolidated subsidiaries.
Since our inception, we have expanded our financial services to include banking, real estate, mortgage, title, insurance, employee benefit services, and investments. We have three reportable segments: Banking, Realty, and Insurance.
Banking Segment. The Banking segment provides loan and deposit services to retail and commercial customers. We also provide commercial mortgage brokerage services and a variety of investment and asset management services.
Realty Segment. The Realty segment provides residential real estate services, originations of a variety of mortgage loans, resort property management, and residential and commercial title insurance.
Insurance Segment. The Insurance segment provides solutions for businesses, individuals, and community organizations. As an independent agency, Towne Insurance works with a variety of carriers to provide a wide array of insurance products, including property, casualty, life, and health insurance.
CORPORATE MISSION STATEMENT
TowneBank will be a relationship and friendship-driven local bank focused on basic human values that will serve to create a warm sense of belonging and financial well-being among our family of members.
We will offer a competitive array of business and personal financial services, delivered only with the highest ethical standards. Our commitment to exquisite service for our members will lead to our ability to create a reasonable rate of return for our shareholders, a bright future for our dedicated bankers, and a leadership role for our bank in promoting the social, cultural, and economic well-being of the communities we serve.
TOWNEBANKBUSINESS PROFILE AND CORPORATE MISSION STATEMENT
4

Year Ended December 31, 2020 2019 Increase/(Decrease)(Dollars in thousands, except per share data)
Results of Operations:Net interest income $ 380,144 $ 358,355 $ 21,789 6.08 %Noninterest income 284,191 205,588 78,603 38.23 %Total revenue 664,335 563,943 100,392 17.80 %Noninterest expenses 395,825 378,302 17,523 4.63 %Provision for credit losses 67,177 9,371 57,806 616.86 %Net income attributable to TowneBank 145,535 138,783 6,752 4.87 %Net income per common share - basic 2.01 1.93 0.08 4.15 %Net income per common share - diluted 2.01 1.92 0.09 4.69 %
Period End Data:Total assets $ 14,626,444 $ 11,947,663 $ 2,678,781 22.42 %Total assets - tangible (1) 14,128,583 11,446,448 2,682,135 23.43 %Earning assets 13,402,717 10,687,658 2,715,059 25.40 %Loans (net of unearned income and deferred costs) 9,629,068 8,419,288 1,209,780 14.37 %Allowance for credit losses 120,157 58,234 61,923 106.33 %Goodwill and other intangibles 497,861 501,215 (3,354) (0.67) %Noninterest-bearing deposits 4,374,566 2,951,225 1,423,341 48.23 %Interest-bearing deposits 7,198,600 6,319,692 878,908 13.91 %
Total deposits 11,573,166 9,270,917 2,302,249 24.83 %Equity 1,783,828 1,653,694 130,134 7.87 %Equity - tangible (1) 1,285,967 1,152,479 133,488 11.58 %Book value per share 24.31 22.58 1.73 7.66 %Book value per share - tangible (1) 17.46 15.69 1.77 11.28 %Cash dividends declared per share 0.72 0.70 0.02 2.86 %
Daily Average Balances:Total assets $ 14,172,206 $ 11,638,426 $ 2,533,780 21.77 %Total assets - tangible (1) 13,676,499 11,135,318 2,541,181 22.82 %Earning assets 12,008,805 10,428,539 1,580,266 15.15 %Loans (net of unearned income and deferred costs) 9,436,628 8,133,735 1,302,893 16.02 %Allowance for loan losses 85,570 54,476 31,094 57.08 %Goodwill and other intangibles 495,707 503,108 (7,401) (1.47) %Noninterest-bearing deposits 3,924,797 2,844,178 1,080,619 37.99 %Interest-bearing deposits 6,746,284 6,110,692 635,592 10.40 %
Total deposits 10,671,081 8,954,870 1,716,211 19.17 %Equity 1,721,059 1,597,281 123,778 7.75 %Equity - tangible (1) 1,225,352 1,094,173 131,179 11.99 %
Key Ratios:Return on average assets 1.03 % 1.19 % (0.16) % (13.45) %Return on average tangible assets (1) 1.13 % 1.33 % (0.20) % (15.04) %Return on average equity 8.46 % 8.69 % (0.23) % (2.65) %Return on average tangible equity (1) 12.62 % 13.58 % (0.96) % (7.07) %Net interest margin (1)(2) 3.18 % 3.46 % (0.28) % (8.09) %Efficiency ratio (1) 60.33 % 64.79 % (4.46) % (6.88) %Average earning assets/total average assets 84.73 % 89.60 % (4.87) % (5.44) %Average loans/average deposits 88.43 % 90.83 % (2.40) % (2.64) %Average noninterest deposits/total average deposits 36.78 % 31.76 % 5.02 % 15.81 %Allowance for loan losses/period end loans 1.25 % 0.69 % 0.56 % 81.16 %Period end equity/period end total assets 12.20 % 13.84 % (1.64) % (11.85) %
(1) Non-GAAP financial measure. See the Non-GAAP Financial Measures section of Management's Discussion and Analysis for reconciliation.
(2) Presented on a tax-equivalent basis.
TOWNEBANKSELECTED FINANCIAL HIGHLIGHTS
5

Year Ended December 31, 2018 2017 2016(Dollars in thousands, except per share data)
Results of Operations:Net interest income $ 341,073 $ 261,121 $ 218,876 Noninterest income 191,593 188,121 155,222 Total revenue 532,666 449,242 374,098 Noninterest expenses 352,124 296,214 267,828 Provision for loan losses 8,541 5,426 5,357 Net income attributable to TowneBank 133,793 87,663 67,250 Net income per common share - basic 1.88 1.41 1.18 Net income per common share - diluted 1.88 1.41 1.18
Period End Data:Total assets $ 11,163,030 $ 8,522,176 $ 7,973,915 Total assets - tangible (1) 10,670,620 8,213,358 7,671,149 Earning assets 10,079,846 7,706,747 7,157,391 Loans (net of unearned income and deferred costs) 8,018,233 5,946,965 5,807,221 Allowance for loan losses 52,094 45,131 42,001 Goodwill and other intangibles 492,410 308,819 302,766 Noninterest-bearing deposits 2,622,761 2,157,338 1,947,312 Interest-bearing deposits 5,747,661 4,290,882 4,087,885
Total deposits 8,370,422 6,448,220 6,035,197 Equity 1,538,420 1,142,505 1,086,558 Equity - tangible (1) 1,046,010 833,686 783,792 Book value per share 21.05 18.06 17.20 Book value per share - tangible (1) 14.26 13.13 12.36 Cash dividends declared per share 0.62 0.55 0.51
Daily Average Balances:Total assets $ 10,599,185 $ 8,334,999 $ 7,205,236 Total assets - tangible (1) 10,129,664 8,027,381 6,958,267 Earning assets 9,504,755 7,517,893 6,442,385 Loans (net of unearned income and deferred costs) 7,572,995 5,912,223 5,140,024 Allowance for loan losses 48,737 43,760 39,547 Goodwill and other intangibles 469,521 307,618 246,968 Noninterest-bearing deposits 2,517,173 2,094,753 1,720,093 Interest-bearing deposits 5,314,060 4,248,571 3,852,100
Total deposits 7,831,233 6,343,324 5,572,192 Equity 1,454,795 1,123,588 963,775 Equity - tangible 985,275 815,969 716,807
Key Ratios:Return on average assets 1.26 % 1.05 % 0.93 %Return on average tangible assets (1) 1.41 % 1.15 % 1.02 %Return on average equity 9.20 % 7.80 % 6.98 %Return on average tangible equity (1) 14.52 % 11.35 % 9.93 %Net interest margin (1)(2) 3.61 % 3.51 % 3.44 %Efficiency ratio (1) 63.91 % 64.23 % 69.99 %Average earning assets/total average assets 89.67 % 90.19 % 89.41 %Average loans/average deposits 96.70 % 93.20 % 92.24 %Average noninterest deposits/total average deposits 32.14 % 33.02 % 30.87 %Allowance for loan losses/period end loans 0.65 % 0.76 % 0.72 %
Period end equity/period end total assets 13.78 % 13.41 % 13.63 %
(1) Non-GAAP financial measure. See the Non-GAAP Financial Measures section of Management's Discussion and Analysis for reconciliation.
(2) Presented on a tax-equivalent basis.
TOWNEBANKSELECTED FINANCIAL HIGHLIGHTS
6

OVERVIEW
TowneBank is a commercial and retail banking business that places special emphasis on serving the financial needs of individuals, commercial enterprises, and professionals in our geographic footprint. We offer a full range of banking and related financial services through our controlled divisions and subsidiaries.
Our financial services include banking, real estate, mortgage, title, insurance, employee benefit services, and investments. We have three reportable segments: Banking, Realty, and Insurance. Our Banking segment provides loan and deposit services to retail and commercial customers and also provides commercial mortgage brokerage services and a variety of investment and asset management services. The Realty segment offers residential real estate services, originations of a variety of mortgage loans, resort property management, and residential and commercial title insurance. The Insurance segment provides individual and business members with a wide array of insurance products, including life, property, casualty, and vehicle insurance, as well as employee and group benefits. Through Towne Insurance, we offer a full line of commercial and consumer insurance products and financial services. Through Towne Benefits, we offer health, life, dental, vision, and disability plans to employers, brokers, and individuals.
The following is a summary of the Company's 2020 financial performance:
• Net income increased to $145.54 million compared with $138.78 million in 2019. Diluted earnings were $2.01 per common share as compared to $1.92 per common share in 2019.
• Net interest income increased $21.79 million, or 6.08%, driven by a decline in interest expense due to lower rates on interest-bearing deposits.
• With the adoption of ASC 326, loss recognition on financial instruments changed from an incurred loss to an expected loss methodology, which requires the immediate recognition of life of financial instrument credit losses at origination or acquisition. Additionally, a provision for credit losses was established which includes specific expenses related to losses on loans, securities, and unfunded commitments. The provision for credit losses on loans increased $51.85 million to $61.22 million compared to $9.37 million at December 31, 2019. This increase is primarily attributable to the change in loss recognition methodology and management's expectation of continued economic weakness due to the impact of the COVID-19 pandemic. The allowance for credit losses on loans was 1.25% of period-end loans, as compared to 0.69% at December 31, 2019. Additionally, the provision for credit losses on unfunded commitments was $5.74 million compared to $0 for 2019.
• In 2020, the Company processed over 6,700 PPP "round one" loans totaling approximately $1.10 billion, with an outstanding balance of $0.86 billion as of December 31, 2020. The CARES Act provides for forgiveness of up to the full principal amount of qualifying loans guaranteed under the PPP. In January 2021, the Company began accepting applications for PPP "round two".
• Noninterest income increased by $78.60 million, or 38.23%, over 2019. Residential mortgage brokerage income, real estate brokerage and property management income, other income growth, and net gains on the sale of investment securities were all contributors to this growth. Residential mortgage brokerage income increased $45.35 million, or 67.88%, due to higher annual loan production. Also included in other income was the third quarter sale of Red Sky, a travel insurance joint venture.
• Noninterest expense increased $17.52 million, or 4.63%, compared to 2019. This increase was driven by growth in salaries and benefits, software expenses, and cost associated with debt restructuring.
TOWNEBANKMANAGEMENT’S DISCUSSION AND ANALYSIS
7

COVID-19 IMPACT
In first quarter 2020, the outbreak of the global COVID-19 pandemic and related preventive measures taken across the U.S. and worldwide resulted in an extended economic downturn, driven by the domino effect of business and production interruptions, supply-chain disruptions, volatility in the equity and debt markets, widespread sickness, nationwide health industry stress, changes in workforce dynamics, quarantines, and record unemployment claims. Through the end of 2020, the state of global health is still unclear due to an uptick in the number of COVID-19 cases, both in and outside of the U.S., new restrictions on travel and gatherings, and the emergence of new strains of the virus. Reports of improvements in unemployment levels are offset by weak sales reports. With the duration and magnitude of the effects of COVID-19 still unknown, questions regarding the financial impact and recovery period remain unanswered.
Events surrounding the COVID-19 pandemic have had an impact on both the timing and recognition of Company financial results. Although travel-related noninterest income streams were initially impacted by forced closures, they have since rebounded and increased compared to prior year. The continued low rate environment has positively impacted mortgage production and real estate brokerage income. On the downside, concerns over the financial health of our members in the wake of the pandemic remain paramount. Our provision for credit losses has increased significantly due to management's expectation of continued economic weakness driven by the impact of the pandemic. We have experienced margin compression due to changes in our earning assets and liabilities mix and actions taken by the FOMC to lower benchmark rates. With the significant slowdown of the local economies in the markets we serve, organic loan growth has slowed, with the exception of the origination of PPP loans. PPP loans carry rates well below market, driving down loan yield.
On March 27, 2020, the CARES Act was enacted, which provided temporary relief from TDR accounting for eligible loan modifications in addition to temporarily adding a new product, titled the Paycheck Protection Program to the SBA's 7(a) Loan Program. On December 27, 2020, the Appropriations Act extended TDR relief and provided additional PPP funding.
Our relationship managers continue to maintain a high level of contact with our members to closely evaluate their financial needs and help them navigate their specific situations. As of December 31, 2020, the Company had 210 eligible loan modifications with outstanding balances of $340.81 million. As expected, the largest concentration of deferrals is related to tourism, specifically the hotel industry, which has been significantly impacted by the pandemic. Although the severity of the impact varies by property, influenced by many factors, including hotel type, primary customer base, and location, the challenges to this industry will likely extend beyond their deferral periods.
In 2020, the Company processed over 6,700 PPP "round one" loans totaling approximately $1.10 billion, with an outstanding balance of $0.86 billion as of December 31, 2020. The CARES Act provides for forgiveness of up to the full principal amount of qualifying loans guaranteed under the PPP. In January 2021, the Company began accepting applications for PPP "round two".
In second quarter 2020, we established a PPP credit facility with the FHLB. At December 31, 2020, we pledged PPP loans, on a non-recourse basis, and had outstanding borrowings on our Federal Reserve PPP credit facility of $182.85 million.
TOWNEBANKMANAGEMENT’S DISCUSSION AND ANALYSIS
8
The Company performed our required annual goodwill impairment tests as of August 31, 2020, and determined there was no impairment. No events or circumstances since the August 31, 2020, annual impairment test were noted that would indicate it was more likely than not a goodwill impairment exists.
CRITICAL ACCOUNTING POLICIES
The preparation of financial statements and related disclosures in conformity with GAAP requires management to make judgments, assumptions, and estimates in certain circumstances that affect amounts reported in the Consolidated Financial Statements and the accompanying footnotes. Certain accounting estimates are particularly sensitive because of their significance to the financial statements and because of the possibility that future events affecting them may differ significantly from management's current judgments. We consider our policies for the allowance for credit losses, other real estate owned, deferred income taxes, estimates of fair value of financial instruments, mergers and acquisitions, and goodwill and other intangibles to be critical accounting policies. Significant accounting policies and effects of new accounting pronouncements are discussed in detail in Note 1, "Summary of Significant Accounting Policies," in the Notes to Consolidated Financial Statements.
The following is a summary of our critical accounting policies that are highly dependent on estimates, assumptions, and judgments.
Allowance for Credit Losses on Loans. In accordance with ASC 326, the allowance for credit losses, which includes both the allowance for loan losses and the allowance for loan-related off-balance-sheet credit exposures, is calculated with the objective of maintaining a reserve for current expected credit losses over the remaining contractual life of the portfolio. Management uses loss factors, based on estimated probability of default for internal risk ratings and loss given default, to determine the allowance for credit losses for the majority of the portfolio. A well-documented methodology, which includes the use of macroeconomic variables sourced from third parties and weightings based on the Company's economic outlook, has been developed and is applied to ensure consistency across our markets. We also have a formalized independent loan review program to evaluate loan administration, credit quality, and compliance with corporate loan standards. This program includes periodic, regular reviews of problem loan reports, delinquencies, and charge-offs.
In addition, various regulatory agencies, as an integral part of their examination process, periodically review our allowance for credit losses on loans. Such agencies may require us to recognize additions to the allowance based on their judgments of information available to them at the time of their examination. The allowance represents our best estimate of incurred losses in the loan portfolio, but significant downturns in circumstances relating to loan quality and economic conditions could result in a requirement for additional allowance. Likewise, an upturn in loan quality and improved economic conditions may allow a reduction in the required allowance. In either instance, unanticipated changes could have a significant impact on our financial condition and results of operations.
Deferred Income Taxes. Deferred tax assets and liabilities are recognized for future tax consequences attributable to differences between the financial statement carrying amounts of existing assets and liabilities and their respective tax bases. Deferred tax assets, including tax loss and credit carry-forwards, and deferred tax liabilities are measured using enacted tax rates expected to apply to taxable income in the years in which those temporary differences are expected to be recovered or settled. Deferred income tax expense (benefit) represents the change during the period in the deferred tax assets and deferred tax liabilities.
We use the asset and liability method in accounting for income taxes. This method recognizes the amount of taxes payable or refundable for the current year and recognizes deferred tax liabilities and assets for the expected
TOWNEBANKMANAGEMENT’S DISCUSSION AND ANALYSIS
9
future tax consequences of events and transactions that have been recognized in our financial statements or tax returns. Deferred tax assets are reduced by a valuation allowance when, in the opinion of management, it is more likely than not that some portion or all of the deferred tax assets will not be realized. Realization of the deferred income tax asset is dependent on generating sufficient taxable income in future years, and, as such, material changes could impact our financial condition and results of operations.
Estimates of Fair Value of Financial Instruments. The estimation of fair value is significant to certain assets, including loans held for sale, available-for-sale securities, on-balance-sheet commitments to originate loans held for sale, and other real estate held for sale. These assets and liabilities are recorded either at fair value or at the lower of cost or fair value, as applicable. The fair values of loans held for sale are based on commitments on hand from investors or, if commitments have not yet been obtained, prevailing market rates. The fair values of available-for-sale securities are based on published market prices or dealer quotes. If a quoted market price is not available, fair value is estimated using quoted market prices for similar securities. The fair values of commitments to originate loans held for sale are based on fees currently charged to enter into similar agreements and, for fixed-rate commitments, also consider the difference between current levels of interest rates and committed rates.
Fair values can be volatile and may be influenced by a number of factors, including market interest rates, prepayment speeds, discount rates, and market conditions. Since these factors can change significantly and rapidly, fair values are difficult to predict and subject to material changes that could impact our financial condition and results of operations.
Mergers and Acquisitions. Mergers and acquisitions are accounted for using the acquisition method, as required by ASC 805, Business Combinations. Under this method, the cost of the acquired entity will be allocated to the assets acquired and liabilities assumed based on their fair values at the date of acquisition. The excess of the cost over the fair value of the acquired net assets is recognized as goodwill.
Goodwill and Other Intangibles. We record all assets and liabilities acquired in purchase acquisitions, including goodwill, intangibles with indefinite lives, and other intangibles, at fair value as required by ASC 805, Business Acquisitions. The initial recording of goodwill and other intangibles requires subjective decisions concerning estimates of the fair value of the acquired assets and liabilities.
Goodwill is reviewed for potential impairment at the reporting unit level (one level below the identified business segments) on an annual basis, or more often if events or circumstances indicate there may be impairment. In accordance with ASC 350, the Company assesses qualitative factors to determine whether it is more-likely-than-not the fair value of the reporting unit was less than its carrying amount. If the Company concludes the carrying amount exceeds the implied fair value, based on the qualitative assessment, a quantitative one-step impairment test will then be applied. An impairment loss will be recognized for any excess of the carrying value over fair value of the reporting unit, to the extent the loss does not exceed the amount of goodwill allocated to the reporting unit. Subsequent increases in goodwill are not recognized in the Consolidated Financial Statements.
Other identifiable intangible assets are evaluated for impairment if events or changes in circumstances indicate a possible impairment. Such evaluation is based on undiscounted cash flow projections, which may extend far into the future and, by their nature, are difficult to determine over an extended timeframe. Fair value may be influenced by market prices, comparison to similar assets, market multiples, discounted cash flow analysis, and other determinants. Factors that may significantly affect the estimates include, among others, competitive forces, customer behaviors and attrition, changes in revenue growth trends, cost structures and technology, changes in discount rates, and specific industry or market sector conditions. Other key judgments in accounting for intangibles include useful life and classification between goodwill and intangibles with indefinite lives or other intangibles that require amortization.
TOWNEBANKMANAGEMENT’S DISCUSSION AND ANALYSIS
10

ANALYSIS OF RESULTS OF OPERATIONS
Consolidated Performance Summary
Results of Operations: We reported net income for the years ended December 31, 2020, 2019, and 2018, of $145.54 million, $138.78 million, and $133.79 million, respectively. Diluted earnings per share were $2.01, $1.92, and $1.88 for the years ended December 31, 2020, 2019, and 2018, respectively. In 2019, EPS were affected by acquisition related expenses of $0.58 million on an after tax basis. In 2018, EPS were affected by the issuance of 9.46 million shares of common stock related to the acquisition of Paragon on January 26, 2018, and acquisition-related expenses of $7.00 million on an after tax basis.
Profitability, as measured by our ROA, was 1.03%, 1.19%, and 1.26% for the years ended December 31, 2020, 2019, and 2018, respectively. Return on average tangible assets (non-GAAP) was 1.13%, 1.33%, and 1.41% for the same respective periods. ROE was 8.46%, 8.69%, and 9.20% for the years ended December 31, 2020, 2019, and 2018, respectively, while return on average tangible equity (non-GAAP) was 12.62%, 13.58%, and 14.52% for the same respective years.
Our operating income, calculated as net interest income and noninterest income, excluding gains and losses on investment securities and other nonrecurring income, was $637.08 million for the year ended December 31, 2020, compared to $564.79 million and $532.66 million for 2019 and 2018, respectively.
Net Interest Income: Net interest income, the major source of our earnings, is the income generated by interest-earning assets reduced by the total interest cost of the funds incurred to carry them. It is impacted by market interest rates and the mix and volume of earning assets and interest-bearing liabilities. The yields and rates in this discussion and in the following tables have been computed based upon interest income and expense adjusted to a fully taxable equivalent basis (non-GAAP) using a 21% federal marginal tax rate.
The Company utilizes various asset and liability management strategies to manage net interest income exposure to interest rate risk. Refer to the "Market Risk Management" and "Interest Sensitivity" sections of this financial review for further discussions regarding our asset and liability management policies.
Net interest income, on a tax-equivalent basis (non-GAAP), was $382.44 million for the year ended December 31, 2020, which was $21.63 million, or 5.99%, more than the $360.81 million reported in the previous year. For the majority of 2020, FOMC benchmark rates were lower, which had the impact of reducing yields on interest-earning assets and reducing the cost of interest-bearing liabilities. Volume increases in earning assets marginally outpaced volume increases in interest-bearing liabilities. Net interest income was also positively impacted by the decline in the cost of deposits. Accretion from purchase accounting of 5 bp and PPP of 5 bp added to margin in the current year. Purchase accounting accretion added 10 bp to margin in 2019.
Interest income, on a tax-equivalent basis (non-GAAP), was $462.45 million for the year ended December 31, 2020, which was $7.83 million, or 1.66%, lower than the $470.28 million for the year ended December 31, 2019. Average earning assets grew to $12.01 billion in 2020 from $10.43 billion in 2019, an increase of $1.58 billion, or 15.15%. The yield on earning assets was 3.85% in the year ended December 31, 2020, compared to 4.51% in the prior year. Average loan balances, excluding nonaccrual loans of $16.04 million, were $1.30 billion, or 15.99%, higher in 2020 than in 2019, while loan yields decreased by 62 bp. The increase in average loan balances was driven by $0.74 billion in average PPP loans. Related interest and fees on PPP loans were $26.94 million. As a provision of the CARES Act, PPP loans carry below-market rates. Lower benchmark rates coupled with the addition of PPP loans adversely impacted the overall yield on interest-earning assets.
TOWNEBANKMANAGEMENT’S DISCUSSION AND ANALYSIS
11

Interest expense for the year ended December 31, 2020, decreased by $29.46 million, or 26.91%, to $80.01 million, compared to $109.47 million for the year ended December 31, 2019. The balance of average interest-bearing liabilities increased to $8.26 billion in 2020 from $6.97 billion in 2019, an increase of $1.30 billion, or 18.60%. The decrease in interest expense as compared to the prior year was driven by lower average rates on all interest-bearing liabilities. In the third quarter of 2020, the Company restructured FHLB borrowing facilities for future reductions in borrowing costs of approximately $2.63 million over the life of those borrowings.
Net interest margin, on a tax-equivalent basis (non-GAAP), which is net interest income expressed as a percentage of average earning assets, was 3.18% in the year ended December 31, 2020, which was 28 bp lower than the 3.46% one year ago. The margin decline in comparison to prior year periods was driven by the declines in earning asset yields outpacing the declines in liability costs. Margin was also affected by the Company's decision to operate with above-average liquidity in response to economic uncertainty caused by the COVID-19 pandemic.
TOWNEBANKMANAGEMENT’S DISCUSSION AND ANALYSIS
12
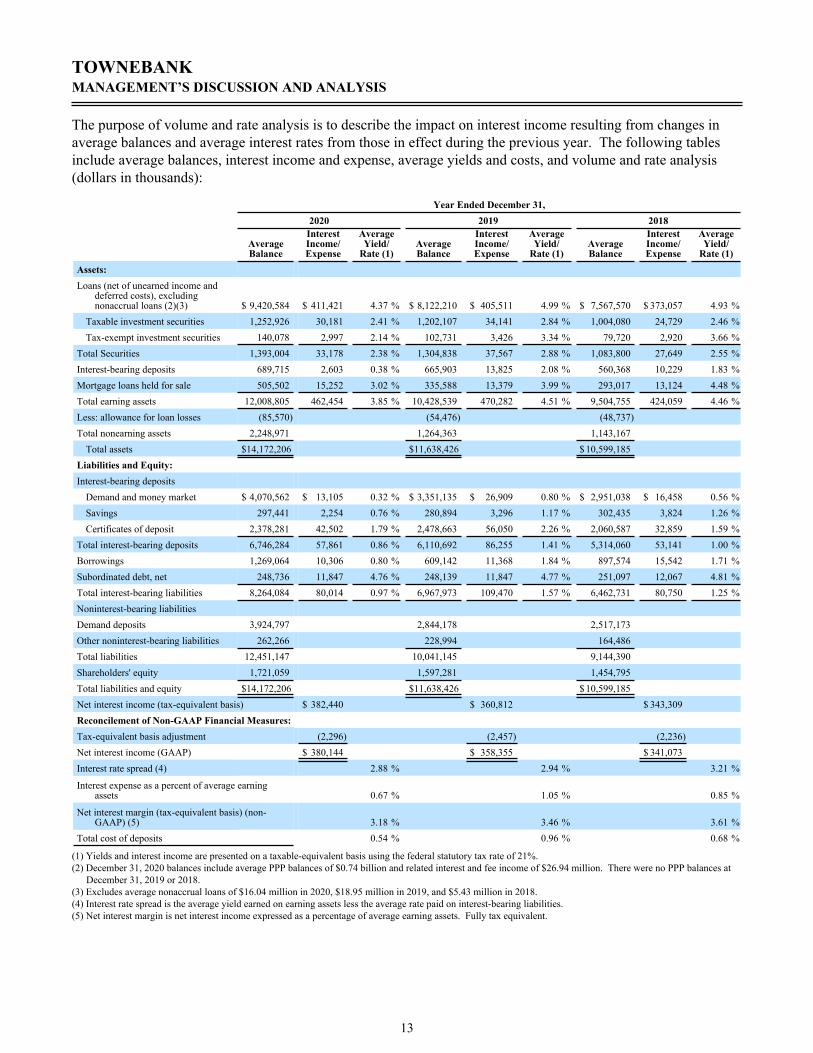
The purpose of volume and rate analysis is to describe the impact on interest income resulting from changes in average balances and average interest rates from those in effect during the previous year. The following tables include average balances, interest income and expense, average yields and costs, and volume and rate analysis (dollars in thousands):
Year Ended December 31,2020 2019 2018
Average Balance
Interest Income/ Expense
Average Yield/
Rate (1)Average Balance
Interest Income/ Expense
Average Yield/
Rate (1)Average Balance
Interest Income/ Expense
Average Yield/
Rate (1)Assets:Loans (net of unearned income and
deferred costs), excluding nonaccrual loans (2)(3) $ 9,420,584 $ 411,421 4.37 % $ 8,122,210 $ 405,511 4.99 % $ 7,567,570 $ 373,057 4.93 %
Taxable investment securities 1,252,926 30,181 2.41 % 1,202,107 34,141 2.84 % 1,004,080 24,729 2.46 %Tax-exempt investment securities 140,078 2,997 2.14 % 102,731 3,426 3.34 % 79,720 2,920 3.66 %
Total Securities 1,393,004 33,178 2.38 % 1,304,838 37,567 2.88 % 1,083,800 27,649 2.55 %Interest-bearing deposits 689,715 2,603 0.38 % 665,903 13,825 2.08 % 560,368 10,229 1.83 %Mortgage loans held for sale 505,502 15,252 3.02 % 335,588 13,379 3.99 % 293,017 13,124 4.48 %Total earning assets 12,008,805 462,454 3.85 % 10,428,539 470,282 4.51 % 9,504,755 424,059 4.46 %Less: allowance for loan losses (85,570) (54,476) (48,737) Total nonearning assets 2,248,971 1,264,363 1,143,167
Total assets $ 14,172,206 $ 11,638,426 $ 10,599,185 Liabilities and Equity:Interest-bearing deposits
Demand and money market $ 4,070,562 $ 13,105 0.32 % $ 3,351,135 $ 26,909 0.80 % $ 2,951,038 $ 16,458 0.56 %Savings 297,441 2,254 0.76 % 280,894 3,296 1.17 % 302,435 3,824 1.26 %Certificates of deposit 2,378,281 42,502 1.79 % 2,478,663 56,050 2.26 % 2,060,587 32,859 1.59 %
Total interest-bearing deposits 6,746,284 57,861 0.86 % 6,110,692 86,255 1.41 % 5,314,060 53,141 1.00 %Borrowings 1,269,064 10,306 0.80 % 609,142 11,368 1.84 % 897,574 15,542 1.71 %Subordinated debt, net 248,736 11,847 4.76 % 248,139 11,847 4.77 % 251,097 12,067 4.81 %Total interest-bearing liabilities 8,264,084 80,014 0.97 % 6,967,973 109,470 1.57 % 6,462,731 80,750 1.25 %Noninterest-bearing liabilitiesDemand deposits 3,924,797 2,844,178 2,517,173 Other noninterest-bearing liabilities 262,266 228,994 164,486 Total liabilities 12,451,147 10,041,145 9,144,390 Shareholders' equity 1,721,059 1,597,281 1,454,795 Total liabilities and equity $ 14,172,206 $ 11,638,426 $ 10,599,185 Net interest income (tax-equivalent basis) $ 382,440 $ 360,812 $ 343,309 Reconcilement of Non-GAAP Financial Measures:Tax-equivalent basis adjustment (2,296) (2,457) (2,236) Net interest income (GAAP) $ 380,144 $ 358,355 $ 341,073 Interest rate spread (4) 2.88 % 2.94 % 3.21 %
Interest expense as a percent of average earning assets 0.67 % 1.05 % 0.85 %
Net interest margin (tax-equivalent basis) (non-GAAP) (5) 3.18 % 3.46 % 3.61 %
Total cost of deposits 0.54 % 0.96 % 0.68 %
(1) Yields and interest income are presented on a taxable-equivalent basis using the federal statutory tax rate of 21%.(2) December 31, 2020 balances include average PPP balances of $0.74 billion and related interest and fee income of $26.94 million. There were no PPP balances at
December 31, 2019 or 2018.(3) Excludes average nonaccrual loans of $16.04 million in 2020, $18.95 million in 2019, and $5.43 million in 2018.(4) Interest rate spread is the average yield earned on earning assets less the average rate paid on interest-bearing liabilities.(5) Net interest margin is net interest income expressed as a percentage of average earning assets. Fully tax equivalent.
TOWNEBANKMANAGEMENT’S DISCUSSION AND ANALYSIS
13

2020 vs 2019 Increase (Decrease) 2019 vs 2018 Increase (Decrease)
(in thousands) Due to Changes In Due to Changes In
Volume Rate (1) Total Volume Rate (1) Total
Assets:Loans (net of unearned income and deferred
costs), excluding nonaccrual loans $ 60,270 $ (54,360) $ 5,910 $ 4,815 $ 27,639 $ 32,454
Taxable investment securities 1,396 (5,356) (3,960) 4,114 5,298 9,412 Tax-exempt investment securities 1,021 (1,450) (429) (279) 785 506
Interest-bearing deposits 477 (11,700) (11,223) 1,516 2,080 3,596
Loans held for sale 5,661 (3,788) 1,873 (1,532) 1,787 255
Total earning assets 68,825 (76,654) (7,829) 8,634 37,589 46,223
Liabilities and Equity:
Interest-bearing deposits:
Demand and money market accounts 4,864 (18,668) (13,804) 7,988 2,463 10,451
Savings 184 (1,226) (1,042) (265) (263) (528)
Certificates of deposit (2,193) (11,355) (13,548) 15,614 7,577 23,191
Total interest-bearing deposits 2,855 (31,249) (28,394) 23,337 9,777 33,114
FHLB advances and repurchase agreements 7,779 (8,841) (1,062) 1,133 (5,307) (4,174) Subordinated debt 29 (29) — (78) (142) (220)
Total interest-bearing liabilities 10,663 (40,119) (29,456) 24,392 4,328 28,720 Net interest income (tax equivalent basis)(2) $ 58,162 $ (36,535) $ 21,627 $ (15,758) $ 33,261 $ 17,503
(1) Variances caused by the change in rate times the change in balances are allocated to rate.
(2) Non-GAAP.
Provision for Credit Losses: Effective January 1, 2020, with the adoption of ASU 326, financial assets with the contractual right to receive cash, including loans, HTM debt securities, trade receivables, net investments in leases, and off-balance-sheet credit exposures, are required to be measured at amortized cost and to be presented at the net amount expected to be collected. ASC 326 also made changes to the accounting for AFS debt securities, requiring credit losses be accounted for as an allowance rather than as a direct write-down of the AFS debt securities. The allowance for credit losses is a valuation account that is deducted from the amortized cost basis of the financial asset to present the net carrying value and the amount expected to be collected on the financial asset. The allowance is established through a provision for credit losses charged against earnings.
TOWNEBANKMANAGEMENT’S DISCUSSION AND ANALYSIS
14

The following table presents a breakdown of the provision for credit losses included in our Consolidated Statements of Income for the applicable periods (in thousands):
Year Ended December 31,
2020 2019 2018
Provision for loan losses $ 61,223 $ 9,371 $ 8,541
Provision for off-balance-sheet exposures 5,738 — — Provision for (recovery of) HTM security losses (57) — —
Provision for (recovery of) AFS security losses 273 — —
Total provision for credit losses $ 67,177 $ 9,371 $ 8,541
For loans, losses are required to be estimated over the life of a loan and recorded at origination or acquisition. Additionally, management is required to employ a prospective approach to reasonable and supportable forecasts to inform credit loss estimates. With the adoption of ASU 326, the Company increased the allowance for credit losses on unfunded commitments, in other liabilities, with a provision for credit losses charged against retained earnings. The provisions for credit losses recorded in 2020, 2019, and 2018 were $67.18 million, $9.37 million, and $8.54 million, respectively. Net charge-offs were $0.24 million, $3.23 million, and $1.58 million for 2020, 2019, and 2018, respectively. The increase in the provision for credit losses on loans is primarily attributable to a heavier weighting given to adverse economic forecasts in our credit loss models due to expectation of continued economic weakness driven by a number of uncertainties impacting the local and national economy. These macroeconomic forecasts were impacted by the notable weakening of small businesses in the wake of the extended COVID-19 pandemic. The allowance for loan losses as a percentage of period-end loans was 1.25% and 0.69% at December 31, 2020 and 2019, respectively.
For further discussion and analysis of the loan portfolio and the allowance for credit losses on loans, see the "Analysis of Financial Condition" section found later in this report. Also, see Note 3 "Investment Securities," and Note 5, "Allowance for Credit Losses on Loans," in the Notes to Consolidated Financial Statements.
Noninterest Income: Total noninterest income for the year ended December 31, 2020, was $284.19 million, or $78.60 million, and 38.23%, higher than 2019. Total noninterest income for the year ended December 31, 2019, was $205.59 million, representing a $14.00 million, or 7.30%, increase from 2018. Noninterest income, excluding securities gains or losses, for the year ended December 31, 2020, was 43.10% of total operating income, compared with 36.55% for 2019 and 35.97% for 2018.
TOWNEBANKMANAGEMENT’S DISCUSSION AND ANALYSIS
15

The following table provides an analysis of noninterest income (dollars in thousands):
2020 over 2019 2019 over 2018Increase/(Decrease) Increase/(Decrease)
For the Year Ended December 31, 2020 2019 2018 Amount % Amount %Residential mortgage banking income, net $ 112,166 $ 66,812 $ 65,104 $ 45,354 67.88 % $ 1,708 2.62 %Insurance commissions and other title fees and income, net 65,840 64,478 56,164 1,362 2.11 % 8,314 14.80 %Real estate brokerage and property management income, net 38,249 34,292 31,863 3,957 11.54 % 2,429 7.62 %Service charges on deposit accounts 8,021 10,544 11,808 (2,523) (23.93) % (1,264) (10.70) %Credit card merchant fees, net 5,170 4,746 5,472 424 8.93 % (726) (13.27) %BOLI 8,285 9,215 6,836 (930) (10.09) % 2,379 34.80 %
Other incomeTowne Investment income, net 7,833 6,807 6,354 1,026 15.07 % 453 7.13 %Service fees on loans 3,967 3,020 2,209 947 31.36 % 811 36.71 %Income from equity method investments 2,102 703 665 1,399 199.00 % 38 5.71 %Commercial mortgage brokerage fees, net 192 331 199 (139) (41.99) % 132 66.33 %Other 22,732 5,485 4,916 17,247 314.44 % 569 11.57 %
Total other income 36,826 16,346 14,343 20,480 125.29 % 2,003 13.97 %Noninterest income before securities gain/(loss) 274,557 206,433 191,590 68,124 33.00 % 14,843 7.75 %Gain/(loss) on securities available for sale 9,634 (845) 3 10,479 N/M (848) (28,266.67) %Total noninterest income $ 284,191 $ 205,588 $ 191,593 $ 78,603 38.23 % $ 13,995 7.30 %
For the year ended December 31, 2020, residential mortgage banking income, net of commission expense, was $112.17 million, reflecting an increase of $45.35 million, or 67.88%, compared to 2019, which was $1.71 million, or 2.62%, higher than 2018. Production volume was $5.88 billion in 2020, an increase of $2.72 billion, as compared to 2019. The increase in 2020 over 2019 was driven by historically low mortgage rates and strong refinance activity. Rates began to decline in the latter part of 2019 and continued to stay low through 2020. Refinance activity represented 41.69% in 2020, compared to 23.76% in 2019. Inventory levels remained low throughout much of the year but trended upward near year-end. The 2020 income statement impact of the value of rate lock commitments and forward contracts recorded was $0.18 million, compared to $2.56 million in 2019, and $1.15 million in 2018. For further information, refer to our discussion of the Realty segment in this Annual Report, which provides a comparative schedule of operations.
Real estate brokerage and property management income, net of commission expense, for the year ended December 31, 2020, was $38.25 million, an increase of $3.96 million, or 11.54%, from 2019, which was $2.43 million, or 7.62%, higher than 2018. The increase year over year was driven primarily by an increase in the number of real estate units sold and higher property management fees. Real estate sales commissions, net, increased $1.91 million in 2020 compared to 2019, after increasing $0.41 million in 2019 compared to 2018. Sales volume increased $255.36 million in 2020 compared to 2019. Sales volume in 2019 increased $106.83 million. The number of units sold totaled 5,137 in 2020, 4,822 in 2019, and 4,864 in 2018. Despite a slow start to the year, due to COVID-19, in 2020 property management fees increased $2.05 million, or 8.38%, compared to 2019. International travel and quarantine-related restrictions resulted in more travel to local vacation rental locations and high occupancy levels in the summer months that continued into the fall.
For the year ended December 31, 2020, insurance commissions and other title income, net of commission expense, were $65.84 million, which was $1.36 million, or 2.11%, higher than comparative 2019. Property and casualty insurance commissions, net of commission expense, increased $1.27 million, driven by organic growth. Benefit insurance commissions, net of commission expense, increased $0.42 million in 2020 compared to 2019.
TOWNEBANKMANAGEMENT’S DISCUSSION AND ANALYSIS
16

In third quarter 2020, the Company sold its travel insurance joint venture, Red Sky, which resulted in a decline in commissions from travel insurance of $0.56 million compared to 2019.
Service charges on deposit accounts were $8.02 million for 2020, compared with $10.54 million and $11.81 million for 2019 and 2018, respectively. The decrease from the prior year was due to several factors including fee waivers for members experiencing financial hardship, fee waivers related to the Company's core banking system conversion, and new regulations applicable to financial institutions that have assets of $10 billion or more, which took effect in third quarter 2019. The new regulations provide that the maximum permissible interchange fee for an electronic debit transaction is the sum of 21 cents per transaction and 5 bp multiplied by the value of the transaction. An upward adjustment of no more than 1 cent to an issuer's debit card interchange fee is allowed if the card issuer develops and implements policies and procedures reasonably designed to achieve certain fraud-prevention standards. Average deposits increased 19.17% and 14.35% in the years ended December 31, 2020 and 2019, respectively.
For the year ended December 31, 2020, credit card merchant fees totaled $5.17 million, which was $0.42 million, or 8.93%, higher than comparative 2019, which was $0.73 million, or 13.27%, lower than 2018. During 2019, we converted to a new processing platform that will allow us to provide additional services and capabilities, but had a short-term adverse effect on credit card merchant fees.
Income from BOLI was $8.29 million in 2020, compared to $9.22 million in 2019 and $6.84 million in 2018. BOLI income in 2020 and 2019 included life insurance proceeds which resulted in the fluctuations between years.
Other noninterest income for the year ended December 31, 2020, was $36.83 million, compared with $16.35 million for the year ended December 31, 2019, and $14.34 million for the year ended December 31, 2018. In third quarter 2020, the Company sold Red Sky, and recorded a gain of $17.63 million in other income. After distributions to noncontrolling interests, the Company retained $6.52 million of the pre-tax gain on sale of Red Sky. Other noninterest income includes income generated by TIG and TWM, net of commission expense of $7.83 million, $6.81 million, and $6.35 million for the years ended December 31, 2020, 2019, and 2018, respectively. The increase in TIG and TWM income for 2020 and 2019 was driven by growth in assets under management.
We sold 47 investment securities with a carrying value of $333.51 million in 2020 and nine investment securities with a carrying value of $187.08 million in 2019. We recorded net gains of $9.63 million compared to losses of $0.85 million in 2019.
Noninterest Expense: Total noninterest expense for 2020 was $395.83 million, which was $17.52 million, or 4.63%, higher than 2019. Primary components of 2020 noninterest expense were salaries and employee benefits of $235.68 million, occupancy expenses of $31.32 million, software expense of $14.62 million, furniture and equipment expenses of $13.91 million, professional fees of $11.27 million, and amortization of intangibles of $11.50 million. The primary driver of the increase in total noninterest expense in 2020 from 2019 was the increase in salaries and benefits of $16.76 million.
TOWNEBANKMANAGEMENT’S DISCUSSION AND ANALYSIS
17

Total noninterest expense to total operating revenue was 62.13% for the year ended December 31, 2020, compared with 66.98% for 2019 and 66.11% for 2018. The following table provides an analysis of noninterest expense (dollars in thousands):
2020 over 2019 2019 over 2018Increase/(Decrease) Increase/(Decrease)
For the year ended December 31, 2020 2019 2018 Amount % Amount %
Salaries and benefits $ 235,676 $ 218,920 $ 201,838 $ 16,756 7.65 % $ 17,082 8.46 %Occupancy 31,317 31,381 27,644 (64) (0.20) % 3,737 13.52 %Furniture and equipment 13,914 14,351 14,477 (437) (3.05) % (126) (0.87) %Amortization - intangibles 11,498 12,370 11,710 (872) (7.05) % 660 5.64 %Software expenses 14,622 11,717 10,621 2,905 24.79 % 1,096 10.32 %Data processing 10,985 11,825 10,364 (840) (7.10) % 1,461 14.10 %Professional fees 11,268 12,943 8,323 (1,675) (12.94) % 4,620 55.51 %Advertising and marketing 9,643 12,279 11,194 (2,636) (21.47) % 1,085 9.69 %Other expenses
Acquisition-related expenses (68) 657 8,428 (725) (110.35) % (7,771) (92.20) %Bank franchise tax/SCC fees 8,688 7,251 5,647 1,437 19.82 % 1,604 28.40 %Charitable contributions 9,492 9,339 5,104 153 1.64 % 4,235 82.97 %Directors' expense 1,864 2,136 1,991 (272) (12.73) % 145 7.28 %FDIC and other insurance 6,202 3,119 5,047 3,083 98.85 % (1,928) (38.20) %Foreclosed property expenses 1,763 985 820 778 78.98 % 165 20.12 %Other 17,709 15,807 15,275 1,902 12.03 % 532 3.48 %Stationery and office supplies 2,571 2,962 3,217 (391) (13.20) % (255) (7.93) %Telephone and postage 6,811 6,426 6,788 385 5.99 % (362) (5.33) %Travel/Meals/Entertainment 1,870 3,834 3,636 (1,964) (51.23) % 198 5.45 %
Total other expenses 56,902 52,516 55,953 4,386 8.35 % (3,437) (6.14) %Total noninterest expense $ 395,825 $ 378,302 $ 352,124 $ 17,523 4.63 % $ 26,178 7.43 %
Salaries and employee benefits, the largest portion of noninterest expense, were $235.68 million, representing 59.54% of total noninterest expense for the year ended December 31, 2020. This was a $16.76 million, or 7.65%, increase over comparative 2019. Cost of living increases that occurred in mid-2019, market expansion, production-driven incentives, and core banking system conversion and production-related overtime were all contributing factors to this increase. We added a Corporate Banking Group in the second quarter of 2019, established two new banking groups, located in Greensboro and Greenville, North Carolina, and opened full-service banking offices in those cities in the fourth and first quarters of 2019, respectively. We also acquired insurance agencies in the first and fourth quarters of 2019. Salaries and benefits expense for the year ended December 31, 2019, was $218.92 million, up 8.46%, or $17.08 million, over 2018. The increase was primarily due to the addition of staff resulting from the Paragon acquisition, adding $19.39 million, while the insurance agency acquisitions added $1.26 million.
In our Banking segment, we had a total of 1,146 FTEs at December 31, 2020, which was up from 1,145 and 1,068 at December 31, 2019 and 2018, respectively. In our non-Banking segments at December 31, 2020, we had a total of 1,344 FTEs, excluding real estate sales agents, an increase from 1,301 at December 31, 2019, which had decreased from 1,342 at December 31, 2018. Real estate sales agents are independent contractors and, therefore, not included as the Company's employees. There were 407 real estate sales agents at December 31, 2020.
TOWNEBANKMANAGEMENT’S DISCUSSION AND ANALYSIS
18

For the year ended December 31, 2020, occupancy expense totaled $31.32 million, representing a decrease of $0.06 million, or 0.20%, over comparative 2019. Occupancy expense for 2019 was $3.74 million, or 13.52%, greater than the 2018 amount of $27.64 million. Occupancy expense related to North Carolina expansion and insurance agency acquisitions totaled $1.03 million in 2019.
Furniture and equipment expense was $13.91 million for 2020, or $0.44 million and 3.05% lower than 2019. With a large percentage of our employees working remotely in 2020, expansion activities were limited. Furniture and equipment expense was $14.35 million for 2019, or $0.13 million and 0.87% lower than comparative 2018. The decrease from 2018 to 2019 was due to lower year-over-year furniture and equipment costs from acquisitions.
Other expenses for 2020 were $56.90 million, which was $4.39 million, or 8.35%, higher than the 2019 amount of $52.52 million. Included in other expenses was a loss on early extinguishment of debt of $2.63 million associated with the restructuring of certain borrowings to reduce future interest expense and deploy excess liquidity. In 2019, we received a small bank credit related to FDIC and other insurance expense of $3.08 million. The primary driver of the decrease from 2018 to 2019 was the decrease in acquisition costs of $7.77 million, along with a decrease in FDIC and other insurance expense of $1.93 million related to small bank credits, offset by increases in charitable contributions of $4.24 million.
Income Taxes: Income taxes for the year ended December 31, 2020, were $31.90 million. This was $0.70 million lower than the 2019 amount of $32.60 million, which was $1.63 million lower than the 2018 amount of $34.23 million. The effective tax rate decreased to 17.98% in 2020 compared to 19.02% in 2019 as a result of certain provisions of the CARES Act.
SEGMENT PERFORMANCE SUMMARY
Our reportable segments are a traditional full-service community bank, a full-service realty business, and a full-service insurance agency. In this section, we discuss the performance and financial results of our segments. For further financial details, see Note 28, "Segment Reporting," in the Notes to Consolidated Financial Statements.
Banking Segment: For the year ended December 31, 2020, the Banking segment represented 62.40%, or $90.81 million, of our total consolidated net income, compared to 86.25% and 89.69% for 2019 and 2018, respectively.
Pre-tax earnings for the year ended December 31, 2020, for the Banking segment were $105.27 million, decreasing $40.14 million, or 27.61%, from comparative 2019. A $25.95 million, or 6.72%, increase in total revenues was partially offset by an increase in total expenses of $10.19 million, or 4.37%, with an overall decrease in earnings of $28.90 million, or 24.14%. The provision for credit loss increased $56.43 million, or 602.16%, from 2019 due primarily to the heavy weighting given to adverse economic forecasts in our credit loss model based on expectations of continued economic weaknesses related to the impacts of COVID-19 and uncertainties in the local and national economy. The provision for income tax decreased $11.24 million.
The increase in net interest income for the year ended December 31, 2020, of $15.38 million, or 4.37%, was primarily a result of lower interest costs due to lower rates on deposits and other interest-bearing liabilities. Average earnings assets increased in all categories, with most notable increases in average loan balances of $1.30 billion to $9.42 billion and taxable investment securities of $0.05 billion to $1.25 billion, but overall yields declined.
Noninterest income increased $10.57 million, or 31.02%, primarily due to investment security gains totaling $9.63 million. Included in other income is income from BOLI policies of $8.06 million and Towne Investment income of $7.83 million. Also included in other income is gains on sale of OREO of $1.30 million, compared to
TOWNEBANKMANAGEMENT’S DISCUSSION AND ANALYSIS
19

OREO gains of $0.77 million in 2019. Service charges declined $2.52 million year over year, driven by a full year's impact from the Durbin Amendment, promulgated under the Dodd-Frank Act.
Noninterest expense for the year ended December 31, 2020, increased $10.19 million, or 4.37%, over 2019 driven by expenses related to market expansion, production-related overtime and incentives, and core banking system conversion expense. Salaries and employee benefits expense increased $11.18 million, or 8.52%. Occupancy expense increased $0.82 million, or 4.01%, and furniture and equipment expense increased $0.19 million, or 1.81%.
Pre-tax earnings for the year ended December 31, 2019, for the Banking segment were $145.41 million, decreasing $3.48 million, or 2.34%, from comparative 2018. A $22.19 million, or 6.10%, increase in total revenues was outpaced by an increase in total expenses of $25.11 million, or 12.07%, leading to a decrease in earnings of $0.30 million, or 0.25%. The provision for loan loss increased $0.83 million, or 9.72%, from 2018 due to portfolio growth, while the provision for income tax decreased $3.17 million.
The increase in net interest income for the year ended December 31, 2019, of $22.39 million, or 6.79%, was primarily a result of additional interest income from an increase in earning assets due to organic growth and higher yields. Average earnings assets increased in all categories, with most notable increases in average loan balances of $0.55 billion to $8.12 billion and taxable investment securities of $0.20 billion to $1.20 billion. These increases were partially offset by additional interest expense of $7.36 million, the majority of which is due to increased costs related to interest-bearing deposits.
Noninterest income decreased $0.20 million, or 0.57%, from 2019 to 2018 primarily due to a combination of a decrease in service charges on deposit accounts of $1.26 million driven by the Durbin Amendment and investment security losses totaling $0.85 million. Included in other income is income from BOLI policies of $7.35 million and Towne Investment income of $6.81 million. Also included in other income is gains on sale of OREO of $0.77 million, compared to OREO gains of $0.48 million in 2018. Credit card merchant fees declined $0.73 million, year over year, related to the implementation of a new processing platform, as previously discussed.
TOWNEBANKMANAGEMENT’S DISCUSSION AND ANALYSIS
20

The following chart presents revenue and expenses for the Banking segment (dollars in thousands):
Year Ended Increase/(Decrease)December 31, 2020 over 2019 2019 over 2018
2020 2019 2018 Amount Percent Amount PercentRevenue
Net interest income $ 367,353 $ 351,969 $ 329,584 $ 15,384 4.37 % $ 22,385 6.79 %Noninterest income
Service charges on deposit accounts 8,021 10,544 11,808 (2,523) (23.93) % (1,264) (10.70) %Credit card merchant fees 5,169 4,746 5,472 423 8.91 % (726) (13.27) %Other income 21,809 19,620 16,977 2,189 11.16 % 2,643 15.57 %Subtotal 34,999 34,910 34,257 89 0.25 % 653 1.91 %Gain (loss) on investment securities 9,634 (845) 3 10,479 N/M (848) N/M
Total noninterest income 44,633 34,065 34,260 10,568 31.02 % (195) (0.57) %Total revenue 411,986 386,034 363,844 25,952 6.72 % 22,190 6.10 %
Provision for credit losses 65,799 9,371 8,541 56,428 602.16 % 830 9.72 %
ExpensesSalaries and employee benefits 142,328 131,149 114,472 11,179 8.52 % 16,677 14.57 %Occupancy expense 21,237 20,419 17,410 818 4.01 % 3,009 17.28 %Furniture and equipment 10,425 10,240 9,912 185 1.81 % 328 3.31 %Amortization of intangible assets 4,354 5,160 5,658 (806) (15.62) % (498) (8.80) %Other expenses 65,107 66,295 60,697 (1,188) (1.79) % 5,598 9.22 %
Total expenses 243,451 233,263 208,149 10,188 4.37 % 25,114 12.07 %
Income before income tax expense and corporate allocation 102,736 143,400 147,154 (40,664) (28.36) % (3,754) (2.55) %
Corporate allocation 2,534 2,011 1,736 523 26.01 % 275 15.84 %
Income before income tax provision 105,270 145,411 148,890 (40,141) (27.61) % (3,479) (2.34) %Provision for income tax expense 14,467 25,706 28,880 (11,239) (43.72) % (3,174) (10.99) %Net income 90,803 119,705 120,010 (28,902) (24.14) % (305) (0.25) %Noncontrolling interest 6 2 (8) 4 N/M 10 N/MNet income attributable to TowneBank $ 90,809 $ 119,707 $ 120,002 $ (28,898) (24.14) % $ (295) (0.25) %
Realty Segment: For the year ended December 31, 2020, the Realty segment represented 27.20%, or $39.59 million, of our total consolidated net income, compared to 7.05%, or $9.78 million, for 2019, and 4.80%, or $6.42 million, for 2018.
Earnings before income tax provision and noncontrolling interest for the year ended December 31, 2020, for the Realty segment were $63.44 million, increasing 268.88% from 2019. Total revenue increased to $170.46 million in 2020 from $113.09 million in 2019. A provision for credit losses on loans of $1.38 million was recorded in the Realty segment for the first time in 2020.
Net residential mortgage banking income increased by $46.15 million to $114.59 million from 2019 primarily as a result of a $2.72 billion increase in production volume. The increase in 2020 over 2019 was driven by historically low mortgage rates and strong refinance activity. Refinance activity represented 41.69% in 2020, compared to 23.76% in 2019. Inventory levels remained low throughout much of the year but trended upward near year-end. The 2020 income statement impact of the value of rate lock commitments and forward contracts recorded was $0.18 million, compared to $2.56 million in 2019, and $1.15 million in 2018. The increase in property management fees from 2019 was primarily due to high summer and fall reservation volumes driven by restrictions on international travel and quarantines that kept travel to local vacation rental locations.
TOWNEBANKMANAGEMENT’S DISCUSSION AND ANALYSIS
21

Expenses for the Realty segment increased 9.92%, or $9.40 million, when compared to 2019. Salaries and benefits expense increased $5.64 million, or 10.73%, and loan expenses increased $3.79 million, or 52.51%, when compared to 2019. Salary and benefits increases were related to the high levels of mortgage loan production, specifically in overtime and incentive-based compensation. The increase in loan expenses are also production-related.
Earnings before income tax provision and noncontrolling interest for the year ended December 31, 2019, for the Realty segment were $17.20 million, increasing 46.87% from 2018. Total revenue decreased to $113.09 million in 2019 from $114.02 million in 2018. Net residential mortgage banking income increased by $1.75 million to $68.44 million from 2018, primarily as a result of a $132.45 million increase in production volume. The increase in property management fees from 2018 was primarily due to increased revenue from additional rental properties. The decrease in net interest and other income primarily resulted from higher average funding costs on mortgage loans held for sale.
Expenses for the Realty segment decreased 6.41%, or $6.49 million, when compared to 2018. Salaries and benefits expense decreased $5.83 million, or 9.98%, professional fees decreased $0.62 million, or 38.56%, and furniture and equipment expense decreased $0.60 million, or 16.18%, when compared to 2018. These 2019 cost reductions were part of management focus on improved efficiencies that began late in 2018.
The following chart presents revenue and expenses for the Realty segment (dollars in thousands):
Year Ended Increase/(Decrease)December 31, 2020 over 2019 2019 over 2018
2020 2019 2018 Amount Percent Amount PercentRevenue
Residential mortgage banking income, net $ 114,589 $ 68,443 $ 66,696 $ 46,146 67.42 % $ 1,747 2.62 %Real estate brokerage income, net 11,776 9,865 9,458 1,911 19.37 % 407 4.30 %Title insurance and settlement fees 2,397 2,111 1,877 286 13.55 % 234 12.47 %Property management fees, net 26,473 24,427 22,405 2,046 8.38 % 2,022 9.02 %Income from unconsolidated subsidiary 1,336 516 370 820 158.91 % 146 39.46 %Net interest and other income 13,889 7,724 13,210 6,165 79.82 % (5,486) (41.53) %
Total revenue 170,460 113,086 114,016 57,374 50.73 % (930) (0.82) %
Provision for credit losses 1,378 — — 1,378 N/M — N/M
ExpensesSalaries and employee benefits 58,263 52,619 58,450 5,644 10.73 % (5,831) (9.98) %Occupancy expense 7,465 8,285 7,871 (820) (9.90) % 414 5.26 %Furniture and equipment 2,622 3,099 3,697 (477) (15.39) % (598) (16.18) %Amortization of intangible assets 2,630 2,741 2,782 (111) (4.05) % (41) (1.47) %Other expenses 33,143 27,982 28,416 5,161 18.44 % (434) (1.53) %
Total expenses 104,123 94,726 101,216 9,397 9.92 % (6,490) (6.41) %
Income before income tax, corporate allocation, and noncontrolling interest 64,959 18,360 12,800 46,599 253.81 % 5,560 43.44 %
Corporate allocation (1,522) (1,163) (1,091) (359) 30.87 % (72) 6.60 %Income before income tax provision and
noncontrolling interest 63,437 17,197 11,709 46,240 268.88 % 5,488 46.87 %Provision for income tax 12,035 3,707 2,892 8,328 224.66 % 815 28.18 %Net income 51,402 13,490 8,817 37,912 281.04 % 4,673 53.00 %Noncontrolling interest (11,809) (3,711) (2,398) (8,098) 218.22 % (1,313) 54.75 %Net income attributable to TowneBank $ 39,593 $ 9,779 $ 6,419 $ 29,814 304.88 % $ 3,360 52.34 %
TOWNEBANKMANAGEMENT’S DISCUSSION AND ANALYSIS
22

The following chart shows key data for the Realty segment (dollars in thousands):
Year Ended Increase/(Decrease)December 31, 2020 over 2019 2019 over 2018
2020 2019 2018 Amount Percent Amount PercentKey data
Number of units sold 5,137 4,822 4,864 315 6.53 % (42) (0.86) %Volume of units sold $ 1,845,110 $ 1,589,753 $ 1,482,919 $ 255,357 16.06 % $ 106,834 7.20 %Number of real estate agents 407 407 411 — — (4) (0.97) %
Loans originated, mortgage $ 4,386,227 $ 2,273,483 $ 2,114,558 $ 2,112,744 92.93 % $ 158,925 7.52 %Loans originated, joint ventures 1,490,285 884,997 911,475 605,288 68.39 % (26,478) (2.90) %Total loans originated $ 5,876,512 $ 3,158,480 $ 3,026,033 $ 2,718,032 86.06 % $ 132,447 4.38 %
Number of loans, mortgage 13,443 7,729 7,656 5,714 73.93 % 73 0.95 %Number of loans, joint ventures 5,698 3,714 4,006 1,984 53.42 % (292) (7.29) %Total number of loans 19,141 11,443 11,662 7,698 67.27 % (219) (1.88) %
Average loan amount, mortgage $ 326 $ 294 $ 276 $ 32 10.88 % $ 18 6.52 %Average loan amount, joint ventures 262 238 228 24 10.08 % 10 4.39 %Average loan amount $ 307 $ 276 $ 259 $ 31 11.23 % $ 17 6.56 %
Number of originators, mortgage 164 155 213 9 5.81 % (58) (27.23) %Number of originators, joint ventures 65 62 80 3 4.84 % (18) (22.50) %
Number of originators 229 217 293 12 5.53 % (76) (25.94) %
Mortgage. The loan volume for combined mortgage operations increased during the year ended December 31, 2020, as compared to 2019. Total loans originated in 2020 were $5.88 billion, an 86.06%, or $2.72 billion, increase from $3.16 billion in 2019, which was a $0.13 billion, or 4.38%, increase compared to the 2018 volume of $3.03 billion. Refinance activity comprised 41.62% of loan volume for the year ended December 31, 2020. For the years ended December 31, 2019 and 2018, refinance volume was 23.76% and 11.53%, respectively. The number of units originated increased by 7,698 in 2020 compared to 2019, while the average mortgage size increased by $31 thousand. Refinance activity increased during the year as mortgage rates were at historic lows.
Insurance Segment: The Insurance segment is comprised of property and casualty and group benefits divisions. The Insurance segment represented 10.40%, or $15.13 million, of our total consolidated net income in 2020 compared to 6.70%, or $9.30 million, in 2019.
Earnings before taxes and noncontrolling interest for the Insurance segment were $32.63 million in 2020, as compared to $13.66 million in 2019. There was an increase in total property and casualty commissions and fees of $2.31 million, or 3.31%, over 2019, and a decrease in contingency and bonus revenue of $0.08 million. Contingent revenue primarily consists of amounts received from various property and casualty insurance carriers. The carriers use several nonclient-specific factors to determine the amount of contingency payments. Such factors include the aggregate loss performance of insurance policies previously placed and the volume of business, among other things. In third quarter 2020, the Company sold Red Sky, a travel insurance joint venture, and recorded a gross gain on sale of $17.63 million in other income in the Insurance segment. After distributions to noncontrolling interests, the Company retained $6.52 million of the pre-tax gain on sale of Red Sky.
Earnings before taxes and noncontrolling interest for the Insurance segment were $13.66 million in 2019, as compared to $11.40 million in 2018. The primary factor affecting earnings was a one-time accrual made prior to
TOWNEBANKMANAGEMENT’S DISCUSSION AND ANALYSIS
23

the accounting changes in 2018. With the adoption of ASU No. 2014-09, Revenue from Contracts with Customers (Topic 606), in 2018, we modified the timing for recognizing contingent commissions revenue.
The following chart presents revenue and expenses for the Insurance segment (dollars in thousands):
Year Ended Increase/(Decrease)December 31, 2020 over 2019 2019 over 2018
2020 2019 2018 Amount Percent Amount PercentCommission and fee income
Property and casualty $ 52,726 $ 50,380 $ 40,948 $ 2,346 4.66 % $ 9,432 23.03 %Employee benefits 15,259 14,726 14,088 533 3.62 % 638 4.53 %Travel insurance 3,526 4,085 5,123 (559) (13.68) % (1,038) (20.26) %Specialized benefit services 664 672 673 (8) (1.19) % (1) (0.15) %
Total commissions and fees 72,175 69,863 60,832 2,312 3.31 % 9,031 14.85 %Contingency and bonus revenue 6,230 6,307 4,888 (77) (1.22) % 1,419 29.03 %Other income 17,976 2,032 295 15,944 784.65 % 1,737 588.81 %
Total revenue 96,381 78,202 66,015 18,179 23.25 % 12,187 18.46 %
Employee commission expense 14,492 13,379 11,209 1,113 8.32 % 2,170 19.36 %Revenue, net of commission expense $ 81,889 $ 64,823 $ 54,806 $ 17,066 26.33 % $ 10,017 18.28 %
Salaries and employee benefits 35,085 35,152 28,916 (67) (0.19) % 6,236 21.57 %Occupancy expense 2,615 2,677 2,363 (62) (2.32) % 314 13.29 %Furniture and equipment 867 1,012 868 (145) (14.33) % 144 16.59 %Amortization of intangible assets 4,514 4,469 3,269 45 1.01 % 1,200 36.71 %Other expenses 5,170 7,003 7,343 (1,833) (26.17) % (340) (4.63) %
Total expenses 48,251 50,313 42,759 (2,062) (4.10) % 7,554 17.67 %
Income before income tax, corporate allocation, and noncontrolling interest 33,638 14,510 12,047 19,128 131.83 % 2,463 20.44 %
Corporate allocation (1,012) (848) (645) (164) 19.34 % (203) 31.47 %Income before income tax provision and
noncontrolling interest 32,626 13,662 11,402 18,964 138.81 % 2,260 19.82 %Provision for income tax expense 5,398 3,183 2,455 2,215 69.59 % 728 29.65 %Net income 27,228 10,479 8,947 16,749 159.83 % 1,532 17.12 %Noncontrolling interest (12,095) (1,182) (1,575) (10,913) 923.27 % 393 (24.95) %Net income attributable to TowneBank $ 15,133 $ 9,297 $ 7,372 $ 5,836 62.77 % $ 1,925 26.11 %
Total revenue for the year ended December 31, 2020, increased $18.18 million, or 23.25%. Excluding the $17.63 million gain on sale of Red Sky, the increase from the prior period was driven by organic growth in property and casualty fee income of $2.35 million. The Company acquired an insurance agency late in the fourth quarter of 2020 which is expected to add approximately $2.40 million in gross revenue in 2021. The Company goal is to grow insurance commissions to $100 million over the next three to five years.
Salaries and employee benefits expense decreased $0.07 million, or 0.19%, when comparing 2020 to 2019, and increased $6.24 million, or 21.57%, when comparing 2019 to 2018. Insurance agency acquisitions in 2019 and late 2018 had resulted in an increase in salaries in 2019. In 2020, the Company focused on achieving efficiencies within the business, which resulted in reductions in personnel expenses and began to allow us to capitalize on the potential of those acquisitions.
TOWNEBANKMANAGEMENT’S DISCUSSION AND ANALYSIS
24

Occupancy expense decreased $0.06 million, or 2.32%, when comparing 2020 to 2019, and increased $0.31 million, or 13.29%, when comparing 2019 to 2018, largely as a result of insurance agency acquisitions in both years.
Amortization of intangible assets increased by $0.05 million, or 1.01%, during the year ended December 31, 2020, compared to 2019, and increased $1.20 million, or 36.71%, when comparing 2019 to 2018, which was also a result of the acquisitions.
ANALYSIS OF FINANCIAL CONDITION
Overview: Our total assets increased $2.68 billion, or 22.42%, to $14.63 billion at December 31, 2020, from $11.95 billion at December 31, 2019. Our loan portfolio grew by 14.37%, or $1.21 billion, to $9.63 billion at December 31, 2020, from $8.42 billion at December 31, 2019.
Our total average assets were $14.17 billion for 2020, reflecting an increase of $2.53 billion, or 21.77%, compared to the 2019 average of $11.64 billion. Total average assets for 2019 increased $1.04 billion, or 9.80%, compared to the 2018 average of $10.60 billion. Average earning assets were $12.01 billion in 2020, reflecting an increase of $1.58 billion, or 15.15%, compared to 2019.
Our average total deposits were $10.67 billion in 2020, reflecting growth of $1.72 billion, or 19.17%, compared to 2019. Growth continued in average noninterest-bearing deposits, which increased $1.08 billion, or 37.99%.
Interest-Bearing Deposits in Financial Institutions: Interest-bearing deposits in other banks, at the FRB- Richmond, and federal funds sold are used for daily cash management purposes, management of short-term interest rate opportunities, and liquidity. At December 31, 2020, these balances were $1.82 billion and consisted mainly of overnight deposits with the FRB-Richmond and deposits in other banks.
The average balance of interest-bearing deposits at the FRB-Richmond, in other banks, and federal funds sold in 2020 was $0.69 billion, or 5.75%, of average total earning assets, compared with $0.67 billion, or 6.39%, of average total earning assets in 2019.
Securities: Our securities consist of AFS debt securities and HTM debt securities. Our AFS debt securities portfolio, which is held primarily for earnings, liquidity, and asset/liability management purposes, is reported at fair value based on market prices for similar instruments. Our HTM debt securities portfolio, which is held primarily for yield and pledging purposes, is valued at amortized cost. Our investment portfolio totaled $1.42 billion as of December 31, 2020, with a balance of $1.37 billion in AFS, $16.42 million in HTM, $6.49 million in other equity securities, and $30.14 million in FHLB stock. Average yield on AFS debt securities was 2.05% at December 31, 2020, compared with 2.67% at December 31, 2019, and 2.56% at December 31, 2018. Average yield on HTM debt securities was 2.90% at December 31, 2020, compared to 3.22% at December 31, 2019, and 3.23% at December 31, 2018.
With the adoption of ASU 326 on January 1, 2020, we began recording an allowance for credit losses on our AFS debt securities portfolio and on our HTM debt securities portfolio. These portfolios are reviewed quarterly to assess whether an allowance for credit losses is required. The allowance is charged through a provision for credit losses on our Consolidated Statements of Income. At December 31, 2020, our allowance for credit losses on AFS debt securities was $348.43 thousand and our allowance for credit losses on HTM debt securities was $97.06 thousand.
Our AFS debt securities portfolio consists of U.S. agency securities, municipal securities, MBSs, and trust preferred corporate obligations. Our HTM portfolio consists of MBSs, municipal securities, and trust preferred
TOWNEBANKMANAGEMENT’S DISCUSSION AND ANALYSIS
25

corporate obligations. Our investment activities are governed internally by a written and Board-approved investment policy, which is administered by our ALCO, which generally meets quarterly to review the economic environment, to assess current activities for appropriateness, and to establish investment strategies.
Investment strategies are established by the ALCO in consideration of the interest rate cycle, balance sheet mix, actual and anticipated loan demand, funding options, and our overall interest rate sensitivity. In general, the investment portfolio is managed in a manner appropriate with the attainment of the following goals: (i) to provide a sufficient margin of liquid assets to cover unanticipated deposit and loan fluctuations, seasonal funds flow variations, and overall funds management objectives; (ii) to provide eligible securities to secure public funds, trust deposits, and repurchase agreements as prescribed by law; and (iii) to earn the maximum return on funds invested that is commensurate with meeting the requirements of (i) and (ii).
The following table provides information regarding the composition of our securities portfolio, showing selected maturities and yields (dollars in thousands). For more information, refer to Note 3, "Investment Securities," in the Notes to Consolidated Financial Statements.
Year Ended December 31,2020 2019 2018
Amortized Cost
Estimated Fair Value
Weighted Average
YieldAmortized
CostEstimated Fair Value
Weighted Average
YieldAmortized
CostEstimated Fair Value
Weighted Average
YieldSecurities Available for Sale:
U.S. agency securities $ 183,514 $ 184,657 1.39 % $ 128,451 $ 129,038 2.22 % $ 362,272 $ 358,542 1.88 % U.S. Treasury notes 1,000 1,000 1.56 % 1,000 1,000 2.56 % 1,247 1,246 2.11 % Municipal securities 331,850 353,641 2.35 % 217,911 223,106 2.94 % 87,044 87,308 3.21 %
Trust preferred corporate securities 30,983 31,161 4.91 % 51,724 53,367 4.72 % 30,498 30,992 4.94 %Mortgage-backed securities 762,903 797,765 1.96 % 1,022,487 1,034,797 2.57 % 626,188 617,251 2.76 %Total securities available for sale 1,310,250 1,368,224 2.05 % 1,421,573 1,441,308 2.67 % 1,107,249 1,095,339 2.56 %
Securities Held to Maturity:
Trust preferred corporate securities 2,321 2,552 3.45 % 2,369 2,599 3.42 % 500 676 8.75 %
Municipal securities 5,012 6,247 3.96 % 29,167 30,388 3.70 % 34,488 35,541 3.69 %Mortgage-backed securities 9,179 9,670 2.18 % 12,152 12,184 2.05 % 15,610 15,051 2.04 %Total securities held to maturity 16,512 18,469 2.90 % 43,688 45,171 3.22 % 50,598 51,268 3.23 %
Total Portfolio $ 1,326,762 $ 1,386,693 2.06 % $ 1,465,261 $ 1,486,479 2.69 % $ 1,157,847 $ 1,146,607 2.59 %
TOWNEBANKMANAGEMENT’S DISCUSSION AND ANALYSIS
26

The following table indicates the maturities of securities at December 31, 2020 (dollars in thousands):
Available for Sale Held to Maturity
Amortized Cost
Fair Market Value
Weighted Average
YieldAmortized
Cost
Fair Market Value
Weighted Average
YieldU.S. Treasury & U.S. agency securitiesDue in one year or less $ 1,000 $ 1,000 1.56 % $ — $ — — After one year through five years 24,584 25,631 2.35 % — — — After five years through ten years 94,144 94,250 1.20 % — — — After ten years 64,785 64,776 1.31 % — — — Municipal securitiesDue in one year or less 1,061 1,070 2.92 % — — — After one year through five years 14,028 15,049 2.56 % — — — After five years through ten years 164,855 176,189 2.24 % 3,405 4,102 3.84 %After ten years 151,907 161,333 2.45 % 1,608 2,146 4.20 %Mortgage-backed securitiesDue in one year or less 4,192 4,263 2.56 % — — — After one year through five years 26,228 27,471 2.67 % 2,850 2,890 1.40 %After five years through ten years 403,717 424,870 1.87 % 5,788 6,199 2.14 %After ten years 328,766 341,161 2.04 % 540 581 6.67 %Trust preferred corporate securitiesDue in one year or less — — — — — — After one year through five years — — — — — — After five years through ten years 30,983 31,161 4.91 % 500 731 8.75 %After ten years — — — 1,821 1,820 2.00 %Total Portfolio $ 1,310,250 $ 1,368,224 2.05 % $ 16,512 $ 18,469 2.90 %
Loans Held for Sale: At December 31, 2020, we held $540.80 million in mortgage loans originated and intended for sale in the secondary market, compared with $419.23 million at December 31, 2019. Average loans held for sale were 4.21% and 3.22% of average earning assets for the years ended December 31, 2020 and 2019, respectively.
Our mortgage banking activities include two types of commitments: rate lock commitments and forward mortgage loan sales contracts. Rate lock commitments are loans in our pipeline that have an interest rate locked with the customer. The commitments are generally for periods of 60 days and are at market rates. In order to mitigate the effect of the interest rate risk inherent in providing rate lock commitments, we enter into either a forward loan sales contract under best efforts delivery, or a trade of TBA MBS ("notional securities") for mandatory delivery. When the interest rate is locked with the borrower, the rate lock commitment and MBS position are undesignated derivatives and marked to fair value through earnings. The fair value of the rate lock derivative is based on quoted prices for similar loans in the secondary market adjusted by a factor which considers the likelihood that the loan in a lock position will ultimately close. Both the rate lock commitment and the corresponding TBA MBS are considered derivatives, but are not accounted for using hedge accounting. As such, changes in the estimated fair value of the derivatives during the commitment period are recorded in current earnings and included in net residential mortgage banking income in the Consolidated Statements of Income.
Loan Portfolio: Our loan portfolio, net of unearned income and deferred costs, totaled $9.63 billion on December 31, 2020. As a percentage of total average earning assets, average loans were 78.45% in 2020, compared with 77.88% in 2019 and 79.62% in 2018. Lending activities represent our primary source of income. Excluding PPP, management expects annualized loan growth to be in the mid-single digits for 2021. The
TOWNEBANKMANAGEMENT’S DISCUSSION AND ANALYSIS
27

following tables provide the balance and composition of the loan portfolio by major classification for the periods indicated (dollars in thousands):
Year Ended December 31, 2020 2019 2018 2017 2016
Commercial Real Estate
Construction and land development $ 1,199,772 $ 1,117,625 $ 1,067,239 $ 930,426 $ 826,027
Owner occupied 1,380,516 1,330,344 1,262,748 937,767 928,846
Non-owner occupied 2,335,235 2,183,409 1,978,592 1,344,774 1,322,466
Multi-family 295,488 242,773 260,987 198,720 222,791
Total Commercial Real Estate 5,211,011 4,874,151 4,569,566 3,411,687 3,300,130
Residential 1-4 family 1,216,629 1,192,090 1,153,037 814,822 801,928
HELOC 412,476 460,639 473,859 402,527 413,895
Commercial and industrial business 1,990,808 1,173,409 1,175,396 800,684 806,097
Government 379,243 325,123 320,607 277,652 279,615
Indirect 271,459 267,950 268,558 187,439 151,222
Consumer loans and other 147,442 125,926 57,210 51,154 54,334
Loans, net of unearned income and deferred costs $ 9,629,068 $ 8,419,288 $ 8,018,233 $ 5,945,965 $ 5,807,221
Year Ended December 31, 2020 2019 2018 2017 2016
Commercial Real Estate
Construction and land development 12.46 % 13.27 % 13.31 % 15.65 % 14.22 %Owner occupied 14.34 % 15.80 % 15.75 % 15.77 % 15.99 %Non-owner occupied 24.26 % 25.94 % 24.68 % 22.62 % 22.78 %Multi-family 3.07 % 2.88 % 3.25 % 3.34 % 3.84 %
Total Commercial Real Estate 54.13 % 57.89 % 56.99 % 57.38 % 56.83 %Residential 1-4 family 12.63 % 14.16 % 14.38 % 13.70 % 13.81 %HELOC 4.28 % 5.47 % 5.91 % 6.77 % 7.13 %Commercial and industrial business 20.67 % 13.94 % 14.66 % 13.47 % 13.88 %Government 3.94 % 3.86 % 4.00 % 4.67 % 4.81 %Indirect 2.82 % 3.18 % 3.35 % 3.15 % 2.60 %Consumer loans and other 1.53 % 1.50 % 0.71 % 0.86 % 0.94 %Loans, net of unearned income and deferred costs 100.00 % 100.00 % 100.00 % 100.00 % 100.00 %
TOWNEBANKMANAGEMENT’S DISCUSSION AND ANALYSIS
28

The table below provides the maturity and sensitivity of the loan portfolio at December 31, 2020 (in thousands):
Due After One Year
Due in One Year or Less
Due After One Year Through
Five YearsDue After Five Years Totals Fixed Rates
Adjustable Rates
Commercial Real Estate
Construction and land development $ 722,292 $ 378,217 $ 99,263 $ 1,199,772 $ 274,367 $ 203,113 Owner occupied 96,334 284,342 999,840 1,380,516 1,176,841 107,341 Non-owner occupied 237,040 729,239 1,368,956 2,335,235 1,865,663 232,532 Multi-family 14,217 96,460 184,811 295,488 246,426 34,845
Residential 1- 4 family 69,122 152,580 994,927 1,216,629 653,742 493,765 HELOC 45,180 63,987 303,309 412,476 1,953 365,343
Commercial and industrial business 517,420 1,187,029 286,359 1,990,808 1,361,409 111,979 Government 9,093 33,203 336,947 379,243 261,160 108,990 Indirect 8,215 174,772 88,472 271,459 263,244 —
Consumer loans and other 41,458 70,813 35,171 147,442 94,743 11,241
Loans, net of unearned income and deferred costs $ 1,760,371 $ 3,170,642 $ 4,698,055 $ 9,629,068 $ 6,199,548 $ 1,669,149
The following table is a summary of our floating rate loan portfolio and contractual interest rate indices at December 31, 2020 (in thousands):
Contractual Interest Rate IndexFloating Rate (at floor rate)
Floating Rate (not at floor
or ceiling rate)
Floating Rate(at ceiling
rate)Total Floating
Rate
Percentage of Floating
Rate LoansWall Street Journal Prime $ 776,777 $ 448,341 $ — $ 1,225,118 45.7 %LIBOR 466,477 492,226 — 958,703 35.8 %Other contractual interest rate indices 12,219 482,048 — 494,267 18.5 %
$ 1,255,473 $ 1,422,615 $ — $ 2,678,088 100.0 %
At December 31, 2020, the majority of our floating rate loans are tied to LIBOR interest rates or Wall Street Journal Prime interest rates. LIBOR is the global benchmark rate supporting a diverse range of financial activities in the U.S. and abroad. Although the Financial Conduct Authority, which is the governing body responsible for collecting and communicating LIBOR rates, announced they would cease their activities in 2021, that deadline has now been extended until June 30, 2023. When it occurs, transition to another benchmark is expected to have a financial impact on the banking industry as a whole. The full impact of the transition cannot be determined at this time.
Allowance for Credit Losses and Asset Quality: Effective January 1, 2020, with the adoption of ASU 326, losses were required to be estimated over the life of the loan and recorded at origination or acquisition. We are also required to incorporate reasonable and supportable forecasts into our credit loss estimates. The allowance for credit losses on funded loans is established through a provision for credit losses charged against earnings. Additionally, with the adoption of ASU 326, the Company increased the allowance for credit losses on unfunded commitments, in other liabilities, with a provision for credit losses charged against earnings. The level of the allowance for credit losses is an estimate of expected losses inherent in the Company's portfolio at December 31, 2020.
TOWNEBANKMANAGEMENT’S DISCUSSION AND ANALYSIS
29
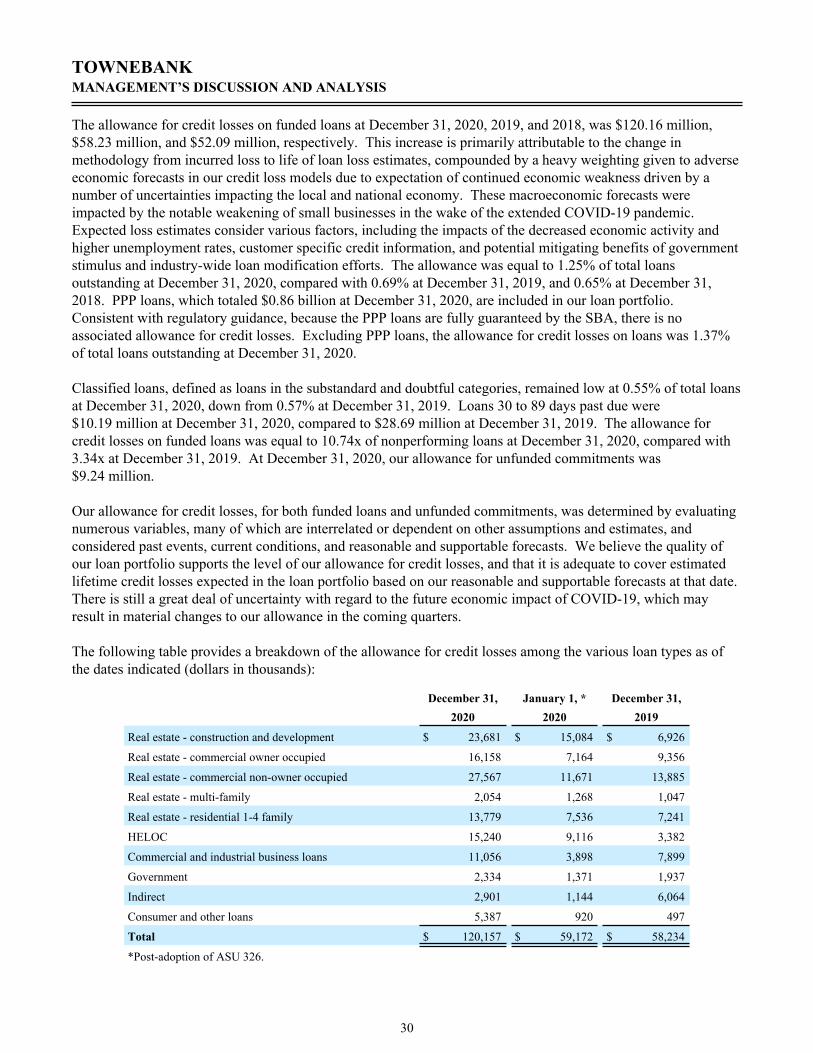
The allowance for credit losses on funded loans at December 31, 2020, 2019, and 2018, was $120.16 million, $58.23 million, and $52.09 million, respectively. This increase is primarily attributable to the change in methodology from incurred loss to life of loan loss estimates, compounded by a heavy weighting given to adverse economic forecasts in our credit loss models due to expectation of continued economic weakness driven by a number of uncertainties impacting the local and national economy. These macroeconomic forecasts were impacted by the notable weakening of small businesses in the wake of the extended COVID-19 pandemic. Expected loss estimates consider various factors, including the impacts of the decreased economic activity and higher unemployment rates, customer specific credit information, and potential mitigating benefits of government stimulus and industry-wide loan modification efforts. The allowance was equal to 1.25% of total loans outstanding at December 31, 2020, compared with 0.69% at December 31, 2019, and 0.65% at December 31, 2018. PPP loans, which totaled $0.86 billion at December 31, 2020, are included in our loan portfolio. Consistent with regulatory guidance, because the PPP loans are fully guaranteed by the SBA, there is no associated allowance for credit losses. Excluding PPP loans, the allowance for credit losses on loans was 1.37% of total loans outstanding at December 31, 2020.
Classified loans, defined as loans in the substandard and doubtful categories, remained low at 0.55% of total loans at December 31, 2020, down from 0.57% at December 31, 2019. Loans 30 to 89 days past due were $10.19 million at December 31, 2020, compared to $28.69 million at December 31, 2019. The allowance for credit losses on funded loans was equal to 10.74x of nonperforming loans at December 31, 2020, compared with 3.34x at December 31, 2019. At December 31, 2020, our allowance for unfunded commitments was $9.24 million.
Our allowance for credit losses, for both funded loans and unfunded commitments, was determined by evaluating numerous variables, many of which are interrelated or dependent on other assumptions and estimates, and considered past events, current conditions, and reasonable and supportable forecasts. We believe the quality of our loan portfolio supports the level of our allowance for credit losses, and that it is adequate to cover estimated lifetime credit losses expected in the loan portfolio based on our reasonable and supportable forecasts at that date. There is still a great deal of uncertainty with regard to the future economic impact of COVID-19, which may result in material changes to our allowance in the coming quarters.
The following table provides a breakdown of the allowance for credit losses among the various loan types as of the dates indicated (dollars in thousands):
December 31, January 1, * December 31,2020 2020 2019
Real estate - construction and development $ 23,681 $ 15,084 $ 6,926
Real estate - commercial owner occupied 16,158 7,164 9,356
Real estate - commercial non-owner occupied 27,567 11,671 13,885
Real estate - multi-family 2,054 1,268 1,047
Real estate - residential 1-4 family 13,779 7,536 7,241
HELOC 15,240 9,116 3,382
Commercial and industrial business loans 11,056 3,898 7,899
Government 2,334 1,371 1,937
Indirect 2,901 1,144 6,064
Consumer and other loans 5,387 920 497
Total $ 120,157 $ 59,172 $ 58,234
*Post-adoption of ASU 326.
TOWNEBANKMANAGEMENT’S DISCUSSION AND ANALYSIS
30

The following table provides information on the allowance for credit losses on loans and nonperforming assets for the periods indicated (dollars in thousands): Year Ended December 31, 2020 2019 2018 2017 2016Nonperforming assets:
Nonperforming loans $ 11,188 $ 17,437 $ 4,749 $ 4,807 $ 13,099 Former bank premises 750 1,521 2,253 3,469 3,494 Foreclosed property 4,276 13,839 17,163 19,818 21,011 Total nonperforming assets $ 16,214 $ 32,797 $ 24,165 $ 28,094 $ 37,604 Loans past due 90 days accruing interest $ 528 $ 309 $ 394 $ 103 $ 76
Asset Quality RatiosAllowance for loan losses to nonperforming loans 10.74x 3.34x 10.97x 9.39x 3.21x
Allowance to nonperforming assets 7.41x 1.78x 2.16x 1.61x 1.12xAllowance for loan losses to period end loans 1.25 % 0.69 % 0.65 % 0.76 % 0.72 %
Allowance for loan losses to period end loans excluding PPP loans 1.37 % 0.69 % 0.65 % 0.76 % 0.72 %Nonperforming loans to period end loans 0.12 % 0.21 % 0.06 % 0.08 % 0.23 %Nonperforming assets to period end assets 0.11 % 0.27 % 0.22 % 0.33 % 0.47 %
Net charge-offs to average loans — 0.04 % 0.03 % 0.04 % 0.03 %
For additional financial details regarding the analysis of the allowance for credit losses on loans, see Note 5, "Allowance for Credit Losses on Loans," of the Notes to Consolidated Financial Statements in this report.
The following table provides information on the composition of nonperforming loans by loan type as of the dates indicated (in thousands):
December 31, December 31,2020 2019
CRE - Construction and development $ — $ 43 CRE - Owner occupied 387 7,291 CRE - Non-owner occupied 1,163 221 CRE - Multi-family — — Residential 1-4 family 3,432 4,760 HELOC 1,072 1,214 Commercial and industrial business 4,414 3,284 Government — — Indirect 717 620 Consumer and other loans 3 4 Total nonperforming loans $ 11,188 $ 17,437
Nonperforming assets consist of nonaccrual loans, foreclosed real estate, and other repossessed collateral. It is our policy to place commercial loans on nonaccrual status when full collection of principal and interest becomes doubtful, or when any portion of principal or interest becomes 90 days past due, whichever occurs first, unless the
TOWNEBANKMANAGEMENT’S DISCUSSION AND ANALYSIS
31
debt is both well-secured and in the process of collection. When loans are placed on nonaccrual status, interest receivable is reversed against interest income recognized in the current period, and any prior-year unpaid interest is charged off against the allowance for loan losses. Interest payments received thereafter are applied as a reduction of the remaining principal balance so long as doubt exists as to the ultimate collection of the principal. Loans are removed from nonaccrual status when they become current as to both principal and interest and when the collection of principal or interest is no longer doubtful. Similarly, residential mortgage loans and other consumer loans are also placed on nonaccrual status when full collection of principal and interest becomes doubtful, or when any portion of principal or interest becomes 120 days past due, whichever occurs first, unless the debt is both well-secured and in the process of collection.
At December 31, 2020, we had $16.21 million in nonperforming assets, which amounted to 0.11% of total assets. Nonperforming assets consist of $11.19 million in nonperforming loans, $0.75 million in former bank premises related to the Monarch merger, as well as $4.28 million in foreclosed property. Nonperforming loans decreased by $6.25 million from December 31, 2019. At December 31, 2020, foreclosed property totaled $4.28 million, a decrease from $13.84 million at December 31, 2019. Foreclosed property consists of two residential properties and three construction and development properties. The largest foreclosed property development represents 86.60% of total foreclosed property at December 31, 2020.
At December 31, 2020, loans 60-89 days past due, excluding nonperforming loans, totaled $0.22 million. All loans in these categories are subject to constant management attention, and their status is reviewed on a regular basis.
In order to maximize the collection of loan balances, we evaluate troubled loan accounts on a case-by-case basis to determine if a loan modification would be appropriate. We may pursue loan modifications when there is a reasonable chance that an appropriate modification would allow our clients to continue servicing the debt. Because some TDRs may not ultimately result in the complete collection of principal and interest (as modified by the terms of the restructuring), additional incremental losses could result. These potential incremental losses have been factored into our overall allowance for credit losses estimate.
At December 31, 2020, nonaccruing TDRs, which are included in nonperforming loans, totaled $0.71 million and accruing TDRs totaled $13.86 million. Nonaccruing loans that are modified can be placed back on accrual status when both principal and interest are current, there is a sustained repayment performance of six months or longer, and it is probable that we will be able to collect all amounts due (both principal and interest) according to the terms of the loan agreement.
Section 4013 of the CARES Act provides that a qualified loan modification is exempt by law from classification as a TDR as defined by GAAP from the period beginning March 1, 2020, until the earlier of December 31, 2020, or the date that is 60 days after the date on which the national emergency concerning the COVID-19 outbreak was declared by the President of the United States under the National Emergencies Act terminates. On December 27, 2020, the Appropriations Act amended the Cares Act Section 4013 and extended the TDR relief to the earlier of January 1, 2022, or 60 days after the date on which the national emergency concerning the COVID-19 outbreak was declared by the President of the United States under the National Emergencies Act terminates. Accordingly, we are offering short-term modifications made in response to COVID-19 to borrowers who are current and otherwise not past due. These generally include short-term, 180 days or less, modifications in the form of payment deferrals, fee waivers, extensions of repayment terms, or other delays in payment that are insignificant. As of December 31, 2020, we had 210 loans with modifications under on Section 4013 with total outstanding balances of $340.81 million.
Deposits: Customer deposits are attractive sources of liquidity because of their stability, low average cost, and the ability to generate fee income through the cross-sale of other services to depositors. Deposits are attracted
TOWNEBANKMANAGEMENT’S DISCUSSION AND ANALYSIS
32
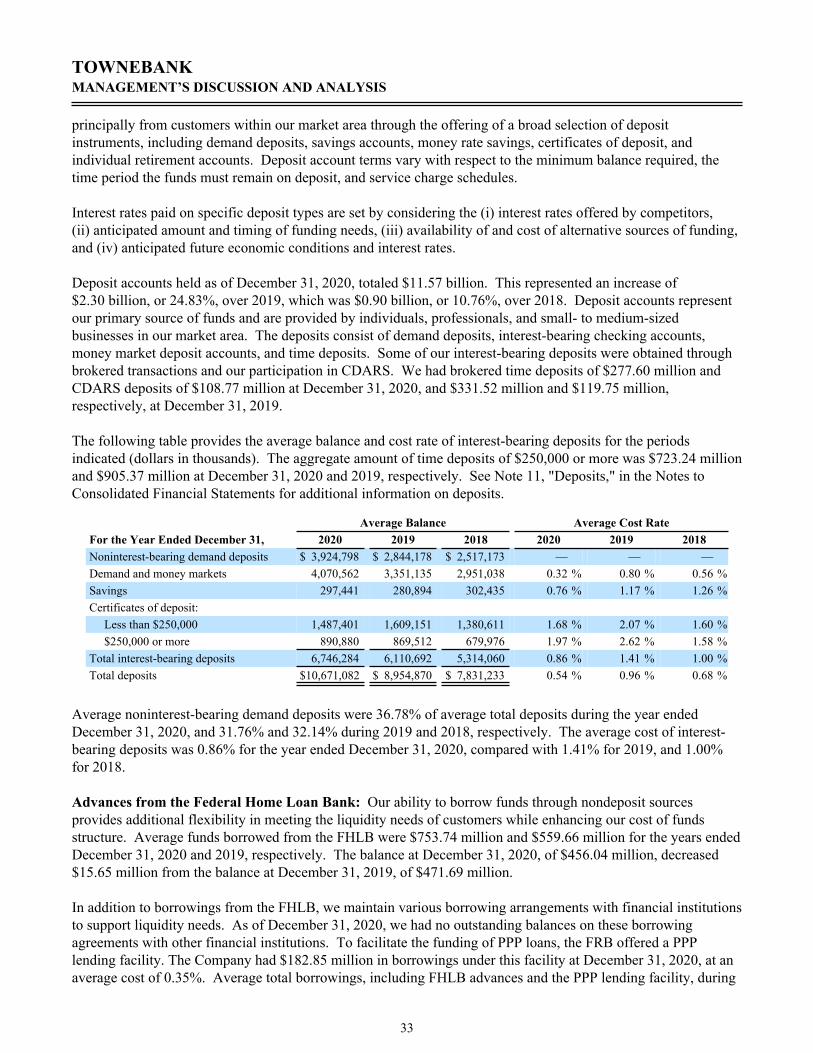
principally from customers within our market area through the offering of a broad selection of deposit instruments, including demand deposits, savings accounts, money rate savings, certificates of deposit, and individual retirement accounts. Deposit account terms vary with respect to the minimum balance required, the time period the funds must remain on deposit, and service charge schedules.
Interest rates paid on specific deposit types are set by considering the (i) interest rates offered by competitors, (ii) anticipated amount and timing of funding needs, (iii) availability of and cost of alternative sources of funding, and (iv) anticipated future economic conditions and interest rates.
Deposit accounts held as of December 31, 2020, totaled $11.57 billion. This represented an increase of $2.30 billion, or 24.83%, over 2019, which was $0.90 billion, or 10.76%, over 2018. Deposit accounts represent our primary source of funds and are provided by individuals, professionals, and small- to medium-sized businesses in our market area. The deposits consist of demand deposits, interest-bearing checking accounts, money market deposit accounts, and time deposits. Some of our interest-bearing deposits were obtained through brokered transactions and our participation in CDARS. We had brokered time deposits of $277.60 million and CDARS deposits of $108.77 million at December 31, 2020, and $331.52 million and $119.75 million, respectively, at December 31, 2019.
The following table provides the average balance and cost rate of interest-bearing deposits for the periods indicated (dollars in thousands). The aggregate amount of time deposits of $250,000 or more was $723.24 million and $905.37 million at December 31, 2020 and 2019, respectively. See Note 11, "Deposits," in the Notes to Consolidated Financial Statements for additional information on deposits.
Average Balance Average Cost RateFor the Year Ended December 31, 2020 2019 2018 2020 2019 2018Noninterest-bearing demand deposits $ 3,924,798 $ 2,844,178 $ 2,517,173 — — — Demand and money markets 4,070,562 3,351,135 2,951,038 0.32 % 0.80 % 0.56 %Savings 297,441 280,894 302,435 0.76 % 1.17 % 1.26 %Certificates of deposit:
Less than $250,000 1,487,401 1,609,151 1,380,611 1.68 % 2.07 % 1.60 %$250,000 or more 890,880 869,512 679,976 1.97 % 2.62 % 1.58 %
Total interest-bearing deposits 6,746,284 6,110,692 5,314,060 0.86 % 1.41 % 1.00 %Total deposits $ 10,671,082 $ 8,954,870 $ 7,831,233 0.54 % 0.96 % 0.68 %
Average noninterest-bearing demand deposits were 36.78% of average total deposits during the year ended December 31, 2020, and 31.76% and 32.14% during 2019 and 2018, respectively. The average cost of interest-bearing deposits was 0.86% for the year ended December 31, 2020, compared with 1.41% for 2019, and 1.00% for 2018.
Advances from the Federal Home Loan Bank: Our ability to borrow funds through nondeposit sources provides additional flexibility in meeting the liquidity needs of customers while enhancing our cost of funds structure. Average funds borrowed from the FHLB were $753.74 million and $559.66 million for the years ended December 31, 2020 and 2019, respectively. The balance at December 31, 2020, of $456.04 million, decreased $15.65 million from the balance at December 31, 2019, of $471.69 million.
In addition to borrowings from the FHLB, we maintain various borrowing arrangements with financial institutions to support liquidity needs. As of December 31, 2020, we had no outstanding balances on these borrowing agreements with other financial institutions. To facilitate the funding of PPP loans, the FRB offered a PPP lending facility. The Company had $182.85 million in borrowings under this facility at December 31, 2020, at an average cost of 0.35%. Average total borrowings, including FHLB advances and the PPP lending facility, during
TOWNEBANKMANAGEMENT’S DISCUSSION AND ANALYSIS
33

2020 were $1.27 billion, compared with $0.61 billion at December 31, 2019, while the average cost of these funds was 0.80% and 1.84%, respectively. Refer to Note 12, "Borrowings," in the Notes to Consolidated Financial Statements for additional disclosures related to borrowing arrangements.
Subordinated Debt: On July 17, 2017, the Company issued $250.0 million of fixed-to-floating rate subordinated notes due July 30, 2027, in a public offering. The Company received $247.07 million in net proceeds after deducting discounts and issuance costs. The subordinated notes accrue interest at a fixed rate of 4.50% for the first five years until July 30, 2022. From and including this date and for the remaining five years of the subordinated notes' term, interest will accrue at a floating rate of three-month LIBOR plus 2.55%. The Company may redeem the subordinated notes, in whole or in part, on or after July 30, 2022. At December 31, 2020, the carrying value of the notes totaled $249.06 million and average subordinated debt during 2020 was $248.74 million, while the average cost of the debentures was 4.76%. At December 31, 2019, the carrying value of the notes totaled $248.46 million and average subordinated debt during 2019 was $248.14 million, while the average cost of the debentures was 4.77%.
Liquidity: Liquidity represents our ability to provide funds to meet customer demand for loan and deposit withdrawals without impairing profitability. Our liquid assets consist of cash, interest-bearing deposits in financial institutions, federal funds sold, and investments and loans maturing within one year. Asset liquidity is also provided by managing both loan and security maturities.
Liquidity Sources (in thousands) December 31, 2020Available Liquid Funds:Cash and cash equivalents $ 1,864,288 Unencumbered investment securities 955,172 Availability of Borrowings:Amount available from FHLB 1,582,456 Amount available from unsecured liens of credit with correspondent banks 155,000 Amount available for Federal Reserve discount window 465,392
We maintained an average of $689.72 million outstanding in overnight interest-bearing deposits during 2020, compared with $665.90 million for 2019. We intend to maintain sufficient liquidity at all times to meet our funding commitments and growth plans. During 2020, we primarily funded our growth in total assets with deposit growth.
Capital Resources: Federal banking laws set forth certain regulatory capital requirements that apply to us. Within the framework established by the law, we qualify for the classification "well-capitalized," which is the highest regulatory classification.
Additional information concerning our capital resources is contained in Note 19, "Regulatory Capital Requirements," in the Notes to Consolidated Financial Statements.
TOWNEBANKMANAGEMENT’S DISCUSSION AND ANALYSIS
34

Contractual Obligations, Contingent Liabilities, and Commitments: The following table summarizes our significant contractual obligations, contingent liabilities, and certain other commitments outstanding as of December 31, 2020. Loan commitments and standby letters of credit are presented at contractual amounts; however, since many of these commitments are expected to expire unused or partially used, the total amounts of these commitments do not necessarily reflect future cash requirements.
(in thousands) Payments Due by Period
Contractual Obligations TotalLess Than
1 Year 1 - 3 years 3 - 5 yearsMore Than
5 YearsOperating lease obligations $ 91,461 $ 12,568 $ 18,784 $ 12,099 $ 48,010 Other long-term liabilities reflected on the
registrant's balance sheet under GAAPFHLB advances 456,038 300,000 125,000 25,000 6,038
Other commitmentsStandby letters of credit 134,000 134,000 — — — Commitments to extend credit 3,693,352 2,739,970 953,382 — —
Total contractual obligations $ 4,374,851 $ 3,186,538 $ 1,097,166 $ 37,099 $ 54,048
Impact of Inflation and Changing Prices: The financial statements and related data presented herein have been prepared in accordance with GAAP. These principles dictate that financial position and operating results be measured in terms of historical dollars, without considering changes in the relative purchasing power of money over time due to inflation. A financial institution's assets and liabilities are primarily monetary in nature. As a result, general levels of inflation typically have a less significant effect on financial performance than do changes in interest rates; however, noninterest expenses tend to rise in periods of general inflation.
Return on Equity and Assets: The annualized ratio of operating income to average total assets and average shareholders' equity and average equity to average assets for the periods indicated are as follows:
Year Ended December 31, 2020 2019 2018Return on average assets 1.03 % 1.19 % 1.26 %Return on average equity 8.46 % 8.69 % 9.20 %Return on average tangible equity (non-GAAP) 12.62 % 13.58 % 14.52 %Average equity to average assets 12.14 % 13.72 % 13.73 %
Interest Sensitivity: Prudent balance sheet management requires processes that monitor and protect us against unanticipated or significant changes in the level of market interest rates. Net interest income stability should be maintained in changing rate environments by ensuring that interest rate risk is kept to an acceptable level. The ability to reprice our interest-sensitive assets and liabilities over various time intervals is of critical importance.
We use a variety of traditional and on-balance-sheet tools to manage our interest rate risk. Gap analysis, which monitors the "gap" between interest-sensitive assets and liabilities, is one such tool. In addition, we use simulation modeling to forecast future balance sheet and income statement behavior. By studying the effects on net interest income of rising, stable, and falling interest rate scenarios, we can position ourselves to take advantage of anticipated interest rate movement, and protect ourselves from unanticipated rate movements, by understanding the dynamic nature of our balance sheet components.
An asset-sensitive balance sheet structure implies that assets, such as loans and securities, will reprice faster than liabilities; consequently, net interest income should be positively affected in an increasing interest rate environment. Conversely, a liability-sensitive balance sheet structure implies that liabilities, such as deposits, will reprice faster than assets; consequently, net interest income should be positively affected in a decreasing interest rate environment. At December 31, 2020, we had $0.70 billion more liabilities than assets subject to repricing
TOWNEBANKMANAGEMENT’S DISCUSSION AND ANALYSIS
35
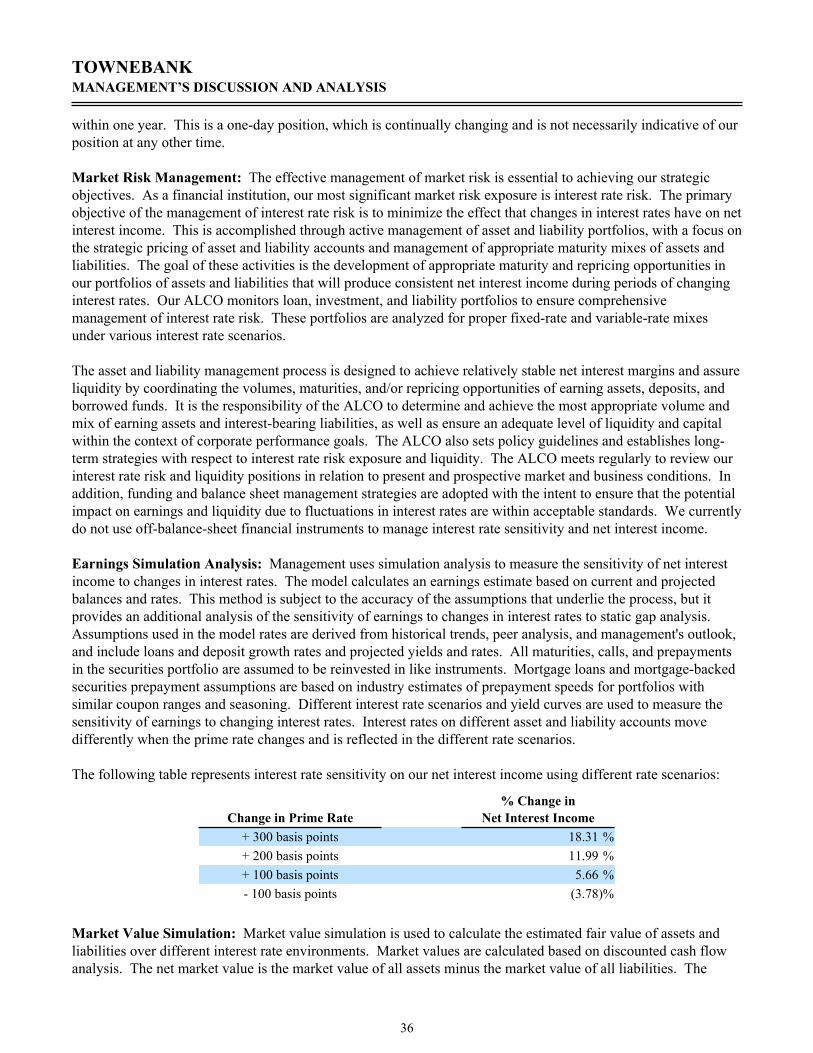
within one year. This is a one-day position, which is continually changing and is not necessarily indicative of our position at any other time.
Market Risk Management: The effective management of market risk is essential to achieving our strategic objectives. As a financial institution, our most significant market risk exposure is interest rate risk. The primary objective of the management of interest rate risk is to minimize the effect that changes in interest rates have on net interest income. This is accomplished through active management of asset and liability portfolios, with a focus on the strategic pricing of asset and liability accounts and management of appropriate maturity mixes of assets and liabilities. The goal of these activities is the development of appropriate maturity and repricing opportunities in our portfolios of assets and liabilities that will produce consistent net interest income during periods of changing interest rates. Our ALCO monitors loan, investment, and liability portfolios to ensure comprehensive management of interest rate risk. These portfolios are analyzed for proper fixed-rate and variable-rate mixes under various interest rate scenarios.
The asset and liability management process is designed to achieve relatively stable net interest margins and assure liquidity by coordinating the volumes, maturities, and/or repricing opportunities of earning assets, deposits, and borrowed funds. It is the responsibility of the ALCO to determine and achieve the most appropriate volume and mix of earning assets and interest-bearing liabilities, as well as ensure an adequate level of liquidity and capital within the context of corporate performance goals. The ALCO also sets policy guidelines and establishes long-term strategies with respect to interest rate risk exposure and liquidity. The ALCO meets regularly to review our interest rate risk and liquidity positions in relation to present and prospective market and business conditions. In addition, funding and balance sheet management strategies are adopted with the intent to ensure that the potential impact on earnings and liquidity due to fluctuations in interest rates are within acceptable standards. We currently do not use off-balance-sheet financial instruments to manage interest rate sensitivity and net interest income.
Earnings Simulation Analysis: Management uses simulation analysis to measure the sensitivity of net interest income to changes in interest rates. The model calculates an earnings estimate based on current and projected balances and rates. This method is subject to the accuracy of the assumptions that underlie the process, but it provides an additional analysis of the sensitivity of earnings to changes in interest rates to static gap analysis. Assumptions used in the model rates are derived from historical trends, peer analysis, and management's outlook, and include loans and deposit growth rates and projected yields and rates. All maturities, calls, and prepayments in the securities portfolio are assumed to be reinvested in like instruments. Mortgage loans and mortgage-backed securities prepayment assumptions are based on industry estimates of prepayment speeds for portfolios with similar coupon ranges and seasoning. Different interest rate scenarios and yield curves are used to measure the sensitivity of earnings to changing interest rates. Interest rates on different asset and liability accounts move differently when the prime rate changes and is reflected in the different rate scenarios.
The following table represents interest rate sensitivity on our net interest income using different rate scenarios:
% Change inChange in Prime Rate Net Interest Income
+ 300 basis points 18.31 %+ 200 basis points 11.99 %+ 100 basis points 5.66 %- 100 basis points (3.78) %
Market Value Simulation: Market value simulation is used to calculate the estimated fair value of assets and liabilities over different interest rate environments. Market values are calculated based on discounted cash flow analysis. The net market value is the market value of all assets minus the market value of all liabilities. The
TOWNEBANKMANAGEMENT’S DISCUSSION AND ANALYSIS
36

change in net market value over different rate environments is an indication of the longer term repricing risk in the balance sheet. The same assumptions are used in the market value simulation as in the earnings simulation. The following table reflects the change in net market value over different rate environments:
Change in Net Market ValueChange in Prime Rate (in thousands)
+ 300 basis points $ 303,819 + 200 basis points $ 209,701 + 100 basis points $ 103,579 - 100 basis points $ (147,384)
Credit Risk Elements: We place commercial loans in nonaccrual status when management believes, after considering economic and business conditions and collections efforts, that the borrower's financial condition is such that full collection of principal and interest is doubtful or when the loan is past due for 90 days or more, unless the debt is both well-secured and in the process of collection. Residential mortgage loans and other consumer loans are placed on nonaccrual status when full collection of principal and interest becomes doubtful or when the loan is past due for 120 days or more, unless the debt is both well-secured and in the process of collection.
FORWARD-LOOKING STATEMENTS
This report contains certain forward-looking statements with respect to our plans, objectives, future performance, and business, which are made pursuant to the safe harbor provisions of the Private Securities Litigation Reform Act of 1995. Words such as "expects," "anticipates," "believes," "plans," "intends," "estimates," and other similar expressions or future or conditional verbs such as "will," "should," "would," "may," "likely," "probably," "possibly," and "could" are intended to identify such forward-looking statements. These forward-looking statements are not guarantees of future performance and involve certain risks and uncertainties and are based on the beliefs and assumptions of our management.
Factors that may cause actual results to differ materially from those contemplated by such forward-looking statements include, among others, the following:
• competitive pressures in the banking industry may increase significantly;
• the impact of the COVID-19 pandemic and the associated efforts to limit its spread;
• changes in the interest rate environment may reduce margins and/or the volumes and values of loans made or held, as well as the value of other financial assets held;
• changes in the creditworthiness of customers may possibly impair the collectability of loans;
• general economic conditions, either nationally or regionally, may be less favorable than expected, resulting in, among other things, a deterioration in credit quality and/or a reduced demand for credit or other services;
• changes in the legislative or regulatory environment, including changes in accounting standards and tax laws, may adversely affect our businesses;
• costs or difficulties related to the integration of the business and the businesses we have acquired may be greater than expected;
• expected cost savings associated with pending or recently completed acquisitions may not be fully realized or realized within the expected time frame;
TOWNEBANKMANAGEMENT’S DISCUSSION AND ANALYSIS
37

• cybersecurity threats or attacks, the implementation of new technologies, and the ability to develop and maintain reliable electronic systems;
• our competitors may have greater financial resources and develop products that enable them to compete more successfully;
• changes in business conditions;
• changes in the securities market; and
• changes in our local economy with regard to our market area.
We undertake no obligation to update or clarify these forward-looking statements, whether as a result of new information, future events, or otherwise.
NON-GAAP FINANCIAL MEASURES
This report contains financial information determined by methods other than in accordance with GAAP. The Company's management uses these non-GAAP financial measures in its analysis of the Company's performance. Management believes presentations of these non-GAAP financial measures provide useful supplemental information that is essential to a proper understanding of the operating results of the Company's core businesses. These non-GAAP disclosures should not be viewed as a substitute for operating results determined in accordance with GAAP, nor are they necessarily comparable to non-GAAP performance measures that may be presented by other companies.
The Company presents return on average assets, return on average tangible assets, return on average equity, and return on average tangible equity. The Company excludes the balance of average goodwill and other intangible assets from our calculation of return on average tangible assets and return on average tangible equity. This adjustment allows management to review the Company's core operating results and core capital position.
TOWNEBANKMANAGEMENT’S DISCUSSION AND ANALYSIS
38

(dollars in thousands)Year Ended December 31, 2020 2019Average assets (GAAP basis) $ 14,172,206 $ 11,638,426 Less: average goodwill and other intangibles 495,707 503,108 Average tangible assets (non-GAAP) $ 13,676,499 $ 11,135,318
Average equity (GAAP basis) $ 1,721,059 $ 1,597,281 Less: average goodwill and other intangibles 495,707 503,108 Average tangible equity (non-GAAP) $ 1,225,352 $ 1,094,173
Average common equity (GAAP) $ 1,707,635 $ 1,585,238 Less: average goodwill and other intangibles 495,707 503,108 Average tangible common equity (non-GAAP) $ 1,211,928 $ 1,082,130
Net interest income (GAAP) $ 380,144 $ 358,355 Add: Tax equivalent basis adjustment 2,296 2,457 Tax equivalent net interest income (non-GAAP) $ 382,440 $ 360,812
Net income (GAAP) $ 145,535 $ 138,783 Add: Amortization of intangibles, net of tax 9,086 9,772 Tangible net income (non-GAAP) $ 154,621 $ 148,555
Total revenue (GAAP) $ 664,335 $ 563,943 Net (gain)/loss on investment securities (9,634) 845 Other nonrecurring income (17,625) — Operating income (non-GAAP) $ 637,076 $ 564,788
Total noninterest expenses (GAAP) $ 395,825 $ 378,302 Less: Amortization of intangibles 11,498 12,370 Operating expense (non-GAAP) $ 384,327 $ 365,932
TOWNEBANKMANAGEMENT’S DISCUSSION AND ANALYSIS
39

Year Ended December 31, 2020 2019Return on average assets (GAAP basis) 1.03 % 1.19 %Impact of excluding average goodwill and other intangibles and amortization 0.10 % 0.14 %Return on average tangible assets (non-GAAP) 1.13 % 1.33 %
Return on average equity (GAAP basis) 8.46 % 8.69 %Impact of excluding average goodwill and other intangibles and amortization 4.16 % 4.89 %Return on average tangible equity (non-GAAP) 12.62 % 13.58 %
Return on average common equity (GAAP basis) 8.52 % 8.75 %Impact of excluding average goodwill and other intangibles and amortization 4.24 % 4.98 %Return on average tangible common equity (non-GAAP) 12.76 % 13.73 %
Efficiency ratio (GAAP) 59.58 % 67.08 %Impact of exclusions 0.75 % (2.29) %Efficiency ratio (non-GAAP) 60.33 % 64.79 %
The Company presents book value (period ended shareholders' equity divided by the period ended common shares outstanding) and tangible book value. In calculating tangible book value, the Company excludes goodwill and other intangible assets, allowing management to review its core capital position.
(dollars in thousands, except per share data) Per shareYear Ended December 31, 2020 2019Book value (GAAP basis) $ 24.31 $ 22.58 Impact of excluding average goodwill and other intangibles and amortization (6.85) (6.89) Tangible book value (non-GAAP) $ 17.46 $ 15.69
Period End:Common equity (GAAP basis) $ 1,766,848 $ 1,640,755 Goodwill and other intangibles 497,861 501,215 Tangible common equity (non-GAAP) $ 1,268,987 $ 1,139,540
TOWNEBANKMANAGEMENT’S DISCUSSION AND ANALYSIS
40

DHG is registered in the U.S. Patent and Trademark Office to Dixon Hughes Goodman LLP.
Report of Independent Registered Public Accounting Firm
To the Board of Directors and Shareholders of TowneBank
Opinions on the Consolidated Financial Statements and Internal Control Over Financial Reporting We have audited the accompanying consolidated balance sheets of TowneBank and subsidiaries (the “Company”) as of December 31, 2020 and 2019, and the related consolidated statements of income, comprehensive income, equity, and cash flows for each of the three years in the period ended December 31, 2020 and the related notes (collectively referred to as the “consolidated financial statements”). We also have audited the Company's internal control over financial reporting as of December 31, 2020, based on criteria established in Internal Control – Integrated Framework (2013) issued by the Committee of Sponsoring Organizations of the Treadway Commission (“COSO”).
In our opinion, the consolidated financial statements present fairly, in all material respects, the financial position of the Company as of December 31, 2020 and 2019, and the results of its operations and its cash flows for each of the three years in the period ended December 31, 2020, in conformity with U.S. generally accepted accounting principles. Also in our opinion, the Company maintained, in all material respects, effective internal control over financial reporting as of December 31, 2020, based on criteria established in Internal Control – Integrated Framework (2013) issued by COSO.
Basis for Opinion The Company’s management is responsible for these consolidated financial statements, for maintaining effective internal control over financial reporting, and for its assessment of the effectiveness of internal control over financial reporting, included in the accompanying Management’s Report on Internal Control. Our responsibility is to express an opinion on the Company’s consolidated financial statements, and an opinion on the Company’s internal control over financial reporting based on our audits. We are a public accounting firm registered with the Public Company Accounting Oversight Board (United States) (“PCAOB”) and are required to be independent with respect to the Company in accordance with the U.S. federal securities laws and the applicable rules and regulations of the Securities and Exchange Commission and the PCAOB.
We conducted our audits in accordance with the standards of the PCAOB. Those standards require that we plan and perform the audits to obtain reasonable assurance about whether the consolidated financial statements are free of material misstatement, whether due to error or fraud, and whether effective internal control over financial reporting was maintained in all material respects.
Our audits of the consolidated financial statements included performing procedures to assess the risks of material misstatement of the consolidated financial statements, whether due to error or fraud, and performing procedures that respond to those risks. Such procedures included examining, on a test basis, evidence regarding the amounts and disclosures in the consolidated financial statements. Our audits also included evaluating the accounting principles used and significant estimates made by management, as well as evaluating the overall presentation of the consolidated financial statements. Our audit of internal control over financial reporting included obtaining an understanding of internal control over
41

DHG is registered in the U.S. Patent and Trademark Office to Dixon Hughes Goodman LLP.
financial reporting, assessing the risk that a material weakness exists, and testing and evaluating the design and operating effectiveness of internal control based on the assessed risk. Our audits also included performing such other procedures as we considered necessary in the circumstances. We believe that our audits provide a reasonable basis for our opinions.
Adoption of New Accounting Standard As discussed in Notes 1, 3 and 5 to the consolidated financial statements, the Company changed its method of accounting for credit losses effective January 1, 2020 due to the adoption of Accounting Standards Codification (ASC) Topic 326 Financial Instruments – Credit Losses.
Critical Audit Matters The critical audit matters communicated below are matters arising from the current period audit of the financial statements that were communicated or required to be communicated to the audit committee and that: (1) relate to accounts or disclosures that are material to the financial statements and (2) involved our especially challenging, subjective, or complex judgments. The communication of critical audit matters does not alter in any way our opinion on the financial statements, taken as a whole, as we are not, by communicating the critical audit matters below, providing separate opinions on the critical audit matters or on the accounts or disclosures to which they relate.
Goodwill Impairment Assessment As described in Notes 1 and 8 to the consolidated financial statements, the Company’s consolidated goodwill balance was $452.3 million at December 31, 2020, which is allocated to the Company’s reporting units. Goodwill is tested for impairment at least annually at the reporting unit level. The determination of the fair value of the reporting units requires management to make significant estimates and assumptions in determining the discounted projected future cash flows, which are derived from internal forecasts, economic and market conditions, and the discount rate. As disclosed by management, changes in these assumptions could have a significant impact on either the fair value of the reporting units, the amount of any goodwill impairment charge, or both.
We identified the Company’s goodwill impairment assessment as a critical audit matter. Management makes estimates and assumptions for each reporting unit regarding cash flows over the forecast period as well as the discount rate, which include a higher degree of subjectivity. As a result, auditing the reasonableness of management’s significant estimates and assumptions, particularly as it relates to the rate of growth of revenue and expenses, involves a higher degree of judgment and subjectivity. In addition, the extent of audit effort included the use of the firm’s internal valuation specialists to assist in performing these procedures and evaluating whether management’s judgments were appropriate.
The primary procedures we performed to address this critical audit matter included:
• We tested the design and operating effectiveness of controls relating to management’s goodwillimpairment tests, including controls over management's review of the significant inputs andassumptions in determining the discounted projected future cash flows and the discount rate,associated with the fair value determination of the reporting units.
• We evaluated the historical performance of each of the reporting units as compared to forecastedperformance and assessing any significant forecasted changes. We also considered evidencegathered in other areas of the audit and the potential impact that could have on the assumptionsused in the calculations.
42

DHG is registered in the U.S. Patent and Trademark Office to Dixon Hughes Goodman LLP.
• We involved the firm’s internal valuation specialists in our evaluation of management’s significantassumptions, as described above, used in developing the fair value estimate for each reportingunit.
Allowance for Loan Credit Losses As described in Notes 1 and 5 to the consolidated financial statements, the Company’s consolidated allowance for loan credit losses was $120.2 million at December 31, 2020. As further described in Notes 1 and 5, the Company adopted ASC Topic 326 Financial Instruments – Credit Losses as of January 1, 2020. As described by management, the allowance for loan credit losses includes pooling loans with similar risk characteristics and individually evaluating loans that do not share similar risk characteristics. The Company builds an expected credit loss (ECL) using probability of default (PD), loss given default (LGD), and exposure at default (EAD) calculated based on the Company’s historical loss experience and then adjusted for a reasonable and supportable forecast. Estimating an appropriate allowance requires management to make numerous assumptions about losses that will occur over the remaining contractual life of loans recorded as of the balance sheet date. The most significant judgments in the allowance as of December 31, 2020 include the determination of a reasonable and supportable forecast and the impact of qualitative factors needed to adjust model ECL output to a level that management believes is appropriate for risks that are not fully accounted for in the quantitative analysis.
We identified the allowance for loan credit losses as a critical audit matter. The principal considerations for our determination of the allowance for loan credit losses as a critical audit matter includes management’s judgment applied in determining a reasonable and supportable forecast and determining the qualitative factors. In turn, auditing management’s judgments regarding loan credit loss estimates and assumptions, specifically the determination of reasonable and supportable forecasts and qualitative factors involved a high degree of subjectivity and an increased extent of audit effort.
The primary procedures we performed to address this critical audit matter included:
• We tested the design and operating effectiveness of controls relating to management’sdetermination of the allowance for loan credit losses, including controls relating to the:o Completeness and accuracy of input into the model used to determine the allowance for loan
credit losses.o Approval of key policies adopted during implementation of the new accounting standard.o The determination of a reasonable and supportable forecast.o The determination of the qualitative factors.
• We evaluated management’s application of qualitative adjustments, including testing the accuracy of the supporting calculations and evaluating whether the qualitative factors appropriatelyaddressed risks that were not fully accounted for in the quantitative ECL component of themethodology.
• We evaluated management’s determination of a reasonable and supportable forecast, includingtesting the application of the forecast in quantitative ECL calculation. We also utilized our internalspecialists to assist us in testing the application of the forecast to the ECL calculation.
43
DHG is registered in the U.S. Patent and Trademark Office to Dixon Hughes Goodman LLP.
Definition and Limitations of Internal Control Over Financial Reporting A company's internal control over financial reporting is a process designed to provide reasonable assurance regarding the reliability of financial reporting and the preparation of financial statements for external purposes in accordance with generally accepted accounting principles. A company's internal control over financial reporting includes those policies and procedures that (1) pertain to the maintenance of records that, in reasonable detail, accurately and fairly reflect the transactions and dispositions of the assets of the company; (2) provide reasonable assurance that transactions are recorded as necessary to permit preparation of financial statements in accordance with generally accepted accounting principles, and that receipts and expenditures of the company are being made only in accordance with authorizations of management and directors of the company; and (3) provide reasonable assurance regarding prevention or timely detection of unauthorized acquisition, use, or disposition of the company's assets that could have a material effect on the financial statements.
Because of its inherent limitations, internal control over financial reporting may not prevent or detect misstatements. Also, projections of any evaluation of effectiveness to future periods are subject to the risk that controls may become inadequate because of changes in conditions, or that the degree of compliance with the policies or procedures may deteriorate.
We have served as the Company’s auditor since 1999.
Charlotte, NC February 26, 2021
44

INTERNAL CONTROL OVER FINANCIAL REPORTING
Management of TowneBank is responsible for the preparation and fair presentation of the financial statements and other financial information contained in this report. The accompanying Consolidated Financial Statements were prepared in conformity with accounting principles generally accepted in the United States of America and include, as necessary, best estimates and judgments by management. Management also prepared other information in the Annual Report and is responsible for its accuracy and consistency with the consolidated financial statements. Our management is responsible for establishing and maintaining adequate internal control over financial reporting and for our compliance with laws and regulations relating to safety and soundness designated by the Federal Deposit Insurance Corporation ("FDIC"). Our internal control system was designed to provide reasonable assurance to our management and Board of Directors regarding the preparation and fair presentation of published financial statements.
All internal control systems, no matter how well designed, have inherent limitations. Therefore, even those systems determined to be effective can provide only reasonable assurance with respect to financial statement preparation and presentation.
We maintain systems of controls that we believe are reasonably designed to provide our management with timely and accurate information about our operations. The system of internal controls includes, but is not limited to, maintaining internal audit and compliance functions; establishing formal written policies, procedures, and codes of conduct; training personnel; and segregating key duties and functions, where appropriate.
The Audit Committee of the Board of Directors participates in the adequacy of the system of internal controls and financial reporting. The Audit Committee consists of independent directors who meet regularly with management, the internal auditor, and the independent auditors to review the scope of their work and findings.
Our management assessed the effectiveness of our internal control over financial reporting as of December 31, 2020, including controls over regulatory financial statements in accordance with the Federal Financial Institutions Examination Council instructions for Consolidated Reports of Condition and Income. In making this assessment, it used the criteria set forth by the Committee of Sponsoring Organizations of the Treadway Commission in Internal Control – Integrated Framework (2013). Based on our assessment we believe that, as of December 31, 2020, our internal control over financial reporting is effective based on those criteria.
Financial Statements
Our management is responsible for the preparation, integrity, and fair presentation of our published consolidated financial statements as of December 31, 2020, and for the year then ended. The financial statements have been prepared in conformity with accounting principles generally accepted in the United States of America and, as such, include amounts, some of which are based on management's judgments and estimates.
TOWNEBANKMANAGEMENT’S REPORT ON INTERNAL CONTROL
45

Compliance with Designated Laws and Regulations
Our management is also responsible for compliance with federal and state laws and regulations concerning dividend restrictions and federal laws and regulations concerning loans to insiders designated by the FDIC as safety and soundness laws and regulations. Management assessed our compliance with the designated laws and regulations. Based on this assessment, our management believes that we complied, in all significant respects, with the designated laws and regulations relating to safety and soundness for the year ended December 31, 2020.
Management's assessment of the effectiveness of internal control over financial reporting, including controls over the preparation of regulatory financial statements in accordance with the Federal Financial Institutions Examination Council instructions for Consolidated Reports of Condition and Income, as of December 31, 2020, has been audited by Dixon Hughes Goodman LLP, the independent registered public accounting firm, as stated in their report dated February 26, 2021. A copy of this report, which is combined with the report expressing an opinion on the consolidated financial statements, precedes.
February 26, 2021
/s/ J. Morgan Davis
J. Morgan DavisPresident and Chief Executive Officer
/s/ William B. Littreal
William B. LittrealSenior Executive Vice President and Chief Financial Officer
TOWNEBANKMANAGEMENT’S REPORT ON INTERNAL CONTROL
46

ASSETS 2020 2019Cash and due from banks $ 41,514 $ 97,593 Interest-bearing deposits at FRB-Richmond 1,795,241 322,505 Interest-bearing deposits in financial institutions 27,532 22,518
Total Cash and Cash Equivalents 1,864,287 442,616 Securities available for sale, at fair value (amortized cost of $1,310,250 and $1,421,573, and allowance for credit losses of $348 and $0 at December 31, 2020 and 2019, respectively) 1,368,224 1,441,308 Securities held to maturity, at amortized cost (fair value of $18,469 and $45,171 at December 31, 2020 and 2019, respectively) 16,512 43,688
Less: Allowance for credit losses (97) — Securities held to maturity, net of allowance for credit losses 16,415 43,688
Other equity securities 6,492 6,462 FHLB stock 30,135 30,094
Total Securities 1,421,266 1,521,552 Mortgage loans held for sale 540,798 419,233 Loans, net of unearned income and deferred costs 9,629,068 8,419,288
Less: allowance for credit losses (120,157) (58,234) Net Loans 9,508,911 8,361,054
Premises and equipment, net 260,242 231,806 Goodwill 452,328 446,816 Other intangible assets, net 45,533 54,399 BOLI 246,109 243,062 Other assets 286,970 227,125
TOTAL ASSETS $ 14,626,444 $ 11,947,663 LIABILITIES AND EQUITY
Deposits:Noninterest-bearing demand $ 4,374,566 $ 2,951,225 Interest-bearing:
Demand and money market accounts 4,819,604 3,586,364 Savings 330,091 276,205 Certificates of deposit 2,048,905 2,457,123
Total Deposits 11,573,166 9,270,917 Advances from the FHLB 456,038 471,687 Subordinated debt, net 249,055 248,458 FRB PPP Lending Facility 182,852 — Repurchase agreements and other borrowings 67,786 52,391
Total Borrowings 955,731 772,536 Other liabilities 313,719 250,516
TOTAL LIABILITIES 12,842,616 10,293,969 Preferred stock
Authorized and unissued shares - 2,000,000 — — Common stock, $1.667 par value: 150,000,000 shares authorized
Issued and outstanding shares - 72,667,541 in 2020 and 72,649,682 in 2019 121,132 121,107 Capital surplus 1,046,642 1,041,160 Retained earnings 557,889 467,186 Common stock issued to deferred compensation trust, at cost
873,486 shares in 2020 and 818,578 shares in 2019 (16,969) (15,555) Deferred compensation trust 16,969 15,555 Accumulated other comprehensive income 41,184 11,302
TOTAL SHAREHOLDERS' EQUITY 1,766,847 1,640,755 Noncontrolling interest 16,981 12,939
TOTAL EQUITY 1,783,828 1,653,694 TOTAL LIABILITIES AND EQUITY $ 14,626,444 $ 11,947,663
TOWNEBANKCONSOLIDATED BALANCE SHEETS(dollars in thousands)December 31, 2020 and 2019
See accompanying Notes to Consolidated Financial Statements.47
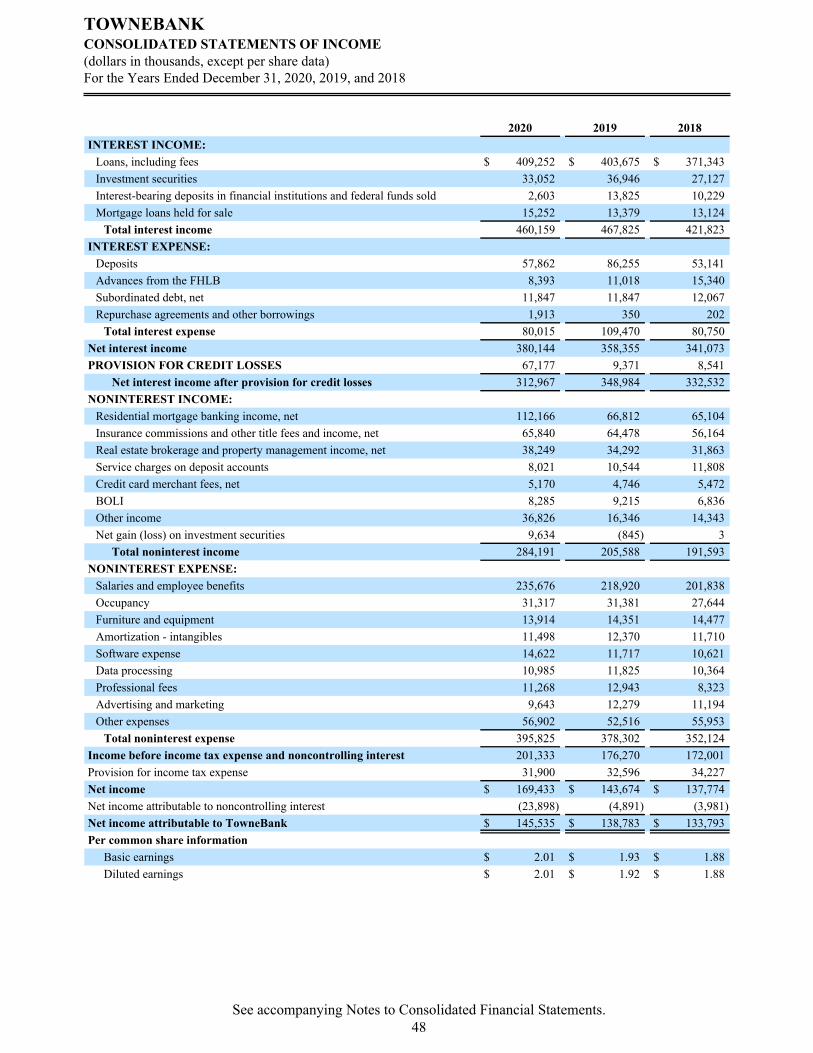
2020 2019 2018INTEREST INCOME:
Loans, including fees $ 409,252 $ 403,675 $ 371,343 Investment securities 33,052 36,946 27,127 Interest-bearing deposits in financial institutions and federal funds sold 2,603 13,825 10,229 Mortgage loans held for sale 15,252 13,379 13,124
Total interest income 460,159 467,825 421,823 INTEREST EXPENSE:
Deposits 57,862 86,255 53,141 Advances from the FHLB 8,393 11,018 15,340 Subordinated debt, net 11,847 11,847 12,067 Repurchase agreements and other borrowings 1,913 350 202
Total interest expense 80,015 109,470 80,750 Net interest income 380,144 358,355 341,073 PROVISION FOR CREDIT LOSSES 67,177 9,371 8,541
Net interest income after provision for credit losses 312,967 348,984 332,532 NONINTEREST INCOME:
Residential mortgage banking income, net 112,166 66,812 65,104 Insurance commissions and other title fees and income, net 65,840 64,478 56,164 Real estate brokerage and property management income, net 38,249 34,292 31,863 Service charges on deposit accounts 8,021 10,544 11,808 Credit card merchant fees, net 5,170 4,746 5,472 BOLI 8,285 9,215 6,836 Other income 36,826 16,346 14,343 Net gain (loss) on investment securities 9,634 (845) 3
Total noninterest income 284,191 205,588 191,593 NONINTEREST EXPENSE:
Salaries and employee benefits 235,676 218,920 201,838 Occupancy 31,317 31,381 27,644 Furniture and equipment 13,914 14,351 14,477 Amortization - intangibles 11,498 12,370 11,710 Software expense 14,622 11,717 10,621 Data processing 10,985 11,825 10,364 Professional fees 11,268 12,943 8,323 Advertising and marketing 9,643 12,279 11,194 Other expenses 56,902 52,516 55,953
Total noninterest expense 395,825 378,302 352,124 Income before income tax expense and noncontrolling interest 201,333 176,270 172,001 Provision for income tax expense 31,900 32,596 34,227 Net income $ 169,433 $ 143,674 $ 137,774 Net income attributable to noncontrolling interest (23,898) (4,891) (3,981) Net income attributable to TowneBank $ 145,535 $ 138,783 $ 133,793 Per common share information
Basic earnings $ 2.01 $ 1.93 $ 1.88 Diluted earnings $ 2.01 $ 1.92 $ 1.88
TOWNEBANKCONSOLIDATED STATEMENTS OF INCOME(dollars in thousands, except per share data)For the Years Ended December 31, 2020, 2019, and 2018
See accompanying Notes to Consolidated Financial Statements.48

2020 2019 2018Net income $ 169,433 $ 143,674 $ 137,774 Other comprehensive income (loss)Unrealized gains (losses) on securities
Unrealized holding gains (losses) arising during the period 48,225 30,797 (5,511) Deferred tax (expense) benefit (10,603) (6,707) 1,224
Realized (gains) losses reclassified into earnings (9,634) 845 (3) Deferred tax benefit (expense) 2,023 (177) 1
Net unrealized gains (losses) 30,011 24,758 (4,289) Pension and postretirement benefit plans
Prior service costs (558) (2,704) (224) Deferred tax benefit (expense) 123 601 49
Actuarial gain (loss) (741) (2,754) 2,327 Deferred tax benefit (expense) 161 612 (506)
Amortization of prior service costs 675 613 305 Deferred tax benefit (expense) (149) (133) (66)
Amortization of net actuarial (gain) loss 462 (645) 85 Deferred tax benefit (expense) (102) 144 (19)
Change in retirement plans, net of tax (129) (4,266) 1,951 Other comprehensive income (loss), net of tax 29,882 20,492 (2,338) Comprehensive income $ 199,315 $ 164,166 $ 135,436 Comprehensive income attributable to noncontrolling interest (23,898) (4,891) (3,981) Comprehensive income attributable to TowneBank $ 175,417 $ 159,275 $ 131,455
TOWNEBANKCONSOLIDATED STATEMENTS OF COMPREHENSIVE INCOME(in thousands)For the Years Ended December 31, 2020, 2019, and 2018
See accompanying Notes to Consolidated Financial Statements.49

Common Shares
Common Stock
Capital Surplus
Retained Earnings
Deferred Compensation
Trust
Common Stock Issued to
Deferred Compensation
Trust
Accumulated Other
Comprehensive (Loss)
Non- controlling Interests Total
Balance, December 31, 2017 62,629,001 $ 104,403 $ 749,800 $ 282,729 $ 12,524 $ (12,524) $ (5,692) $ 11,265 $ 1,142,505 Impact of adoption of new accounting standards (1) — — — 7,579 — — (1,160) — 6,419
Net income — — — 133,793 — — — 3,981 137,774
Other comprehensive loss, net of taxes — — — — — — (2,338) — (2,338)
Cash dividends declared on common stock ($0.62 per share) — — — (44,862) — — — — (44,862)
Directors' deferred compensation — — — — 1,431 (1,431) — — —
Investment of noncontrolling interest in consolidated joint ventures — — — — — — — 2,945 2,945
Distribution of interests in joint ventures, net — — — — — — — (5,297) (5,297)
Conversion of convertible debt into common stock 553 1 8 — — — — — 9
Issuance of common stock - acquisitions 9,457,197 15,764 279,293 — — — — — 295,057
Issuance of common stock - stock compensation plans 293,349 490 3,112 — — — — — 3,602
Issuance of common stock - net contingent consideration earned on acquisitions 85,823 143 2,463 — — — — — 2,606
Balance, December 31, 2018 72,465,923 $ 120,801 $ 1,034,676 $ 379,239 $ 13,955 $ (13,955) $ (9,190) $ 12,894 $ 1,538,420
Net income — — — 138,783 — — — 4,891 143,674
Other comprehensive loss, net of taxes — — — — — — 20,492 — 20,492
Cash dividends declared on common stock ($0.70 per share) — — — (50,836) — — — — (50,836)
Directors' deferred compensation — — — — 1,600 (1,600) — — —
Investment of noncontrolling interest in consolidated joint ventures — — — — — — — 100 100
Distribution of interests in joint ventures, net — — — — — — — (4,946) (4,946)
Issuance of common stock - stock compensation plans 130,943 219 5,107 — — — — — 5,326
Issuance of common stock - net contingent consideration earned on acquisitions 52,816 87 1,377 — — — — — 1,464
Balance, December 31, 2019 72,649,682 $ 121,107 $ 1,041,160 $ 467,186 $ 15,555 $ (15,555) $ 11,302 $ 12,939 $ 1,653,694
Impact of adoption of new accounting standards (2) — — — (2,528) — — — — (2,528)
Net income — — — 145,535 — — — 23,898 169,433
Other comprehensive income, net of taxes — — — — — — 29,882 — 29,882
Cash dividends declared on common stock ($0.72 per share) — — — (52,304) — — — — (52,304)
Directors' deferred compensation — — — — 1,414 (1,414) — — —
Distribution of interests in joint ventures, net — — — — — — — (19,856) (19,856)
Conversion of convertible debt into common stock 69 — 1 — — — — — 1
Issuance of common stock - stock compensation plans (25,908) (49) 4,644 — — — — — 4,595
Issuance of common stock - net contingent consideration earned on acquisitions 43,698 74 837 — — — — — 911
Balance, December 31, 2020 72,667,541 $ 121,132 $ 1,046,642 $ 557,889 $ 16,969 $ (16,969) $ 41,184 $ 16,981 $ 1,783,828
(1) Represents the impact of adopting ASU No. 2018-02 and ASU No. 2014-09. (2) Represents the impact of adopting ASU No. 2016-13.
TOWNEBANKCONSOLIDATED STATEMENTS OF EQUITY(dollars in thousands, except share data)For the Years Ended December 31, 2020, 2019, and 2018
See accompanying Notes to Consolidated Financial Statements.50

OPERATING ACTIVITIES: 2020 2019 2018Net income $ 169,433 $ 143,674 $ 137,774 Adjustments to reconcile net income to net cash from operating activities:
Net amortization of securities 4,871 2,774 2,874 Investment securities (gains) losses (9,634) 845 (3) Depreciation, amortization, and other intangible amortization 29,061 29,371 28,724 Amortization of debt issuance costs 596 597 665 Provision for credit losses 67,177 9,371 8,541 Bank-owned life insurance income (8,285) (9,215) (6,836) Deferred income tax expense (benefit) (16,869) (4,783) 1,300 Share-based compensation expense 5,481 5,345 2,905 (Gain) loss on sale and write-down of foreclosed assets 1,059 (247) (956) Gain on sale of noncontrolling interest (17,626) — — Originations of mortgage loans held for sale (5,888,565) (3,175,797) (2,984,899) Proceeds from sales of mortgage loans held for sale 5,965,864 3,082,906 3,179,752 Gain on sales of mortgage loans held for sale (198,864) (105,356) (102,583) Changes in:
Interest receivable 1,305 (46) (10,579) Other assets (18,482) (4,210) 19,103 Interest payable (3,840) 1,065 3,224 Other liabilities 45,206 34,019 38,591
Net cash provided by operating activities 127,888 10,313 317,597 INVESTING ACTIVITIES:
Purchase of available-for-sale securities (421,225) (778,538) (960,334) Purchase of held-to-maturity securities — (1,896) — Purchase of other securities (75) (1,669) (964) Sale of available-for-sale securities 347,757 186,043 48,549 Net change in FHLB stock (41) 13,135 6,721 Proceeds from maturities, calls, and prepayments of available-for-sale securities 189,268 274,641 851,369 Proceeds from maturities, calls, and prepayments of held-to-maturity securities 27,467 8,718 10,555 Proceeds from maturities, calls, and prepayments of other securities 44 — 1,176 Net increase in loans (1,213,348) (407,416) (643,266) Net change in investment in LIHTC (33,002) (26,348) (10,247) Purchases of premises and equipment (45,788) (36,717) (20,847) Proceeds from sales of premises and equipment 569 649 634 Proceeds from sales of foreclosed assets 14,512 8,041 7,994 Proceeds from sale of noncontrolling interest 16,942 — — Proceeds from bank-owned life insurance 5,483 1,385 582 Investment from noncontrolling interest in consolidated joint ventures — 100 123 Acquisition of business, net of cash acquired (7,554) (19,747) 61,100
Net cash used for investing activities (1,118,991) (779,619) (646,855) FINANCING ACTIVITIES:
Net increase in deposit accounts 2,302,249 900,495 673,566 Net change in borrowings 182,598 (322,393) (113,387) Repayments of subordinated debt — — (18,558) (Payments) proceeds from share-based compensation activity (884) (19) 697 Proceeds from issuance of common stock 911 1,464 2,606 Distribution of interest in joint ventures (19,856) (4,946) (5,297) Cash dividends paid (52,244) (49,375) (44,862)
Net cash from financing activities 2,412,774 525,226 494,765 Change in cash and cash equivalents 1,421,671 (244,080) 165,507 Cash and cash equivalents at beginning of year 442,616 686,696 521,189
Cash and cash equivalents at end of year $ 1,864,287 $ 442,616 $ 686,696 Supplemental cash flow information:
Cash paid for interest $ 83,854 $ 108,405 $ 58,578 Cash paid for income taxes $ 35,154 $ 28,065 $ 24,612
Noncash financing and investing activities:Transfer from loans to foreclosed property $ 4,762 $ 3,130 $ 2,917 Sales of foreclosed assets financed by the Company $ 5,700 $ 227 $ 1,340 Net unrealized gain (loss) on available-for-sale securities $ 30,011 $ 24,758 $ (4,289) Dividends declared but not paid $ 13,461 $ 13,005 $ 11,699 Common stock issued in connection with business acquisitions $ — $ — $ 295,057 Right of use asset recognized upon adoption of ASC 842 $ — $ 43,260 $ —
TOWNEBANKCONSOLIDATED STATEMENTS OF CASH FLOWS(in thousands)For the Years Ended December 31, 2020, 2019, and 2018
See accompanying Notes to Consolidated Financial Statements.51

NOTE 1: SUMMARY OF SIGNIFICANT ACCOUNTING POLICIES
Business: TowneBank was organized and incorporated under the laws of the Commonwealth of Virginia on September 1, 1998, and commenced operations on April 8, 1999. The Company, through its banking and non-banking subsidiaries, provides a diverse range of financial services and products throughout Richmond, Virginia, the Greater Hampton Roads region in southeastern Virginia, northeastern North Carolina, and the Raleigh, Charlotte, Greensboro, and Greenville, North Carolina metropolitan areas.
Basis of presentation: The Consolidated Financial Statements include the accounts of the Company and all other entities in which the Company has a controlling financial interest. The accompanying Consolidated Financial Statements are prepared in conformity with GAAP and prevailing practices of the banking industry. All significant intercompany balances and transactions have been eliminated in consolidation. The following is a summary of the significant accounting and reporting policies used in preparing the Consolidated Financial Statements.
Reclassifications and corrections: To maintain consistency and comparability, certain amounts from prior periods have been reclassified to conform to current period presentation with no effect on net income or shareholders' equity as previously reported.
Use of estimates: The preparation of consolidated financial statements in conformity with GAAP requires management to make estimates and assumptions that affect the reported amounts of assets and liabilities and disclosure of contingent assets and liabilities at the date of the financial statements, and the reported amounts of revenues and expenses during the reporting periods. Actual results could differ from those estimates and assumptions. Material estimates that are particularly susceptible to significant change in the near term relate to the determination of the allowance for credit losses, valuation of OREO, deferred income taxes, fair value estimates, and valuation of goodwill, intangible assets.
Cash and cash equivalents: For purposes of reporting cash flows, the Company considers cash and due from banks, interest-bearing deposits in financial institutions, and federal funds sold as cash and cash equivalents. Generally, federal funds and securities purchased under agreements to resell are purchased and sold for one-day periods.
Current expected credit losses: The Company adopted ASU No. 2016-13, Financial Instruments - Credit Losses (Topic 326), Measurement of Credit Losses on Financial Instruments ("ASC 326") as of January 1, 2020, which unless excluded from the scope, affect financial assets with the contractual right to receive cash, including loans, HTM debt securities, trade receivables, net investments in leases, and off-balance-sheet credit exposures. ASC 326 requires financial assets measured at amortized cost basis to be presented at the net amount expected to be collected. The allowance for credit losses is a valuation account that is deducted from the amortized cost basis of the financial asset to present the net carrying value and the amount expected to be collected on the financial asset. ASC 326 also made changes to the accounting for AFS debt securities, requiring credit losses be accounted for as an allowance rather than as a direct write-down of the AFS debt securities which management does not intend to sell or does not believe that it is more likely than not they will be required to sell. For financial assets measured at amortized cost, the Company adopted the standard utilizing the modified-retrospective method, which required a cumulative-effect adjustment to retained earnings. Acquired loans that were previously classified as purchased credit-impaired loans and accounted for under ASC 310-30 were transitioned over as purchased credit deteriorated under ASU 2016-13. Consistent with the requirements of ASU 2016-13, management did not reassess whether legacy purchased credit-impaired assets met the criteria of purchased credit deteriorated assets as of the date of adoption.
TOWNEBANK NOTES TO CONSOLIDATED FINANCIAL STATEMENTS
52

Investment securities: Investment securities are classified in three categories and accounted for as follows:
a) Debt securities that the Company has the positive intent and ability to hold to maturity are classified as HTM securities and reported at amortized cost.
b) Debt and equity securities that are bought and held principally for the purpose of selling them in the near term are classified as trading securities and reported at fair value, with unrealized gains and losses included in earnings.
c) Debt securities not classified as either HTM or trading securities are classified as AFS securities and reported at fair value, with unrealized holding gains and losses, not related to impairment, excluded from earnings and reported as other comprehensive income, a separate component of shareholders' equity, until realized.
Gains and losses on sales of securities are determined on a trade date basis using specific identification of the adjusted cost of each security and included in noninterest income. Amortization of premiums and accretion of discounts are computed by the effective yield method and included in interest income.
The adoption of ASC 326 impacted how AFS debt securities and HTM debt securities would be evaluated for allowances for credit losses in the Consolidated Balance Sheets. Corresponding provisions for credit losses have been added to the existing provisions, and the line item provision for loan losses is replaced with a broader provision for credit losses.
When the fair value of an individual AFS debt security has declined below its amortized cost basis, the Company will assess whether (i) we intend to sell or (ii) it is more likely than not that we will be required to sell the security before recovery of its amortized cost basis. If either is affirmative, any previously recognized allowances are charged off and the security's amortized cost is written down to fair value through income. If neither is affirmative, the Company will assess whether the decline is from a credit loss or other factor. If the decline in fair value is attributable to a credit loss, the Company records that loss in net income via a provision for credit loss expense with offset to an allowance for credit loss. This allowance is reduced for improvements in expected cash flows, and reversal of previously recognized credit losses is permitted through net income in the period in which they occur. This change results in recognition and presentation of credit losses on the income statement.
For HTM debt securities, an allowance is recognized when lifetime credit losses are expected, for an amount that reflects the expected contractual credit losses, even when the risk of credit losses is remote. As such, credit losses for HTM debt securities will generally be recognized earlier than credit losses for AFS debt securities, which are not recognized until there is evidential support of a potential loss.
Loans: Loans that management has the intent and ability to hold for the foreseeable future, or until maturity or payoff, generally are stated at the amount of outstanding principal less unamortized fees and costs on originated loans, unearned income, and participation interests sold to other lending institutions. Interest on loans is accrued and credited to income based upon the principal amount outstanding. Fees collected and costs incurred in connection with loans originated are deferred and recognized as interest income over the term of the loan as an adjustment of yield.
The CARES Act, signed into law on March 27, 2020, included provisions that provide temporary relief from TDR accounting for certain types of modifications. Under these provisions, modifications deemed to be COVID-19-related would not be considered a TDR if the loan was not more than 30 days past due as of December 31, 2019, and the deferral was executed between March 1, 2020, and the earlier of 60 days after the date of termination of the
TOWNEBANK NOTES TO CONSOLIDATED FINANCIAL STATEMENTS
53

COVID-19 national emergency or December 31, 2020. The termination of these provisions was extended, to the earlier of 60 days after the termination of the COVID-19 national emergency or January 1, 2022, with the Appropriations Act. The banking regulators issued similar guidance, which also clarified that a COVID-19-related modification should not be considered a TDR if the borrower was current on payments at the time the underlying loan modification program was implemented and if the modification was considered to be short-term. Modifications are first evaluated for eligibility under the CARES Act, then the interagency guidance if they do not qualify for CARES Act relief. Modifications that are not eligible for either program continue to follow the Company's established TDR policy. Additionally, loans with deferrals granted due to COVID-19 are not generally reported as past due.
Allowance for credit losses on loans: ASC 326 replaced the previous "incurred loss" model for measuring credit losses with an "expected loss" model that requires losses to be estimated for the life of the loan and recorded at origination or acquisition. All disclosures as of December 31, 2020, are presented in accordance with ASC 326. The Company did not recast comparative financial periods and has presented those disclosures under previously applicable GAAP.
The allowance for loan losses is established through a provision for loan losses charged against earnings. It consists of reserves for expected losses that have been identified related to specific borrowing relationships as well as expected losses inherent in the loan portfolio that are not specifically identified. The level of the allowance for loan losses is based on management's estimates of expected loss inherent in the portfolio using relevant available information from internal and external sources, related to past events, current conditions, and reasonable and supportable forecasts. To facilitate the development of these estimates, management utilizes a model that deploys multiple economic scenarios with probability weightings, reasonable and supportable forecasting with reversion to long term historical loss after two years, and in-depth portfolio analysis. For economic forecasts, the Company uses scenarios from an independent third party. Expected loss estimates consider various factors, including the impacts of decreased economic activity and higher unemployment rates, customer-specific credit information, and the potential mitigating benefits of government stimulus and industry-wide loan modification efforts.
It is our policy to assign internal risk grades to all loans as a component of the approval process. Based on the size of the loan, senior credit officers, regional credit administrators, and the Chief Credit Officer review the classification to ensure accuracy and consistency of classifications, which are then validated by the internal loan review process. Loan classifications are internally reviewed to determine if any changes in the circumstances of the loan require a different risk grade. To determine the most appropriate risk grade classification for each loan, the credit officers examine the borrower's liquidity level, asset quality, the amount of the borrower's other indebtedness, cash flow, earnings, sources of financing, and existing lending relationships. The allowances established for expected losses on specific loans are based on a regular analysis and evaluation of classified loans.
Allowance for credit losses - off-balance-sheet credit exposures: The allowance for credit losses on off-balance-sheet credit exposures is a liability account, calculated in accordance with ASC 326, representing expected credit losses over the contractual period for which we are exposed to credit risk resulting from a contractual obligation to extend credit. No allowance is recognized if we have the unconditional right to cancel the obligation. The allowance is reported as a component of other liabilities in our Consolidated Balance Sheets. Adjustments to the allowance are reported in our Consolidated Statements of Income as a component of the provision for credit loss expense.
Loans acquired: Loans acquired through the completion of a transfer, including loans acquired in a business combination, which have evidence of more-than-insignificant deterioration of credit quality since origination, are initially recorded at the purchase price plus the allowance for credit losses expected at the time of acquisition. The Day 1 allowance for credit losses established for loans identified with more-than-insignificant deterioration in
TOWNEBANK NOTES TO CONSOLIDATED FINANCIAL STATEMENTS
54

credit quality since origination has no income statement impact and is allocated to each individual loan regardless of whether the initial allowance was determined on an individual or collective basis at the time of acquisition. PCD loans are pooled based on similar risk characteristics unless individual assessment is required in the same manner as the Company's originated loans. Subsequent to the initial recording, PCD loans are evaluated each reporting period for credit losses in accordance with the Allowance for Credit Losses Policy, and the initial allowance is adjusted for any change in the estimate of expected credit losses and recognized immediately into net income through the provision for credit losses. The noncredit discount or premium determined at the acquisition date is allocated to each individual loan and accreted or amortized into income using the effective interest rate method or the cost recovery method when a reasonable expectation of the amount expected to be collected is unknown.
Purchased loans not deemed PCD at acquisition are recorded at fair value. Non-PCD loans are aggregated and accounted for based on common risk characteristics in the same manner as the Company's originated loans for purposes of determining an allowance for credit loss. Any established allowance for credit loss is recognized in net income through the provision for credit losses at the initial and subsequent reporting dates. The noncredit discount or premium determined at the acquisition date is allocated to each individual loan and accreted or amortized into income using the effective interest rate method or the cost recovery method when a reasonable expectation of the amount expected to be collected is unknown.
Mortgage loans held for sale: Loans originated and intended for sale in the secondary market using "best efforts" delivery are carried at the lower of cost or estimated fair value. Net unrealized losses, if any, are recognized through a valuation allowance by charges to income. Loans originated and intended for sale in the secondary market using "mandatory" delivery are carried at estimated fair value.
Premises and equipment: Premises and equipment are stated at cost, less accumulated depreciation. Leasehold improvements are amortized over the lives of the respective leases or the estimated useful life of the leasehold improvement, whichever is less.
For financial reporting purposes, depreciation is computed by the straight-line method over the estimated useful lives of the assets. For income tax purposes, the modified accelerated cost recovery system is used. Costs of maintenance and repairs are charged to expense as incurred. Costs of replacing structural parts of major units are considered individually and are expensed or capitalized as the facts dictate.
Fixed assets may be retired and disposed of by sale, trade, abandonment, or through a casualty loss such as a fire or storm. At retirement, the cost of the asset and its related accumulated depreciation are removed from the accounts. The type of disposal will determine the specific treatment of the asset.
Leases: Operating lease liabilities, which are included in other liabilities, reflect the Company's obligation to make future lease payments. Lease terms typically comprise contractual terms, but may include extension options reasonably certain of being exercised at lease inception. Payments are discounted using the rate the Company would pay to borrow amounts equal to the lease payments over the lease term (the Company's incremental borrowing rate). The Company does not separate lease and non-lease components for contracts in which it is the lessee. Operating lease expense is recognized on a straight-line basis over the lease term, while variable lease payments are recognized as incurred. Common area maintenance and other executory costs are the main components of variable lease payments. Operating and variable lease expenses are recorded in net occupancy expense on the Consolidated Statements of Income.
Goodwill and other intangibles: Goodwill is not subject to amortization, but is subject to an annual assessment for impairment by applying a fair-value-based test as required by FASB ASC 350, Goodwill and Other Intangible
TOWNEBANK NOTES TO CONSOLIDATED FINANCIAL STATEMENTS
55
Assets. Additionally, under ASC 350, acquired intangible assets are separately recognized if the benefit of the assets can be sold, transferred, licensed, rented, or exchanged, and amortized over their useful life.
Goodwill is tested for impairment at the reporting unit level on an annual basis as of August 31, or more often if events or circumstances indicate there may be impairment. In accordance with ASC 350, the Company assesses qualitative factors to determine whether is is more-likely-than-not the fair value of the reporting unit was less than its carrying amount. If the Company concludes the carrying amount exceeds the implied fair value, based on the qualitative assessment, a quantitative one-step impairment test will then be applied. An impairment loss will be recognized for any excess of the carrying value over fair value of goodwill. Subsequent increases in goodwill are not recognized in the Consolidated Financial Statements.
In 2020, the onset of the COVID-19 pandemic prompted the Company to assess qualitative factors for each reporting unit, in the first and second quarters, to determine whether it was more-likely-than-not the fair value of our reporting units were less than their carrying amount. In the second quarter we identified a triggering event related to the economic downturn and performed an assessment of goodwill, which resulted in a conclusion that goodwill was not impaired. Annual testing occurred in the third quarter of 2020, and the Company monitored events and circumstances during the fourth quarter of 2020, but no triggering event was identified.
Significant judgment is applied when goodwill is assessed for impairment. This judgment includes developing cash flow projections, selecting appropriate discount rates, identifying relevant market comparables, and incorporating general economic and market conditions. Selection and weighting of the various fair value techniques may result in a higher or lower fair value. Judgment is applied in determining the weightings most representative of fair value.
Intangible assets are amortized or tested for impairment based on whether they have finite or indefinite lives. Intangibles that have finite lives are amortized on a straight-line basis over their useful life and tested for impairment whenever events or circumstances indicate the carrying amount of the assets may not be recoverable. Intangibles with indefinite lives are tested annually for impairment. Note 9 provides additional information related to goodwill and other intangible assets.
Other real estate owned: OREO, which is included in other assets on the Consolidated Balance Sheet, consists primarily of commercial and residential real estate that has been obtained in partial or full satisfaction of loan obligations. OREO is carried at the lower of carrying value or fair value of the property, less estimated selling costs, with any difference between the fair value of the property, less estimated selling costs, and the carrying value of the loan recorded through a charge to the allowance for credit losses. Subsequent write-downs required for declines in value are recorded through a valuation allowance, or taken directly to the asset, charged to other noninterest expense.
Transfers of financial assets: Transfers of financial assets are accounted for as sales when control over the assets has been surrendered. Control over transferred assets is deemed to be surrendered when (i) the asset has been isolated from the Company, (ii) the transferee obtains the right (free of conditions that constrain it from taking advantage of that right) to pledge or exchange the transferred asset, and (iii) the Company does not maintain effective control over the transferred asset.
Credit-related financial instruments: In the ordinary course of business, the Company has entered into commitments to extend credit, including commitments under credit card arrangements, commercial letters of credit, and standby letters of credit. Such financial instruments are recorded when they are funded. They are considered in calculating the provision for credit losses and any reserve is recognized in other liabilities.
TOWNEBANK NOTES TO CONSOLIDATED FINANCIAL STATEMENTS
56

Interest rate lock commitments and TBA MBSs: The Company enters into rate lock commitments with its mortgage customers whereby the interest rate on the mortgage loan is determined prior to funding. The commitments are generally for periods of 60 days and are at market rates. The Company is also a party to sales of TBA MBSs. The rate lock commitment and MBS position are undesignated derivatives and marked to fair value through earnings. Both the rate lock commitment and the corresponding MBSs are considered derivatives, but are not accounted for using hedge accounting. As such, changes in the estimated fair value of the derivatives are recorded in current earnings and included in net residential mortgage banking income in the Consolidated Statements of Income.
We sell mortgage loans under both "mandatory" and "best efforts" delivery programs. Under "best efforts", in order to mitigate risk from interest rate fluctuations, the Company enters into forward loan sale commitments on a loan-by-loan basis while the loan is in the pipeline. Under the "mandatory" delivery system, loans with interest rate locks are paired with the sale of TBA MBSs bearing similar attributes. We commit to deliver loans to an investor at an agreed-upon price after the close of such loans.
Revenue recognition: Revenue earned on interest-earning assets is recognized based on the effective yield of the financial instrument. Revenue recognized from contracts with customers, which is accounted for under ASC 606, is primarily included in the Company's noninterest income. Interest income and certain other types of noninterest income are accounted for under other applicable accounting standards.
Service charges on deposit accounts are recognized as charged. Credit-related fees, including letter of credit fees, are recognized in noninterest income when earned. See Note 17 for additional information about revenue from contracts with customers.
Income recognition on nonaccrual loans: Commercial loans are generally classified as nonaccrual if they are past due as to maturity or payment of principal or interest for a period of more than 90 days, unless such loans are well-secured and in the process of collection. Residential mortgage loans and other consumer loans are classified as nonaccrual if they are past due as to maturity or payment of principal or interest for a period of more than 120 days, unless the debt is both well-secured and in the process of collection. If a loan or a portion of a loan is classified as doubtful or is partially charged off, the loan is generally classified as nonaccrual. Loans that are on a current payment status or past due less than 90 days may also be classified as nonaccrual, if repayment in full of principal and/or interest is unlikely.
While a loan is classified as nonaccrual and the probability of collecting the recorded loan balance is doubtful, collections of interest and principal are generally applied as a reduction to principal outstanding. When the probability of collecting the recorded loan balance is expected, interest income may be recognized on a cash basis. In the case where a nonaccrual loan had been partially charged off, recognition of interest on a cash basis is limited to that which would have been recognized on the recorded loan balance at the contractual interest rate. Cash interest receipts in excess of that amount are recorded as recoveries to the allowance for loan losses until prior charge-offs have been fully recovered.
Loans may be returned to accrual status when all principal and interest amounts contractually due (including arrearages) are reasonably assured of repayment within an acceptable period of time, and there is a sustained period of repayment performance by the borrower in accordance with the contractual terms of interest and principal.
Advertising costs: Advertising costs are expensed as incurred.
Segment information: Operating segments as defined by ASC 280, Segment Reporting, are components of an enterprise for which separate financial information is available that is evaluated regularly by the chief operating
TOWNEBANK NOTES TO CONSOLIDATED FINANCIAL STATEMENTS
57

decision-maker in deciding how to allocate resources and in assessing performance. The accounting policies of operating segments are the same as those described elsewhere in this footnote. Revenue for all segments is derived from external sources. See Note 28 for further discussion of the Company's operating segments.
Mergers and acquisitions: Mergers and acquisitions are accounted for using the acquisition method, as required by ASC 805, Business Combinations. Under this method, the cost of the acquired entity will be allocated to the assets acquired and liabilities assumed based on their fair values at the date of acquisition. The excess of the cost over the fair value of the acquired net assets is recognized as goodwill, and any merger-related costs are expensed as incurred. See Note 2 for further discussion on the Company's mergers and acquisitions.
Income taxes: Income taxes are accounted for under the asset and liability method. Under this method, deferred tax assets and liabilities are determined based on differences between financial reporting and tax bases of assets and liabilities that result in future taxable or deductible amounts. The effect on deferred taxes of a change in tax rates is recognized in the year of enactment and is measured using the enacted tax rates and laws that will be in effect when the differences are expected to reverse. Valuation allowances are established when necessary to reduce deferred tax assets to the amount expected to be realized in the near term. Note 23 provides additional information on the Company's income taxes.
Comprehensive income: Accounting principles generally require that recognized revenue, expenses, gains, and losses be included in net income or loss. Although certain changes in assets and liabilities, such as unrealized gains and losses on available-for-sale securities, are reported as a separate component of the equity section of the balance sheet, such items, along with the operating net income or loss, are components of comprehensive income or loss. Other comprehensive income or loss includes unrealized gains and losses on available-for-sale securities and actuarial gains and losses on our SERP and other postretirement benefit plans.
Share-based compensation: The Company has a share-based employee compensation plan, which is described in more detail in Note 15. The Company accounts for the plan using the fair value method, which requires that compensation cost relating to stock-based payment transactions be recognized in the financial statements over the vesting period. The compensation cost is measured based on the fair value of the instruments issued.
Earnings per share: Basic earnings per share are computed by dividing earnings available to common shareholders by the weighted-average number of common shares outstanding for the year, less the average number of nonvested restricted stock awards. Diluted earnings per share reflect potential dilution from the issuance of additional shares of common stock caused by the exercise of stock options and restricted stock awards. See Note 29 for further discussion on the Company's earnings per share.
TOWNEBANK NOTES TO CONSOLIDATED FINANCIAL STATEMENTS
58

Recent accounting pronouncements:Accounting standards adopted in current yearStandard Summary of guidance Effects on financial statementsTopic 326 - Financial Instruments - Credit Losses: Measurement of Credit Losses on Financial InstrumentsASU 2016 - 13Issued June 2016
Changes the accounting for credit losses to one based on expected losses from one based on incurred losses. In addition, the ASU modifies the impairment model for debt securities.
Eliminates the probable recognition threshold for credit losses on financial assets measured at amortized cost.
Requires those financial assets to be presented at the net amount expected to be collected (i.e., net of expected credit losses).
Measurement of expected credit losses should be based on relevant information, including historical experience, current conditions, and reasonable and supportable forecasts that affect the collectability of the reported amount.
As discussed above, the Company adopted this standard January 1, 2020, applying the modified-retrospective method, which required a cumulative-effect adjustment to retained earnings. This cumulative-effect adjustment resulted in a decrease in retained earnings of $2.53 million, net of tax.
On January 1, 2020, the Company recorded an addition of $1.65 million to our allowance for credit losses on loans related to PCD loans, a $3.51 million liability for our allowance for credit losses on off-balance-sheet credit exposures, which was a partial reclassification from our allowance for credit losses on loans, and resulted in a net increase in our allowance for credit losses on loans of $0.94 million. We also established an allowance for credit losses on HTM debt securities of $0.15 million, and an allowance for credit losses on AFS debt securities of $0.08 million.
Topic 350 - Intangibles - Goodwill and Other: Simplifying the Test for Goodwill ImpairmentASU 2017 - 04Issued January 2017
Simplifies goodwill impairment testing by eliminating the second step of the analysis under which the implied fair value of goodwill is determined as if the reporting unit were being acquired in a business combination.
Requires the entity to instead compare the fair value of a reporting unit with its carrying amount and recognize an impairment charge for any amount by which the carrying amount exceeds the reporting unit's fair value, to the extent that the loss recognized does not exceed the amount of goodwill allocated to that reporting unit.
The Company adopted this standard, effective January 1, 2020.
The adoption of the accounting standard did not have a material impact on the Company's Consolidated Financial Statements.
TOWNEBANK NOTES TO CONSOLIDATED FINANCIAL STATEMENTS
59

Accounting standards not yet adoptedStandard Summary of guidance Effects on financial statementsTopic 470 - Debt and Topic 815 - Derivatives and HedgingSubtopics 470-20 - Debt with Conversion and Other Options and Subtopic 815-40 - Contracts in Entity's Own EquityASU 2020 - 06Issued August 2020
Simplifies an issuer's accounting for convertible debt instruments.
Simplifies the settlement assessment that entities are required to perform to determine whether a contract qualifies for equity classification.
Requires new disclosures about events that occur during the reporting period.
Requires entities to use the if-converted method in the majority of diluted EPS calculations.
Effective for interim and annual periods beginning after December 15, 2021.
Early adoption is permitted.
The Company is evaluating the impact the pronouncement will have on its Consolidated Financial Statements, but does not expect the adoption of this guidance to have a material impact.
Topic 715 - Compensation - Retirement Benefits Subtopic 715 - 20 - Defined Benefit Plans - General: Disclosure Framework - Changes in the Disclosure Requirements for Defined Benefit PlansASU 2018 - 14Issued August 2018
Removes, adds, and clarifies certain required financial statement disclosures which apply to all employers that sponsor defined benefit pension or other postretirement plans.
Effective for fiscal years ending after December 15, 2020.
Early adoption is permitted.
The Company is currently evaluating the impact the pronouncement will have on its Consolidated Financial Statements, but does not expect the adoption of this guidance to have a material impact.
Topic 740 - Income Taxes: Simplifying the Accounting for Income TaxesASU 2019 - 12Issued December 2019
Simplifies the accounting for income taxes by removing certain exceptions to the general principles in Topic 740.
Improves the consistent application and simplification of GAAP for other areas of Topic 740 by clarifying and amending existing guidance.
Effective for interim and annual periods beginning after December 15, 2020.
The Company is currently evaluating the impact the pronouncement will have on its Consolidated Financial Statements, but does not expect the adoption of this guidance to have a material impact.
TOWNEBANK NOTES TO CONSOLIDATED FINANCIAL STATEMENTS
60

Accounting standards not yet adoptedStandard Summary of guidance Effects on financial statementsTopic 848 - Reference Rate Reform - Facilitation of the Effects of Reference Rate Reform on Financial ReportingASU 2020 - 04Issued March 2020
Provides optional guidance for a limited period of time to ease the potential burden in accounting for (or recognizing the effects of) reference rate reform on financial reporting.
In response to concerns about structural risks of interbank offered rates, and, particularly, the risk of cessation of the LIBOR, this ASU provides optional expedients and exceptions for applying GAAP to contracts, hedging relationships, and other transactions affected by reference rate reform, if certain criteria are met.
Effective for March 12, 2020, through December 31, 2022.
An entity may elect to apply the amendments for contract modifications as of any date from the beginning of an interim period that includes, or is subsequent to, March 12, 2020, or prospectively from a date within the interim period that includes, or is subsequent to, March 12, 2020, up to the date that the financial statements are available to be issued. Once elected, the amendments in this Update must be applied prospectively for all eligible contract modifications.
The Company is currently evaluating the impact the pronouncement will have on its Consolidated Financial Statements.
NOTE 2: MERGERS AND ACQUISITIONS
George Johnson Insurance Agency, Inc.: Effective December 31, 2020, the Company acquired G.C. Johnson, an independent insurance agency, which was merged into the operations of Towne Insurance Agency, LLC, a wholly owned subsidiary of TowneBank. The acquisition was accounted for as a business combination under the acquisition method of accounting in accordance with ASC 805, Business Combinations, and, as such, the assets acquired and liabilities assumed in the transaction were recorded at their respective fair values as of the acquisition date. Such fair values were preliminary estimates and are subject to adjustment for up to one year after the merger date, or when additional information relative to the closing date fair values becomes available and such information is considered final, whichever is earlier. Primary areas of the preliminary allocation of the fair value of consideration transferred that are not yet finalized relate to the fair values of certain intangible assets acquired and the residual goodwill. The results of operations of the acquired business were included in the Company's Consolidated Statements of Income commencing December 31, 2020.
Angel Insurance and Financial Services, Inc.: Effective September 1, 2019, the Company acquired Angel, an independent insurance agency, which was merged into the operations of Towne Insurance Agency, LLC, a wholly owned subsidiary of TowneBank. The acquisition was accounted for as a business combination under the acquisition method of accounting in accordance with ASC 805, Business Combinations, and, as such, the assets acquired and liabilities assumed in the transaction were recorded at their respective fair values as of the acquisition date. The results of operations of the acquired business were included in the Company's Consolidated Statements of Income commencing September 1, 2019.
Straus, Itzkowitz & LeCompte Insurance Agency, Inc.: Effective January 1, 2019, the Company acquired SIL, an independent insurance agency, which was merged into the operations of Towne Insurance Agency, LLC, a wholly owned subsidiary of TowneBank. The acquisition was accounted for as a business combination under the acquisition method of accounting in accordance with ASC 805, Business Combinations, and, as such, the assets
TOWNEBANK NOTES TO CONSOLIDATED FINANCIAL STATEMENTS
61

acquired and liabilities assumed in the transaction were recorded at their respective fair values as of the acquisition date. The results of operations of the acquired business were included in the Company's Consolidated Statements of Income commencing January 1, 2019.
Middle Peninsula Insurance Agency, Inc.: Effective November 6, 2018, the Company acquired Middle Peninsula Insurance Agency, Inc., an independent insurance agency, which was merged into the operations of Towne Insurance Agency, LLC, a wholly owned subsidiary of TowneBank. The acquisition was accounted for as a business combination under the acquisition method of accounting in accordance with ASC 805, Business Combinations, and, as such, the assets acquired and liabilities assumed in the transaction were recorded at their respective fair values as of the acquisition date. The results of operations of the acquired business are included in the Company's Consolidated Statements of Income commencing November 6, 2018.
Michael R. Bare, LLC: Effective May 15, 2018, the Company acquired Michael R. Bare, LLC, an independent insurance agency, which was merged into the operations of Towne Insurance Agency, LLC, a wholly owned subsidiary of TowneBank. The acquisition was accounted for as a business combination under the acquisition method of accounting in accordance with ASC 805, Business Combinations, and, as such, the assets acquired and liabilities assumed in the transaction were recorded at their respective fair values as of the acquisition date. The results of operations of the acquired business are included in the Company's Consolidated Statements of Income commencing May 15, 2018.
Paragon Commercial Corporation: Effective January 26, 2018, TowneBank completed its acquisition of Paragon in an all-stock transaction. As part of the merger, Paragon merged with and into TB Acquisition, LLC, a wholly owned subsidiary of TowneBank, and Paragon Bank, a wholly owned subsidiary of Paragon, merged with and into TowneBank.
In the merger with Paragon, each outstanding share of Paragon common stock was converted into the right to receive 1.725 shares of TowneBank common stock. TowneBank issued an aggregate of 9.43 million shares of its common stock to former Paragon shareholders. Based on the closing price of TowneBank's common stock on January 26, 2018, of $31.20 per share, the aggregate consideration paid to former Paragon common shareholders and holders of equity awards to acquire Paragon common stock was approximately $294.07 million.
Paragon Bank was headquartered in Raleigh, North Carolina, and had three branches serving the metropolitan areas of Charlotte and Raleigh, North Carolina. TowneBank engaged in this transaction with the expectation that it would expand its community banking franchise into new geographic markets that it believes are demographically attractive and rapidly growing. The integration of Paragon Bank's deposit system and the conversion of Paragon Bank's branches to TowneBank's operating platform were completed over the weekend of January 27-28, 2018.
The Paragon merger has been accounted for under the acquisition method of accounting. Under this guidance, an entity is required to recognize the assets acquired, liabilities assumed, and consideration given at their fair value on the acquisition date. The assets and liabilities, both tangible and intangible, were recorded at their estimated fair values as of the January 26, 2018, merger date. Such fair values were preliminary estimates and were subject to adjustment for up to one year after the merger date, or when additional information relative to the closing date fair values became available and such information was considered final. The fair value of consideration exchanged exceeded the recognized amounts of the identifiable net assets and resulted in goodwill of $149.73 million. Goodwill resulted from a combination of expected synergies, expansion in the metropolitan areas of Charlotte and Raleigh, North Carolina, with the addition of three branch locations, and growth opportunities. None of the goodwill recognized is expected to be deductible for income tax purposes.
The following table presents the estimated fair values of the assets acquired and liabilities assumed for Paragon as of January 26, 2018 (dollars in thousands):
TOWNEBANK NOTES TO CONSOLIDATED FINANCIAL STATEMENTS
62

Fair value of assets acquired:Cash and cash equivalents $ 79,372 Securities available for sale 184,184 Loans held for investment 1,432,497 Bank premises and equipment 13,647 OREO 1,330 Core deposit intangible 21,520 Other assets 69,315 Total assets $ 1,801,865
Fair value of liabilities assumed:Deposits $ 1,248,636 Total borrowings 378,558 Other liabilities 30,326 Total liabilities $ 1,657,520
Net identifiable assets acquired 144,345 Goodwill 149,725 Net assets acquired $ 294,070
Purchase price:Company common shares issued 9,425,213 Purchase price per share of Company's common stock $ 31.20 Common stock issued $ 294,067 Cash exchanged for fractional shares 3 Fair value of total consideration transferred $ 294,070
Although superseded by ASC 326, on January 1, 2020, at the time of acquisition, the loans acquired in the Paragon merger were divided into loans with evidence of credit quality deterioration, which are accounted for under ASC 310-30 (purchased credit impaired), and loans that do not meet this criteria, which are accounted for under ASC 310-20 (purchased performing). See Notes 1 and 5 for additional information regarding the treatment of acquired loans under ASC 326. As of January 26, 2018, the estimated fair value of the Paragon purchased performing loans acquired was $1.42 billion, the related gross contractual amount was $1.67 billion, and the estimated contractual cash flows not expected to be collected were $12.51 million.
The following table presents the acquired purchased credit impaired loans receivable at the acquisition date, as adjusted (dollars in thousands):
Contractual principal and interest at acquisition $ 26,697 Nonaccretable difference (10,672) Expected cash flows at acquisition 16,025 Accretable yield (1,857) Estimated fair value of loans acquired with a deterioration of credit quality $ 14,168
TOWNEBANK NOTES TO CONSOLIDATED FINANCIAL STATEMENTS
63

NOTE 3: INVESTMENT SECURITIES
AFS debt securities are carried at fair value, with unrealized holding gains and losses reported in other comprehensive income, net of tax. HTM debt securities are carried at amortized cost. Interest income on debt securities includes the amortization of purchase premiums and discounts. Premiums and discounts on securities are generally amortized on the effective yield method without anticipating prepayments, except for MBSs where prepayments are anticipated. Premiums on callable debt securities are amortized to their earliest call date. Gains and losses on sales are recorded on the trade date and determined using the specific identification method.
Debt securities are evaluated individually at each trade level. A debt security is placed on nonaccrual status at the time any principal or interest payments become 90 days delinquent. Interest accrued but not received for a security placed on nonaccrual is reversed against interest income on a timely basis. At a minimum, debt securities are evaluated for potential losses on a quarterly basis, and more frequently, if deemed necessary. We charge off any portion of an investment security we determine to be uncollectible. The amortized cost basis, excluding accrued interest, is charged off through the allowance for credit losses. Accrued interest is charged off as a reduction to interest income. Recoveries of previously charged-off principal amounts are recognized in our provision for credit losses when received.
Available-for-sale debt securities
When the fair value of an individual AFS debt security has declined below its amortized cost basis, the Company is required to assess whether the decline is from a credit loss or other factor. If the decline in fair value is attributable to a credit loss, ASC 326 requires assessment of allowance for credit losses instead of other than temporary impairment. Through the use of an allowance, the Company is able to record credit losses in current period net income via a provision for credit loss expense rather than a direct write-down of the security's amortized cost basis. In addition, under ASC 326, the allowance is reduced for improvements in expected cash flows, and reversal of previously recognized credit losses is permitted through net income in the period in which they occur. This change results in recognition and presentation of credit losses on the income statement.
In our assessment of whether the decline in fair value of AFS debt securities below the amortized cost is due to credit factors, all relevant information is considered at the individual security level. Specifically, the Company considers both qualitative and quantitative factors:
• Qualitative Factors◦ Market spread.◦ The extent to which the fair value is less than the amortized cost basis.◦ Adverse changes in the financial condition of the issuer.◦ Adverse conditions specifically related to the security, such as past due principal or interest.◦ Adverse changes in security ratings.◦ Economic conditions and demographics.
• Quantitative Factors◦ The present value of cash flows expected to be collected from the security compared with the
amortized cost basis of the security.◦ The likelihood the Company will be able to collect all amounts due in accordance with the
contractual terms of the debt security.
If our assessment indicates that a credit loss exists, the Company records an allowance for credit losses for the excess of the amortized cost basis over the present value of cash flows expected to be collected, subject to the fair value floor. Subsequent changes in the allowance for credit losses are recorded as an addition to (or reversal of) the provision for credit loss expense.
TOWNEBANK NOTES TO CONSOLIDATED FINANCIAL STATEMENTS
64

The Company elected not to measure an allowance for credit losses for accrued interest receivables because uncollectible accrued interest receivables are written off in a timely manner and, as such, the accrued interest receivable on AFS debt securities amounting to $5.21 million as of December 31, 2020, was excluded from the estimate of expected credit loss and included in other assets.
As of December 31, 2020, we have recognized no credit losses on Company-held MBSs issued by GSEs, U.S. government sponsored agency securities, and U.S. treasury securities because these securities are either explicitly or implicitly guaranteed by the U.S. government, are highly rated by major rating agencies, and have a long history of no credit losses. As such, the Company has excluded them, under the zero risk of loss expectation, from the impairment analysis under ASC 326-30.
Held-to-maturity debt securities
For HTM debt securities, an allowance will be recognized when lifetime credit losses are expected, for an amount that reflects the expected contractual credit losses, even when the risk of credit losses is remote. As such, credit losses for HTM debt securities will generally be recognized earlier than credit losses for AFS debt securities, which are not recognized until there is evidential support of a potential loss.
As of December 31, 2020, no credit losses on Company-held MBSs issued by GSEs, U.S. government sponsored agency securities, and U.S. treasury securities have been recognized because these securities are either explicitly or implicitly guaranteed by the U.S. government, are highly rated by major rating agencies, and have a long history of no credit losses. As such, the Company has excluded them under the zero risk of loss exception in the allowance for credit losses under ASC 326-20.
For the HTM debt securities not implicitly or explicitly guaranteed by the U.S. government, the Company measures expected credit losses on a collective basis, by major security type with each type sharing similar characteristics, utilizing published statistical information from annual default and recovery tables. Accrued interest receivable on HTM debt securities totaling $0.92 million was included in other assets as of December 31, 2020, and excluded from the estimate of expected credit losses. At December 31, 2020, all HTM debt securities are current for both principal and interest. There were no in-scope collateral-dependent HTM debt securities at December 31, 2020.
TOWNEBANK NOTES TO CONSOLIDATED FINANCIAL STATEMENTS
65

Available-for-sale debt securities
The following table summarizes amortized cost and fair values of AFS debt securities as of the dates indicated (dollars in thousands):
December 31, 2020
Amortized Cost
Gross Unrealized
Gains
Gross Unrealized
LossesAllowance for Credit Losses Fair Value
U.S. agency securities $ 183,514 $ 1,797 $ (654) $ — $ 184,657 U.S. Treasury notes 1,000 — — — 1,000 Municipal securities 331,850 21,952 (151) (10) 353,641 Trust preferred and other corporate securities 30,983 692 (176) (338) 31,161 MBS issued by GSEs and GNMA 762,903 35,584 (722) — 797,765 Total available-for-sale securities $ 1,310,250 $ 60,025 $ (1,703) $ (348) $ 1,368,224
December 31, 2019
Amortized Cost
Gross Unrealized
Gains
Gross Unrealized
LossesAllowance for Credit Losses Fair Value
U.S. agency securities $ 128,451 $ 788 $ (201) n/a $ 129,038 U.S. Treasury notes 1,000 — — n/a 1,000 Municipal securities 217,911 6,032 (837) n/a 223,106 Trust preferred and other corporate securities 51,724 1,668 (25) n/a 53,367 MBS issued by GSEs and GNMA 1,022,487 15,462 (3,152) n/a 1,034,797 Total available-for-sale securities $ 1,421,573 $ 23,950 $ (4,215) n/a $ 1,441,308
The following table summarizes realized gains and losses on the sale of AFS debt securities as of the dates indicated (dollars in thousands):
December 31, December 31, December 31,
2020 2019 2018
Gross gains $ 10,649 $ 432 $ 3
Gross (losses) (1,015) (1,277) —
Net gains (losses) $ 9,634 $ (845) $ 3
Sales proceed (1) $ 348,977 $ 186,658 $ 48,675
(1) Proceeds include interest on investment securities sold of $1.22 million, $0.61 million, and $0.32 million in 2020, 2019, and 2018, respectively.
TOWNEBANK NOTES TO CONSOLIDATED FINANCIAL STATEMENTS
66

Held-to-maturity debt securities
The following table summarizes amortized cost and fair values of HTM debt securities as of the dates indicated (dollars in thousands):
December 31, 2020
Amortized Cost
Gross Unrealized
Gains
Gross Unrealized
Losses Fair ValueAllowance for Credit Losses
Trust preferred and other corporate securities $ 2,321 $ 231 $ — $ 2,552 $ (85) Municipal securities 5,012 1,235 — 6,247 (12) MBS issued by GSE 9,179 491 — 9,670 — Total held-to-maturity securities $ 16,512 $ 1,957 $ — $ 18,469 $ (97)
December 31, 2019
Amortized Cost
Gross Unrealized
Gains
Gross Unrealized
Losses Fair ValueAllowance for Credit Losses
Trust preferred and other corporate securities $ 2,369 $ 230 $ — $ 2,599 n/aMunicipal securities 29,167 1,221 — 30,388 n/aMBS issued by GSE 12,152 69 (37) 12,184 n/aTotal held-to-maturity securities $ 43,688 $ 1,520 $ (37) $ 45,171 n/a
Maturities of debt securities
Expected maturities may differ from contractual maturities because borrowers may have the right to call or prepay obligations with or without call or prepayment penalties. The amortized cost and estimated fair value of debt securities are shown by contractual maturity (including MBSs) as of December 31, 2020, and December 31, 2019, in the following table (dollars in thousands):
December 31, 2020 Available for Sale Held to MaturityAmortized
Cost Fair ValueAmortized
Cost Fair ValueDue in one year or less $ 6,254 $ 6,331 $ — $ — Due after one year through five years 64,839 67,814 2,850 2,890 Due after five years through ten years 693,699 726,808 9,693 11,031 Due after ten years 545,458 567,271 3,969 4,548
1,310,250 1,368,224 16,512 18,469 Other equity securities 6,492 6,492 — —
$ 1,316,742 $ 1,374,716 $ 16,512 $ 18,469
TOWNEBANK NOTES TO CONSOLIDATED FINANCIAL STATEMENTS
67
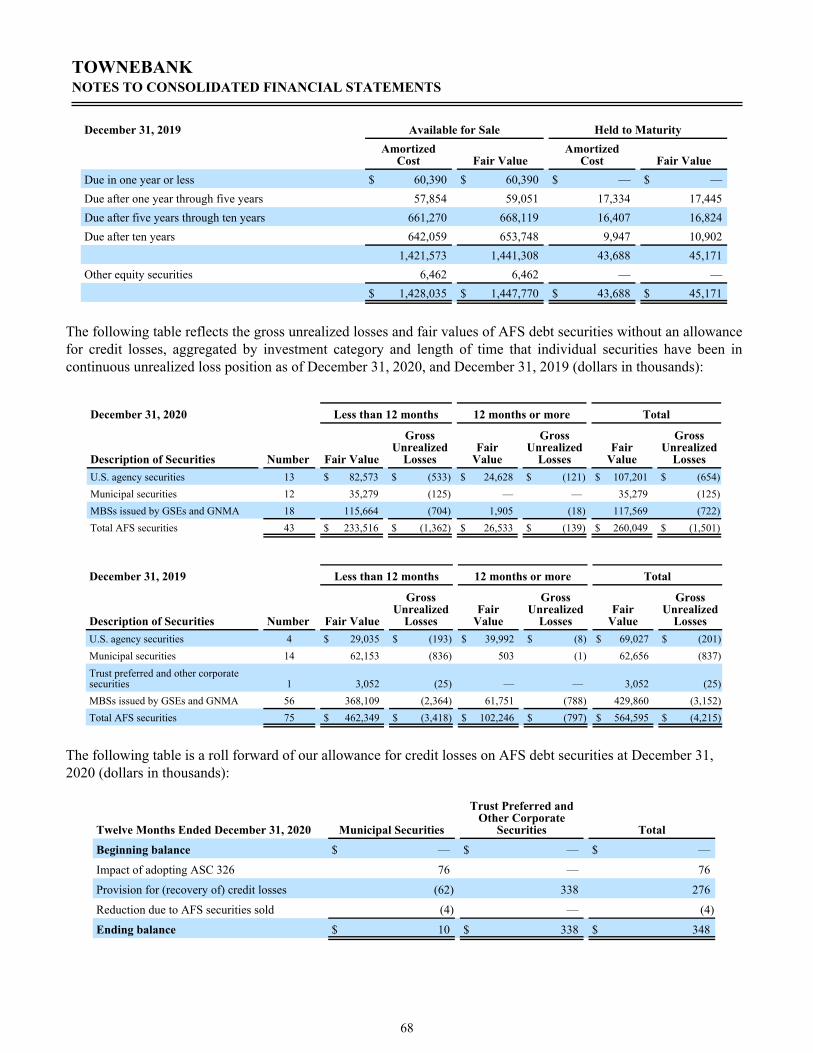
December 31, 2019 Available for Sale Held to MaturityAmortized
Cost Fair ValueAmortized
Cost Fair ValueDue in one year or less $ 60,390 $ 60,390 $ — $ — Due after one year through five years 57,854 59,051 17,334 17,445 Due after five years through ten years 661,270 668,119 16,407 16,824 Due after ten years 642,059 653,748 9,947 10,902
1,421,573 1,441,308 43,688 45,171 Other equity securities 6,462 6,462 — —
$ 1,428,035 $ 1,447,770 $ 43,688 $ 45,171
The following table reflects the gross unrealized losses and fair values of AFS debt securities without an allowance for credit losses, aggregated by investment category and length of time that individual securities have been in continuous unrealized loss position as of December 31, 2020, and December 31, 2019 (dollars in thousands):
December 31, 2020 Less than 12 months 12 months or more Total
Description of Securities Number Fair Value
Gross Unrealized
LossesFair
Value
Gross Unrealized
LossesFair
Value
Gross Unrealized
LossesU.S. agency securities 13 $ 82,573 $ (533) $ 24,628 $ (121) $ 107,201 $ (654) Municipal securities 12 35,279 (125) — — 35,279 (125) MBSs issued by GSEs and GNMA 18 115,664 (704) 1,905 (18) 117,569 (722) Total AFS securities 43 $ 233,516 $ (1,362) $ 26,533 $ (139) $ 260,049 $ (1,501)
December 31, 2019 Less than 12 months 12 months or more Total
Description of Securities Number Fair Value
Gross Unrealized
LossesFair
Value
Gross Unrealized
LossesFair
Value
Gross Unrealized
LossesU.S. agency securities 4 $ 29,035 $ (193) $ 39,992 $ (8) $ 69,027 $ (201) Municipal securities 14 62,153 (836) 503 (1) 62,656 (837) Trust preferred and other corporate securities 1 3,052 (25) — — 3,052 (25) MBSs issued by GSEs and GNMA 56 368,109 (2,364) 61,751 (788) 429,860 (3,152) Total AFS securities 75 $ 462,349 $ (3,418) $ 102,246 $ (797) $ 564,595 $ (4,215)
The following table is a roll forward of our allowance for credit losses on AFS debt securities at December 31, 2020 (dollars in thousands):
Twelve Months Ended December 31, 2020 Municipal Securities
Trust Preferred and Other Corporate
Securities Total
Beginning balance $ — $ — $ —
Impact of adopting ASC 326 76 — 76
Provision for (recovery of) credit losses (62) 338 276
Reduction due to AFS securities sold (4) — (4)
Ending balance $ 10 $ 338 $ 348
TOWNEBANK NOTES TO CONSOLIDATED FINANCIAL STATEMENTS
68

We monitor the credit quality of HTM debt securities through the use of credit ratings. These ratings are updated on a monthly basis, and were last updated December 31, 2020. The following table reflects the credit ratings aggregated by investment category for HTM debt securities at December 31, 2020 (dollars in thousands):
Credit Ratings
Description of Securities AAA AA+ AA- A+ to A-BBB+ to
BBB-BB+ and
below Total
Municipal securities $ 1,608 $ 3,404 $ — $ — $ — $ — $ 5,012 Trust preferred and other corporate securities — — — — 2,321 — 2,321 Mortgage-backed securities issued by GSEs and GNMA 9,179 — — — — — 9,179
Total $ 10,787 $ 3,404 $ — $ — $ 2,321 $ — $ 16,512
The following table provides a breakdown, by major security type and year of origination, for our HTM debt securities at December 31, 2020 (dollars in thousands):
Description of Securities 2020 2019 2018 2017 2016 Prior TotalMunicipal securities $ — $ — $ — $ — $ — $ 5,012 $ 5,012 Trust preferred and other corporate securities — 1,821 — — — 500 2,321 Mortgage-backed securities issued by GSEs and GNMA — — — — 5,788 3,391 9,179
Total $ — $ 1,821 $ — $ — $ 5,788 $ 8,903 $ 16,512
The following table is a roll forward of our allowance for credit losses on HTM debt securities at December 31, 2020 (dollars in thousands):
Twelve Months Ended December 31, 2020 Municipal Securities
Trust Preferred and Other Corporate
Securities TotalBeginning balance $ — $ — $ —
Impact of adopting ASC 326 63 91 154
Provision for (recovery of) credit losses (51) (6) (57)
Ending balance $ 12 $ 85 $ 97
Equity securities
We hold certain securities that do not have a readily determinable fair value and are recognized using cost or other measurement principles. These equity securities include FHLB stock, private equity, and tax credit investments. At December 31, 2020, FHLB stock totaled $30.14 million and other equity securities totaled $6.49 million. At December 31, 2019, FHLB stock totaled $30.09 million and other equity securities totaled $6.46 million. No impairments or adjustments have been recorded on these investments.
Debt Securities - Pre-ASC 326
Prior to the adoption of ASC 326, the disclosure for OTTI on AFS and HTM debt securities was combined. Unrealized losses were broken down between "less than 12 months" and "12 months or more."
TOWNEBANK NOTES TO CONSOLIDATED FINANCIAL STATEMENTS
69

The following table shows the Company's gross unrealized losses and fair values aggregated by investment category and length of time that individual securities have been in a continuous unrealized loss position for the periods indicated (dollars in thousands):
December 31, 2019 Less than 12 months 12 months or more Total
Description of Securities Number Fair ValueUnrealized
LossesFair
ValueUnrealized
LossesFair
ValueUnrealized
Losses
U.S. Treasury obligations and direct obligations of U.S. government agencies 4 $ 29,035 $ (192) $ 39,992 $ (9) $ 69,027 $ (201)
Municipal securities 14 62,153 (836) 502 (1) 62,655 (837)
Mortgage-backed securities issued by GSE 58 377,146 (2,401) 61,751 (788) 438,897 (3,189)
Trust preferred and other corporate obligations 1 3,052 (25) — — 3,052 (25)
Total temporarily impaired securities 77 $ 471,386 $ (3,454) $ 102,245 $ (798) $ 573,631 $ (4,252)
Pledged securities
At December 31, 2020 and 2019, the Company had investment securities with market values of $288.06 million and $306.25 million, respectively, pledged to secure federal, state, and municipal deposits. Additionally, the Company had no investment securities pledged to secure borrowings from the FRB-Richmond at December 31, 2020 or 2019. The Company also had $80.21 million in investment securities pledged against repurchase agreements with commercial customers at December 31, 2020, compared to $64.62 million at December 31, 2019.
Federal Home Loan Bank stock
The Company is required to maintain an investment in the capital stock of the FHLB. The FHLB stock is stated at cost, as this is a restricted security without a readily determinable fair value. The Company had $30.14 million and $30.09 million of FHLB stock at December 31, 2020 and 2019, respectively. Based on the Company's review of the credit quality of the institution, the institution's ability to repurchase shares, and the Company's carrying value in the shares, the Company does not consider this investment impaired.
NOTE 4: LOANS
The Company grants commercial, real estate, and consumer loans to customers throughout our lending area. Although the Company has a diversified loan portfolio, a substantial portion of the Company's debtors' abilities to honor their contracts is dependent upon the economic environment of the lending area.
TOWNEBANK NOTES TO CONSOLIDATED FINANCIAL STATEMENTS
70

The following table presents loan balances by major classification as of the date indicated (in thousands):
December 31, December 31,
2020 (1) 2019 (2)
Commercial Real Estate
Construction and land development 1,199,772 $ 1,117,625
Owner occupied 1,380,516 1,330,344
Non-owner occupied 2,335,235 2,183,409
Multi-family 295,488 242,773
Total Commercial Real Estate 5,211,011 4,874,151
Residential 1- 4 family 1,216,629 1,192,090
HELOC 412,476 460,639
Commercial and industrial business 1,990,808 1,173,409
Government 379,243 325,123
Indirect 271,459 267,950
Consumer loans and other 147,442 125,926 Loans, net of unearned income and deferred costs $ 9,629,068 $ 8,419,288
(1) Paycheck Protection Program loans totaling $0.86 billion, primarily in C&I, are included in December 31, 2020, balances.(2) The loan portfolio segments for December 31, 2019, were further segmented to reflect the new January 1, 2020, presentation due to the adoption of ASC
326.
Unearned loan income was $18.20 million in excess of deferred loan costs at December 31, 2020, $8.98 million at December 31, 2019, and $7.06 million at December 31, 2018. Unearned loan income on PPP totaled $14.79 million at December 31, 2020, and zero at December 31, 2019 and 2018. Unaccreted discounts on PCD loans were $8.02 million and were $6.91 million on non-PCD loans at December 31, 2020. There were $11.19 million, $17.44 million, and $4.75 million in nonaccrual loans at December 31, 2020, 2019, and 2018, respectively. The Company would have earned $0.33 million in 2020, $0.58 million in 2019, and $0.23 million in 2018 if interest on the loans had been accruing. Of total loans, $3.14 billion was pledged as collateral to secure overnight borrowings with the FHLB, and $1.09 billion was pledged to secure borrowings from the discount window at the FRB-Richmond at December 31, 2020.
Nonaccrual Loans
The Company generally places loans on nonaccrual status when the full and timely collection of interest or principal becomes uncertain, part of the principal balance has been charged off and no restructuring has occurred, or the loans reach a certain number of days past due. Commercial loans are placed on nonaccrual status when full collection of principal and interest becomes doubtful, or when any portion of principal or interest becomes 90 days past due, whichever occurs first, unless the debt is both well-secured and in the process of collection. Residential mortgage loans and other consumer loans are placed on nonaccrual status when full collection of principal and interest becomes doubtful, or when any portion of principal or interest becomes 120 days past due, whichever occurs first, unless the debt is both well-secured and in the process of collection. When loans are placed on nonaccrual status, interest receivable is reversed against interest income recognized in the current period, and any prior-year unpaid interest is charged off against the allowance for credit losses. Interest payments received thereafter are applied as a reduction of the remaining principal balance as long as doubt exists as to the ultimate collection of the principal. Loans are removed from nonaccrual status when they become current as to both principal and interest and when the collection of principal or interest is no longer doubtful.
TOWNEBANK NOTES TO CONSOLIDATED FINANCIAL STATEMENTS
71

Troubled Debt Restructuring
A TDR loan is a loan that has been modified, for reasons related to a borrower's financial difficulties, that the Company would not otherwise consider modifying. A loan is a TDR if both of the following conditions are met: (1) a creditor has granted a concession to the debtor, and (2) the debtor is experiencing financial difficulty. Loan modifications may be utilized when there is a reasonable chance that an appropriate modification would allow a borrower to continue servicing their debt. Loan terms that may be modified or restructured due to a borrower's financial situation include, but are not limited to, a reduction in the stated interest rate, an extension of the maturity or renewal of the loan at an interest rate below current market, a reduction in the face amount of the debt, a reduction in the accrued interest, or deferral of interest payments.
If the value of a TDR is determined to be less than the recorded investment in the loan, a valuation allowance is created with a corresponding charge-off. Measurement of the value of a TDR is generally based on the present value of expected future cash flows discounted at the loan's original effective interest rate before modification, or is based on the underlying collateral value less costs to sell, if repayment of the loan is collateral-dependent.
The Company determined that TDRs will continue to be pooled with other loans in the portfolio for purposes of estimating the ACL, as they share similar risk characteristics, unless the TDR no longer shares the common risk characteristics of its pool or if the concessions granted require a method for estimating expected credit losses that is inconsistent with the method applied to the pool. This method is used consistently for all segments of the portfolio.
At December 31, 2020, nonaccruing TDRs, which are included in nonperforming loans, totaled $0.71 million and accruing TDRs totaled $13.86 million. Nonaccruing loans that are modified can be placed back on accrual status when both principal and interest are current, there is a sustained repayment performance of six months or longer, and it is probable that we will be able to collect all amounts due (both principal and interest) according to the terms of the loan agreement.
For the year ended December 31, 2020, there were no loans modified as TDRs. For the year ended December 31, 2019, there were three loans modified as TDRs. There were no loans restructured in the past 12 months that have subsequently defaulted. Restructured loans generally include terms to reduce the interest rate and extended payment terms.
Year Ended December 31, 2019
NumberPre-
ModificationPost-
Modificationof Recorded Recorded
Loans Balance BalanceConstruction and land development 2 $ 275 $ 275 Multi-family real estate 1 2,852 2,852 Total 3 $ 3,127 $ 3,127
Section 4013 of the CARES Act provided that a qualified loan modification is exempt by law from classification as a TDR as defined by GAAP, from the period beginning March 1, 2020, until the earlier of December 31, 2020, or the date that is 60 days after the date on which the national emergency concerning the COVID-19 outbreak declared by the President of the United States under the National Emergencies Act terminates. The Appropriations Act, passed December 27, 2020, extended TDR relief to the earlier of January 1, 2022, or 60 days after the national emergency terminates. Accordingly, we have offered modifications made in response to COVID-19 to borrowers who are current and otherwise not past due. Management continues to review risk grades and update credit risk
TOWNEBANK NOTES TO CONSOLIDATED FINANCIAL STATEMENTS
72

when additional modifications are needed. As of December 31, 2020, the Company had 210 eligible loan modifications with outstanding balances of $340.81 million.
NOTE 5. ALLOWANCE FOR CREDIT LOSSES ON LOANS
Effective January 1, 2020, ASC 326 replaces the prior incurred loss impairment methodology with an expected loss methodology, commonly referred to as CECL. The incurred loss methodology delayed the recognition of credit losses until it was probable a loss had been incurred. In contrast, the CECL methodology requires losses to be estimated over the life of the financial instrument and recorded at origination or acquisition. Additionally, CECL requires consideration of a reasonable and supportable forecast to inform credit loss estimates while the prior standard did not allow forecasting of losses.
ASC 326 also supersedes the guidance for PCI assets within the scope of ASC 310-30, Loans and Debt Securities Acquired with Deteriorated Credit Quality. Under ASC 326, PCD assets are acquired assets that, as of the date of acquisition, have experienced a more than insignificant deterioration in credit quality since origination. The entity is required to use its own judgment in this evaluation.
Unless excluded from the scope, the requirements of ASC 326 affect financial assets with the contractual right to receive cash, including loans, HTM debt securities, trade receivables, net investments in leases, and off-balance-sheet credit exposures. ASC 326 requires financial assets measured at amortized cost basis to be presented at the net amount expected to be collected. The allowance for credit losses is a valuation account that is deducted from the amortized cost basis of the financial asset to present the net carrying value and the amount expected to be collected on the financial asset.
• For financial assets measured at amortized cost, the Company adopted the standard utilizing the modified-retrospective method, which required a cumulative-effect adjustment to retained earnings. That cumulative-effect adjustment resulted in a decrease in retained earnings of $2.53 million, net of tax. This decrease is related to our existing balance sheet assets in scope, and off-balance-sheet exposures, at January 1, 2020, and due to the change in the timing of recognition of credit losses, from incurred loss methodology, to lifetime of expected losses methodology. Results for reporting periods beginning January 1, 2020, are presented under the new standard, while prior period allowance estimates have not been adjusted and continue to be reported in accordance with the Company's historic accounting under GAAP.
• For PCD financial assets that were previously classified as PCI, in accordance with ASC 326, management did not reassess whether PCI assets met the criteria of PCD assets as of the date of adoption. On January 1, 2020, in accordance with ASC 326, the amortized cost basis of the PCD assets were adjusted to reflect the addition of $1.65 million to the allowance for credit losses. The remaining noncredit discount of $10.02 million, based on the adjusted amortized cost basis, will be accreted into interest income over the contractual life using the effective interest rate method as of January 1, 2020.
As stated previously, prior periods will continue to be presented under the prior incurred loss impairment methodology. As such, period-over-period presentations may differ in measurable ways. Such differences will be highlighted when presented. The most notable difference will be related to the concept of impairment, which does not exist under ASC 326. Previously, an impaired asset was specifically defined as an asset for which management did not expect to receive contractual payments in accordance with the original terms of the asset. However, unless it was probable a loss had occurred, no loss related to the asset's impairment could be recognized. For those assets in scope of ASC 326-20, the Company will be considering the lifetime ECLs at the point of origination and recording an allowance for that expectation, rather than waiting until a loss is probable to record an allowance, thus removing the need for consideration of impairment.
TOWNEBANK NOTES TO CONSOLIDATED FINANCIAL STATEMENTS
73

The following table summarizes the impact to our allowance for credit losses with the adoption of ASC 326 as of the adoption date:
January 1, 2020
As Reported Under Pre-ASC 326 Impact of ASC 326
(dollars in thousands) ASC 326 Adoption Adoption
ASSETS
Allowance for credit losses on AFS securities $ 76 $ — $ 76
Allowance for credit losses on HTM securities $ 154 $ — $ 154
Loans
Commercial real estate loans
Construction and development $ 15,084 $ 6,926 $ 8,158
Owner occupied 7,164 9,356 (2,192)
Non-owner occupied 11,671 13,885 (2,214)
Multi-family 1,268 1,047 221
Total Commercial Real Estate 35,187 31,214 3,973
Residential 1-4 family 7,536 7,241 295
HELOC 9,116 3,382 5,734
Commercial and industrial 3,898 7,899 (4,001)
Government 1,371 1,937 (566)
Indirect 1,144 6,064 (4,920)
Consumer and other 920 497 423
Allowance for credit losses on loans $ 59,172 $ 58,234 $ 938
LIABILITIESAllowance for credit losses on off-balance-sheet credit exposures $ 3,507 $ — $ 3,507
Several factors impacted changes in the distribution of the allowance for credit losses with the adoption of ASC 326. In addition to changes related to the transition from an incurred loss methodology to a Day 1 estimate of lifetime loss, new modeling techniques were adopted. These techniques rely on a robust statistical base in the form of multiple economic forecasts to assist in identifying portfolio exposures and estimating areas of potential loss, and replace the heavier reliance on qualitative adjustments under the previous estimate methodology.
The following table presents a breakdown of the provision for credit losses included in our Consolidated Statements of Income for the applicable periods (in thousands):
Year Ended
December 31, 2020
Provision for loan losses $ 61,223
Provision for off-balance-sheet exposures 5,738 Provision for (recovery of) HTM security losses (57)
Provision for (recovery of) AFS security losses 273
Total provision for credit losses $ 67,177
TOWNEBANK NOTES TO CONSOLIDATED FINANCIAL STATEMENTS
74

The allowance for credit losses on loans is applied to amortized cost, which is defined as the amount at which a financing receivable is originated or acquired, adjusted for applicable accrued interest, accretion of discount, or amortization of premium, discount, and net of deferred fees and costs, collection of cash, and write-offs. ASC 326 allows a company to make a separate accounting policy election to exclude accrued interest receivable balances from the calculation of an allowance, contingent on the company having an accounting policy in place that results in the timely reversal, or write-off, of any unpaid accrued interest. The Company has such a policy in place, and has elected to exclude accrued interest from the calculation of its allowance for credit losses. As of December 31, 2020, $25.83 million in accrued interest receivable on loans is excluded from the estimate of ECL and is included in other assets.
We charge off loans, or portions of loans, we determine to be uncollectible. The amortized cost basis, excluding interest, is charged off as a reduction to the allowance for credit losses. Accrued interest on loans determined to be uncollectible is reversed as a reduction of interest income. When received, recoveries of previously charged off amounts are recorded as an increase to the allowance for credit losses until prior charge-offs have been fully recovered.
Credit risk is inherent in the business of extending loans to borrowers and is continuously monitored by management and reflected within the allowance for credit losses for loans. The allowance for credit losses is an estimate of expected losses inherent within the Company's loans held for investment portfolio. In estimating the allowance for credit losses, loans with similar risk characteristics are aggregated into pools and collectively assessed. Risk characteristics for pooling include, but are not limited to: loan purpose, underlying collateral, and similarities in performance and structure. Some loans are not sufficiently similar in risk characteristics to other loans. These loans are excluded from collective evaluation and evaluated on an individual basis. Loans identified for individual assessment include: substandard loans equal to or greater than $1.0 million, PCD loans greater than $100,000 graded special mention or substandard, PCD loans with specific reserves, and/or loans identified as no longer sharing similar risk characteristics with other pooled loans. Individually assessed loans totaled $26.50 million with specific reserves of $1.84 million at December 31, 2020.
Our loan portfolio is divided into modeling segments, which are further broken down into portfolios:
Modeling Segment Portfolio
CRE
Construction and developmentCommercial owner occupiedCommercial non-owner occupiedMulti-family
Resi-Mort1 - 4 family mortgage and subordinated mortgage
HELOC HELOC
C&ICommercial and industrialDealer floorplans
Government Municipal loans / bondsIndirect Indirect autoConsumer Consumer and other loans
In determining the allowance for credit losses, the Company utilized two approaches:• Risk parameter - PD, LGD, EAD• Qualitative adjustment
TOWNEBANK NOTES TO CONSOLIDATED FINANCIAL STATEMENTS
75

For government and dealer floorplans, which have limited data history and limited history of defaults, baseline ECL estimates are adjusted quantitatively to determine the allowance for credit losses. Baseline ECL is defined as the most likely scenario for financial outcome based on the current conditions of U.S. monetary policy, fiscal policy, U.S. dollar strength, and energy prices as provided through widely published macroeconomic modeling tools. For all other segments/portfolios, the Company builds an estimate of ECLs using an expected loss methodology that incorporates risk parameters which are derived from various vendor models, internally developed statistical models, or nonstatistical estimation approaches.
• PD - estimates the frequency of loss events by assigning probabilities of default within each period to each account
• LGD - calculates the loss severity for defaulted accounts relative to their exposure at the point of default• EAD - calculates the exposure the account faces at default
PD is projected in these models or estimation approaches using loan level and macroeconomic variables. Loan level variables can include structural, performance, and credit variables such as amortization terms, balance, and credit scores, including age groupings. Macroeconomic variables are sourced from third parties. Multiple outcomes are weighted based on the Company's economic outlook and incorporate relevant information about past events, current conditions, and reasonable and supportable forecasts. The weighting of the outcomes of economic scenarios involves significant judgement by management about the effects of matters that are inherently uncertain. Additionally, these weightings are subject to change between periods, and adjustments may be added to capture risk, based on management's assessment of the economic realities, and identified sensitivities, unique to the Company and its markets.
The Company's PD models share a common definition of default, which include loans that are 90 days past due, on nonaccrual status, and/or have a write-off or obligor bankruptcy. All of the Company's models utilize an eight-quarter reasonable and supportable period followed by a four-quarter input reversion period. The Company's loan segments' LGD was developed from actual cumulative loss history. Based on model development results, the Company applies an average net charge-off rate for each modeling segment utilizing internal loss historical observations. For off-balance-sheet commitments, EAD includes estimates of amounts available to draw for loans considered not unconditionally cancellable. Calculations for EAD utilize a flat-rate assumption methodology based on median over time for C&I, consumer, and HELOC loans, and average utilization at default for CRE loans. No allowance for credit losses has been recognized for PPP loans because the loans are fully guaranteed by the SBA.
For most of the Company's loan segments, prepayment rate assumptions are based on prepayment patterns of pools with shared risk characteristics. Prepayment trends are sensitive to interest rates and the macroeconomic environment. While both fixed-rate and variable-rate loans are influenced by interest rates, variable rate loans are more heavily influenced by the macroeconomic environment. After quantitative expected loss estimates are calculated, management then adjusts these estimates to incorporate considerations of current trends and conditions that are not captured in the quantitative loss estimates through the use of qualitative and/or environmental factors.
TOWNEBANK NOTES TO CONSOLIDATED FINANCIAL STATEMENTS
76
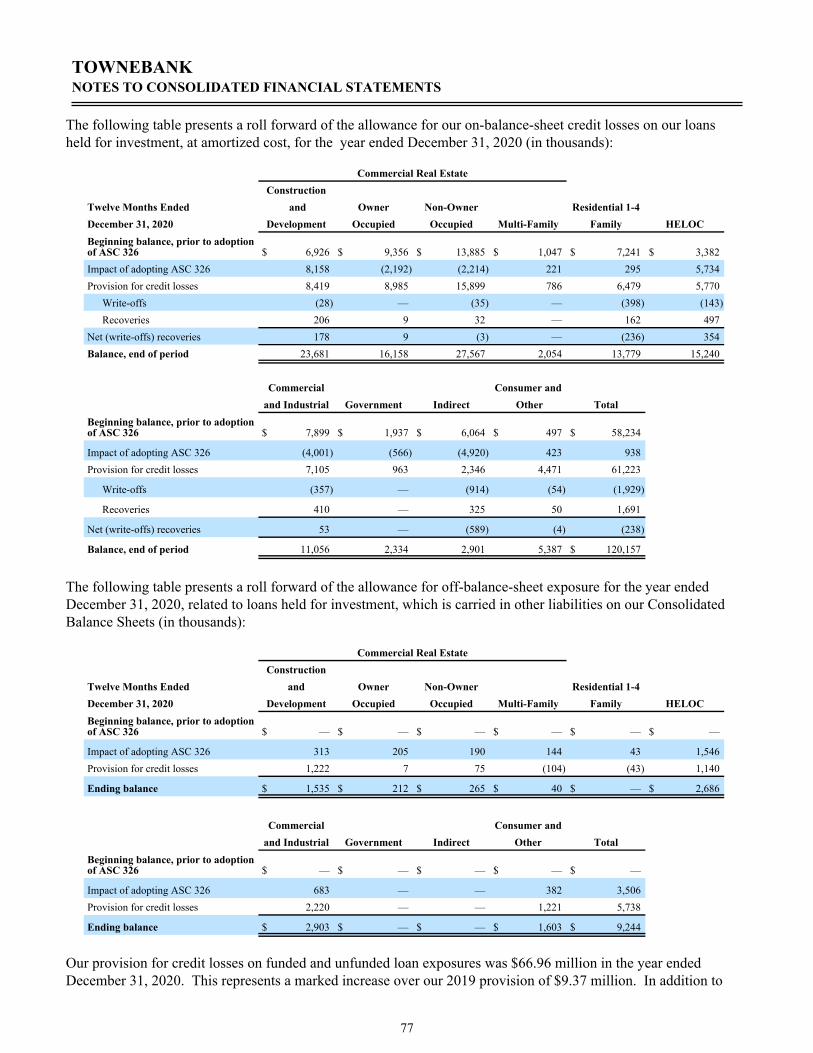
The following table presents a roll forward of the allowance for our on-balance-sheet credit losses on our loans held for investment, at amortized cost, for the year ended December 31, 2020 (in thousands):
Commercial Real EstateConstruction
Twelve Months Ended and Owner Non-Owner Residential 1-4December 31, 2020 Development Occupied Occupied Multi-Family Family HELOCBeginning balance, prior to adoption of ASC 326 $ 6,926 $ 9,356 $ 13,885 $ 1,047 $ 7,241 $ 3,382 Impact of adopting ASC 326 8,158 (2,192) (2,214) 221 295 5,734 Provision for credit losses 8,419 8,985 15,899 786 6,479 5,770
Write-offs (28) — (35) — (398) (143) Recoveries 206 9 32 — 162 497
Net (write-offs) recoveries 178 9 (3) — (236) 354 Balance, end of period 23,681 16,158 27,567 2,054 13,779 15,240
Commercial Consumer andand Industrial Government Indirect Other Total
Beginning balance, prior to adoption of ASC 326 $ 7,899 $ 1,937 $ 6,064 $ 497 $ 58,234
Impact of adopting ASC 326 (4,001) (566) (4,920) 423 938 Provision for credit losses 7,105 963 2,346 4,471 61,223
Write-offs (357) — (914) (54) (1,929)
Recoveries 410 — 325 50 1,691
Net (write-offs) recoveries 53 — (589) (4) (238)
Balance, end of period 11,056 2,334 2,901 5,387 $ 120,157
The following table presents a roll forward of the allowance for off-balance-sheet exposure for the year ended December 31, 2020, related to loans held for investment, which is carried in other liabilities on our Consolidated Balance Sheets (in thousands):
Commercial Real EstateConstruction
Twelve Months Ended and Owner Non-Owner Residential 1-4December 31, 2020 Development Occupied Occupied Multi-Family Family HELOCBeginning balance, prior to adoption of ASC 326 $ — $ — $ — $ — $ — $ —
Impact of adopting ASC 326 313 205 190 144 43 1,546 Provision for credit losses 1,222 7 75 (104) (43) 1,140
Ending balance $ 1,535 $ 212 $ 265 $ 40 $ — $ 2,686
Commercial Consumer andand Industrial Government Indirect Other Total
Beginning balance, prior to adoption of ASC 326 $ — $ — $ — $ — $ —
Impact of adopting ASC 326 683 — — 382 3,506 Provision for credit losses 2,220 — — 1,221 5,738
Ending balance $ 2,903 $ — $ — $ 1,603 $ 9,244
Our provision for credit losses on funded and unfunded loan exposures was $66.96 million in the year ended December 31, 2020. This represents a marked increase over our 2019 provision of $9.37 million. In addition to
TOWNEBANK NOTES TO CONSOLIDATED FINANCIAL STATEMENTS
77

the change in methodology between periods, the increase was attributable to a heavy weighting given to adverse economic forecasts in our credit loss models due to expectation of continued economic weakness driven by a number of uncertainties impacting the local and national economy. Macroeconomic forecasts were impacted by the weakening of small businesses in the wake of the extended COVID-19 pandemic, major layoff announcements in the latter portion of 2020, and deterioration in the U.S. trade relationship with China. Our provision could change significantly in future periods as changes in forecasted macroeconomic conditions and loan mix information become available, resulting in both increases and reductions to the reserve.
Credit quality indicators
For commercial credits, the Company's internal credit risk grading analysis assesses the capability of the borrower to repay contractual obligations of the loan agreements as scheduled, or at all. The Company's internal credit risk grading system is based on numerous factors, including management's experiences with similarly graded loans. Credit risk is inherent in the business of extending loans and leases to borrowers and is monitored by management and reflected within the allowance for credit losses for loans. The allowance for credit losses is an estimate of expected losses inherent within the Company's loans held for investment portfolio.
Credit risk grades, which were last affirmed in September 2020, are refreshed semi-annually. No risk grades were automatically adjusted based on requesting an initial modification due to COVID-19. At affirmation, management analyzes the resulting scores, as well as external statistics and factors, to track loan performance. On an as-needed basis, credit risk grades may be updated between review periods if new information arises related to the customer's ability to repay the loan. The Company differentiates its loan segments based on shared risk characteristics for which expected credit loss is measured on a pool basis.
The Company's internally assigned risk grades are as follows:
Pass - Several pass credit grades comprise loans in this category, which are assigned based on varying levels of risk, ranging from credits that are secured by cash or marketable securities, to management attention credits, which have all the characteristics of an acceptable credit risk but warrant a more than normal level of monitoring.
Special Mention - These assets are characterized by well-defined credit weaknesses and carry the distinct possibility that the Company will sustain some loss if such weakness or deficiency is not corrected.
Substandard - The borrower's ability to repay is threatened by a clearly defined weakness, related to the capacity of the obligor, which jeopardizes ultimate repayment of the loan according to terms.
Doubtful - The borrower's ability to repay in full, on the basis of currently existing facts, conditions, and values, is highly questionable and improbable. Some loss of principal and income is likely; however, the total amount of such loss cannot be determined at the present time. Loans in this category are immediately placed on nonaccrual status with all payments applied to principal until such time as the potential loss exposure is eliminated.
For consumer-related credits, the Company utilizes credit scores calculated and maintained by one of three credit bureaus. Credit scores range between 300 and 850, with a lower score indicating a potentially higher risk. Credit scores are updated semi-annually, with the last update in August 2020.
TOWNEBANK NOTES TO CONSOLIDATED FINANCIAL STATEMENTS
78

The following table provides a breakdown of the Company's loans held for investment by credit score or risk grade and year of origination at December 31, 2020 (in thousands):
Term Loans By Origination
2020 2019 2018 2017 2016 PriorRevolving
Loans
Revolving Loans
Converted to Term Total
CRE - Construction and Development
Pass $ 746,266 $ 283,160 $ 87,004 $ 4,363 $ 5,054 $ 11,553 $ 27,555 $ — $ 1,164,955
Special Mention 20,818 1,046 — 3,686 1,393 651 6,474 — 34,068
Substandard 90 259 1 — 399 — — — 749
$ 767,174 $ 284,465 $ 87,005 $ 8,049 $ 6,846 $ 12,204 $ 34,029 $ — $ 1,199,772
CRE - Owner Occupied
Pass $ 369,009 $ 284,085 $ 152,121 $ 119,339 $ 119,502 $ 234,528 $ 23,022 $ 69 $ 1,301,675
Special Mention 5,083 19,045 20,183 5,437 7,132 9,659 623 — 67,162
Substandard 1,146 286 1,335 2,028 864 5,547 473 — 11,679
$ 375,238 $ 303,416 $ 173,639 $ 126,804 $ 127,498 $ 249,734 $ 24,118 $ 69 $ 1,380,516
CRE - Non-Owner Occupied
Pass $ 642,270 $ 523,494 $ 301,813 $ 239,821 $ 197,357 $ 285,554 $ 18,626 $ 1,198 $ 2,210,133
Special Mention 36,390 9,425 52,804 6,268 4,819 9,735 1,019 — 120,460
Substandard 3,250 — 300 394 — 698 — — 4,642
$ 681,910 $ 532,919 $ 354,917 $ 246,483 $ 202,176 $ 295,987 $ 19,645 $ 1,198 $ 2,335,235
CRE - Multi-Family
Pass $ 98,441 $ 86,876 $ 21,973 $ 17,612 $ 10,116 $ 46,492 $ 3,682 $ — $ 285,192
Special Mention 954 — 6,056 — — — — — 7,010
Substandard 2,953 — — — — 333 — — 3,286
$ 102,348 $ 86,876 $ 28,029 $ 17,612 $ 10,116 $ 46,825 $ 3,682 $ — $ 295,488
Commercial and Industrial
Pass $ 1,092,235 $ 159,672 $ 96,211 $ 36,229 $ 19,167 $ 18,752 $ 483,151 $ 337 $ 1,905,754
Special Mention 20,521 12,679 6,987 3,732 1,079 41 33,401 — 78,440
Substandard 814 1,876 408 2,159 217 226 914 — 6,614
$ 1,113,570 $ 174,227 $ 103,606 $ 42,120 $ 20,463 $ 19,019 $ 517,466 $ 337 $ 1,990,808
Government
Pass $ 89,667 $ 36,737 $ 48,485 $ 13,784 $ 50,528 $ 128,155 $ 3,388 $ — $ 370,744
Special Mention 1,914 — — 1,826 — 4,759 — — 8,499
Substandard — — — — — — — — —
$ 91,581 $ 36,737 $ 48,485 $ 15,610 $ 50,528 $ 132,914 $ 3,388 $ — $ 379,243
TOWNEBANK NOTES TO CONSOLIDATED FINANCIAL STATEMENTS
79

Term Loans By Origination
2020 2019 2018 2017 2016 PriorRevolving
Loans
Revolving Loans
Converted to Term Total
Residential 1 - 4 Family
Credit Score:
> = 750 $ 294,478 $ 186,829 $ 111,587 $ 108,038 $ 103,351 $ 138,147 $ 2,198 $ — $ 944,628
650 - 749 78,001 39,116 44,803 18,712 26,082 36,239 — 78 243,031
450 - 649 5,977 4,110 4,743 2,709 874 10,556 — — 28,969
300 - 449 — — — — — 1 — — 1
$ 378,456 $ 230,055 $ 161,133 $ 129,459 $ 130,307 $ 184,943 $ 2,198 $ 78 $ 1,216,629
HELOC
Credit Score:
> = 750 $ 876 $ 384 $ 364 $ 477 $ 447 $ 1,630 $ 297,662 $ 322 $ 302,162
650 - 749 852 64 150 417 15 1,500 91,906 1 94,905
450 - 649 551 79 73 158 376 3,246 10,926 — 15,409
300 - 449 — — — — — — — — —
$ 2,279 $ 527 $ 587 $ 1,052 $ 838 $ 6,376 $ 400,494 $ 323 $ 412,476
Indirect
Credit Score:
> = 750 $ 42,370 $ 26,437 $ 29,224 $ 13,376 $ 3,811 $ 1,311 $ — $ — $ 116,529
650 - 749 57,120 28,451 24,900 7,378 4,179 1,457 — — 123,485
450 - 649 5,022 8,756 10,176 3,628 2,793 1,012 — — 31,387
300 - 449 — 24 18 16 — — — — 58
$ 104,512 $ 63,668 $ 64,318 $ 24,398 $ 10,783 $ 3,780 $ — $ — $ 271,459
Consumer and Other
Credit Score:
> = 750 $ 76,556 $ 13,487 $ 5,150 $ 3,536 $ 685 $ 1,613 $ 31,048 $ 28 $ 132,103
650 - 749 3,650 2,106 2,091 435 37 318 3,882 28 12,547
450 - 649 761 310 50 142 372 44 648 8 2,335
300 - 449 — — — — 457 — — — 457
$ 80,967 $ 15,903 $ 7,291 $ 4,113 $ 1,551 $ 1,975 $ 35,578 $ 64 $ 147,442
Grand Total $ 3,698,035 $ 1,728,793 $ 1,029,010 $ 615,700 $ 561,106 $ 953,757 $ 1,040,598 $ 2,069 $ 9,629,068
Through our loan portfolio evaluation process, we have identified certain loans for which the primary source of loan repayment is no longer a viable option, necessitating identifying these loans as CDAs. In most cases, these are loans in which the borrower is experiencing financial difficulty, which may or may not be classified as TDRs, but we believe will necessitate the operation or sale of the underlying collateral to provide substantially all of the repayment.
In estimating ECL, ASC 326 prescribes that if foreclosure is probable, a CDA is required to be measured at the fair value of collateral, but as a practical expedient, if foreclosure is not probable, fair value measurement is optional. For those CDA loans measured at the fair value of collateral, a credit loss expense is recorded for loan amounts in excess of fair value.
TOWNEBANK NOTES TO CONSOLIDATED FINANCIAL STATEMENTS
80
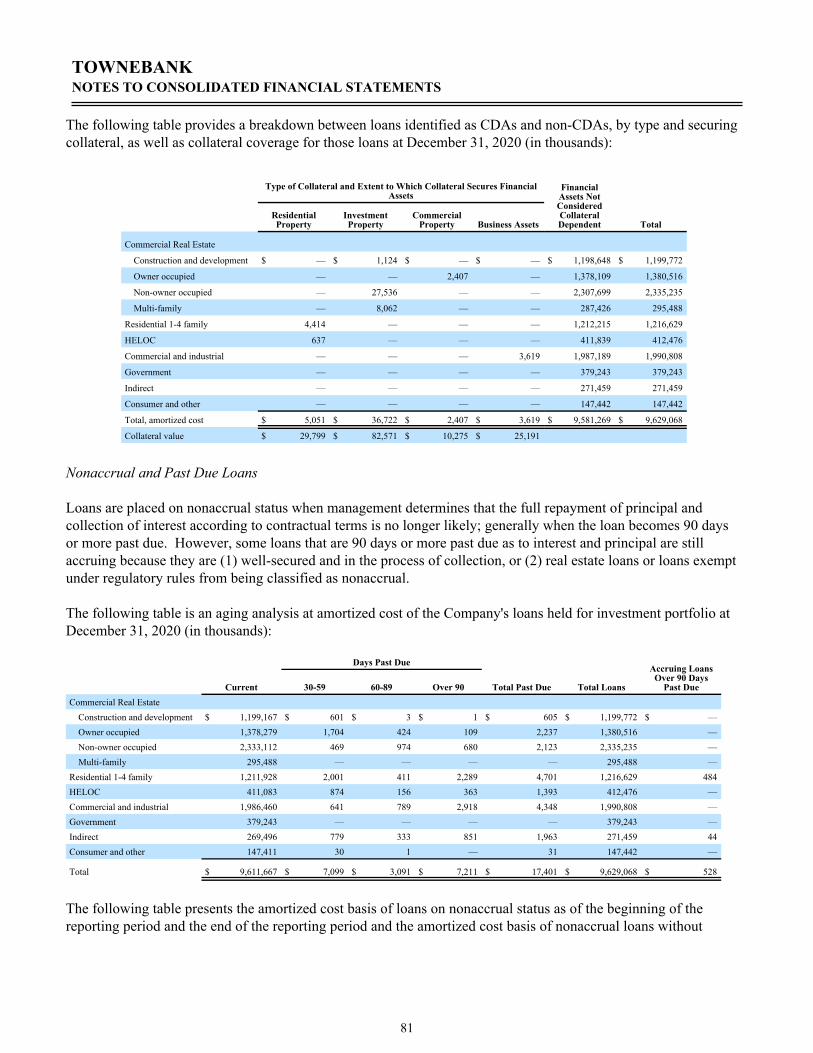
The following table provides a breakdown between loans identified as CDAs and non-CDAs, by type and securing collateral, as well as collateral coverage for those loans at December 31, 2020 (in thousands):
Type of Collateral and Extent to Which Collateral Secures Financial Assets
Financial Assets Not Considered Collateral Dependent
Residential Property
Investment Property
Commercial Property Business Assets Total
Commercial Real Estate
Construction and development $ — $ 1,124 $ — $ — $ 1,198,648 $ 1,199,772
Owner occupied — — 2,407 — 1,378,109 1,380,516
Non-owner occupied — 27,536 — — 2,307,699 2,335,235
Multi-family — 8,062 — — 287,426 295,488
Residential 1-4 family 4,414 — — — 1,212,215 1,216,629
HELOC 637 — — — 411,839 412,476
Commercial and industrial — — — 3,619 1,987,189 1,990,808
Government — — — — 379,243 379,243
Indirect — — — — 271,459 271,459
Consumer and other — — — — 147,442 147,442
Total, amortized cost $ 5,051 $ 36,722 $ 2,407 $ 3,619 $ 9,581,269 $ 9,629,068
Collateral value $ 29,799 $ 82,571 $ 10,275 $ 25,191
Nonaccrual and Past Due Loans
Loans are placed on nonaccrual status when management determines that the full repayment of principal and collection of interest according to contractual terms is no longer likely; generally when the loan becomes 90 days or more past due. However, some loans that are 90 days or more past due as to interest and principal are still accruing because they are (1) well-secured and in the process of collection, or (2) real estate loans or loans exempt under regulatory rules from being classified as nonaccrual.
The following table is an aging analysis at amortized cost of the Company's loans held for investment portfolio at December 31, 2020 (in thousands):
Days Past DueAccruing Loans
Over 90 Days Past DueCurrent 30-59 60-89 Over 90 Total Past Due Total Loans
Commercial Real EstateConstruction and development $ 1,199,167 $ 601 $ 3 $ 1 $ 605 $ 1,199,772 $ — Owner occupied 1,378,279 1,704 424 109 2,237 1,380,516 — Non-owner occupied 2,333,112 469 974 680 2,123 2,335,235 — Multi-family 295,488 — — — — 295,488 —
Residential 1-4 family 1,211,928 2,001 411 2,289 4,701 1,216,629 484 HELOC 411,083 874 156 363 1,393 412,476 — Commercial and industrial 1,986,460 641 789 2,918 4,348 1,990,808 — Government 379,243 — — — — 379,243 — Indirect 269,496 779 333 851 1,963 271,459 44 Consumer and other 147,411 30 1 — 31 147,442 —
Total $ 9,611,667 $ 7,099 $ 3,091 $ 7,211 $ 17,401 $ 9,629,068 $ 528
The following table presents the amortized cost basis of loans on nonaccrual status as of the beginning of the reporting period and the end of the reporting period and the amortized cost basis of nonaccrual loans without
TOWNEBANK NOTES TO CONSOLIDATED FINANCIAL STATEMENTS
81

specific reserves. Nonaccrual loans that are not individually assessed are included in collectively evaluated pools for which an ACL has been recorded. It also shows interest income recognized on nonaccrual loans (in thousands):
Nonaccrual Financial Assets Financial Assets 90 Days or More Past Due, Not on
Nonaccrual Status
Nonaccrual Financial Assets With No Specific
Reserve as of 12/31/2020
Interest Income RecognizedAs of 01/01/2020 As of 12/31/2020
Commercial Real Estate
Construction and development $ 43 $ — $ — $ — $ 8
Owner occupied 7,346 387 — 387 47
Non-owner occupied 221 1,163 — 694 98
Multi-family — — — — —
Residential 1-4 family 5,525 3,432 484 3,042 371
HELOC 1,214 1,072 — 1,071 114
Commercial and industrial 3,284 4,414 — 4,414 404
Government — — — — —
Indirect 976 717 45 890 135
Consumer and other 4 3 — 3 32
Total $ 18,613 $ 11,188 $ 529 $ 10,501 $ 1,209
Off-Balance-Sheet Credit Exposure
The Company maintains a separate allowance for credit losses from off-balance-sheet credit exposures, including unfunded loan commitments, which is included in other liabilities on the Consolidated Balance Sheets. The allowance for credit losses on off-balance-sheet credit exposures is adjusted as a provision for credit loss expense and included with the provision for credit loss expense on funded loans in the Consolidated Statements of Income. The estimate includes consideration of the likelihood that funding will occur and an estimate of ECLs on commitments expected to be funded over their estimated life, utilizing the same models and approaches for the Company's other loan portfolio segments described above, as these unfunded commitments share similar risk characteristics as our loan portfolio segments. The Company has identified the unfunded portion of certain lines of credit as unconditionally cancellable credit exposures, meaning the Company can cancel the unfunded commitment at any time. No credit loss estimate is reported for off-balance-sheet credit exposures that are unconditionally cancellable by the Company or for undrawn amounts under such arrangements that may be drawn prior to the cancellation of the arrangement. At December 31, 2020, the allowance for credit losses from off-balance-sheet credit exposures included in other liabilities was $9.24 million.
Loans - Pre ASC 326
Under the prior incurred loss methodology, loss contingencies were evaluated as: probable, reasonably possible, or remote. If, at the date of financial statement presentation, information was available that indicated an asset had been impaired and the amount of loss could be reasonably estimated, then an allowance for that loss could be recorded. Recording an allowance for a loss that was considered reasonably possible or remote was not permitted. With the adoption of ASC 326, the Company considers the lifetime potential for losses at the point of origination and records an allowance for that potential, at that point in time, removing the necessity of differentiation between the three loss contingency concepts and impairment. The following disclosures are presented under previously applicable GAAP.
TOWNEBANK NOTES TO CONSOLIDATED FINANCIAL STATEMENTS
82

The following table presents, by portfolio segment, the allowance for loan losses at December 31, 2019 (in thousands):
Real Estate
Construction Real Estate Commercial Consumer
Year Ended and Land Real Estate Multi- Real Estate and Industrial and Other
December 31, 2019 Development Commercial family Residential Business Loans Total
Allowance for loan losses:
Balance, beginning of period $ 6,171 $ 19,488 $ 1,011 $ 10,245 $ 8,669 $ 6,510 $ 52,094
Provision charged to expense 654 5,013 36 841 2,003 824 9,371
Losses charged off (43) (1,298) — (1,098) (984) (1,068) (4,491)
Recoveries 144 38 — 635 148 295 1,260
Balance, end of period $ 6,926 $ 23,241 $ 1,047 $ 10,623 $ 9,836 $ 6,561 $ 58,234
The following table presents, by portfolio segment, the allocation of the allowance for loan losses at December 31, 2019 (in thousands):
Real Estate
Construction Real Estate Commercial Consumer
and Land Real Estate Multi- Real Estate and Industrial and Other
December 31, 2019 Development Commercial family Residential Business Loans Total
Period-end balance allocated to:
Loans individually evaluated for impairment $ 16 $ 472 $ 39 $ 427 $ 267 $ 41 $ 1,262
Loans collectively evaluated for impairment 6,910 22,769 1,008 10,068 9,484 6,520 56,759
Loans acquired with deteriorated credit quality — — — 128 85 — 213
Balance, end of year $ 6,926 $ 23,241 $ 1,047 $ 10,623 $ 9,836 $ 6,561 $ 58,234
The following table presents, by portfolio segment, the Company's investment in loans at December 31, 2019 (in thousands):
Real Estate
Construction Real Estate Commercial Consumer
and Land Real Estate Multi- Real Estate and Industrial and Other
December 31, 2019 Development Commercial family Residential Business Loans Total
Ending balance: individually evaluated for impairment $ 1,415 $ 21,123 $ 3,941 $ 15,105 $ 5,383 $ 1,296 $ 48,263
Ending balance: collectively evaluated for impairment 1,118,463 3,464,328 233,254 1,619,314 1,568,892 314,683 8,318,934
Ending balance: loans acquired with deteriorated credit quality 655 26,925 5,846 18,665 — — 52,091
Ending Balance $ 1,120,533 $ 3,512,376 $ 243,041 $ 1,653,084 $ 1,574,275 $ 315,979 $ 8,419,288
TOWNEBANK NOTES TO CONSOLIDATED FINANCIAL STATEMENTS
83

The following table represents credit exposures by internally assigned grades as of December 31, 2019 (in thousands):
Real Estate
Construction Real Estate Commercial Consumer
and Land Real Estate Multi- Real Estate and Industrial and Other
December 31, 2019 Development Commercial family Residential Business Loans Total
Pass $ 1,106,773 $ 3,478,967 $ 239,099 $ 1,633,695 $ 1,560,041 $ 314,683 $ 8,333,258
Special Mention 12,613 15,155 692 4,295 6,752 — 39,507
Substandard 1,147 18,254 3,250 15,094 7,482 1,296 46,523
Doubtful — — — — — — —
Total $ 1,120,533 $ 3,512,376 $ 243,041 $ 1,653,084 $ 1,574,275 $ 315,979 $ 8,419,288
The following table includes an aging analysis of the recorded investment of past-due financing receivables as of December 31, 2019 (in thousands):
Accruing Loans
Loans Loans Loans 90 or Total Past More Than 90
30 - 59 Days 60 - 89 Days More Days Nonaccrual Due and Current Total Loans Days
December 31, 2019 Past Due Past Due Past Due Loans Nonaccruing Loans Receivable Past Due
Real estate construction and land development $ 240 $ 323 $ — $ 43 $ 606 $ 1,119,927 $ 1,120,533 $ —
Real estate commercial 1,238 199 45 7,513 8,995 3,503,381 3,512,376 —
Real estate multi-family — — — — — 243,041 243,041 —
Real estate residential 6,470 326 505 5,973 13,274 1,639,810 1,653,084 244
Commercial and industrial business loans 347 55 — 3,284 3,686 1,570,589 1,574,275 —
Consumer loans and other 1,289 148 65 624 2,126 313,853 315,979 65
Total $ 9,584 $ 1,051 $ 615 $ 17,437 $ 28,687 $ 8,390,601 $ 8,419,288 $ 309
The following table includes an aging analysis of the recorded investment of purchased impaired loans included in the table above (in thousands):
Loans Loans Loans 90 or 30 - 59 Days 60 - 89 Days More Days Total Past Current Total Loans
December 31, 2019 Past Due Past Due Past Due Due Loans Receivable
Real estate construction and land development $ 13 $ — $ — $ 13 $ 642 $ 655 Real estate commercial — — 45 45 26,880 26,925 Real estate multi-family — — — — 5,846 5,846 Real estate residential 313 129 260 702 17,963 18,665
Total $ 326 $ 129 $ 305 $ 760 $ 51,331 $ 52,091
TOWNEBANK NOTES TO CONSOLIDATED FINANCIAL STATEMENTS
84

Impaired Loans
The following tables include the recorded investment and unpaid principal balances for impaired financing receivables, excluding purchased impaired loans, with the associated allowance amount, if applicable, as of December 31, 2019 (in thousands):
YTDUnpaid Average Interest
Principal Recorded Specific Recorded IncomeDecember 31, 2019 Balance Balance Allowance Investment RecognizedLoans without a specific valuation allowanceReal estate - construction and land development $ 43 $ 43 $ — $ 48 $ 2 Real estate - commercial 8,226 8,058 — 8,500 396 Real estate - multi-family 2,852 2,852 — 2,852 127 Real estate - residential 1-4 family 7,211 6,999 — 7,029 322 Commercial and industrial business 3,500 3,213 — 3,255 206 Consumer and other loans — — — — — Total $ 21,832 $ 21,165 $ — $ 21,684 $ 1,053
Loans with a specific valuation allowanceReal estate - construction and land development $ 1,372 $ 1,372 $ 16 $ 1,386 $ 71 Real estate - commercial 13,216 13,065 472 13,395 737 Real estate - multi-family 1,089 1,089 39 1,124 71 Real estate - residential 1-4 family 8,423 8,106 427 9,114 509 Commercial and industrial business 2,277 2,170 267 2,293 131 Consumer and other loans 1,335 1,296 41 1,418 79 Total $ 27,712 $ 27,098 $ 1,262 $ 28,730 $ 1,598
Total impaired loansReal estate - construction and land development $ 1,415 $ 1,415 $ 16 $ 1,434 $ 73 Real estate - commercial 21,442 21,123 472 21,895 1,133 Real estate - multi-family 3,941 3,941 39 3,976 198 Real estate - residential 1-4 family 15,634 15,105 427 16,143 831 Commercial and industrial business 5,777 5,383 267 5,548 337 Consumer and other loans 1,335 1,296 41 1,418 79 Total $ 49,544 $ 48,263 $ 1,262 $ 50,414 $ 2,651
Included in the table above are accruing TDRs of $15.02 million, which the Company has designated as performing loans, while nonaccruing TDRs, which are also included in the above table of impaired loans, totaled $2.27 million.
NOTE 6: OTHER REAL ESTATE OWNED
The table below presents a summary of the activity related to OREO (in thousands):
Year Ended December 31,2020 2019
Beginning balance $ 15,360 $ 19,416 Additions and capital improvements 5,237 3,738 Sales (14,512) (8,041) Net change in valuation allowance (471) — Gain on sale and write-downs, net (588) 247
Ending balance $ 5,026 $ 15,360
As of December 31, 2020, the Company's recorded investment in OREO collateralized by residential real estate was $0.55 million. As of December 31, 2020, the Company's recorded investment in mortgage loans collateralized
TOWNEBANK NOTES TO CONSOLIDATED FINANCIAL STATEMENTS
85
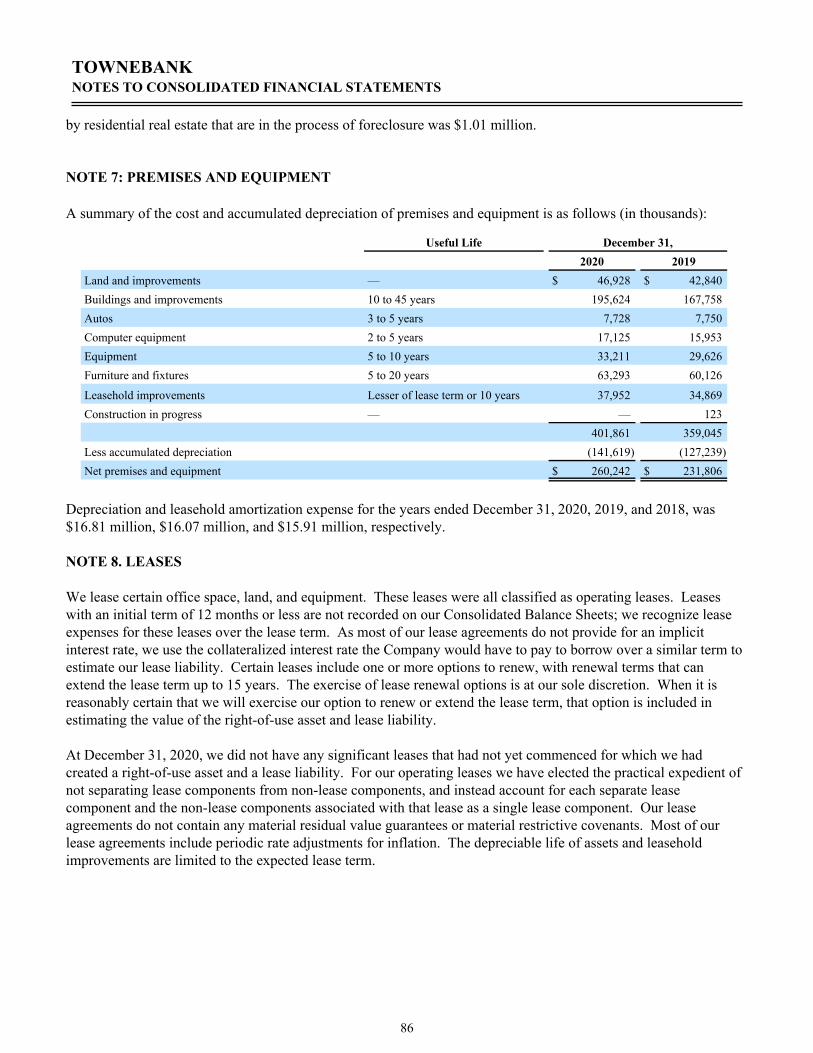
by residential real estate that are in the process of foreclosure was $1.01 million.
NOTE 7: PREMISES AND EQUIPMENT
A summary of the cost and accumulated depreciation of premises and equipment is as follows (in thousands):
Useful Life December 31,2020 2019
Land and improvements — $ 46,928 $ 42,840 Buildings and improvements 10 to 45 years 195,624 167,758 Autos 3 to 5 years 7,728 7,750 Computer equipment 2 to 5 years 17,125 15,953 Equipment 5 to 10 years 33,211 29,626 Furniture and fixtures 5 to 20 years 63,293 60,126
Leasehold improvements Lesser of lease term or 10 years 37,952 34,869 Construction in progress — — 123
401,861 359,045 Less accumulated depreciation (141,619) (127,239) Net premises and equipment $ 260,242 $ 231,806
Depreciation and leasehold amortization expense for the years ended December 31, 2020, 2019, and 2018, was $16.81 million, $16.07 million, and $15.91 million, respectively.
NOTE 8. LEASES
We lease certain office space, land, and equipment. These leases were all classified as operating leases. Leases with an initial term of 12 months or less are not recorded on our Consolidated Balance Sheets; we recognize lease expenses for these leases over the lease term. As most of our lease agreements do not provide for an implicit interest rate, we use the collateralized interest rate the Company would have to pay to borrow over a similar term to estimate our lease liability. Certain leases include one or more options to renew, with renewal terms that can extend the lease term up to 15 years. The exercise of lease renewal options is at our sole discretion. When it is reasonably certain that we will exercise our option to renew or extend the lease term, that option is included in estimating the value of the right-of-use asset and lease liability.
At December 31, 2020, we did not have any significant leases that had not yet commenced for which we had created a right-of-use asset and a lease liability. For our operating leases we have elected the practical expedient of not separating lease components from non-lease components, and instead account for each separate lease component and the non-lease components associated with that lease as a single lease component. Our lease agreements do not contain any material residual value guarantees or material restrictive covenants. Most of our lease agreements include periodic rate adjustments for inflation. The depreciable life of assets and leasehold improvements are limited to the expected lease term.
TOWNEBANK NOTES TO CONSOLIDATED FINANCIAL STATEMENTS
86

The following table presents a summary of the lease assets and liabilities as of the dates indicated:
Leases
December 31, December 31,
(In thousands) 2020 2019
Assets
Operating lease assets included in other assets $ 60,340 $ 47,515
Liabilities
Accrued liability operating leases included in other liabilities $ 64,161 $ 50,246
The following table presents a summary of activity related to leases for the year ended December 31, 2020 and 2019:
Lease CostYear Ended December 31,
(In thousands) 2020 2019Operating lease cost (1) included in occupancy expense $ 14,064 $ 14,400 Variable lease cost included in occupancy expense 655 656 Sublease income included in occupancy expense (82) (64) Net lease cost $ 14,637 $ 14,992 (1) Includes short-term leases, which are immaterial.
The following table presents lease liability maturities, by year, as of December 31, 2020:
Maturity of Lease Liabilities
(In thousands) Operating Leases (1)
2021 12,568
2022 10,457
2023 8,328
2024 6,451
2025 5,648
Thereafter 48,009
Total lease payments $ 91,461
Less: interest 27,300
Present value of lease liabilities $ 64,161 (1) Operating lease payments include $30.09 million related to options to extend lease terms that are reasonably certain of being exercised.
Note: Minimum lease payments exclude payments to landlords for real estate taxes and common area maintenance.
The following table presents the lease term and discount rate as of the dates indicated:
Lease Term and Discount Rate
Year Ended December 31,
2020 2019
Weighted - average remaining lease term - operating leases (in years) 13.05 12.01
Weighted - average discount rate - operating leases 4.82% 4.55%
The following table presents other information with regard to leases as of the dates indicated:
TOWNEBANK NOTES TO CONSOLIDATED FINANCIAL STATEMENTS
87

Other Information
(In thousands) Year Ended December 31,
2020 2019
Cash paid for amounts included in the measurement of lease liabilities
Operating cash flows for operating leases $ 11,659 $ 11,595
Related Party Transactions (1)
Rent expense included in occupancy expense $ 2,646 $ 2,806
(1) The Company rents space for various financial centers from companies associated with its directors.
Rental income for the year ended December 31, 2020, was $2.76 million, compared to $1.36 million for 2019, and $0.99 million for 2018. Future minimum rental income by year and in the aggregate, under noncancellable operating leases, was as follows at December 31, 2020 (in thousands):
2021 $ 3,903
2022 1,003
2023 590
2024 281
2025 54
Thereafter 82
$ 5,913
NOTE 9: GOODWILL AND INTANGIBLE ASSETS
The gross carrying amount and accumulated amortization for the Company's intangible assets (in thousands):
December 31,2020 2019
Gross CarryingAmount
AccumulatedAmortization
Gross CarryingAmount
AccumulatedAmortization
Intangible assets subject to amortization
Core deposit intangible $ 31,339 $ 19,288 $ 31,339 $ 14,933
Non-compete agreements 2,185 1,535 2,085 1,320
Customer lists 66,359 38,138 63,826 31,209
Total intangible assets subject to amortization 99,883 58,961 97,250 47,462 Intangible assets not subject to amortization
Trade names 1,380 — 1,380 —
Contractual agreements 3,231 — 3,231 —
Total intangible assets not subject to amortization 4,611 — 4,611 —
Total intangible assets $ 104,494 $ 58,961 $ 101,861 $ 47,462
The aggregate amortization expense for intangible assets with finite lives for the year ended December 31, 2020, was $11.50 million, compared to $12.37 million for 2019, and $11.71 million for 2018. The estimated aggregate annual amortization expense for each of the five years subsequent to December 31, 2020, is as follows: 2021, $10.43 million; 2022, $8.91 million; 2023, $7.25 million; 2024, $5.26 million; and 2025, $5.24 million.
TOWNEBANK NOTES TO CONSOLIDATED FINANCIAL STATEMENTS
88
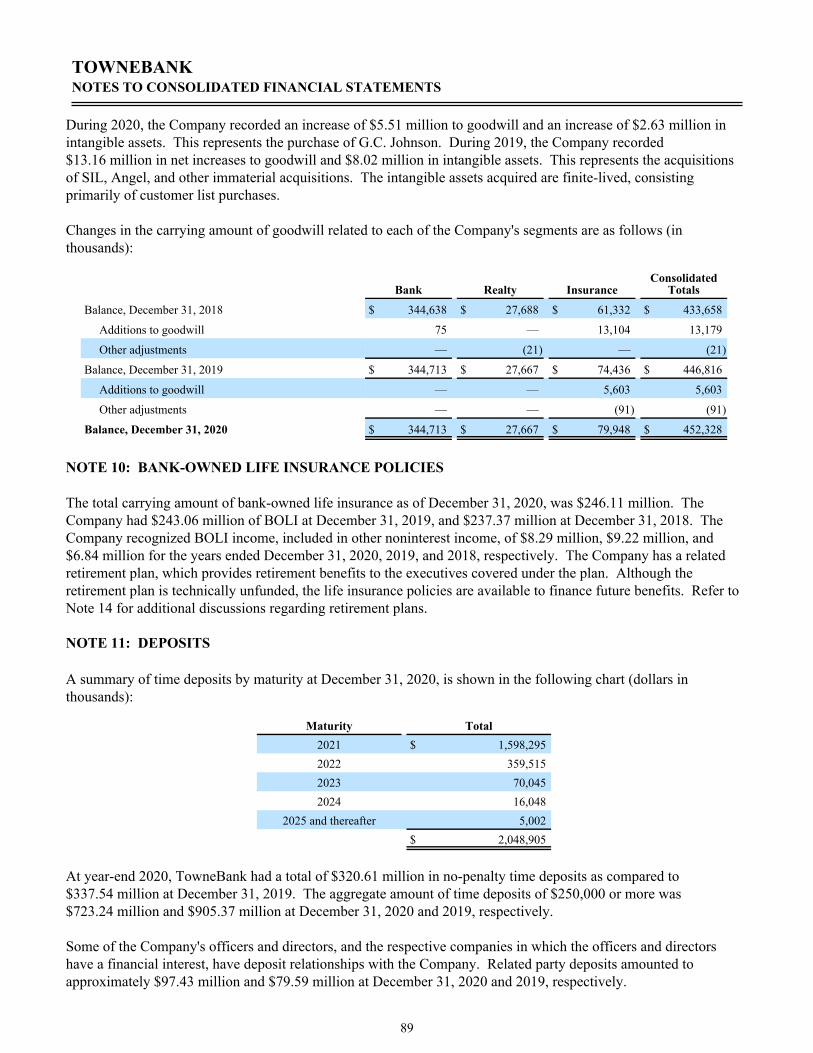
During 2020, the Company recorded an increase of $5.51 million to goodwill and an increase of $2.63 million in intangible assets. This represents the purchase of G.C. Johnson. During 2019, the Company recorded $13.16 million in net increases to goodwill and $8.02 million in intangible assets. This represents the acquisitions of SIL, Angel, and other immaterial acquisitions. The intangible assets acquired are finite-lived, consisting primarily of customer list purchases.
Changes in the carrying amount of goodwill related to each of the Company's segments are as follows (in thousands):
Bank Realty InsuranceConsolidated
Totals
Balance, December 31, 2018 $ 344,638 $ 27,688 $ 61,332 $ 433,658
Additions to goodwill 75 — 13,104 13,179
Other adjustments — (21) — (21)
Balance, December 31, 2019 $ 344,713 $ 27,667 $ 74,436 $ 446,816
Additions to goodwill — — 5,603 5,603
Other adjustments — — (91) (91)
Balance, December 31, 2020 $ 344,713 $ 27,667 $ 79,948 $ 452,328
NOTE 10: BANK-OWNED LIFE INSURANCE POLICIES
The total carrying amount of bank-owned life insurance as of December 31, 2020, was $246.11 million. The Company had $243.06 million of BOLI at December 31, 2019, and $237.37 million at December 31, 2018. The Company recognized BOLI income, included in other noninterest income, of $8.29 million, $9.22 million, and $6.84 million for the years ended December 31, 2020, 2019, and 2018, respectively. The Company has a related retirement plan, which provides retirement benefits to the executives covered under the plan. Although the retirement plan is technically unfunded, the life insurance policies are available to finance future benefits. Refer to Note 14 for additional discussions regarding retirement plans.
NOTE 11: DEPOSITS
A summary of time deposits by maturity at December 31, 2020, is shown in the following chart (dollars in thousands):
Maturity Total2021 $ 1,598,295 2022 359,515 2023 70,045 2024 16,048
2025 and thereafter 5,002 $ 2,048,905
At year-end 2020, TowneBank had a total of $320.61 million in no-penalty time deposits as compared to $337.54 million at December 31, 2019. The aggregate amount of time deposits of $250,000 or more was $723.24 million and $905.37 million at December 31, 2020 and 2019, respectively.
Some of the Company's officers and directors, and the respective companies in which the officers and directors have a financial interest, have deposit relationships with the Company. Related party deposits amounted to approximately $97.43 million and $79.59 million at December 31, 2020 and 2019, respectively.
TOWNEBANK NOTES TO CONSOLIDATED FINANCIAL STATEMENTS
89

NOTE 12: BORROWINGS
TowneBank is a member of the FHLB and may borrow funds based on criteria established by the FHLB. The FHLB may call these borrowings if the adjusted collateral balance falls below the borrowing level. The borrowing arrangements available from the FHLB could be either short- or long-term, depending on our related cost and needs.
Advances from the FHLB for the years ended December 31 are summarized as follows (dollars in thousands):
2020 2019Balance outstanding at end of year $ 456,038 $ 471,687 Average balance outstanding $ 753,739 $ 559,659 Maximum outstanding at any month-end $ 1,006,527 $ 799,989 Average interest rate during the year 1.11 % 1.74 %Average interest rate at end of year 0.99 % 1.74 %
The scheduled maturity dates, call dates, and related fixed interest rates on advances from the FHLB at December 31, 2020, are summarized as follows (dollars in thousands):
OutstandingMaturity Date Interest Rate Call/Reset Date Amount
11/15/2028 3.43% — $ 3,529 12/01/2028 2.83% — 2,509 01/07/2021 1.75% — 100,000 02/12/2021 1.67% — 100,000 08/13/2021 0.27% — 75,000 09/20/2021 0.26% — 25,000 09/20/2022 0.33% — 25,000 03/20/2023 0.37% — 25,000 09/20/2023 0.40% — 25,000 03/20/2024 0.43% — 25,000 09/20/2024 0.46% — 25,000 03/20/2025 0.54% — 25,000
$ 456,038
Information concerning securities sold under agreements to repurchase and federal funds purchased is summarized as follows (dollars in thousands):
2020 2019
Balance outstanding at end of year $ 68,981 $ 51,717
Average balance outstanding $ 60,952 $ 48,801
Maximum outstanding at any month-end $ 68,981 $ 55,681
Average interest rate during the year 0.27 % 0.72 %
Average interest rate at end of year 0.08 % 0.62 %
REPOs totaled $68.98 million at December 31, 2020. All REPOs are overnight short-term investments and are not insured by the FDIC. Securities pledged as collateral under these REPO financing arrangements cannot be sold or
TOWNEBANK NOTES TO CONSOLIDATED FINANCIAL STATEMENTS
90

repledged by the secured party and are therefore accounted for as a secured borrowing. Due to the overnight short-term nature of REPOs, potential risk due to a decline in the value of the pledged collateral is low. Collateral pledging requirements with REPOs are monitored daily. In addition, federal funds lines with other financial institutions of $155.00 million were available at December 31, 2020, for short-term funding needs. Federal funds purchased are overnight, unsecured borrowings.
At December 31, 2020 and 2019, the Company had an unused line of credit with the FHLB totaling $3.76 billion and $2.94 billion, respectively. The FHLB advances are secured by a blanket floating lien on certain 1-4 family residential, multi-family, HELOCs, second mortgages, and commercial mortgages with carrying values of $3.14 billion at December 31, 2020.
Further, the Company had loan participation lines and reverse repurchase agreements with various financial institutions available at December 31, 2020, which provide potential additional funding.
On July 17, 2017, the Company issued $250.0 million of fixed-to-floating rate subordinated notes due July 30, 2027, in a public offering. The Company received $247.07 million in net proceeds after deducting discounts and issuance costs. The subordinated notes accrue interest at a fixed rate of 4.50% for the first five years until July 30, 2022. From and including this date and for the remaining five years of the subordinated notes' term, interest will accrue at a floating rate of three-month LIBOR plus 2.550%. The Company may redeem the subordinated notes, in whole or in part, on or after July 30, 2022. At December 31, 2020, the carrying value of the notes totaled $249.06 million, compared to $248.46 million at December 31, 2019.
The CARES Act temporarily added a new product, titled the PPP, to the SBA's 7(a) Loan Program. The CARES Act provides for forgiveness of up to the full principal amount of qualifying loans guaranteed. TowneBank pledged PPP loans, on a non-recourse basis, and had $182.85 million in funding outstanding under the Federal Reserve's PPP Lending Facility at December 31, 2020.
NOTE 13: COMMITMENTS
TowneBank is a party to financial instruments with off-balance-sheet risk in the normal course of business to meet the financing needs of its customers. These financial instruments include commitments to extend credit and standby letters of credit. These instruments involve, to varying degrees, elements of credit risk, which have not been recognized in the balance sheet. The contract amount of these instruments reflects the extent of the Company's involvement or "credit risk."
Our exposure to credit loss in the event of nonperformance by the other party to the financial instrument for commitments to extend credit and standby letters of credit is represented by the contractual amount of those instruments. The Company uses the same credit policies in making commitments and conditional obligations as it does for on-balance-sheet instruments. Unless noted otherwise, collateral or other security is required to support financial instruments with credit risk. In 2020, with the adoption of ASC 326, the Company began recording an allowance for credit losses from off-balance-sheet credit exposures. At December 31, 2020, our allowance for credit losses from off-balance-sheet credit exposures, included in other liabilities was $9.24 million.
TOWNEBANK NOTES TO CONSOLIDATED FINANCIAL STATEMENTS
91

Our contractual amounts are as follows (in thousands):
December 31, 2020 2019
Financial instruments whose contract amounts represent credit risk:
Commitments to extend credit $ 3,693,351 $ 3,094,615
Standby letters of credit 134,000 140,630
$ 3,827,351 $ 3,235,245
Commitments to extend credit are agreements to lend to a customer as long as there is not a violation of any condition established in the contract. Commitments generally have fixed expiration dates or other termination clauses and may require payment of a fee. Since many of the commitments are expected to expire without being drawn upon, the total commitment amounts do not necessarily represent future cash requirements. The Company evaluates each customer's creditworthiness on a case-by-case basis. The amount of collateral obtained, if deemed necessary upon extension of credit, is based on management's credit evaluation of the counter-party. Collateral held varies but may include accounts receivable, inventory, property, plant and equipment, income-producing commercial properties, and real estate.
Standby letters of credit are conditional commitments issued to guarantee performance of a customer to a third party. The letters of credit are primarily issued to support public and private borrowing arrangements. The credit risk involved in issuing letters of credit is essentially the same as that involved in extending loan facilities to customers. Collateral supporting those commitments is generally held, if deemed necessary. The Company provides an allowance for estimated losses from such provisions that management considered adequate at December 31, 2020. Management does not anticipate any material losses will arise from additional disbursements of the aforementioned lines or standby letters of credit.
Additionally, the Company had $2.18 billion in mortgage loans sold to investors with estimated recourse and warranty provisions totaling $82.07 million as of December 31, 2020.
NOTE 14: RETIREMENT PLANS
Defined Contribution Plans
The Company has a defined contribution 401(k) plan. All employees who are at least 18 years of age and have completed one month of service are eligible to participate. Under the plan, employees may contribute a percentage of their annual salary, subject to statutory limitations, and the Company will make a discretionary match of the employees' contributions up to 6% of their salary. The Company matched employee contributions up to 3.0% in 2020, 2019, and 2018. The Company may also make an additional discretionary contribution; there were no discretionary contributions for the years ended December 31, 2020, 2019, or 2018. The Company made matching contributions of $5.06 million, $4.77 million, and $4.58 million for the years ended December 31, 2020, 2019, and 2018, respectively.
The Company has a non-qualified deferred compensation plan that allows certain executives, senior officers, and other employees to defer payment of up to 100% of their base salary and annual bonus. The Company has the option to match an employee's combined non-qualified deferred compensation and 401(k) deferrals up to a maximum of 6% of his or her salary. The Company does not match contributions made by employees who are participants in the SERP, described below.
The funds for the non-qualified deferred compensation plan are held in a rabbi trust and invested in certificates of deposit, which are included in interest-bearing deposits on the balance sheet. Changes in the obligation are
TOWNEBANK NOTES TO CONSOLIDATED FINANCIAL STATEMENTS
92

recorded in compensation expense, which resulted in an increase in expenses of $0.38 million, $0.46 million, and $0.43 million for the years ended December 31, 2020, 2019, and 2018, respectively. The Company did not make matching contributions to the plan for the years ended December 31, 2020, 2019, or 2018.
Retirement Plans
The Company has a noncontributory, unfunded SERP for certain officers and key employees. The SERP is intended to provide retirement benefits and postretirement health benefits to individuals covered under the plan. The SERP agreements with the officers provide that upon attainment of retirement age, generally at age 65, the participating officer will be entitled to receive a retirement benefit equal to either (i) a designated percentage, ranging from 30% to 50% of their base salary depending on their level of seniority, with an annual 4% increase until retirement, or (ii) a fixed targeted benefit amount. The retirement benefit is payable over a 10-year, 15-year, or 20-year period, beginning upon the later of separation of service or the attainment of contractual retirement age. The SERP agreements provide for an annual vesting schedule until the participating officer reaches retirement age. In the case of a participating officer's voluntary termination of employment, disability, or termination for cause, the annual amount payable under the SERP is equal to the amount of the vested benefit earned as of the date of termination of employment. In the case of involuntary termination without cause or termination of employment for good reason by the participating officer, the participating officer becomes fully vested in the full retirement benefit. Upon termination of employment, payment of the retirement benefit generally does not begin until the participating officer reaches the designated retirement age set forth in the SERP agreement. In the event of death, the full amount of the retirement benefit is payable. We also provide postretirement benefits other than pensions for certain employees, which include health care, dental care, Medicare Part B reimbursement and life insurance benefits. Benefits under this plan are accounted for under the guidance of ASC 715 Compensation - Retirement Benefits.
TOWNEBANK NOTES TO CONSOLIDATED FINANCIAL STATEMENTS
93

The following table sets forth changes in benefit obligations and financial data relative to the retirement plans. The accrued liability is recorded on the Consolidated Balance Sheets as a component of other liabilities (in thousands):
SERP Other Postretirement BenefitsDecember 31, 2020 2019 2020 2019Change in benefit obligationBenefit obligation, beginning of year $ 45,704 $ 35,524 $ 1,464 $ 1,385 Service cost 4,117 4,484 — — Interest cost 1,281 1,268 40 45 Net amortization 1,098 (57) 39 31 Benefits paid (1,785) (976) (18) (20) Prior service cost 558 2,704 — — Net actuarial (gain) loss (367) 2,757 (29) 23 Benefit obligation, end of year $ 50,606 $ 45,704 $ 1,496 $ 1,464 Change in plan assetsFair value of plan assets, beginning of year — — — — Employer contributions 1,785 976 18 20 Benefits paid (1,785) (976) (18) (20) Fair value of plan assets, end of year $ — $ — $ — $ — Funded status, end of year $ (50,606) $ (45,704) $ (1,496) $ (1,464) Accumulated benefit obligation, end of year $ 45,846 $ 41,073 $ 1,496 $ 1,464 Amounts recognized in other comprehensive
income, pretaxPrior service cost $ 558 $ 2,704 $ — $ — Net actuarial (gain) loss $ (367) $ 2,757 $ (29) $ 23
The components of the net periodic benefit cost are as follows (in thousands):
SERP Other Postretirement Benefits2020 2019 2018 2020 2019 2018
Service cost $ 4,117 $ 4,484 $ 3,096 $ — $ — $ — Interest cost 1,281 1,268 1,429 40 45 59 Prior service cost 675 613 305 — — — Net amortization 423 (670) 32 39 31 52 Net periodic benefit cost $ 6,496 $ 5,695 $ 4,862 $ 79 $ 76 $ 111
The service cost component of net periodic benefit costs is included in salaries and employee benefits. All other components of net periodic benefit costs are included in other expenses.
Amounts recognized as a component of accumulated other comprehensive income that have not yet been recognized as a component of net periodic benefit cost consist of the following (in thousands):
SERP Other Postretirement BenefitsDecember 31, 2020 2019 2020 2019Prior service cost $ 4,004 $ 4,120 $ — $ — Net actuarial (gain) loss 1,352 1,045 126 154 Deferred tax benefit (expense) (1,187) (1,149) (28) (34) Amounts included in accumulated other comprehensive
income, net of tax $ 4,169 $ 4,016 $ 98 $ 120
TOWNEBANK NOTES TO CONSOLIDATED FINANCIAL STATEMENTS
94

Pre-tax amounts recorded in accumulated other comprehensive income as of December 31, 2020, that are expected to be recognized as a component of our net periodic benefit cost in 2021 consist of the following (in thousands):
OtherPostretirement
SERP BenefitsNet actuarial (gain) loss $ 146 $ 11 Prior service cost $ 684 $ —
The Company used certain weighted average assumptions to determine benefit obligations and net benefit costs, including discount rate and rate of increase in future compensation levels. The discount rate used to determine net periodic benefit cost and benefit obligation of the SERP was 2.78% in 2020, 3.14% in 2019, and 4.45% in 2018. The rate of increase in future compensation levels used was 4.0% in 2020, 2019, and 2018. The discount rate used to determine net periodic benefit cost and benefit obligation of other postretirement benefits was 2.78% in 2020, 3.14% in 2019, and 4.45% in 2018. When estimating the discount rate, we review yields available on high-quality, fixed-income debt instruments and use a yield curve model from which the discount rate is derived by applying the projected benefit payments under the plan to points on a published yield curve.
The following table sets forth expected future benefit payments, which include expected future service, for the periods indicated (in thousands):
OtherPostretirement
Year SERP Benefits2021 $ 2,763 $ 57 2022 2,891 61 2023 3,211 64 2024 3,136 68 2025 3,450 70
2026-2030 20,848 420
In conjunction with its acquisition of Paragon, the Company assumed the liabilities related to Paragon's existing non-qualifying supplemental retirement contractual agreements with several key executives. The executives were fully vested in their benefits prior to the acquisition. The agreements typically require a fixed retirement benefit paid over a 20-year period following retirement.
The agreements are accounted for under ASC 710, Compensation - General. The following table sets forth changes in benefit obligations and financial data relative to the retirement plans. The accrued liability is recorded on the Consolidated Balance Sheets as a component of other liabilities (in thousands):
December 31, 2020 2019
Benefit obligation, beginning of year $ 3,989 $ 3,571
Service cost 647 1,006
Interest cost 109 102
Benefits paid (122) (690)
Benefit obligation, end of year $ 4,623 $ 3,989
TOWNEBANK NOTES TO CONSOLIDATED FINANCIAL STATEMENTS
95
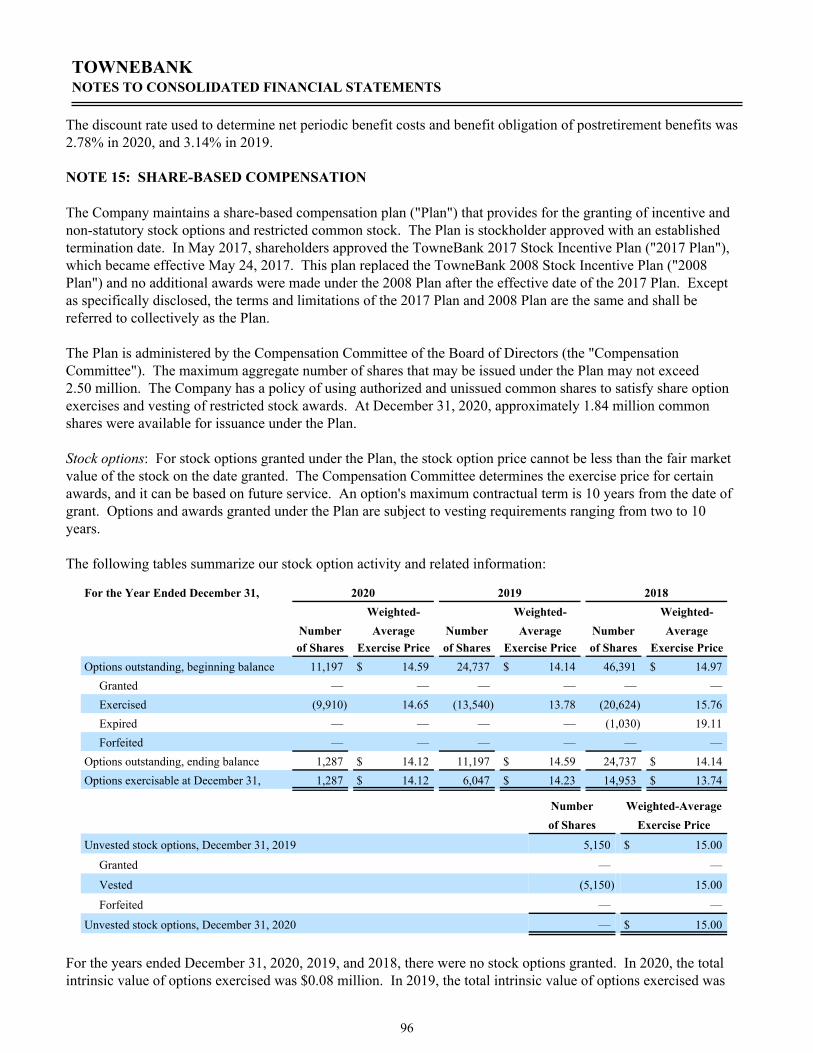
The discount rate used to determine net periodic benefit costs and benefit obligation of postretirement benefits was 2.78% in 2020, and 3.14% in 2019.
NOTE 15: SHARE-BASED COMPENSATION
The Company maintains a share-based compensation plan ("Plan") that provides for the granting of incentive and non-statutory stock options and restricted common stock. The Plan is stockholder approved with an established termination date. In May 2017, shareholders approved the TowneBank 2017 Stock Incentive Plan ("2017 Plan"), which became effective May 24, 2017. This plan replaced the TowneBank 2008 Stock Incentive Plan ("2008 Plan") and no additional awards were made under the 2008 Plan after the effective date of the 2017 Plan. Except as specifically disclosed, the terms and limitations of the 2017 Plan and 2008 Plan are the same and shall be referred to collectively as the Plan.
The Plan is administered by the Compensation Committee of the Board of Directors (the "Compensation Committee"). The maximum aggregate number of shares that may be issued under the Plan may not exceed 2.50 million. The Company has a policy of using authorized and unissued common shares to satisfy share option exercises and vesting of restricted stock awards. At December 31, 2020, approximately 1.84 million common shares were available for issuance under the Plan.
Stock options: For stock options granted under the Plan, the stock option price cannot be less than the fair market value of the stock on the date granted. The Compensation Committee determines the exercise price for certain awards, and it can be based on future service. An option's maximum contractual term is 10 years from the date of grant. Options and awards granted under the Plan are subject to vesting requirements ranging from two to 10 years.
The following tables summarize our stock option activity and related information:
For the Year Ended December 31, 2020 2019 2018Weighted- Weighted- Weighted-
Number Average Number Average Number Averageof Shares Exercise Price of Shares Exercise Price of Shares Exercise Price
Options outstanding, beginning balance 11,197 $ 14.59 24,737 $ 14.14 46,391 $ 14.97 Granted — — — — — — Exercised (9,910) 14.65 (13,540) 13.78 (20,624) 15.76 Expired — — — — (1,030) 19.11 Forfeited — — — — — —
Options outstanding, ending balance 1,287 $ 14.12 11,197 $ 14.59 24,737 $ 14.14 Options exercisable at December 31, 1,287 $ 14.12 6,047 $ 14.23 14,953 $ 13.74
Number Weighted-Averageof Shares Exercise Price
Unvested stock options, December 31, 2019 5,150 $ 15.00
Granted — —
Vested (5,150) 15.00
Forfeited — —
Unvested stock options, December 31, 2020 — $ 15.00
For the years ended December 31, 2020, 2019, and 2018, there were no stock options granted. In 2020, the total intrinsic value of options exercised was $0.08 million. In 2019, the total intrinsic value of options exercised was
TOWNEBANK NOTES TO CONSOLIDATED FINANCIAL STATEMENTS
96

$0.18 million. In 2018, the total intrinsic value of options exercised was $0.29 million. Additional information pertaining to options outstanding at December 31, 2020, is as follows:
Weighted-AverageNumber Weighted-Average Aggregate Remainingof Shares Exercise Price Intrinsic Value Contractual Life
Options outstanding 1,287 $ 14.12 $ 12,046 .1492Options vested or expected to vest 1,287 $ 14.12 $ 12,046 .1492Options exercisable 1,287 $ 14.12 $ 12,046 .1492
The grant-date fair value of each option grant is estimated using the Black-Scholes option pricing model. Use of a valuation model requires management to make certain assumptions with respect to selected model inputs. Expected volatility was calculated based on the historical volatility of the Company's stock over the most recent period of time equal to the expected term of the option. The average expected life was based on the contractual term of the option and expected employee exercise and post-vesting employment termination behavior based on historical patterns. The risk-free interest rate is based on the U.S. Treasury zero-coupon issues with a remaining term equal to the expected life assumed at the date of grant. Forfeitures are estimated based on historical voluntary termination behavior.
For the years ended December 31, 2020, 2019, and 2018, the tax benefit on cash paid for stock options exercised was $0.02 million, $0.04 million, and $0.06 million, respectively. Compensation expense related to stock options for the years ended December 31, 2020, 2019, and 2018, was $0.02 million, $0.02 million, and $0.02 million, respectively. As of December 31, 2020, there was no unrecognized compensation cost related to unvested stock option awards.
Restricted stock awards ("RSAs") and restricted stock units ("RSUs"): Under the Plan, recipients of RSAs have full voting rights and are generally entitled to dividends on the common stock. RSAs issued under the 2008 Plan are also entitled to dividends as they are paid. Under the 2017 Plan, dividends on RSAs are accumulated and retained for the grantee by the Company until the stock vests. The accumulated cash and stock dividends on restricted stock awards are distributed with the award at vesting. Recipients of RSUs are entitled to receive shares of common stock after the applicable restrictions lapse. Recipients of RSUs are not entitled to receive cash dividends in respect of the underlying common stock during the period the RSUs are outstanding, and are not entitled to voting rights. RSAs granted under the Plan are generally subject to vesting requirements ranging from two to 10 years. The shares are subject to forfeiture if vesting and other contractual provision requirements are not met. Generally, the value of RSAs and RSUs will equal the fair value of our common stock on the date of grant and the expense is recognized over the vesting period.
The following chart shows a summary of activity for RSAs and RSUs, assuming the weighted-average price being the weighted-average fair value at the date of grant for the year ended December 31, 2020:
Restricted Stock Awards Restricted Stock UnitsWeighted- Weighted-
Number Average Number Averageof Shares Price of Shares Price
Unvested, beginning balance 511,174 $ 27.15 84,844 $ 27.54 Granted — — 120,120 18.68 Vested (215,666) 26.54 (17,826) 27.43 Forfeited (5,033) 29.39 (7,169) 27.90
Unvested, ending balance 290,475 $ 27.42 179,969 $ 21.63
TOWNEBANK NOTES TO CONSOLIDATED FINANCIAL STATEMENTS
97

Compensation expense related to awards for the years ended December 31, 2020, 2019, and 2018, was $4.83 million, $5.77 million, and $4.05 million, respectively. The total fair value of RSAs vested during 2020, 2019, and 2018 was $5.60 million, $4.10 million, and $2.61 million, respectively. The total fair value of RSUs vested during 2020 was $0.66 million, with none vesting in prior years. No RSUs were issued prior to 2018. As of December 31, 2020, there was $4.04 million of total unrecognized compensation cost related to unvested RSAs; that cost is expected to be recognized over a period of 1.58 years. As of December 31, 2020, there was $3.38 million of total unrecognized compensation cost related to unvested RSUs; that cost is expected to be recognized over a period of 3.33 years.
The Company has a directors' deferred compensation plan whereby the directors may elect to defer up to 100% of their directors' fees. All deferred compensation is invested in the Company's common stock and is held in a rabbi trust. The stock is held in the nominee name of the trustee, and the principal and earnings of the trust are held separate and apart from other funds of the Company, and are used exclusively for the uses and purposes of the deferred compensation agreement. The accounts of the trust have been consolidated in the financial statements of the Company with common stock reported separately in a manner similar to treasury stock (that is, changes in fair value are not recognized) and a corresponding deferred compensation obligation reflected in additional paid-in capital of $16.97 million and $15.56 million at December 31, 2020 and 2019, respectively.
NOTE 16: STOCK PURCHASE AND DIVIDEND REINVESTMENT PLAN, AND DIVIDEND RESTRICTIONS
The Company has a Member Stock Purchase and Dividend Reinvestment Plan to raise additional capital by providing a convenient and cost-effective way for shareholders, customers, and employees to purchase shares of TowneBank common stock. In connection with the member stock purchase component of the plan for the year ended December 31, 2020, the Company entered the open market and acquired 123,467 shares at an average price of $20.03 per share. In connection with the dividend reinvestment component of the plan for the year ended December 31, 2020, the Company entered the open market and acquired 247,591 shares at an average price of $20.26 per share.
In connection with the member stock purchase component of the plan for the year ended December 31, 2019, the Company entered the open market and acquired 98,279 shares at an average price of $27.30 per share. In connection with the dividend reinvestment component of the plan for the year ended December 31, 2019, the Company entered the open market and acquired 208,691 shares at an average price of $26.62 per share.
TowneBank, as a Virginia banking corporation, may pay cash dividends only out of retained earnings. In February, May, August, and November 2020, the Company declared quarterly cash dividends of $0.18 per common share. In February 2019, the Company declared a quarterly cash dividend of $0.16 per common share. In May, August, and November 2019, the Company declared quarterly cash dividends of $0.18 per common share. In February 2018, the Company declared a quarterly cash dividend of $0.14 per common share. In May, August, and November 2018, the Company declared quarterly cash dividends of $0.16 per common share. The quarterly dividends were paid on January 12, 2018; April 10, 2018; July 10, 2018; October 10, 2018; January 11, 2019; April 10, 2019; July 10, 2019; October 10, 2019; January 10, 2020; April 10, 2020; July 10, 2020; October 9 2020; and January 11, 2021.
Declaration of future cash dividends will depend on our earnings, our capital position, and other factors. All dividends paid are limited by the requirement to meet capital guidelines issued by regulatory authorities, and future declarations are subject to financial performance and regulatory requirements.
TOWNEBANK NOTES TO CONSOLIDATED FINANCIAL STATEMENTS
98
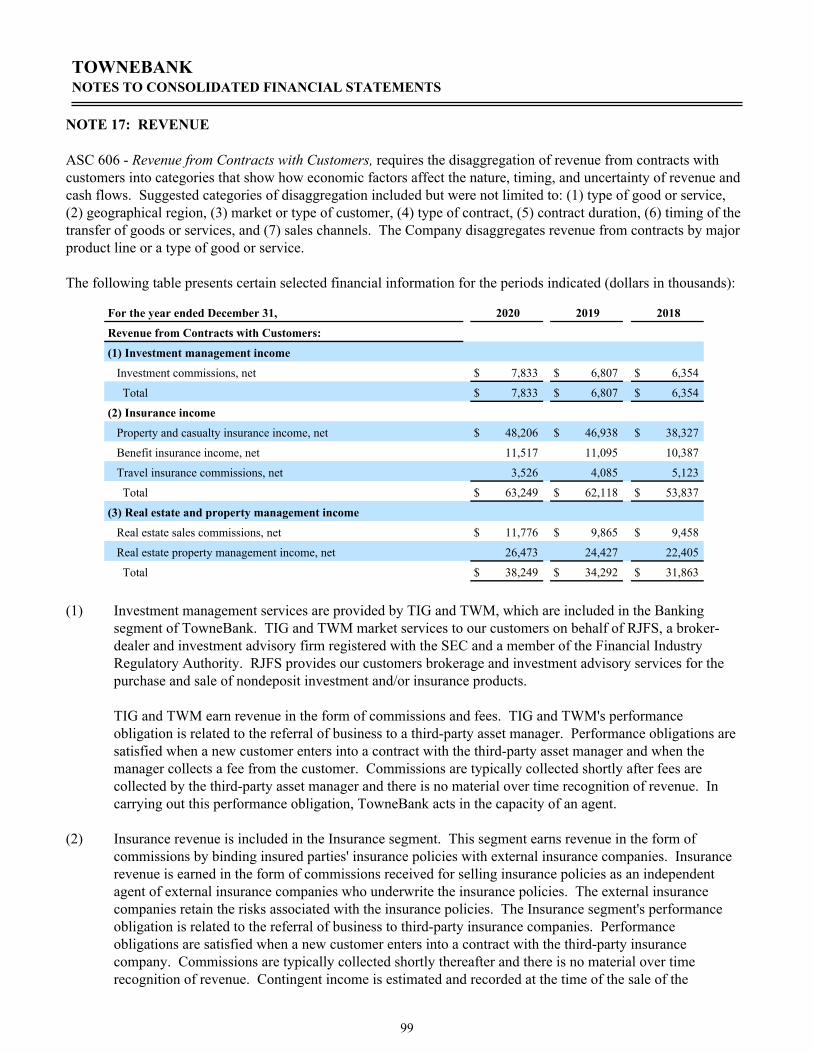
NOTE 17: REVENUE
ASC 606 - Revenue from Contracts with Customers, requires the disaggregation of revenue from contracts with customers into categories that show how economic factors affect the nature, timing, and uncertainty of revenue and cash flows. Suggested categories of disaggregation included but were not limited to: (1) type of good or service, (2) geographical region, (3) market or type of customer, (4) type of contract, (5) contract duration, (6) timing of the transfer of goods or services, and (7) sales channels. The Company disaggregates revenue from contracts by major product line or a type of good or service.
The following table presents certain selected financial information for the periods indicated (dollars in thousands):
For the year ended December 31, 2020 2019 2018
Revenue from Contracts with Customers:
(1) Investment management income
Investment commissions, net $ 7,833 $ 6,807 $ 6,354
Total $ 7,833 $ 6,807 $ 6,354
(2) Insurance income
Property and casualty insurance income, net $ 48,206 $ 46,938 $ 38,327
Benefit insurance income, net 11,517 11,095 10,387
Travel insurance commissions, net 3,526 4,085 5,123
Total $ 63,249 $ 62,118 $ 53,837
(3) Real estate and property management income
Real estate sales commissions, net $ 11,776 $ 9,865 $ 9,458
Real estate property management income, net 26,473 24,427 22,405
Total $ 38,249 $ 34,292 $ 31,863
(1) Investment management services are provided by TIG and TWM, which are included in the Banking segment of TowneBank. TIG and TWM market services to our customers on behalf of RJFS, a broker-dealer and investment advisory firm registered with the SEC and a member of the Financial Industry Regulatory Authority. RJFS provides our customers brokerage and investment advisory services for the purchase and sale of nondeposit investment and/or insurance products.
TIG and TWM earn revenue in the form of commissions and fees. TIG and TWM's performance obligation is related to the referral of business to a third-party asset manager. Performance obligations are satisfied when a new customer enters into a contract with the third-party asset manager and when the manager collects a fee from the customer. Commissions are typically collected shortly after fees are collected by the third-party asset manager and there is no material over time recognition of revenue. In carrying out this performance obligation, TowneBank acts in the capacity of an agent.
(2) Insurance revenue is included in the Insurance segment. This segment earns revenue in the form of commissions by binding insured parties' insurance policies with external insurance companies. Insurance revenue is earned in the form of commissions received for selling insurance policies as an independent agent of external insurance companies who underwrite the insurance policies. The external insurance companies retain the risks associated with the insurance policies. The Insurance segment's performance obligation is related to the referral of business to third-party insurance companies. Performance obligations are satisfied when a new customer enters into a contract with the third-party insurance company. Commissions are typically collected shortly thereafter and there is no material over time recognition of revenue. Contingent income is estimated and recorded at the time of the sale of the
TOWNEBANK NOTES TO CONSOLIDATED FINANCIAL STATEMENTS
99

insurance policy to the extent that it is probable that there will not be a material amount of the income reversed. In carrying out this performance obligation, TowneBank acts in the capacity of an agent.
(3) Real estate and property management revenue is mainly in the form of commission, fee, and title income. The revenue is earned on both residential and commercial properties. Real estate and property management revenues fall within the Realty segment. Towne Realty, LLC, provides real estate services and residential and title insurance. Revenue is recognized as commissions and fee income are received. Performance obligations are satisfied with the receipt of commissions and fee income and there is no material over time recognition of revenue.
TowneBank's performance obligation related to the property management business is to market the property, take reservations (including collection of rent) and provide facility management services. The performance obligation to take reservations is satisfied when a customer makes a booking. Facility management services obligations are ongoing until a customer vacates a property. Fees are typically collected half upon booking and half upon a customer vacating a property. Materially all of the value of the performance obligation is related to the booking of the reservation; therefore, the Company recognizes the commission at the time the reservation is confirmed via the receipt of deposit. In carrying out these performance obligations, TowneBank acts in the capacity of an agent.
Remaining performance obligations related to ASC 606 application to the above revenue streams represent performance obligations with an original contract term greater than one year, which are fully or partially unsatisfied at the end of the period. The Company applies the practical expedient in ASC paragraph 606-10-50-14(a) and does not disclose information about remaining performance obligations that are part of a contract with an original expected duration of one year or less. The timing of revenue billings and cash collections may result in contract assets (the Company performing on its obligations prior to receiving payment unrelated to the passage of time) and contract liabilities (the Company receiving payment from a customer prior to performing on its obligation to that customer) on the Consolidated Balance Sheets.
In 2020, the Company recorded a provision for credit losses related to future reservations of resort properties recorded in real estate property management income and a provision for credit losses related to property and casualty insurance receivables of $0.22 million and $0.42 million, respectively. The Company sold Red Sky, a travel insurance joint venture, in third quarter 2020, at a pre-tax gain of $6.52 million, after distributions to noncontrolling interests. Red Sky was our only source of travel insurance commission, and we do not anticipate a future income stream from this line of insurance.
The Company had no material contract assets or contract liabilities recorded on the Consolidated Balance Sheets as of December 31, 2020.
This disclosure includes only revenue from contracts with third-party customers. See Note 28 for additional information regarding other revenue streams, primarily from revenue between the Company's consolidated subsidiaries and lines of business, in addition to those included in the table above.
TOWNEBANK NOTES TO CONSOLIDATED FINANCIAL STATEMENTS
100
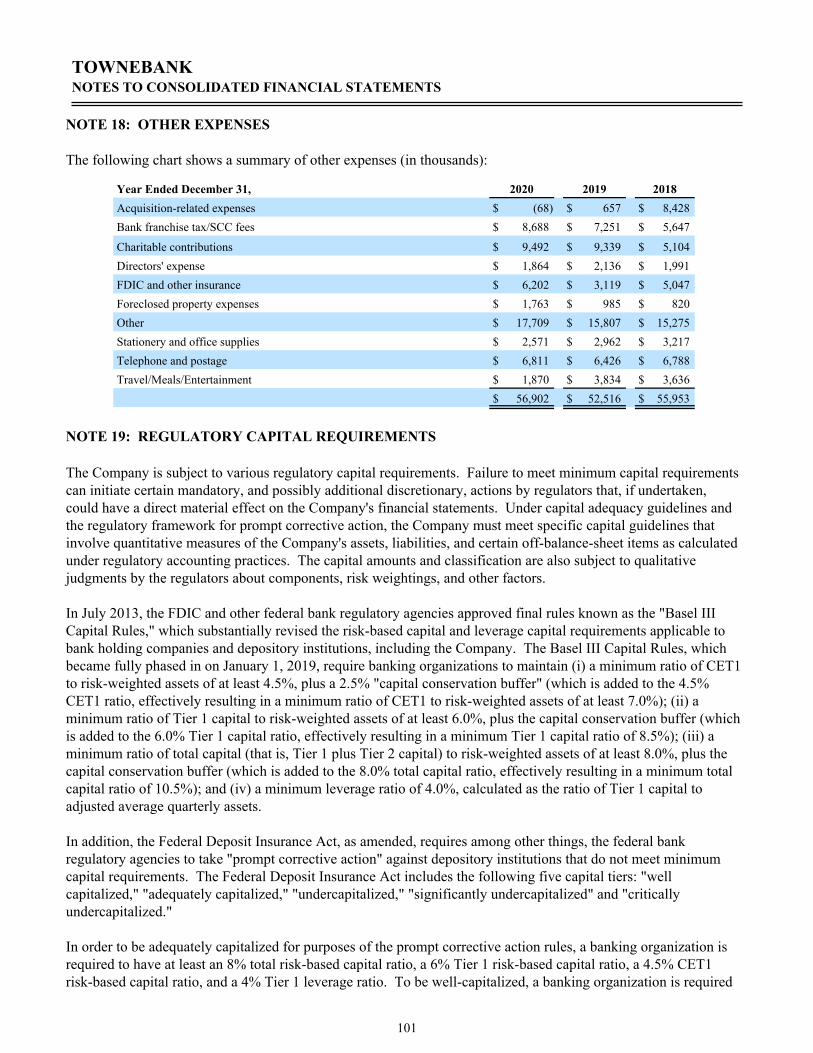
NOTE 18: OTHER EXPENSES
The following chart shows a summary of other expenses (in thousands):
Year Ended December 31, 2020 2019 2018Acquisition-related expenses $ (68) $ 657 $ 8,428 Bank franchise tax/SCC fees $ 8,688 $ 7,251 $ 5,647
Charitable contributions $ 9,492 $ 9,339 $ 5,104 Directors' expense $ 1,864 $ 2,136 $ 1,991 FDIC and other insurance $ 6,202 $ 3,119 $ 5,047 Foreclosed property expenses $ 1,763 $ 985 $ 820 Other $ 17,709 $ 15,807 $ 15,275 Stationery and office supplies $ 2,571 $ 2,962 $ 3,217 Telephone and postage $ 6,811 $ 6,426 $ 6,788 Travel/Meals/Entertainment $ 1,870 $ 3,834 $ 3,636
$ 56,902 $ 52,516 $ 55,953
NOTE 19: REGULATORY CAPITAL REQUIREMENTS
The Company is subject to various regulatory capital requirements. Failure to meet minimum capital requirements can initiate certain mandatory, and possibly additional discretionary, actions by regulators that, if undertaken, could have a direct material effect on the Company's financial statements. Under capital adequacy guidelines and the regulatory framework for prompt corrective action, the Company must meet specific capital guidelines that involve quantitative measures of the Company's assets, liabilities, and certain off-balance-sheet items as calculated under regulatory accounting practices. The capital amounts and classification are also subject to qualitative judgments by the regulators about components, risk weightings, and other factors.
In July 2013, the FDIC and other federal bank regulatory agencies approved final rules known as the "Basel III Capital Rules," which substantially revised the risk-based capital and leverage capital requirements applicable to bank holding companies and depository institutions, including the Company. The Basel III Capital Rules, which became fully phased in on January 1, 2019, require banking organizations to maintain (i) a minimum ratio of CET1 to risk-weighted assets of at least 4.5%, plus a 2.5% "capital conservation buffer" (which is added to the 4.5% CET1 ratio, effectively resulting in a minimum ratio of CET1 to risk-weighted assets of at least 7.0%); (ii) a minimum ratio of Tier 1 capital to risk-weighted assets of at least 6.0%, plus the capital conservation buffer (which is added to the 6.0% Tier 1 capital ratio, effectively resulting in a minimum Tier 1 capital ratio of 8.5%); (iii) a minimum ratio of total capital (that is, Tier 1 plus Tier 2 capital) to risk-weighted assets of at least 8.0%, plus the capital conservation buffer (which is added to the 8.0% total capital ratio, effectively resulting in a minimum total capital ratio of 10.5%); and (iv) a minimum leverage ratio of 4.0%, calculated as the ratio of Tier 1 capital to adjusted average quarterly assets.
In addition, the Federal Deposit Insurance Act, as amended, requires among other things, the federal bank regulatory agencies to take "prompt corrective action" against depository institutions that do not meet minimum capital requirements. The Federal Deposit Insurance Act includes the following five capital tiers: "well capitalized," "adequately capitalized," "undercapitalized," "significantly undercapitalized" and "critically undercapitalized."
In order to be adequately capitalized for purposes of the prompt corrective action rules, a banking organization is required to have at least an 8% total risk-based capital ratio, a 6% Tier 1 risk-based capital ratio, a 4.5% CET1 risk-based capital ratio, and a 4% Tier 1 leverage ratio. To be well-capitalized, a banking organization is required
TOWNEBANK NOTES TO CONSOLIDATED FINANCIAL STATEMENTS
101

to have at least a 10% total risk-based capital ratio, an 8% Tier 1 risk-based capital ratio, a 6.5% CET1 risk-based capital ratio, and a 5% Tier 1 leverage ratio. An institution may be downgraded to, or deemed to be in, a capital category that is lower than indicated by its capital ratios if it is determined to be in an unsafe or unsound condition or if it receives an unsatisfactory examination rating with respect to certain matters. A bank's capital category is determined solely for the purpose of applying prompt corrective action regulations, and the capital category may not constitute an accurate representation of the bank's overall financial condition or prospects for other purposes.
A summary of our required and actual capital components follow (dollars in thousands):
To Be WellFor Capital Capitalized UnderAdequacy Prompt Action
As of December 31, 2020 Actual Purposes ProvisionsAmount Ratio % Amount Ratio % Amount Ratio %
Common equity Tier 1(to risk-weighted assets) $ 1,254,310 11.87 % $ 475,327 4.50 % $ 739,398 7.00 %
Tier 1 capital(to risk-weighted assets) $ 1,271,291 12.04 % $ 633,770 6.00 % $ 897,841 8.50 %
Total risk-based capital(to risk-weighted assets) $ 1,629,227 15.42 % $ 845,027 8.00 % $ 1,109,097 10.50 %
Tier 1 leverage ratios(to average assets) $ 1,271,291 8.99 % $ 565,838 4.00 % $ 707,298 5.00 %
To Be WellFor Capital Capitalized UnderAdequacy Prompt Action
As of December 31, 2019 Actual Purposes ProvisionsAmount Ratio % Amount Ratio % Amount Ratio %
Common equity Tier 1(to risk-weighted assets) $ 1,135,886 11.46 % $ 446,220 4.50 % $ 694,120 6.50 %
Tier 1 capital(to risk-weighted assets) $ 1,139,107 11.49 % $ 594,960 6.00 % $ 842,860 8.00 %
Total risk-based capital(to risk-weighted assets) $ 1,445,799 14.58 % $ 793,280 8.00 % $ 1,041,180 10.00 %
Tier 1 leverage ratios(to average assets) $ 1,139,107 9.95 % $ 458,090 4.00 % $ 572,613 5.00 %
NOTE 20: FAIR VALUE DISCLOSURES
Fair value is defined as the exchange price that would be received for an asset or paid to transfer a liability (an exit price) in the principal or most advantageous market for the asset or liability in an orderly transaction between market participants on the measurement date. A three-level valuation hierarchy was established for disclosure of fair value measurements. The valuation hierarchy is based upon the transparency of inputs to the valuation of an asset or liability as of the measurement date. The three levels are defined as follows:
Level 1 Valuation is based on quoted prices (unadjusted) in active markets for identical assets or liabilities.
TOWNEBANK NOTES TO CONSOLIDATED FINANCIAL STATEMENTS
102

Level 2 Valuation is based on observable inputs, other than Level 1 prices, that are observable or can be corroborated by observable market data for substantially the full term of the assets or liabilities.
Level 3 Valuation is based on unobservable inputs that are supported by little or no market activity and which are significant to the fair value of the assets or liabilities.
The following is a description of the valuation methodologies used for instruments measured at fair value on a recurring basis.
Securities available for sale: Fair values are based on published market prices or dealer quotes. If a quoted market price is not available, fair value is estimated using quoted market prices for similar securities. The fair value of certain corporate securities is based on a discounted cash flow model which utilizes Level 3, or unobservable inputs, the most significant of which were a discount rate and weighted-average life. At December 31, 2020, the discount rate utilized was 2.30% and the weighted-average life was 28.35 years.
Loans held for sale - mandatory delivery: Fair values of loans held for sale are based on commitments onhand from investors or, if commitments have not yet been obtained, prevailing market rates. TowneBank elects to carry mortgages it intends to sell in the mandatory delivery program at fair value. Intent is established for these residential real estate mortgage loans when TowneBank enters into a loan commitment or interest rate lock with the customer. At December 31, 2020, the Company was temporarily not participating in the mandatory delivery program. For additional information about loans held for sale, refer to Note 21.
Derivative Financial Instruments: Interest rate lock commitments, related to the origination of mortgage loans held for sale, are recorded at estimated fair value based on the value of the underlying loan, which in turn is based on quoted prices for similar loans in the secondary market. However, this value is adjusted by a factor which considers the likelihood that the loan in a lock position will ultimately close. This factor, the fall-out rate, is derived from the Company's internal data and is adjusted using significant management judgment. The fall-out rate is largely dependent on the processing stage that a loan is currently in and the change in prevailing interest rates from the time of the rate lock. As such, interest rate lock commitments are classified as recurring Level 3. For the years ended December 31, 2020 and 2019, the Company used weighted average fall-out rates of 12.77%, and 13.16%, respectively.
To mitigate the effect of the interest rate risk inherent in providing rate lock commitments to borrowers, theCompany enters into either a forward sales contract to sell loans to investors when using best efforts or aTBA mortgage-backed security under mandatory delivery. The forward sales contracts lock in a price for thesale of loans with similar characteristics to the specific rate lock commitments. The Company has notformally designated these derivatives as a qualifying hedge relationship; accordingly, changes to fair valueare recorded to earnings each period. These valuations fall into a Level 2 category. At December 31, 2020,because the Company was not participating in the mandatory delivery program, we did not have any TBAmortgage-backed securities.
TOWNEBANK NOTES TO CONSOLIDATED FINANCIAL STATEMENTS
103

The following tables present the recorded amount of assets and liabilities measured at fair value on a recurring basis (in thousands):
December 31, 2020Level 1 Level 2 Level 3 Total
U.S. agency securities $ — $ 184,657 $ — $ 184,657
U.S. Treasury notes $ 1,000 $ — $ — $ 1,000
Municipal securities $ — $ 353,641 $ — $ 353,641
Mortgage-backed securities issued by GSEs $ — $ 797,765 $ — $ 797,765
Trust preferred and other corporate securities $ — $ 29,340 $ 1,821 $ 31,161
Loans held for sale - mandatory delivery $ — $ — $ — $ —
Derivative assets $ — $ — $ 11,781 $ 11,781
Derivative liabilities $ — $ — $ — $ —
December 31, 2019Level 1 Level 2 Level 3 Total
U.S. agency securities $ — $ 129,038 $ — $ 129,038
U.S. Treasury notes $ 1,000 $ — $ — $ 1,000
Municipal securities $ — $ 223,106 $ — $ 223,106
Mortgage-backed securities issued by GSEs $ — $ 1,034,797 $ — $ 1,034,797
Trust preferred and other corporate securities $ — $ 53,367 $ — $ 53,367 Loans held for sale - mandatory delivery $ — $ 340,915 $ — $ 340,915
Derivative assets $ — $ 439 $ 1,525 $ 1,964
Derivative liabilities $ — $ 940 $ — $ 940
TowneBank elects the fair value option for loans held for sale within the mandatory delivery program. This election allows for a more effective offset of the changes in fair values of the loans and the derivative instruments used to economically hedge them without the burden of complying with the requirements for hedge accounting. TowneBank has not elected the fair value option for other loans held for sale primarily because they are not actively hedged. Fair values of loans held for sale are recorded in mortgage loans held for sale in the Consolidated Balance Sheets.
The following table summarizes the difference between the aggregate fair value and the aggregate unpaid principal balance for mortgage loans held for sale measured at fair value at December 31, 2020 and 2019 (in thousands):
December 31, 2020 December 31, 2019
Aggregate fair value $ — $ 340,915
Aggregate unpaid principal — 339,831 Aggregate fair value less aggregate unpaid principal $ — $ 1,084
Interest income on mortgage loans held for sale is recognized based on contractual rates and is reflected in interest income on mortgage loans held for sale in the Consolidated Statements of Income. The following table details net gains and losses resulting from changes in fair value of these loans, which were recorded in residential mortgage banking income, net in the Consolidated Statements of Income for the periods presented.
TOWNEBANK NOTES TO CONSOLIDATED FINANCIAL STATEMENTS
104

Net Gains (Losses) Resulting from Changes in Fair Value
Twelve Months Ended
(in thousands) December 31, 2020 December 31, 2019
Mortgage loans held for sale, at fair value $ — $ 1,084
The Company may be required, from time to time, to measure certain assets at fair value on a nonrecurring basis in accordance with GAAP. These adjustments to fair value usually result from application of lower-of-cost-or-market accounting or write-downs of individual assets. For assets measured at fair value on a nonrecurring basis that were still held in the balance sheet at year-end, the following table provides the level of valuation assumptions used to determine each adjustment and the carrying value of the related assets (in thousands):
December 31, 2020 Level 1 Level 2 Level 3 TotalCollateral-dependent assets with specific reserves $ — $ — $ 8 $ 8 Other real estate owned and other nonperforming assets $ — $ — $ 5 $ 5
December 31, 2019 Level 1 Level 2 Level 3 TotalImpaired loans - Pre-ASC 326 $ — $ — $ 3,204 $ 3,204 Other real estate owned and other nonperforming assets $ — $ — $ 15,360 $ 15,360
The following is a description of valuation methodologies used for assets measured on a nonrecurring basis.
Loans: Loans for which repayment of the loan is expected to be provided solely by the value of the underlying collateral are considered collateral-dependent and are valued based on the fair value of such collateral. Collateral values are estimated using inputs based on observable market data, where available, or inputs based on customized discounting criteria. In cases where such inputs were unobservable, specifically discounts applied to appraisal values to adjust such values to current market conditions or to reflect net realizable value, the collateral-dependent assets with specific reserves loan balance is reflected within Level 3 of the hierarchy. These discounts ranged from 4.82% to 100%, with a weighted average of 17.38%.
Loans held for sale - best efforts: Loans closed and held for sale within the mandatory program are carried at fair value. Loans held for sale within the best efforts program are carried at the lower of cost or fair value. Fair values of loans held for sale are based on commitments on hand from investors or, if commitments have not yet been obtained, prevailing market rates. For additional information about loans held for sale, refer to Note 21.
Other real estate owned and other nonperforming assets: The fair value of foreclosed property is measured at fair value on a nonrecurring basis (upon initial recognition or subsequent impairment) and is classified within Level 3 of the valuation hierarchy. When transferred from the loan portfolio, other real estate is adjusted to fair value less estimated selling costs and is subsequently carried at the lower of carrying value or fair value less estimated selling costs. The fair value is generally determined using an external appraisal process and is discounted based on internal criteria when deemed necessary.
The following methods and assumptions were used in estimating fair value for the remaining classes of our financial instruments.
Cash and due from banks, interest-bearing deposits in financial institutions, and federal funds sold: The carrying amount approximates fair value.
Securities held to maturity: Fair values are based on published market prices or dealer quotes. If a quoted market price is not available, fair value is estimated using quoted market prices for similar securities.
TOWNEBANK NOTES TO CONSOLIDATED FINANCIAL STATEMENTS
105

Loans: For loan receivables with short-term and/or variable characteristics, the total receivable outstanding approximates fair value. The fair value of other loans is estimated by discounting the future cash flows using interest rates currently being offered for loans with similar terms to borrowers of similar credit quality.
Interest receivable and interest payable: The carrying amount approximates fair value.
Deposits: The carrying amount of noninterest-bearing deposits and deposits with no defined maturity approximates fair value. The fair value of certificates of deposit is estimated by discounting the future cash flows using the current rates at which similar deposits would be made.
Advances from the FHLB: The fair value of advances from the FHLB is determined using the discounted cash flow method with the discount rate being equal to the rate currently offered on similar products.
Repurchase agreements: The carrying amount approximates fair value.
Commitments to extend and standby letters of credit: These financial instruments are generally not sold or traded. The estimated fair values of off-balance-sheet credit commitments, including standby letters of credit and guarantees written, are not readily available due to the lack of cost-effective and reliable measurement methods for these instruments.
The estimated fair values of our financial instruments required to be disclosed under ASC 825, Financial Instruments, and the level within the fair value hierarchy at which such assets and liabilities are measured, are as follows (in thousands):
December 31, 2020Carrying
ValueEstimatedFair Value Level 1 Level 2 Level 3
Cash and due from banks $ 41,514 $ 41,514 $ 41,514 $ — $ — Interest-bearing deposits at FRB-Richmond $ 1,795,241 $ 1,795,241 $ 1,795,241 $ — $ — Interest-bearing deposits in financial
institutions $ 27,532 $ 27,532 $ 27,532 $ — $ — Securities available for sale $ 1,368,224 $ 1,368,224 $ — $ 1,368,224 $ — Securities held to maturity $ 16,512 $ 18,469 $ — $ 16,648 $ 1,821 Other equity securities $ 6,492 $ 6,492 $ — $ 6,492 $ — Mortgage loans held for sale $ 540,798 $ 541,027 $ — $ 541,027 $ — Loans, net $ 9,629,068 $ 9,542,454 $ — $ — $ 9,542,454 Interest receivable $ 31,821 $ 31,821 $ — $ 31,821 $ — Non-maturity deposits $ 9,524,261 $ 9,838,420 $ — $ 9,838,420 $ — Time deposits $ 2,048,905 $ 2,062,962 $ — $ 2,062,962 $ — Advances from the FHLB $ 456,038 $ 457,117 $ — $ 457,117 $ — Subordinated debentures $ 249,055 $ 255,398 $ — $ 255,398 $ — Repurchase agreements, FRB PPP lending
facility and other borrowings $ 250,638 $ 250,203 $ — $ 250,203 $ — Interest payable $ 9,723 $ 9,723 $ — $ 9,723 $ —
TOWNEBANK NOTES TO CONSOLIDATED FINANCIAL STATEMENTS
106

December 31, 2019Carrying
ValueEstimated Fair Value Level 1 Level 2 Level 3
Cash and due from banks $ 97,593 $ 97,593 $ 97,593 $ — $ — Interest-bearing deposits at FRB-Richmond $ 322,505 $ 322,505 $ 322,505 $ — $ — Interest-bearing deposits in financial
institutions $ 22,518 $ 22,518 $ 22,518 $ — $ — Securities available for sale $ 1,441,308 $ 1,441,308 $ — $ 1,441,308 $ — Securities held to maturity $ 43,688 $ 45,171 $ — $ 45,171 $ — Other equity securities $ 6,462 $ 6,462 $ — $ 6,462 $ — Mortgage loans held for sale $ 419,233 $ 419,420 $ — $ 419,420 $ — Loans, net $ 8,361,054 $ 8,365,959 $ — $ — $ 8,365,959 Interest receivable $ 33,126 $ 33,126 $ — $ 33,126 $ — Non-maturity deposits $ 6,813,794 $ 6,732,178 $ — $ 6,732,178 $ — Time deposits $ 2,457,123 $ 2,468,979 $ — $ 2,468,979 $ — Advances from the FHLB $ 471,687 $ 472,029 $ — $ 472,029 $ — Subordinated debentures $ 248,458 $ 254,993 $ — $ 254,993 $ — Repurchase agreements and other borrowings $ 52,391 $ 49,958 $ — $ 49,958 $ — Interest payable $ 13,563 $ 13,563 $ — $ 13,563 $ —
NOTE 21. DERIVATIVE INSTRUMENTS AND HEDGING ACTIVITIES
The Company enters into interest rate lock commitments with its mortgage customers. The Company is also a party to forward mortgage sales contracts to sell loans servicing-released and sales of TBA MBSs. When the interest rate is locked with the borrower, the rate lock commitment, forward sales contract, and mortgage-backed security position are undesignated derivatives and marked to fair value through earnings. The fair value of the rate lock derivative is based on quoted prices for similar loans in the secondary market adjusted by a factor which considers the likelihood that the loan in a lock position will ultimately close. Both the rate lock commitment and the corresponding forward sales contracts are considered derivatives, but are not accounted for using hedge accounting. As such, changes in the estimated fair value of the derivatives during the commitment period are recorded in current earnings and included in net residential mortgage banking income in the Consolidated Statements of Income.
When the market is favorable, we sell mortgage loans under both "mandatory" and "best efforts" delivery programs. Under the mandatory delivery system, loans with interest rate locks with respective borrowers are paired with the sales of TBA MBSs bearing similar attributes. We commit to deliver loans to an investor at an agreed-upon price upon the closing of such loans. This differs from "best efforts" delivery transactions, which set the sale price with the investor on a loan-by-loan basis at the time each loan is locked with the respective borrower. At December 31, 2020, we were temporarily not participating in the mandatory delivery system and had no sales of TBA MBSs outstanding.
TOWNEBANK NOTES TO CONSOLIDATED FINANCIAL STATEMENTS
107

The following table reflects the amount and market value of mortgage banking derivatives included in the Consolidated Balance Sheets as of the period end (in thousands):
December 31, 2020 December 31, 2019
Notional Fair Notional Fair
Amount Value Amount Value
Interest rate contracts included in other assets $ 698,126 $ 11,781 $ 367,073 $ 1,964
Interest rate contracts included in other liabilities $ — $ — $ 315,912 $ 940
Gains and losses from mortgage banking derivatives are included in residential mortgage banking income, net on the Consolidated Statements of Income. For the years ended December 31, 2020, and December 31, 2019, the Company recognized gains of $0.18 million and $2.56 million, respectively.
NOTE 22: VARIABLE INTEREST ENTITIES
In the normal course of business, the Company is involved with various entities that are considered to be Variable Interest Entities. A VIE is an entity that has either a total equity investment that is insufficient to permit the entity to finance its activities without additional subordinated financial support, or whose equity investors lack the characteristics of a controlling financial interest. In accordance with existing accounting guidance, we are required to consolidate any VIE of which we are determined to be the primary beneficiary. The primary beneficiary is the entity that has (i) the power to direct the activities of a VIE that most significantly impact the entity's economic performance; and (ii) the obligation to absorb losses of the entity that could potentially be significant to the VIE, or the right to receive benefits from the entity that could potentially be significant to the VIE. We review all significant interests in the VIEs we are involved with, including the amounts and types of financial and other support, including equity investments, debt financing, and guarantees. We also consider the activities of the VIEs that most significantly impact the VIEs' economic performance and whether we have control over those activities. We assess whether or not we are the primary beneficiary of a VIE on an ongoing basis. To provide the necessary disclosures, we aggregate similar VIEs based on the nature and purpose of the entities.
Low Income Housing Tax Credit Partnerships
As part of its community reinvestment initiatives, the Company invests within its footprint in multi-family affordable housing developments as a limited partner. The Company receives tax credits for its partnership investments. The Company has determined that these partnerships are VIEs when it does not own 100% of the entity, because the holders of the equity investment at risk do not have the power through voting rights or similar rights to direct the activities of the entity that most significantly impact the entity's economic performance. Accordingly, the Company's limited partner interests are variable interests that the Company evaluates for purposes of determining whether the Company is the primary beneficiary.
For each of the partnerships, the Company acts strictly in a limited partnership capacity. The Company has determined that it is not the primary beneficiary of these partnerships because it does not have the power to direct the activities of the entity that most significantly impact the entity's economic performance. The Company accounts for its limited partner interests in accordance with the accounting guidance for investments in affordable housing projects. Partnership assets of $281.28 million and $229.01 million were not included in the Consolidated Balance Sheets at December 31, 2020 and 2019, respectively. These limited partner interests had carrying values of $92.38 million and $59.38 million at December 31, 2020 and 2019, respectively, and are recorded in other assets on the Company's Consolidated Balance Sheets. The Company's maximum exposure to loss for these limited partner investments totaled $92.38 million and $62.24 million at December 31, 2020 and 2019, respectively. As of December 31, 2020, the Company has $57.64 million in funding commitments that are dependent on certain
TOWNEBANK NOTES TO CONSOLIDATED FINANCIAL STATEMENTS
108

contractual milestones and $30.50 million in loans, unfunded short-term construction loans, or letters of credit commitments. For the year ended December 31, 2020, a tax benefit totaling $2.07 million, net of amortization of $9.99 million, was recognized as a component of income tax expense.
NOTE 23: INCOME TAXES
Current income tax expense represents the amounts expected to be reported on the Company's income tax returns, and deferred tax expense or benefit represents the change in net deferred tax assets and liabilities. Deferred tax assets and liabilities are determined based on the difference between the financial statement and tax basis of assets and liabilities as measured by the enacted tax rates that will be in effect when these differences reverse. Valuation allowances are recorded as appropriate to reduce deferred tax assets to the amount considered likely to be realized.
The Company uses the asset and liability method of accounting for income taxes. Under this method, deferred tax assets and liabilities are recognized for the future tax consequences attributable to differences between the financial statement carrying amounts of existing assets and liabilities and their respective tax basis. Deferred tax assets and liabilities are measured using enacted tax rates expected to apply to taxable income in the years in which those temporary differences are expected to reverse. The Company qualified for certain provisions of the CARES Act that reduced the effective rate when compared to 2019.
The provision for income taxes charged to operations is listed in the following chart (in thousands):
For the Year Ended December 31, 2020 2019 2018Current income tax expenseFederal $ (45,306) $ (34,927) $ (30,867) State (3,463) (2,452) (2,060)
Total current tax expense (48,769) (37,379) (32,927) Deferred income tax (expense) benefitFederal 15,142 4,707 (1,013) State 1,727 76 409 Revaluation of deferred taxes — — (696)
Total deferred income tax (expense) benefit 16,869 4,783 (1,300) Income tax expense $ (31,900) $ (32,596) $ (34,227)
Differences between income tax expense calculated at the statutory rate and shown on the Consolidated Statements of Income are summarized as follows (dollars in thousands):
2020 2019 2018For the Year Ended December 31, $ Rate $ Rate $ RateFederal income tax expense at statutory rate $ (37,261) (21.00) % $ (35,990) (21.00) % $ (35,284) (21.00) %Revaluation of deferred taxes — — % — — % (696) (0.41) %State income tax expense, net of federal
benefit (2,358) (1.33) % (1,800) (1.05) % (1,667) (0.99) %Tax advantaged income 3,858 2.17 % 4,209 2.46 % 3,469 2.06 %Low income housing tax credit, net of amortization 2,074 1.17 % 1,819 1.06 % 874 0.52 %Prior year adjustments 2,539 1.43 % — — % — — %Other (752) (0.42) % (834) (0.49) % (923) (0.55) %Income tax expense $ (31,900) (17.98) % $ (32,596) (19.02) % $ (34,227) (20.37) %
TOWNEBANK NOTES TO CONSOLIDATED FINANCIAL STATEMENTS
109

Significant components of deferred tax assets and deferred tax liabilities follow (in thousands):
Year Ended December 31, 2020 2019Deferred tax assets:
Allowance for credit losses $ 28,993 $ 12,837 Stock-based compensation 1,004 680 Accrued expenses 4,721 1,352 Retirement plan 13,385 11,975 Deferred compensation 8,868 7,040 Operating lease liabilities 14,162 11,077 Assets acquired in acquisitions 3,256 6,118 Other 2,687 3,979 Total deferred tax assets 77,076 55,058
Deferred tax liabilities:Depreciation 15,679 13,277 Noncompete and intangibles 5,373 6,044 Basis differences due to tax credits and partnerships (664) (761) Unrealized gain on securities available for sale 12,873 4,293 Operating lease right-of-use assets 13,312 10,475 Other 1,366 1,627 Total deferred tax liabilities 47,939 34,955 Net deferred tax assets $ 29,137 $ 20,103
As of December 31, 2020, and December 31, 2019, the Company did not have any unrecognized tax benefits. The Company does not expect the total amount of unrecognized tax benefits to significantly increase or decrease in the next 12 months. The Company recognizes interest and penalties related to unrecognized tax benefits as "Interest Expense" and "Other Expense," respectively, and not as part of the tax provision. The Company is no longer subject to examination for federal and state purposes for tax years prior to 2017.
TOWNEBANK NOTES TO CONSOLIDATED FINANCIAL STATEMENTS
110

NOTE 24: ACCUMULATED OTHER COMPREHENSIVE INCOME
The following table summarizes the components of accumulated other comprehensive income (loss) at December 31, 2020, 2019, and 2018, and changes during the years then ended. The amounts reclassified from accumulated other comprehensive income for the securities available for sale are included in gain on investment securities, net on the Consolidated Statements of Income, while the amounts reclassified from accumulated other comprehensive income for the defined benefit retirement plan are a component of salaries and employee benefits expense on the Consolidated Statements of Income.
(in thousands)
Unrealized Gains (Losses) on Securities
(a)
Pension and Postretirement
Plans(b)
Accumulated Other
Comprehensive Income (Loss),
Net of TaxBalance, December 31, 2017 $ (4,177) $ (1,515) $ (5,692)
Impact from adoption of new accounting standards (851) (309) (1,160) Other comprehensive loss before reclassifications, net of tax (4,287) 1,646 (2,641) Amounts reclassified from AOCI, net of tax (2) 305 303 Net change (4,289) 1,951 (2,338)
Balance, December 31, 2018 (9,317) 127 (9,190) Other comprehensive income (loss) before reclassifications, net of tax 24,090 (4,245) 19,845 Amounts reclassified from AOCI, net of tax 668 (21) 647Net change 24,758 (4,266) 20,492
Balance, December 31, 2019 15,441 (4,139) 11,302 Other comprehensive income (loss) before reclassifications, net of tax 37,622 (1,015) 36,607 Amounts reclassified from AOCI, net of tax (7,611) 886 (6,725) Net change 30,011 (129) 29,882
Balance, December 31, 2020 $ 45,452 $ (4,268) $ 41,184
(a) For additional information about investment securities, refer to Note 3.(b) For additional information about retirement plans, refer to Note 14.
NOTE 25: LEGAL CONTINGENCIES
Various legal actions arise from time to time in the normal course of our business. There were no significant asserted claims or assessments at December 31, 2020. Management was not aware of any unasserted claims or assessments that may be probable of assertion at December 31, 2020.
NOTE 26: OTHER RELATED PARTY TRANSACTIONS
Loans are made to the Company's executive officers and directors and their associates during the ordinary course of business. The aggregate amount of loans to such related parties totaled $461.73 million, $324.60 million, and $341.09 million as of December 31, 2020, 2019, and 2018, respectively. During 2020, new advances on all commitments to such parties totaled $145.29 million, and repayments amounted to $607.59 million. Included in the loans to related parties, at December 31, 2020, we had $119.39 million in unfunded commitments to extend credit to such related parties.
The Company rents space for various financial centers from companies associated with its directors. Rent expense related to these leases was $2.65 million, $2.81 million, and $2.96 million for the years ended December 31, 2020, 2019, and 2018, respectively.
TOWNEBANK NOTES TO CONSOLIDATED FINANCIAL STATEMENTS
111
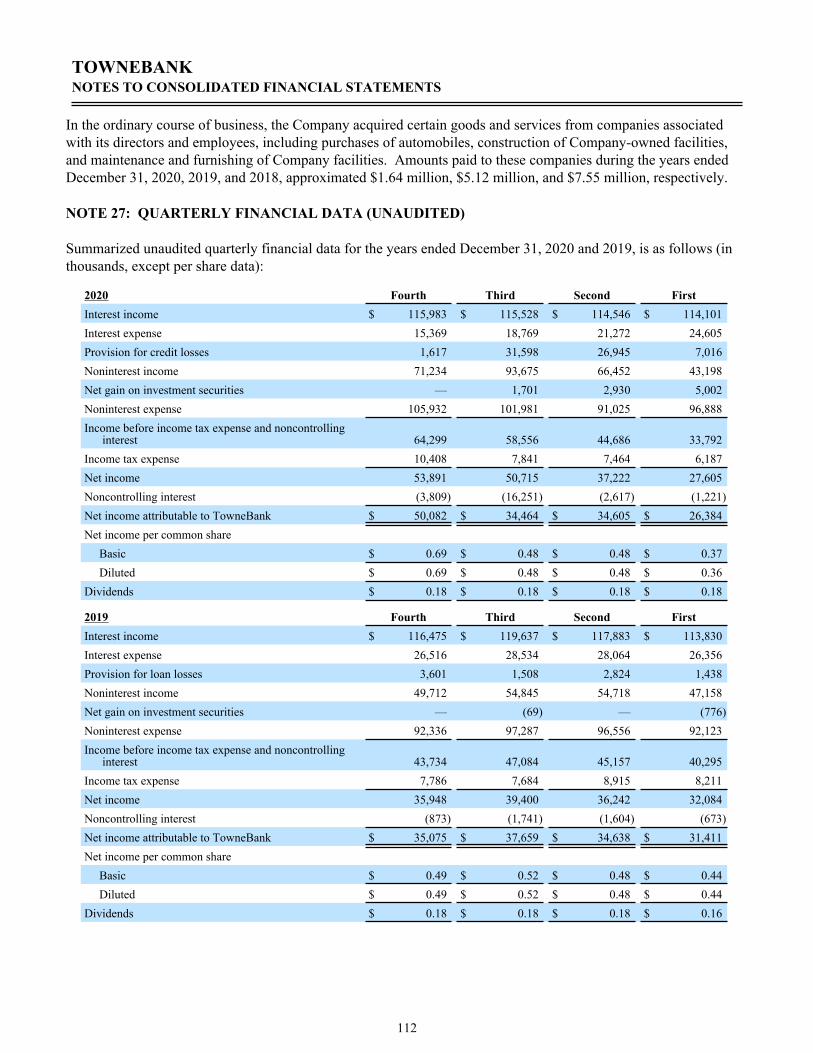
In the ordinary course of business, the Company acquired certain goods and services from companies associated with its directors and employees, including purchases of automobiles, construction of Company-owned facilities, and maintenance and furnishing of Company facilities. Amounts paid to these companies during the years ended December 31, 2020, 2019, and 2018, approximated $1.64 million, $5.12 million, and $7.55 million, respectively.
NOTE 27: QUARTERLY FINANCIAL DATA (UNAUDITED)
Summarized unaudited quarterly financial data for the years ended December 31, 2020 and 2019, is as follows (in thousands, except per share data):
2020 Fourth Third Second FirstInterest income $ 115,983 $ 115,528 $ 114,546 $ 114,101 Interest expense 15,369 18,769 21,272 24,605 Provision for credit losses 1,617 31,598 26,945 7,016 Noninterest income 71,234 93,675 66,452 43,198 Net gain on investment securities — 1,701 2,930 5,002 Noninterest expense 105,932 101,981 91,025 96,888 Income before income tax expense and noncontrolling
interest 64,299 58,556 44,686 33,792 Income tax expense 10,408 7,841 7,464 6,187 Net income 53,891 50,715 37,222 27,605 Noncontrolling interest (3,809) (16,251) (2,617) (1,221) Net income attributable to TowneBank $ 50,082 $ 34,464 $ 34,605 $ 26,384 Net income per common share
Basic $ 0.69 $ 0.48 $ 0.48 $ 0.37 Diluted $ 0.69 $ 0.48 $ 0.48 $ 0.36
Dividends $ 0.18 $ 0.18 $ 0.18 $ 0.18
2019 Fourth Third Second FirstInterest income $ 116,475 $ 119,637 $ 117,883 $ 113,830 Interest expense 26,516 28,534 28,064 26,356 Provision for loan losses 3,601 1,508 2,824 1,438 Noninterest income 49,712 54,845 54,718 47,158 Net gain on investment securities — (69) — (776) Noninterest expense 92,336 97,287 96,556 92,123 Income before income tax expense and noncontrolling
interest 43,734 47,084 45,157 40,295 Income tax expense 7,786 7,684 8,915 8,211 Net income 35,948 39,400 36,242 32,084 Noncontrolling interest (873) (1,741) (1,604) (673) Net income attributable to TowneBank $ 35,075 $ 37,659 $ 34,638 $ 31,411 Net income per common share
Basic $ 0.49 $ 0.52 $ 0.48 $ 0.44 Diluted $ 0.49 $ 0.52 $ 0.48 $ 0.44
Dividends $ 0.18 $ 0.18 $ 0.18 $ 0.16
TOWNEBANK NOTES TO CONSOLIDATED FINANCIAL STATEMENTS
112

NOTE 28: SEGMENT REPORTING
The Company has three reportable segments: Banking, Realty, and Insurance. The Banking segment provides loan and deposit services to retail and commercial customers. The Realty segment provides residential real estate services, resort property management, originations of a variety of mortgage loans, and commercial and residential title insurance. Mortgage loans are originated and sold principally in the secondary market through purchase commitments from investors. The Insurance segment provides full-service commercial and retail insurance and employee benefit services. Until its sale in the third quarter of 2020, the Company also provided travel insurance services through Red Sky.
All the segments are service-based. The Banking segment offers a distribution and referral network for the realty and insurance services, and the Realty and Insurance divisions offer a similar network for the Banking segment due largely to overlapping geographic markets. A major distinction is the source of income. The Realty and Insurance businesses are fee-based, while the Banking segment is driven principally by net interest income.
Segment profit and loss is measured by net income after income tax. Inter-segment transactions are recorded at cost and eliminated as part of the consolidation process. Because of the interrelationships of the various segments, the information presented is not indicative of how the segments would perform if they operated as independent entities.
Information about reportable segments and reconciliation of such information to the Consolidated Financial Statements follows (dollars in thousands):
For the Year Ended December 31, 2020Bank Realty Insurance
Consolidated Totals
Net interest income $ 367,353 $ 12,791 $ — $ 380,144 Provision for loan losses 65,799 1,378 — 67,177 Net interest income after provision for loan losses 301,554 11,413 — 312,967 Residential mortgage banking income, net (2,423) 114,589 — 112,166 Insurance commissions and other title fees and income, net 194 2,397 63,249 65,840 Real estate brokerage and property management income, net — 38,249 — 38,249 Other noninterest income 46,862 2,434 18,640 67,936 Noninterest expense 243,451 104,123 48,251 395,825 Income before income tax, corporate allocation, and
noncontrolling interest 102,736 64,959 33,638 201,333 Corporate allocation 2,534 (1,522) (1,012) — Income before income tax provision and noncontrolling
interest 105,270 63,437 32,626 201,333 Income tax provision 14,467 12,035 5,398 31,900 Net income 90,803 51,402 27,228 169,433 Noncontrolling interest 6 (11,809) (12,095) (23,898) Net income attributable to TowneBank $ 90,809 $ 39,593 $ 15,133 $ 145,535 Net income as percentage of total 62.40 % 27.20 % 10.40 % 100.00 %Assets $ 13,430,909 $ 814,060 $ 381,475 $ 14,626,444
TOWNEBANK NOTES TO CONSOLIDATED FINANCIAL STATEMENTS
113

For the Year Ended December 31, 2019Bank Realty Insurance
Consolidated Totals
Net interest income $ 351,969 $ 6,386 $ — $ 358,355 Provision for loan losses 9,371 — — 9,371 Net interest income after provision for loan losses 342,598 6,386 — 348,984 Residential mortgage banking income, net (1,631) 68,443 — 66,812 Real estate brokerage and property management income, net — 34,292 — 34,292 Insurance commissions and other title fees and income, net 248 2,111 62,119 64,478 Other noninterest income 35,448 1,854 2,704 40,006 Noninterest expense 233,263 94,726 50,313 378,302 Income before income tax, corporate allocation, and
noncontrolling interest 143,400 18,360 14,510 176,270 Corporate allocation 2,011 (1,163) (848) — Income before income tax provision and noncontrolling
interest 145,411 17,197 13,662 176,270 Income tax provision 25,706 3,707 3,183 32,596 Net income 119,705 13,490 10,479 143,674 Noncontrolling interest 2 (3,711) (1,182) (4,891) Net income attributable to TowneBank $ 119,707 $ 9,779 $ 9,297 $ 138,783 Net income as percentage of total 86.25 % 7.05 % 6.70 % 100.00 %Assets $ 10,953,815 $ 673,996 $ 319,852 $ 11,947,663
For the Year Ended December 31, 2018Bank Realty Insurance
Consolidated Totals
Net interest income $ 329,584 $ 11,489 $ — $ 341,073 Provision for loan losses 8,541 — — 8,541 Net interest income after provision for loan losses 321,043 11,489 — 332,532 Residential mortgage banking income, net (1,592) 66,696 — 65,104 Real estate brokerage and property management income, net — 31,863 — 31,863 Insurance commissions and other title fees and income, net 449 1,877 53,838 56,164 Other noninterest income 35,403 2,091 968 38,462 Noninterest expense 208,149 101,216 42,759 352,124 Income before income tax, corporate allocation, and
noncontrolling interest 147,154 12,800 12,047 172,001 Corporate allocation 1,736 (1,091) (645) — Income before income tax provision and noncontrolling
interest 148,890 11,709 11,402 172,001 Income tax provision 28,880 2,892 2,455 34,227 Net income 120,010 8,817 8,947 137,774 Noncontrolling interest (8) (2,398) (1,575) (3,981) Net income attributable to TowneBank $ 120,002 $ 6,419 $ 7,372 $ 133,793 Net income as percentage of total 89.69 % 4.80 % 5.51 % 100.00 %Assets $ 10,475,712 $ 441,283 $ 246,036 $ 11,163,031
TOWNEBANK NOTES TO CONSOLIDATED FINANCIAL STATEMENTS
114
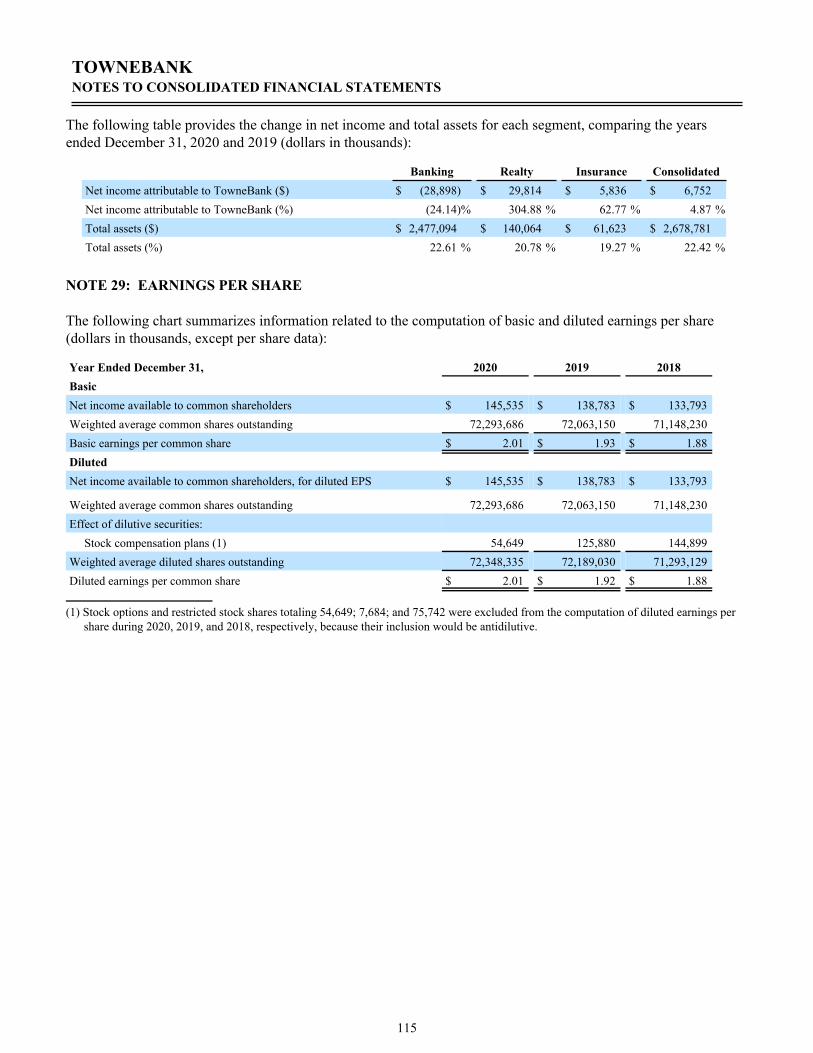
The following table provides the change in net income and total assets for each segment, comparing the years ended December 31, 2020 and 2019 (dollars in thousands):
Banking Realty Insurance ConsolidatedNet income attributable to TowneBank ($) $ (28,898) $ 29,814 $ 5,836 $ 6,752 Net income attributable to TowneBank (%) (24.14) % 304.88 % 62.77 % 4.87 %Total assets ($) $ 2,477,094 $ 140,064 $ 61,623 $ 2,678,781 Total assets (%) 22.61 % 20.78 % 19.27 % 22.42 %
NOTE 29: EARNINGS PER SHARE
The following chart summarizes information related to the computation of basic and diluted earnings per share (dollars in thousands, except per share data):
Year Ended December 31, 2020 2019 2018BasicNet income available to common shareholders $ 145,535 $ 138,783 $ 133,793 Weighted average common shares outstanding 72,293,686 72,063,150 71,148,230 Basic earnings per common share $ 2.01 $ 1.93 $ 1.88 DilutedNet income available to common shareholders, for diluted EPS $ 145,535 $ 138,783 $ 133,793
Weighted average common shares outstanding 72,293,686 72,063,150 71,148,230 Effect of dilutive securities:
Stock compensation plans (1) 54,649 125,880 144,899 Weighted average diluted shares outstanding 72,348,335 72,189,030 71,293,129 Diluted earnings per common share $ 2.01 $ 1.92 $ 1.88
(1) Stock options and restricted stock shares totaling 54,649; 7,684; and 75,742 were excluded from the computation of diluted earnings per share during 2020, 2019, and 2018, respectively, because their inclusion would be antidilutive.
TOWNEBANK NOTES TO CONSOLIDATED FINANCIAL STATEMENTS
115
ANNUAL MEETING
TowneBank's Annual Meeting of Shareholders will be a virtual presentation, held at 11:30 a.m. on Wednesday, June 2, 2021.
COMMON STOCK
The Company's Common Stock is listed on the Nasdaq Global Select Market under the symbol TOWN.
INVESTOR RELATIONS
Our Annual Report, Form 10-K, and other corporate publications are available to shareholders on request, without charge, by writing:
TowneBank6001 Harbour View BoulevardSuffolk, Virginia 23435email: [email protected]
These reports are also available on our website at http://www.townebank.com/investor_relations.
INDEPENDENT AUDITORS
Dixon Hughes Goodman LLP4350 Congress Street, Suite 900Charlotte, North Carolina 28209
TRANSFER AGENT
Computershare Shareholder ServicesP.O. Box 30170College Station, Texas 77842-3170800-368-5948www.computershare.com/investor
CORPORATE COUNSEL
Williams Mullen200 South 10th Street, Suite 1600Richmond, Virginia 23219
Troutman Pepper Hamilton Sanders L.L.P.222 Central Park Avenue, Suite 2000Virginia Beach, Virginia 23462
TOWNEBANKSHAREHOLDER INFORMATION
116
Exhibit (4.2)
DESCRIPTION OF TOWNEBANK’S SECURITIES
As of December 31, 2020, TowneBank's common stock was the only class of its securities registered under Section 12 of the Securities Exchange Act of 1934. The common stock is registered with the Federal Deposit Insurance Corporation. The following summary description of the material features of TowneBank’s common stock is qualified in its entirety by reference to TowneBank's articles of incorporation and bylaws, each as amended. For more information, refer to TowneBank’s articles of incorporation and bylaws and any applicable provisions of relevant law, including the Virginia Stock Corporation Act (the "Virginia SCA") and federal laws governing banks.
General
TowneBank is authorized to issue 150,000,000 shares of common stock, par value $1.667 per share. Each share of TowneBank’s common stock has the same relative rights as, and is identical in all respects to, each other share of its common stock. TowneBank’s common stock is traded on the Nasdaq Global Select Market under the symbol "TOWN." The transfer agent for TowneBank's common stock is Computershare, Inc., 250 Royall Street, Canton, Massachusetts 02021. TowneBank's common stock is not a deposit or a savings account and is not insured or guaranteed by the Federal Deposit Insurance Corporation or any other government agency.
Dividends
TowneBank's shareholders are entitled to receive dividends or distributions that its board of directors may declare out of funds legally available for those payments. The payment of distributions by TowneBank is subject to the restrictions of Virginia law applicable to the declaration of distributions by a Virginia banking corporation. Under Virginia law, TowneBank's board of directors may declare a dividend out of the net undivided profits of the bank, after providing for all expenses, losses, interest and taxes accrued or due. No dividend may be declared or paid by TowneBank that would impair its paid-in capital. To determine the net undivided profits, all debts due to TowneBank on which interest is past due and unpaid for a period of 12 months, unless well secured and in process of collection by law, are deducted from the undivided profits in addition to all expenses, losses, interest and taxes accrued. In addition, the payment of distributions to shareholders is subject to any prior rights of outstanding preferred stock. The ability of TowneBank to pay dividends in the future is and could be further influenced by bank regulatory requirements and capital guidelines.
Liquidation Rights
In the event of any liquidation, dissolution or winding up of TowneBank, the holders of shares of its common stock will be entitled to receive, after payment of all debts and liabilities of TowneBank and after satisfaction of all liquidation preferences applicable to any preferred stock, all remaining assets of TowneBank available for distribution in cash or in kind.
Voting Rights
The holders of TowneBank's common stock are entitled to one vote per share and, in general, a majority of votes cast with respect to a matter is sufficient to authorize action upon routine matters. Directors are elected by a plurality of the votes cast, and shareholders do not have the right to accumulate their votes in the election of directors.
Classes of Directors
TowneBank's board of directors is divided into three classes, apportioned as evenly as possible, with directors serving staggered three-year terms.
117

No Preemptive Rights; Redemption and Assessment
Holders of shares of TowneBank's common stock are not entitled to preemptive rights with respect to any shares that may be issued. TowneBank's common stock is not subject to redemption or any sinking fund and the outstanding shares are fully paid and nonassessable.
Preferred Stock
TowneBank's board of directors is empowered to authorize the issuance, in one or more series, of shares of preferred stock at such times, for such purposes and for such consideration as it may deem advisable without stockholder approval. TowneBank's board is also authorized to fix the designations, voting, conversion, preference and other relative rights, qualifications and limitations of any such series of preferred stock. TowneBank's board, without stockholder approval, may authorize the issuance of one or more series of preferred stock with voting and conversion rights which could adversely affect the voting power of the holders of TowneBank's common stock. The creation and issuance of any series of preferred stock, and the relative rights, designations and preferences of such series, if and when established, will depend upon, among other things, the future capital needs of TowneBank, then existing market conditions and other factors that, in the judgment of TowneBank's board, might warrant the issuance of preferred stock.
Anti-takeover Provisions
Certain provisions of the articles of incorporation and bylaws of TowneBank may discourage attempts to acquire control of TowneBank. These provisions also may render the removal of one or all directors more difficult or deter or delay corporate changes of control that TowneBank's board of directors did not approve. These provisions include the following:
Classified Board of Directors. TowneBank's articles of incorporation provide for classification of TowneBank's board of directors into three separate classes, which may have certain anti-takeover effects. For example, at least two annual meetings of shareholders may be required for the shareholders to replace a majority of the directors serving on TowneBank’s board of directors.
Authorized Preferred Stock. TowneBank’s board of directors may, subject to application of Virginia law and federal banking regulations, authorize the issuance of preferred stock at such times, for such purposes and for such consideration as the board may deem advisable without further stockholder approval. The issuance of preferred stock under certain circumstances may have the effect of discouraging an attempt by a third party to acquire control of TowneBank by, for example, authorizing the issuance of a series of preferred stock with rights and preferences designed to impede the proposed transaction.
Supermajority Voting Provisions. TowneBank's articles of incorporation state that certain significant corporate actions must be approved by a majority of all the votes entitled to be cast on the action by each voting group entitled to vote at a meeting at which a quorum of the voting group is present, provided that the action has been approved and recommended by at least two-thirds of the directors in office at the time of such approval and recommendation. If the action is not so approved and recommended by two-thirds of the directors in office, then the action must be approved by the affirmative vote of 80% or more of all of the votes entitled to be cast on such action by each voting group entitled to vote. These significant corporate actions include: adoption of plans of merger or share exchange; sales of all or substantially all of TowneBank's assets other than in the ordinary course of business; adoption of plans of dissolution; and amendments to or restatement of TowneBank's articles of incorporation.
Removal of Directors. TowneBank's articles of incorporation provide that any director may be removed by shareholders only for cause and only if the number of votes cast to remove the director constitutes a majority of the votes entitled to be cast at an election of directors of the voting group or voting groups by which the director was elected. Absent this provision, under Virginia law, a director may be removed with or without cause by a majority vote of the holders of the corporation’s outstanding voting stock. The requirement that directors may only be
118

removed for cause may provide anti-takeover protection through perpetuating the terms of incumbent directors by making it more difficult for shareholders to remove directors and replace them with their own nominees.
No Cumulative Voting. TowneBank's articles of incorporation do not provide for cumulative voting for any purpose. The absence of cumulative voting may afford anti-takeover protection by making it more difficult for shareholders of TowneBank to elect nominees opposed by the board of directors.
Special Meetings of Shareholders. The bylaws of TowneBank contain a provision pursuant to which special meetings of the shareholders of TowneBank may only be called by the chairman of the board, the chief executive officer, the president or by a majority of the board of directors. This provision is designed to afford anti-takeover protection by ensuring that only the board of directors and certain members of management may call a special meeting of shareholders to consider a proposed merger or other business combination.
Stockholder Nominations and Proposals. TowneBank's bylaws require a stockholder who intends to nominate a candidate for election to the board of directors, or to raise new business at a stockholder meeting, to deliver written notice to the Secretary of TowneBank not fewer than 60 days nor more than 90 days prior to the first anniversary of the preceding year's annual meeting; provided, however, if the date of the annual meeting is advanced by more than 30 days or delayed by more than 60 days from such anniversary date, notice by the stockholder must be delivered not earlier than the 90th day prior to such annual meeting and not later than the close of business on the later of the 60th day prior to such annual meeting or the 10th day following the day on which public announcement of the date of such meeting if first made.
The notice provision in TowneBank's bylaws requires TowneBank's shareholders who desire to raise new business to provide certain information to the corporation concerning the nature of the new business, the stockholder and the stockholder’s interest in the business matter. Similarly, a TowneBank stockholder wishing to nominate any person for election as a director must provide TowneBank with certain information concerning the nominee and the proposing stockholder. These requirements may discourage TowneBank's shareholders from submitting director nominations and proposals.
119
Exhibit (14)
TOWNEBANKEXECUTIVE CHAIRMAN, CHIEF EXECUTIVE OFFICER,
EXECUTIVE OFFICERS and SENIOR FINANCIAL OFFICERSCODE OF ETHICAL CONDUCT
Preface
The honesty, integrity, and sound judgment of the Executive Chairman, Chief Executive Officer ("CEO"), executive officers and senior financial officers are fundamental to the reputation and success of TowneBank. While all employees, officers, and directors are required to adhere to the TowneBank Standards of Conduct, the professional and ethical conduct of the Executive Chairman, CEO, executive officers and senior financial officers is essential to the proper function and success of TowneBank as a leading financial services provider.
The Executive Chairman, CEO, executive officers and senior financial officers hold an important and elevated role in corporate governance. These individuals are key members of the management team, who are uniquely capable and empowered to ensure that the interests of stakeholders (including shareholders, clients, employees, suppliers, and citizens of the communities in which TowneBank operates) are appropriately balanced, protected, and preserved. The Executive Chairman, CEO, executive officers and senior financial officers fulfill this responsibility by prescribing and enforcing the policies and procedures employed in TowneBank's financial operations.
Code of Ethical Conduct
General standards of ethical behavior
The CEO, executive officers and senior financial officers of TowneBank performing accounting, audit, financial management, or similar functions must:
Ø Act with honesty and integrity, avoiding actual or apparent conflicts of interest in personal and professional relationships.
Ø Provide colleagues with information that is accurate, complete, objective, relevant, timely, and understandable.
Ø Comply with applicable laws, rules, and regulations of federal, state, and local governments (both United States and foreign) and other appropriate private and public regulatory agencies.
Ø Act in good faith, with due care, competence, and diligence, without misrepresenting material facts or allowing independent judgment to be subordinated.
Ø Respect the confidentiality of information acquired in the course of employment.
Ø Share knowledge and maintain skills necessary and relevant to TowneBank's needs.
Ø Proactively promote ethical and honest behavior within the workplace.
Ø Assure responsible use of and control of all assets, resources, and information in possession of TowneBank.
Ø Keep management informed of financial information of importance, including departures from sound policy, practice and accounting norms.
Standards regarding financial records and reporting
The Executive Chairman, CEO, executive officers and senior financial officers of TowneBank performing accounting, audit, financial management, or similar functions must:
Ø Establish systems and procedures to ensure business transaction are recorded in accordance with Generally Accepted Accounting Principles, company policy and appropriate regulatory pronouncements and guidelines.
Ø Protect and maintain accounting records and information as required by applicable law, regulation, or regulatory guidelines.
Ø Inform the Board of Directors and the Audit Committee of any material information that affects the disclosures made by the Bank in its public filings.
Ø Report to the Board of Directors and the Audit Committee concerning (a) significant deficiencies in the design and operation of internal controls or (b) any fraud involving management or other employees with a significant role in the Bank's financial reporting, disclosures or internal controls.
Ø In addition, the Executive Chairman, CEO, CFO, Executive officers and other Senior Financial officers are expected to provide the Board of Directors and Audit Committee, on a timely basis, with such information relating to the financial status of the Company, relevant business environment and other pertinent matters which are considered essential for the Board of Directors to fulfill its obligations.
The Executive Chairman, CEO, executive and senior financial officers are expected to adhere to both the TowneBank Standards of Conduct and the TowneBank Chief Executive Officer and Senior Financial Officers Code of Ethical Conduct at all times. The board of directors shall have the sole and absolute discretionary authority to approve any deviation or waiver from the Code of Ethical Conduct. Any waiver and the grounds for such waiver for the Executive Chairman, CEO, executive or senior financial officer shall be promptly disclosed through a filing with the Federal Deposit Insurance Corporation on Form 8-K. Additionally, any change of this Code of Ethical Conduct shall be promptly disclosed to shareholders.
The policy is applicable to executive officers for purposes of Regulation O, any person Executive Vice President and above in Corporate Accounting and the Chief Audit Executive.

TOWNEBANKCHIEF EXECUTIVE OFFICER, EXECUTIVE OFFICERS and SENIOR FINANCIAL OFFICERS
CODE OF ETHICAL CONDUCT
Please indicate that you have received, read and will abide by the TowneBank Chief Executive Officer, Executive Officers and Senior Financial Officers Code of Ethical Conduct by signing your name and dating the attached acknowledgment and returning it promptly to the Chairman and CEO of TowneBank.
ACKNOWLEDGMENT
I certify that I have received and read and that I will abide by the TowneBank Chief Executive Officer, Executive Officers and Senior Financial Officers Code of Ethical Conduct distributed to me on this _____________ day of _____________, 20___.
________________________________OFFICER
________________________________DATE

Exhibit (21)
Subsidiaries of TowneBank
Subsidiary State of Incorporation or Organization
TowneBank Investment Corporation Virginia Towne Investments, LLC Virginia TowneBank Woodview Investment Co., LLC Virginia TowneBank Woodview Investment Co. II, LLC Virginia TowneBank Heritage Forest, LLC Virginia TowneBank Cromwell House Affordable Housing, LLC Virginia TowneBank Pavilion Place Affordable Housing, LLC Virginia TowneBank Westbury Cottages Affordable Housing, LLC Virginia TowneBank Catalina Crossing Affordable Housing, LLC Virginia Hamilton Place Towne I, LLC Virginia Hamilton Place Towne II, LLC Virginia
TowneBank VCDC Fund 18, LLC Virginia TowneBank VCDC Fund 19, LLC Virginia TB Affordable Housing Equity Fund XX, LLC Virginia TB Affordable Housing Equity Fund XXI, LLC Virginia TB Affordable Housing Equity Fund XXII, LLC Virginia TB Affordable Housing Equity Fund XXIII, LLC Virginia TB Forrest Landing II Affordable Housing, LLC Virginia TB Foundry Affordable Housing, LLC Virginia TB HFHWC, LLC Virginia TB Lake View Affordable Housing, LLC Virginia TB Lake View II Affordable Housing, LLC Virginia TB Dale II Affordable Housing, LLC Virginia TB NC Affordable Housing Equity Fund XXIII, LLC Virginia TB NC Affordable Equity Fund XXIV, LLC Virginia TB NMF Affordable Housing, LLC Virginia TB Renaissance I Affordable Housing, LLC Virginia TB Renaissance II Affordable Housing, LLC Virginia TB Sunset Hampton Affordable Housing, LLC Virginia TB York Senior Affordable Housing, LLC Virginia TB Suffolk Senior Affordable Housing, LLC Virginia TB Market Heights Affordable Housing -4%, LLC Virginia TB PABP Affordable Housing, LLC Virginia TB PABP II Affordable Housing, LLC Virginia Affordable Housing Equity Fund XXIV, LLC Virginia Towne Financial Services Group, LLC Virginia
GSH Residential Real Estate Corporation Virginia Towne Oak Island RE, LLC Virginia Towne Vacations Oak Island, LLC, t/a Oak Island Accommodations Virginia Towne Vacations, LLC, t/a Beach Properties of Hilton Head Virginia Towne Vacations Deep Creek, LLC t/a Railey Mountain Lake Vacations Virginia

Subsidiaries of TowneBank (continued)
Subsidiary State of Incorporation or Organization Towne Deep Creek RE, LLC Virginia GSH NC Realty, LLC Virginia
Towne Realty LLC, t/a Berkshire Hathaway HomeServices Towne Realty Virginia
Eastern Title Company, Inc. Virginia PTR Referral, LLC Virginia
Virginia Home Title and Settlements, LLC Virginia Towne Insurance Agency, LLC Virginia
The Frieden Agency LLC, t/a Towne Benefits Virginia Benefit Design Group, LLC Virginia Beneflex Management, LLC Virginia Towne Insurance Agency of North Carolina, LLC North Carolina
TowneBank Commercial Mortgage, LLC VirginiaTowne Hall, LLC Virginia Towne 1031 Exchange, LLC VirginiaTowne Security, LLC VirginiaTowne Mortgage, LLC VirginiaNewTowne Mortgage, LLC VirginiaCoastal Towne Mortgage, LLC Virginia Advance Financial Group, LLC Virginia
Towne First Mortgage, LLC VirginiaFranklin Service Corporation VirginiaHomesale Mortgage, LLC VirginiaMayberry Real Estate Holdings, LLC Virginia PCB Trustee, INC. VirginiaReality Holdings, LLC VirginiaReality I, LLC VirginiaReality X, LLC Virginia Southeastern Virginia Investment Properties, LLC VirginiaSoutheastern Virginia Coastal Properties I, LLC VirginiaSoutheastern Virginia Properties, LLC VirginiaSoutheastern Virginia Properties at Uncles Neck, LLC Virginia
Towne Mortgage of the Carolinas, LLC North CarolinaNortheastern North Carolina Properties, LLC North CarolinaNortheastern North Carolina Properties Corolla Soundside, LLC North CarolinaNortheastern North Carolina Properties Oceanside Villas, LLC North CarolinaVirginia Hotel Properties, LLC VirginiaVirginia Properties Apartment and Land, LLC VirginiaCPF Partners, LLC VirginiaTBNCT, LLC North Carolina TBVAT, LLC VirginiaWest Suffolk Properties, LLC VirginiaTB Travel Services, LLC Virginia Monarch Investment, LLC Virginia Real Estate Security Agency, LLC Virginia

I, J. Morgan Davis, President and Chief Executive Officer, certify that:
1. I have reviewed this annual report on Form 10-K of TowneBank;
2. Based on my knowledge, this report does not contain any untrue statement of a material fact or omit to state a material fact necessary to make the statements made, in light of the circumstances under which such statements were made, not misleading with respect to the period covered by this report;
3. Based on my knowledge, the financial statements, and other financial information included in this report, fairly present in all material respects the financial condition, results of operations, and cash flows of the registrant as of, and for, the periods presented in this report;
4. The registrant's other certifying officer and I are responsible for establishing and maintaining disclosure controls and procedures (as defined in Exchange Act Rules 13a-15(e) and 15d-15(e)) and internal control over financial reporting (as defined in Exchange Act Rules 13a-15(f) and 15d-15(f)) for the registrant and have:
(a) Designed such disclosure controls and procedures, or caused such disclosure controls and procedures to be designed under our supervision, to ensure that material information relating to the registrant, including its consolidated subsidiaries, is made known to us by others within those entities, particularly during the period in which this report is being prepared;
(b) Designed such internal control over financial reporting, or caused such internal control over financial reporting to be designed under our supervision, to provide reasonable assurance regarding the reliability of financial reporting and the preparation of financial statements for external purposes in accordance with generally accepted accounting principles;
(c) Evaluated the effectiveness of the registrant's disclosure controls and procedures and presented in this report our conclusions about the effectiveness of the disclosure controls and procedures as of the end of the period covered by this report based on such evaluation; and
(d) Disclosed in this report any change in the registrant's internal control over financial reporting that occurred during the registrant’s most recent fiscal quarter (the registrant's fourth fiscal quarter in the case of an annual report) that has materially affected, or is reasonably likely to materially affect, the registrant's internal control over financial reporting; and
5. The registrant's other certifying officer and I have disclosed, based on our most recent evaluation of internal control over financial reporting, to the registrant's auditors and the audit committee of the registrant's board of directors (or persons performing the equivalent functions):
(a) All significant deficiencies and material weaknesses in the design or operation of internal control over financial reporting which are reasonably likely to adversely affect the registrant's ability to record, process, summarize, and report financial information; and
(b) Any fraud, whether or not material, that involves management or other employees who have a significant role in the registrant's internal control over financial reporting.
February 26, 2021 /s/ J. Morgan DavisDate J. Morgan Davis
President/Chief Executive Officer
Exhibit (31.1)
CERTIFICATION PURSUANT TO SECTION 302 OF THE SARBANES-OXLEY ACT OF 2002

I, William B. Littreal, Senior Executive Vice President and Chief Financial Officer, certify that:
1. I have reviewed this annual report on Form 10-K of TowneBank;
2. Based on my knowledge, this report does not contain any untrue statement of a material fact or omit to state a material fact necessary to make the statements made, in light of the circumstances under which such statements were made, not misleading with respect to the period covered by this report;
3. Based on my knowledge, the financial statements, and other financial information included in this report, fairly present in all material respects the financial condition, results of operations, and cash flows of the registrant as of, and for, the periods presented in this report;
4. The registrant's other certifying officer and I are responsible for establishing and maintaining disclosure controls and procedures (as defined in Exchange Act Rules 13a-15(e) and 15d-15(e)) and internal control over financial reporting (as defined in Exchange Act Rules 13a-15(f) and 15d-15(f)) for the registrant and have:
(a) Designed such disclosure controls and procedures, or caused such disclosure controls and procedures to be designed under our supervision, to ensure that material information relating to the registrant, including its consolidated subsidiaries, is made known to us by others within those entities, particularly during the period in which this report is being prepared;
(b) Designed such internal control over financial reporting, or caused such internal control over financial reporting to be designed under our supervision, to provide reasonable assurance regarding the reliability of financial reporting and the preparation of financial statements for external purposes in accordance with generally accepted accounting principles;
(c) Evaluated the effectiveness of the registrant's disclosure controls and procedures and presented in this report our conclusions about the effectiveness of the disclosure controls and procedures as of the end of the period covered by this report based on such evaluation; and
(d) Disclosed in this report any change in the registrant's internal control over financial reporting that occurred during the registrant's most recent fiscal quarter (the registrant's fourth fiscal quarter in the case of an annual report) that has materially affected, or is reasonably likely to materially affect, the registrant's internal control over financial reporting; and
5. The registrant's other certifying officer and I have disclosed, based on our most recent evaluation of internal control over financial reporting, to the registrant's auditors and the audit committee of the registrant's board of directors (or persons performing the equivalent functions):
(a) All significant deficiencies and material weaknesses in the design or operation of internal control over financial reporting which are reasonably likely to adversely affect the registrant's ability to record, process, summarize, and report financial information; and
(b) Any fraud, whether or not material, that involves management or other employees who have a significant role in the registrant's internal control over financial reporting.
February 26, 2021 /s/ William B. LittrealDate William B. Littreal
Senior Executive Vice President/CFO
Exhibit (31.2)
CERTIFICATION PURSUANT TO SECTION 302 OF THE SARBANES-OXLEY ACT OF 2002

Exhibit (32)
Certification Pursuant to 18 U.S.C. Section 1350,As Adopted BySection 906 of The Sarbanes-Oxley Act of 2002
Pursuant to 18 U.S.C. §1350, as adopted by §906 of the Sarbanes-Oxley Act of 2002, each of the undersigned officers of TowneBank (the "Bank"), do hereby certify, to such officer's knowledge, that:
1. Our Annual Report on Form 10-K for the year ended December 31, 2020 (the "Report") fully complies with the requirements of Section 13(a) of the Securities Exchange Act of 1934; and
2. The information contained in the Report presents fairly, in all material respects, our financial condition and results of operations as of and for the period covered by the Report.
February 26, 2021 /s/ J. Morgan DavisDate J. Morgan Davis
President/Chief Executive Officer
February 26, 2021 /s/ William B. LittrealDate William B. Littreal
Senior Executive Vice President/CFO
A signed original of this written statement required by Section 906 has been provided to TowneBank and will be retained by TowneBank and furnished to the Federal Deposit Insurance Corporation or its staff upon request.