Glass Lightweight Aggregates from Glass Cullet and Mining ...
Upload
independentCategory
view
1download
0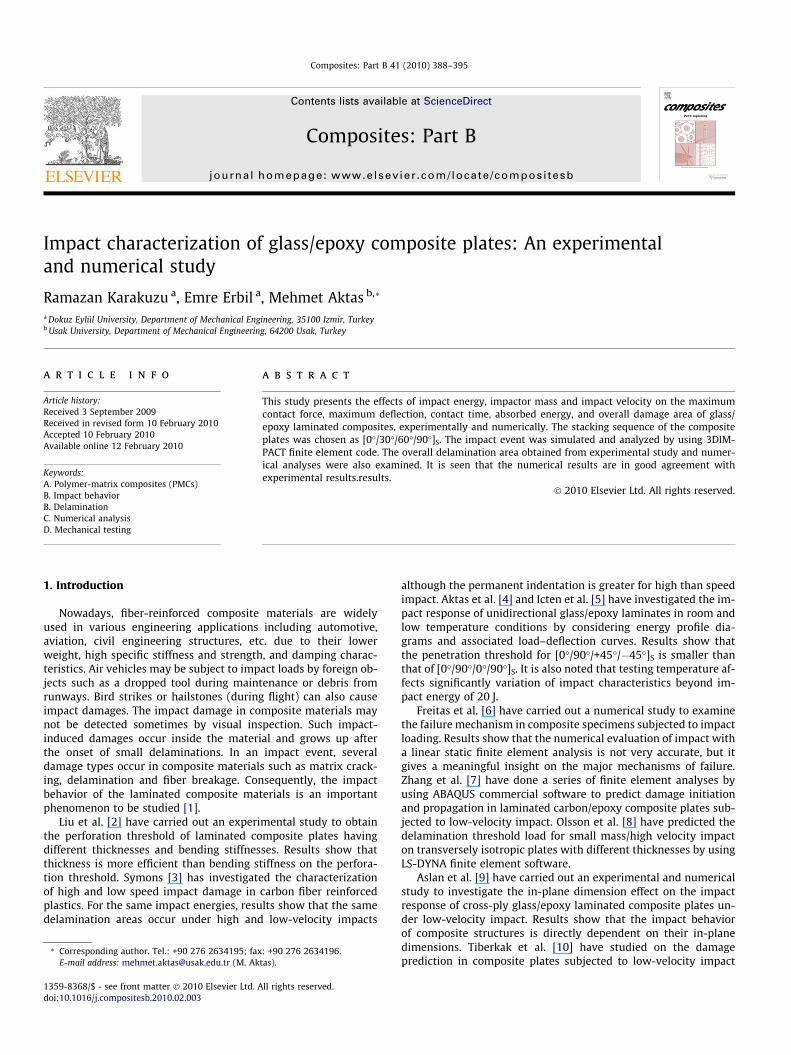
Composites: Part B 41 (2010) 388–395
Contents lists available at ScienceDirect
Composites: Part B
journal homepage: www.elsevier .com/locate /composi tesb
Impact characterization of glass/epoxy composite plates: An experimentaland numerical study
Ramazan Karakuzu a, Emre Erbil a, Mehmet Aktas b,*
a Dokuz Eylül University, Department of Mechanical Engineering, 35100 Izmir, Turkeyb Usak University, Department of Mechanical Engineering, 64200 Usak, Turkey
a r t i c l e i n f o
Article history:Received 3 September 2009Received in revised form 10 February 2010Accepted 10 February 2010Available online 12 February 2010
Keywords:A. Polymer-matrix composites (PMCs)B. Impact behaviorB. DelaminationC. Numerical analysisD. Mechanical testing
1359-8368/$ - see front matter � 2010 Elsevier Ltd. Adoi:10.1016/j.compositesb.2010.02.003
* Corresponding author. Tel.: +90 276 2634195; faxE-mail address: [email protected] (M. Ak
a b s t r a c t
This study presents the effects of impact energy, impactor mass and impact velocity on the maximumcontact force, maximum deflection, contact time, absorbed energy, and overall damage area of glass/epoxy laminated composites, experimentally and numerically. The stacking sequence of the compositeplates was chosen as [0�/30�/60�/90�]S. The impact event was simulated and analyzed by using 3DIM-PACT finite element code. The overall delamination area obtained from experimental study and numer-ical analyses were also examined. It is seen that the numerical results are in good agreement withexperimental results.results.
� 2010 Elsevier Ltd. All rights reserved.
1. Introduction
Nowadays, fiber-reinforced composite materials are widelyused in various engineering applications including automotive,aviation, civil engineering structures, etc. due to their lowerweight, high specific stiffness and strength, and damping charac-teristics. Air vehicles may be subject to impact loads by foreign ob-jects such as a dropped tool during maintenance or debris fromrunways. Bird strikes or hailstones (during flight) can also causeimpact damages. The impact damage in composite materials maynot be detected sometimes by visual inspection. Such impact-induced damages occur inside the material and grows up afterthe onset of small delaminations. In an impact event, severaldamage types occur in composite materials such as matrix crack-ing, delamination and fiber breakage. Consequently, the impactbehavior of the laminated composite materials is an importantphenomenon to be studied [1].
Liu et al. [2] have carried out an experimental study to obtainthe perforation threshold of laminated composite plates havingdifferent thicknesses and bending stiffnesses. Results show thatthickness is more efficient than bending stiffness on the perfora-tion threshold. Symons [3] has investigated the characterizationof high and low speed impact damage in carbon fiber reinforcedplastics. For the same impact energies, results show that the samedelamination areas occur under high and low-velocity impacts
ll rights reserved.
: +90 276 2634196.tas).
although the permanent indentation is greater for high than speedimpact. Aktas et al. [4] and Icten et al. [5] have investigated the im-pact response of unidirectional glass/epoxy laminates in room andlow temperature conditions by considering energy profile dia-grams and associated load–deflection curves. Results show thatthe penetration threshold for [0�/90�/+45�/�45�]S is smaller thanthat of [0�/90�/0�/90�]S. It is also noted that testing temperature af-fects significantly variation of impact characteristics beyond im-pact energy of 20 J.
Freitas et al. [6] have carried out a numerical study to examinethe failure mechanism in composite specimens subjected to impactloading. Results show that the numerical evaluation of impact witha linear static finite element analysis is not very accurate, but itgives a meaningful insight on the major mechanisms of failure.Zhang et al. [7] have done a series of finite element analyses byusing ABAQUS commercial software to predict damage initiationand propagation in laminated carbon/epoxy composite plates sub-jected to low-velocity impact. Olsson et al. [8] have predicted thedelamination threshold load for small mass/high velocity impacton transversely isotropic plates with different thicknesses by usingLS-DYNA finite element software.
Aslan et al. [9] have carried out an experimental and numericalstudy to investigate the in-plane dimension effect on the impactresponse of cross-ply glass/epoxy laminated composite plates un-der low-velocity impact. Results show that the impact behaviorof composite structures is directly dependent on their in-planedimensions. Tiberkak et al. [10] have studied on the damageprediction in composite plates subjected to low-velocity impact
R. Karakuzu et al. / Composites: Part B 41 (2010) 388–395 389
by the use of finite element analysis. Results showed that the in-crease of the 90� plies causes the increase in the contact forceand a reduction in the rigidity of laminate.
Mili and Necib [11] have considered the impact behavior ofglass/epoxy laminated composite plates under low-velocity impacttheoretically and experimentally. Tita et al. [12] have conductedexperimental and numerical studies to examine the stacking se-quence and impact energy effect on thin carbon/epoxy laminatedcomposite plates under low-velocity impact.
Li et al. [13] have done an experimental and numerical investi-gation on low-velocity impact-induced damage of continuous fi-ber-reinforced composite laminates. Results show that themaximum contact force decreases, while the maximum deflectionincreases with increasing of the plate size. In addition, the influ-ence of the boundary condition on the maximum contact force,maximum deflection and delamination size is very small. However,the impactor mass has a significant effect on the impact behaviorof the composite plates.
In this study, the effects of the equal impact energy (40 J), equalimpactor mass (5 kg) and equal velocity (2 m/s) on the contactforce, deflection, contact time, damage area and absorbed energyof glass/epoxy laminated composite plates with [0�/30�/60�/90�]S
orientation were examined, experimentally and numerically. Theequal impact energy remained constant by changing the impactvelocity or the impactor mass. Four different impact energies,10 J, 20 J, 30 J and 40 J, and four impactor masses, 5 kg, 10 kg,15 kg and 20 kg were chosen. The numerical analysis was doneby using 3DIMPACT finite element code.
Fig. 1. (a) Impact test fixture and (b) specimen clamp position.
2. Production of composite laminates
The glass/epoxy composite material used in this study was pro-duced in Izoreel Composite Isolate Materials Company. The unidi-rectional E-glass fabric having a weight of 509 g/m2 was used asreinforcing material. CY225 epoxy and HY225 hardener weremixed and applied to the E-glass fabric. Then, it was cured under0.25 MPa pressure during 2 h at 120 �C. The curing process wascarried out by using a hydraulic press with temperature and timecontrol. Composite plate consists of eight unidirectional layerswith approximately 0.36 mm thickness. At the end of the manufac-turing process, the final thickness of the composite plate was mea-sured as about 2.9 mm. The mechanical properties of thecomposite plate are given in Table 1 [14].
3. Experimental study
The impact tests were performed by using Fractovis Plus testmachine at room temperature. The impact test fixture is given inFig. 1a. During the tests, the impactor with a hemispherical noseof 12.7 mm in diameter and a piezoelectric force transducer local-ized in the hemispherical impactor nose with the capacity of
Table 1Mechanical properties of the lamina [15].
Property Value
Density, q (g/cm3) 1.83Longitudinal modulus, E1 (GPa) 40.51Transverse modulus, E2 (GPa) 13.96In-plane shear modulus, G12 (GPa) 3.10Poison’s ratio, m12 0.22In-plane shear strength, S12 (GPa) 69.00Long. tensile strength, Xt (MPa) 783.30Trans. tensile strength, Yt (MPa) 64.00Long. comp. strength, Xc (MPa) 298.00Trans. comp. strength, Yc (MPa) 124.00Interlaminar shear strength, S1 (MPa) 38.00
22.24 kN was used. An automatic clamping device was also usedin the environmental chamber of the test machine to clamp thespecimen before impact. The dimensions of the specimens werechosen as 100 mm � 100 mm. However, the inner diameter ofthe clamping ring is 76.2 mm. The impact specimen and clampingring are schematically illustrated in Fig. 1b. Four different massesincluding the impactor mass and the crosshead mass were se-lected, 5 kg, 10 kg, 15 kg and 20 kg.
The stacking sequence of the impact specimen was chosen as [0�/30�/60�/90�]S. Impact tests were performed for three varied param-eters; equal impact energy, equal impactor mass and equal impactvelocity. Nine major experiments were performed for differentimpactor masses and impact energies. Each experiment was re-peated three times. The values of the impact velocity depending onthe impactor mass and energy are presented in Table 2.
Table 2The velocity of the impactor for different impact test cases (m/s).
Impactor mass Impact energy
10 J 20 J 30 J 40 J
5 kg 2.00 2.83 3.46 4.0010 kg – 2.00 – 2.8315 kg – – 2.00 2.3120 kg – – – 2.00
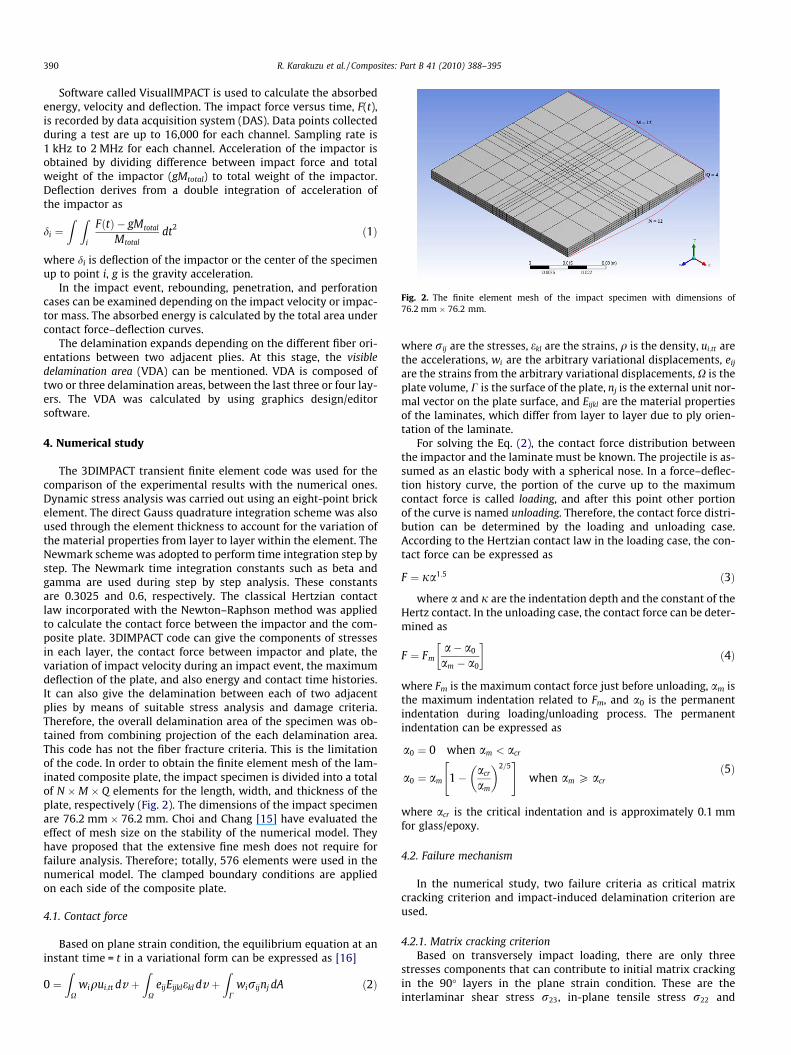
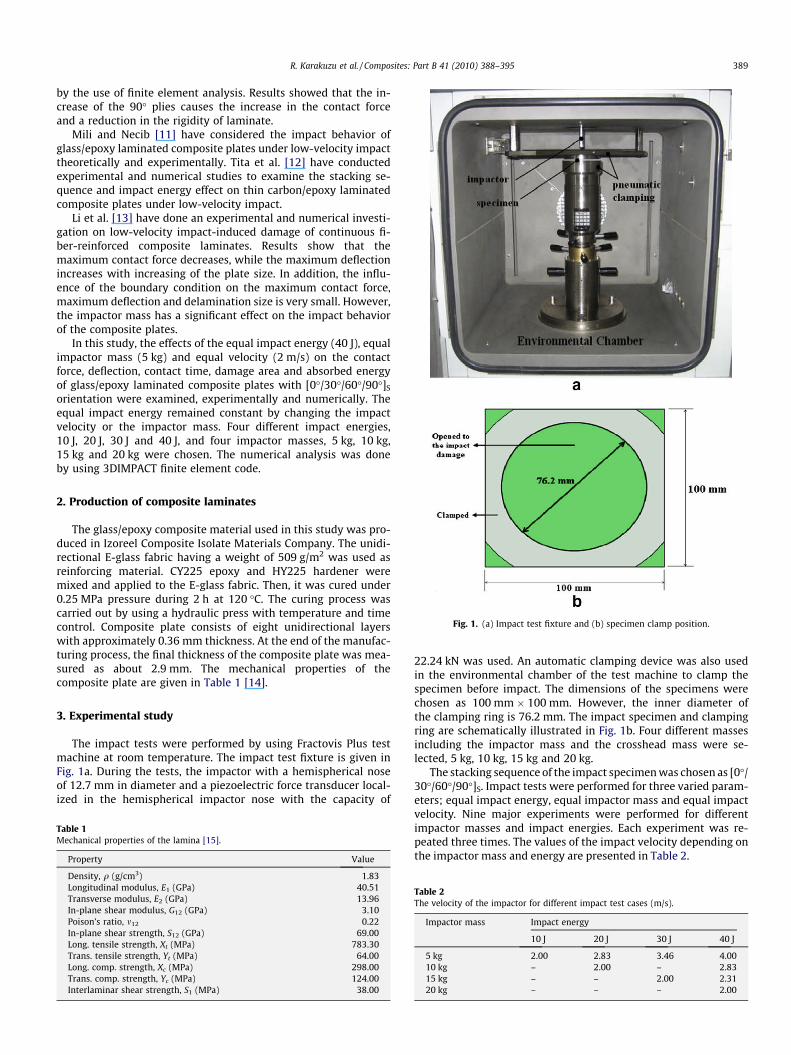
Fig. 2. The finite element mesh of the impact specimen with dimensions of76.2 mm � 76.2 mm.
390 R. Karakuzu et al. / Composites: Part B 41 (2010) 388–395
Software called VisualIMPACT is used to calculate the absorbedenergy, velocity and deflection. The impact force versus time, F(t),is recorded by data acquisition system (DAS). Data points collectedduring a test are up to 16,000 for each channel. Sampling rate is1 kHz to 2 MHz for each channel. Acceleration of the impactor isobtained by dividing difference between impact force and totalweight of the impactor (gMtotal) to total weight of the impactor.Deflection derives from a double integration of acceleration ofthe impactor as
di ¼Z Z
i
FðtÞ � gMtotal
Mtotaldt2 ð1Þ
where di is deflection of the impactor or the center of the specimenup to point i, g is the gravity acceleration.
In the impact event, rebounding, penetration, and perforationcases can be examined depending on the impact velocity or impac-tor mass. The absorbed energy is calculated by the total area undercontact force–deflection curves.
The delamination expands depending on the different fiber ori-entations between two adjacent plies. At this stage, the visibledelamination area (VDA) can be mentioned. VDA is composed oftwo or three delamination areas, between the last three or four lay-ers. The VDA was calculated by using graphics design/editorsoftware.
4. Numerical study
The 3DIMPACT transient finite element code was used for thecomparison of the experimental results with the numerical ones.Dynamic stress analysis was carried out using an eight-point brickelement. The direct Gauss quadrature integration scheme was alsoused through the element thickness to account for the variation ofthe material properties from layer to layer within the element. TheNewmark scheme was adopted to perform time integration step bystep. The Newmark time integration constants such as beta andgamma are used during step by step analysis. These constantsare 0.3025 and 0.6, respectively. The classical Hertzian contactlaw incorporated with the Newton–Raphson method was appliedto calculate the contact force between the impactor and the com-posite plate. 3DIMPACT code can give the components of stressesin each layer, the contact force between impactor and plate, thevariation of impact velocity during an impact event, the maximumdeflection of the plate, and also energy and contact time histories.It can also give the delamination between each of two adjacentplies by means of suitable stress analysis and damage criteria.Therefore, the overall delamination area of the specimen was ob-tained from combining projection of the each delamination area.This code has not the fiber fracture criteria. This is the limitationof the code. In order to obtain the finite element mesh of the lam-inated composite plate, the impact specimen is divided into a totalof N �M � Q elements for the length, width, and thickness of theplate, respectively (Fig. 2). The dimensions of the impact specimenare 76.2 mm � 76.2 mm. Choi and Chang [15] have evaluated theeffect of mesh size on the stability of the numerical model. Theyhave proposed that the extensive fine mesh does not require forfailure analysis. Therefore; totally, 576 elements were used in thenumerical model. The clamped boundary conditions are appliedon each side of the composite plate.
4.1. Contact force
Based on plane strain condition, the equilibrium equation at aninstant time = t in a variational form can be expressed as [16]
0 ¼Z
Xwiqui;tt dv þ
ZX
eijEijklekl dv þZ
Cwirijnj dA ð2Þ
where rij are the stresses, ekl are the strains, q is the density, ui;tt arethe accelerations, wi are the arbitrary variational displacements, eij
are the strains from the arbitrary variational displacements, X is theplate volume, C is the surface of the plate, nj is the external unit nor-mal vector on the plate surface, and Eijkl are the material propertiesof the laminates, which differ from layer to layer due to ply orien-tation of the laminate.
For solving the Eq. (2), the contact force distribution betweenthe impactor and the laminate must be known. The projectile is as-sumed as an elastic body with a spherical nose. In a force–deflec-tion history curve, the portion of the curve up to the maximumcontact force is called loading, and after this point other portionof the curve is named unloading. Therefore, the contact force distri-bution can be determined by the loading and unloading case.According to the Hertzian contact law in the loading case, the con-tact force can be expressed as
F ¼ ja1:5 ð3Þ
where a and j are the indentation depth and the constant of theHertz contact. In the unloading case, the contact force can be deter-mined as
F ¼ Fma� a0
am � a0
� �ð4Þ
where Fm is the maximum contact force just before unloading, am isthe maximum indentation related to Fm, and a0 is the permanentindentation during loading/unloading process. The permanentindentation can be expressed as
a0 ¼ 0 when am < acr
a0 ¼ am 1� acr
am
� �2=5" #
when am P acrð5Þ
where acr is the critical indentation and is approximately 0.1 mmfor glass/epoxy.
4.2. Failure mechanism
In the numerical study, two failure criteria as critical matrixcracking criterion and impact-induced delamination criterion areused.
4.2.1. Matrix cracking criterionBased on transversely impact loading, there are only three
stresses components that can contribute to initial matrix crackingin the 90� layers in the plane strain condition. These are theinterlaminar shear stress r23, in-plane tensile stress r22 and
Fig. 3. Energy profiling diagram for the experimental results.
R. Karakuzu et al. / Composites: Part B 41 (2010) 388–395 391
out-of-plane normal stress r33. However, the out-of-plane normalstress is very small in comparison with the other two stresses dur-ing an entire impact event. Hence, the matrix cracking criterion canbe expressed as (r22 P 0) [17]
n �r22nYt
� �2
þn �r23
nSi
� �2
¼ e2M
eM P 0 failureeM < 0 no failure
�ð6Þ
where the subscripts of 1 and 2 are the local coordinates of the nthlayer parallel and normal to the fiber directions, respectively, and 3is the out-of-plane direction. nYt and nSi are the in situ ply trans-verse tensile strength and interlaminar transverse shear strengthwithin the nth ply of laminate under consideration, respectively.n �r23 and n �r22 are the averaged interlaminar transverse shear stressand the averaged in-plane transverse tensile stress, respectively.
For determining any additional matrix failure, the criterionmust be applied to the other layers. If no additional matrix crack-ing is found during impact, then the impactor’s velocity associatedwith the first matrix cracking is referred to as the impact velocitythreshold, which is the velocity required to just cause the initialimpact damage of the laminate.
4.2.2. Impact-induced delamination criterionBasically two types of critical cracks initiating delamination
resulting from impact as shear crack and bending crack. For theshear crack, delamination can occur due to the interlaminar longi-tudinal shear stress r13 and the interlaminar transverse shearstress r23. However, for the bending crack, delamination can occurdue to the interlaminar longitudinal shear stress r13 and the in-plane bending stress r22. By taking both failure mechanisms,delamination could occur only when the following two sequentialconditions are met:
� One of the ply groups intimately above or below the concernedinterface has failed due to matrix cracking.
� The combined stresses governing the delamination growthmechanisms through the thicknesses of the upper and lowerply groups of the interface reaches a critical value.
Based on the above statement, impact-induced delaminationcriterion for low-velocity impact can be given as:
Da
n �r23nSi
� �2
þnþ1 �r13
nþ1Si
� �2
þnþ1 �r22
nþ1Y
� �2" #
¼ e2D
eD P 1 failureeD < 1 no failurenþ1Y ¼ nþ1Yt if �r22 P 0nþ1Y ¼ nþ1Yc if r22 < 0
8>><>>:
ð7Þ
where Da is a constant which is determined from impact tests. Thesuperscripts n and n + 1 correspond to the upper and lower plies ofthe nth interface, respectively. n �r23 and nþ1 �r22 are the averagedinterlaminar and in-plane transverse stresses within the nth and(n + 1)th ply, respectively. nþ1 �r13 is the averaged interlaminar longi-tudinal stress within the (n + 1)th ply.
5. Results and discussion
In this study, the effects of equal impact energy, equal impactormass and equal impact velocity on the maximum contact force,maximum deflection, contact time, absorbed energy and overalldamage area of glass/epoxy laminated composite plates wereinvestigated, experimentally and numerically.
The impact energy versus the absorbed energy is plotted forequal mass and equal velocity as shown in Fig. 3 by using energyprofiling diagrams [2,4]. That is variation of the absorbed energy
versus impact energy is plotted for two equal parameters; massand velocity. It is clearly seen from Fig. 3 that all the specimensare of the rebounding case. However, the specimen subjected to40 J for equal velocity has reached the penetration threshold. Inaddition, the energy absorption capability of the specimen sub-jected to equal mass is lower than the specimen subjected to equalvelocity, for the same impact energy.
For a better understanding of the impact behavior of glass/epoxy composite plates, only the maximum values of the contactforce, maximum deflection and contact time are given in Fig. 4. Asseen in the figure, the equal mass and the equal velocity havenearly the same effects on the maximum contact force and max-imum deflection while the impact energy increases (Fig. 4a andb). However, the effect of both on the contact time differs fromeach other (Fig. 4c). In the range of 10–20 J, the maximum contactforce changes linearly with increasing impact energy for the equalmass and the equal velocity. Beyond the energy level of 20 J, themaximum contact force is observed to have a nonlinear behaviorfor both parameters varied, Fig. 4a. Maximum deflection changeslinearly by increasing impact energy for the plates subjected toequal mass and equal velocity (Fig. 4b). It can be seen fromFig. 4c that the velocity is the most important parameter forthe contact duration. The equal mass does not affect significantlycontact time. The effect of equal velocity on the contact time ismuch higher than the equal mass when the impact energyincreases.
The contact time for the different impactor mass and impact en-ergy is given in Table 3. The change of contact time between 5 kgand 20 kg impactor mass for the same impact energy (40 J) dis-plays the energy transfer speeds. Transfer of the energy dependson the magnitude of the impactor mass. High-mass impacts causelarger contact time than low-mass impacts for the same impactenergy.
The variation of the contact force and energy versus the contacttime is illustrated in Fig. 5a and b. The contact force versus deflec-tion is also given in Fig. 5c. It can be seen from the figure that, thecontact force increases by increasing impact energy, while theimpactor mass remains constant, 5 kg. The loading portions ofthe graphs are similar, but unloading portions differ due to dissim-ilar damage mechanisms. The loading and unloading portions ofthe curves are smoother for the samples subjected to 5 kg to 10 Jand 5 kg to 20 J. The damages of these specimens are matrix crack-ing and delamination. The damage consists mostly of matrix dam-age and fiber fractures for the samples subjected to higherimpactor mass, for instance, 15 kg to 40 J, 20 kg to 40 J and 15 kgto 30 J. For the same impact energy levels, the lightweight – thefastest impactor (for instance, 5 kg to 40 J) causes earlier damageand reaches the peak contact force earlier (Fig. 5a). The highermass causes higher absorbed energy at the same impact energy va-lue. Because some of the impact energy is dissipated owing to
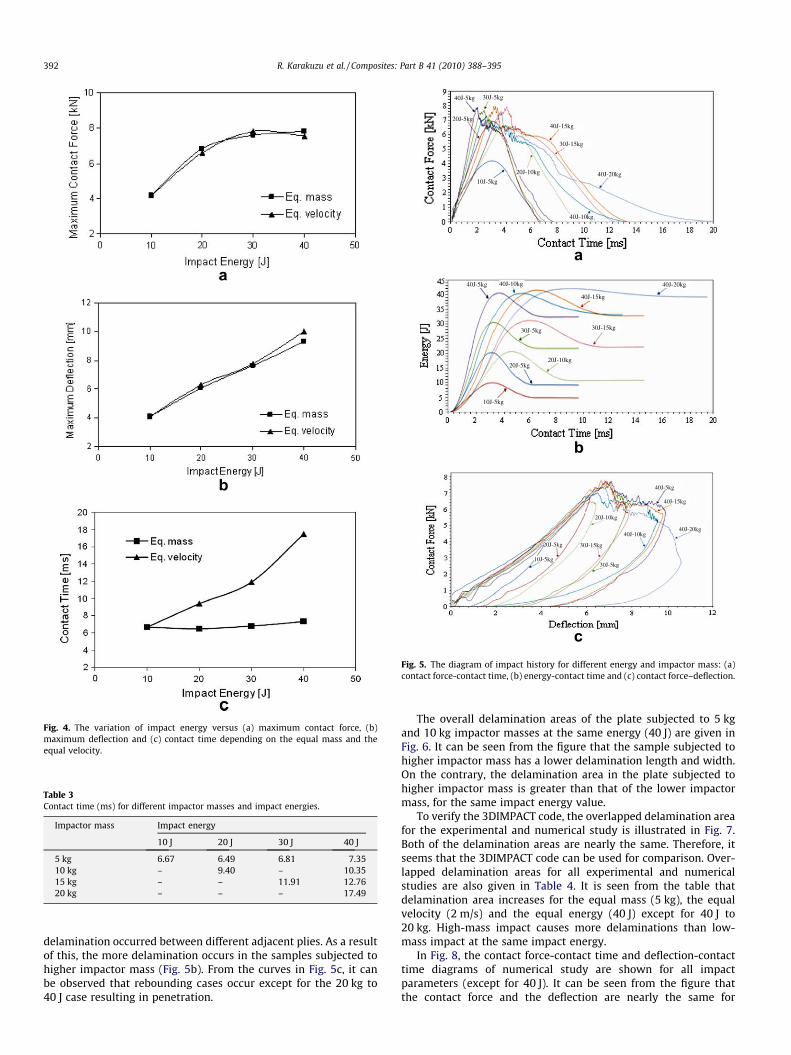
Fig. 4. The variation of impact energy versus (a) maximum contact force, (b)maximum deflection and (c) contact time depending on the equal mass and theequal velocity.
Table 3Contact time (ms) for different impactor masses and impact energies.
Impactor mass Impact energy
10 J 20 J 30 J 40 J
5 kg 6.67 6.49 6.81 7.3510 kg – 9.40 – 10.3515 kg – – 11.91 12.7620 kg – – – 17.49
40J-5kg 30J-5kg
20J-5kg40J-15kg
30J-15kg
40J-20kg
40J-10kg
20J-10kg
10J-5kg
40J-10kg40J-5kg
30J-5kg 30J-15kg
20J-10kg20J-5kg
10J-5kg
10J-5kg
20J-5kg
30J-5kg
30J-15kg
40J-10kg
20J-10kg
40J-20kg
40J-15kg
40J-5kg
40J-20kg
40J-15kg
a
b
cFig. 5. The diagram of impact history for different energy and impactor mass: (a)contact force-contact time, (b) energy-contact time and (c) contact force–deflection.
392 R. Karakuzu et al. / Composites: Part B 41 (2010) 388–395
delamination occurred between different adjacent plies. As a resultof this, the more delamination occurs in the samples subjected tohigher impactor mass (Fig. 5b). From the curves in Fig. 5c, it canbe observed that rebounding cases occur except for the 20 kg to40 J case resulting in penetration.
The overall delamination areas of the plate subjected to 5 kgand 10 kg impactor masses at the same energy (40 J) are given inFig. 6. It can be seen from the figure that the sample subjected tohigher impactor mass has a lower delamination length and width.On the contrary, the delamination area in the plate subjected tohigher impactor mass is greater than that of the lower impactormass, for the same impact energy value.
To verify the 3DIMPACT code, the overlapped delamination areafor the experimental and numerical study is illustrated in Fig. 7.Both of the delamination areas are nearly the same. Therefore, itseems that the 3DIMPACT code can be used for comparison. Over-lapped delamination areas for all experimental and numericalstudies are also given in Table 4. It is seen from the table thatdelamination area increases for the equal mass (5 kg), the equalvelocity (2 m/s) and the equal energy (40 J) except for 40 J to20 kg. High-mass impact causes more delaminations than low-mass impact at the same impact energy.
In Fig. 8, the contact force-contact time and deflection-contacttime diagrams of numerical study are shown for all impactparameters (except for 40 J). It can be seen from the figure thatthe contact force and the deflection are nearly the same for
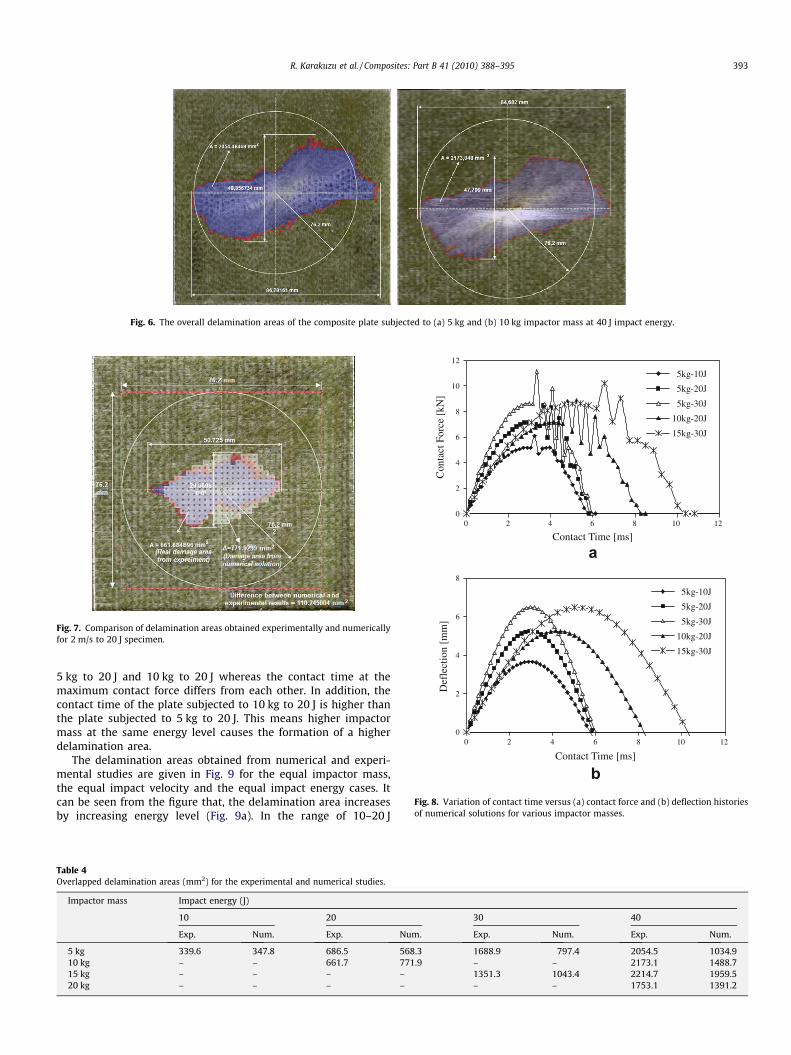
Fig. 6. The overall delamination areas of the composite plate subjected to (a) 5 kg and (b) 10 kg impactor mass at 40 J impact energy.
Fig. 7. Comparison of delamination areas obtained experimentally and numericallyfor 2 m/s to 20 J specimen.
0
2
4
6
8
10
12
Contact Time [ms]
Con
tact
For
ce [
kN]
5kg-10J
5kg-20J
5kg-30J
10kg-20J
15kg-30J
0
2
4
6
8
0 2 4 6 8 10 12
0 2 4 6 8 10 12
Contact Time [ms]
Def
lect
ion
[mm
]
5kg-10J
5kg-20J
5kg-30J
10kg-20J
15kg-30J
a
bFig. 8. Variation of contact time versus (a) contact force and (b) deflection historiesof numerical solutions for various impactor masses.
R. Karakuzu et al. / Composites: Part B 41 (2010) 388–395 393
5 kg to 20 J and 10 kg to 20 J whereas the contact time at themaximum contact force differs from each other. In addition, thecontact time of the plate subjected to 10 kg to 20 J is higher thanthe plate subjected to 5 kg to 20 J. This means higher impactormass at the same energy level causes the formation of a higherdelamination area.
The delamination areas obtained from numerical and experi-mental studies are given in Fig. 9 for the equal impactor mass,the equal impact velocity and the equal impact energy cases. Itcan be seen from the figure that, the delamination area increasesby increasing energy level (Fig. 9a). In the range of 10–20 J
Table 4Overlapped delamination areas (mm2) for the experimental and numerical studies.
Impactor mass Impact energy (J)
10 20 30 40
Exp. Num. Exp. Num. Exp. Num. Exp. Num.
5 kg 339.6 347.8 686.5 568.3 1688.9 797.4 2054.5 1034.910 kg – – 661.7 771.9 – – 2173.1 1488.715 kg – – – – 1351.3 1043.4 2214.7 1959.520 kg – – – – – – 1753.1 1391.2
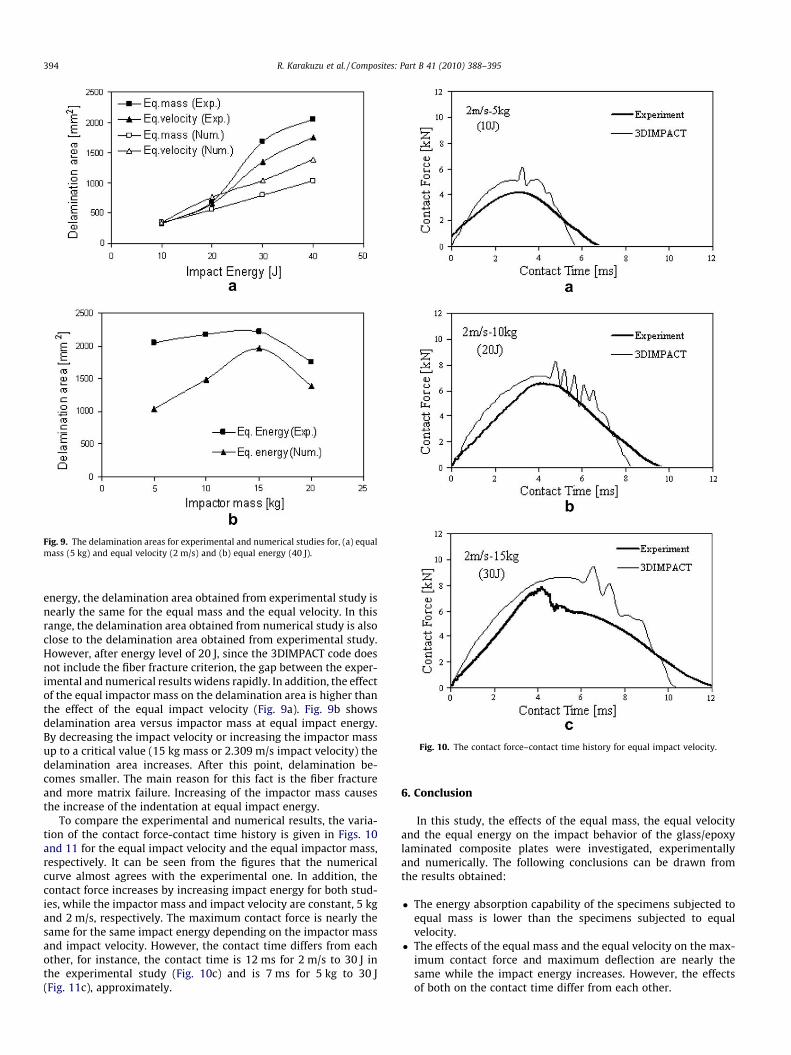
Fig. 9. The delamination areas for experimental and numerical studies for, (a) equalmass (5 kg) and equal velocity (2 m/s) and (b) equal energy (40 J).
Fig. 10. The contact force–contact time history for equal impact velocity.
394 R. Karakuzu et al. / Composites: Part B 41 (2010) 388–395
energy, the delamination area obtained from experimental study isnearly the same for the equal mass and the equal velocity. In thisrange, the delamination area obtained from numerical study is alsoclose to the delamination area obtained from experimental study.However, after energy level of 20 J, since the 3DIMPACT code doesnot include the fiber fracture criterion, the gap between the exper-imental and numerical results widens rapidly. In addition, the effectof the equal impactor mass on the delamination area is higher thanthe effect of the equal impact velocity (Fig. 9a). Fig. 9b showsdelamination area versus impactor mass at equal impact energy.By decreasing the impact velocity or increasing the impactor massup to a critical value (15 kg mass or 2.309 m/s impact velocity) thedelamination area increases. After this point, delamination be-comes smaller. The main reason for this fact is the fiber fractureand more matrix failure. Increasing of the impactor mass causesthe increase of the indentation at equal impact energy.
To compare the experimental and numerical results, the varia-tion of the contact force-contact time history is given in Figs. 10and 11 for the equal impact velocity and the equal impactor mass,respectively. It can be seen from the figures that the numericalcurve almost agrees with the experimental one. In addition, thecontact force increases by increasing impact energy for both stud-ies, while the impactor mass and impact velocity are constant, 5 kgand 2 m/s, respectively. The maximum contact force is nearly thesame for the same impact energy depending on the impactor massand impact velocity. However, the contact time differs from eachother, for instance, the contact time is 12 ms for 2 m/s to 30 J inthe experimental study (Fig. 10c) and is 7 ms for 5 kg to 30 J(Fig. 11c), approximately.
6. Conclusion
In this study, the effects of the equal mass, the equal velocityand the equal energy on the impact behavior of the glass/epoxylaminated composite plates were investigated, experimentallyand numerically. The following conclusions can be drawn fromthe results obtained:
� The energy absorption capability of the specimens subjected toequal mass is lower than the specimens subjected to equalvelocity.
� The effects of the equal mass and the equal velocity on the max-imum contact force and maximum deflection are nearly thesame while the impact energy increases. However, the effectsof both on the contact time differ from each other.
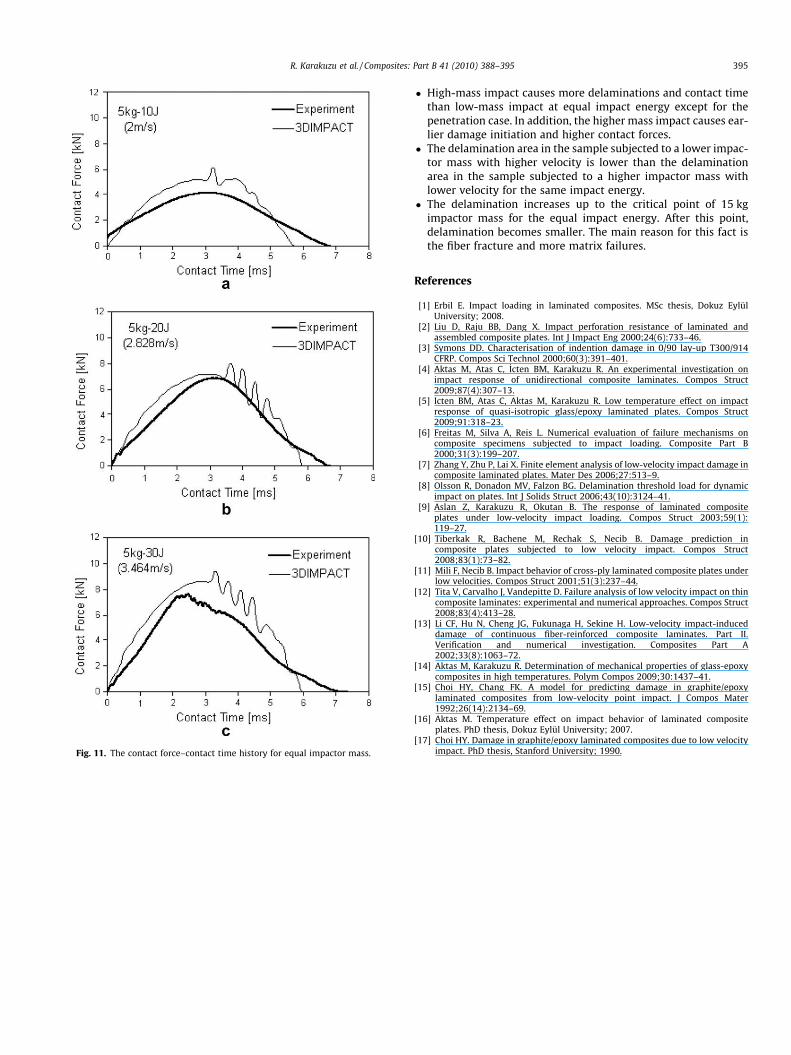
Fig. 11. The contact force–contact time history for equal impactor mass.
R. Karakuzu et al. / Composites: Part B 41 (2010) 388–395 395
� High-mass impact causes more delaminations and contact timethan low-mass impact at equal impact energy except for thepenetration case. In addition, the higher mass impact causes ear-lier damage initiation and higher contact forces.
� The delamination area in the sample subjected to a lower impac-tor mass with higher velocity is lower than the delaminationarea in the sample subjected to a higher impactor mass withlower velocity for the same impact energy.
� The delamination increases up to the critical point of 15 kgimpactor mass for the equal impact energy. After this point,delamination becomes smaller. The main reason for this fact isthe fiber fracture and more matrix failures.
References
[1] Erbil E. Impact loading in laminated composites. MSc thesis, Dokuz EylülUniversity; 2008.
[2] Liu D, Raju BB, Dang X. Impact perforation resistance of laminated andassembled composite plates. Int J Impact Eng 2000;24(6):733–46.
[3] Symons DD. Characterisation of indention damage in 0/90 lay-up T300/914CFRP. Compos Sci Technol 2000;60(3):391–401.
[4] Aktas M, Atas C, _Icten BM, Karakuzu R. An experimental investigation onimpact response of unidirectional composite laminates. Compos Struct2009;87(4):307–13.
[5] Icten BM, Atas C, Aktas M, Karakuzu R. Low temperature effect on impactresponse of quasi-isotropic glass/epoxy laminated plates. Compos Struct2009;91:318–23.
[6] Freitas M, Silva A, Reis L. Numerical evaluation of failure mechanisms oncomposite specimens subjected to impact loading. Composite Part B2000;31(3):199–207.
[7] Zhang Y, Zhu P, Lai X. Finite element analysis of low-velocity impact damage incomposite laminated plates. Mater Des 2006;27:513–9.
[8] Olsson R, Donadon MV, Falzon BG. Delamination threshold load for dynamicimpact on plates. Int J Solids Struct 2006;43(10):3124–41.
[9] Aslan Z, Karakuzu R, Okutan B. The response of laminated compositeplates under low-velocity impact loading. Compos Struct 2003;59(1):119–27.
[10] Tiberkak R, Bachene M, Rechak S, Necib B. Damage prediction incomposite plates subjected to low velocity impact. Compos Struct2008;83(1):73–82.
[11] Mili F, Necib B. Impact behavior of cross-ply laminated composite plates underlow velocities. Compos Struct 2001;51(3):237–44.
[12] Tita V, Carvalho J, Vandepitte D. Failure analysis of low velocity impact on thincomposite laminates: experimental and numerical approaches. Compos Struct2008;83(4):413–28.
[13] Li CF, Hu N, Cheng JG, Fukunaga H, Sekine H. Low-velocity impact-induceddamage of continuous fiber-reinforced composite laminates. Part II.Verification and numerical investigation. Composites Part A2002;33(8):1063–72.
[14] Aktas M, Karakuzu R. Determination of mechanical properties of glass-epoxycomposites in high temperatures. Polym Compos 2009;30:1437–41.
[15] Choi HY, Chang FK. A model for predicting damage in graphite/epoxylaminated composites from low-velocity point impact. J Compos Mater1992;26(14):2134–69.
[16] Aktas M. Temperature effect on impact behavior of laminated compositeplates. PhD thesis, Dokuz Eylül University; 2007.
[17] Choi HY. Damage in graphite/epoxy laminated composites due to low velocityimpact. PhD thesis, Stanford University; 1990.
Copyright © 2022 FDOKUMEN