Characterization of Mechanical and Electrical Properties of Epoxy-Glass Microballoon Syntactic...
13
Ferroelectrics, 345:1–12, 2006 Copyright © Taylor & Francis Group, LLC ISSN: 0015-0193 print / 1563-5112 online DOI: 10.1080/00150190601018002 Characterization of Mechanical and Electrical Properties of Epoxy-Glass Microballoon Syntactic Composites NIKHIL GUPTA, 1,∗ SHASHANK PRIYA, 2 RASHED ISLAM, 2 AND WILLIAM RICCI 1 1 Composite Materials and Mechanics Laboratory, Mechanical, Aerospace and Manufacturing Engineering, Polytechnic University, Brooklyn, NY 11201, USA 2 Materials Science and Engineering, Automation Robotics Research Institute, University of Texas at Arlington, Arlington, TX 76019, USA The density of hollow particle (microballoon) filled composites called syntactic foams can be varied by two methods. The first method is the variation in microballoon volume fraction and the second method is the variation in the microballoon wall thickness, while keeping their volume fraction the same. A comparison of compressive properties of syntactic foams having microballoons of four different wall thicknesses in five volume fraction each is presented here. It is found that the compressive strength and modulus vary linearly with respect to the foam density. Dielectric constant, dielectric loss and electrical impedance are measured for four syntactic foam compositions with respect to temperature and frequency. Dielectric constant and loss are found to decrease with increase in frequency and with decrease in temperature in the range of 40–140 ◦ C. Keywords Particle-reinforced composites (A); polymer-matrix composites (A); elec- trical properties (B); porosity (B); syntactic foam Introduction Hollow glass particles (microballoons) are filled in polymers or metals to create low den- sity composite materials called syntactic foams. Large numbers of published studies have characterized epoxy resin matrix syntactic foams for a variety of properties. Compressive properties have been studied in great detail because most of the applications of these ma- terials are in the marine structures where hydrostatic compression is the most common force applied on the material [1–4]. For the same reason, moisture absorption is also found studied [5]. It is found that these materials have a capacity to absorb large compressive strains because of the hollow space within their structure. However, under tensile loading condition the epoxy based foams were found to fracture in brittle manner, at the end of their linear elastic region [6, 7]. Tensile properties of syntactic foams are highly dependent on Received August 21, 2006. ∗ Corresponding author. Dr. Nikhil Gupta, Mechanical, Aerospace and Manufacturing Engineering Department, Six MetroTech Center, Brooklyn, NY 11201, Phone: 718-2603080; Fax: 718-2603532; E-mail: [email protected] 1
Transcript of Characterization of Mechanical and Electrical Properties of Epoxy-Glass Microballoon Syntactic...

Ferroelectrics, 345:1–12, 2006
Copyright © Taylor & Francis Group, LLC
ISSN: 0015-0193 print / 1563-5112 online
DOI: 10.1080/00150190601018002
Characterization of Mechanical and ElectricalProperties of Epoxy-Glass Microballoon
Syntactic Composites
NIKHIL GUPTA,1,∗ SHASHANK PRIYA,2 RASHED ISLAM,2
AND WILLIAM RICCI1
1Composite Materials and Mechanics Laboratory, Mechanical, Aerospace and
Manufacturing Engineering, Polytechnic University, Brooklyn, NY 11201, USA2Materials Science and Engineering, Automation Robotics Research Institute,
University of Texas at Arlington, Arlington, TX 76019, USA
The density of hollow particle (microballoon) filled composites called syntactic foamscan be varied by two methods. The first method is the variation in microballoon volumefraction and the second method is the variation in the microballoon wall thickness,while keeping their volume fraction the same. A comparison of compressive propertiesof syntactic foams having microballoons of four different wall thicknesses in five volumefraction each is presented here. It is found that the compressive strength and modulusvary linearly with respect to the foam density. Dielectric constant, dielectric loss andelectrical impedance are measured for four syntactic foam compositions with respectto temperature and frequency. Dielectric constant and loss are found to decrease withincrease in frequency and with decrease in temperature in the range of 40–140◦C.
Keywords Particle-reinforced composites (A); polymer-matrix composites (A); elec-
trical properties (B); porosity (B); syntactic foam
Introduction
Hollow glass particles (microballoons) are filled in polymers or metals to create low den-
sity composite materials called syntactic foams. Large numbers of published studies have
characterized epoxy resin matrix syntactic foams for a variety of properties. Compressive
properties have been studied in great detail because most of the applications of these ma-
terials are in the marine structures where hydrostatic compression is the most common
force applied on the material [1–4]. For the same reason, moisture absorption is also found
studied [5]. It is found that these materials have a capacity to absorb large compressive
strains because of the hollow space within their structure. However, under tensile loading
condition the epoxy based foams were found to fracture in brittle manner, at the end of their
linear elastic region [6, 7]. Tensile properties of syntactic foams are highly dependent on
Received August 21, 2006.∗Corresponding author. Dr. Nikhil Gupta, Mechanical, Aerospace and Manufacturing
Engineering Department, Six MetroTech Center, Brooklyn, NY 11201, Phone: 718-2603080;
Fax: 718-2603532; E-mail: [email protected]
1

2 N. Gupta et al.
the characteristics of matrix material. Matrix modification can be carried out to enhance the
elastic and plastic strain in syntactic foams.
It is known that the strength of syntactic foams increases with an increase in their density.
Two approaches have been found studied in the published literature to modify the density of
syntactic foams. The first approach is based on increasing the microballoon volume fraction
(Vmb) in the syntactic foam structure to decrease their density. Typically, microballoons are
lighter than the polymer used as the matrix material, hence, increase in Vmb leads to decreased
density of the composite. However, a newer approach uses microballoon wall thickness to
vary the density of syntactic foams. Microballoons with higher wall thickness have higher
strength and lead to stronger syntactic foams. In these studies a parameter named Radius
Ratio (η), defined as the ratio of inner to the outer radius of microballoons is used to relate
the microballoon size and wall thickness [8]. Although, considerable amount of data on
compressive strength and modulus can be found published in the literature, there is absence
of comprehensive studies that utilize the same type of microballoons and matrix material
to compare the effectiveness of both approaches. Existence of such comprehensive data
will also make it possible to validate theoretical models developed for these materials. The
present study is an attempt to fill his gap by comprehensive experimental characterization of
twenty types of syntactic foams having four different types of microballoons in five volume
fractions, over the range of 0.3–0.65, each.
New applications of syntactic foams are being continuously developed making it nec-
essary to characterize other types of properties also. Epoxies are widely used in electrical
and electronic insulation and packaging applications. Epoxy based syntactic foams are also
used as low density materials in electronic applications. However, only a few studies are
available that characterize syntactic foams for their electrical properties [9, 10]. It is found
that impedance and phase angle increase with increase in volume fraction of microballoons
in the foam [9]. The impedance increased and dielectric constant decreased with increasing
filler content at the frequency of 10 kHz [10]. Park et al have tested some syntactic foams
with only 1 and 2 wt% microballoons [11]. They found that the dielectric constant decreases
with increasing frequency and filler content within this range. A study on hollow glass fiber
filled composites was also found published where addition of glass fibers was found to
decrease the dielectric constant of the material [12].
Syntactic foams can vary in the type and volume fraction of microballoons. A com-
prehensive investigation of their electrical properties with respect to various material and
electric parameter must be carried out. The present paper investigates impedance, dielec-
tric constant and dielectric loss of four types of syntactic foams selected from various
foams synthesized in this study. The temperature dependence of dielectric constant is also
investigated in the temperature range of 40–140◦C.
Experimental
Constituent Materials
Epoxy resin DER 332 with hardener DEH 24, manufactured by DOW Chemical Company,
is used as the matrix resin. A diluent C12–C14 aliphaticglycidylether (ERISYS 8) is used in
5 vol% quantity to reduce the viscosity of the resin and to facilitate mixing and wetting of
microballoons.
ScotchliteTM glass microballoons, manufactured and supplied by 3M, are used in syn-
thesizing syntactic foams. The size, density and calculated η for microballoons used in

Mechanical and Electrical Properties of Syntactic Foams 3
Table 1Properties of microballoons used in synthesized syntactic foams
Microroballoon Microballoon True particle Radius ratio
type diameter (μ m) density (kg/m3) η
S22 35 220 0.970
S32 40 320 0.956
S38 40 380 0.947
K46 40 460 0.936
synthesis of these foams are given in Table 1. The average outer diameter of all types of
microballoons is nearly the same. Hence, a difference in their densities is caused by their
η values. The microballoon type in Table 1 is the manufacturer’s code for these microbal-
loons. Syntactic foams containing 30, 40, 50, 60 and 65% microballoons by volume are
fabricated.
Syntactic Foam Synthesis
Stir mixing of microballoons in the epoxy resin system is the processing method adopted for
synthesizing syntactic foams in the present study. The synthesis process consists of mixing
5 vol% of diluent in the resin and heating them to 50◦C. Addition of diluent and heating
them to higher temperature help in reducing the resin viscosity and facilitate the mixing of
microballoons in the resin system. Hardener is added to this mixture and then microballoons
are mixed. The mixing of microballoons is carried out using a wooden dowel until a slurry
of uniform viscosity is obtained. The slurry is cast in molds, cured at room temperature for
24 hr and then post cured at 100◦C for 3 hr.
Compression Testing
The compression testing is carried out using a computerized Instron 4467 mechanical test
system. The system is capable of obtaining load-displacement data, which is later converted
to stress-strain information. The specimens of 10 × 10 mm2 cross section and 17 mm height
were used for the testing. The compression rate was maintained at 1 mm/min for the testing.
The tests were stopped at the collapse of the specimen due to failure or when the densification
was completed.
Electrical Testing
The foam slabs were sectioned to obtain pieces of 10 × 10 mm2 cross section and 6 mm
thickness for the measurement of their electrical properties. In order to perform the dielectric
measurements, an Ag electrode was applied on the samples and fired at 40◦C for 1 hr.
Impedance characteristics were determined by HP 4194A impedance analyzer (Hewlett
Packard Co., USA). Dielectric constant as a function of temperature was measured via
HP 4274A LCR meter (Hewlett Packard Co. USA). Since the magnitude of the dielectric
constant is quite low in the range of 4–7, careful attention was paid in designing the sample
holder. However, it should be pointed out that there may be some effect of the capacitance
due to wiring and holder on the measured value.

4 N. Gupta et al.
Figure 1. Microstructure of syntactic foams showing glass microballoons embedded in epoxy resin
matrix.
Results and Discussion
The microstructure of SF460–60 type syntactic foam is shown in Fig. 1, which is represen-
tative for all types of syntactic foams fabricated in this study. Glass microballoons can be
observed dispersed in epoxy resin matrix in this micrograph.
The theoretical density, calculated using rule of mixture, and the measured density of
all kinds of syntactic foams synthesized in this study are presented in Table 2. During the
mechanical mixing of microballoons in the matrix resin system some air gets entrapped
into the material structure, which remains in the cast foam slab. This entrapped air is termed
as matrix porosity. An estimate of matrix porosity (Vv ) is derived from the theoretical and
measured densities of syntactic foams using Equation 1.
Vv = ρth − ρm
ρth(1)
where ρth and ρm are the theoretical and the measured densities, respectively. Most of the
foams in the present study contain 3–12 vol% of matrix porosity. Presence of matrix porosity
is undesirable in the structure as it weakens the material and may lead to increased moisture
absorption. A detailed discussion on the porosity effects on the mechanical properties of
syntactic foams has been published previously [7]. The electrical properties of syntactic
foams can be affected by the level of porosity present in these samples. Hence, these figures
are presented in Table 2. However, porosity is not considered as a study parameter in the
present work.
Compressive Properties
The compressive stress-strain curves for syntactic foams containing microballoons of dif-
ferent η in volume fractions of 0.3–0.65 can be compared in Fig. 2. As the general trend,
like most other types of foams, syntactic foams show a linear elastic region, followed by

Mechanical and Electrical Properties of Syntactic Foams 5
Table 2Nomenclature, theoretical density and measured density of various syntactic foam
compositions
Syntactic foam density (kg/m3)Microballoon
density
(kg/m3)
Volume
fraction of
Microballoons
Syntactic
foam
nomenclature Theoretical Measured
Matrix
porosity
(%)
220 30 SF220-30 878 850 3.2
40 SF220-40 784 735 6.3
50 SF220-50 690 611 11.4
60 SF220-60 596 550 7.7
65 SF220-65 549 490 10.7
320 30 SF320-30 908 875 3.6
40 SF320-40 824 780 5.3
50 SF320-50 740 670 9.5
60 SF320-60 656 611 6.9
65 SF320-65 614 545 11.2
380 30 SF380-30 926 887 4.2
40 SF380-40 848 800 5.7
50 SF380-50 770 694 9.9
60 SF380-60 692 625 9.7
65 SF380-65 653 575 11.9
460 30 SF460-30 950 931 2.0
40 SF460-40 880 846 3.9
50 SF460-50 810 732 9.6
60 SF460-60 740 645 12.8
65 SF460-65 705 650 7.8
a stress plateau region [1, 2]. At the end of the plateau region the stress starts increasing
again. Several previous studies have observed and reported this kind of stress-strain curves
in polymer and metal matrix syntactic foams [13, 14]. It is noted that the stress reaches a
peak value at the end of the linear region, followed by a decrease before the stress-plateau is
attained. Cracks initiate at the peak stress value and specimen tends to generate fragments
as a result of these cracks. The stress-plateau is the region where the densification of the
material takes place. Microballoons fracture and their enclosed porosity opens up for the
compressing material to occupy. The stress starts increasing when the densification ends.
These observations can be found extensively documented in the previous studies focusing
on interpreting the stress-strain curves [2].
From the compressive stress-strain curves it is observed that the difference between the
peak stress and the plateau stress increases as the Vmb decreases and also as the microballoon
η decreases. The initial cracks that generate in the specimens are either due to the shear
stresses or the secondary tensile stresses [15]. Such cracks normally initiate and propagate in
the matrix material with fracture of only a small number of microballoons. Hence, increase
in the matrix volume fraction and specimen rigidity cause enhancement in the specimen
cracking, which leads to a sharp drop in stress after the peak stress is attained. It can be
observed in Fig. 2 that the decrease in strength becomes greater when Vmb increases for
foams containing the same type of microballoons [16]. For SF220-65 foams the decrease
in strength is only about 10%, whereas for SF220-30 foams it is on the order of 20%. A

6 N. Gupta et al.
Figure 2. Compressive stress-strain curves for syntactic foams having four types of microballoons
having (a) η = 0.970 (b) η = 0.956 (c) η = 0.947 and (d) η = 0.936 in 0.3–0.65 volume fractions.
(See Color Plate I)
similar trend is found to exist for other types of foams also. It can also be observed that
decrease in η has a significant effect on the strength drop. The drop is in the range of 10–
20% for various compositions of SF220 type foams, however, it is on the order of 40–60%
for SF460 type foams. In most applications such steep decrease in strength is enough to
consider complete failure of the material. Consistent with the previous studies, the strain at
which the densification completes decreases with decreasing η and Vmb. The densification
strain depends on the total porosity in the specimens, which is found to be maximum in
SF220-65 foams and minimum in SF460-30 foams.
The results for compressive strength and modulus are presented in Figure 3. The com-
pressive strength and modulus are found to increase with decrease in Vmb and η. Decrease
in Vmb and η cause increase in matrix volume fraction and stronger microballoons, re-
spectively. Since, matrix has higher compressive strength and modulus than microballoons,
decrease in Vmb leads to increased strength of the composite. Hence, a combination of Vmb
and η can provide close control over the strength and modulus of syntactic foams. The

Mechanical and Electrical Properties of Syntactic Foams 7
Figure 3. Relation between the density and (a) compressive strength and (b) modulus of syntactic
foams.
composite with the least density can be designed for the given mechanical properties by
considering both these parameters simultaneously.
Graphical representation of strength and modulus is found to be very illustrative in
observing the trends between the density and mechanical properties of syntactic foams as
shown in Fig. 3. Microballoon η and Vmb both are found to be important parameters in
determining the compressive strength and modulus of syntactic foams. It can be observed
in these figures that the strength and modulus increase linearly with the foam density. For
SF320, SF380 and SF460 type syntactic foams the strength values are found to on the same
trendline, whereas the values are found to be lower for SF220 type foams. This observation
can be related to the strength of microballoons. The strength of microballoons used in
8 N. Gupta et al.
SF220 foams is lower because of their lower wall thickness. Hence, their fracture starts in
early stages of compression leading to overall lower strength and modulus of these foams.
For foams containing higher density microballoons, which are stronger, the trend fits on
one trendline a shown in Fig. 3. Depending upon the relative and absolute strengths of
microballoons and matrix material the strength of syntactic foams may vary but it linearly
varies with respect to their density. In some previous studies also it is observed that very
low strength microballoons lead to weakening of syntactic foams as Vmb increases [17].
The compressive properties of metal matrix foams are also found to follow the linearly
increasing trend with density [12].
Electrical Properties
In the first step the electrical properties of neat epoxy resin and four types of syntactic foams
are measured. Properties of the neat resin will serve as a base for interpretation of electrical
properties of syntactic foams, which contain glass microballoons in the resin matrix. The
four types of syntactic foams selected for the measurement of dielectric properties represent
four extremes of the compositions among the synthesized syntactic foams in the present
study. Foams having the lowest and highest η values in lowest and highest Vmb are selected,
which are SF220-30, SF220-65, SF460-30 and SF460-65. Comparison of properties of
these foams will help in developing an understanding of the relationship between material
parameters such as η and Vmb and electrical properties such as dielectric constant, dielectric
loss, and impedance. The electrical properties are measured with respect to temperature
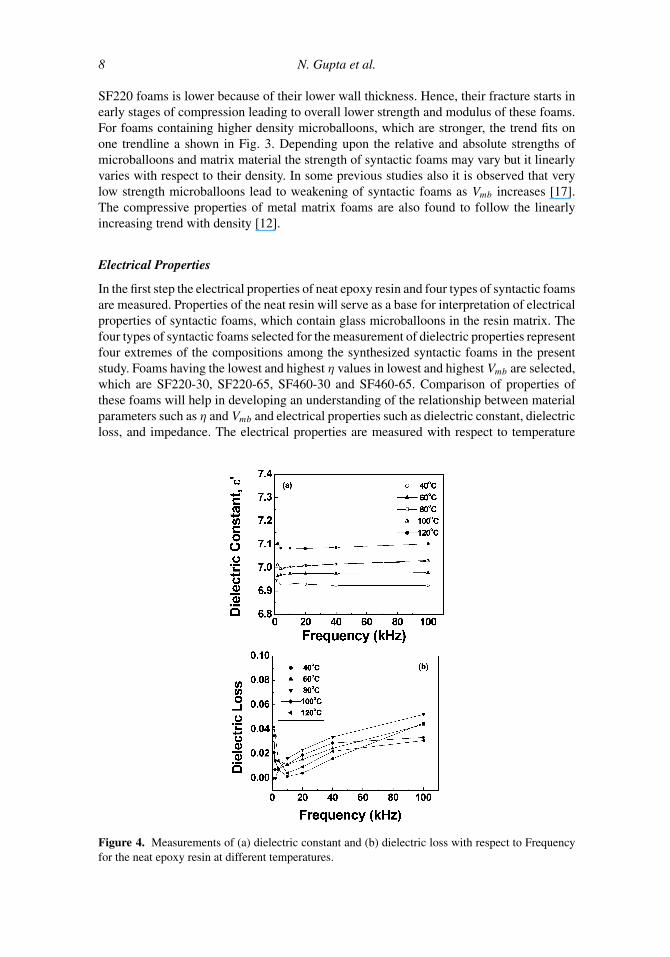
Figure 4. Measurements of (a) dielectric constant and (b) dielectric loss with respect to Frequency
for the neat epoxy resin at different temperatures.

Mechanical and Electrical Properties of Syntactic Foams 9
and the applied frequency. In this study, the dielectric constant was measured in the low
frequency region for two reasons: (i) material used for the sensor (capacitive sensors) work
in the low frequency region and (ii) stresses and vibrations occurring in the material during
its lifetime are low frequency signals.
Figure 4 shows the dielectric constant and loss data for the neat epoxy resin as a function
of temperature and frequency. The dielectric constant and loss at room temperature were
found to be of the order of 6.8 and 4% at 10 kHz. Since all the samples were exposed
to the temperature of 40◦C during electroding the dielectric data was measured from this
temperature onwards. As can be seen in Fig. 4 that dielectric constant increases slightly with
increase in temperature but the trend saturates quickly and it remains almost constant in
the frequency interval of 10–100 kHz. It can be observed that the dielectric losses increase
with the frequency and temperature after a steep initial decrease within a narrow range of
0–10 kHz.
Figure 5 shows the dielectric constant variation as a function of temperature and fre-
quency for the four types of syntactic foams selected for the study. Clearly, the dielectric
constant drops with the increasing Vmb for the same type of microballoons. For the case of
SF220, the dielectric constant was of the order of 4.8 with 30 vol% microballoons and it
dropped to 3.8 with 65 vol% microballoons. For the case of SF460, the dielectric constant
was of the order of 5.1 with 30 vol% microballoons and it dropped to 3.7 with 65 vol%
microballoons. The dielectric constant in both cases was found to increase to 5–10 % with
Figure 5. Variation in dielectric constant with respect to frequency at different temperatures for
(a) SF220-30, (b) SF220-65, (c) SF 460-30 and (d) SF460-65 syntactic foams.

10 N. Gupta et al.
Figure 6. Dielectric loss as a function of frequency at different temperatures for (a) SF220-30
(b) F220-65, (c) SF460-30 and (d) SF460-65 syntactic foams.
Figure 7. Impedance and phase angle Vs frequency at room temperature for (a) neat resin, (b)
SF220-30 foam and (c) SF220-65 foam.

Mechanical and Electrical Properties of Syntactic Foams 11
increase in temperature. The variation in the dielectric loss as a function of temperature and
frequency is shown in Fig. 6 for the four types of syntactic foams. With increasing frequency
a drop in the dielectric loss was observed at higher temperatures but this effect may be due
to the poor contact of the electrode and material. This problem can be resolved by using
electrodes which can adhere and form strong bonds at low curing temperature with the foam
surface.
Figure 7 shows the impedance characteristic for the neat epoxy and SF220 type syntactic
foams. The impedance characteristics for the SF460 foams were found to be similar to that
of the SF220. The impedance drops with frequency, which is a common characteristic for
the dielectric materials [18, 19]. The change in the impedance was found to be similar for
both cases. The phase difference remains close to −90◦, which reflects the capacitive nature
of the material. The data of Figs. 5 and 7 shows that these materials have the possibility
to function as sensors. The sensing is achieved by the variation in the magnitude of the
capacitance due to external stress or other factors. The health monitoring is conducted by
recording the variation in the magnitude of the electrical impedance and comparing it with
the reference signal from virgin material.
Conclusions
The detailed experimental study related to the compressive properties of syntactic foams
concludes that for syntactic foams the compressive strength and modulus
1. increase with increase in microballoon wall thickness and decrease in microballoon
volume fraction.
2. increase linearly with the foam density.
3. depend on the relative strength of microballoons and the matrix resin. Foams with very
low strength microballoons tend to show greater dependence of mechanical properties
on the microballoon properties.
The investigation of electrical properties concludes that
1. dielectric constant increases with increase in microballoon wall thickness and decreases
with increasing microballoon volume fraction. It is found to decrease with test frequency
and increase with temperature.
2. dielectric loss also follows the trend observed for dielectric constant with respect to the
material and electrical test parameters.
The results show that the syntactic foams have a possibility to be developed
as sensors with appropriate microstructural modification and their electrical properties
can be effectively controlled by means of microballoon wall thickness and volume
fraction.
Acknowledgments
3M is acknowledged for providing glass microballoons and technical information related
to them. Partial funding for the research was provided by Othmer Institute to the first author
under the major project initiation grant, which is gratefully acknowledged.

12 N. Gupta et al.
References
1. P. Bunn and J. T. Mottram, Manufacture and compression properties of syntactic foams.
Composites 24(7), 565–571 (1993).
2. N. Gupta, Kishore, E. Woldesenbet, and S. Sankaran, Studies on compressive failure features in
syntactic foam material. J. Mater. Sci. 36(18), 4485–4491 (2001).
3. L. Bardella and F. Genna, On the elastic behavior of syntactic foams. Int. J. Solids Struct. 38,
7235–7260 (2001).
4. C. S. Karthikeyan, S. Sankaran, and Kishore, Elastic behaviour of plain and fibre-reinforced
syntactic foams under compression. Materials Letters 58, 995–999 (2004).
5. N. Gupta and E. Woldesenbet, Hygrothermal studies on syntactic foams and compressive strength
determination. Composite Structures 61(4), 311–320 (2003).
6. J. S. Huang and L. J. Gibson, Elastic moduli of a composite of hollow spheres in a matrix.
J. Mechanics Physics Solids 41(l), 55–75 (1993).
7. N. Gupta and R. Nagorny, On the Tensile Properties of Glass Microballoon-Epoxy Resin Syntactic
Foams. J. Appl. Polym. Sci. 102, 1254–1261 (2006).
8. N. Gupta, E. Woldesenbet, and P. Mensah, Compression properties of syntactic foams: effect of
cenosphere radius ratio and specimen aspect ratio. Composites Part A. 35(1), 103–111 (2004).
9. M. Shahin, M. A. H. Abdallah, A. M. Zihlif, and R. Farris, Dielectric properties of epoxy—glass
microballoons composite. J. Polym. Mater 12, 151–156 (1995).
10. M. Shahin, M. A. H. Abdallah, and A. M. Zihlif, Temperature dependence of electrical properties
of epoxy-glass microballoon composite. J. Polym. Mater 13, 253–257 (1996).
11. S. J. Park, F. L. Jin, and C. Lee, Preparation and physical properties of hollow glass microspheres-
reinforced epoxy matrix resins. Mater Sci. Eng. A 402(l–2), 335–340 (2005).
12. S. M. Bleay and L. Humberstone, Mechanical and electrical assessment of hybrid composites
containing hollow glass reinforcement. Compos. Sci. Technol. 59(9), 1321–1329 (1999).
13. D. K. Balch, J. G. O’Dwyer, G. R. Davis, C. M. Cady, G. T. Gray III, and D. C. Dunand, Plasticity
and damage in aluminum syntactic foams deformed under dynamic and quasi-static conditions.
Mater Sci. Eng. A 391, 408–417 (2005).
14. P. K. Rohatgi, J. K. Kim, N. Gupta, S. Alaraj, and A. Daoud, Compressive characteristics of
A356/hollow fly ash particle composites made by pressure infiltration technique. Composites A
37:3, 430–437 (2006).
15. N. Gupta, E. Woldesenbet, and Kishore. Compressive fracture features of syntactic foams—
microscopic examination. J. Mater Sci. 37(15), 3199–3209 (2002).
16. H. S. Kim and P. Plubrai, Manufacturing and failure mechanisms of syntactic foam under com-
pression. Composites Part A 35(9), 1009–1015 (2004).
17. E. M. Wouterson, F. Y. C. Boey, X. Hu, and S. C. Wong, Specific properties and fracture toughness
of syntactic foam: Effect of foam microstructures. Compos. Sci. Technol. 65, 1840–1850 (2005).
18. M. E. Lines, and A. M. Glass, Principles and Applications of Ferroelectrics and Related Materials
(Oxford: Clarendon Press, 1977).
19. R. Coelho, Physics of Dielectrics for the Engineer. (Oxford: Elsevier Scientific Publishing
Company, 1979).

All in-text references underlined in blue are linked to publications on ResearchGate, letting you access and read them immediately.