Immunohistochemical analysis of changes in signaling pathway activation downstream of growth factor...
10
BioMed Central Page 1 of 10 (page number not for citation purposes) BMC Cancer Open Access Research article Immunohistochemical analysis of changes in signaling pathway activation downstream of growth factor receptors in pancreatic duct cell carcinogenesis Nhu-An Pham 1 , Joerg Schwock 2 , Vladimir Iakovlev 2 , Greg Pond 3 , David W Hedley 1,2,4 and Ming-Sound Tsao* 1,2,5 Address: 1 Department of Medical Biophysics, University of Toronto, Toronto, ON, Canada, 2 Department of Laboratory Medicine and Pathobiology, University of Toronto, Toronto, ON, Canada, 3 Department of Biostatistics, Princess Margaret Hospital, Toronto, ON, Canada, 4 Department of Medical Oncology, Princess Margaret Hospital, Toronto, ON, Canada and 5 Department of Pathology, University Health Network, Toronto, ON, Canada Email: Nhu-An Pham - [email protected]; Joerg Schwock - [email protected]; Vladimir Iakovlev - [email protected]; Greg Pond - [email protected]; David W Hedley - [email protected]; Ming- Sound Tsao* - [email protected] * Corresponding author Abstract Background: The pathogenesis of pancreatic ductal adenocarcinoma (PDAC) involves multi-stage development of molecular aberrations affecting signaling pathways that regulate cancer growth and progression. This study was performed to gain a better understanding of the abnormal signaling that occurs in PDAC compared with normal duct epithelia. Methods: We performed immunohistochemistry on a tissue microarray of 26 PDAC, 13 normal appearing adjacent pancreatic ductal epithelia, and 12 normal non-PDAC ducts. We compared the levels of 18 signaling proteins including growth factor receptors, tumor suppressors and 13 of their putative downstream phosphorylated (p-) signal transducers in PDAC to those in normal ductal epithelia. Results: The overall profiles of signaling protein expression levels, activation states and sub- cellular distribution in PDAC cells were distinguishable from non-neoplastic ductal epithelia. The ERK pathway activation was correlated with high levels of S2448 p-mTOR (100%, p = 0.05), T389 p-S6K (100%, p = 0.02 and S235/236 p-S6 (86%, p = 0.005). Additionally, T389 p-S6K correlated with S727 p- STAT3 (86%, p = 0.005). Advanced tumors with lymph node metastasis were characterized by high levels of S276 p-NFκB (100%, p = 0.05) and S9 p-GSK3β (100%, p = 0.05). High levels of PKBβ/AKT2, EGFR, as well as nuclear T202/Y204 p-ERK and T180/Y182 p-p38 were observed in normal ducts adjacent to PDAC compared with non-cancerous pancreas. Conclusion: Multiple signaling proteins are activated in pancreatic duct cell carcinogenesis including those associated with the ERK, PKB/AKT, mTOR and STAT3 pathways. The ERK pathway activation appears also increased in duct epithelia adjacent to carcinoma, suggesting tumor micro- environmental effects. Published: 6 February 2008 BMC Cancer 2008, 8:43 doi:10.1186/1471-2407-8-43 Received: 13 August 2007 Accepted: 6 February 2008 This article is available from: http://www.biomedcentral.com/1471-2407/8/43 © 2008 Pham et al; licensee BioMed Central Ltd. This is an Open Access article distributed under the terms of the Creative Commons Attribution License (http://creativecommons.org/licenses/by/2.0 ), which permits unrestricted use, distribution, and reproduction in any medium, provided the original work is properly cited.
-
Upload
independent -
Category
Documents
-
view
2 -
download
0
Transcript of Immunohistochemical analysis of changes in signaling pathway activation downstream of growth factor...
BioMed CentralBMC Cancer
ss
Open AcceResearch articleImmunohistochemical analysis of changes in signaling pathway activation downstream of growth factor receptors in pancreatic duct cell carcinogenesisNhu-An Pham1, Joerg Schwock2, Vladimir Iakovlev2, Greg Pond3, David W Hedley1,2,4 and Ming-Sound Tsao*1,2,5Address: 1Department of Medical Biophysics, University of Toronto, Toronto, ON, Canada, 2Department of Laboratory Medicine and Pathobiology, University of Toronto, Toronto, ON, Canada, 3Department of Biostatistics, Princess Margaret Hospital, Toronto, ON, Canada, 4Department of Medical Oncology, Princess Margaret Hospital, Toronto, ON, Canada and 5Department of Pathology, University Health Network, Toronto, ON, Canada
Email: Nhu-An Pham - [email protected]; Joerg Schwock - [email protected]; Vladimir Iakovlev - [email protected]; Greg Pond - [email protected]; David W Hedley - [email protected]; Ming-Sound Tsao* - [email protected]
* Corresponding author
AbstractBackground: The pathogenesis of pancreatic ductal adenocarcinoma (PDAC) involves multi-stagedevelopment of molecular aberrations affecting signaling pathways that regulate cancer growth andprogression. This study was performed to gain a better understanding of the abnormal signaling thatoccurs in PDAC compared with normal duct epithelia.
Methods: We performed immunohistochemistry on a tissue microarray of 26 PDAC, 13 normalappearing adjacent pancreatic ductal epithelia, and 12 normal non-PDAC ducts. We compared thelevels of 18 signaling proteins including growth factor receptors, tumor suppressors and 13 of theirputative downstream phosphorylated (p-) signal transducers in PDAC to those in normal ductalepithelia.
Results: The overall profiles of signaling protein expression levels, activation states and sub-cellular distribution in PDAC cells were distinguishable from non-neoplastic ductal epithelia. TheERK pathway activation was correlated with high levels of S2448p-mTOR (100%, p = 0.05), T389p-S6K(100%, p = 0.02 and S235/236p-S6 (86%, p = 0.005). Additionally, T389p-S6K correlated with S727p-STAT3 (86%, p = 0.005). Advanced tumors with lymph node metastasis were characterized by highlevels of S276p-NFκB (100%, p = 0.05) and S9p-GSK3β (100%, p = 0.05). High levels of PKBβ/AKT2,EGFR, as well as nuclear T202/Y204p-ERK and T180/Y182p-p38 were observed in normal ducts adjacentto PDAC compared with non-cancerous pancreas.
Conclusion: Multiple signaling proteins are activated in pancreatic duct cell carcinogenesisincluding those associated with the ERK, PKB/AKT, mTOR and STAT3 pathways. The ERK pathwayactivation appears also increased in duct epithelia adjacent to carcinoma, suggesting tumor micro-environmental effects.
Published: 6 February 2008
BMC Cancer 2008, 8:43 doi:10.1186/1471-2407-8-43
Received: 13 August 2007Accepted: 6 February 2008
This article is available from: http://www.biomedcentral.com/1471-2407/8/43
© 2008 Pham et al; licensee BioMed Central Ltd. This is an Open Access article distributed under the terms of the Creative Commons Attribution License (http://creativecommons.org/licenses/by/2.0), which permits unrestricted use, distribution, and reproduction in any medium, provided the original work is properly cited.
Page 1 of 10(page number not for citation purposes)
BMC Cancer 2008, 8:43 http://www.biomedcentral.com/1471-2407/8/43
BackgroundPancreatic ductal adenocarcinoma (PDAC) is the mostcommon malignant tumor of the human pancreas. PDACpatients have one of the worst prognoses among all cancertypes with a 5-year survival rate of less than 5%. Despitesignificant advances during the last decade in our molec-ular knowledge on this disease, the prognosis and man-agement of PDAC patients have remained unchanged[1,2]. The most common genetic aberrations in pancreaticduct cell carcinogenesis involve the activation of KRASoncogene and inactivation of tumor suppressor genesp16/CDKN2, p53 and SMAD4/DPC4 [3]. Less frequentlyaltered genes in PDAC are the amplification of growth fac-tor receptors EGFR and HER2 [4,5], and the survival sign-aling transducer PKBβ/AKT2 [6]. Additionally, themolecular deregulation of the tyrosine kinase receptor c-MET has been associated with enhanced transcript levels[7]. The protein products of these genes play importantregulatory roles in cell proliferation, survival, motility,invasion and differentiation. There is increasing realiza-tion that the biochemical activities and cellular functionsof these genes constitute part of a complex network ofinteracting signaling pathways [8]. Activities of these path-ways are highly dependent on the reversible phosphoryla-tion of tyrosine, threonine or serine residues of signaltransduction proteins.
Despite a significant gain of knowledge on genes that aredifferentially expressed in PDAC compared with normalpancreas or duct cells, the associated changes in signaltransduction networks have not yet been extensively char-acterized. Studies on the activation of singular pathwaysby immunohistochemistry (IHC) with phosphorylation-specific antibodies have been reported for PKB/AKT[9,10], p70/S6K [11], NFκB [12,13] and STAT3 [14].These signaling proteins are potentially major signalinghubs downstream of growth factor receptors that are over-expressed in proportions of PDAC including EGFR (31%to 58%) [5,15,16], HER2 (20%) [4], c-MET/hepatocytegrowth factor receptor (78%) [17], c-KIT/stem cell recep-tor (38%) [18]. However, the IHC analyses performed inthese studies rarely included pathway activities in normalpancreatic cellular compartments including the centroaci-nar, duct or ductular, acinar and islet cells. These compo-nents may contain subpopulations of cells that arepancreatic progenitor cells as well as the cell of origin forPDAC [19-21]. The survival of the ductal epithelia hasbeen associated with activated ERK in an inflammatoryenvironment of hereditary pancreatitis, a risk factor forPDAC [22].
To better understand the activation of tyrosine and serine/threonine phosphorylated proteins, we have used IHCanalysis to evaluate the levels and activation state of sev-eral signaling pathways including the ERK, SRC, STAT3,
PTEN/PKB, mTOR/S6K/S6, β-catenin (βCAT) and SMAD4in PDAC cells and epithelia of normal pancreas.
MethodsTissue materialThis study has been approved by the Research EthicsBoard of the University Health Network (Toronto, ON,Canada) in compliance with applicable national Tri-Council ethics principles. The formalin-fixed and paraffinembedded (FFPE) samples used in this study were tumorand adjacent normal pancreatic tissue obtained within 30minutes after Whipple's resection for pancreatic ductaladenocarcinoma (PDAC) or non-PDAC conditions. TheFFPE blocks were made from thin cross sections of tissuescollected for snap-frozen tumor banking and were ini-tially intended for a histological quality check of thebanked tissue. These samples were particularly suitable forthis study due to their limited delay between samplingand fixation.
Tissue microarray (TMA) constructionHistology was reviewed to assure the correct diagnosis ofthe 26 PDAC specimens and 12 specimens that were con-sidered "normal" pancreas from patients with non-pan-creatic conditions (e.g. Ampulla of Vater, bile duct andstomach cancers) [see Additional file 1]. The clinicopatho-logical parameters of individual cases are listed in an addi-tional file [see Additional file 2]. H&E slides were used toguide the selection of representative 1.5 mm diametercores from paraffin blocks containing viable tumor areasand morphologically normal pancreatic parenchyma. Thecores were constructed into a tissue microarray (TMA)using a manual tissue arrayer (Beecher Instruments, SunPrairie, WI). The final TMA contained 67 of 71 (94.3%)cores, (four cores were lost during processing) and eachPDAC case was represented by at least one core [see Addi-tional file 3]. Results are reported on 26 tumor cores (T),13 cores containing adjacent normal parenchyma andnon-neoplastic ducts (Dt), and 12 cores containing paren-chyma with non-neoplastic tissue from non-PDAC condi-tions (D).
ImmunohistochemistryAntibodies and staining methods are summarized in anadditional file [see Additional file 2]. Microwave antigenretrieval was performed for all immunostains except CK7,EGFR and p-S6 which were treated with pepsin digestion.Secondary antibodies (anti-mouse and anti-rabbit) wereused as provided by the IDetect Ultra HRP system (IDLabs, London, ON). Goat polyclonal antibody (biotin-conjugated anti-goat IgG, 1:300 dilution), NovaRed per-oxidase substrate and hematoxylin counterstain were pur-chased from Vector Laboratories (Burlingame, CA). Anegative control slide was processed with a mix of pooled
Page 2 of 10(page number not for citation purposes)
BMC Cancer 2008, 8:43 http://www.biomedcentral.com/1471-2407/8/43
secondary antibodies, omitting primary antibody incuba-tion [see Additional file 1].
IHC scoring systemThe immunostained slides were scanned using an AperioCS Scanner (Vista, CA) at 20× magnification. Either slidesor digital images were used for scoring by three independ-ent evaluators (NAP, JS, VI) without prior knowledge ofthe core source or stained target antigen. Final scores werebased on a consensus of the three evaluators. A singleintensity score was obtained since the intensity of stainingwithin each core was mostly homogeneous. Intensity wasscored as 0 for absence of staining, 1 for weak, 2 for mod-erate, and 3 for strong staining. Scores were recorded forthe different cell types as well as their nuclear and cyto-plasmic compartments. EGFR and MET receptor werescored for their plasma membrane staining only.
Statistical analysisUnsupervised hierarchical clustering using the agglomera-tion rule average linkage placed cases and antibodies nextto each other if they were most similar in their IHC pro-files (free software Genesis [23]). The relationship of twocategorical variables was calculated using Fisher's exact
test. Data of categorical variables were arbitrarily split intolow and high groups to maximize statistical powerobtained by equalizing the number of samples in eachgroups. The strength of the relationship between two var-iables was calculated using Spearman's rank correlationcoefficient, Rho (ρ). No adjustment for multiple testingwas done. Statistical analyses were performed in SAS Ver-sion 9.1 (SAS Institute, Cary, NC).
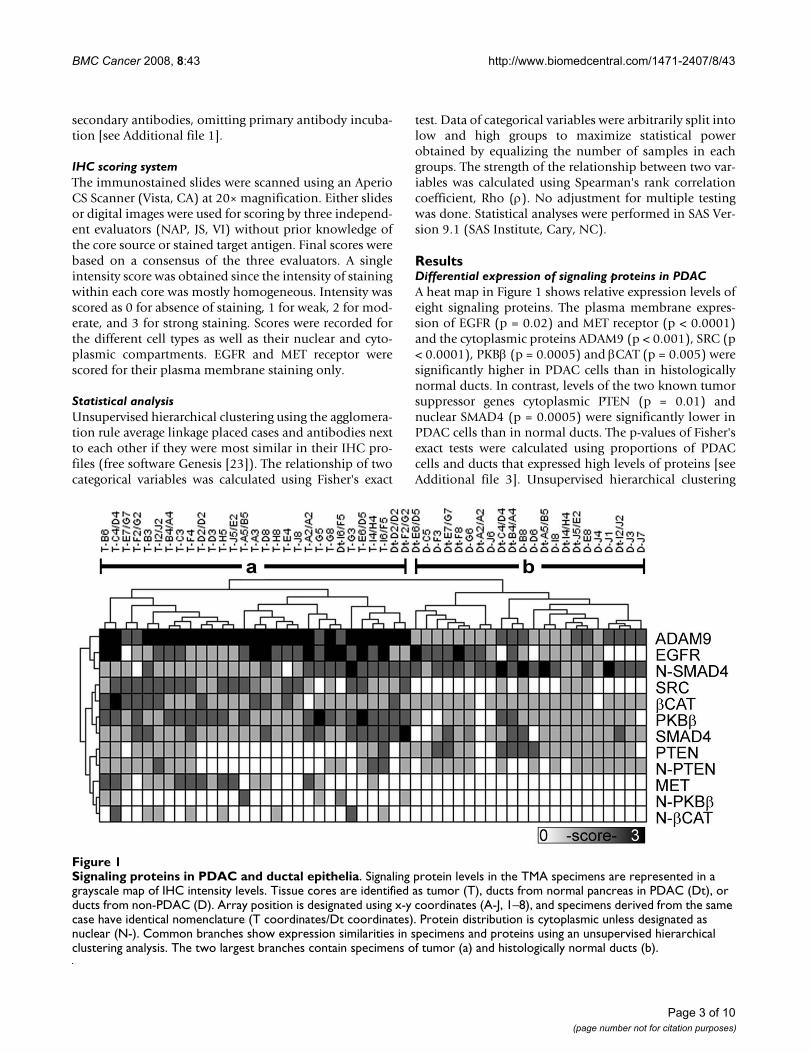
ResultsDifferential expression of signaling proteins in PDACA heat map in Figure 1 shows relative expression levels ofeight signaling proteins. The plasma membrane expres-sion of EGFR (p = 0.02) and MET receptor (p < 0.0001)and the cytoplasmic proteins ADAM9 (p < 0.001), SRC (p< 0.0001), PKBβ (p = 0.0005) and βCAT (p = 0.005) weresignificantly higher in PDAC cells than in histologicallynormal ducts. In contrast, levels of the two known tumorsuppressor genes cytoplasmic PTEN (p = 0.01) andnuclear SMAD4 (p = 0.0005) were significantly lower inPDAC cells than in normal ducts. The p-values of Fisher'sexact tests were calculated using proportions of PDACcells and ducts that expressed high levels of proteins [seeAdditional file 3]. Unsupervised hierarchical clustering
Signaling proteins in PDAC and ductal epitheliaFigure 1Signaling proteins in PDAC and ductal epithelia. Signaling protein levels in the TMA specimens are represented in a grayscale map of IHC intensity levels. Tissue cores are identified as tumor (T), ducts from normal pancreas in PDAC (Dt), or ducts from non-PDAC (D). Array position is designated using x-y coordinates (A-J, 1–8), and specimens derived from the same case have identical nomenclature (T coordinates/Dt coordinates). Protein distribution is cytoplasmic unless designated as nuclear (N-). Common branches show expression similarities in specimens and proteins using an unsupervised hierarchical clustering analysis. The two largest branches contain specimens of tumor (a) and histologically normal ducts (b).
Page 3 of 10(page number not for citation purposes)
BMC Cancer 2008, 8:43 http://www.biomedcentral.com/1471-2407/8/43
segregated tumor specimens (group a) and normal ductsadjacent to PDAC and non-PDAC pancreas (group b). Asexpected, cytokeratin 7 was expressed in all PDAC cellsand normal ducts (results not shown).
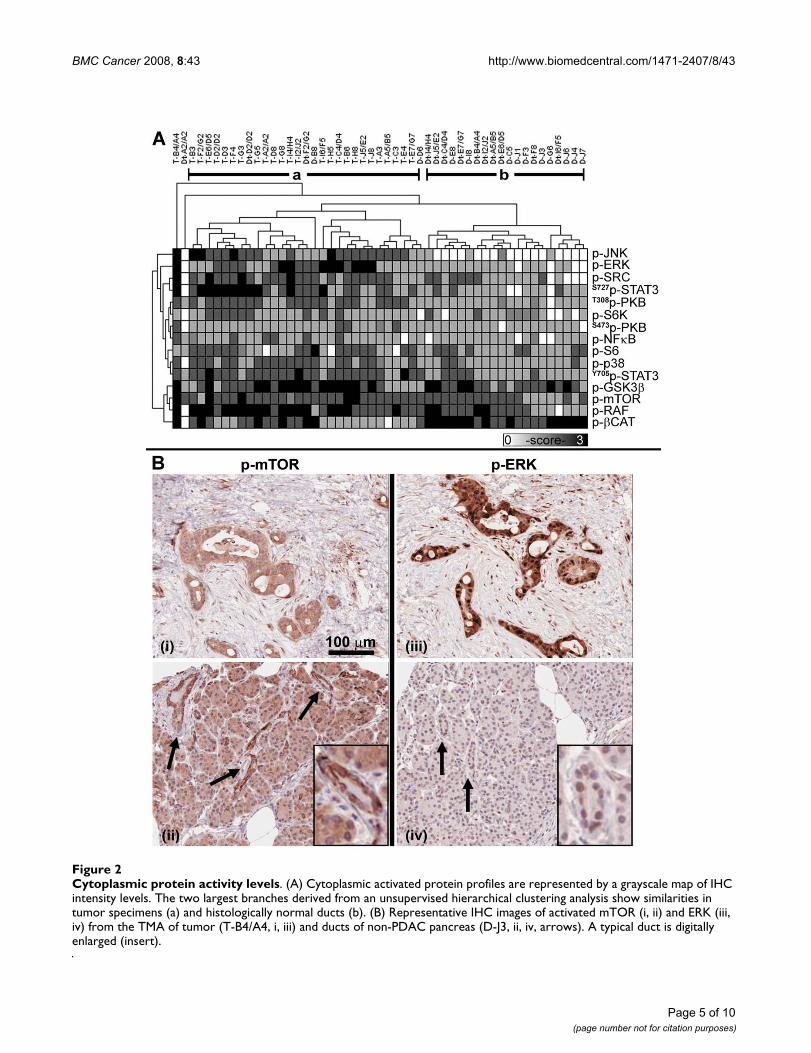
Cytoplasmic activated protein profilesAn unsupervised clustering of cytoplasmic activated pro-tein levels shows that tumor specimens (Figure 2A, groupa) are more similar to each other than to histologicallynormal ducts (group b). Only five of twenty five speci-mens of normal ducts were misclassified as tumor, whilenone of the tumors were misclassified as normal ducts.The cytoplasmic levels of activated p-ERK (p < 0.001), p-SRC (p = 0.0005), T308p-PKB (p < 0.0001), p-p38 (p =0.02), and their putative downstream substrates p-JNK (p< 0.0001), S727p-STAT3 (p = 0.005), Y705p-STAT3 (p =0.0005), p-GSK3β (p = 0.006), p-RAF (p = 0.01) and p-mTOR (p = 0.05) were significantly higher in PDAC cellsthan in ducts. Degradation-targeted p-βCAT levels signifi-cantly decreased (p < 0.0001) in PDAC cells comparedwith ducts, consistent with the observation of an accumu-lation of βCAT in PDAC compared with ducts (Figure 1).The four cytoplasmic proteins, S473p-PKB, p-S6K, p-S6 andp-NFκB were similarly expressed in PDAC cells and ducts(Table 1). Although the cytoplasm is the known cellularcompartment of activity for the mTOR/S6K/S6 pathway(Figure 2B, i and 2B, ii), a subset of activated signalingproteins are also known to translocate into the nucleus.For example, p-ERK was detected at high levels in the cyto-plasm as well as the nuclei of cancer cells (Figure 2B, iii).Low levels of nuclear p-ERK were detected in normal pan-creatic ductal cells and acinar (Figure 2B, iv).
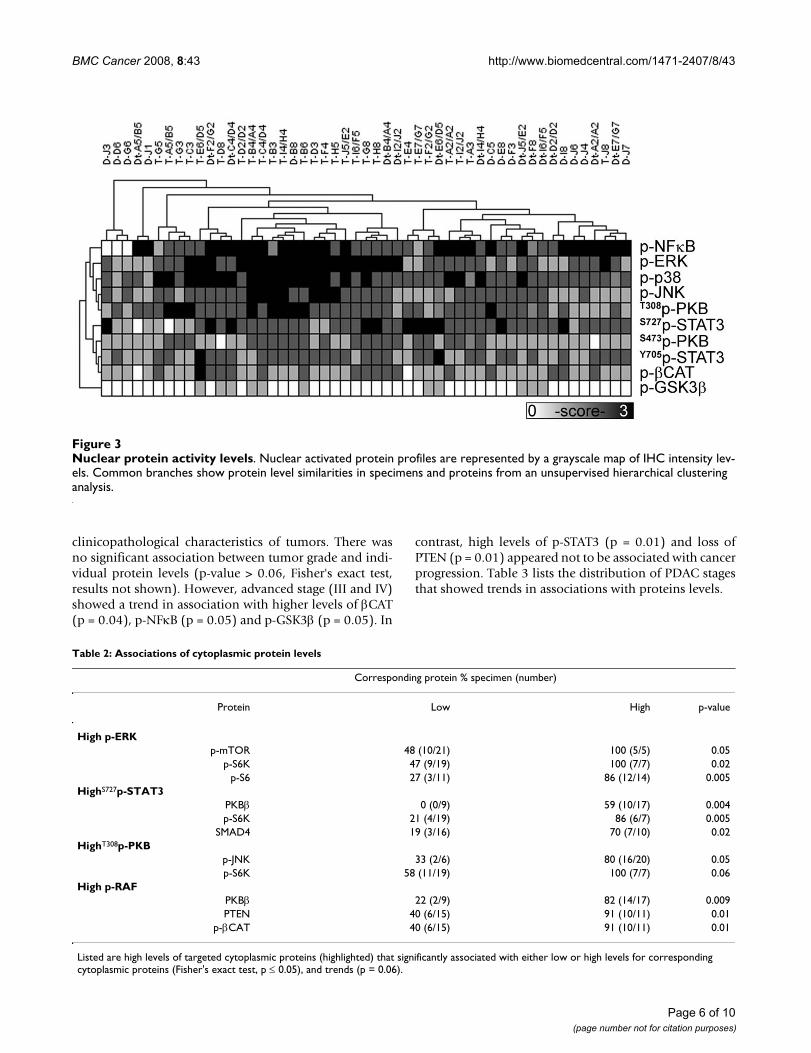
Nuclear activated protein profilesSince many signaling proteins translocate into the nucleusto serve as transcription factors after being activated byphosphorylation, we explored their profiles in PDAC cellscompared with histologically normal ductal epithelia. Anunsupervised clustering of the nuclear activated proteinlevels showed an absence of clustering between tumorand normal ducts (Figure 3). Levels of nuclear activatedproteins, including p-NFκB, p-STAT3, p-βCAT, p-GSK3βand T308p-PKB, were similarly expressed in PDAC cells andnormal ducts. However, the levels of four proteins, p-ERK(p = 0.001), p-p38 (p = 0.004), p-JNK (p = 0.01), andS473p-PKB (p = 0.001) were significantly higher in nucleiof PDAC cells than in normal ducts (Table 1). Cancer cellsalso displayed significant moderate to strong relation-ships between cytoplasmic and nuclear levels for severalproteins: p-ERK (ρ = 0.72, p < 0.001), p-p38 (ρ = 0.56, p= 0.004), T308p-PKB (ρ = 0.52, p = 0.007), SMAD4 (ρ =0.63, p < 0.001) and PTEN (ρ = 0.87, p < 0.001). Theseassociations were absent in ductal epithelia from non-PDAC specimens except for an association of cytoplasmic
and nuclear levels for p-p38 (ρ = 0.61, p < 0.001) in theductal epithelia adjacent to PDAC [see Additional file 4].
Protein-protein and clinicopathological relationshipsTable 2 shows that proportions of PDAC specimens char-acterized by the ERK pathway activation were associatedwith all specimens of high p-mTOR levels (100%, p =0.05), and its downstream substrates p-S6K (100%, p =0.02), and a proportion of specimens with high p-S6(86%, p = 0.005). The activation of p-S6K also correlatedwith high levels of S727p-STAT3 (86%, p = 0.005) andshows a positive trend with high levels of T308p-PKB(100%, 0.06). The activation of p-STAT3 correlated withhigh levels of PKBβ (59%, p = 0.004) and the presence ofSMAD4 (70%, 0.02). An association was observedbetween high levels of T308p-PKB and p-JNK (80%, p =0.05). High levels of inactive p-RAF was correlated withPKBβ (82%, p = 0.009), PTEN (91%, p = 0.01) and p-βCAT (91%, p = 0.01). Protein levels were compared with
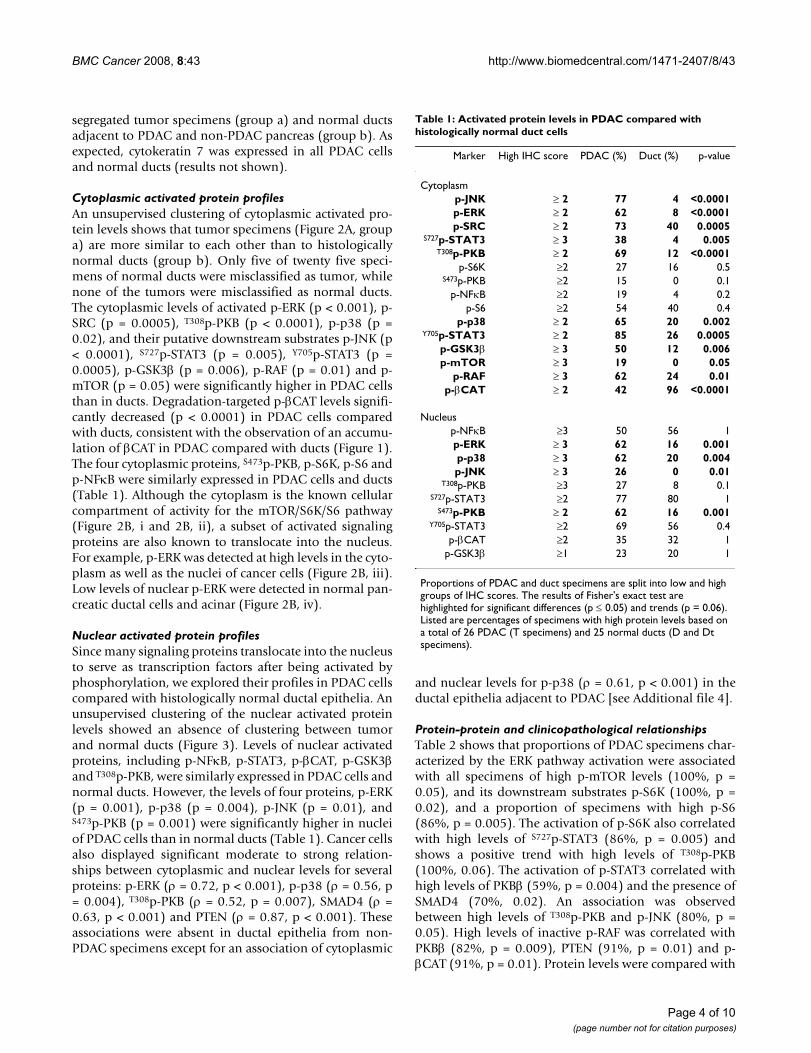
Table 1: Activated protein levels in PDAC compared with histologically normal duct cells
Marker High IHC score PDAC (%) Duct (%) p-value
Cytoplasmp-JNK ≥ 2 77 4 <0.0001p-ERK ≥ 2 62 8 <0.0001p-SRC ≥ 2 73 40 0.0005
S727p-STAT3 ≥ 3 38 4 0.005T308p-PKB ≥ 2 69 12 <0.0001
p-S6K ≥2 27 16 0.5S473p-PKB ≥2 15 0 0.1
p-NFκB ≥2 19 4 0.2p-S6 ≥2 54 40 0.4
p-p38 ≥ 2 65 20 0.002Y705p-STAT3 ≥ 2 85 26 0.0005
p-GSK3β ≥ 3 50 12 0.006p-mTOR ≥ 3 19 0 0.05
p-RAF ≥ 3 62 24 0.01p-βCAT ≥ 2 42 96 <0.0001
Nucleusp-NFκB ≥3 50 56 1p-ERK ≥ 3 62 16 0.001p-p38 ≥ 3 62 20 0.004p-JNK ≥ 3 26 0 0.01
T308p-PKB ≥3 27 8 0.1S727p-STAT3 ≥2 77 80 1
S473p-PKB ≥ 2 62 16 0.001Y705p-STAT3 ≥2 69 56 0.4
p-βCAT ≥2 35 32 1p-GSK3β ≥1 23 20 1
Proportions of PDAC and duct specimens are split into low and high groups of IHC scores. The results of Fisher's exact test are highlighted for significant differences (p ≤ 0.05) and trends (p = 0.06). Listed are percentages of specimens with high protein levels based on a total of 26 PDAC (T specimens) and 25 normal ducts (D and Dt specimens).
Page 4 of 10(page number not for citation purposes)
BMC Cancer 2008, 8:43 http://www.biomedcentral.com/1471-2407/8/43
Page 5 of 10(page number not for citation purposes)
Cytoplasmic protein activity levelsFigure 2Cytoplasmic protein activity levels. (A) Cytoplasmic activated protein profiles are represented by a grayscale map of IHC intensity levels. The two largest branches derived from an unsupervised hierarchical clustering analysis show similarities in tumor specimens (a) and histologically normal ducts (b). (B) Representative IHC images of activated mTOR (i, ii) and ERK (iii, iv) from the TMA of tumor (T-B4/A4, i, iii) and ducts of non-PDAC pancreas (D-J3, ii, iv, arrows). A typical duct is digitally enlarged (insert).
BMC Cancer 2008, 8:43 http://www.biomedcentral.com/1471-2407/8/43
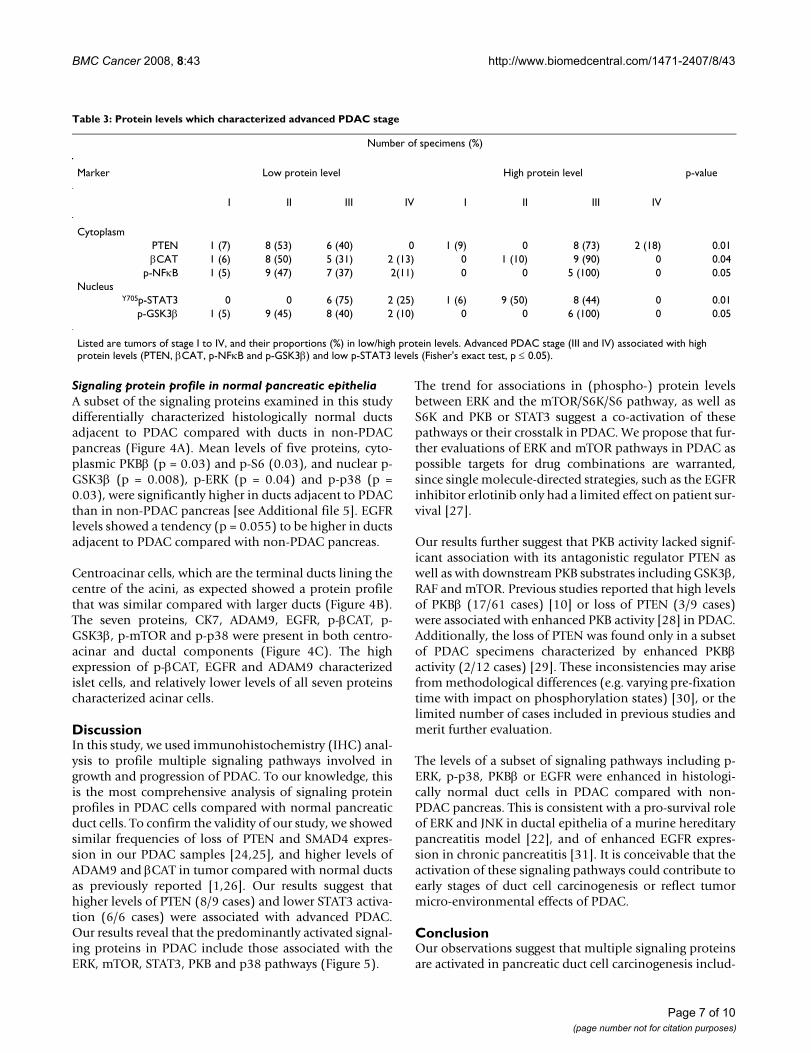
clinicopathological characteristics of tumors. There wasno significant association between tumor grade and indi-vidual protein levels (p-value > 0.06, Fisher's exact test,results not shown). However, advanced stage (III and IV)showed a trend in association with higher levels of βCAT(p = 0.04), p-NFκB (p = 0.05) and p-GSK3β (p = 0.05). In
contrast, high levels of p-STAT3 (p = 0.01) and loss ofPTEN (p = 0.01) appeared not to be associated with cancerprogression. Table 3 lists the distribution of PDAC stagesthat showed trends in associations with proteins levels.
Nuclear protein activity levelsFigure 3Nuclear protein activity levels. Nuclear activated protein profiles are represented by a grayscale map of IHC intensity lev-els. Common branches show protein level similarities in specimens and proteins from an unsupervised hierarchical clustering analysis.
Table 2: Associations of cytoplasmic protein levels
Corresponding protein % specimen (number)
Protein Low High p-value
High p-ERKp-mTOR 48 (10/21) 100 (5/5) 0.05
p-S6K 47 (9/19) 100 (7/7) 0.02p-S6 27 (3/11) 86 (12/14) 0.005
HighS727p-STAT3PKBβ 0 (0/9) 59 (10/17) 0.004p-S6K 21 (4/19) 86 (6/7) 0.005
SMAD4 19 (3/16) 70 (7/10) 0.02HighT308p-PKB
p-JNK 33 (2/6) 80 (16/20) 0.05p-S6K 58 (11/19) 100 (7/7) 0.06
High p-RAFPKBβ 22 (2/9) 82 (14/17) 0.009PTEN 40 (6/15) 91 (10/11) 0.01
p-βCAT 40 (6/15) 91 (10/11) 0.01
Listed are high levels of targeted cytoplasmic proteins (highlighted) that significantly associated with either low or high levels for corresponding cytoplasmic proteins (Fisher's exact test, p ≤ 0.05), and trends (p = 0.06).
Page 6 of 10(page number not for citation purposes)
BMC Cancer 2008, 8:43 http://www.biomedcentral.com/1471-2407/8/43
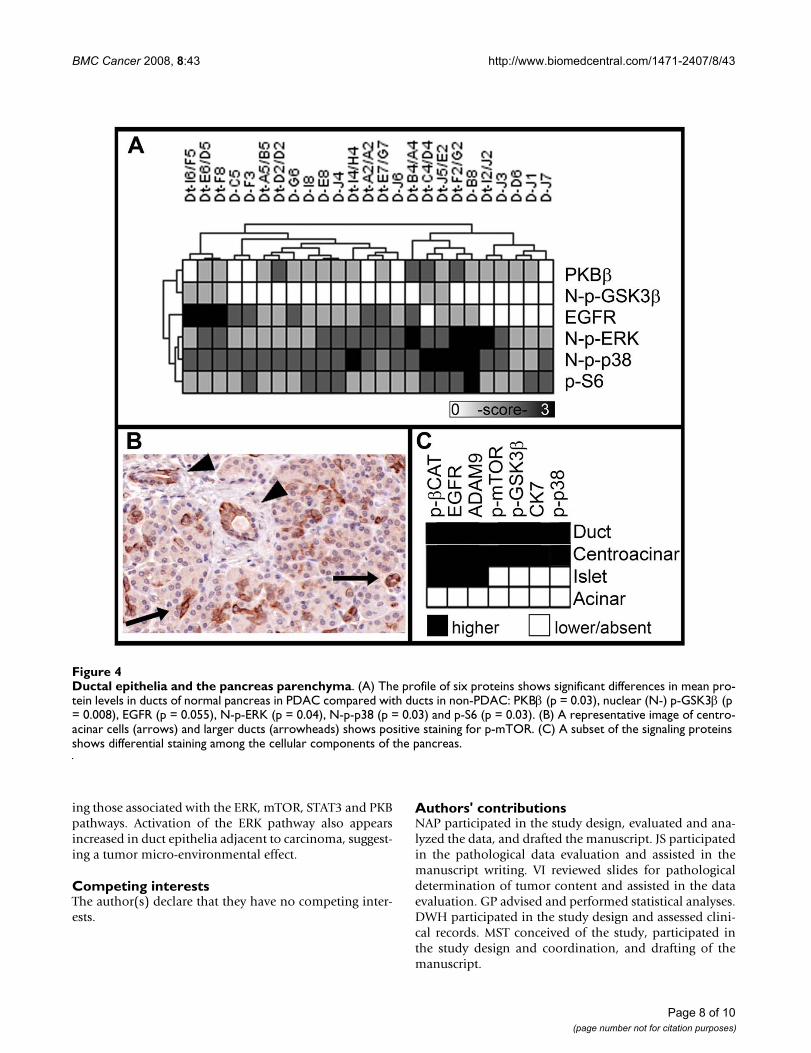
Signaling protein profile in normal pancreatic epitheliaA subset of the signaling proteins examined in this studydifferentially characterized histologically normal ductsadjacent to PDAC compared with ducts in non-PDACpancreas (Figure 4A). Mean levels of five proteins, cyto-plasmic PKBβ (p = 0.03) and p-S6 (0.03), and nuclear p-GSK3β (p = 0.008), p-ERK (p = 0.04) and p-p38 (p =0.03), were significantly higher in ducts adjacent to PDACthan in non-PDAC pancreas [see Additional file 5]. EGFRlevels showed a tendency (p = 0.055) to be higher in ductsadjacent to PDAC compared with non-PDAC pancreas.
Centroacinar cells, which are the terminal ducts lining thecentre of the acini, as expected showed a protein profilethat was similar compared with larger ducts (Figure 4B).The seven proteins, CK7, ADAM9, EGFR, p-βCAT, p-GSK3β, p-mTOR and p-p38 were present in both centro-acinar and ductal components (Figure 4C). The highexpression of p-βCAT, EGFR and ADAM9 characterizedislet cells, and relatively lower levels of all seven proteinscharacterized acinar cells.
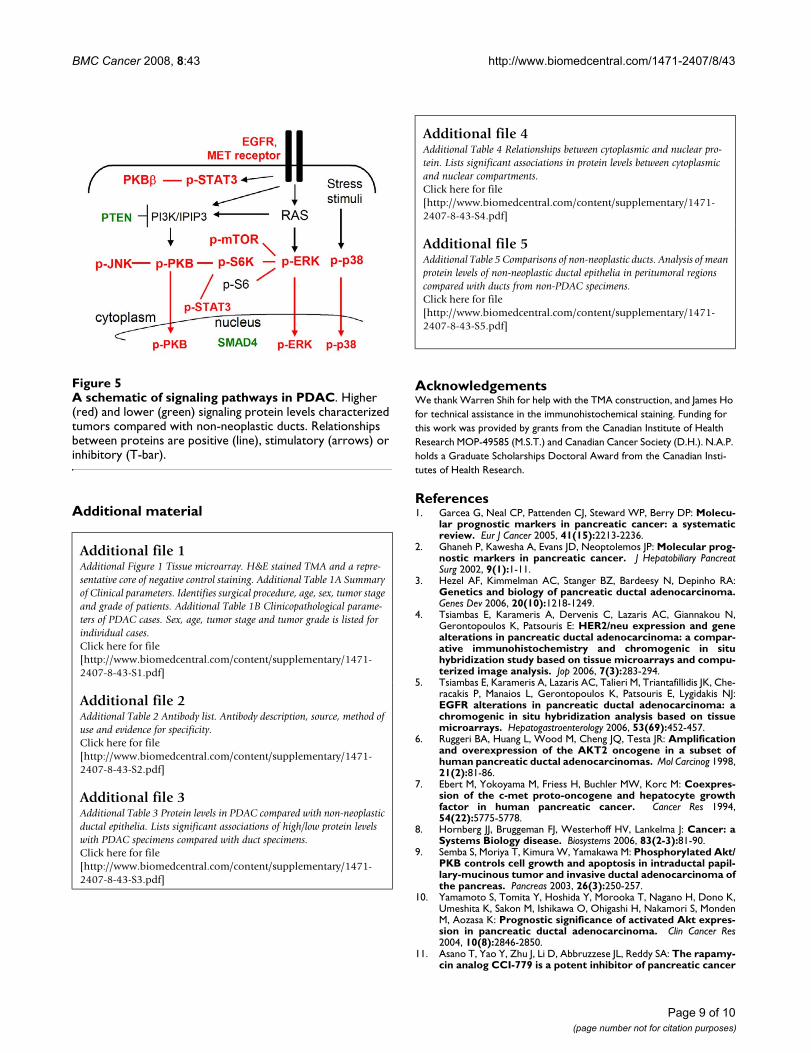
DiscussionIn this study, we used immunohistochemistry (IHC) anal-ysis to profile multiple signaling pathways involved ingrowth and progression of PDAC. To our knowledge, thisis the most comprehensive analysis of signaling proteinprofiles in PDAC cells compared with normal pancreaticduct cells. To confirm the validity of our study, we showedsimilar frequencies of loss of PTEN and SMAD4 expres-sion in our PDAC samples [24,25], and higher levels ofADAM9 and βCAT in tumor compared with normal ductsas previously reported [1,26]. Our results suggest thathigher levels of PTEN (8/9 cases) and lower STAT3 activa-tion (6/6 cases) were associated with advanced PDAC.Our results reveal that the predominantly activated signal-ing proteins in PDAC include those associated with theERK, mTOR, STAT3, PKB and p38 pathways (Figure 5).
The trend for associations in (phospho-) protein levelsbetween ERK and the mTOR/S6K/S6 pathway, as well asS6K and PKB or STAT3 suggest a co-activation of thesepathways or their crosstalk in PDAC. We propose that fur-ther evaluations of ERK and mTOR pathways in PDAC aspossible targets for drug combinations are warranted,since single molecule-directed strategies, such as the EGFRinhibitor erlotinib only had a limited effect on patient sur-vival [27].
Our results further suggest that PKB activity lacked signif-icant association with its antagonistic regulator PTEN aswell as with downstream PKB substrates including GSK3β,RAF and mTOR. Previous studies reported that high levelsof PKBβ (17/61 cases) [10] or loss of PTEN (3/9 cases)were associated with enhanced PKB activity [28] in PDAC.Additionally, the loss of PTEN was found only in a subsetof PDAC specimens characterized by enhanced PKBβactivity (2/12 cases) [29]. These inconsistencies may arisefrom methodological differences (e.g. varying pre-fixationtime with impact on phosphorylation states) [30], or thelimited number of cases included in previous studies andmerit further evaluation.
The levels of a subset of signaling pathways including p-ERK, p-p38, PKBβ or EGFR were enhanced in histologi-cally normal duct cells in PDAC compared with non-PDAC pancreas. This is consistent with a pro-survival roleof ERK and JNK in ductal epithelia of a murine hereditarypancreatitis model [22], and of enhanced EGFR expres-sion in chronic pancreatitis [31]. It is conceivable that theactivation of these signaling pathways could contribute toearly stages of duct cell carcinogenesis or reflect tumormicro-environmental effects of PDAC.
ConclusionOur observations suggest that multiple signaling proteinsare activated in pancreatic duct cell carcinogenesis includ-
Table 3: Protein levels which characterized advanced PDAC stage
Number of specimens (%)
Marker Low protein level High protein level p-value
I II III IV I II III IV
CytoplasmPTEN 1 (7) 8 (53) 6 (40) 0 1 (9) 0 8 (73) 2 (18) 0.01βCAT 1 (6) 8 (50) 5 (31) 2 (13) 0 1 (10) 9 (90) 0 0.04
p-NFκB 1 (5) 9 (47) 7 (37) 2(11) 0 0 5 (100) 0 0.05Nucleus
Y705p-STAT3 0 0 6 (75) 2 (25) 1 (6) 9 (50) 8 (44) 0 0.01p-GSK3β 1 (5) 9 (45) 8 (40) 2 (10) 0 0 6 (100) 0 0.05
Listed are tumors of stage I to IV, and their proportions (%) in low/high protein levels. Advanced PDAC stage (III and IV) associated with high protein levels (PTEN, βCAT, p-NFκB and p-GSK3β) and low p-STAT3 levels (Fisher's exact test, p ≤ 0.05).
Page 7 of 10(page number not for citation purposes)
BMC Cancer 2008, 8:43 http://www.biomedcentral.com/1471-2407/8/43
ing those associated with the ERK, mTOR, STAT3 and PKBpathways. Activation of the ERK pathway also appearsincreased in duct epithelia adjacent to carcinoma, suggest-ing a tumor micro-environmental effect.
Competing interestsThe author(s) declare that they have no competing inter-ests.
Authors' contributionsNAP participated in the study design, evaluated and ana-lyzed the data, and drafted the manuscript. JS participatedin the pathological data evaluation and assisted in themanuscript writing. VI reviewed slides for pathologicaldetermination of tumor content and assisted in the dataevaluation. GP advised and performed statistical analyses.DWH participated in the study design and assessed clini-cal records. MST conceived of the study, participated inthe study design and coordination, and drafting of themanuscript.
Ductal epithelia and the pancreas parenchymaFigure 4Ductal epithelia and the pancreas parenchyma. (A) The profile of six proteins shows significant differences in mean pro-tein levels in ducts of normal pancreas in PDAC compared with ducts in non-PDAC: PKBβ (p = 0.03), nuclear (N-) p-GSK3β (p = 0.008), EGFR (p = 0.055), N-p-ERK (p = 0.04), N-p-p38 (p = 0.03) and p-S6 (p = 0.03). (B) A representative image of centro-acinar cells (arrows) and larger ducts (arrowheads) shows positive staining for p-mTOR. (C) A subset of the signaling proteins shows differential staining among the cellular components of the pancreas.
Page 8 of 10(page number not for citation purposes)
BMC Cancer 2008, 8:43 http://www.biomedcentral.com/1471-2407/8/43
Additional material
AcknowledgementsWe thank Warren Shih for help with the TMA construction, and James Ho for technical assistance in the immunohistochemical staining. Funding for this work was provided by grants from the Canadian Institute of Health Research MOP-49585 (M.S.T.) and Canadian Cancer Society (D.H.). N.A.P. holds a Graduate Scholarships Doctoral Award from the Canadian Insti-tutes of Health Research.
References1. Garcea G, Neal CP, Pattenden CJ, Steward WP, Berry DP: Molecu-
lar prognostic markers in pancreatic cancer: a systematicreview. Eur J Cancer 2005, 41(15):2213-2236.
2. Ghaneh P, Kawesha A, Evans JD, Neoptolemos JP: Molecular prog-nostic markers in pancreatic cancer. J Hepatobiliary PancreatSurg 2002, 9(1):1-11.
3. Hezel AF, Kimmelman AC, Stanger BZ, Bardeesy N, Depinho RA:Genetics and biology of pancreatic ductal adenocarcinoma.Genes Dev 2006, 20(10):1218-1249.
4. Tsiambas E, Karameris A, Dervenis C, Lazaris AC, Giannakou N,Gerontopoulos K, Patsouris E: HER2/neu expression and genealterations in pancreatic ductal adenocarcinoma: a compar-ative immunohistochemistry and chromogenic in situhybridization study based on tissue microarrays and compu-terized image analysis. Jop 2006, 7(3):283-294.
5. Tsiambas E, Karameris A, Lazaris AC, Talieri M, Triantafillidis JK, Che-racakis P, Manaios L, Gerontopoulos K, Patsouris E, Lygidakis NJ:EGFR alterations in pancreatic ductal adenocarcinoma: achromogenic in situ hybridization analysis based on tissuemicroarrays. Hepatogastroenterology 2006, 53(69):452-457.
6. Ruggeri BA, Huang L, Wood M, Cheng JQ, Testa JR: Amplificationand overexpression of the AKT2 oncogene in a subset ofhuman pancreatic ductal adenocarcinomas. Mol Carcinog 1998,21(2):81-86.
7. Ebert M, Yokoyama M, Friess H, Buchler MW, Korc M: Coexpres-sion of the c-met proto-oncogene and hepatocyte growthfactor in human pancreatic cancer. Cancer Res 1994,54(22):5775-5778.
8. Hornberg JJ, Bruggeman FJ, Westerhoff HV, Lankelma J: Cancer: aSystems Biology disease. Biosystems 2006, 83(2-3):81-90.
9. Semba S, Moriya T, Kimura W, Yamakawa M: Phosphorylated Akt/PKB controls cell growth and apoptosis in intraductal papil-lary-mucinous tumor and invasive ductal adenocarcinoma ofthe pancreas. Pancreas 2003, 26(3):250-257.
10. Yamamoto S, Tomita Y, Hoshida Y, Morooka T, Nagano H, Dono K,Umeshita K, Sakon M, Ishikawa O, Ohigashi H, Nakamori S, MondenM, Aozasa K: Prognostic significance of activated Akt expres-sion in pancreatic ductal adenocarcinoma. Clin Cancer Res2004, 10(8):2846-2850.
11. Asano T, Yao Y, Zhu J, Li D, Abbruzzese JL, Reddy SA: The rapamy-cin analog CCI-779 is a potent inhibitor of pancreatic cancer
Additional file 1Additional Figure 1 Tissue microarray. H&E stained TMA and a repre-sentative core of negative control staining. Additional Table 1A Summary of Clinical parameters. Identifies surgical procedure, age, sex, tumor stage and grade of patients. Additional Table 1B Clinicopathological parame-ters of PDAC cases. Sex, age, tumor stage and tumor grade is listed for individual cases.Click here for file[http://www.biomedcentral.com/content/supplementary/1471-2407-8-43-S1.pdf]
Additional file 2Additional Table 2 Antibody list. Antibody description, source, method of use and evidence for specificity.Click here for file[http://www.biomedcentral.com/content/supplementary/1471-2407-8-43-S2.pdf]
Additional file 3Additional Table 3 Protein levels in PDAC compared with non-neoplastic ductal epithelia. Lists significant associations of high/low protein levels with PDAC specimens compared with duct specimens.Click here for file[http://www.biomedcentral.com/content/supplementary/1471-2407-8-43-S3.pdf]
Additional file 4Additional Table 4 Relationships between cytoplasmic and nuclear pro-tein. Lists significant associations in protein levels between cytoplasmic and nuclear compartments.Click here for file[http://www.biomedcentral.com/content/supplementary/1471-2407-8-43-S4.pdf]
Additional file 5Additional Table 5 Comparisons of non-neoplastic ducts. Analysis of mean protein levels of non-neoplastic ductal epithelia in peritumoral regions compared with ducts from non-PDAC specimens.Click here for file[http://www.biomedcentral.com/content/supplementary/1471-2407-8-43-S5.pdf]
A schematic of signaling pathways in PDACFigure 5A schematic of signaling pathways in PDAC. Higher (red) and lower (green) signaling protein levels characterized tumors compared with non-neoplastic ducts. Relationships between proteins are positive (line), stimulatory (arrows) or inhibitory (T-bar).
Page 9 of 10(page number not for citation purposes)
http://www.ncbi.nlm.nih.gov/entrez/query.fcgi?cmd=Retrieve&db=PubMed&dopt=Abstract&list_uids=9496907
http://www.ncbi.nlm.nih.gov/entrez/query.fcgi?cmd=Retrieve&db=PubMed&dopt=Abstract&list_uids=9496907
http://www.ncbi.nlm.nih.gov/entrez/query.fcgi?cmd=Retrieve&db=PubMed&dopt=Abstract&list_uids=9496907
http://www.ncbi.nlm.nih.gov/entrez/query.fcgi?cmd=Retrieve&db=PubMed&dopt=Abstract&list_uids=7954397
http://www.ncbi.nlm.nih.gov/entrez/query.fcgi?cmd=Retrieve&db=PubMed&dopt=Abstract&list_uids=7954397
BMC Cancer 2008, 8:43 http://www.biomedcentral.com/1471-2407/8/43
Publish with BioMed Central and every scientist can read your work free of charge
"BioMed Central will be the most significant development for disseminating the results of biomedical research in our lifetime."
Sir Paul Nurse, Cancer Research UK
Your research papers will be:
available free of charge to the entire biomedical community
peer reviewed and published immediately upon acceptance
cited in PubMed and archived on PubMed Central
yours — you keep the copyright
Submit your manuscript here:http://www.biomedcentral.com/info/publishing_adv.asp
BioMedcentral
cell proliferation. Biochem Biophys Res Commun 2005,331(1):295-302.
12. Liptay S, Weber CK, Ludwig L, Wagner M, Adler G, Schmid RM:Mitogenic and antiapoptotic role of constitutive NF-kappaB/Rel activity in pancreatic cancer. Int J Cancer 2003,105(6):735-746.
13. Nakashima H, Nakamura M, Yamaguchi H, Yamanaka N, Akiyoshi T,Koga K, Yamaguchi K, Tsuneyoshi M, Tanaka M, Katano M: Nuclearfactor-kappaB contributes to hedgehog signaling pathwayactivation through sonic hedgehog induction in pancreaticcancer. Cancer Res 2006, 66(14):7041-7049.
14. DeArmond D, Brattain MG, Jessup JM, Kreisberg J, Malik S, Zhao S,Freeman JW: Autocrine-mediated ErbB-2 kinase activation ofSTAT3 is required for growth factor independence of pan-creatic cancer cell lines. Oncogene 2003, 22(49):7781-7795.
15. Chadha KS, Khoury T, Yu J, Black JD, Gibbs JF, Kuvshinoff BW, TanD, Brattain MG, Javle MM: Activated Akt and Erk expression andsurvival after surgery in pancreatic carcinoma. Ann Surg Oncol2006, 13(7):933-939.
16. Poch B, Gansauge F, Schwarz A, Seufferlein T, Schnelldorfer T, Ram-adani M, Beger HG, Gansauge S: Epidermal growth factorinduces cyclin D1 in human pancreatic carcinoma: evidencefor a cyclin D1-dependent cell cycle progression. Pancreas2001, 23(3):280-287.
17. Furukawa T, Duguid WP, Kobari M, Matsuno S, Tsao MS: Hepato-cyte growth factor and Met receptor expression in humanpancreatic carcinogenesis. Am J Pathol 1995, 147(4):889-895.
18. Yasuda A, Sawai H, Takahashi H, Ochi N, Matsuo Y, Funahashi H, SatoM, Okada Y, Takeyama H, Manabe T: The stem cell factor/c-kitreceptor pathway enhances proliferation and invasion ofpancreatic cancer cells. Mol Cancer 2006, 5:46.
19. Carriere C, Seeley ES, Goetze T, Longnecker DS, Korc M: The Nes-tin progenitor lineage is the compartment of origin for pan-creatic intraepithelial neoplasia. Proc Natl Acad Sci U S A 2007,104(11):4437-4442.
20. Stanger BZ, Dor Y: Dissecting the cellular origins of pancreaticcancer. Cell Cycle 2006, 5(1):43-46.
21. Strobel O, Dor Y, Stirman A, Trainor A, Fernandez-del Castillo C,Warshaw AL, Thayer SP: Beta cell transdifferentiation does notcontribute to preneoplastic/metaplastic ductal lesions of thepancreas by genetic lineage tracing in vivo. Proc Natl Acad Sci US A 2007, 104(11):4419-4424.
22. Archer H, Jura N, Keller J, Jacobson M, Bar-Sagi D: A Mouse Modelof Hereditary Pancreatitis Generated by Transgenic Expres-sion of R122H Trypsinogen. Gastroenterology 2006.
23. Sturn A, Quackenbush J, Trajanoski Z: Genesis: cluster analysis ofmicroarray data. Bioinformatics 2002, 18(1):207-208.
24. Ebert MP, Fei G, Schandl L, Mawrin C, Dietzmann K, Herrera P, FriessH, Gress TM, Malfertheiner P: Reduced PTEN expression in thepancreas overexpressing transforming growth factor-beta 1.Br J Cancer 2002, 86(2):257-262.
25. Tascilar M, Skinner HG, Rosty C, Sohn T, Wilentz RE, Offerhaus GJ,Adsay V, Abrams RA, Cameron JL, Kern SE, Yeo CJ, Hruban RH, Gog-gins M: The SMAD4 protein and prognosis of pancreatic duc-tal adenocarcinoma. Clin Cancer Res 2001, 7(12):4115-4121.
26. Grutzmann R, Luttges J, Sipos B, Ammerpohl O, Dobrowolski F,Alldinger I, Kersting S, Ockert D, Koch R, Kalthoff H, Schackert HK,Saeger HD, Kloppel G, Pilarsky C: ADAM9 expression in pancre-atic cancer is associated with tumour type and is a prognos-tic factor in ductal adenocarcinoma. Br J Cancer 2004,90(5):1053-1058.
27. Welch SA, Moore MJ: Erlotinib: success of a molecularly tar-geted agent for the treatment of advanced pancreatic can-cer. Future Oncol 2007, 3(3):247-254.
28. Asano T, Yao Y, Zhu J, Li D, Abbruzzese JL, Reddy SA: The PI 3-kinase/Akt signaling pathway is activated due to aberrantPten expression and targets transcription factors NF-kap-paB and c-Myc in pancreatic cancer cells. Oncogene 2004,23(53):8571-8580.
29. Altomare DA, Tanno S, De Rienzo A, Klein-Szanto AJ, Tanno S, SkeleKL, Hoffman JP, Testa JR: Frequent activation of AKT2 kinase inhuman pancreatic carcinomas. J Cell Biochem 2003,88(1):470-476.
30. Mandell JW: Phosphorylation state-specific antibodies: appli-cations in investigative and diagnostic pathology. Am J Pathol2003, 163(5):1687-1698.
31. Farrow B, Sugiyama Y, Chen A, Uffort E, Nealon W, Mark Evers B:Inflammatory mechanisms contributing to pancreatic can-cer development. Ann Surg 2004, 239(6):763-9; discussion 769-71.
Pre-publication historyThe pre-publication history for this paper can be accessedhere:
http://www.biomedcentral.com/1471-2407/8/43/prepub
Page 10 of 10(page number not for citation purposes)
http://www.ncbi.nlm.nih.gov/entrez/query.fcgi?cmd=Retrieve&db=PubMed&dopt=Abstract&list_uids=7573364
http://www.ncbi.nlm.nih.gov/entrez/query.fcgi?cmd=Retrieve&db=PubMed&dopt=Abstract&list_uids=7573364