impact of rogun dam on downstream uzbekistan agriculture
80
IMPACT OF ROGUN DAM ON DOWNSTREAM UZBEKISTAN AGRICULTURE A Thesis Submitted to the Graduate Faculty of the North Dakota State University of Agriculture and Applied Science By Shokhrukh-Mirzo Jalilov In Partial Fulfillment of the Requirements for the Degree of MASTER OF SCIENCE Major Program: Natural Resources Management May 2010 Fargo, North Dakota
-
Upload
khangminh22 -
Category
Documents
-
view
1 -
download
0
Transcript of impact of rogun dam on downstream uzbekistan agriculture

IMPACT OF ROGUN DAM ON DOWNSTREAM UZBEKISTAN AGRICULTURE
A Thesis
Submitted to the Graduate Faculty
of the
North Dakota State University
of Agriculture and Applied Science
By
Shokhrukh-Mirzo Jalilov
In Partial Fulfillment of the Requirements
for the Degree of
MASTER OF SCIENCE
Major Program:
Natural Resources Management
May 2010
Fargo, North Dakota

ii

iii
ABSTRACT
Jalilov, Shokhrukh-Mirzo, M.S., Natural Resources Management Program, College of
Graduate and Interdisciplinary Studies, North Dakota State University, May 2010.
Impact of Rogun Dam on Downstream Uzbekistan Agriculture. Major Professor: Dr.
Dr. Tom M. DeSutter.
Strains among the states of Central Asia caused by overuse of the region’s
scarce water resources have been increasing in recent years. This is especially true for
the relations between Tajikistan, upstream, and Uzbekistan, downstream, on the
Amudarya River. Major controversy exists over constructing Rogun Dam on the
Vakhsh River, a tributary of the Amudarya River. Construction of Rogun Dam, with a
planned height of 335 m (1099 ft), began in 1976 but was stopped in 1991 with the
breakup of the former Soviet Union. The intent of this dam is to supply Tajikistan with
energy, but a side effect will be the changed flow regime of the Amudarya River to
downstream states (especially Uzbekistan). The major impact will be on the agricultural
sector of Uzbekistan. The objectives of this study are to estimate the monetary impacts
of Rogun Dam and propose mitigation measures to minimize impacts. The study
investigates the nature and extent of those impacts and indicates policy implications to
mitigate negative consequences of the possible water shortage in summer by assessing
the baseline situation and comparing that situation with future status-quo (no changes)
level of water. Future water shortage could cost Uzbekistan annually over US $609
million economic loss in agriculture, reduce the country’s GDP by 2.2%, and result in
336,000 unemployed people. If Uzbekistan changes its present water use practice and
increases water use efficiency, the future water shortage during irrigation periods will
not as seriously affect the country’s economy, as adaptive management measures could
cut the losses by 40%.

iv
ACKNOWLEDGMENTS
This thesis would not have been possible without the support, encouragement
and endless efforts of a large number of people.
I am deeply indebted to my supervisors, Dr. Jay A. Leitch and Dr. Tom M.
DeSutter, who gave me the opportunity to complete my study; their suggestions and
encouragement helped me in completing research and writing this thesis. The
preparation of this thesis would not have been successful without the facilitation of my
graduate committee members, Dr. Dean Steele and Dr. Garry Clambey, who supported
and encouraged me to go ahead with my research.
I want to thank the U. S. Department of State for giving me the opportunity to
study in the USA and commence this thesis as a Muskie fellow.
My colleagues from the NDSU Soil Testing Laboratory supported me during my
study. I want to thank them for all their help, support, interest and valuable hints.
Especially, I am obliged to Larry Swenson, Dave Olson, and Kristin Newman.
I also want to thank Keri DeSutter for editing the final version of the thesis for
English style and grammar and offering suggestions for improvement.
Especially, I would like to give my special thanks to my father and mother in
Uzbekistan, my wife Donokhon, and my daughters Shokhina and Shokhzoda whose
patient love enabled me to complete this important work.

v
TABLE OF CONTENTS
ABSTRACT ............................................................................................................................... iii
ACKNOWLEDGMENTS........................................................................................................ iv
LIST OF TABLES ................................................................................................................... vii
LIST OF FIGURES ................................................................................................................ viii
LIST OF BOXES ...................................................................................................................... ix
LIST OF ABBREVIATIONS .................................................................................................. x
CHAPTER 1. INTRODUCTION ............................................................................................ 1
Problem statement ......................................................................................................... 1
Research goals ............................................................................................................... 3
Research methods .......................................................................................................... 3
Thesis organization ....................................................................................................... 5
CHAPTER 2. REVIEW OF LITERATURE AND BACKGROUND ............................... 6
Development of water resources management in the Central Asian states ................ 12
Soviet Union period ................................................................................................. 13
Independent period .................................................................................................. 15
Current status of water resources management in the region ..................................... 19
Principles of transboundary water management in the region ................................ 19
Present situation in the study area ........................................................................... 22
Impact assessment of large dams ................................................................................ 24
CHAPTER 3. METHODS AND ASSUMPTIONS ............................................................ 28
Current situation as a baseline condition .................................................................... 28
Rogun Reservoir filling stage...................................................................................... 30
Rogun Reservoir electricity generation mode ............................................................. 37
Estimation of monetary impacts under “worst case” scenario .................................... 40
Estimation of monetary impacts under “adaptive” scenario ....................................... 43

vi
TABLE OF CONTENTS (Continued)
CHAPTER 4. RESULTS AND DISCUSSION ................................................................... 47
Rogun Reservoir filling stage...................................................................................... 47
Rogun Reservoir full operation mode ......................................................................... 49
Estimation of monetary impacts under “worst case” scenario .................................... 51
Estimation of monetary impacts under “adaptive” scenario ....................................... 52
CHAPTER 5. SUMMARY AND POLICY IMPLICATIONS .......................................... 57
Worst case ................................................................................................................... 58
Adaptive case .............................................................................................................. 59
Policy implications ...................................................................................................... 59
REFERENCES CITED .................................................................................................. 62

vii
LIST OF TABLES
Table Page
1. Land resources of the Aral Sea basin ......................................................................... 8
2. Surface water resources in the Aral Sea basin (mean annual runoff, km3/year) ...... 12
3. Water flow (km3) in the Aral Sea basin watershed ................................................... 20
4. Examples of socioeconomic factors and their potential changes resulting from
project implementation .............................................................................................25
5. Mean monthly water flow of the Vakhsh and Amudarya Rivers (km3) ................... 29
6. Total and average seasonal water flow of the Vakhsh and Amudarya Rivers jjnjugvv
(km3) ......................................................................................................................... 29
7. Characteristics of Nurek and Rogun Reservoirs ....................................................... 30
8. Total land area and agricultural land area, by regions of Uzbekistan jksssdsvdkoszd
(as of January 1, 2005; thousand hectares) ............................................................... 32
9. Comparison of economic gross margin (irrigated crops) ......................................... 42
10. Possible reduction of Uzbekistan water use during Rogun Dam filling ................... 53
11. Comparison of impacts under two outcomes............................................................ 55

viii
LIST OF FIGURES
Figure Page
1. Water use and prospective requirements, Amudarya River (million m3/yr) .............. 3
2. Natural surface flow in the Amudarya River basin
(mean annual runoff, %) ............................................................................................. 3
3. Map of Central Asia .................................................................................................... 6
4. Aral Sea basin ............................................................................................................. 9
5. Symbolic map, The Amudarya River basin .............................................................. 10
6. Agreed water allocation and actual water use by the Amudarya River basin jdsuihsd
countries (in km3) ......................................................................................................18
7. Current and planned infrastructure in the Vakhsh River basin ................................. 23
8. Main water consumers in the Amudarya River basin (%) ........................................ 31
9. Irrigated land and water use by regions of Uzbekistan along the Amudarya hbnjiubk
River ......................................................................................................................... 33
10. The Amudarya basin with its main tributaries and the Dams of Rogun, Nurek jhjkj
and Tuyamuyun Hydroengineering Complex (THC) ...............................................34
11. Interannual variations of the discharge of the Amudarya River derived from
precipitation integrated over its catchment area. (A) satellite-measured (GPCP)
precipitation (km3/month); (B) gauge-measured (GPCC) precipitation
(km/3month). Dashed line is a moving average of about 1 year
period..………………………………………………………………………….......48
12. The Amudarya River hydrograph with and without Rogun Dam ............................ 50

ix
LIST OF BOXES
Box Page
1. Externality ................................................................................................................... 1
2. Run-off control rate .................................................................................................. 11
3. Key economic indicators of Uzbekistan ................................................................... 29
4. Some important economic indicators ....................................................................... 43
5. Water pricing methods .............................................................................................. 45
x
LIST OF ABBREVIATIONS
The abbreviations used in this thesis are listed below.
BAT Best available technology
CA Central Asia
EDB Eurasian Development Bank
EIS Environmental Impact Assessment
FAO Food and Agriculture Organization
GDP Gross Domestic Product
GNP Gross National Product
GPCC Global Precipitation Climatology Centre
GPCP Global Precipitation Climatology Project
IA Impact Assessment
ICWC Interstate Commission for Water Coordination
O&M Operation and Maintenance
RCR Run-off control rate
RHPP Rogun Hydro Power Plant
SDI Subsurface drip irrigation
THC Tuyamuyun Hydroengineering Complex
UN United Nation
UNECE United Nation Economic Commission for Europe
UN SPECA Special Programme for the Economies of Central Asia (SPECA)
USSR Union of Soviet Socialist Republics

1
CHAPTER 1. INTRODUCTION
Worldwide, 70% of freshwater used by humans goes to satisfy irrigation
agriculture needs, and demand for irrigation water is still increasing as irrigated land
continues to rise (Cai et al. 2003). For the countries of the Amudarya River basin,
93.4% of water resources is used for irrigated agriculture (Froebrich et al. 2006).
Taking into consideration that upstream countries are keenly interested in developing
hydropower energy potential and downstream countries need to satisfy their irrigated
agriculture, the region is experiencing conflict between two conflicting interests in
using the region’s already scarce water resources.
In 2008, Tajikistan announced intentions to resume construction of Rogun Dam
on the Vakhsh River, a tributary to the Amudarya River (Schmidt 2008). Construction
of Rogun Dam, with a planned height of 335 m (1099 ft), was started in 1976.
Construction was stopped in 1991 with the breakup of the Union of Soviet Socialist
Republics (USSR; Soviet Union). The purpose of this dam is to supply Tajikistan with
hydropower, but a side effect may be a threat of reduced water supplies or changed
annual flow regimes for
downstream countries (especially
for Uzbekistan). This side effect is
what economists call an
“externality” (Box 1).
Problem statement
Water resources management is within the exclusive sovereignty of countries.
Due to political issues and sovereignty rights, the damming of international rivers
represents a politically sensitive issue (Uitto and Duda 2002). Remembering the recent
Box 1. Externality
Externality occurs whenever one economic entity’s
action affects the well-being of another economic
entity for better or worse unintentionally. The most
interesting point, whether positive or negative
externality occurs, it does not need to be paid. In our
case, Tajikistan’s action may result in an unintended
side effects or negative externality on Uzbekistan.
Source: Mount Holyoke (2010)

2
Aral Sea case (Micklin 1993), politicians became involved in the disputes over the need
for construction of Rogun dam, followed by environmentalists who questioned the
impacts that Rogun dam would have on the environment. These disputes demonstrated
how important water is to the socio-economic and environmental well-being of Central
Asian countries.
Rogun Dam has led to growing tensions among riparian countries ever since its
construction was first envisioned. Rogun Dam caused widespread public opposition not
only because of aggravating a social situation by resettling people, but also because this
dam would be constructed in a highly active seismic location (Badenkov 1990). The
total capacity of the planned hydro investments of Rogun Hydro Power Plant (RHPP) in
Tajikistan is expected to be 3,600 MW (average annual performance 13.1 billion kWh)
at a cost of US $2.2 billion (EDB 2008). The cost of energy per MWh in Tajikistan is
going to be US$10-40, while in neighboring Afghanistan it is US$25-350, in Pakistan
US$65-150, and in China US$30-75 (UN SPECA 2004). The importance of the Rogun
Dam for downstream Uzbekistan is that: 1) Uzbekistan’s use of water from the
Amudarya River almost equals the water use of all other five Central Asian (CA)
countries combined (Figure 1), and 2) water flow of the Vakhsh River (the second
biggest tributary) accounts for 27% of the total flow of the Amudarya River (Figure 2).
The construction of the Rogun Dam puts Uzbekistan in a potentially difficult situation
of dependence on water release from upstream Tajikistan during the irrigation season.

3
Figure 1. Water use and prospective Figure 2. Natural surface flow in the
requirements, Amudarya River Amudarya River basin
(million m3/yr) (mean annual runoff, %)
Source: CAREWIB (2010)
Research goals
The goal of this research is to ex ante identify possible outcomes of Rogun Dam
construction on the economy of Uzbekistan. The objectives of this assessment are to:
1. Estimate the strategic level impacts of the proposed Rogun Dam, in terms of
its future water supply volume;
2. Identify impacts to Uzbekistan’s agricultural economy during construction
of Rogun Dam; and
3. Propose mitigation measures to minimize those impacts under worst case
and adaptive scenarios.
Research methods
Research will be conducted in the context of water resources management issues
with the specification of transboundary water management. The research will use a
generally descriptive and qualitative case study approach. Findings will be interpreted
in relation to the working regime of Rogun Dam and in relation to their significance to
strategic planning of Uzbekistan’s economy.
0 20,00040,00060,000
1990
1997
2010
Uzbekistan
Other CAcountries
27%
73%
Vakhsh
Othertributaries

4
The steps for developing a general Impact Assessment (IA) include the
following:
1. Describe an existing situation in water resources management as a
baseline. This includes a history of water resources management practices
in the former Soviet Union period and after its collapse. This chapter allows
for an understanding of the current model of water resources management
practices among adjacent riparian countries, with a focus on the positive and
negative points for the economies of Tajikistan and Uzbekistan.
2. Analyze the future economic situation with regard to the construction of
Rogun Dam. Taking into consideration that construction of Rogun Dam is
already occurring and completion of the project will take approximately ten
more years, a time period of 10 to 15 years was analyzed. Estimation of the
available water supply for downstream Uzbekistan and water usage was
created through this 10 to 15 year timeline.
3. Create future possible scenarios for strategic development of the Uzbekistan
economy in condition of modified flow regime. Two possible scenarios were
analyzed: 1) Uzbekistan keeps its current practice of water resources
management (worst case) and 2) Uzbekistan changes its current practice and
accepts new methods of water resources management (adaptive case).
The proposed research will be a new piece of information for the region of
Central Asia. Although an impact assessment should be done before the construction of
Rogun Dam, results of the study can provide useful information for policymakers in
future damming projects in the study region.

5
Thesis organization
The thesis consists of five chapters. Chapter 1 is the thesis introduction. Chapter
2 examines the current literature in the fields of water resources management in the
study region. Chapter 3 discusses assumptions and methods used in this thesis. Chapter
4 provides the results of the study. Chapter 5 states the conclusions drawn from the
current work and suggests directions for future studies.

6
CHAPTER 2. REVIEW OF LITERATURE AND BACKGROUND
Nature does not respect national borders; yet human beings seem incapable of
managing their affairs without them. Nature has also not endowed every place
on earth or every nation with the same type and amount of resources. Herein lie
the roots of interstate conflict and cooperation over essential and scarce natural
resources, such as freshwater. In Central Asia both possibilities will continue to
exist for a long time. (Elhance 1997, p.207)
Central Asia is a region which had been largely unknown to the international
community for a long time. Central Asia encompasses five republics of the former
Soviet Union: Kazakhstan, Kyrgyzstan, Tajikistan, Turkmenistan, and Uzbekistan
(Figure 3) (McKinney 2003).
Figure 3. Map of Central Asia
Source: Blueyurt Central Asia (2010)
The territory of Central Asia covers about 4 million km2 (1.5 million mi
2) and
has about 55 million people (UN 2007a). Most of Central Asia lies within steppes and
7
deserts, which require water to conduct agricultural activities on fertile spots of land
(Spoor and Krutov 2003). The climate of the region is generally dry with cold winters
and hot summers. The average daytime temperature in July ranges between 25o and
32oC (77
o and 90
oF) and the mean temperature in January is between –15
o and 3
oC (5
o
and 37oF) (Kharin 2002). Annual precipitation in the region ranges from 200 mm (7.9
in) in deserts and valleys to 800 to 1600 mm (31 to 63 in) in elevated mountain areas;
where potential evaporation ranges from more than 2250 mm (88 in) in arid zones to
less than 500 mm (20 in) in mountain areas (O’Hara 2000). The region is rich with
natural resources, especially oil and natural gas. An estimated reserve of the main
natural resources of Central Asia is 33 billion metric tons (250 billion barrels) of
recoverable oil and 9.3 trillion m3 (328 trillion ft
3) of recoverable natural gas (Daly
2009).
The economies of all Central Asian countries, except Kazakhstan, are largely
dependent on agricultural production and this agriculture is almost fully dependent on
irrigation (ICG 2002). Currently, 60% of the rural population in the basin of the Aral
Sea1 is employed by agricultural related businesses (UN 2007a, Elhance 1997). The
well-being of 53% of the people in CA, including 20 million people in Uzbekistan, is
directly dependent on an irrigation-based economy (Elhance 1997). Currently, only 18
million hectares (44 million acres) of the 59 million hectares (146 million acres) of
arable land are being cultivated (UN 2007a). The third largest country of the region, by
area, Uzbekistan, has the largest arable land area of more than 9 million hectares (22
million acres). In contrast, countries of Kyrgyzstan and Tajikistan, collectively have
1 The Aral Sea basin includes states in Central Asia – Kazakhstan, Kyrgyzstan, Tajikistan, Turkmenistan,
and Uzbekistan – and parts of Afghanistan and northern Iran (Elhance 1997). However, for the purpose
of this study, Aral Sea basin, presumes only territories of five Central Asian countries.

8
only 14% of all arable area of the Aral Sea basin, but these countries are upstream,
water flow-generating countries (Table 1). As more than half of the Gross Domestic
Product (GDP) directly comes from agriculture and about 40% of human resources are
employed in that sector, effectively managing the region’s rich, but unequally spread,
water resources is critical (O’Hara 2000). Access to fresh water resources is becoming
the most vital issue in Central Asia.
Table 1. Land resources of the Aral Sea basin
Source: FAO (1997)
Note: * Territories within the Aral Sea basin
The distinctive feature of the region is the uneven distribution of energy
resources where Kazakhstan, Turkmenistan, and Uzbekistan have almost all proven
reserves of hydrocarbons (oil and natural gas), while Kyrgyzstan and Tajikistan have
approximately 90% of all hydropower potential (UN 2007a). However, water is the
most important conflict-prone resource, along with land and mineral reserves (UN
2007b). Therefore, disputes and strains over the use of scarce water resources within the
region are escalating (Sievers 2002). Smith (1995, p. 353) gave a dangerous forecast
for the future of Central Asian countries by stating “nowhere in the world is the
potential for conflict over the use of natural resources as strong as in Central Asia.”
Therefore, careful management of natural resources in Central Asia is becoming a
critical issue for political stability in the region.
Country Area,
ha
Potential arable land,
ha
Arable land,
ha
Kazakhstan* 34,440,000 23,872,400 2,445,000
Kyrgyzstan* 12,490,000 1,570,000 1,017,000
Tajikistan 14,310,000 1,571,000 1,593,000
Turkmenistan 48,810,000 7,013,000 3,540,300
Uzbekistan 44,884,000 25,447,700 9,441,200
Aral Sea Basin 154,934,000 59,474,100 18,036,500

9
Central Asia has two major rivers, the Amudarya2 and the Syrdarya
3. Both rivers
originate in mountainous areas in Central Asia. Both rivers flow into the Aral Sea and
contribute to the water resources of the Aral Sea basin, which constitutes approximately
90% of the region’s usable water resources, which is about 125 km3
(30 mi3) annually
(O’Hara 2000) (Figure 4).
Figure 4. Aral Sea basin
Source: Roll et al. (2003)
Along its route to the Aral Sea, the Amudarya River serves as a border between
Afghanistan and Tajikistan and between Afghanistan and Uzbekistan. Surface runoff
constitutes a large portion of inflow for both rivers (Elhance 1997). The Amudarya
River is the largest river in Central Asia (both in length and flow) with a length of 2,540
km (1,578 mi) (Wegerich 2004) and is shaped by the confluence of two main
tributaries, the Vakhsh and Pyandj Rivers (Figure 5).
2 Amudarya = Amu Darya
3 Syrdarya = Syr Darya

10
Pyandj – 45%
Amudarya River
Amudarya River
Vak
hsh
– 27
%
Kaf
irnig
an –
7%
Sur
khan
dary
a –
7%
Sher
abad
– 1
%
Kas
hk
adar
ya
– 2
%
Rivers of A
fghanistan – 8%
Uzbekistan
Kyrgyzstan
Tajikistan
Turkmenistan
Kazakhstan
Rogun
dam site
Aral
Sea
Afghanistan
Page 1
Figure 5. Symbolic map, The Amudarya River basin
The Amudarya River basin’s drainage terminates in the Aral Sea and comprises
territories of Afghanistan, Kazakhstan, Turkmenistan, Tajikistan, and Uzbekistan. The
Amudarya River basin catchment zone includes between 250,000 and 304,000 km2
(96,000 and 117,000 mi2) and is shared by Afghanistan and four central Asian states of
Kyrgyzstan, Tajikistan, Turkmenistan, and Uzbekistan (Wegerich et al. 2007, Schluter
et al. 2005). The two reservoirs along the main flow of the Amudarya River are the
Tyuyamuyun and Tahiatash reservoirs (Schlűter et al. 2005). The Amudarya’s average
annual runoff is 73.6 km3 (18 mi
3) with variations between 47 and 108 km
3 (11 and 26
mi3) (Spoor and Krutov 2003).
The second largest river in the Aral Sea basin is the Syrdarya River, which starts
in Kyrgyzstan and ends in the Aral Sea. The Syrdarya River is shorter than the
Amudarya River with a length of 2,200 km (1,367 mi) and has an average annual

11
Box 2. Run-off control rate
Run-off control rate is how much surface
water cannot be discharged onto areas of
natural vegetation and where RCR of 1.00
is equal to no water reaching its natural
flow areas.
Source: UN (2007a)
discharge of 38.8 km3 (9 mi
3) with a variation ranging between 21 and 54 km
3 (5 and 13
mi3) (Spoor and Krutov 2003).
The Amudarya and Syrdarya river flows are heavily regulated. A UN Diagnostic
report estimates that the run-off control rate (RCR) is 0.78 for the Amudarya River and
0.94 for the Syrdarya River. Flows of both
rivers are heavily regulated through a number
of water management facilities such as
diversion dams and reservoirs.
In the Aral Sea basin, high RCR occurs due to the presence of 18 water
reservoirs on the previously mentioned rivers. Total capacity of water storage of all 18
water reservoirs on both rivers approximates to 57 million m3 (2 billion ft
3), where
twelve reservoirs are on the Syrdarya River [total capacity of 36.5 million m3
(1.3
billion ft3)] and six reservoirs on the Amudarya River [total capacity of 20.2 million m
3
(0.7 billion ft3)] (Elhance 1997). In addition, the two rivers have collectively 274 water
diversion structures and 612 km (380 mi) of main canals (Elhance 1997). The Syrdarya
River is more heavily regulated than the Amudarya River, although there are a few new
dams under construction on both rivers (Libert et al. 2008, Wegerich 2008). Reservoirs
in Tajikistan control approximately 60% of the total Amudarya flow and also 9% of
Syrdarya storage volume, while Kyrgyzstan controls only 58% of the Syrdarya storage
volume (O’Hara 2000). Diversions from these two rivers have made available enough
water for agricultural, industrial and other uses in most of Central Asia as there are few
sources of freshwater outside these two main river basins (Elhance 1997). The
reservoirs upstream of the Amudarya and Syrdarya Rivers control water discharge, and
disputes between upstream and downstream countries have occurred in recent decades.

12
Water resources are unequally distributed among the states of Central Asia
(Table 2). Upstream countries of Kyrgyzstan and Tajikistan together control about 68%
of the total water flow in the Aral Sea basin; in the same time the downstream countries
of Kazakhstan, Turkmenistan and Uzbekistan consume the most water, about 85% of
water resources in the Aral Sea basin (Libert et al. 2008). Such a large disproportion in
water consumption transferred problem from just hydrological issue to the political
aspect (Libert et al. 2008). At present, Central Asian states concern themselves with
resource catch through increasing their water consumption without following official
agreements (Wegerich 2008).
Table 2. Surface water resources in the Aral Sea basin (mean annual runoff, km3/year)
River basin, km3/year Aral Sea basin
Syrdarya Amudarya km3 %
Kazakhstan 2,516 - 2,516 2.2
Kyrgyzstan 27,542 1,654 29,196 25.2
Tajikistan 1,005 58,732 59,737 51.5
Turkmenistan - 1,405 1,405 1.2
Uzbekistan 5,562 6,791 12,353 10.6
Afghanistan and Iran - 10,814 10,814 9.3
Total 36,625 79,396 116,021 100
Source: Scientific-Information Center of the Interstate Commission for Water
Coordination in Central Asia (SIC ICWC), 2010.
Development of water resources management in the Central Asian states
Water resources management has been a critical issue in Central Asia since
ancient times (Hartman 2007). As long as people have been engaged in traditional
agricultural practices, the profession of “mirab” (water distributor) has been highly
respected and important (Abdullaev et al. 2009). Mirabs are still present in remote areas
of the region’s countries. The 21st-century brought new challenges in water resources
development through diverting rivers and constructing dams for purposes of irrigation
and hydropower generation. Along with new technology and techniques the new

13
century opened room for conflict over the use of water resources in Central Asia
(Hartman 2007).
Soviet Union period
During the era of Soviet rule, Central Asia’s water resources were developed
and managed as one integrated scheme (O’Hara 2000). Although all republics had their
own Ministries of Water Resources, in reality they were just departments of the
Ministry of Land Reclamation and Water Resources (Minvodkhoz) of the Soviet Union
(Spoor and Krutov 2003). Thus, decision-making processes related to water resources
were concentrated in Moscow. Such policy created situations where water resource
development schemes were established without taking into account national borders of
Central Asian states (Wegerich 2004). For instance, reservoirs were built upstream in
Kyrgyzstan and Tajikistan that had high potential of hydropower generation, but no
hydrocarbons reserves (UN 2007a).
During the Soviet era, Moscow was managing water releases for downstream
countries’ needs during the growing season (irrigation) while, in exchange, they
provided upstream countries with natural gas, oil, and coal during the winter. The water
allocation structure in the former Soviet Central Asia consisted of two interrelated
components:
(i) Water allocation quotas for each republic and every irrigation project
established, which were strictly controlled by the USSR Government, and (ii)
planned deliveries of energy to the Kyrgyz and Tajik Soviet Republics for use in
the winter (Libert 2008, p. 11).
O’Hara (2000) claims conflicts between water-abundant and water-shortage
countries were created inventively by Soviet policy-makers to avoid regional
cooperation which was dangerous for Soviet rule, and to strengthen the role of Moscow
as a problem-solving administration between republics.

14
In effect, the Soviet administration created a situation which would ensure
competition between water-surplus and water-deficit republics. This situation
worked to Moscow’s advantage in two ways. First, disputes over water
reinforced the national distinctiveness of the republics, thus limiting the
potential for regional co-operation which would threaten Soviet control. Second,
as competition for water increased the Republics were forced to ask Moscow to
intervene, a role it was more than willing to undertake. In short, water policy
was central to Moscow’s efforts to divide and rule the region (O’Hara 2000, p.
430).
However, such “divide and rule policy” described by O’Hara (2000) is doubted
by Lange (2001) and Wegerich (2004). Lange (2001) argues that water resources
management facilities were intended to unify and were “placed where it made sense.”
Moreover, Lange (2001) states that the building of dams upstream was done especially
to gain full control over downstream countries’ irrigated agriculture. Wegerich (2004)
goes further stating that the old Soviet system, with interrelations between water,
energy, and food, was an advantage for the entire region and was advantageous for all
countries. Wegerich (2004) further concludes that the Soviet management of water
resources was efficient and advantageous for all riparian countries in the Aral Sea basin.
Also, establishment of a large water allocation infrastructure in the region might have
had political reasons by increasing employment and increasing agricultural production
(Wegerich 2008). Thus, there is no one conclusion why Soviet planners put reservoirs
in upstream republics of Kyrgyzstan and Tajikistan and made downstream republics
heavily dependent on water release from upstream, while these upstream states were
dependent on energy supply form their downstream neighbors.
Wegerich (2008) indicates that the Soviet policy of water allocation in the
region was beneficial for downstream countries, while ignoring Afghanistan and
placing Tajikistan into the role of water controller through building dams in its territory.
Qaseem Naimi (2005) mentions that the Soviet Union always ignored water claims of

15
Afghanistan and only in 1987 specified a limit of 2.1 km3/yr (0.5 mi
3) of water for
Afghanistan. However, an International Crisis Group (ICG) report mentions that
according to an agreement between the Soviet Union and Afghanistan in 1946,
Afghanistan has a right to consume 9 km3/yr (2.1 mi
3), which comprises 50 percent of
the Pyandj River flow (ICG 2002). Concerning these data, Wegerich (2008) holds
doubts because no other sources have verified that number and he adds that important
information was mentioned only in footnote (Wegerich 2008). Irrespective of
consequences, the former USSR simply considered the Amudarya River its own inland
river and not a transboundary river as it is today.
Independent period
In 1991, when the Soviet Union collapsed and Central Asian republics became
independent and sovereign nations, the newly independent nations found themselves in
a situation of uneven water allocation and in a large degree of interdependence with
respect to water management facilities (Wegerich 2008). The former water distribution
scheme that resolved all intra- and inter-republic water disputes and was managed by
central authorities in Moscow disappeared almost overnight with the breakdown of the
Soviet Union, which left the newly emerged sovereign countries with problems of
highly uneven distribution and consumption of water resources (Elhance 1997). The
disputes between upstream and downstream states arose because of the mode of
operation of dams that controlled both energy generation and irrigation water. From the
Soviets, the upstream countries inherited control over water allocation and could define
when and what amount of water is permitted to go downstream (O’Hara 2000).
Independence had significant implications for Central Asian water resources allocation.
16
In 1987 USSR Ministry of Land Reclamation and Water Resources established
the following surface water allocations in the Amudarya River basin (in percent of flow
per year):
- Kyrgyzstan – 0.6% (0.4 km3or 0.1 mi
3),
- Tajikistan – 15.4% (11.3 km3or 2.7 mi
3),
- Turkmenistan – 35.8% (26.3 km3or 6.3 mi
3), and
- Uzbekistan – 48.2% (35.5 km3or 8.5 mi
3).
After gaining independence, these four countries reached an agreement (again without
Afghanistan) to keep the Soviet system of water resources allocation (Wegerich 2004,
Wegerich 2008). The “Agreement on Cooperation in Joint Management, Use and
Protection of Interstate Sources of Water Resources” was signed in February 1992 by
the presidents of all five Central Asian states and confirmed the “status quo” of water
allocation structure of the former Soviet Union until new forms and arrangements of
water allocation were developed (Libert et al. 2008). To implement provisions of the
1992 Agreement, the presidents formed the Interstate Commission for Water
Coordination (ICWC), which became the main institution responsible for monitoring
water allocation of the Amudarya and Syrdarya Rivers (Libert et al. 2008).
The 1992 Agreement missed one main statement – provision of energy supplies
to Tajikistan and Kyrgyzstan to use in the winter period (Libert et al. 2008). Therefore,
although Central Asian leaders agreed to continue the Soviet system of water allocation,
the situation became more complicated when downstream countries stopped supplying
Kyrgyzstan and Tajikistan with relatively cheap mineral resources, which were highly
subsidized during Soviet time and were now transferred to current world prices.
However, the upstream countries of Kyrgyzstan and Tajikistan could not afford to pay

17
these world prices. In response to such policy they simply switched their dams from
irrigation mode to hydro-energy generation mode, which means that dams started to
accumulate water in the summer and release water in winter (Wegerich 2008). The
downstream impacts of this situation have been substantial. Uzbekistan claimed that
Kyrgyzstan’s actions negatively affected Uzbekistan’s agriculture and resulted in about
$700 million (US dollars) lost in crop production in 1996 because of water shortage
during the irrigation period (Oxford Analytica 1997). Similarly, release of excess water
in winter creates not only a problem of water shortage in summer for downstream
countries, but also causes floods and natural disasters for these countries during winter
(Lange 2001). Disagreement between these newly independent countries resulted in
issues that directly impacted the economies of the region’s countries.
The Soviet administration managed Central Asian water resources based on the
borders of the river basin and did not pay attention to administrative and national
borders (Wegerich 2004). However, independence brought new challenges for the
region since political borders now dissect the Aral Sea basin creating a situation of
uncontrolled water consumption by riparian countries of Central Asia. The interstate
Council for the Aral Sea (ICAS) in 1998 requested that the regions’ countries present
their estimates of water needs and based on their evaluation, and it became clear that the
demand of 151.8 km3 exceeds the natural flow of 119.2 km
3 (O’Hara 2000). Recent data
presented by Glantz (2005) provide annual estimates of water resources distribution of
the Amudarya River (Figure 6). Uzbekistan, Turkmenistan, Tajikistan use water
resources within their defined water distribution limits. Glantz (2005) did not have data
for Kyrgyzstan.

18
Figure 6. Agreed water allocation and actual water use by the Amudarya River basin
countries (in km3)
Source: Adapted from Glantz (2005)
Uzbekistan tries to reduce water consumption by converting areas formerly used
to grow cotton (Gossypium hirsutum L.) to wheat (Triticum aestivum), which is a less
water consuming crop. However, this water saving strategy might be minimized due to
more water needed for leaching soluble salts (leaching maintenance) and due to
deterioration of the old irrigation infrastructure (Spoor and Krutov 2003). Currently,
with the absence of one superior control agency, every country of the region tries to get
as much water as it can, which essentially leads to a further deterioration of the Aral
Sea.
Although 19 years have passed since the collapse of the Soviet Union, countries
of Central Asia have made little progress in changing the Soviet style of water resources
management. Moreover, some these countries try to keep old, outdated systems, and
therefore put the whole region onto the edge of conflict.
The water allocation in the Amu Darya reflect the colonial legacy of the Soviet
Union: the downstream riparian states, Turkmenistan and Uzbekistan, were
utilized to produce cotton, the upstream state, Tajikistan used water for energy
production and it was anticipated to increase its reservoir capacity further to
0.4
11.3
26.3
35.5
9.5
22
29.6
Kyrgyzstan Tajikistan Turkmenistan Uzbekistan
Limit use Actual use

19
provide water storage and facilitate agricultural production downstream,
Afghanistan and Kyrgyzstan were simple producers of water without having a
real claim to it (Wegerich 2008, p.71).
Current status of water resources management in the region
The possibility for conflict among riparian states in international river basins
occurs because transboundary water resources, particularly on rivers that go beyond
national borders, provoke two main concerns of the riparian states: sovereignty and
territorial integrity (Elhance 1997). Elhance (1997) further states why potential conflict
is the possible case for the Central Asian countries where barely any other water
sources exist outside of the Amudarya and Syrdarya River basins.
The potential for acute conflict intensifies when severe scarcities of water – an
essential, nonsubstitutable, and increasingly shared resource – are experienced
or anticipated by one or more states, or when such a resource is rightly or
wrongly perceived as being overexploited or degraded by others at a cost of
oneself. This is clearly the case in Central Asia… (Elhance 1997, p. 211).
Principles of transboundary water management in the region
Strains between upstream and downstream countries over the use of water
resources are common in many parts of the world (Stone 2010). At present, research on
this topic is mostly based on two main components: 1) who (population) and 2) what
(environment) are impacted by building of a dam (Wegerich 2004). The expression
“upstreamers use water to get more power, downstreamers use power to get more
water” (Warner 2004, p. 11) can be used to describe current water policies of riparian
countries in the basin of the Amudarya River. The solution to water allocation is
difficult, especially when upstream countries follow their national interests and are
unwilling to compromise in this potentially zero-sum game (Spoor and Krutov 2003).
The conflict happens because the downstream countries like Turkmenistan and
Uzbekistan are still preserving old, ineffective irrigation systems and continue to grow

20
cotton, which is highly water-consumptive (Spoor and Krutov 2003) and where
countries like Afghanistan, Tajikistan and Kyrgyzstan are source of water and use only
minimal quantities of water (Wegerich 2008).
According to data presented by the World Bank (1996), three downstream
countries of Central Asia overuse water compared to flow originating in their territories.
The data indicates Kazakhstan uses 7.5 times more water, Turkmenistan uses 8.5 times
more water and Uzbekistan uses 6.5 times more water than available water resources
within each respective country; while upstream countries of Kyrgyzstan and Tajikistan
are the source for 3 and 5 times more water than each country uses for their needs
(Table 3). Such a big discrepancy in water consumption became a source for disputes
between water-abundant and water-poor countries of the region.
Table 3. Water flow (km3) in the Aral Sea basin watershed.
Country Amudarya Syrdarya Totals Water used in
agriculture
Water used
in industry
Afghanistan 6.18 - 6.18 - -
Kazakhstan - 4.50 4.50 27.41 6.26
Kyrgyzstan 1.90 27.40 29.30 9.50 0.59
Tajikistan 62.90 1.10 64.00 10.96 0.91
Turkmenistan 2.78 - 2.78 23.29 0.49
Uzbekistan 4.70 4.14 8.84 54.37 3.68
Totals 78.46 37.14 115.60 125.53 11.93
Source: World Bank (1996)
Wegerich (2004) identifies two kinds of solutions in the situation of water
allocation for upstream hydroenergy generation and for downstream irrigation
suppliers: “win-win” or “zero-sum.” Win-win happens when both sectors need water at
the same time. So, water is released to generate power during irrigation period.
However, release of water and hydropower production when water is not needed for
irrigation creates a zero-sum solution (Wegerich 2004). Wegerich (2004) concludes that
a win-win solution could occur for all riparian countries, while a zero-sum solution is

21
most beneficial for upstream countries because the cost of hydroelectricity is
considerably lower than the cost of hydrocarbons for fuel. As a solution, Wegerich
(2004) proposes a one-to-one exchange of energy between countries and discontinuing
use of world market prices. Under one-to-one exchange Wegerich (2004) means, for
instance, one ton of water to one ton of natural gas. This one-to-one exchange seems a
highly unreliable scenario as it is hard to believe that downstream countries will agree
to these terms of exchange. Another kind of solution is also possible. The main idea of
this solution is when one country loses less than another country gains or vice-versa,
one country gains less than another country loses. This situation of “win-lose” can be
more clearly interpreted in monetary type: country X, through building a dam, gains
200 units when downstream country Y loses 100 units. Although this kind of scenario
has not been extensively described in scientific literature, the idea could be used as a
basis for negotiation between conflicting countries.
Another factor is that about 5% of water resources that are available to former
Soviet republics come from Afghanistan, but, to date, Afghanistan has not been
involved in disputes over the allocation of the Amudarya River basin water resources.
While Afghanistan occupies 23% of the Amudarya River basin, it currently withdraws
only about 1.5 km3 (0.4 mi
3) of the Amudarya River water inflow per year (Elhance
1997). Since Afghanistan is progressing towards stability and developed agriculture, the
country may eventually demand its portion of water resources, which may increase the
competition for the region’s water resources and potentially start new conflicts (O’Hara
2000, Spoor and Krutov 2003). The greatest impact in this situation will be incurred by
Uzbekistan, which will suffer reduced water resources from the Amudarya River basin
(ICG 2002). Uzbekistan should understand that without changing its practice of water

22
usage and without negotiation with upstream countries, an equitable and reliable
distribution of the basin’s water may no longer be possible. Water distribution may also
affect Uzbekistan’s desire to have a steadily developing economy. Some agreement
between water-rich and energy-rich countries of the region will help to regulate
transboundary water issues along the Amudarya River basin. Concerning the
management of transboundary water resources in Central Asia, Libert et al. (2008)
states:
The water situation in Central Asia is unique, determined in particular by the
fact that the main river basins were previously used and developed as national
within a single state (USSR) but are presently transboundary and shared by
independent nations. In this situation, it is not easy to provide a straightforward
answer in regards to the determination and interpretation of the rights and
obligations of upstream and downstream countries (Libert 2008, p. 12).
Present situation in the study area
The many documents of international water law, multilateral as well as bilateral
and including the most known and important non-binding “The Helsinki Rules on the
Uses of the Waters of International Rivers,” the UNECE Convention on the Protection
and Use of Transboundary Watercourses and International Lakes (in force since 1966),
and the worldwide UN Convention on the Law of the Non-Navigational Uses of
International Watercourses (not in force), do not determine common legal basis for
transboundary water management. Moreover, international water law consists of two
contradictory definitions: balanced and reasonable use of transboundary water resources
and the obligation of one country not to make significant harm to another country by
using common water resources (Libert et al. 2008). Further, Libert et al. (2008) explains
that international water law stipulates cooperation and consultations between riparian
countries on sustainable use of transboundary water resources, but if states do not come

23
to an agreement, a state, in exceptional cases, can start action without the consent of
neighboring states.
Tajikistan controls, or is going to control, water discharge in the Amudarya
River through one of the main Amudarya River’s tributaries, the Vakhsh River (27% of
Amudarya River flow). The Vakhsh River has eight dams: Shurob, Nurek, Baipaza,
Sangtuda 1, Sangtuda 2, Golovnaya, Prepadnaya, and Central, but all of them, with the
exception of Nurek Dam, are small dams and do not represent a real threat for
downstream water allocation (Figure 7).
Figure 7. Current and planned infrastructure in the Vakhsh River basin
Source: Tajik Met Service as referenced in World Bank (2004)
Note: Rogum means Rogun

24
In the case of Rogun Dam, development should focus on mutual benefit for both
upstream and downstream countries. Tajikistan needs to have agreements with riparian
countries and according to international institutions, the Vakhsh River is a
transboundary river and is out of exclusive control of one country (Schmidt 2008).
Uzbekistan is strongly against Rogun Dam construction on the base of negative effects
to its agriculture (ICG 2002, Spoor and Krutov 2003). Rogun Dam is a very delicate
project balancing between interests of riparian countries and the situation is too
complex to say whether its construction is “good” or “bad.” Although Rogun Dam is
under construction, there has still not been an assessment done relating the dam’s
impacts on the downstream Uzbekistan economy, which is heavily dependent on
irrigation water from the Amudarya River.
Impact assessment of large dams
The International Commission on Large Dams specified that large dams are
those where height exceeds 15 m from the foundation, or if its reservoir volume is more
than 3 million m3
(World Commission on Dams 2000). According to these definitions,
at present, about 50,000 dams in the world can be classified as large dams (Tullos et al.
2009). The 20th
-century is characterized by advanced technologies and high-capacity
machinery, so engineers are able to build larger and higher dams to meet increasing
demands for electricity generation or irrigation (Dorcey et al. 1997). However, the
construction of large dams became a disputable issue as large dams can result in social
and environmental costs, unforeseen geological changes, unexpected adverse outcomes,
and other negative economic externalities (Dorcey et al. 1997).

25
Table 4. Examples of socioeconomic factors and their potential changes resulting from
project implementation
Type of concern Factor Potential Changes
Demographic General characteristics and trends in population for
state, substate region, county, and city.
Increase or decrease in
population.
Migrational trends in study area (study area is a
function of alternatives and available data base).
Increase or decrease in
migrational trends.
Population characteristics in study area, including
distribution by age, sex, ethnic groups, educational
level, and family size.
Increase or decrease in various
population distributions; people
relocation
Distinct settlements of ethnic groups or deprived
economic/minority groups.
Disruption of settlements pattern;
people relocations
Economic and
employment
Economic history for state, substate region,
county, and city.
Increase or decrease in
economic patterns.
Employment and unemployment patterns in
study area, including occupational distribution
and location and availability of work force.
Increase or decrease in overall
employment or unemployment
levels and change in
occupational distribution.
Income levels and trends for study areas. Increase or decrease in income
levels.
Land use, values,
and taxes
Land-use patterns and controls for study area. Change in land usage; may or
may not be in compliance with
existing land-use plans.
Land values in study area. Increase or decrease in land
values.
Tax levels and patterns in study area, including land
taxes, sales taxes, and income taxes.
Changes in tax levels and patterns
resulting from changes in land
usage and income levels.
Public service
and social
concerns
Housing characteristics in study area, including types
of housing and occupancy levels and age and
condition of housing.
Changes in types of housing and
occupancy levels.
Health and social services in study area, including
health manpower, law enforcement, fire protection,
water supply, wasterwater treatment facilities, solid
waste collection and disposal, and utilities.
Changes in demand on health and
social services.
Public and private educational resources in study
area, including K-12, junior colleges, and
universities.
Changes in demand on
educational resources.
Transportation systems in study area, including
highway, rail, air, and waterway.
Changes in demand on
transportation systems;
relocations of highways and
railroads.
Community
attitudes and
cohesion
Community attitudes and life-styles, including
history of area voting patterns.
Changes in attitudes and life-
styles.
Community cohesion, including organized
community groups.
Disruption of cohesion.
Miscellaneous Tourism and recreational opportunities in study area. Increase or decrease in tourism
and recreational potential.
Religious patterns and characteristics in study area. Disruption of religious patterns
and characteristics.
Areas of unique significance such as cemeteries or
religious camps.
Disruption of unique areas.
Source: Canter, 1977
Note: The concerns in bold are studied in this thesis as the impacts resulted by the
Rogun Dam Project

26
Dam construction should comply with Pareto welfare optimum “where no one can be
made better off without making someone worse off” as it actually means development
failure (Goodland 1997).
Aspects characterizing the socioeconomic environment comprise many
interrelated and nonrelated components, which represent a number of items that are not
related to the physical, chemical, biological, or cultural environments (Canter et al.
1985). On the other hand, these aspects are the most descriptive in describing human
interactions and relationships (Canter et al. 1985). The brief version of socioeconomic
parameters that are used in an Environmental Impact Statement (EIS) and the
generalized changes that can occur after construction and functioning of suggested
projects are given in Table 4, where the concern addressed later in this thesis are
highlighted. However, there are no universally agreed or accepted methods and
standards for conducting socio-economic impact assessments that can be applied to
most development projects (Canter et al., 1985). Canter et al. (1985) outlined typical
criteria for assessing impact significance:
Nature of the impact: probability of occurrence, people affected,
geographic pervasiveness, duration;
Severity: local sensitivity, magnitude; and
Potential for mitigation: reversibility, economic costs, institutional
capacity.
These criteria are used as a starting point in assessing proposed projects and every
development project has its own features and characteristics. Increasing world
population and unlimited goals to increase living standards require construction of more

27
dams for the purpose of hydropower, irrigation, drinking water supply, flood control,
navigation, recreation and others to meet growing needs (Tullos et al. 2009).
Dams are used as instruments for human development, yet their socioeconomic
impacts on people, either intentional or unintentional, are potentially considerable (Egre
and Senecal 2003). These socioeconomic impacts include resettlement and migration,
changes of size and structure of household, employment and income, way of using land
and water resources, changes in community level as well as the potential psychosocial
consequences of resettling people (Tullos et al. 2009). In order to manage negative
socioeconomic impacts, mitigation measures are applied. However, these impacts are in
most cases “spatially significant, locally disruptive, lasting, and often irreversible”
(World Commission on Dams 2000, p. 102). Assessment of social impacts of large
dams always represents a challenge (Egre and Senecal 2003) and dams, depending on
their unique construction scale, design, and operation, have different potential for
adverse effects.
As the nature of impacts which could occur by dam construction is wide and
extensive (Table 4) this study is going to focus attention on impacts of Rogun Dam on
downstream Uzbekistan GDP, government revenues, and employment in agricultural
sector. Through the above-mentioned economic indicators the possible impact of Rogun
Dam on the economy of Uzbekistan will be discussed.

28
CHAPTER 3. METHODS AND ASSUMPTIONS
Construction and operation of Rogun Dam will cause temporary and permanent
water resources changes in the Vakhsh River and, consequently, in flow of the
Amudarya River. Temporary changes will be observed during filling of the reservoir,
while permanent changes will be associated with the electricity generation regime of
Rogun Reservoir after it is filled. This chapter consists of five successively developing
sections: 1) establishment of the baseline condition, 2) estimation of the Rogun
Reservoir annual filling rate, period of filling, and possible changes to the flow of the
Amudarya River during this time, 3) estimation of the flow of the Vakhsh and the
Amudarya Rivers after Rogun Reservoir is filled (electricity generation mode), 4)
identification of monetary impacts (if any) during section 2 and 3 above under status-
quo or “worst case” scenario (Uzbekistan keeps business-as-usual), and 5) identification
of monetary impacts (if any) during the Rogun Reservoir filling stage and full operation
mode under adaptive management case or “adaptive” scenario.
Current situation as a baseline condition
The current situation without Rogun Dam is the baseline condition where all
data related to flow level, agricultural production, and employment were collected
before Rogun Dam construction. The data include the average monthly (Table 5) and
total and average seasonal flow (Table 6) of the Vakhsh and Amudarya Rivers, the
irrigated land area of Uzbekistan and water use volume along the Amudarya River
(Figure 9, p. 33), and Uzbekistan economic situation (Box 3).

29
Table 5. Mean monthly water flow of the Vakhsh and Amudarya Rivers (km3)
(Amudarya flow is measured at the point of Kerki)
Rivers Months
Jan Feb Mar Apr May Jun Jul Aug Sep Oct Nov Dec
Vakhsh 0.46 0.45 0.55 1.16 2.06 3.16 4.15 3.50 1.81 0.87 0.64 0.53
Amudarya 2.12 2.13 2.54 4.33 6.92 9.85 11.66 9.00 5.05 4.51 2.48 2.33
Source: Adapted from UNECE (2007)
Table 6. Total and average seasonal water flow of the Vakhsh and Amudarya Rivers
(km3) (Amudarya flow is measured at the point of Kerki)
Periods Vakhsh Amudarya
Annual Total Monthly Average Annual Total Monthly Average
Summer (Apr-Sept) 15.84 2.64 46.81 7.80
Winter (Oct-Mar) 3.5 0.58 16.11 2.69
Total of two periods 19.34 1.61 62.92 5.24
Source: Adapted from UNECE (2007)
The peak flow of the Amudarya and Vakhsh Rivers occurs in July, when flow reaches
11.66 km3 and 4.15 km
3, respectively, and minimum flow level is observed in January
(2.12 km3 and 0.16 km
3, respectively) (Table 5). Consequently, water flow in the
summer period (April-September) in the Amudarya River increases to almost 47 km3
(75%) out of 63 km3 of annual flow, and the Vakhsh River’s flow during the same
period reaches almost 16 km3 (80%) out of 20 km
3 of annual flow level (Table 6).
Box 3. Key economic indicators of Uzbekistan
Population, total – 27.3 million people
Labor force, total – 15.37 million people
Labor force composition by sectors of economy:
Agriculture – 44% or US$ 6.77 million
Industry – 20% or US$ - 3.07 million
Services – 36 % or US$ 5.53 million
Gross Domestic Product (GDP) (current US$), (billions) – 27.9
GDP composition by sectors:
Agriculture – 25.8% or US$ 7.2 billion
Industry – 31.4% or US$ - 8.7 billion
Services – 42.8 % or US$ 11.9 billion
GDP per labor force (current US$) – 1,815
Budget (US $ billion): Revenues 8.884, Expenditures 8.474 Source: CIA (2009)

30
Rogun Reservoir filling stage
Currently, the biggest dam on the Vakhsh River is the Nurek Dam, located
approximately 30 km (18 mi) below Rogun Dam, which is currently being constructed
(Wegerich et al. 2007). As there are not sufficient data available about Rogun Dam
construction, damming, filling and working regimes, a number of assumptions about the
Rogun Dam were based on Nurek Dam. These assumptions allow us to apply some
information about the filling period and working regime of Nurek Dam to the Rogun
Dam. So, for the purpose of the study, data of Nurek Dam is being used and
extrapolated for Rogun Dam. Such a comparison is viable due to all characteristics,
except active regulation storage and surface area, are similar (Table 7).
Table 7. Characteristics of Nurek and Rogun Reservoirs
Characteristics Nurek Dam Rogun Dam
Height of the dam (m) 300 335
Design capacity (km3) 10.5 13.3
Active regulation storage (km3) 4.5 8.6
Length (km) 70 70
Surface area (km2) 98 170
Maximum depth (m) 220 310
Hydropower capacity (MW) 3000 3600
Long-term average annual hydropower
production (TWh)
11.2 14.5
Source: Adapted from source Wegerich et al. (2007), Schmidt, (2008),
The Rogunskaya HPS (2009).
To assess the impacts of Rogun Dam on the agriculture and overall economy of
Uzbekistan and to understand the nature of those impacts, severity, and mitigation
measures, the overall structure of water consumption in the Amudarya River basin
should be taken into consideration. Different sources give different estimations (Cai et
al. 2003, Ikramov 2000) of water use by the sectors of economy, but all sources indicate
that irrigated agriculture uses the largest portion of the Amudarya River water flow,
which exceeds 90% of the total water consumption from the river (Figure 8) (Froebrich

31
et al. 2006, Ikramov 2000). The quantity of water used by Uzbekistan for irrigation is
certainly substantial and some authors even speculate that during the recent decade,
50% to 90% of irrigation water never reached crop lands because of the poor quality of
irrigation infrastructure (Sievers 2002). In addition, Sievers (2002) mentions that such a
big number can be the result of “the fact that water users have historically received
water for free” (Sievers 2002, p.365).
At present, estimates indicate that irrigated agriculture uses about 93% of the
water of the Amudarya River total flow (Figure 8). Agricultural irrigation is the main
sector of the Uzbekistan economy that will be the most impacted by possible seasonal
water reductions caused by the construction of Rogun Dam, or so called “recipient” of
the impacts. Due to the relatively low portion of water used by other sectors of the
economy compared to agriculture, non-agricultural sectors will be left for another, more
in-depth, study.
Figure 8. Main water consumers in the Amudarya River basin (%)
Source: Adapted from Froebrich et al. (2003)
93.4
1.2 2.8 1.5 0.8 0.3 0
10
20
30
40
50
60
70
80
90
100
Agricultural
irrigation
Industry Municipal
water supply
Electricity Fish economy Animal
husbandry
%

32
However, this assumption does not mean that the rest of the economy may not be
impacted because other sectors of the economy are closely linked with agriculture
through production chains and different kinds of subsidies (Abdullaev et al. 2009).
Due to suitable natural conditions, Uzbekistan has more than four million
hectares of irrigated lands (Table 8), and agriculture accounts for 32% of the country’s
GDP (Ikramov 2000).
Table 8. Total land area and agricultural land area, by regions of Uzbekistan (as of
January 1, 2005; thousand hectares)
Region
Total land
area (ha)
All agricultural
land (ha)
Including
Arable land
(ha)
Hayfields and
pastures (ha)
Karakalpakstan 16,100.6 5,146.9 419.5 4,709.4
Andijan 430.3 250.4 196.8 21.2
Bukhara 4,193.7 2,901.2 199.6 2,674.1
Djizak 2,117.8 1,248.5 479.2 746.0
Kashkadarya 2,856.8 2,198.1 674.9 1,466.7
Navoiy 10,937.4 9,265.1 110.4 9,137.5
Namangan 718.1 388.9 196.7 153.1
Samarkand 1,677.4 1,297.5 440.9 795.7
Surkhandarya 2,009.9 1,176.0 280.4 862.0
Syrdarya 427.6 297.0 256.3 23.6
Tashkent 1,558.5 804.2 335.9 429.7
Ferghana 700.6 314.3 249.8 24.5
Khorezm 681.6 399.3 208.6 172.2
Uzbekistan 44,410.3 25,687.4 4,049.0 21,215.7
Source: Statistical Bulletin (2006)
According to forecasts, agriculture will preserve its leading role in the economy
accounting for 20 to 25% of the GDP (Ikramov 2000). Agriculture employs 36.2% of
the total labor force in Uzbekistan (Gemma 2003). However, agricultural production is
not diversified and largely consists of cotton and wheat (Abdullaev et al. 2009). Cotton
is considered a major strategic crop that, through export, earns approximately 1/3 of
hard currency revenue (US$) (Gemma 2003). Uzbekistan is the fourth largest cotton
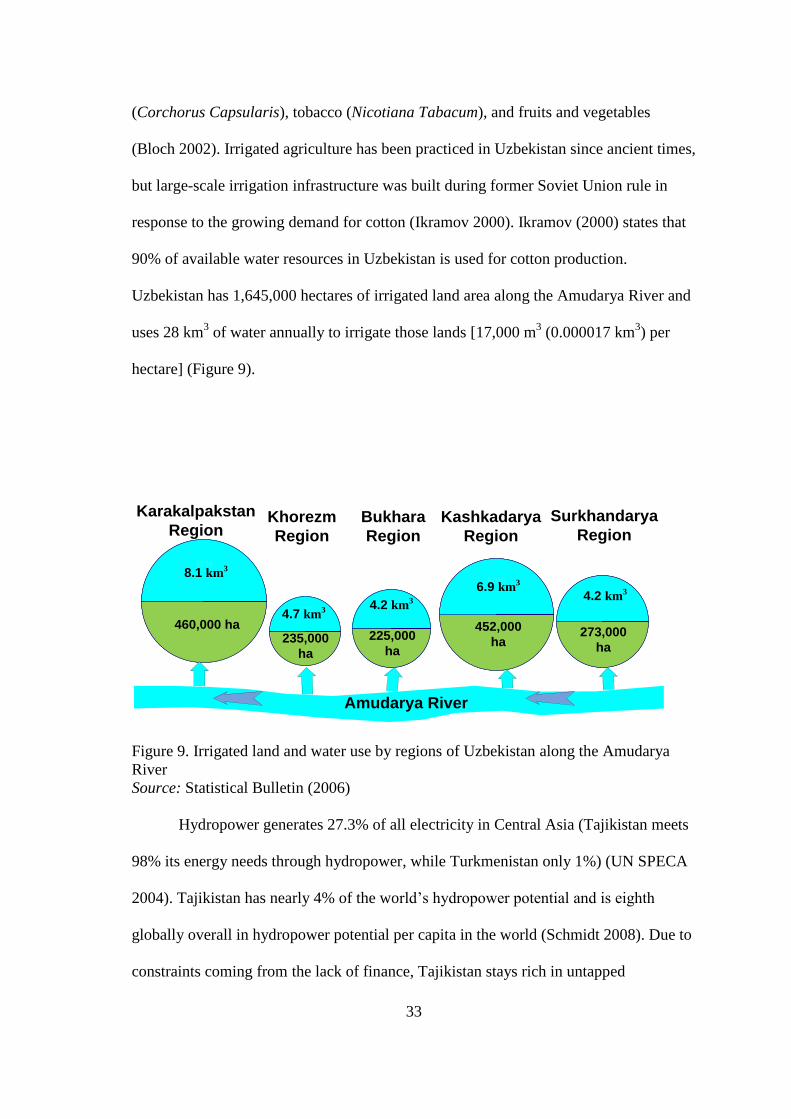
producer in the world on gross production and cotton production consists of 35% of
irrigated land (Bloch 2002). Other major agricultural crops are rice (Oryza sativa), jute
33
(Corchorus Capsularis), tobacco (Nicotiana Tabacum), and fruits and vegetables
(Bloch 2002). Irrigated agriculture has been practiced in Uzbekistan since ancient times,
but large-scale irrigation infrastructure was built during former Soviet Union rule in
response to the growing demand for cotton (Ikramov 2000). Ikramov (2000) states that
90% of available water resources in Uzbekistan is used for cotton production.
Uzbekistan has 1,645,000 hectares of irrigated land area along the Amudarya River and
uses 28 km3 of water annually to irrigate those lands [17,000 m
3 (0.000017 km
3) per
hectare] (Figure 9).
50%
50%
50%
50%
50%
50%
50%
50%
50%
50%
Surkhandarya
RegionKashkadarya
Region
Bukhara
Region
Khorezm
Region
Karakalpakstan
Region
4.2 km3
273,000
ha
6.9 km3
452,000
ha
4.2 km3
225,000
ha
4.7 km3
235,000
ha
8.1 km3
460,000 ha
Amudarya River
Figure 9. Irrigated land and water use by regions of Uzbekistan along the Amudarya
River
Source: Statistical Bulletin (2006)
Hydropower generates 27.3% of all electricity in Central Asia (Tajikistan meets
98% its energy needs through hydropower, while Turkmenistan only 1%) (UN SPECA
2004). Tajikistan has nearly 4% of the world’s hydropower potential and is eighth
globally overall in hydropower potential per capita in the world (Schmidt 2008). Due to
constraints coming from the lack of finance, Tajikistan stays rich in untapped

34
hydropower resources. However, Tajikistan is starting to develop hydropower because
of shortages in energy resources. Tajikistan, being located in a water flow formation
area, is keenly interested in developing hydropower and wants to switch its existing
reservoirs to electricity generation (Froebrich et al. 2006).
The Rogun Dam project was designed by Soviet engineers in the 1960s (Figure
10). It consists of a high dam (335 m, 1099 ft), a hydropower generating plant (14.5
TWh/yr), and a large water reservoir (13.3 km3, 3.2 mi
3) (Libert et al. 2008).
Construction started in 1982 and were halted in 1991 because of the Soviet Union break
down and civil war in Tajikistan. Rogun Dam is being built on the Vakhsh River which
starts its flow from south-east of Kyrgyzstan and is fed by Abramov and Fedchenko
glaciers and has a reservoir with length of 524 km (326 mi) and has a catchment zone in
Tajikistan between 31,200 and 39,000 km2 (7,500 and 9,400 mi
2) (Schmidt 2008,
Wegerich et al. 2007).
Figure 10. The Amudarya basin with its main tributaries and the Dams of Rogun, Nurek
and Tuyamuyun Hydroengineering Complex (THC)
Source: Oliver et al. (2008)
▲existing dam
∆ proposed dam

35
The reservoir created by Rogun Dam will occupy 17,100 hectares (42,300 acres)
of land, of which 6,800 (16,800 acres) hectares are agricultural land (Niyazi 2003). The
discharge of Vakhsh River at the site of projected Rogun Dam is about 20 km3/yr (4.8
mi3/yr), which coincides with an average discharge of 635 m
3/sec (22,425 ft³/s) and
hydropower generation of approximately 14.5 TWh/yr (at 335 m height of dam)
(Schmidt 2008). The time of completion of Rogun Dam construction is still not clear,
but it is expected that the dam will accumulate its necessary water volume in 8 to 10
years. The total capacity of the planned hydro investments in Rogun Hydro Power Plant
(RHPP) in Tajikistan is expected to be 3,600 MW (average annual performance 13.1
billion kWh) at a total cost of US$2.2 billion (EDB 2008). The cost of construction is
too high for Tajikistan’s budget, but the government of Tajikistan hopes to attract
investments and loans from international financial organizations and foreign
governments (EDB 2008).
The benefits of Rogun Dam are electricity generation and water supply. Rogun
Dam will supply electricity not only for Tajikistan, but, as estimated, it will export extra
energy to south-east Asian countries. Also, Tajikistan plans to develop new lands and
increase agricultural production, which will require additional water (EDB 2008). The
negative impacts on the reservoir site include flooding of agricultural land and cultural
and historic sites, silting in the reservoir, and socioeconomic impacts surrounding
people resettling (Schmidt et al. 2006). Concerns of Uzbekistan are that much of the
accumulated water will be released from Rogun Reservoir during winter time to
generate electricity, and as a consequence, in summer, water flow will be reduced,
which will have a negative impact on the population, agriculture, and environment in
Uzbekistan (Libert 2008). Wegerich et al. (2007) argues those negative impacts are

36
questionable and concludes that an additional dam would be beneficial for all the
region’s countries and even outside the basin. In contrast, Spoor and Krutov (2003)
mention that Tajikistan, through Nurek Dam, already controls approximately 40% of
Amudarya flow and construction of new Rogun Dam would allow Tajikistan complete
control of water flow to Uzbekistan (ICG 2002). Further development of Tajikistan’s
hydroenergy potential will have negative consequences on downstream countries’
seasonal water allocations (ICG 2002).
The feasibility study, completed by the German construction company
Lahmeyer International, indicates three separate stages in building of Rogun Dam:
Stage I, the dam’s height will be 225 m (738.1 ft) with a total volume of reservoir of
2.78 km3 (0.6 mi
3), a live storage volume of 1.92 km
3 (0.4 mi
3), and a capacity to
produce 1000 MW (this will give energy output of 5.6 TWh/yr); Stage II, the dam’s
height will be increased to 285 m (935 ft) (volume 6.78 and live storage 3.98 km3 (1.6
and 0.9 mi3, respectively); and Stage III, the dam’s height will reach 335 m (1099 ft)
(reservoir volume 13.3 km3, live storage 10.3 km
3 (3.2 and 2.5 mi
3, respectively)
(Schmidt et al. 2006). Wegerich et al. (2007) argues that neither Stage I nor Stage II
would be detrimental for Uzbekistan, but Stage III would threaten Uzbekistan’s
agricultural production.
Nurek Dam is the largest dam on the Vakhsh River and is located 30 km (18 mi)
downstream from the uncompleted Rogun Dam. Lacking data for Rogun Dam,
characteristics of Nurek Dam are assumed to be a reasonable proxy (Table 7). Nurek
Reservoir has a full storage volume of 10.5 km3 and it took 11 years to fill. The filling
rate of Rogun Reservoir will be extrapolated from the filling data of Nurek Reservoir:
lossn
an WV
Q 11
[1]

37
where Qan is the Vakhsh River flow to be stored in Rogun Reservoir during its filling
(km3/yr), Vn is the total storage volume of Nurek Reservoir (km
3), 11 is the time period
required to fill Nurek Reservoir (years), Wloss is the total water loss due to reservoir
bottom and shores saturation and evaporation (given equal to 0.12 km3/yr) (Vuglinsky
1990). Water losses for saturation occur mainly during the reservoir filling stage
(Vuglinsky 1990).
Rogun Reservoir filling period can be estimated from the following equation:
an
rr
Q
VT [2]
where Tr is the time period required to fill Rogun Reservoir (years), Vr is the total
storage volume of Rogun Reservoir (km3).
The last step is estimation of changes in the Amudarya River flow due to water
storing in Rogun Reservoir:
100%Am
an
Q
QX [3]
where %X is the change in flow of the Amudarya River, QAm is the mean annual flow of
the Amudarya River (63 km3/yr) (Table 6).
Rogun Reservoir electricity generation mode
Rogun reservoir has a total volume (13.3 km3), which consists of active storage
(8.6 km3) and dead storage (4.7 km
3) (Table 7). The reservoir active storage is water
stored above the level of the lowest offtake and the active storage is maintained to
generate electricity. Savchenkov et al. (1989) indicates that the discharge regime of the
Vakhsh River water flow varies by season, characterized by an increase of water flow in
spring and reaching the maximum flow level in summer after the winter low flow. This
phenomenon is mainly explained by melting snow and glaciers into the Vakhsh River

38
(Konovalov 2009). Therefore, Rogun Dam is expected to accumulate water in active
storage volume during April to September (summer period) and release water to
generate electricity during the winter period (October-March) of low flow when the
most electricity needed. Taking into account this case, average monthly water flow of
the Vakhsh River when Rogun Reservoir accumulates water in the summer period (or
Rogun Dam flow) can be estimated:
6
6.8 s
s
QVQ [4]
where Qs is the average monthly flow of the Vakhsh River from Rogun Reservoir
during summer period (km3/month), QVs is the total water flow of the Vakhsh River
during the summer period (km3) (Table 6), and 8.6 is the Vakhsh River flow volume
stored in Rogun Reservoir during the 6 month (April to September) (the active water
storage volume of Rogun Reservoir) (km3).
The average monthly water volume of the Vakhsh River flowing to downstream
water users when Rogun Reservoir will release water to generate electricity in the
winter period is quantified as:
6
6.8 w
w
QVQ [5]
where Qw is the average monthly water discharge of the Vakhsh River from Rogun
Reservoir during winter period (km3/month), QVw is the total water flow of the Vakhsh
River during the winter period (km3) (Table 6), and 8.6 is the Vakhsh River flow
volume released from Rogun Reservoir during the 6 month (October to March) (the
active water storage volume of Rogun Reservoir) (km3).
The Vakhsh River contributes 27% of the annual flow of the Amudarya River
(Figure 2) and every change in the Vakhsh River flow volume reflects on the Amudarya

39
River flow. Therefore, changes in the usual flow of the Amudarya River associated with
changes in the Vakhsh River flow during the summer period are estimated:
10080.7
80.7%
sRogun
s
QAX [6]
where %Xs is the change in flow of the Amudarya River in summer period, QAsRogun is
the average water flow of the Amudarya River (with Rogun Dam) during summer
period (km3/month), and 7.80 is the average flow of the Amudarya River (with no
Rogun Dam) during the summer period (km3/month) (Table 6);
QAsRogun is calculated as:
)64.2(80.7 ssRogun QQA [7]
where 7.80 is the average flow of the Amudarya River (with no Rogun Dam) during the
summer period (km3/month) (Table 6) and 2.64 is the average monthly flow of the
Vakhsh River during the summer period (with no Rogun Dam) (km3/month) (Table 6).
Similarly, a change in the historical flow of the Amudarya River associated with
changes in the Vakhsh River flow during the winter period is estimated:
10069.2
69.2%
wRogun
w
QAX [8]
where %Xw is the change in flow of the Amudarya River during the winter period,
QAwRogun is the average water flow of the Amudarya River (with Rogun Dam) during
the winter period (km3/month), and 2.69 is the average flow of the Amudarya River
(with no Rogun Dam) during the winter period (km3/month) (Table 6).
QAwRogun is calculated as:
)58.0(69.2 wwRogun QQA [9]
where QAwRogun is the average water flow of the Amudarya River (with Rogun Dam)
during the winter period (km3/month), 2.69 is the average flow of the Amudarya River

40
(with no Rogun Dam) during the winter period (km3/month) (Table 6), and 0.58 is the
average monthly flow of the Vakhsh River during winter period (with no Rogun Dam)
(km3/month) (Table 6).
Estimation of monetary impacts under “worst case” scenario
To assess monetary impacts of a changed flow volume of the Amudarya River
on Uzbekistan agriculture it is assumed that changed flow volume will impact upstream
and downstream water users in Uzbekistan in different ways. The Uzbekistan
government cannot fully control water distribution from the Amudarya River because of
the lack of water distribution infrastructure and poor water management (Wegerich
2002). Therefore, seasonally reduced flow in the Amudarya River will be unequally
distributed among the upstream and downstream water users. Seemingly, upstream
water users will withdraw the same water volume as they did before and downstream
water users will experience a water shortage. Justification for this assumption is from
2000-2001when Uzbekistan experienced a severe drought which has been called the
“worst in 95 years” (Wegerich 2002). Recent studies show that the water scarcity
during the 2000-2001 drought in Uzbekistan was the worst in the downstream regions
of the Amudarya (Figure 9, p. 33) (Wegerich 2002). Wegerich (2002) concludes “the
phenomenon of unequal water scarcity could be an indication that the causes are not
only natural, but also management and, therefore, institution related.” (Wegerich 2002,
p. 23) A similar opinion was expressed by Kohn who quotes McKinney (2001), “I think
it’s more a function of simple geography: the Karakalpaks are downstream.” (quoted by
Kohn 2001, p.2) (Figure 9, p. 33).
On the basis of the above assumptions, the land area that will not get irrigated is
estimated. Although the exact availability of water in Uzbekistan during the summer

41
period is uncertain, 8.6 km3 of Rogun Reservoir stored volume is assumed as the water
that is needed for irrigation. The assumed volume needed for irrigation (8.6 km3) is
divided by the average water requirement per hectare in Uzbekistan:
l
aW
L6.8
[10]
where La is the estimated land area that does not receive irrigation water in the summer
period (ha), 8.6 is the Vakhsh River flow volume stored in Rogun Reservoir (the active
water storage volume of Rogun Reservoir) (km3), and Wl is the average water
requirements in Uzbekistan agriculture (km3/ha) (given 0.000017 km
3/ha) (Figure 9).
GDP
Monetary value of one hectare of irrigated land consists of two parts. The first
part is income of farmers from particular crop, this can be referred as a direct
agricultural sector income. To estimate the monetary value of one ha of irrigated land
for the agricultural sector, the term of aggregated revenue from one composite hectare
(Hfar) is used. Aggregated revenue of Hfar is a sum of revenue from cotton, wheat, and
vegetables calculated according to each crop share in the composite hectare and equal to
US $566/ha:
Hfar = ($825x0.44)+($400x0.48)+($1,369x0.08) = $566
One composite hectare (100%) consists of cotton (44%), wheat (48%) and vegetables
(8%), which are the main irrigated crops in Uzbekistan (World Bank 2003). The World
Bank (2003) estimates the gross economic income of cotton, wheat, and vegetables as
US $825, $400, and $1,369 per hectare, respectively (Table 9).
The second part of the monetary value of one ha of irrigated land is the
government revenues which are the difference between price of buying cotton and
wheat from farmers and then reselling those crops in the world market by the

42
government. To estimate the monetary value of one hectare of irrigated land for the
government of Uzbekistan, the term of aggregated value of one composite hectare
(Hgov) is used. Aggregated value of Hgov is a sum of world price for cotton and wheat
calculated according to their shares in the composite hectare and equal to US $694/ha:
Hgov = ($1,305x0.48)+($130x0.52) = $694
One composite hectare (100%) in this case consists of cotton (48%) and wheat (52%) as
these are the main irrigated and exported crops in Uzbekistan (World Bank 2003). The
World Bank (2003) projects the world price for cotton and wheat as US $1,305 and
$130 per hectare, respectively (Table 9).
Table 9. Comparison of economic gross margin (irrigated crops)
Cotton Wheat Vegetables
World Price Projected For 2015 (US$/ton) 1,305 130 N/A
Yield (ton/ha) 2.2 2.5 11
Revenues (US$/ha) 825 400 1,369
Costs (US$/ha) 392 283 702
Gross Margin (Before Energy Costs) 433 117 667
Source: Adapted from World Bank (2003)
Using Hfar and Hgov the total value of foregone agricultural production of land
area that will not get irrigated is calculated:
694)92.0(566 aat LLP [11]
where Pt is the total value of foregone agricultural production of land area that will not
get irrigated (US $), La is the land area left without water during the summer irrigation
period in Uzbekistan (ha) [10], 566 is the estimated value of one hectare of irrigated
land for farmers (US $/ha), 694 is the estimated value of one hectare of irrigated land
for the government of Uzbekistan, and 0.92 is the 92% of land which is under cotton
and wheat (minus 8% of land under vegetables). The impact of that lost total value on
GDP (Box 3, p. 29) of Uzbekistan is estimated by:

43
Box 4. Some important economic indicators
Gross Domestic Product (GDP) represents the value of goods
and services produced inside the territory of a country
without income received from abroad, while Gross National
Product (GNP) or Gross National Income (GNI) is the sum of
domestic and foreign incomes of all residents of a country.
Source: Peterson and Lewis (1999)
1009.27
% tc
PGDP [12]
where %GDPc is the change rate in Uzbekistan GDP, and 27.9 is the Uzbekistan GDP
(US $ billions) (Box 3, p. 29).
Change in revenue of Uzbekistan government revenue can be computed by:
100884.8
% tc
PB [13]
where %Bc is the change rate in the revenue portion of Uzbekistan government revenue
and 8.884 is the revenue portion of Uzbekistan’s budget (US $ billions) (Box 3, p. 29).
Employment
The number of people affected by lost revenue from land area left without
irrigation water due to changed water flow can be found through:
815,1
t
p
PN [14]
where Np is the number of people in Uzbekistan affected by Rogun Project and 1,815 is
the Uzbekistan GDP per labor force (Box 3, p. 29) (US$/per capita) (Box 4). The last
four equations ([11], [12], [13], and [14]) describe Rogun Reservoir impact, working in
electricity generation mode, on
Uzbekistan’s economic
situation under the “worst
case” scenario.
Estimation of monetary impacts under “adaptive” scenario
There is a wide range of methods, practices, and techniques that can be applied
by the Uzbekistan government to mitigate results of changed water regime for irrigated
agriculture. These measures should lead to one goal: to maintain the agricultural

44
production of lands under the condition of less water availability through the decreasing
of the present level of water use in agriculture. Two exclusive methods of reducing
water use are proposed: 1) introduction of drip irrigation (Option A) and 2) introduction
of water pricing in agriculture (Option B).
Option A, introduction of drip irrigation, would be considered a “mandatory
technology” that would be required by the government of Uzbekistan in order to reduce
water use. However, the cost of drip irrigation is high, therefore, some part of the cost
would need to be paid by the government and the other part could be financed in the
form of low-interest loans or subsidies. By using drip irrigation, cotton producing farms
in Uzbekistan can save 32% or 9 km3 annually of irrigation water compared with the
presently used furrow irrigation (Ibragimov et al. 2007). Transferring the current
irrigation infrastructure to drip irrigation could be beneficial, taking into account the
result of the mentioned study. However, the cost of drip irrigation is high and varies
between US$1,331 to $1,408 (average US$1,370) per hectare (O’Brien et al. 1998). As
more than 90% of irrigated agricultural lands in Uzbekistan along the Amudarya River
are used to grow cotton, the total cost of transferring to drip irrigation along the
Amudarya River will be:
370,1tdrip AV [15]
where Vdrip is the total cost of introduction of drip irrigation in the regions of Uzbekistan
located along the Amudarya River (US $), At is the total irrigated area of those regions
(ha) (given 1,645 million ha) and 1,370 is the average cost of drip irrigation (US $/ha).
The cost for Uzbekistan to transfer to drip irrigation could be based on the length of
time to fill Rogun Reservoir:
r
drip
andripT
VV [16]

45
Box 5. Water pricing methods
Volumetric pricing – water charged depending on direct
measurement of consumed water
Per unit area pricing – water is charged per unit of irrigated
area. Charge depends on type of irrigated crop, irrigation
method, season of the year, etc.
Output pricing – water is charged on the basis of output
(water users pay a certain water fee for each unit of
produced output)
Input pricing – water is charged by taxing inputs (water
users pay a water rate for each unit of a certain input used)
Tiered pricing – multi-rate volumetric method, where rates
for water vary as the amount of consumed water exceeds
defined threshold limits
Water markets – some developed economies formed water
markets or water rights to determine price for water
Source: Adapted from World Bank (1995)
where Vandrip is the annual cost of introduction of drip irrigation in the regions of
Uzbekistan located along the Amudarya River (US $) and Tr is the time period required
to fill Rogun Reservoir (years) [2].
Option B, water pricing, would be considered an incentive for farmers to use the
best available technology (BAT) which could result in reducing water use and reducing
costs of water. Under Option B, farmers would be free to choose which technology to
implement. Choices may include, but are not limited to, using groundwater resources,
using recycled water, or switching to less water consuming crops (Pimentel et al. 1997).
Other technologies might include subsurface drip irrigation (SDI), precision agriculture,
or growing high value crops such as almond and pistachios (Ayars 2010). Taking into
account that Rogun Dam has not been fully constructed and that it will take certain
years for reservoir filling, Uzbekistan has the advantage of gradually preparing for
future conditions. Pricing of water as a demand management tool is considered less
popular, but the most effective method of increasing efficient water use and decreasing
demand for irrigation water (World Bank 1995). Of the few types of water pricing
methods, including per unit
area pricing, output pricing,
input pricing, tiered pricing,
water markets, and
volumetric pricing,
volumetric pricing is
proposed as the best method
for Uzbekistan (Box 5).

46
Volumetric pricing can be efficient in limiting water use by farmers, however, it also
requires capital investment in construction and maintenance of measurement points,
equipment, concreting channels, and training of people (O’Brien et al. 1998). The
government of Uzbekistan should start with a relatively low water price and increase
the price for water until the desired change in water demand is reached. On the basis of
data and analysis of different countries, in order to cover costs of operation and
maintenance (O&M) of irrigation infrastructure, water price must be $0.003-0.005 per
m3(Perry 2001). In order to substantially influence demand, water price must be higher
($0.02-0.05 per m3) (Perry 2001). Perry (2001) states that water costs need to be enough
to cover O&M costs. Knowing the possible water flow reduction rate during the Rogun
Reservoir filling period and assuming that Uzbekistan will have the same irrigation area
after filling is completed, the future water demand is estimated:
RDwf 2828 [17]
where Dwf is the demand for water in the future (after Rogun Reservoir filled) (km3/yr),
28 is the present water demand (km3/yr), R is the reduction rate (%) (assumption).
Under adaptive management, the area that will not get irrigated is estimated
using future water demand and saved water volume (difference between present and
future water demand). The main assumption is that Uzbekistan will have the same
irrigated land area, GDP, GNI, and budget levels, and employment indicators. Then,
equations [10], [11], [12], [13], and [14] are used to assess the level of impacts of
Rogun Reservoir, working in electricity generation mode, on Uzbekistan under adaptive
management measures.

47
CHAPTER 4. RESULTS AND DISCUSSION
The results and discussion section is divided into four main parts: 1)
identification of potential changes anticipated during Rogun Reservoir filling stage, 2)
identification of potential changes anticipated when Rogun Reservoir is full and
working in electricity generation mode, 3) assessment of those changes under the
“worst case” scenario, and 4) assessment of those changes under adaptive management
measures, “adaptive” scenario.
Rogun Reservoir filling stage
Using equation [1] and [2], the Vakhsh River annual water flow volume needed
to fill Rogun Reservoir and time period required for fill Rogun Reservoir, respectively,
is estimated:
yrkmyrkmyears
kmQan /07.1/12.0
11
5.10 333
[1]
and
yearsyrkm
kmTr 4.12
/07.1
3.133
3
[2]
Rogun Reservoir will be filled within 12.4 years with the Vakhsh River average annual
water flow volume of 1.07 km3/ yr. Next, changes in annual flow volume of the
Amudarya River due to presence of Rogun Reservoir are estimated:
%7.1100/63
/07.1%
3
3
yrkm
yrkmX [3]
Thus, during 12.4 years of filling, Rogun Reservoir will use approximately 2% of the
Amudarya River annual discharge. Taking into account that the annual discharge of the
Amudarya River can vary between 47 and 108 km3 (11 and 26 mi
3) (Spoor and Krutov
2003), a 1.7% decrease is neglected in this study. In average, flow of the Amudarya

48
River is 5.25 km3/month (
month
yrkm
12
/63 3
). With a decrease of 1.7%/yr, flow of the river
will decline to an average 5.17 km3/month. However, a reduction in flow to 5.17
km3/month would not appear to present a threat to Uzbekistan as the total remote-
sensed precipitation feeding the Amudarya River also shows a trend to decrease (Figure
12A) and this trend is more evident in the gauge-measured precipitation (Figure 12B).
Therefore, the reduction of the flow volume of the Amudarya River during the
predicted filling period of Rogun Reservoir, 12.4 years, should not noticeably impact
Uzbekistan.
Figure 11. Interannual variations of the discharge of the Amudarya River derived from
precipitation integrated over its catchment area. (A) satellite-measured (GPCP)
precipitation (km3/month); (B) gauge-measured (GPCC) precipitation (km
3/month).
Dashed line is a moving average of about 1 year period.
Source: Nezlin et al. (2004)

49
Rogun Reservoir full operation mode
After Rogun Reservoir is filled, Rogun Hydropower Plant (RHPP) will
accumulate the necessary water during the summer period, the most abundant flow time
of the Vakhsh River and generate electricity in winter period. The discharge from
RHPP during summer and winter periods is, respectively:
monthkmkmkm
Qs /21.16
6.884.15 3
33
[4]
and:
monthkmkmkm
Qw /02.26
6.85.3 333
[5]
Therefore, when RHPP starts working in full capacity the average monthly flow of
Rogun Reservoir to downstream will be 1.21 and 2.02 km3 per month in summer and
winter periods, respectively.
To estimate changes in the Amudarya River flow associated with the changed
flow level in the Vakhsh River in respective periods, the average monthly flow of the
Amudarya River should be found in summer (QAsRogun) and winter (QAwRogun) periods
with Rogun Dam in is place, respectively:
monthkmmonthkmmonthkmmonthkmQAsRogun /37.6)/21.1/64.2(/80.7 3333
[7]
and:
monthkmmonthkmmonthkmmonthkmQAwRogun /13.4)/02.2/58.0(/69.2 3333
[9]
Thus, average monthly flow of the Amudarya River, if Rogun Dam is placed on the
Vakhsh River, will be 6.37 km3/month in the summer period, and 4.13km
3/month in the

50
winter period. Changes in the Amudarya River flow due to the presence of Rogun Dam
are estimated as
summer:
%18100/80.7
/80.7/37.6%
3
33
monthkm
monthkmmonthkmX [6]
winter:
%54100/69.2
/69.2/13.4%
3
33
monthkm
monthkmmonthkmX [8]
The estimated of RHPP operating in full electricity generation mode will yield a
decrease of the Amudarya River annual discharge to downstream Uzbekistan in the
summer irrigation period by 18% and an increase of the discharge in the winter time by
54% (Figure 12). These computed data shows that: 1) during the irrigation period from
April to September Uzbekistan will have less water, and 2) in the rest of the year, from
September to April, Uzbekistan may experience water abundance, which may lead to
flooding.
Figure 12. The Amudarya River hydrograph with and without Rogun Dam
Note: Data used in this figure was extrapolated from Table 6 (p. 29) and results of
equations [7] and [9]
0
2
4
6
8
10
12
14
Jan Feb Mar Apr May Jun Jul Aug Sep Oct Nov Dec
Flo
w v
olu
me
in k
m3
Month
No Rogun
With Rogun

51
Estimation of monetary impacts under “worst case” scenario
Estimation of monetary impacts on the economy of Uzbekistan will be
estimated. For these purposes equations [10], [11], [12], [13] and [14] are used. First,
land area which will not get irrigated is estimated:
hahakm
kmLa 000,506
/000017.0
6.83
3
[10]
Uzbekistan may have to withdraw 506,000 ha from agricultural production, which
constitutes about 11% of the country’s irrigated agricultural land area (4,640 thousands
ha, FAO, 2007).
Due to the withdrawal of 506,000 ha, the total lost revenue is estimated to be:
880,466,609$)694$)(92.0(000,506)566$(000,506 USUShaUShaPt [11]
and the subsequent impact on the Uzbekistan GDP will be:
%2.21009.27$
610$%
billionUS
millionUSGDPc [12]
So, the loss of US$610 million of economic income in agriculture and
government revenues would result in a decrease of the country’s total GDP by
approximately 2.2%/yr. Moreover, this US$610 million will reduce the revenues
portion of the budget by
%9.6100884.8$
610$%
billionUS
millionUSBc
. [13]
Regarding the demography which will be impacted,
jobslaborUS
millionUSN p 000,336
/815,1$
610$ [14]
More than 336,000 people will be directly affected by the water shortage in the regions
of Uzbekistan located along the Amudarya River.

52
The main industries of the Uzbekistan economy are textile production, food
processing, machine building, metallurgy, gold mining, petroleum mining, natural gas
mining, and chemical production (CIA 2009). Upon first consideration, all industries
(with the exception of gold mining) will more than likely be impacted by crop reduction
due to withdrawn land. However, the biggest affected industries will be textile
production and food processing. To a lesser degree decline might be observed in
machine building (agricultural direction), metallurgy (for machine building), petroleum
and chemicals production.
Estimation of monetary impacts under “adaptive” scenario
The adaptive scenario uses measures of adaptive management, which may be
applied by Uzbekistan to mitigate the potential negative impacts of the Rogun Dam.
Option A. Transferring of irrigation system to drip irrigation method. Along the
Amudarya River in Uzbekistan there is 1,645,000 ha of irrigated land. Total cost of
transferring to drip irrigation in the regions of Uzbekistan located along the Amudarya
River is estimated:
Vdrip = 1,645,000 ha x US$1,370/ha = $2,253,650,000 [15]
And the annual cost of installing drip irrigation is
yrUSyears
USVandrip /000,000,182$
4.12
000,650,253,2$
.
[16]
The cost of drip irrigation is high, but less than the lost revenue due to Rogun Dam’s
presence (US $609 million/yr). Moreover, introduction of drip irrigation can save 9 km3
water annually, which is important over time (drip irrigation saves up to 32% of
irrigation water compared with present furrow irrigation) (Ibragimov et al. 2007).
Although the annual cost of transferring to drip irrigation is expensive (US$182 million
in each of 12.4 years), the option seems more appealing than the loss of US$609 million

53
annually after Rogun Dam is constructed. The author suggests that this case needs more
detailed calculations and a cost-benefit analysis, as it might be more beneficial to spend
US $182 million annually during 12.4 years and as a result save water, increase crop
yield, or maintain and strengthen national security than to lose US $609 million
annually plus have additional unemployment, decrease in GDP, and be dependent on
Tajikistan for water resources after Rogun Dam is in full operation.
Option B. Using price for demand management. For the purpose of this
estimation, Uzbekistan will have the same area of irrigated land after 12.4 years of
Rogun Reservoir filling. Also, an assumption is made that over 12.4 years of Rogun
Reservoir filling that Uzbekistan could be able to reduce water use by 15% (about 1%
annually), which will result in an average annual water use decline from 17,000 to
14,600 m3/ha (Table 10). The future water demand is estimated using the possible water
flow reduction rate during the Rogun Reservoir filling period:
yrkmyrkmyrkmDwf /8.2315.0/28/28 333 [17]
Table 10. Possible reduction of Uzbekistan water use during Rogun Dam filling
years water use (m3/ha ) reduction (%)
1 17,000 1.2
2 16,800 1.2
3 16,600 1.2
4 16,400 1.2
5 16,200 1.2
6 16,000 1.3
7 15,800 1.3
8 15,600 1.3
9 15,400 1.3
10 15,200 1.3
11 15,000 1.3
12 14,800 1.4
13 14,600
Total reduction after 12 years 2,400 15.2

54
With water pricing, the estimated amount of water that will be saved is:
(1,645,000 ha x 0.000017 km3/ha) - (1,645,000 ha x 0.000014 km
3/ha) = 4.2km
3
Next, equations [10], [11], [12], [13] and [14] are utilized and the assumption
that all variables which were used in calculations of the “worst case” scenario impacts
stay the same for the adaptive management scenario is made, with exception of water
use per hectare.
hahakm
kmkmLa 000,314
/000014.0
2.46.83
33
. [10]
Uzbekistan will have to withdraw only 314,000 ha from irrigated agricultural
production, which will constitute about 7% of the country’s irrigated agricultural land
area (4,640 thousands ha, FAO, 2007). The future total lost revenue computed as:
720,206,378$)694$)(92.0(000,314)566$(000,314 USUShaUShaPt [11]
Impact on the Uzbekistan GDP:
%4.11009.27$
378$%
billionUS
millionUSGDPc
. [12]
The loss of US$378 million of economic income from agriculture will result in
decreasing the country’s total GDP by 1.4% each year. This US$378 million will reduce
the revenues part of the budget by 4.3%:
%3.4100884.8$
378$%
billionUS
millionUSBc
. [13]
Regarding the demography, calculations show that 415,000 people will be directly
impacted by the water shortage in the regions of Uzbekistan located along the
Amudarya River:
jobslaborUS
millionUSN p 000,208
/815,1$
378$
.
[14]

55
Regarding Uzbekistan industries impacted by the adaptive management scenario
an assumption is made that almost thirteen years will likely be enough time to gradually
cancel or diversify such industries as textile production, food processing, machine
building, metallurgy, gold mining, petroleum mining, natural gas mining, and chemical
production. Finally, if Uzbekistan undertakes adaptive management measures and tries
to reduce water use in agriculture, the economic impacts of Rogun Dam will be much
less than under the “worst case” scenario. Theoretically, a 15% reduction in Uzbekistan
agricultural water consumption will result in an average 40% reduction of negative
impacts (Table 11).
Table 11. Comparison of impacts under two outcomes
Type of impact Outcome
Worst case Adaptive management
Option B (Water pricing)
Land area reduced (ha) 506,000 314,000
Lost revenue
(US$ million)
610 378
Decline in GDP by (%) 2.2 1.4
Decline in budget revenue by (%) 6.9 4.3
Jobs affected (thousands) 336 208
Water shortage (km3/yr) 8.6 4.4
Results obtained in the Table 11 show that if Uzbekistan would be able to
introduce adaptive management (Option B) the land area in Uzbekistan which will not
be irrigated would be reduced by 1.6 times. In the worst case scenario, Uzbekistan loses
31% of irrigated lands along the Amudarya River (1,645,000 ha) and thus using
adaptive management is strongly recommended. The difference between revenue lost in
the worst case and adaptive scenarios is estimated as US$232 million which is reduction
of 38%. A reduction rate (36%) is observed in GDP and revenues portion of budget.
The most important measure of adaptive management could decrease water application
from 17,000 m3 per hectare to almost 14,000 m
3 per hectare, which might be one of the

56
main achievements of Uzbekistan’s agriculture and can be viewed as the next step to
further reduce water use in agriculture.
Table 11 does not have results of introduction of drip irrigation described in
adaptive management Option A scenario because that case needs a more careful and
detailed study. Although drip irrigation is extensively used for fruits and vegetables,
drip irrigation is still limitedly used in cotton production (Ibragimov et al. 2007). In
addition, the government of Uzbekistan should have a strong desire to change the
mentality of people who have always used water in unlimited quantities and for free,
encourage farmers to install drip irrigation, and help finance transfer to drip irrigation
before Rogun Dam is completed and the filling stage has started.

57
CHAPTER 5. SUMMARY AND POLICY IMPLICATIONS
Water is a limited and important resource. It is crucial for economic and social
development, and is fundamental for sustainable development. Water is scarce in the
region of Central Asia, which is an arid region where its most fertile areas are former
deserts made arable through irrigation. This is especially true for Uzbekistan. The
country has the largest irrigation area and largest population among the central Asian
states. Furthermore, Uzbekistan is largely dependent on water supplied from the two
biggest rivers of Central Asia: the Amudarya and the Syrdarya. These rivers originate in
the neighboring countries of Tajikistan and Kyrgyzstan, respectively. Recently,
Tajikistan resumed construction of Rogun Dam on the Vakhsh River, tributary to the
Amudarya River, without investigating future downstream impacts and without having
consent from neighboring states.
Potential economic and employment impacts affecting neighboring Uzbekistan
from the Rogun Dam project were investigated in this thesis. Being the highest dam in
the world (335 m, 1099 ft) when completed and working in electricity generation mode,
Rogun Dam will change the annual flow regime of the Amudarya River and as result
will reduce by almost one-fifth the Amudarya River flow during the summer period.
During this period, downstream Uzbekistan will need water for its irrigated agricultural
crops, namely cotton and wheat. Uzbekistan has almost 2 million hectares of irrigated
land along the Amudarya River and the reduction of water to irrigate those lands during
summer months would impact the entire country’s economy.
Through the comparison of present (ex ante) and future (ex post) conditions of
water supply for agriculture and economic indicators of Uzbekistan, the following
conclusions can be made:

58
1. The filling stage of Rogun Reservoir with a duration of 12.4 years will not
have a substantial impact on Uzbekistan agriculture as Rogun Reservoir
will capture 1.7% of mean annual discharge of the Amudarya River, and
2. The main impact will be seen when Rogun Reservoir will start working in
full operation mode and will change annual flow regime of the Amudarya
River, accumulating necessary water volume in the summer period and
releasing water in the winter period. This case is in opposition of
Uzbekistan’s need where agricultural producers will then experience a
water shortage during the crop growing period.
Taking into consideration that the main impact will be observed after Rogun
Dam is filled and when RHPP will start working in electricity generation mode, two
outcomes were defined: worst case (business-as-usual) and adaptive case (adaptive
management scenario). The scope of impacts under each scenario was estimated and
possible policy implications described.
Worst case
The worst case scenario implies that Uzbekistan will continue to maintain its
present practice of water use, i.e., do business as usual. This case is considered a no-win
option for the Uzbekistan economy because in this case the country will have to
withdraw the equivalent of 506,000 ha of land from agricultural production, which
means 336,000 people may lose their jobs and will be forced to relocate to less
desirable positions or migrate to seek jobs in other countries. Also, production of cotton
and wheat will decline, and such spheres of industrial production as textiles, food
processing, machine building, metallurgy, petroleum, and chemicals will be impacted
59
by a decrease in agricultural production. As a result, Uzbekistan’s GDP will decrease by
2.2% and government revenues by 6.9%.
Adaptive case
This scenario assumes that Uzbekistan will undertake Option B in agricultural
water use, particularly in irrigation practices, by introducing water pricing and thus
adjusting irrigation requirements to fit the future seasonal water reduction. This
scenario will give Uzbekistan a chance to reduce water consumption in agriculture by
15% over 12 years of Rogun Reservoir filling so the country will not be impacted as
much as in the “worst case.” This option also can increase water use efficiency in
irrigated agriculture of Uzbekistan. Generally, a 15% reduction of water use can
decrease negative impacts on average by 40%, meaning Uzbekistan will have to
withdraw 314,000 ha of irrigated land, and find jobs for 208,000 people; the country’s
GDP will decline by 1.4%, and the revenue portion of the budget by 4.3%. Although
this case has negative results too, this scenario seems more desirable considering
current Uzbekistan conditions.
Policy implications
Each country has a right to implement policy which would be most beneficial
for the population of that country and would reflect trends of economic development of
that country. Irrespective of the position of Uzbekistan as a riparian country, Tajikistan
will finish construction of Rogun Dam. In this context, the government of Uzbekistan
should, as soon as possible, focus future development strategies on changing water use
practices in agriculture by introducing water pricing and applying other advanced
irrigation practices rather than furrow irrigation which is commonly used in the country.
The revenue that is expected from water pricing should be strictly controlled and spent

60
for the implementation of changes in water resources management, education and
training of mid- and lower management personnel in the regions. Consequently, all
undertaken measures must lead to reducing the negative impact of water use reduction
in irrigated agriculture.
Another solution might be a scenario in which Tajikistan will share with
Uzbekistan revenue from power generated from Rogun Reservoir. The basis for this
action might be the “Agreement on Cooperation in Joint Management, Use and
Protection of Interstate Sources of Water Resources” of 1992 where riparian states
agreed to continue water allocation practices developed during the Soviet period.
However, the 1992 Agreement does not address energy supply to upstream states.
Therefore, Uzbekistan and Tajikistan could reach an additional agreement and
determine Uzbekistan loses due to the presence of Rogun Dam and on this
determination agree to how much Tajikistan compensates Uzbekistan for loss of
agricultural opportunities during a respective time period. Thus, if Tajikistan shares its
revenues from Rogun Reservoir, Uzbekistan could be able to transfer to advanced
agricultural practices easier and sooner. This scenario might be a win-win case for
Tajikistan and for Uzbekistan as well. However, this case needs strong political desire
from the governments of both countries and this desire is currently not present.
One of the findings of this study was that the Amudarya River will have a 54%
increase in flow discharge in the winter period which potentially may lead to flood
events downstream. Therefore, for the next study, assessment of impacts of Rogun Dam
during the winter period downstream of the Amudarya River is suggested. The
proposed future study and this study could constitute useful information for use by

61
policy-makers to determine possible changes in the Amudarya River basin after Rogun
Dam is constructed.

62
REFERENCES CITED
Abdullaev, I., C. .D. Fraiture, M. Giordano, M. Yakubov, and A. Rasulov. 2009.
“Agricultural water use and trade in Uzbekistan: situation and potential impacts
of market liberalization.” International Journal of Water Resources
Development 25(1):47-63.
Ayars, J. E. 2010. “Adapting irrigated agriculture to drought in the San Joaquin Valley
of California.” P. 19 In: Symp. Proceedings of the International Drought
Symposium, Water Science and Policy Center University of California,
Riverside, Riverside Marriott Hotel, March 24-26.
Badenkov, Y. 1990. “Sustainable development of the mountain regions of the USSR.
The realities, the role of science, and research orientations.” Mountain Research
and Development 10:129-139.
Bloch, P. C. 2002. Agrarian Reform in Uzbekistan and other Central Asian Countries.
Working Paper #49. An Institute for research and education on social structure,
rural institutions, resource use, and development, University of Wisconsin-
Madison.
Blueyurt Central Asia, 2010. Available at
http://kocicka.files.wordpress.com/2008/09/central_asia_map_19991.gif,
accessed in Jan-12-2010.
Bobajanov, I. and J.P.A. Lamers. 2005. “Optimization of water allocation and the
potential of alternative crops when dealing with water deficits: option analysis
for Khorezm region, Uzbekistan.” In: Conf. Proceedings of the Problems of
Implementation and Transition Toward Market Economy Conditions in Water
Resource Management and Land Melioration Sector in Uzbekistan, Tashkent
Institute of Irrigation and Melioration (TIIM) and SANIIRI Scientific-
Production Association, Tashkent, November 16-18.
Cai, X., D. McKinney, and M. Rosegrant. 2003. “Sustainability analysis for irrigation
water management in the Aral Sea region.” Agricultural Systems 76:1043-1066.

63
Canter, L.W. 1977. “Prediction and Assessment of Impacts on the Socioeconomic
Environment.” In: Environmental Impact Assessment. Canter L. W. McGraw-
Hill, New York, p.163-172.
Canter, L.W., J. Atkinson, L. Leistritz. 1985. “Impact of Growth. A Guide for Socio-
Economic Impact Assessment and Planning”, Lewis Publishers, Chelsea,
Michigan.
CAREWIB, Central Asia Regional Water Information Base Project. 2010. Available at
http://www.cawater-info.net/amudarya/demand_e.htm, accessed Aug-12-2009.
CIA, 2009. The World Factbook. “Uzbekistan”. Available at
https://www.cia.gov/library/publications/the-world-factbook/geos/uz.html,
accessed Jan-22-2010.
Daly, J. 2009. “Central Asia’s Energy Chessboard”. Available at
http://www.scribd.com/doc/18690872/Central-Asias-Energy-Chessboard,
accessed Aug-25-2009.
Dorcey, T., A. Steiner, M. Acreman and B. Orlando, eds. 1997. “Large dams. Learning
from the past, looking at the future.” In: Proceedings of IUCN-The World
Conservation Union and World Bank Workshop, 11-12 April 1997, Gland,
Switzerland.
EDB. 2008. “Water and Energy Resources in Central Asia: Utilization and
Development Issues.” Available at
http://www.eabr.org/media/img/eng/research-and-
publications/AnalyticalReports/Report_2_water_and_energy_EDB.pdf,
accessed Jun-28-2009.
Egre, D. and P. Senecal. 2003. “Social impact assessment of large dams throughout the
world: lessons learned over two decades.” Impact Assessment and Project
Appraisal 21(3):215-224.
Elhance, P. A. 1997. “Conflict and cooperation over water in the Aral Sea basin.”
Studies in Conflict & Terrorism 20:207-218.
FAO. Aquastat Database. 1997. “Uzbekistan.” Available at
http://www.fao.org/ag/agl/aglw/aquastat/countries/uzbekistan/index.stm,
accessed Dec-22-2009.

64
Froebrich, J., O. Olsson, and M. Bauer. 2006. “Improved dam operation in the Amu
Darya river basin including transboundary aspects.” In: Dams and Reservoirs,
Societies and Environment in the 21st Century – Berga et al (eds), 2006 Taylor
& Francis Group, London.
Gemma, M. 2003. “Water management and agricultural development in Central Asia:
Case of Uzbekistan.” Paper presented in International Farm Management
Association 14th Congress, Perth, Western Australia, August 10-15, 2003.
Available at http://ageconsearch.umn.edu/bitstream/24393/1/cp03ge01.pdf,
accessed Nov-18-2009.
Glantz, M. H. 2005. “Water, climate, and development issues in the Amu Darya basin.”
Mitigation and Adaptation Strategies for Global change 10:23-50.
Goodland, R. 1997. “Environmental sustainability in the hydro industry.” In: “Large
dams. Learning from the past, looking at the future.” ed. Dorcey T., A. Steiner,
M. Acreman and B. Orlando. Proceedings of IUCN-The World Conservation
Union and World Bank Workshop, 11-12 April 1997, Gland, Switzerland.
Hartman, W. B. 2007. “Central Asia’s raging waters: the prospects of water conflict in
Central Asia.” MA Thesis. Available at http://www.dtic.mil/cgi-
bin/GetTRDoc?AD=ADA467385&Location=U2&doc=GetTRDoc.pdf,
accessed Jan-31-2010.
Ibragimov, N., S.R.Evett, Y. Esanbekov, B.S.Kamilov, L.Mirzaev, and J.P.A.Lamers.
2007. “Water use efficiency of irrigated cotton in Uzbekistan under drip and
furrow irrigation.” Agricultural Water Management 90:112-120.
ICG. 2002. “Central Asia: Water and Conflict”, Report # 34. Available at
http://www.reliefweb.int/library/documents/2002/icg-uzb-30may.pdf, accessed
Aug-16-2009.
Ikramov R. K., 2000. “The modern condition of water management and amelioration of
irrigated lands in the Republic of Uzbekistan. Main arrangement for
improvement.” UDK 631.6 (in Russian).
IWMI. 1999. “Water brief 1. Water scarcity in the Twenty-First Century.” by D.
Seckler, D. Molden, and R. Barker. Available at
http://pdf.usaid.gov/pdf_docs/PNACH595.pdf, accessed Jan-12-2010.

65
Jackson, S. and A. Sleigh. 2001. “The political economy and socio-economic impact of
China’s Three Gorges Dam.” Asian Studies review 25(1): 57-72.
Kharin, N. 2002. “Vegetation Degradation in Central Asia under the Impact of Human
Activities.” Available at
http://books.google.com/books?id=jRfTAOWwH1MC&printsec=frontcover&d
q=Vegetation+Degradation+in+Central+Asia+under+the+Impact+of+Human+
Activities&source=bl&ots=YxsKZmvWD9&sig=wsPT_EVLw9y250USrpZwq
KdzRZ4&hl=en&ei=6SDXS8S3I4OANpXL1YsG&sa=X&oi=book_result&ct=
result&resnum=1&ved=0CBYQ6AEwAA#v=onepage&q&f=false, accessed
Jan-14-2010.
Kohn, D. 2001. “Man-Made Drought Wreaks Havoc in Karakalpakstan.” Available at
Eurasianet.org, February 26, 2001, accessed Jun-16-2009.
Konovalov, V. 2009. “Extreme and average glacier runoff in the Amudarya River
Basin.” Available at http://www.springerlink.com/content/m530128021147308,
accessed Aug-15-2010.
Lange, K. 2001. “Energy and Environmental Security in Central Asia: the Syr Darya.”
Center for Strategic and International Studies (CSIS). Available
http://www.csis.org/ruseura/cs010220lange.htm, accessed Sep-25-2009.
Libert, B., E. Orolbaev, and Y. Steklov. 2008. “Water and Energy Crisis in Central
Asia.” China and Eurasia Forum Quarterly 6(3):9-20.
McKinney, D. 2003. “Cooperative Management of Transboundary Water Resources in
Central Asia.” In: The Tracks of Tamerlane – Central Asia’s Path into 21st
Century, D. Burghart and T. Sabonis-Helf (eds.), National Defense University
press. 2004.
Micklin, P. 1993. “The shrinking Aral Sea.” Geotimes 38(4):14-18
Morimoto R. and C. Hope. 2004. “Applying a cost-benefit analysis model to the Three
Gorges project in China.” Impact Assessment and Project Appraisal 22(3):205-
220.
Mount Holyoke. 2010. Available at www.mtholyoke.edu/~mirobins/econ212/Ch29.ppt,
accessed in Apr-15-10.

66
Nezlin, N. P., A. G. Kostianoy, S. A. Lebedev. 2004. “Interannual variations of the
discharge of Amu Darya and Syr Darya estimated from global atmospheric
precipitation.” Journal of Marine Systems 47:67-75.
Niyazi, A. 2003. “Tajikistan: Its Hydropower Resources and the Problems of Their
Use.” Central Asia and the Caucasus 4(22):15-22.
O’Brien, D. M., D. H. Rogers, F. R. Lamm, and G. A. Clark. 1998. “An Economic
Comparison of Subsurface Drip and Center Pivot Sprinkler Irrigation Systems.”
Applied Enginering in Agriculture 14(4):391-398 .
O’Hara, S. L. 2000. “Central Asia’a Water Resources: Contemporary and Future
Management Issues.” Water Resources Development 16(3):423-441.
Oliver, O., M. Bauer, M. Ikramova, and J. Froebrich. 2008. “The role of the Amu Darya
dams and reservoirs in future water supply in the Amu Darya basin.” In J.Qi and
K. T. Evered (eds.). Environmental Problems of Central Asia and their
Economic, Social and Security Impacts. 277-292.
Oxford Analytica, Global Strategic Analysis. 1997. Available at
http://www.oxan.com/SubscriptionServices/DailyBrief, accessed in Oct-16-
2009.
Perry C. J. 2001. “Charging for Irrigation Water: The Issues and Options, with a Case
Study from Iran.” International Water Management Institute Research Report
52. Available
http://books.google.com/books?id=pyI7sNzxUZMC&printsec=frontcover&dq=
Charging+for+Irrigation+Water:+The+Issues+and+Options,+with+a+Case+Stu
dy+from+Iran&source=bl&ots=oh2tVofU_u&sig=gXWN3AH8uyKJx6aGaefY
NsFp-
Mo&hl=en&ei=SCPXS5iVEZjWMMeYkdwF&sa=X&oi=book_result&ct=resu
lt&resnum=1&ved=0CBEQ6AEwAA#v=onepage&q&f=false, accessed Mar-
15-2010.
Peterson, J. and Lewis M. 1999. “The Elgar companion to feminist economics.”
Available at
http://books.google.com/books?id=4BxSnNQIYx4C&dq=Gross+Domestic+Pro
duct&lr=&source=gbs_navlinks_s, accessed in Apr-10-2010.

67
Pimentel, D., J. Houser, E. Preiss, O. White, H. Fang, L. Mesnick, T. Barsky, S.
Tariche, J.Schreck and Sharon Alpert. 1997. “Water Resources: Agriculture, the
Environment, and Society.” BioScience. 47(2):97-106.
Qaseem Naimi, M. 2005. “Conflict prevention and the politics of Central Asia water
cooperation from the point of view of Afghanistan.” Paper presentation at
Workshop: University of Peace, Central Asia Program, Regional water
resources and peace building. Almaty, 23-27/04/2005.
Renner, M. 1996. “Fighting for survival: environmental decline, social conflict, and the
new age of insecurity.” Available
http://books.google.com/books?id=VYRzg4xaGk0C&printsec=frontcover&dq=
Fighting+for+survival:+environmental+decline,+social+conflict,+and+the+new
+age+of+insecurity&source=bl&ots=q-kGn7LA75&sig=fT77Dp13eegaIXCu-
5JxzboDag4&hl=en&ei=lSPXS5TKFpK-
NuuWpMUF&sa=X&oi=book_result&ct=result&resnum=1&ved=0CBgQ6AE
wAA#v=onepage&q&f=false, accessed Jan-14-2010.
Roll, G., N. Alexeeva, N. Aladin, V. Sokolov, T. Sarsembekov, P.P. Micklin, and I.
Plotnikov. 2003. “Aral Sea”, Lake Basin Management Initiative Experience
and Lessons Learned Report. Available at
http://www.worldlakes.org/uploads/aralsea_30sep04.pdf, accessed Jan-31-
2010.
Savchenkov, N.G., L.G. Osadchii, A.I. Kolesnichenko, S.M. Dokuchaev, and E.I.
Dubinchik. 1989. “Damming the Vakhsh River channel at the site of the Rogun
Hydroelectric station.” Translated from Gidrotekhnicheskoe Stroitel’stvo 9:17-
19.
Schlűter M., A. G. Savitsky, D. C. McKinney, and H. Lieth. 2005. “Optimizing long-
term water allocation in the Amudarya River delta: a water management model
for ecological impact assessment”. Environmental Modelling and Software
20:529-545.
Schmidt, R. 2008. “Onwards and upwards”. Water Power Magazine. Available at
http://www.waterpowernagazine.com/story.asp?storyCode=2049809, accessed
Jun-28-2009.

68
Schmidt R., S. Zambaga-Schulz, and M. Seibitz. 2006. “Bankable Feasibility Study for
Rogun HEP Stage I construction completion in Tajikistan”. In: Berga L., J. M.
Buil, E. Bofill, J. C. De Cea, J. A. Garcia Perez, G. Maňueco, J. Polimon, A.
Soriano, J. Yagűe (Eds.), Dams and Reservoirs, Societies and Environment in
the 21st Century. Taylor & Francis, London available at
http://books.google.com/books?hl=en&lr=&id=6XzSYK9vNXQC&oi=fnd&pg
=PA405&dq=impact+%22Rogun%22&ots=pixcWvYSJK&sig=6yESqeT7NHq
gIpGv_t2WJL4UTsk accessed on Jul-29-2009.
Sherman, S.S. and V.A. Rafikov. 1991. “Sedimentation of the Nurek Reservoir.”
Translated from Gidrotekhnicheskoe Stroitel’stvo 10:59-62.
SIC ICWC, Scientific-Information Center of the Interstate Commission for Water
Coordination in Central Asia. 2010. available at http://www.cawater-
info.net/aral/water_e.htm accessed in 02/15/2010.
Sievers, E. W. 2002. “Water. Conflict, and regional security in Central Asia”. Conflict
and Water in Central Asia Macro V5:356-402.
Smith D. R. 1995. “Environmental security and shared water resources in post-Soviet
Central Asia”. Post Soviet Geography 36(6):351-370.
Spoor M. and A. Krutov. 2003. “The “Power of Water” in a Divided Central Asia”.
Perspectives on Global Development and Technology 2(3-4):593-614.
Statistical Bulletin. 2006. Environmental situation and utilization of natural resources in
Uzbekistan. Facts and figures 2000-2004. available at www.statistics.uz
accessed Jan-11-2010.
Stone, R. 2010. “Severe drought puts spotlight on Chinese Dams”. Science 327
(5971):1311.
The Rogunskaya Hydro Power Station. Performance Characteristics. Open Joint Stock
Holding Company “Barki Tojik” available at
http://www.tjus.org/Copy%20of%20Rogynskaya%20GES%20_English%20vers
ion1.pdf accessed Sep-25-2009.

69
Tullos D., T. Bryan, C. R. Liermann. 2009. “Introduction to the special issue:
Understanding and linking the biophysical, socioeconomic and geopolitical
effects of dams.” Journal of Environmental Management 90:S203-S207.
Uitto J. I. and A. M. Duda. 2002 “Management of transboundary water resources:
lessons from international cooperation for conflict prevention”. The
Geographical Journal 168:365-378.
UN. 2007(a). “Central Asia: Background Paper on Climate Change”. Human
Development Report 2007/2008, Human Development Report Office
Occasional Paper available http://hdr.undp.org/en/reports/global/hdr2007-
2008/papers/Perelet_Renat.pdf accessed in Aug-2-2009.
UN. 2007(b). “Water critical resource for Uzbekistan’ future”, Publication in support of
the Millennium Development Goals Goals 7: Ensure environmental
sustainability United Nations Development Program, Tashkent.
UN SPECA. 2004. “Diagnostic Report on Water Resources in Central Asia”, available
http://www.unece.org/speca/pdf/wer/effuse_e.pdf accessed Aug-4-2009.
UNECE. 2007. “Our waters: Joining hands across borders. First Assessment of
Transboundary Rivers, Lakes and Groundwaters”, available at
http://www.unece.org/env/water/ accessed Dec-25-2009.
UNESCO. 2000. “France Water related vision for the Aral Sea basin for the year 2025”,
Division of Water Science. UNESCO, Paris.
UNICEF Uzbekistan statistics available at
http://www.unicef.org/infobycountry/uzbekistan_statistics.html accessed Jan-
22-2010.
Vuglinsky V. S. 1990. The effect of large mountain and Piedmont reservoirs on the
water resources of USSR rivers. Hydrology in Mountainous Regions.II-Artificial
Reservoirs; Water and Slopes. Proceedings of two Lousanne Symposia, August
1990.
Ward F. A. and A. Michelsen. 2002. “The economic value of water in agriculture:
concepts and policy applications”. Water Policy 4:423-446.
Warner J. 2004. “Mind the GAP – Working with Buzan: the Ilisu Dam as a security
Issue”, SOAS Water Issue Study Group, School of Oriental and African Studies
/ King’s College – London, Occasional Paper 67.

70
Ways of Water Conservation (results of works on WUFMAS Sub-project of
WARMAR-2 Project (TACIS) and Sub-component A-2 of GEF Project “The
Aral Sea basin water resources and environment management”), SIC
ICWC/IWMI publication, Tashkent 2002.
Wegerich K. 2002. “Natural drought or human made water scarcity in Uzbekistan?”
Central Asia and Caucasus, 2(14) available at
http://preventionweb.net/files/1776_VL102309.pdf accessed Mar-18-10.
Wegerich K. 2004. “Coping with disintegration of a river-basin management system:
multi-dimensional issues in Central Asia”. Water Policy 6:335-344.
Wegerich, K., O. Olsson, and J. Froebrich. 2007. “Reliving the past in a changed
environment: Hydropower ambitions, opportunities and constraints in
Tajikistan”. Energy Policy 35:3815-3825.
Wegerich K. 2008. “Hydro-hegemony in the Amu Darya basin”. Water Policy 10(52):
71-88.
Wolf A. 1997. “International Water Conflict Resolution: Lessons from Comparative
Analysis”. Water Resources Development 13: 333-365.
World Bank. 1995. “Efficiency and Equity Considerations in Pricing and Allocating
Irrigation Water”. Policy Research Working Paper 1460.
World Bank. 1996. “Fundamental provision of water management strategy in the Aral
Sea Basin”. Report.
World Bank. 2003. “Irrigation in Central Asia. Social, economic and ecological
aspects” (in Russian) available at www.worldbank.or/eca/environment accessed
Jan-11-2010.
World Bank. 2004. Central Asia, Regional electricity export potential study, appendix
volume.
World Bank. 2009. Key Development Data & Statistics available at
http://web.worldbank.org/WBSITE/EXTERNAL/DATASTATISTICS/0,,conten
tMDK:20535285~menuPK:1192694~pagePK:64133150~piPK:64133175~theSi
tePK:239419,00.html accessed Jan-24-10.
World Commission on Dams. 2000. “Dams and Development: a New Framework for
Decision-Making, Earthscan, London.”