Image spectroscopy and stable isotopes elucidate functional dissimilarity between native and...
13
Image spectroscopy and stable isotopes elucidate functional dissimilarity between native and nonnative plant species in the aquatic environment Maria J. Santos, Erin L. Hestir, Shruti Khanna and Susan L. Ustin Center for Spatial Technologies and Remote Sensing (CSTARS), Department of Land, Air and Water Resources, University of California, One Shields Avenue, The Barn, Davis, CA 95616, USA Author for correspondence: Maria J. Santos Tel: +1 530 7520621 Email: [email protected] Received: 5 August 2011 Accepted: 3 October 2011 New Phytologist (2012) 193: 683–695 doi: 10.1111/j.1469-8137.2011.03955.x Key words: early detection, Egeria densa, hyperspectral remote sensing, imaging spectroscopy, Myriophyllum spicatum native, nonnative, submersed aquatic plants (SAP). Summary • Nonnative species may change ecosystem functionality at the expense of native species. Here, we examine the similarity of functional traits of native and nonnative submersed aquatic plants (SAP) in an aquatic ecosystem. • We used field and airborne imaging spectroscopy and isotope ratios of SAP species in the Sacramento–San Joaquin Delta, California (USA) to assess species identification, chlorophyll (Chl) concentration, and differences in photosynthetic efficiency. • Spectral separability between species occurs primarily in the visible and near-infrared spec- tral regions, which is associated with morphological and physiological differences. Nonnatives had significantly higher Chl, carotene, and anthocyanin concentrations than natives and had significantly higher photochemical reflectance index (PRI) and d 13 C values. • Results show nonnative SAPs are functionally dissimilar to native SAPs, having wider leaf blades and greater leaf area, dense and evenly distributed vertical canopies, and higher pig- ment concentrations. Results suggest that nonnatives also use a facultative C 4 -like photo- synthetic pathway, allowing efficient photosynthesis in high-light and low-light environments. Differences in plant functionality indicate that nonnative SAPs have a competitive advantage over native SAPs as a result of growth form and greater light-use efficiency that promotes growth under different light conditions, traits affecting system-wide species distributions and community composition. Introduction Rapid environmental changes may cause plant functional traits to become mismatched with current environmental conditions. Current species distributions reflect both present ecological sort- ing and past selective pressures, and range expansion or survival in new geographic locations are dependent upon traits that are preadapted to the new environment. These preadaptations are likely to have competitive and evolutionary advantages, such as those observed in nonnative species with unconstrained growth and that become invasive (Mack et al., 2007) and replace native species. What is uncertain is whether the presence of nonnative species retains or changes the functionality of the previous eco- system to the disadvantage of native species. In this paper we examine to what extent the functional traits of native and non- native submersed aquatic plants (SAPs) are similar in an aquatic ecosystem. One system where environmental conditions markedly con- strain plant community functionality is the submersed aquatic ecosystem (Sculthorpe, 1965). Plant functional traits can be mea- sured at metabolic, physiological and morphological levels. Functional metabolic traits include photosynthetic pathways, the substrates used for photosynthesis, and the ability to respond to varying light intensities. SAPs have constraints on photosynthesis that are imposed by carbon availability and light in the water column (Dennison et al., 1993). To cope with the low-CO 2 envi- ronment in the water column, most SAPs have a carbon concen- tration mechanism (CCM; Maberly & Madsen, 2002) that allows them to store carbon for photosynthesis, either from CO 2 or HCO 3 substrates (Van et al., 1976; Sand-Jensen, 1983). The main photosynthetic pathways for SAPs are C 3 , often coupled with CCMs (Maberly & Madsen, 2002), and many use other photosynthetic pathways, including C 4 , CAM (Crassulean acid metabolism), and C 3 –C 4 intermediates (Keeley, 1999; Ueno, 2001; Bowes et al., 2002; Keeley & Rundel, 2003). Most SAPs are restricted by light partitioning in the water column, with excess light at the surface and low light in deeper water (Dennison et al., 1993). Some SAPs are known to switch from C 3 photosyn- thesis in the light-limited environment at depth to a C 4 -like photosynthesis and also in the high-light environment of the surface (Ueno, 2001). This facultative C 4 -like metabolism includes some of the properties of the C 4 metabolic pathway, such Research ȑ 2011 The Authors New Phytologist ȑ 2011 New Phytologist Trust New Phytologist (2012) 193: 683–695 683 www.newphytologist.com
-
Upload
independent -
Category
Documents
-
view
2 -
download
0
Transcript of Image spectroscopy and stable isotopes elucidate functional dissimilarity between native and...

Image spectroscopy and stable isotopes elucidate functionaldissimilarity between native and nonnative plant species in theaquatic environment
Maria J. Santos, Erin L. Hestir, Shruti Khanna and Susan L. Ustin
Center for Spatial Technologies and Remote Sensing (CSTARS), Department of Land, Air and Water Resources, University of California, One Shields Avenue, The Barn, Davis, CA 95616, USA
Author for correspondence:Maria J. SantosTel: +1 530 7520621
Email: [email protected]
Received: 5 August 2011
Accepted: 3 October 2011
New Phytologist (2012) 193: 683–695doi: 10.1111/j.1469-8137.2011.03955.x
Key words: early detection, Egeria densa,hyperspectral remote sensing, imagingspectroscopy, Myriophyllum spicatum
native, nonnative, submersed aquatic plants(SAP).
Summary
• Nonnative species may change ecosystem functionality at the expense of native species.
Here, we examine the similarity of functional traits of native and nonnative submersed aquatic
plants (SAP) in an aquatic ecosystem.
• We used field and airborne imaging spectroscopy and isotope ratios of SAP species in the
Sacramento–San Joaquin Delta, California (USA) to assess species identification, chlorophyll
(Chl) concentration, and differences in photosynthetic efficiency.
• Spectral separability between species occurs primarily in the visible and near-infrared spec-
tral regions, which is associated with morphological and physiological differences. Nonnatives
had significantly higher Chl, carotene, and anthocyanin concentrations than natives and had
significantly higher photochemical reflectance index (PRI) and d13C values.
• Results show nonnative SAPs are functionally dissimilar to native SAPs, having wider leaf
blades and greater leaf area, dense and evenly distributed vertical canopies, and higher pig-
ment concentrations. Results suggest that nonnatives also use a facultative C4-like photo-
synthetic pathway, allowing efficient photosynthesis in high-light and low-light environments.
Differences in plant functionality indicate that nonnative SAPs have a competitive advantage
over native SAPs as a result of growth form and greater light-use efficiency that promotes
growth under different light conditions, traits affecting system-wide species distributions and
community composition.
Introduction
Rapid environmental changes may cause plant functional traits tobecome mismatched with current environmental conditions.Current species distributions reflect both present ecological sort-ing and past selective pressures, and range expansion or survivalin new geographic locations are dependent upon traits that arepreadapted to the new environment. These preadaptations arelikely to have competitive and evolutionary advantages, such asthose observed in nonnative species with unconstrained growthand that become invasive (Mack et al., 2007) and replace nativespecies. What is uncertain is whether the presence of nonnativespecies retains or changes the functionality of the previous eco-system to the disadvantage of native species. In this paper weexamine to what extent the functional traits of native and non-native submersed aquatic plants (SAPs) are similar in an aquaticecosystem.
One system where environmental conditions markedly con-strain plant community functionality is the submersed aquaticecosystem (Sculthorpe, 1965). Plant functional traits can be mea-sured at metabolic, physiological and morphological levels.
Functional metabolic traits include photosynthetic pathways, thesubstrates used for photosynthesis, and the ability to respond tovarying light intensities. SAPs have constraints on photosynthesisthat are imposed by carbon availability and light in the watercolumn (Dennison et al., 1993). To cope with the low-CO2 envi-ronment in the water column, most SAPs have a carbon concen-tration mechanism (CCM; Maberly & Madsen, 2002) that allowsthem to store carbon for photosynthesis, either from CO2 orHCO3 substrates (Van et al., 1976; Sand-Jensen, 1983). Themain photosynthetic pathways for SAPs are C3, often coupledwith CCMs (Maberly & Madsen, 2002), and many use otherphotosynthetic pathways, including C4, CAM (Crassulean acidmetabolism), and C3–C4 intermediates (Keeley, 1999; Ueno,2001; Bowes et al., 2002; Keeley & Rundel, 2003). Most SAPsare restricted by light partitioning in the water column, withexcess light at the surface and low light in deeper water (Dennisonet al., 1993). Some SAPs are known to switch from C3 photosyn-thesis in the light-limited environment at depth to a C4-likephotosynthesis and also in the high-light environment of thesurface (Ueno, 2001). This facultative C4-like metabolismincludes some of the properties of the C4 metabolic pathway, such
Research
� 2011 The Authors
New Phytologist � 2011 New Phytologist Trust
New Phytologist (2012) 193: 683–695 683www.newphytologist.com

as fixation of CO2 by phosphoenolpyruvate into malic acid(Ueno, 2001), and no activation of the xanthophyll cycle(Penuelas et al., 1993, 1997). C4-like metabolism (Keeley, 1999;Keeley & Rundel, 2003) has been demonstrated for some SAPspecies, including Hydrilla verticillata (Salvucci & Bowes, 1981),Myriophyllum spicatum (Van et al., 1976), Egeria densa (Casatiet al., 2000), and potentially Cabomba caroliniana (Salvucci &Bowes, 1981).
Functional physiological traits include the distribution,arrangement and composition of plant biochemical compounds(nutrients, pigments, Chl, etc.), and how these building blocksare combined to overcome environmental limitations such assubmergence, high light, salinity, or temperature. Functionalmorphological traits include plant organs (leaves, stems, roots)and traits such as leaf : root ratios, morphology (entire anddissected leaves, fine and tap roots, etc.), and architecture(three-dimensional distributions of leaves and stems, leaf angledistribution, ratio of leaves to stem, leaf to root, etc.). At the leaflevel, morphological and physiological traits of SAP leaves areoften similar to shade adaptations (Mommer et al., 2005), andtheir typically spherical leaf angle distributions allow them toabsorb diffuse light from all directions. There are three maintypes of leaves in submersed plants: blade-shaped leaves (strap-shaped, elongated or ribbon-like, which are associated with lenticand lotic environments); dissected leaves (deeply cut or subdividedleaves); and whorled leaves (three or more blades at each node),which are associated with lentic environments (Luther, 1947;Sculthorpe, 1965). The metabolic, biochemical, and morpho-logical plasticity and diversity of SAPs make them particularlywell adapted to varying environmental conditions, and thereforehave high potential to spread into new habitats. The functionalityof ecosystem processes can be affected by changes in plant com-munity composition depending on whether nonnative speciesreplace or change the functions that native species performed.
While remote sensing is effective at monitoring invaded plantcommunities over large spatial extents (Lehmann & Lachavanne,1997; Elmore et al., 2003; Kerr & Ostrovsky, 2003; Cohen &Goward, 2004; Coppin et al., 2004; Asner & Vitousek, 2005;Bradley & Mustard, 2006), imaging spectroscopy is well estab-lished for remote detection of plant biochemistry, photosyntheticefficiency, and leaf morphology and canopy structure (Ustin &Curtiss, 1990; Penuelas et al., 1993; Jacquemoud et al., 1994;Gamon et al., 1997; Zhang et al., 1997; Asner, 1998; Kokaly,2001; Ollinger & Smith, 2005). Imaging spectroscopy (alsocalled hyperspectral remote sensing) measures hundreds of contigu-ous narrow bands spanning the solar reflective spectrum from400 to 2500 nm. The result is a nearly continuous spectrummeasured in each pixel that provide the information needed todetect SAPs in the water column (Zhang et al., 1997; Under-wood et al., 2006; Hestir et al., 2008), despite interactions withthe water column itself (Holden & LeDrew, 2001; Han, 2002;Bostater et al., 2003; Hall et al., 2004), which obscures the char-acteristic SAP spectral patterns. When plant species are spectrallydistinct (Fyfe, 2003), imaging spectroscopy is a likely method formapping SAPs down to species level (Ustin et al., 2009). Imagingspectrometers capture spectral differences resulting from species
morphological (leaf and canopy), biochemical (pigment concen-tration) and metabolic (photosynthesis) traits. When the analysisframework includes additional biophysical information, such asstable isotope data (Farquhar et al., 1989; Raven et al., 2002;Carvalho et al., 2009), the combination provides multiple linesof evidence to compare and contrast functionality across species.
We applied this combined approach to the SAP species thatco-occur in the Sacramento–San Joaquin River Delta (henceforthreferred to as the Delta) in California, USA. The Delta is one ofthe major gateways for nonnative aquatic species in the UnitedStates (Cohen & Carlton, 1995, 1998). In the last 30 yr theaquatic plant community has dramatically changed: the numberof species has increased (Atwater et al., 1979; Cohen & Carlton,1998; Bossard et al., 2000; Light et al., 2005; Santos et al.,2009), with the plant community composition now c. 50% non-native plant species (Fig. 1; Santos et al., 2009). The assemblage
Fig. 1 Submersed aquatic plant species co-occurring in the Sacramento–San Joaquin River Delta. The top four species are natives and the bottomfour species are nonnatives. Egeria densa and Myriophyllum spicatum areinvasive. Note the difference in the leaf structure among the differentspecies: wide leaves include Potamogeton nodosus, E. densa, andPotamogeton crispus; fine leaves include Elodea canadensis, Stuckenia
pectinata, and Myriophyllum spicatum; and whorled leaves includeCeratophyllum demersum and Cabomba caroliniana.
684 Research
NewPhytologist
� 2011 The Authors
New Phytologist � 2011 New Phytologist Trust
New Phytologist (2012) 193: 683–695
www.newphytologist.com

today includes five native and four nonnative SAPs (Table 1). Allnonnative species in the Delta have both the C3 pathway and afacultative C4-like metabolism (Van et al., 1976; Salvucci &Bowes, 1981; Casati et al., 2000), as does the native Elodeacanadensis (Nichols & Shaw, 1986). Varied types of leaf morpho-logies are found in the Delta SAP assemblage. All nonnativespecies have wider and longer leaves than native SAP and distinctgrowth forms, with blade-like and dissected leaves evenlydistributed along the stem length through the water column(Sculthorpe, 1965).
Materials and Methods
Study area
Located in central California (38�19¢N, 121�36¢W), the Delta isformed from the confluence of the Sacramento and the San Joa-quin Rivers, and drains into San Francisco Bay (CA, USA). Itswetlands were reclaimed in the early 20th century for agriculturethrough construction of nonnatural islands, hydrologicallyconnected through a reticulate network of earthen levees andchannels. To avoid saline intrusion of tidal waters, counter-circuit pumping of freshwater occurs system-wide to force fresh-water to extraction pumps. This creates a relatively stable aquaticenvironment for drinking water and agriculture and conditionsideal for growth of SAP (Cohen & Carlton, 1995; Jassby &Cloern, 2000; Lucas et al., 2002).
Airborne imaging spectroscopy
We used airborne HyMap imaging spectroscopy data acquired inJune 2007 by HyVista, Inc. (Sydney, NSW, Australia) at a nomi-nal spatial resolution of 3 m. HyMap is delivered as radiometri-cally and geometrically corrected image measurements in 126spectral bands in the range 400–2400 nm with a bandwidth of15 nm in the visible-near-infrared (VIS-NIR) and 15–20 nm inthe shortwave-infrared (SWIR, 1500–2500 nm) domain.
Field measurements
Over 2000 SAP patches distributed over the 2100 km2 of Deltachannels were visited concurrent with acquisition of imaging
spectroscopy data. For each site we documented species composi-tion, species percentage cover, and patch dimensions. SAPsfrequently co-occur in the study area at scales smaller than theground pixel size of 9 m2 (Santos et al., 2011). Therefore, toensure that each pixel spectrum represents a single species ratherthan a mixture, we chose patches with > 60% area occupied by asingle species, which resulted in 1151 field samples. No purepatches were found for E. canadensis and Stuckenia filiformis, andthese species were excluded from subsequent analysis. Spectra ofpure patches of each of the SAP species and of turbid and clearwater (assessed with a Secchi disk) were extracted using STAR-SPAN (Rueda et al., 2005; http://code.google.com/p/starspan/)for all bands for each of the 1151 field samples, one pixel persample.
Handheld spectrometer measurements
Ten specimens of each SAP species were collected in the field andgrown in aquatic tanks in a glasshouse for handheld spectrometermeasurements (Table 1). An ASD Field Spec Pro FR (ASD Inc.Boulder, CO, USA) spectrometer with a 0.45 rad instantaneousfield-of-view (IFOV; 0.01 m diameter) was used to collect 30reflectance measurements of monospecific dense canopy mats foreach SAP species at 20 cm above the plant surface in full intensitymidday (11:00–13:00 h) sunlight. To correct for backgroundand water influence in the spectral signature, we collected 30measurements of tank water and 30 of tap water. Because thephenological stages of the submersed species were different, thePotamogeton nodosus sample was in advanced senescence whenthe other species were ready for measurement, and consequently,it was excluded from the glasshouse study. This species is unusual,as it acts as an emergent dominant with most of its canopy at thewater surface rather than within the water column (Santos et al.,2011), making it functionally more similar to emergent aquaticspecies like water hyacinth (Eichhornia crassipes), and dissimilar toother SAP species.
We used the Spectral Analysis and Management System(SAMS; http://sams.casil.ucdavis.edu/) software to extract reflec-tance for all spectrometer bands, and screened the data to excludebands at wavelengths < 420 nm and > 1200 nm because ofnoise. We resampled the glasshouse spectrometer data to thewavelength resolution of the airborne sensor to facilitate
Table 1 Submersed aquatic plant (SAP) species occurring in the Sacramento–San Joaquin River Delta, CA, USA
Family Scientific names Common names Code Roots Leaf Statusa
Hydrocharitaceae Egeria densa Brazilian waterweed EGDE Yes Entire, wide blade NonnativeHydrocharitaceae Elodea canadensis Waterweed ELCA Yes Entire, narrow blade NativeCeratophyllaceae Ceratophyllum demersum Coontail CEDE No Dissected, whorl NativePotamogetonaceae Stuckenia pectinata Sago pondweed STPE Yes Entire, no blade NativePotamogetonaceae Stuckenia filiformis Broadleaf sago pondweed STFI Yes Entire, no blade NativePotamogetonaceae Potamogeton nodosus American pondweed PONO Yes Entire, floating blade NativePotamogetonaceae Potamogeton crispus Curlyleaf pondweed POCR Yes Entire, wide blade NonnativeHaloragaceae Myriophyllum spicatum Eurasian watermilfoil MYSP Yes Dissected, whorl NonnativeCabombaceae Cabomba caroliniana Carolina fanwort CACA Yes Dissected, whorl Nonnative
aRefers to its current status in the Delta and not to its invasibility potential.
NewPhytologist Research 685
� 2011 The Authors
New Phytologist � 2011 New Phytologist Trust
New Phytologist (2012) 193: 683–695
www.newphytologist.com

comparison using a standard Gaussian resampling model with15 nm band spacing in ENVI 4.4 (ITT, Boulder, CO, USA).
Mapping SAPs, species differences and separability analysis
We used hierarchical Boolean classification schemes (decisiontrees), utilizing several spectral analysis methods (Giardino &Zilioli, 2001; Holden & LeDrew, 2001; Han, 2002) at differentnodes to identify SAP communities. Spectral methods includedthe Spectral Mixture Analysis (Ustin et al., 1993; Roberts et al.,1997, 1998; Elmore et al., 2000; Dennison et al., 2004; Luet al., 2004) and Spectral Angle Mapper (Kruse et al., 1993;Dennison et al., 2004) coupled with reflectance thresholds forspecific bands, vegetation red-edge detection – which describesthe long-wavelength edge of the Chl absorption, from low reflec-tance near the maximum absorption to high reflectance at a wave-length where Chl does not absorb energy (Han & Rundquist,1997; Han, 2002; Bostater et al., 2003) – and the absorption fea-ture of Chla at 680 nm (Han & Rundquist, 1997; Han, 2002).This resulted in a map of SAP throughout the Delta, with a clas-sification accuracy of 80% (for details on the classificationmethod see Hestir et al., 2008).
We then investigated whether there were significant spectraldifferences between the SAP species in glasshouse spectrometerdata and the airborne imaging spectrometer. We used the spectracollected in the glasshouse and, from the imagery, we collectedspectra of ‘pure’ SAP end members (> 90% pixel cover of eachindividual SAP species) based on locations of each species fromfield measurements. We used ANOVA at each band and princi-pal component analysis (PCA) of all bands to test whether specieswere separable (Jongman et al., 1995). ANOVA identifies whichspecies are most different and which bands are most important toassess these differences. PCA identifies whether the spectral infor-mation locates each SAP species in different regions of the hyper-ellipsoid created in the data space, and the loadings of the PCAaxis indicate the contribution of each of the spectral bands to thefinal result.
We used discriminant function analysis (DFA) (Im et al.,2008) to predict species identity using both resampled glasshousespectra and airborne data. Species identity and native status wereused as the categories, and reflectance spectra were used as covari-ates. The class discrimination quality was assessed as correctclassification rates for the available field data points: for the nativevs nonnative classification, the species conditional correct classifi-cation rates, and the overall rate. Where DFA supported highseparability of the species, we applied its function to a subset ofimaging spectroscopy data to create a map of the distribution ofeach SAP species where there was high co-occurrence of nativeand nonnative species after masking the area previously classifiedas SAP (Hestir et al., 2008).
Pigment concentration
Species differences in Chl concentration often manifest them-selves as low reflectance at 440, 480, 650 and 680 nm wave-lengths. Unfortunately, utilizing these bands in a radiative
transfer model, such as PROSPECT (Jacquemoud & Baret,1990; Jacquemoud, 1993; Feret et al., 2008), would not result inusable Chl concentration estimates, because of the extremely lowreflectance of submerged plants at these wavelengths (J.B. Feret,pers. comm.). Therefore, the interspecies differences in Chl, car-otenes and anthocyanin concentrations were tested indirectlyusing the three band indexes described in Gitelson et al. (2006),using the spectrometer reflectance data (not resampled to HyMapwavelengths and bandwidths). For Chl the best approximationusing the green reflectance (550 nm) is estimated as:
Chlorophyllgreen ¼ ðq760�800=q550Þ � 1 Eqn 1
whereq is the reflectance at the specified wavelengths. We trun-cated the near infrared (NIR) to be between 760 and 800 nm tomatch the optimizations described in Gitelson et al. (2006). Wealso estimated Chl concentration using the red edge, using thefollowing equation:
Chlorophyllred edge ¼ ðq760�800=q690�725Þ � 1 Eqn 2
For carotenes, we followed the same procedures as for Chl,estimating carotene concentration with both the green- and red-edge reflectance values, using the following equations:
Carotenegreen ¼ ððq510�520Þ�1 � ðq560�570Þ
�1Þ � q760�800
Eqn 3
Carotenered edge ¼ ððq510�520Þ�1 � ðq690�710Þ
�1Þ � q760�800
Eqn 4
Finally, we estimated anthocyanin concentration using thefollowing equation:
Anthocyanin ¼ ððq530�570Þ�1 � ðq690�710Þ
�1Þ � q760�800
Eqn 5
We tested whether Chl, carotene and anthocyanin concen-trations were significantly different between species and betweennative and nonnative species using ANOVA and Tukey’s hon-estly significant difference tests (Zar, 1999).
Photosynthetic efficiency
Photosynthesis is limited in high-light environments to avoiddamage to the photosynthetic reaction center (Grace et al.,2007). During high-light periods, plants are able to activate thexanthophyll cycle to divert excess energy. This cycle consists oftwo states: at high light de-epoxidation allows conversion ofviolaxanthin to zeaxanthin via antheraxanthin; when light inten-sities are reduced, epoxidation reverts zeaxanthin to violaxanthin,via the same intermediary products (Grace et al., 2007). Thismechanism is not activated in plants using the C4 pathway,allowing them to maximize photosynthesis in high-light environ-ments (Keeley & Rundel, 2003). In the context of SAPs within atidal system such as the Delta, having a heterogeneous metabolic
686 Research
NewPhytologist
� 2011 The Authors
New Phytologist � 2011 New Phytologist Trust
New Phytologist (2012) 193: 683–695
www.newphytologist.com

functionality for high-light environments (e.g. regular exposureto surface light at low tide) and low-light environments (e.g.regular submersion at high tide in turbid water) would increasefitness. For each species we computed the photochemicalreflectance index (PRI; Gamon et al., 1997), which represents ameasure of light-use efficiency, and changes in metabolicpathways (Grace et al., 2007). Gamon et al. (1992) showed thatPRI values were correlated with the epoxidation state of thexanthophyll cycle in sunflower. PRI is a normalized ratio betweenreflectance at 531 and 570 nm (Gamon et al., 1997) given by:
PRI ¼ ðq531 � q570Þ=ðq531 þ q710Þ Eqn 6
Negative values of larger magnitudes indicate activation of thedefense mechanism – photosynthetic inhibition at high-lightconditions – while less negative or positive values indicate photo-synthesis in high-light conditions (Grace et al., 2007). We usedthe nonresampled ASD reflectance to test whether PRI valueswere significantly different between species and between nativeand nonnative species using ANOVA and Tukey’s honestly sig-nificant difference tests (Zar, 1999).
In addition, 10 samples of each of the SAP species to estimatethe values of d13C as a measure of internal carbon concentrationwere analyzed by the UC Davis stable isotope facility (for detailson their standard protocols, see http://stableisotopefacility.ucdavis.edu/13cand15n.html). Several confounding factors, how-ever, can affect the measurements of d13C for aquatic plants, suchas the degree to which atmospheric CO2 is in equilibrium withthe water mass, input of CO2 from the decomposition of 13C-depleted terrestrial detritus in the water, contribution from thedissolution of 13C-enriched carbonate rock, and seasonal rates ofphotosynthesis and respiration (Boutton, 1991). The Deltawaters are slightly depleted in d13C (Cloern et al., 2002) com-pared with terrestrial environments, so the d13C values areexpected to be slightly lower to reflect this depletion. The proto-col we used is based on the d13C of CO2 in the atmosphere.Aquatic plants use two sources of carbon for photosynthesis,uptake of carbonic anhydrase-mediated HCO3 or CO2, but theresulting d13C signal from either source is likely indistinguishable(Riebesell & Wolf-Gladrow, 1995). All submerged aquatic plantsin this study have a CCM, but only a few have a C4-like photo-synthetic pathway (Maberly & Madsen, 2002). Thus, we expectthat if there are differences between species in the d13C value,and other factors cannot account for them, these would likely bea result of the photosynthetic pathway (Bowes et al., 2002). Plantspecies that undergo C4-like photosynthesis are likely to have lessnegative values of d13C because they discriminate less against 13Cfrom the photosynthetic substrate as a result of the bicarbonatefixed by phosphoenolpyruvate carboxylation (PEPC) rather thancarbon dioxide fixed by Rubisco (Farquhar et al., 1989). For C4
photosynthesis, d13C values c. )30& are expected (Farquharet al., 1989). However, differences in the range of d13C valuesare expected for the aquatic environment, where values from )3to )50& have been observed for aquatic plants (Farquhar et al.,1989; Boutton, 1991; Cloern et al., 2002; Raven et al., 2002).
To assess the consistency between the remote sensing estimates(PRI) and the stable isotopes data, we regressed the estimatedPRI values against the d13C values, using the coefficient of deter-mination (R2) to evaluate how well the two metrics are relatedand an F-test to assess model fit.
Results
Species differences and separability analysis
Submersed aquatic species had significantly different reflectancein certain regions of the electromagnetic spectrum (P < 0.0001;Fig. 2; Table 2) that allowed their identification (PCA and DFA;Fig. 3; Table 3). Both the glasshouse spectrometer data and theairborne imaging spectroscopy data discriminated betweennatives and nonnatives with 80% certainty, and the individualspecies’ correct classification rate amounted to 60% (Fig. 4;Supporting Information, Tables S1–S4).
The univariate analysis revealed that the species are most sepa-rable in the visible (400–700 nm) spectral region (Table 2), asindicated by both PCA axis 2 (Fig. 3) and the discriminant func-tions (Table 3). Native and nonnative species have differentreflectance spectra in the visible region (Fig. 2), with the excep-tion of the invasive M. spicatum. The only SAP species with non-submersed leaves, P. nodosus, is spectrally distinct from all othersubmersed species (Fig. 2).
The HyMap remote sensing data also separate well the naturalcanopies of native and nonnative species (Fig. 3; Table S3).Many species are rather distinct, including most native speciessuch as C. demersum and P. nodosus; however, nonnative specieswere the most frequently confounded, especially M. spicatum,Potamogeton crispus and E. densa (Table S2). These three specieshave distinct spectral signatures (Fig. 2), when acquired with ahandheld spectrometer. However, these differences are nearlyentirely lost in the airborne spectra (Fig. 2; Tables S1, S2). Fig. 4represents a section of the Delta where most species co-occur andwhere we applied the discriminant function to the airborne data.It shows a robust discrimination between native (green) and non-native (orange-red) species at the pixel level (Fig. 4b; Table S4).
Pigment concentration
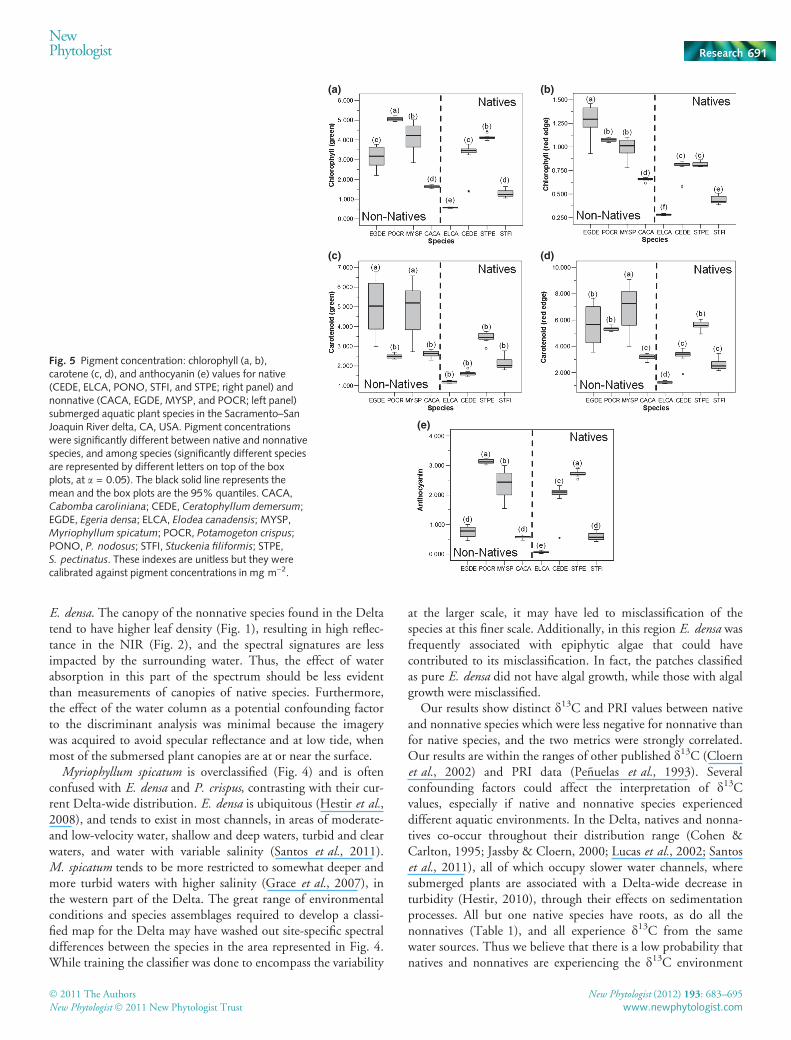
Nonnatives had significantly higher concentrations of Chl(Chlgreen: F = 24.82, df = 104, P < 0.0001; Chlred edge:F = 84.24, df = 104, P < 0.0001), carotenes (carotenesgreen:F = 71.74, df = 104, P < 0.0001; carotenesred edge: F = 60.61,df = 104, P < 0.0001) and anthocyanin (F = 6.91, df = 104,P = 0.009) when compared with native species (Fig. 5). At thespecies level there were also significant differences (Chlgreen:F = 123.69, df = 104, P < 0.0001; Chlred edge: F = 188.49, df =104, P < 0.0001; carotenesgreen: F = 55.17, df = 104,
P < 0.0001; carotenesred edge: F = 58.01, df = 104, P < 0.0001;anthocyanin: F = 138.14, df = 104, P = 0.009), but similar pig-ment concentrations grouped native and nonnative species(significantly different groups as letters on top of the box plots inFig. 5).
NewPhytologist Research 687
� 2011 The Authors
New Phytologist � 2011 New Phytologist Trust
New Phytologist (2012) 193: 683–695
www.newphytologist.com

Photosynthetic efficiency
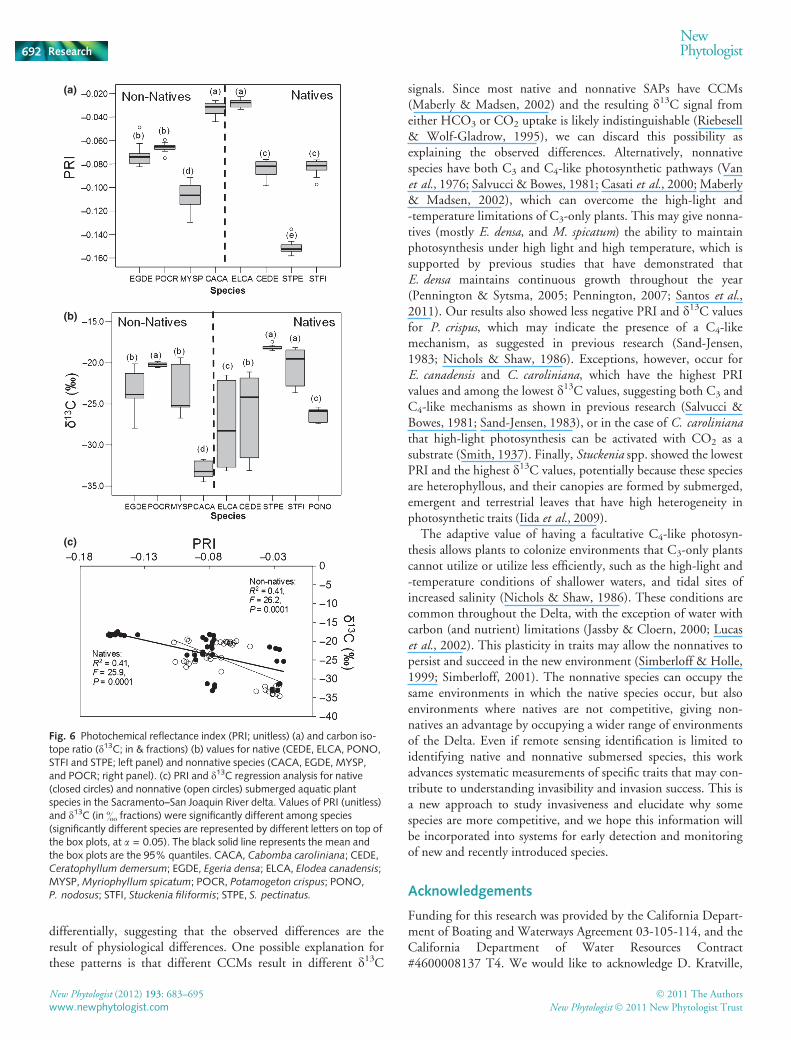
We found significant differences in PRI values between species(F = 281.64, df = 104, P < 0.0001) but not between native andnonnative status (F = 0.34, df = 104, P = 0.56) with the ASDreflectance data (Fig. 6a). Significantly the highest PRI values(less negative) were observed for E. canadensis and C. caroliniana,followed by P. crispus and E. densa, then by S. filliformis,C. demersum and M. spicatum, and the lowest PRI values (morenegative) were for S. pectinata.
Stable isotope results were consistent with those of PRI, espe-cially for the nonnatives E. densa, M. spicatum, P. crispus, andthe native C. demersum. Nonnative species showed significantly
less negative d13C values than the natives (F = 27.52, df = 89,P < 0.0001), with the exception of the nonnative C. caroliniana(the most negative) and the native Stuckenia spp. (the least neg-ative; Fig. 6b). C. demersum and E. canadensis showed the great-est range of variation in isotope ratio. We were unable tocompare isotope ratios and PRI for P. nodosus because samplesfor this species were unavailable at the time of measurement.PRI and d13C values were strongly related for both native andnonnative species (Fig. 6c). Regression analysis coefficient ofdetermination (R2) was 0.41 for both native and nonnatives,and the model was significantly fitted to the data (natives:F = 25.9, P = 0.0001; nonnatives: F = 26.2, P = 0.0001;Fig. 6c).
Fig. 2 Average spectral signature for each of the nativeand nonnative species, and water with the handheldspectrometer (ASD) and the airborne sensor (HyMap).Handheld spectrometer measurements were resampled tothe airborne sensor spectral bands. For some species onlyone measurement was possible. Reflectance is measuredin %.
688 Research
NewPhytologist
� 2011 The Authors
New Phytologist � 2011 New Phytologist Trust
New Phytologist (2012) 193: 683–695
www.newphytologist.com

Discussion
Our results show that morphological differences in plant struc-ture and biochemistry allow spectral differentiation betweennatives and nonnatives. While many previous studies succeededin discriminating terrestrial species (Cochrane, 2000; Lewis,2000; Fyfe, 2003; Andrew & Ustin, 2006; Hutto et al., 2006;Atkinson et al., 2007), the aquatic environment presents a muchgreater challenge to spectral differentiation (Marshall & Lee,1994; Hestir et al., 2008). So far, only a few submerged aquaticspecies have been successfully differentiated (Williams et al.,2003; Dogan et al., 2009). This differentiation challenge resultsfrom linear and nonlinear mixing with water, as well as the prop-erties of the water column itself (Williams et al., 2003; Hestiret al., 2008; Dogan et al., 2009). Our data collection wasdesigned to reduce the known challenges of optical remote sens-ing over aquatic systems, which include meteorological and illu-mination variability, in-water radiance, and water-leavingradiance (Giardino & Zilioli, 2001; Holden & LeDrew, 2001;Bostater et al., 2003; Vis et al., 2003; Williams et al., 2003;Dogan et al., 2009). To account for meteorological and illumina-tion variability, we specified flight times that minimized cloudsand specular reflectance and we controlled for wind velocities andtime of the day during data acquisition (Hestir et al., 2008). In-water radiance varies with the ratio of SAP to water in the watercolumn, as different mixtures have different results in the amountof radiance. In the Delta there are freshwater outflows with highturbidity gradients, which mix with tidal water inflows. Thesedynamics make the in-water radiance highly variable during thedaily tidal cycles. To reduce the effects of in-water radiance vari-ability we restricted our analysis to pure pixels, where individualSAP species were the dominant cover in the pixel rather thanwater (Hestir et al., 2008). Finally, SAP contribution to water-leaving radiance is likely affected by the depth of the watercolumn above the SAP cover (Han & Rundquist, 1997; Han,2002). To reduce this effect we restricted our imagery collectionto low-tide conditions (Hestir et al., 2008). In a parallel studytesting the impact of the water column, we observed no
Table 2 Regions of the electromagnetic spectrum where species weremost distinct based on the ANOVA of each of the measured bands by thehandheld spectrometer (ASD) and the airborne imaging spectrometer(HyMap).
Scientific names
ANOVA
ASD (nm) HyMap (nm)
Egeria densa 570–580; 950–1000;1140–1150
550–650
Elodea canadensis 700 –Ceratophyllum demersum 660–670; 900–1050 550–650Stuckenia pectinata 600–750; 800–1150 NondifferentiableStuckenia filiformis Nondifferentiable –Potamogeton nodosus – 750–1000Potamogeton crispus Nondifferentiable NondifferentiableMyriophyllum spicatum 1030–1050; 1090–1120 590–640Cabomba caroliniana 520–560 560Water 520–1200 750–1000
(a)
(b)
Fig. 3 Principal component analysis of handheld spectrometer (ASD) andairborne spectrometer (HyMap) spectra for the submersed aquatic plantspecies occurring in the Sacramento–San Joaquin River Delta, CA, USA. (a)ASD measurements; (b) HyMap measurements. Native species are repre-sented in green, nonnative species in red, and water in blue. Note thatASD does not include Potamogeton nodosus and turbid water, and thatHyMap does not include Stuckenia filiformis, and Elodea canadensis
because we did not register pure patches in the field. PCA 1, PCA axis 1;PCA 2, PCA axis 2.
Table 3 Regions of the spectrum that contributed to the principal compo-nent analysis (PCA) and discriminant function analysis (DFA) axis, and theamount of variability explained by each analysis
PCA DFA
ASD(nm)
HyMap(nm)
ASD(nm)
HyMap(nm)
Axis 1 575–900;1025–1115
710–1200 496–511; 619–679; 816 505–665
Axis 2 425–465 452–695 557–588; 634; 695–740 545–635Axis 3 525–565 695–820 600–700 465; 565
96% 96% 98% 86%
NewPhytologist Research 689
� 2011 The Authors
New Phytologist � 2011 New Phytologist Trust
New Phytologist (2012) 193: 683–695
www.newphytologist.com

significant deterioration of the submerged plant spectra withdepth, and the water column overlying the canopy did not limitthe plant detectability (Hestir, 2010).
We have shown that native and nonnative species have system-atic differences in their spectral properties related to biochemis-try, light use, and morphological, and structural traits, in both‘controlled’ and natural canopies. At the leaf level, reflectance isaffected by the structure of the leaf tissue and biochemistry, andthe size, shape, and orientation of the leaf. Submerged leaves havea poorly differentiated mesophyll and a high frequency of epider-mal chloroplasts that are likely to be under selective pressure bythe reduced diffusion coefficient of carbon dioxide in water(MacFarlane & Raven, 1990), which is not offset by the use ofbicarbonate in photosynthesis (Raven et al., 2005). The presenceof epidermal chloroplasts that maximize light absorption by thesubmersed leaf (Sculthorpe, 1965) results in minimal spectral dif-ferences between species. Hence, we believe that the structure ofleaf tissue may be more important to differentiate betweennonsubmersed and submersed plants rather than between co-occurring submersed plants. Nonsubmersed aquatic plants have agreatly differentiated mesophyll with palisade and spongy layers,and internal anatomy similar to land plants. In fact, our results
show that the only SAP species with nonsubmersed leaves,P. nodosus, is spectrally distinct from all other submersed species(Fig. 2). The leaf structure of S. pectinata is also substantiallydifferent from the other species – stems without leaf blades,allowing S. pectinata to be spectrally separated from other SAPsin the glasshouse spectrometer data (Table 2). In the landscape,however, S. pectinata occurs in very sparse canopies, which oftenform patches smaller than the ground pixel size of 9 m2, producinglow biomass per pixel area. As a result, S. pectinata is indis-tinguishable from other species in the airborne data (Table 2),despite its very characteristic laboratory spectrum (Fig. 2).
Plant leaf biochemistry greatly influences reflectance (Ustinet al., 1991, 2009; Ustin et al., 2004). This factor is not totallyindependent of the internal leaf arrangement, as leaf optical prop-erties often correspond to pigment concentrations (Blackburn,2007; Ustin et al., 2009). Chlorophylls, carotenoids, and otherpigments have absorption peaks at overlapping but differentwavelengths (Ustin et al., 2009), between 400 and 700 nm,which were used to separate species (Table 3). Several plant pig-ments are instrumental in plant photosynthetic activity (Ustinet al., 2009), and differences in leaf biochemistry affect photo-synthetic efficiency in moles of carbon assimilated per mole ofphotons absorbed.
Different leaf widths, shapes, and colors of these species mayalso contribute to the measured reflectance. With the exceptionof P. nodosus, most native species have no leaf blades, dissectedleaf blades (e.g. C. demersum) or narrow blades (e.g. E. canadensis),which are distinctly different leaf morphologies from the wideblades and large dissected leaf whorls of nonnative species. Thesegrowth forms may influence the amount of light intercepted, andthus the light reflected. Our analysis showed that native speciesare spectrally distinct from nonnatives, which is likely a result ofthree convergent characteristics of nonnative species: widerribbon-like leaves, greater leaf area per plant with higher Chlconcentration, resulting in lower visible reflectance. Native andnonnative species have different reflectance in the visible regionand most of the nonnative species have darker green leaves whilenative species are a brownish color, indicating different pigmentcompositions (Ustin et al., 2009). Our results corroborate thisprediction as we found significantly higher pigment concen-trations (Chl, carotenes and anthocyanins) in nonnative than innative species. Larger differences were found for pigments thatharvest photons for photosynthesis (Chl and carotenes) than foranthocyanins. Our spectral profiles show significant differences inreflectance that match these differences in pigment concentrations.The PRI results show that potentially different pigmentconcentrations are present in native and nonnative species (seeparagraph on 13C and PRI results). We conclude that the observedreflectance patterns are related to the interaction of shape, widthand color of the leaves, which explains the separability of thesespecies.
When scaling up from the leaf to the canopy, factors such asleaf density and canopy closure come into play. Many species arequite distinct, including most native species, such as C. demersumand P. nodosus; however, the ones most frequently confoundedwere the nonnative species, especially M. spicatum, P. crispus and
(a)
(b)
Fig. 4 Area selected to apply the discriminant function scores to theHyMap imagery: (a) hyperspectral imagery overlaid with field data pointsof patches dominated by natives (green) and nonnatives (red); (b)distribution of Ceratophyllum demersum, Egeria densa, Cabomba
carolinensis, Potamogeton crispus, P. nodosus, Myriophyllum spicatum.
690 Research
NewPhytologist
� 2011 The Authors
New Phytologist � 2011 New Phytologist Trust
New Phytologist (2012) 193: 683–695
www.newphytologist.com
E. densa. The canopy of the nonnative species found in the Deltatend to have higher leaf density (Fig. 1), resulting in high reflec-tance in the NIR (Fig. 2), and the spectral signatures are lessimpacted by the surrounding water. Thus, the effect of waterabsorption in this part of the spectrum should be less evidentthan measurements of canopies of native species. Furthermore,the effect of the water column as a potential confounding factorto the discriminant analysis was minimal because the imagerywas acquired to avoid specular reflectance and at low tide, whenmost of the submersed plant canopies are at or near the surface.
Myriophyllum spicatum is overclassified (Fig. 4) and is oftenconfused with E. densa and P. crispus, contrasting with their cur-rent Delta-wide distribution. E. densa is ubiquitous (Hestir et al.,2008), and tends to exist in most channels, in areas of moderate-and low-velocity water, shallow and deep waters, turbid and clearwaters, and water with variable salinity (Santos et al., 2011).M. spicatum tends to be more restricted to somewhat deeper andmore turbid waters with higher salinity (Grace et al., 2007), inthe western part of the Delta. The great range of environmentalconditions and species assemblages required to develop a classi-fied map for the Delta may have washed out site-specific spectraldifferences between the species in the area represented in Fig. 4.While training the classifier was done to encompass the variability
at the larger scale, it may have led to misclassification of thespecies at this finer scale. Additionally, in this region E. densa wasfrequently associated with epiphytic algae that could havecontributed to its misclassification. In fact, the patches classifiedas pure E. densa did not have algal growth, while those with algalgrowth were misclassified.
Our results show distinct d13C and PRI values between nativeand nonnative species which were less negative for nonnative thanfor native species, and the two metrics were strongly correlated.Our results are within the ranges of other published d13C (Cloernet al., 2002) and PRI data (Penuelas et al., 1993). Severalconfounding factors could affect the interpretation of d13Cvalues, especially if native and nonnative species experienceddifferent aquatic environments. In the Delta, natives and nonna-tives co-occur throughout their distribution range (Cohen &Carlton, 1995; Jassby & Cloern, 2000; Lucas et al., 2002; Santoset al., 2011), all of which occupy slower water channels, wheresubmerged plants are associated with a Delta-wide decrease inturbidity (Hestir, 2010), through their effects on sedimentationprocesses. All but one native species have roots, as do all thenonnatives (Table 1), and all experience d13C from the samewater sources. Thus we believe that there is a low probability thatnatives and nonnatives are experiencing the d13C environment
(a) (b)
(c) (d)
(e)
Fig. 5 Pigment concentration: chlorophyll (a, b),carotene (c, d), and anthocyanin (e) values for native(CEDE, ELCA, PONO, STFI, and STPE; right panel) andnonnative (CACA, EGDE, MYSP, and POCR; left panel)submerged aquatic plant species in the Sacramento–SanJoaquin River delta, CA, USA. Pigment concentrationswere significantly different between native and nonnativespecies, and among species (significantly different speciesare represented by different letters on top of the boxplots, at a = 0.05). The black solid line represents themean and the box plots are the 95% quantiles. CACA,Cabomba caroliniana; CEDE, Ceratophyllum demersum;EGDE, Egeria densa; ELCA, Elodea canadensis; MYSP,Myriophyllum spicatum; POCR, Potamogeton crispus;PONO, P. nodosus; STFI, Stuckenia filiformis; STPE,S. pectinatus. These indexes are unitless but they werecalibrated against pigment concentrations in mg m)2.
NewPhytologist Research 691
� 2011 The Authors
New Phytologist � 2011 New Phytologist Trust
New Phytologist (2012) 193: 683–695
www.newphytologist.com
differentially, suggesting that the observed differences are theresult of physiological differences. One possible explanation forthese patterns is that different CCMs result in different d13C
signals. Since most native and nonnative SAPs have CCMs(Maberly & Madsen, 2002) and the resulting d13C signal fromeither HCO3 or CO2 uptake is likely indistinguishable (Riebesell& Wolf-Gladrow, 1995), we can discard this possibility asexplaining the observed differences. Alternatively, nonnativespecies have both C3 and C4-like photosynthetic pathways (Vanet al., 1976; Salvucci & Bowes, 1981; Casati et al., 2000; Maberly& Madsen, 2002), which can overcome the high-light and-temperature limitations of C3-only plants. This may give nonna-tives (mostly E. densa, and M. spicatum) the ability to maintainphotosynthesis under high light and high temperature, which issupported by previous studies that have demonstrated thatE. densa maintains continuous growth throughout the year(Pennington & Sytsma, 2005; Pennington, 2007; Santos et al.,2011). Our results also showed less negative PRI and d13C valuesfor P. crispus, which may indicate the presence of a C4-likemechanism, as suggested in previous research (Sand-Jensen,1983; Nichols & Shaw, 1986). Exceptions, however, occur forE. canadensis and C. caroliniana, which have the highest PRIvalues and among the lowest d13C values, suggesting both C3 andC4-like mechanisms as shown in previous research (Salvucci &Bowes, 1981; Sand-Jensen, 1983), or in the case of C. carolinianathat high-light photosynthesis can be activated with CO2 as asubstrate (Smith, 1937). Finally, Stuckenia spp. showed the lowestPRI and the highest d13C values, potentially because these speciesare heterophyllous, and their canopies are formed by submerged,emergent and terrestrial leaves that have high heterogeneity inphotosynthetic traits (Iida et al., 2009).
The adaptive value of having a facultative C4-like photosyn-thesis allows plants to colonize environments that C3-only plantscannot utilize or utilize less efficiently, such as the high-light and-temperature conditions of shallower waters, and tidal sites ofincreased salinity (Nichols & Shaw, 1986). These conditions arecommon throughout the Delta, with the exception of water withcarbon (and nutrient) limitations (Jassby & Cloern, 2000; Lucaset al., 2002). This plasticity in traits may allow the nonnatives topersist and succeed in the new environment (Simberloff & Holle,1999; Simberloff, 2001). The nonnative species can occupy thesame environments in which the native species occur, but alsoenvironments where natives are not competitive, giving non-natives an advantage by occupying a wider range of environmentsof the Delta. Even if remote sensing identification is limited toidentifying native and nonnative submersed species, this workadvances systematic measurements of specific traits that may con-tribute to understanding invasibility and invasion success. This isa new approach to study invasiveness and elucidate why somespecies are more competitive, and we hope this information willbe incorporated into systems for early detection and monitoringof new and recently introduced species.
Acknowledgements
Funding for this research was provided by the California Depart-ment of Boating and Waterways Agreement 03-105-114, and theCalifornia Department of Water Resources Contract#4600008137 T4. We would like to acknowledge D. Kratville,
(a)
(b)
(c)
Fig. 6 Photochemical reflectance index (PRI; unitless) (a) and carbon iso-tope ratio (d13C; in & fractions) (b) values for native (CEDE, ELCA, PONO,STFI and STPE; left panel) and nonnative species (CACA, EGDE, MYSP,and POCR; right panel). (c) PRI and d13C regression analysis for native(closed circles) and nonnative (open circles) submerged aquatic plantspecies in the Sacramento–San Joaquin River delta. Values of PRI (unitless)and d13C (in & fractions) were significantly different among species(significantly different species are represented by different letters on top ofthe box plots, at a = 0.05). The black solid line represents the mean andthe box plots are the 95% quantiles. CACA, Cabomba caroliniana; CEDE,Ceratophyllum demersum; EGDE, Egeria densa; ELCA, Elodea canadensis;MYSP, Myriophyllum spicatum; POCR, Potamogeton crispus; PONO,P. nodosus; STFI, Stuckenia filiformis; STPE, S. pectinatus.
692 Research
NewPhytologist
� 2011 The Authors
New Phytologist � 2011 New Phytologist Trust
New Phytologist (2012) 193: 683–695
www.newphytologist.com

J.R.C. Leavitt, P. Akers, and the field crews of the CaliforniaDepartment of Boating & Waterways; and J. Greenberg, M.Andrew, P. Haverkamp, M. Whiting, and A. Kultonov for usefuldiscussion and sharing of ideas on environmental conditions inthe Delta. We also thank R. McIlvaine and G. Scheer for admin-istrative support.
References
Andrew ME, Ustin SL. 2006. Spectral and physiological uniqueness of perennial
pepperweed (Lepidium latifolium). Weed Science 54: 1051–1062.
Asner GP. 1998. Biophysical and biochemical sources of variability in canopy
reflectance. Remote Sensing of Environment 64: 234–253.
Asner GP, Vitousek PM. 2005. Remote analysis of biological invasion and
biogeochemical change. Proceedings of the National Academy of Sciences, USA102: 4383–4386.
Atkinson PM, Foody GM, Gething PW, Mathur A, Kelly CK. 2007.
Investigation spatial structure in specific tree species in ancient semi-natural
woodland using remote sensing and marked point pattern analysis. Ecography30: 88–104.
Atwater BF, Conard SG, Dowden JN, Hedel CW, Macdonald RL, Savage W.
1979. History, landforms and vegetation of the estuary’s tidal marshes. In:
Conomos TJ, ed. San Francisco Bay the urbanized estuary. San Francisco, CA,
USA: Pacific Division of the American Association for the Advancement of
Science, 347–388.
Blackburn GA. 2007. Hyperspectral remote sensing of plant pigments. Journal ofExperimental Botany 58: 855–867.
Bossard CC, Randall JM, Hoshovksy MC. 2000. Invasive plants of California’swildlands. Berkeley, CA, USA: University of California Press.
Bostater CR, Ghir T, Bassetti L, Hall C, Reyier E, Lowers R, Holloway-Adkins
K, Virnstein R. 2003. Hyperspectral remote sensing protocol development for
submerged aquatic vegetation in shallow water. In: Bostater CR, Santoleri R,
eds. Remote sensing of the ocean and sea ice 2003: Proceedings of SPIE, 199–215.
Boutton TW. 1991. Stable carbon isotope ratios of natural materials. In:
Coleman DC, Fry B, eds. Carbon isotope techniques. San Diego, CA, USA:
Academic Press, 173–186.
Bowes G, Rao SK, Estavillo GM, Reiskind JB. 2002. C4 mechanisms in aquatic
angiosperms: comparisons with terrestrial C4 systems. Functional Plant Biology29: 379–392.
Bradley BA, Mustard JF. 2006. Characterizing the landscape dynamics of an
invasive plant and risk of invasion using remote sensing. Ecological Applications16: 1132–1147.
Carvalho MC, Hayashizaki K-I, Ogawa H. 2009. Short-term measurement of
carbon stable isotope discrimination in photosynthesis and respiration by
aquatic macrophytes with marine macroalgal examples. Journal of Phycology 45:
761–770.
Casati P, Lara MV, Andreo CS. 2000. Induction of a C4-Like mechanism of
CO2 fixation in Egeria densa, a submersed aquatic species. Plant Physiology 123:
1611–1621.
Cloern JE, Canuel EA, Harris D. 2002. Stable carbon and nitrogen isotope
composition of aquatic and terrestrial plants of the San Francisco Bay Estuarine
System. Limnology and Oceanography 47: 713–729.
Cochrane MA. 2000. Using vegetation reflectance variability for species level
classification of hyperspectral data. International Journal of Remote Sensing 21:
2075–2087.
Cohen AN, Carlton JT. 1995. Non-indigenous aquatic species in a United Statesestuary: a case study of the biological invasions of the San Francisco Bay and Delta.
Washington, DC, USA: United States Fish and Wildlife Services.
Cohen AN, Carlton JT. 1998. Accelerating invasion rate in a highly invaded
estuary. Science 279: 555–558.
Cohen WB, Goward SN. 2004. Landsat’s role in ecological applications of
remote sensing. BioScience 54: 535–545.
Coppin P, Jonckheere I, Nackaerts K, Muys B, Lambin E. 2004. Digital change
detection methods in ecosystem monitoring: a review. International Journal ofRemote Sensing 25: 1565–1596.
Dennison PE, Halligan KQ, Roberts DA. 2004. A comparison of error metrics
and constraints for multiple endmember spectral mixture analysis and spectral
angle mapper. Remote Sensing of Environment 93: 359–367.
Dennison WC, Orth RJ, Moore KA, Stevenson JC, Carter V, Bergstrom PW,
Batiuk RA. 1993. Assessing water quality with submersed aquatic vegetation.
BioScience 43: 86–94.
Dogan OK, Akyurek Z, Beklioglu M. 2009. Identification and mapping of
submerged plants in a shallow lake using Quickbird satellite data. Journal ofEnvironmental Management 90: 2138–2143.
Elmore AJ, Mustard JF, Manning SJ. 2003. Regional patterns of plant
community response to changes in water: Owens Valley California. EcologicalApplications 13: 443–460.
Elmore AJ, Mustard JF, Manning SJ, Lobell DB. 2000. Quantifying vegetation
change in semiarid environments: precision and accuracy of spectral mixture
analysis and the normalized difference vegetation index. Remote Sensing ofEnvironment 73: 87–102.
Farquhar GD, Ehleringer JR, Hubick KT. 1989. Carbon isotope discrimination
and photosynthesis. Annual Review of Plant Physiology and Plant MolecularBiology 40: 503–537.
Feret J-B, Francois C, Asner GP, Gitelson AA, Marin RE, Bidel LPR, Ustin SL,
Maire Gl, Jacquemoud S. 2008. PROSPECT-4 and 5: advances in leaf optical
properties model separating photsynthetic pigments. Remote Sensing ofEnvironment 112: 3030–3043.
Fyfe SK. 2003. Spatial and temporal variation in spectral reflectance: are seagrass
species spectrally distinct? Limnology and Oceanography 48: 464–479.
Gamon JA, Penuelas J, Field CB. 1992. A narrow-waveband spectral reflectance
index that tracks diurnal changes in photosynthetic efficiency. Remote Sensing ofEnvironment 41: 35–44.
Gamon JA, Serrano L, Surfus JS. 1997. The photochemical reflectance index: an
optical indicator of photosynthetic radiation use efficiency across species,
functional types and nutrition levels. Oecologia 112: 492–501.
Giardino C, Zilioli E. 2001. Imaging spectrometry for submerged vegetation
mapping in Lake Garda. IEEE-IGARS 6: 2749–2751.
Gitelson AA, Keydan GP, Merzlyak MN. 2006. Three-band model for
noninvasive estimation of chlorophyll, carotenoids, and anthocyanin contents
in higher plant leaves. Geophysical Research Letters 33: 1–5.
Grace J, Nichol C, Disney M, Lewis P, Quaife T, Bowyer P. 2007. Can we
measure terrestrial photosynthesis from space directly, using spectral reflectance
and fluorescence? Global Change Biology 13: 1484–1497.
Hall CR, Bostater CR, Virnstein R. 2004. Plant pigment types, distributions,
and influences on shallow water submerged aquatic vegetation mapping. In:
Remote sensing of the ocean and sea ice: Proceedings of SPIE, 183–193.
Han L. 2002. Spectral reflectance of Thalassia testudinum with varying depths. In:
IEEE-IGARS 4: 2123–2125.
Han L, Rundquist DC. 1997. Comparison of NIR ⁄ RED ratio and first
derivative of reflectance in estimating algal-chlorophyll concentration: a
case study in a turbid reservoir. Remote Sensing of Environment 62:
253–261.
Hestir EL. 2010. Trends in estuarine water quality and submerged aquaticvegetation invasion. Davis, CA, USA: University of California Davis.
Hestir EL, Khanna S, Andrew ME, Santos MJ, Viers JH, Greenberg JA,
Rajapakse SS, Ustin SL. 2008. Identification of invasive vegetation using
hyperspectral remote sensing in the California Delta ecosystem. Remote Sensingof Environment 112: 4034–4047.
Holden H, LeDrew E. 2001. Effects of the water column on hyperspectral
reflectance of submerged coral reef features. Bulletin of Marine Science 69:
685–699.
Hutto KC, Shaw DR, Byrd JD, King RL. 2006. Differentiation of turfgrass and
common weed species using hyperspectral radiometry. Weed Science 54:
335–339.
Iida S, Miyagi A, Aoki S, Ito M, Kadono Y, Kosuge K. 2009. Molecular
adaptation of rbcL in the heterophyllous aquatic plant Potamogeton. PLoS One 4:
1–7.
Im J, Jensen JR, Hodgson ME. 2008. Optimizing the binary discriminant
function in change detection applications. Remote Sensing of Environment 112:
2761–2776.
NewPhytologist Research 693
� 2011 The Authors
New Phytologist � 2011 New Phytologist Trust
New Phytologist (2012) 193: 683–695
www.newphytologist.com

Jacquemoud S. 1993. Inversion of the PROSPECT+SAIL canopy reflectance
model from AVIRIS equivalent spectra: theoretical study. Remote Sensing ofEnvironment 44: 281–292.
Jacquemoud S, Baret F. 1990. PROSPECT: a model of leaf optical properties
spectra. Remote Sensing of Environment 34: 75–91.
Jacquemoud S, Verdebout J, Schmuck G, Andreoli G, Hosgood B, Hornig SE.
1994. Investigation of leaf biochemistry by statistics. In: Stein TI, ed.
IGARSS 94: Proceedings of the International Geosciences and Remote SensingSymposium. Pasadena, CA, USA: The Institute of Electrical and Electronics
Engineers, Inc. Paper no. 940669.
Jassby AD, Cloern JE. 2000. Organic matter sources and rehabilitation of the
Sacramento – San Joaquin Delta (California, USA). Aquatic Conservation 10:
323–352.
Jongman RHG, TerBraak CJF, vanTongeren OFR. 1995. Data analysis incommunity and landscape ecology: Cambridge, UK: Cambridge University Press.
Keeley JE. 1999. Photosynthetic pathway diversity in a seasonal pool community.
Functional Ecology 13: 106–118.
Keeley JE, Rundel PW. 2003. Evolution of CAM and C4 Carbon-concentrating
mechanisms. International Journal of Plant Science 164: 55–77.
Kerr JT, Ostrovsky M. 2003. From space to species: ecological applications for
remote sensing. Trends in Ecology and Evolution 18: 299–305.
Kokaly RF. 2001. Investigating a physical basis for spectroscopic estimates
of leaf nitrogen concentration. Remote Sensing of Environment 75:
153–161.
Kruse FA, Lefkoff AB, Boardman JW, Heidebrecht KB, Shapiro AT, Barloon
PJ, Goetz AFH. 1993. The Spectral Image-Processing System (Sips)-interactive
visualization and analysis of imaging spectrometer data. Remote Sensing ofEnvironment 44: 145–163.
Lehmann A, Lachavanne JB. 1997. Geographic information systems and remote
sensing in aquatic botany. Aquatic Botany 58: 195–207.
Lewis M. 2000. Discrimination of arid vegetation composition with high
resolution CASI imagery. Rangeland Journal 22: 141–167.
Light T, Grosholz T, Moyle P. 2005. Delta Ecological Survey (Phase I):
nonindigenous aquatic species in the Sacramento-San Joaquin Delta, a
literature review. In: Final Report to the U.S. Fish and Wildlife Service. Stockton,
CA, USA. 36pp.
Lu DS, Batistella M, Moran E. 2004. Multitemporal spectral mixture analysis for
Amazonian land-cover change detection. Canadian Journal of Remote Sensing30: 87–100.
Lucas LV, Cloern JE, Thompson JK, Monsen NE. 2002. Functional variability
of habitats within the Sacramento-San Joaquin Delta: restoration implications.
Ecological Applications 12: 1528–1547.
Luther H. 1947. Morphologische und systematische Beobach-tungen an
Wasserphanerogamen. Acta Botanica Fennica 40: 1–28.
Maberly SC, Madsen TV. 2002. Freshwater angiosperm carbon concentrating
mechanisms: processes and patterns. Functional Plant Biology 29: 393–
405.
MacFarlane JJ, Raven JA. 1990. C, N and P nutrition of Lemanea mamillosaKutz. (Batrachospermales, Rhodophyta) in Dighty Burn Angus U.K. Plant,Cell & Environment 13: 1–13.
Mack RN, Holle BV, Meyerson LA. 2007. Assessing invasive alien species across
multiple spatial scales: working globally and locally. Frontiers in Ecology and theEnvironment 5: 217–220.
Marshall TR, Lee PF. 1994. Mapping aquatic macrophytes through digital image
analysis of aerial photographs: an assessment. Journal of Aquatic PlantManagement 32: 61–66.
Mommer L, Kroon Hd, Pierik R, Bogemann GM, Visser EJW. 2005. A
functional comparison of acclimation to shade and submergence in two
terrestrial plant species. New Phytologist 167: 197–206.
Nichols SA, Shaw BH. 1986. Ecological life histories of the three aquatic
nuisance plants, Myriophyllum spicatum, Potamogeton crispus and Elodeacanadensis. Hydrobiologia 131: 3–21.
Ollinger SV, Smith M-L. 2005. Net primary production and canopy nitrogen in
a temperate forest landscape: an analysis using imaging spectroscopy, modeling
and field data. Ecosystems 8: 760–778.
Pennington TG. 2007. Seasonal changes in allocation, growth, and photosyntheticresponses of the submerged macrophytes Egeria densa Planch (Hydrocharitaceae)
from Oregon and California. PhD dissertation thesis, Portland State University,
Portland, OR, USA.
Pennington TG, Sytsma MD. 2005. Production and growth rates of Egeria densain the Sacramento – San Joaquin Delta, California. San Antonio, TX, USA:
American Plant Management Society.
Penuelas J, Filella I, Gamon JA, Field C. 1997. Assessing photosynthetic
radiation-use efficiency of emergent aquatic vegetation from spectral
reflectance. Aquatic Botany 58: 307–315.
Penuelas J, Gamon JA, Griffin KL, Field CB. 1993. Assessing community type,
plant biomass, pigment composition, and photosynthetic efficiency of aquatic
vegetation from spectral reflectance. Remote Sensing of Environment 46:
110–118.
Raven JA, Ball LA, Beardall J, Giordano M, Maberly SC. 2005. Algae lacking
carbon concentrating mechanisms. Canadian Journal of Botany-RevueCanadienne De Botanique 83: 879–890.
Raven JA, Johnston AM, Kubler JE, Korb R, McInroy SG, Handley LL,
Scrimgeour CM, Walker DI, Beardall J, Vanderklift M et al. 2002.
Mechanistic interpretation of carbon isotope discrimination by marine
macroalgae and seagrasses. Functional Plant Biology 29: 355–378.
Riebesell U, Wolf-Gladrow D. 1995. Growth limits on phytoplankton.
Nature 373: 28.
Roberts DA, Gardner M, Church R, Ustin SL, Green RO. 1997. Optimum
strategies for mapping vegetation using multiple endmember spectral mixture
models. In: Imaging spectrometry III: presented at the 42nd annual SPIE meeting.
San Diego, CA, USA: SPIE. 108–119.
Roberts DA, Gardner M, Church R, Ustin S, Scheer G, Green RO. 1998.
Mapping chaparral in the Santa Monica Mountains using multiple endmember
spectral mixture models. Remote Sensing of Environment 65: 267–279.
Rueda CA, Greenberg JA, Ustin SL. 2005. StarSpan: a tool for fast selective pixel
extraction from remotely sensed data. In: Center for Spatial Technologies andRemote Sensing (CSTARS). Davis, CA, USA: University of California at Davis.
Salvucci ME, Bowes G. 1981. Induction of reduced photorespiratory activity in
submersed and amphibious aquatic macrophytes. Plant Physiology 67:
335–340.
Sand-Jensen J. 1983. Photosynthetic carbon sources of stream macrophytes.
Journal of Experimental Botany 34: 198–210.
Santos MJ, Anderson LWJ, Ustin SL. 2011. Effects of invasive species on plant
communities: an example using submersed aquatic plants at the regional scale.
Biological Invasions 13: 443–457.
Santos MJ, Khanna S, Hestir EL, Andrew ME, Rajapakse SS, Greenberg JA,
Anderson LWJ, Ustin SL. 2009. Use of hyperspectral remote sensing to
evaluate efficacy of aquatic plant management in the Sacramento-San Joaquin
River Delta, California. Invasive Plant Science and Management 2: 216–229.
Sculthorpe CD. 1965. The biology of aquatic vascular plants. Koenigstein, West
Germany: Koeltz Scientific Books.
Simberloff D. 2001. Introduced Species, Effect and Distribution. Encyclopedia ofBiodiversity. New York, USA: Academic Press.
Simberloff D, Holle BV. 1999. Positive interactions of nonindigenous species:
invasional meltdown? Biological Invasions 1: 21–32.
Smith EL. 1937. The induction period in photosynthesis. The Journal of GeneralPhysiology 21: 151–163.
Ueno O. 2001. Environmental regulation of C3 and C4 differentiation in the
amphibious sedge Eleocharis vivipara. Plant Physiology 127: 1524–1532.
Underwood EC, Mulitsch MJ, Greenberg JA, Whiting ML, Ustin SL, Kefauver
SC. 2006. Mapping of invasive aquatic vegetation in the Sacramento-San
Joaquin Delta using hyperspectral imagery. Environmental Monitoring andAssessment 121: 47–64.
Ustin SL, Roberts DA, Gamon JA, Asner GP, Green RO. 2004. Using Imaging
Spectroscopy to Study Ecosystem Processes and Properties. Bioscience 54:
523–534.
Ustin SL, Curtiss B. 1990. Spectral characteristics of ozone treated conifer
species. Environmental and Experimental Botany 30: 293–308.
Ustin SL, Wessman CA, Curtiss B, Kasischke E, Way J, Vanderbilt VC. 1991.
Opportunities for using the EOS imaging spectrometers and synthetic aperture
radar in ecological models. Ecology 72: 1934–1945.
Ustin SL, Gitelson AA, Jacquemoud S, Schaepman M, Asner GP, Gamon JA,
Zarco-Tejada P. 2009. Retrieval of foliar information about plant pigment
694 Research
NewPhytologist
� 2011 The Authors
New Phytologist � 2011 New Phytologist Trust
New Phytologist (2012) 193: 683–695
www.newphytologist.com

systems from high resolution spectroscopy. Remote Sensing of Environment 113:
S67–S77.
Ustin SL, Smith MO, Adams JB. 1993. Remote sensing of ecological rrocesses: a
strategy for developing and resting ecological models using Spectral Mixture
Analysis. In: Ehelringer JR, Field CB, eds. Scaling physiological processes: leaf toglobe. San Diego, CA, USA: Academic Press, Inc, 339–357.
Van TK, Haller WT, Bowes G. 1976. Comparison of photosynthetic
characteristics of three submersed aquatic plants. Plant Physiology 58: 761–768.
Vis C, Hudon C, Carignan R. 2003. An evaluation of approaches used to
determine the distribution and biomass of emergent and submerged aquatic
macrophytes over large spatial scales. Aquatic Botany 77: 187–201.
Williams DJ, Rybicki NB, Lombana AV, O’Brien TM, Gomez RB. 2003.
Preliminary investigatiin of submerged aquatic vegetation mapping using
hyperspectral remote sensing. Environmental Monitoring and Assessment 81:
383–392.
Zar JH. 1999. Biostatistical analysis. New Jersey, USA: Prentice Hall.
Zhang M, Ustin SL, Rejmankova E, Sanderson EW. 1997. Monitoring Pacific
coast salt marshes using remote sensing. Ecological Applications 7: 1039–1053.
Supporting Information
Additional supporting information may be found in the onlineversion of this article.
Table S1 Training correct classification rates for discriminantfunctions of resampled handheld spectrometer reflectance data
using as classes the SAP species co-occurring in the Sacramento–San Joaquin River Delta
Table S2 Training correct classification rates for discriminantfunctions of airborne spectrometer reflectance data using as clas-ses the SAP species co-occurring in the Sacramento–San JoaquinRiver Delta
Table S3 Training correct classification rates for discriminantfunctions of resampled handheld spectrometer data and, inparenthesis, for the airborne sensor reflectance data, consideringas classes native and nonnative species co-occurring in the Sacra-mento–San Joaquin River Delta
Table S4 Testing correct classification rates for the discriminantfunction predictions for the area described in Fig. 4
Please note: Wiley-Blackwell are not responsible for the contentor functionality of any supporting information supplied by theauthors. Any queries (other than missing material) should bedirected to the New Phytologist Central Office.
New Phytologist is an electronic (online-only) journal owned by the New Phytologist Trust, a not-for-profit organization dedicatedto the promotion of plant science, facilitating projects from symposia to free access for our Tansley reviews.
Regular papers, Letters, Research reviews, Rapid reports and both Modelling/Theory and Methods papers are encouraged. We are committed to rapid processing, from online submission through to publication ‘as ready’ via Early View – our average timeto decision is <25 days. There are no page or colour charges and a PDF version will be provided for each article.
The journal is available online at Wiley Online Library. Visit www.newphytologist.com to search the articles and register for tableof contents email alerts.
If you have any questions, do get in touch with Central Office ([email protected]) or, if it is more convenient,our USA Office ([email protected])
For submission instructions, subscription and all the latest information visit www.newphytologist.com
NewPhytologist Research 695
� 2011 The Authors
New Phytologist � 2011 New Phytologist Trust
New Phytologist (2012) 193: 683–695
www.newphytologist.com