Thermodynamics, Solubility and Environmental Issues - E-Library

Classifying Sequences by the Optimized Dissimilarity Space
Embedding Approach: a Case Study on the Solubility Analysis of
the E. coli Proteome
Lorenzo Livi∗†1, Antonello Rizzi‡2, and Alireza Sadeghian§1
1Dept. of Computer Science, Ryerson University, 350 Victoria Street, Toronto, ON M5B2K3, Canada
2Department of Information Engineering, Electronics, and Telecommunications,SAPIENZA University of Rome, Via Eudossiana 18, 00184 Rome, Italy
August 19, 2014
Abstract
We evaluate a version of the recently-proposed Optimized Dissimilarity Space Embedding (ODSE)classification system that operates in the input space of sequences of generic objects. The ODSE systemhas been originally presented as a labeled graph classification system. However, since it is foundedon the dissimilarity space representation of the input data, the classifier can be easily adapted to anyinput domain where it is possible to define a meaningful dissimilarity measure. We demonstrate theeffectiveness of the ODSE classifier for sequences considering an application dealing with recognition ofthe solubility degree of the Escherichia coli proteome. Overall, the obtained results, which we stress thathave been achieved with no context-dependent tuning of the ODSE system, confirm the validity andgenerality of the ODSE-based approach for structured data classification.Index terms— Dissimilarity representation; Sequence matching and classification; E. coli proteomeanalysis; Entropy-based data characterization.
1 Introduction
A considerable number of pattern recognition applications deal with data represented as sequences of objects[4, 44]. The handwriting on-line recognition problem provides a good example: each object in the sequenceis a distinct stroke written by a user through a suitable input device [40]. The objects of the sequence canoriginate from a finite alphabet, as in the problem of text excerpt classification [14], where the objects areusually words of the corresponding language. Another interesting example in this case pertains biochemicalcompounds, such as DNA and proteins [10, 39, 43]. Many applications deal with objects originating frominfinite domains, such as in the case of series of real-valued data (e.g., 3D spatial positions of a moving agent,financial time-series, and sequences of measurements related to a physical plant or device) [12, 29]. Oftenthe ordering of the objects is assumed to be over the time domain; in this case, the objects are referred toas events. When dealing with classification problems defined on an input space of sequences, modeling theabstract classification function underlying the unknown data generating process can become a very complex
∗[email protected]†Corresponding author‡[email protected]§[email protected]
1
arX
iv:1
408.
3873
v1 [
cs.C
V]
17
Aug
201
4

task. To this end, the problem can be faced by mapping the sequences into Rd vectors, using a suitablefeature extraction procedure [3, 16, 18, 33, 35]. In this scenario, features are elaborated from the dataset athand, and therefore can be considered as a local reference framework on which ground the new vector-basedrepresentation of the input data. This solution is supported by the fact that there are many effective andwell-established data-driven inductive inference systems that deal with real-valued vectors as input patterns[23–25, 32, 36, 37].
The dissimilarity representation is a powerful framework for dealing with pattern recognition and datamining problems defined in spaces with no trivial (geo)metric structure [4, 5, 7, 13, 21, 31, 42]. Pairwisedissimilarity values of input data are generated according to a suitable dissimilarity measure, d : X×X → R+,which operates directly in the input domain, X . Such a dissimilarity measure, which can also diverge from acommon metric distance (e.g., Euclidean distance), is usually defined by parameters that allow to tailor thematching method to the particular data type at hand. The dissimilarity representation is developed withrespect to a local base of prototypes, R, called representation set. Dissimilarity-based classification systemsfor sequences of objects have been proposed on various data types, such as simple atomic elements [35] (e.g.,sequences of numbers or characters belonging to a finite alphabet) and more complex data structures, liketype-2 fuzzy sets [19, 22, 26] and pen strokes [2, 40].
The recently proposed classification system called Optimized Dissimilarity Space Embedding (ODSE) isfounded on the dissimilarity representation. It has been originally developed as a classification system forlabeled graphs, denoting state-of-the-art test set performances on various well-known benchmarking datasets[17, 21]. The synthesis of the classification model is implemented by exploiting an information-theoreticinterpretation of the dissimilarity matrix. Such an interpretation allows to conceive suitable compressionand expansion operations of the representation set, implementing the optimization of the dissimilarity space.The ODSE system performs all operations (i.e., synthesis of the model, test set evaluation etc.) starting fromthe construction of the dissimilarity matrix, which in turn is completely elaborated through a dissimilaritymeasure. Therefore, by adapting the dissimilarity measure to the particular context at hand, it is possibleto easily adapt the whole ODSE system accordingly.
In this paper, we present and test a version of the ODSE system tailored to work in the input spaceof sequences. The main aim of this study is to demonstrate the versatility and effectiveness of the ODSEclassifier design, which is quickly adaptable to different input domains. Toward this end, we evaluate theODSE classifier for sequences on an important application concerning the solubility analysis of sequences ofamino acid residues, elaborated from the Escherichia coli (E. coli) proteome [27, 28]. Folding is a chemico-physical process of extraordinary difficulty and complexity from the viewpoint of prediction. This fact isdue to (i) the large number of residues constituting protein molecules and to (ii) the multiplicity of differentenergetic constraints involved in the underlying physical process [6]. Moreover, the process of folding is instrict competition with the aggregation process (low propensity of a molecule to be soluble), that is, withthe tendency of establishing inter-molecular bonds. This results in the formation of large multi-molecular“aggregates” which, analogously to what happens for artificial polymers, are insoluble and hence precipitatein solution [6, 8, 10].
The herein considered data as been already processed by different groups [1, 35], although in slightlydifferent settings. Therefore, we use such results [35] for comparison in the experiments.
This paper is structured as follows. Section 2 quickly introduces the ODSE system; initially we describethe system in terms of graph-based patterns. Section 2.2 discusses the straightforward adaptation of theODSE system for processing sequences. In Section 3 we discuss the experiments performed on the E. colidataset. Finally, Section 4 concludes the paper.
2 The ODSE Classification System
The ODSE graph classification system [17, 21] is based on the interplay between different techniques, amongwhich we have graph matching, dissimilarity space representation, cluster analysis, and information-theoreticdata analysis methods. The classifier is founded on an explicit graph embedding mechanism that representsthe input graphs S, n = |S|, using a suitable representation set, R,m = |R|, by computing the dissimilarity
2
matrix Dn×m. Originally, the system has been conceived to operate on the labeled graphs domain G bymeans of a suitable inexact graph matching procedure [15]. The vector configuration representing the inputdata in the embedding space D is derived directly using the rows of D.
An important component of the ODSE graph classification system is the inner feature-based classifier,which operates directly on the developed dissimilarity space embedding; its own classification model issynthesized along with the ODSE synthesis. Such a classifier can be any well-known classification system,such as a neuro-fuzzy Min-Max network [9, 32].
2.1 A Quick Look Into the ODSE Design
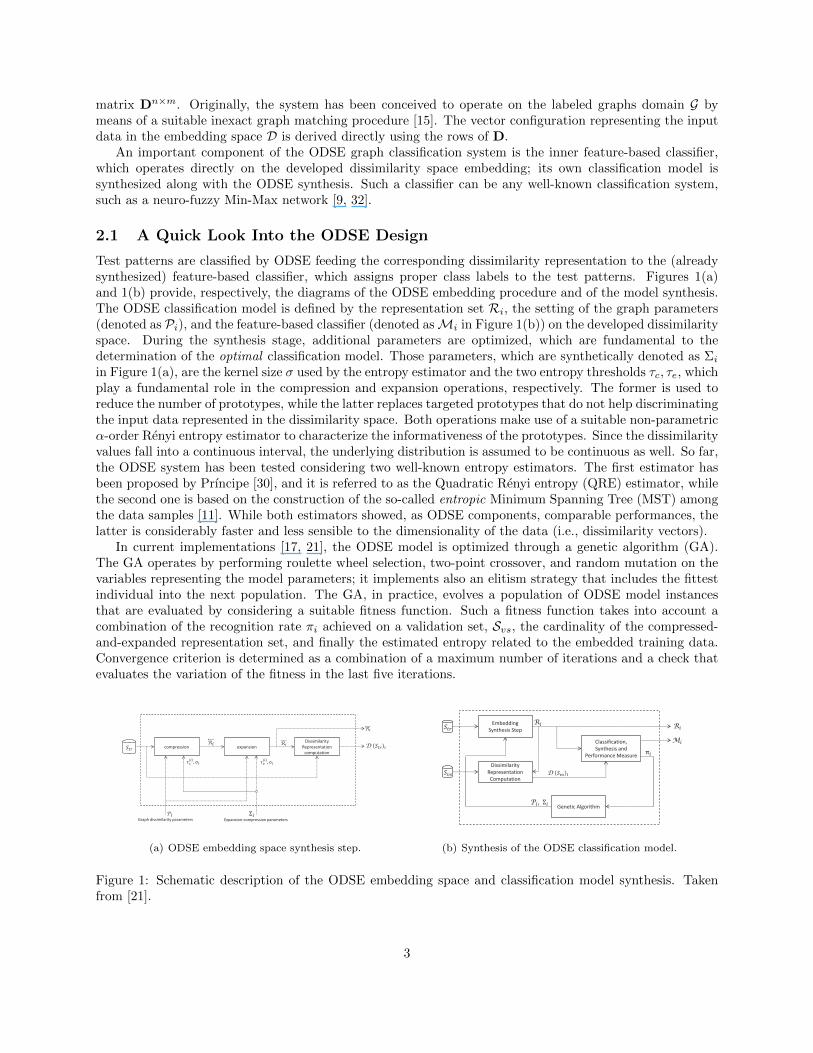
Test patterns are classified by ODSE feeding the corresponding dissimilarity representation to the (alreadysynthesized) feature-based classifier, which assigns proper class labels to the test patterns. Figures 1(a)and 1(b) provide, respectively, the diagrams of the ODSE embedding procedure and of the model synthesis.The ODSE classification model is defined by the representation set Ri, the setting of the graph parameters(denoted as Pi), and the feature-based classifier (denoted asMi in Figure 1(b)) on the developed dissimilarityspace. During the synthesis stage, additional parameters are optimized, which are fundamental to thedetermination of the optimal classification model. Those parameters, which are synthetically denoted as Σi
in Figure 1(a), are the kernel size σ used by the entropy estimator and the two entropy thresholds τc, τe, whichplay a fundamental role in the compression and expansion operations, respectively. The former is used toreduce the number of prototypes, while the latter replaces targeted prototypes that do not help discriminatingthe input data represented in the dissimilarity space. Both operations make use of a suitable non-parametricα-order Renyi entropy estimator to characterize the informativeness of the prototypes. Since the dissimilarityvalues fall into a continuous interval, the underlying distribution is assumed to be continuous as well. So far,the ODSE system has been tested considering two well-known entropy estimators. The first estimator hasbeen proposed by Prıncipe [30], and it is referred to as the Quadratic Renyi entropy (QRE) estimator, whilethe second one is based on the construction of the so-called entropic Minimum Spanning Tree (MST) amongthe data samples [11]. While both estimators showed, as ODSE components, comparable performances, thelatter is considerably faster and less sensible to the dimensionality of the data (i.e., dissimilarity vectors).
In current implementations [17, 21], the ODSE model is optimized through a genetic algorithm (GA).The GA operates by performing roulette wheel selection, two-point crossover, and random mutation on thevariables representing the model parameters; it implements also an elitism strategy that includes the fittestindividual into the next population. The GA, in practice, evolves a population of ODSE model instancesthat are evaluated by considering a suitable fitness function. Such a fitness function takes into account acombination of the recognition rate πi achieved on a validation set, Svs, the cardinality of the compressed-and-expanded representation set, and finally the estimated entropy related to the embedded training data.Convergence criterion is determined as a combination of a maximum number of iterations and a check thatevaluates the variation of the fitness in the last five iterations.
compression
Dissimilarity
Representation
computation
expansion
Graph dissimilarity parameters Expansion-compression parameters
P
DR
R
R
(a) ODSE embedding space synthesis step.
Embedding
Synthesis Step
Dissimilarity
Representation
Computation
Classification,
Synthesis and
Performance Measure
Genetic Algorithm P ,
D
R R
M
(b) Synthesis of the ODSE classification model.
Figure 1: Schematic description of the ODSE embedding space and classification model synthesis. Takenfrom [21].
3
2.2 Classifying Sequences with ODSE
It is easy to realize that ODSE can be straightforwardly adapted to operate in other input spaces (i.e., differ-ent from the labeled graphs domain). In fact, once an effective dissimilarity measure d(·, ·) that operates inthe specific input space at hand (e.g., a domain of sequence of characters) is defined, all ODSE operations areautomatically valid and well-defined, since they are performed on the vectors derived from the dissimilaritymatrix D (i.e., compression, expansion, and entropy estimation). Therefore, adaptation of ODSE to processsequences of generic objects is performed by implementing d(·, ·) as a suitable sequence matching algorithm.
From the software implementation point of view, ODSE flexibility is due to the C++ template metapro-gramming approach1 [20]. In fact, the designer is in charge to define just a class implementing a suitabledissimilarity measure, passing it as an argument to the main procedure.
3 Recognition of the E. coli Protein Solubility
Aggregation propensity of proteins is strongly related to “errors” in the folding process [6]. In fact, pro-tein aggregation is at the basis of pathologies defined as misfolding diseases (which include Alzheimer andParkinson) [41]. Nevertheless, protein–protein interactions are of vital importance for proteins exerting theirphysiological role, so that a refined balance between aggregation (inter-molecular connections) and folding(intra-molecular connections) is of utmost importance. This balance is so crucial for life that does exist aclass of protein molecules called “chaperones”, whose specific role is to help other proteins in completinga correct folding process [38]. However, the nature of the code by which a linear sequence of amino acidresidues is transformed into a functional 3D structure is still elusive [6]. It is well-known that some proteinsare capable to easily reach the stable state, so that they can undergo different folding–unfolding cycles evenwhen isolated from the cell micro-environment. On the other hand, there are other proteins that cannot befolded when isolated from their cellular environment, necessitating a chaperone-driven folding process.
Niwa et al. [27] studied, in a strictly controlled setting, the aggregation/solubility propensity of the E. coliproteins. Proteins having difficulty in performing the folding “autonomously” tend to aggregate and henceprecipitate in the solution (water in this case). Agostini et al. [1] in a recent work clearly demonstrated thatthe solubility degree in the same Niwa et al. data base negatively correlates with the aggregation propensity(the aggregation is estimated from the folded state). This result implies that it is possible to consider thesolubility as a measure of the relative stability of both the folded and aggregated states (i.e., the higher thesolubility the higher the protein stability in its native state).
3.1 Dataset Description
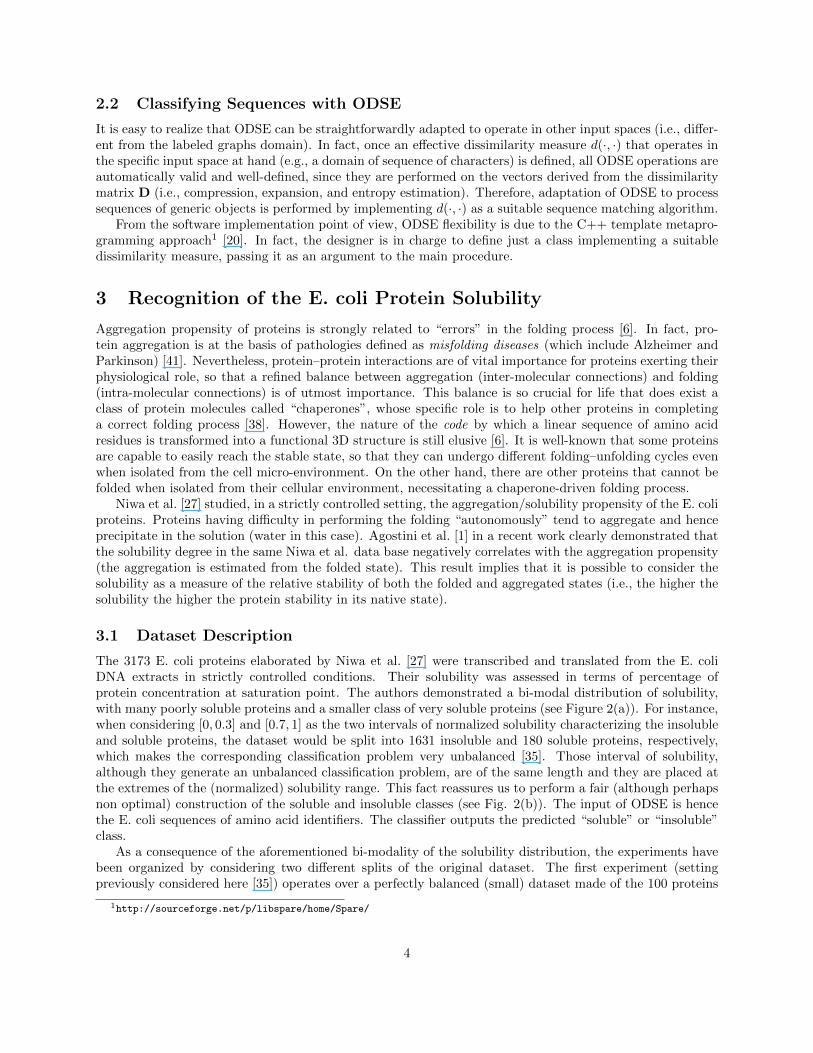
The 3173 E. coli proteins elaborated by Niwa et al. [27] were transcribed and translated from the E. coliDNA extracts in strictly controlled conditions. Their solubility was assessed in terms of percentage ofprotein concentration at saturation point. The authors demonstrated a bi-modal distribution of solubility,with many poorly soluble proteins and a smaller class of very soluble proteins (see Figure 2(a)). For instance,when considering [0, 0.3] and [0.7, 1] as the two intervals of normalized solubility characterizing the insolubleand soluble proteins, the dataset would be split into 1631 insoluble and 180 soluble proteins, respectively,which makes the corresponding classification problem very unbalanced [35]. Those interval of solubility,although they generate an unbalanced classification problem, are of the same length and they are placed atthe extremes of the (normalized) solubility range. This fact reassures us to perform a fair (although perhapsnon optimal) construction of the soluble and insoluble classes (see Fig. 2(b)). The input of ODSE is hencethe E. coli sequences of amino acid identifiers. The classifier outputs the predicted “soluble” or “insoluble”class.
As a consequence of the aforementioned bi-modality of the solubility distribution, the experiments havebeen organized by considering two different splits of the original dataset. The first experiment (settingpreviously considered here [35]) operates over a perfectly balanced (small) dataset made of the 100 proteins
1http://sourceforge.net/p/libspare/home/Spare/
4
(a) Density of the 3173 E. coli proteins with respect to thenormalized solubility degree. Taken from [35].
0
0.2
0.4
0.6
0.8
1
0 200 400 600 800 1000 1200 1400 1600 1800 2000
So
lub
ility
de
gre
e
Protein
(b) Normalized solubility degree of the considered 1631 pro-teins. The two classes are clearly recognized.
Figure 2: Density (2(a)) and solubility degree (2(b)) of the considered proteins.
with the highest solubility degree and the 100 with the lowest solubility degree. We refer to this datasetas DS-200. The training set Str contains 140 proteins and the test set Sts the remaining 60. Training andtest set are characterized by the same number of soluble and insoluble proteins. The second experiment,which we introduce here, takes into account instead a larger dataset of 1811 proteins (DS-1811), obtainedby considering the aforementioned solubility ranges (see Fig. 2(b)). The training set, in this case, contains180 proteins, 70 of which belong to the soluble class and the remaining 110 to the insoluble class. The testset is considerably larger, since in fact it contains 1631 proteins, 1521 of which are insoluble proteins. Thetraining set, although it is much smaller than the test set, it is suitably conceived to “cover” the considereddata instance with characterizing proteins, that is, with proteins that suitably represent the soluble orinsoluble prototypical patterns – those proteins are selected as suitable prototypes of the respective classesby exploiting a clustering-based analysis.
3.2 Test Set Classification Accuracy Results
In this paper, we adopt the ODSE version described in [17, Sec. 3]. For the sake of shortness, we do notreport the details of this particular ODSE implementation here, referring the reader to given reference. Wesetup ODSE to operate in the input space of sequences by means of a dissimilarity measure implementedthrough the Levenshtein sequence matching algorithm [19, 34]. We consider in the Levenshtein globalalignment scheme suitable pre-computed substitution weights; notably, we used the weights provided bythe “PAM120” matrix, which have been retrieved from: ftp://ftp.ncbi.nih.gov/blast/matrices/. Wereport the results obtained with two different feature-based classifiers operating on the dissimilarity space:a k -NN rule operating the Euclidean distance (kNN) and the C-SVM classifier (C-SVM) equipped with aGaussian kernel. We compare ODSE with the recently-proposed sequence classification system based onanother embedding technique [35], which is denoted as GRAPSEC in the following. We consider also tworeference systems that operate directly in the input space. The first one is a k -NN rule based classifier,equipped with the same weighted Levenshtein matching scheme used in ODSE (kNN); the second one is thekernelized C-SVM classifier operating in the input space of sequences through the kernel function elaboratedfrom the Levenshtein metric – no corrections are performed to assure positive definiteness of the resultingkernel. Setting of meta-parameters (e.g., C of C-SVM) have been defined by preliminary tests. In thefollowing, “0” indicates the insoluble class, while “1” the soluble class. For DS-1811, we considered 10different randomized re-samplings; split percentages of the datasets are defined as described in the previoussection. The following results on DS-1811 are thus intended as averages (with related standard deviations).
5
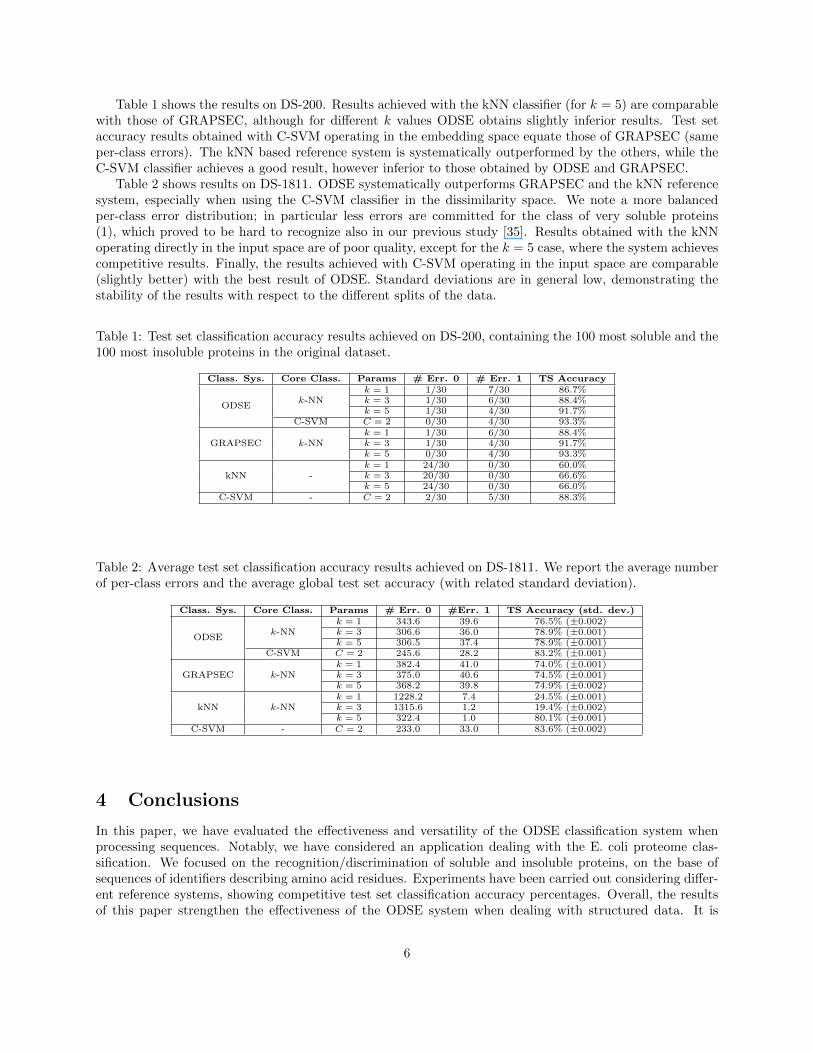
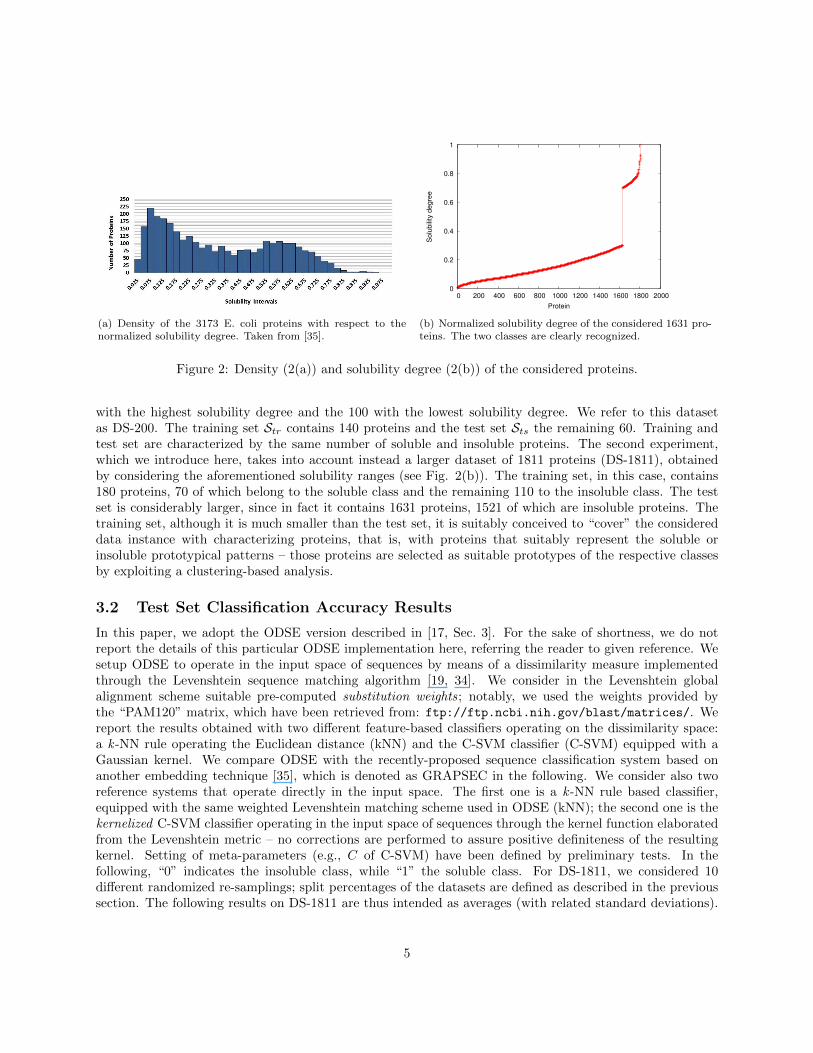
Table 1 shows the results on DS-200. Results achieved with the kNN classifier (for k = 5) are comparablewith those of GRAPSEC, although for different k values ODSE obtains slightly inferior results. Test setaccuracy results obtained with C-SVM operating in the embedding space equate those of GRAPSEC (sameper-class errors). The kNN based reference system is systematically outperformed by the others, while theC-SVM classifier achieves a good result, however inferior to those obtained by ODSE and GRAPSEC.
Table 2 shows results on DS-1811. ODSE systematically outperforms GRAPSEC and the kNN referencesystem, especially when using the C-SVM classifier in the dissimilarity space. We note a more balancedper-class error distribution; in particular less errors are committed for the class of very soluble proteins(1), which proved to be hard to recognize also in our previous study [35]. Results obtained with the kNNoperating directly in the input space are of poor quality, except for the k = 5 case, where the system achievescompetitive results. Finally, the results achieved with C-SVM operating in the input space are comparable(slightly better) with the best result of ODSE. Standard deviations are in general low, demonstrating thestability of the results with respect to the different splits of the data.
Table 1: Test set classification accuracy results achieved on DS-200, containing the 100 most soluble and the100 most insoluble proteins in the original dataset.
Class. Sys. Core Class. Params # Err. 0 # Err. 1 TS Accuracy
ODSEk-NN
k = 1 1/30 7/30 86.7%k = 3 1/30 6/30 88.4%k = 5 1/30 4/30 91.7%
C-SVM C = 2 0/30 4/30 93.3%
GRAPSEC k-NNk = 1 1/30 6/30 88.4%k = 3 1/30 4/30 91.7%k = 5 0/30 4/30 93.3%
kNN -k = 1 24/30 0/30 60.0%k = 3 20/30 0/30 66.6%k = 5 24/30 0/30 66.0%
C-SVM - C = 2 2/30 5/30 88.3%
Table 2: Average test set classification accuracy results achieved on DS-1811. We report the average numberof per-class errors and the average global test set accuracy (with related standard deviation).
Class. Sys. Core Class. Params # Err. 0 #Err. 1 TS Accuracy (std. dev.)
ODSEk-NN
k = 1 343.6 39.6 76.5% (±0.002)k = 3 306.6 36.0 78.9% (±0.001)k = 5 306.5 37.4 78.9% (±0.001)
C-SVM C = 2 245.6 28.2 83.2% (±0.001)
GRAPSEC k-NNk = 1 382.4 41.0 74.0% (±0.001)k = 3 375.0 40.6 74.5% (±0.001)k = 5 368.2 39.8 74.9% (±0.002)
kNN k-NNk = 1 1228.2 7.4 24.5% (±0.001)k = 3 1315.6 1.2 19.4% (±0.002)k = 5 322.4 1.0 80.1% (±0.001)
C-SVM - C = 2 233.0 33.0 83.6% (±0.002)
4 Conclusions
In this paper, we have evaluated the effectiveness and versatility of the ODSE classification system whenprocessing sequences. Notably, we have considered an application dealing with the E. coli proteome clas-sification. We focused on the recognition/discrimination of soluble and insoluble proteins, on the base ofsequences of identifiers describing amino acid residues. Experiments have been carried out considering differ-ent reference systems, showing competitive test set classification accuracy percentages. Overall, the resultsof this paper strengthen the effectiveness of the ODSE system when dealing with structured data. It is
6

important to underline that the tests have been performed without any need to tune any system componentspecifically for the considered problem (i.e., the E. coli solubility recognition), thus confirming that ODSEcan be considered as a widely applicable classification system.
Future research directions involve the application of ODSE in other sequence-based pattern recognitionproblems. We also plan to cast the herein presented E. coli proteome analysis as a function approximationproblem, i.e., by considering the continuous solubility degree as the target output signal.
References
[1] F. Agostini, M. Vendruscolo, and G. G. Tartaglia. Sequence-Based Prediction of Protein Solubility. Journal of MolecularBiology, 421(2-3):237–241, 2012. ISSN 0022-2836. doi: 10.1016/j.jmb.2011.12.005.
[2] L. Batista, E. Granger, and R. Sabourin. Applying Dissimilarity Representation to Off-Line Signature Verification. InProceedings of the 2010 20th International Conference on Pattern Recognition, ICPR ’10, pages 1293–1297, 2010. ISBN978-0-7695-4109-9. doi: 10.1109/ICPR.2010.322.
[3] F. M. Bianchi, L. Livi, A. Rizzi, and A. Sadeghian. A Granular Computing approach to the design of optimized graphclassification systems. Soft Computing, 18(2):393–412, 2014. ISSN 1432-7643. doi: 10.1007/s00500-013-1065-z.
[4] M. Bicego, V. Murino, and M. A. T. Figueiredo. Similarity-based classification of sequences using hidden Markov models.Pattern Recognition, 37(12):2281–2291, 2004. ISSN 0031-3203. doi: 10.1016/j.patcog.2004.04.005.
[5] Y. Calana, E. Reyes, M. Alzate, and R. P. W. Duin. Prototype Selection for Dissimilarity Representation by a GeneticAlgorithm. In Proceedings of the 20th International Conference on Pattern Recognition, pages 177–180, Aug. 2010. doi:10.1109/ICPR.2010.52.
[6] K. A. Dill and J. L. MacCallum. The protein-folding problem, 50 years on. Science, 338(6110):1042–1046, 2012.
[7] R. P. W. Duin and E. Pekalska. The dissimilarity space: Bridging structural and statistical pattern recognition. PatternRecognition Letters, 33(7):826–832, 2012. ISSN 0167-8655. doi: 10.1016/j.patrec.2011.04.019.
[8] H. Frauenfelder and P. Wolynes. Proteins: where physics of simplicity and complexity meet. Physics Today, 47:58–65,1994.
[9] B. Gabrys and A. Bargiela. General Fuzzy Min-Max Neural Network for Clustering and Classification. IEEE Transactionson Neural Networks, 11(3):769–783, 2000.
[10] A. Giuliani, R. Benigni, J. P. Zbilut, C. L. Webber Jr., P. Sirabella, and A. Colosimo. Nonlinear Signal Analysis Methodsin the Elucidation of Protein Sequence—Structure Relationships. ChemInform, 33(28):1471–1492, 2002. ISSN 1522-2667.doi: 10.1002/chin.200228300.
[11] A. O. Hero III, B. Ma, O. J. J. Michel, and J. Gorman. Applications of entropic spanning graphs. IEEE Signal ProcessingMagazine, 19(5):85–95, Sept. 2002. doi: 10.1109/MSP.2002.1028355.
[12] A. Iosifidis, A. Tefas, and I. Pitas. Multidimensional Sequence Classification based on Fuzzy Distances and DiscriminantAnalysis. IEEE Transactions on Knowledge and Data Engineering, 99(PrePrints):1, 2012. ISSN 1041-4347. doi: 10.1109/TKDE.2012.223.
[13] D. W. Jacobs, D. Weinshall, and Y. Gdalyahu. Classification with Nonmetric Distances: Image Retrieval and ClassRepresentation. IEEE Transactions on Pattern Analysis and Machine Intelligence, 22(6):583–600, June 2000. ISSN0162-8828. doi: 10.1109/34.862197.
[14] M. Lan, C. L. Tan, J. Su, and Y. Lu. Supervised and Traditional Term Weighting Methods for Automatic Text Catego-rization. IEEE Transactions on Pattern Analysis and Machine Intelligence, 31(4):721–735, april 2009. ISSN 0162-8828.doi: 10.1109/TPAMI.2008.110.
[15] L. Livi and A. Rizzi. The graph matching problem. Pattern Analysis and Applications, 16(3):253–283, 2013. ISSN1433-7541. doi: 10.1007/s10044-012-0284-8.
[16] L. Livi, G. Del Vescovo, and A. Rizzi. Graph Recognition by Seriation and Frequent Substructures Mining. In Proceedingsof the First International Conference on Pattern Recognition Applications and Methods, volume 1, pages 186–191, Feb.2012. ISBN 978-989-8425-98-0. doi: 10.5220/0003733201860191.
[17] L. Livi, F. M. Bianchi, A. Rizzi, and A. Sadeghian. Dissimilarity Space Embedding of Labeled Graphs by a Clustering-based Compression Procedure. In Proceedings of the 2013 International Joint Conference on Neural Networks, pages1646–1653, Aug 2013. ISBN 978-1-4673-6129-3. doi: 10.1109/IJCNN.2013.6706937.
7
[18] L. Livi, G. Del Vescovo, and A. Rizzi. Combining Graph Seriation and Substructures Mining for Graph Recognition. InP. Latorre Carmona, J. S. Sanchez, and A. L. N. Fred, editors, Pattern Recognition - Applications and Methods, volume 204of Advances in Intelligent and Soft Computing, pages 79–91. Springer Berlin Heidelberg, 2013. ISBN 978-3-642-36529-4.doi: 10.1007/978-3-642-36530-0 7.
[19] L. Livi, H. Tahayori, A. Sadeghian, and A. Rizzi. Aggregating α-planes for Type-2 fuzzy set matching. In 2013 Joint IFSAWorld Congress and NAFIPS Annual Meeting (IFSA/NAFIPS), pages 860–865, 2013. doi: 10.1109/IFSA-NAFIPS.2013.6608513.
[20] L. Livi, G. Del Vescovo, A. Rizzi, and F. M. Frattale Mascioli. Building Pattern Recognition Applications with the SPARELibrary. Pattern Analysis and Applications, 2014. To appear.
[21] L. Livi, A. Rizzi, and A. Sadeghian. Optimized dissimilarity space embedding for labeled graphs. Information Sciences,266:47–64, 2014. ISSN 0020-0255. doi: 10.1016/j.ins.2014.01.005.
[22] L. Livi, H. Tahayori, A. Sadeghian, and A. Rizzi. Distinguishability of interval type-2 fuzzy sets data by analyzing upper andlower membership functions. Applied Soft Computing, 17:79–89, 2014. ISSN 1568-4946. doi: 10.1016/j.asoc.2013.12.020.
[23] P. Melin and O. Castillo. A review on the applications of type-2 fuzzy logic in classification and pattern recognition. ExpertSystems with Applications, 40(13):5413–5423, 2013.
[24] P. Melin and O. Castillo. A review on type-2 fuzzy logic applications in clustering, classification and pattern recognition.Applied Soft Computing, 21:568–577, 2014.
[25] P. Melin, J. Amezcua, F. Valdez, and O. Castillo. A new neural network model based on the lvq algorithm for multi-classclassification of arrhythmias. Information Sciences, 279:483–497, 2014.
[26] M. Moharrer, H. Tahayori, L. Livi, A. Sadeghian, and A. Rizzi. Interval Type-2 Fuzzy Sets to Model Linguistic LabelPerception in Online Services Satisfaction. Soft Computing, 2014. ISSN 1432-7643. doi: 10.1007/s00500-014-1246-4.
[27] T. Niwa, B.-W. Ying, K. Saito, W. Jin, S. Takada, T. Ueda, and H. Taguchi. Bimodal protein solubility distribution revealedby an aggregation analysis of the entire ensemble of Escherichia coli proteins. Proceedings of the National Academy ofSciences, 106(11):4201–4206, 2009. doi: 10.1073/pnas.0811922106.
[28] T. Niwa, T. Kanamori, T. Ueda, and H. Taguchi. Global analysis of chaperone effects using a reconstituted cell-freetranslation system. Proceedings of the National Academy of Sciences, 109(23):8937–8942, 2012. doi: 10.1073/pnas.1201380109.
[29] W. Pedrycz, W. Lu, X. Liu, W. Wang, and L. Wang. Human-centric analysis and interpretation of time series: a perspectiveof granular computing. Soft Computing, pages 1–15, 2014. ISSN 1432-7643. doi: 10.1007/s00500-013-1213-5.
[30] J. C. Prıncipe. Information Theoretic Learning: Renyi’s Entropy and Kernel Perspectives. Information Science andStatistics. Springer, 2010. ISBN 9781441915696.
[31] K. Riesen and H. Bunke. Graph Classification and Clustering Based on Vector Space Embedding. Series in MachinePerception and Artificial Intelligence. World Scientific Pub Co Inc, 2010. ISBN 9789814304719.
[32] A. Rizzi, M. Panella, and F. M. Frattale Mascioli. Adaptive resolution min-max classifiers. IEEE Transactions on NeuralNetworks, 13:402–414, Mar. 2002. ISSN 1045-9227.
[33] A. Rizzi, G. Del Vescovo, L. Livi, and F. M. Frattale Mascioli. A New Granular Computing Approach for SequencesRepresentation and Classification. In Proceedings of the 2012 International Joint Conference on Neural Networks, pages2268–2275, June 2012. ISBN 978-1-4673-1489-3. doi: 10.1109/IJCNN.2012.6252680.
[34] A. Rizzi, L. Livi, H. Tahayori, and A. Sadeghian. Matching general type-2 fuzzy sets by comparing the vertical slices. In2013 Joint IFSA World Congress and NAFIPS Annual Meeting (IFSA/NAFIPS), pages 866–871, 2013. doi: 10.1109/IFSA-NAFIPS.2013.6608514.
[35] A. Rizzi, F. Possemato, L. Livi, A. Sebastiani, A. Giuliani, and F. M. Frattale Mascioli. A Dissimilarity-based Classifierfor Generalized Sequences by a Granular Computing Approach. In Proceedings of the 2013 International Joint Conferenceon Neural Networks, pages 2397–2404, Aug 2013. ISBN 978-1-4673-6129-3. doi: 10.1109/IJCNN.2013.6707041.
[36] A. Sadeghian. Nonlinear neuro-fuzzy prediction: methodology, design and applications. In The 10th IEEE InternationalConference on Fuzzy Systems, volume 3, pages 1022–1026, 2001. doi: 10.1109/FUZZ.2001.1009136.
[37] D. Sanchez and P. Melin. Optimization of modular granular neural networks using hierarchical genetic algorithms forhuman recognition using the ear biometric measure. Engineering Applications of Artificial Intelligence, 27:41–56, 2014.
8
[38] M. Shtilerman, G. H. Lorimer, and S. Walter Englander. Chaperonin Function: Folding by Forced Unfolding. Science,284(5415):822–825, 1999. doi: 10.1126/science.284.5415.822.
[39] P. Smialowski, A. J. Martin-Galiano, A. Mikolajka, T. Girschick, T. A. Holak, and D. Frishman. Protein solubility:sequence based prediction and experimental verification. Bioinformatics, 23(19):2536–2542, 2007.
[40] C. Tappert, C. Suen, and T. Wakahara. The State of the Art in Online Handwriting Recognition. IEEE Transactions onPattern Analysis and Machine Intelligence, 12(8):787–808, 1990. ISSN 0162-8828. doi: 10.1109/34.57669.
[41] G. Taubes. Protein Chemistry: Misfolding the Way to Disease. Science, 271(5255):1493–1495, 1996. doi: 10.1126/science.271.5255.1493.
[42] C. Trujillo-Pulgarın and M. Orozco-Alzate. Parzen classification in generalised dissimilarity spaces. Electronics Letters,49(3):192–193, 2013.
[43] N. Xiaohui, S. Feng, H. Xuehai, X. Jingbo, and L. Nana. Predicting the protein solubility by integrating chaos gamesrepresentation and entropy in information theory. Expert Systems with Applications, 41(4):1672–1679, 2014.
[44] Z. Xing, J. Pei, and E. Keogh. A brief survey on sequence classification. SIGKDD Explorations Newsletter, 12:40–48, Nov.2010. ISSN 1931-0145. doi: 10.1145/1882471.1882478.
9
Copyright © 2022 FDOKUMEN