Microfluidics set-up rapidly measures solubility directly from ...
12
HAL Id: hal-01899746 https://hal.archives-ouvertes.fr/hal-01899746v2 Submitted on 31 Oct 2018 HAL is a multi-disciplinary open access archive for the deposit and dissemination of sci- entific research documents, whether they are pub- lished or not. The documents may come from teaching and research institutions in France or abroad, or from public or private research centers. L’archive ouverte pluridisciplinaire HAL, est destinée au dépôt et à la diffusion de documents scientifiques de niveau recherche, publiés ou non, émanant des établissements d’enseignement et de recherche français ou étrangers, des laboratoires publics ou privés. Microfluidics set-up rapidly measures solubility directly from powder Guillem Peybernès, Romain Grossier, Frédéric Villard, Philippe Letellier, Mehdi Lagaize, Nadine Candoni, Stéphane Veesler To cite this version: Guillem Peybernès, Romain Grossier, Frédéric Villard, Philippe Letellier, Mehdi Lagaize, et al.. Mi- crofluidics set-up rapidly measures solubility directly from powder. Organic Process Research and Development, American Chemical Society, 2018, 22, pp.1856-1860. 10.1021/acs.oprd.8b00300. hal- 01899746v2
-
Upload
khangminh22 -
Category
Documents
-
view
1 -
download
0
Transcript of Microfluidics set-up rapidly measures solubility directly from ...

HAL Id: hal-01899746https://hal.archives-ouvertes.fr/hal-01899746v2
Submitted on 31 Oct 2018
HAL is a multi-disciplinary open accessarchive for the deposit and dissemination of sci-entific research documents, whether they are pub-lished or not. The documents may come fromteaching and research institutions in France orabroad, or from public or private research centers.
L’archive ouverte pluridisciplinaire HAL, estdestinée au dépôt et à la diffusion de documentsscientifiques de niveau recherche, publiés ou non,émanant des établissements d’enseignement et derecherche français ou étrangers, des laboratoirespublics ou privés.
Microfluidics set-up rapidly measures solubility directlyfrom powder
Guillem Peybernès, Romain Grossier, Frédéric Villard, Philippe Letellier,Mehdi Lagaize, Nadine Candoni, Stéphane Veesler
To cite this version:Guillem Peybernès, Romain Grossier, Frédéric Villard, Philippe Letellier, Mehdi Lagaize, et al.. Mi-crofluidics set-up rapidly measures solubility directly from powder. Organic Process Research andDevelopment, American Chemical Society, 2018, 22, pp.1856-1860. �10.1021/acs.oprd.8b00300�. �hal-01899746v2�

Microfluidics set-up rapidly measures solubility directly from powder
Guillem Peybernès1,2, Romain Grossier1, Frédéric Villard2, Philippe Letellier2, Mehdi Lagaize1, Nadine
Candoni1, Stéphane Veesler1*,
1CNRS, Aix-Marseille University, CINaM (Centre Interdisciplinaire de Nanosciences de Marseille), Campus
de Luminy, Case 913, F-13288 Marseille Cedex 09, France, 2Technologie Servier, 27 Rue EugèneVignat,45000 Orléans, France
FOR TABLE OF CONTENTS ONLY
Microfluidics set-up rapidly measures solubility directly from powder
Guillem Peybernès1,2, Romain Grossier1, Frédéric Villard2, Philippe Letellier2, Mehdi Lagaize1, Nadine
Candoni1, Stéphane Veesler1*,
1CNRS, Aix-Marseille University, CINaM (Centre Interdisciplinaire de Nanosciences de Marseille), Campus
de Luminy, Case 913, F-13288 Marseille Cedex 09, France, 2Technologie Servier, 27 Rue EugèneVignat,45000 Orléans, France
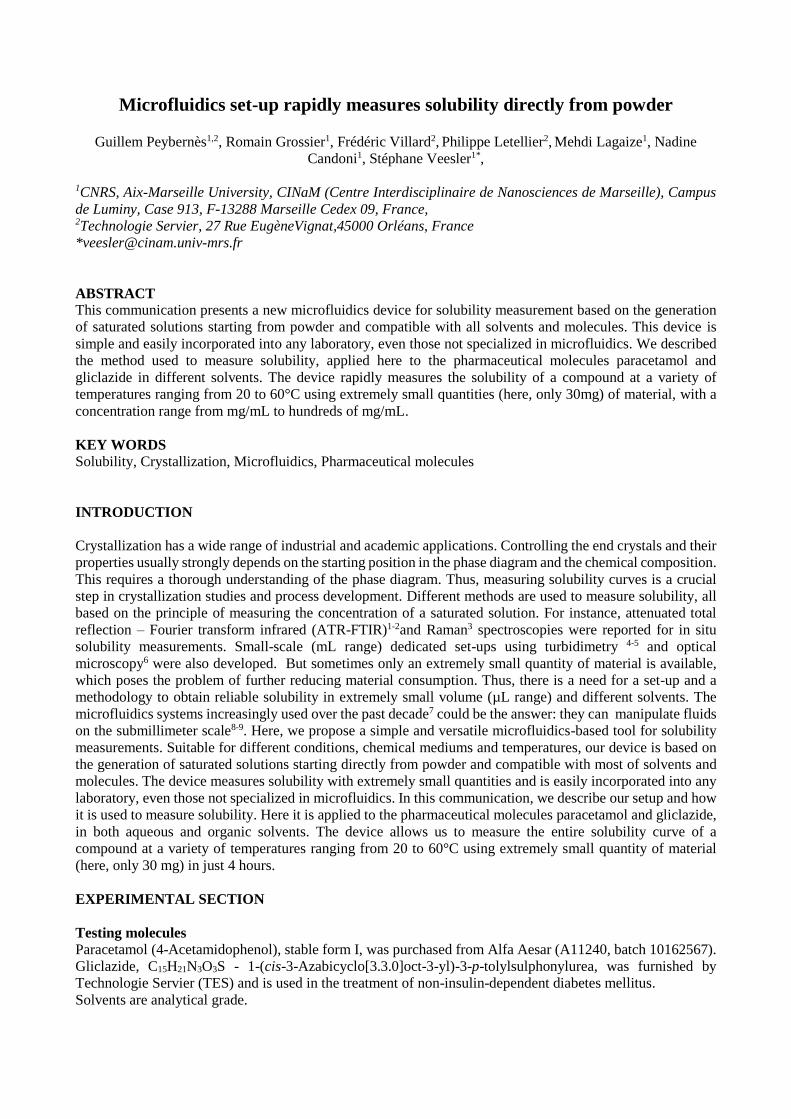
ABSTRACT
This communication presents a new microfluidics device for solubility measurement based on the generation
of saturated solutions starting from powder and compatible with all solvents and molecules. This device is
simple and easily incorporated into any laboratory, even those not specialized in microfluidics. We described
the method used to measure solubility, applied here to the pharmaceutical molecules paracetamol and
gliclazide in different solvents. The device rapidly measures the solubility of a compound at a variety of
temperatures ranging from 20 to 60°C using extremely small quantities (here, only 30mg) of material, with a
concentration range from mg/mL to hundreds of mg/mL.
KEY WORDS
Solubility, Crystallization, Microfluidics, Pharmaceutical molecules
INTRODUCTION
Crystallization has a wide range of industrial and academic applications. Controlling the end crystals and their
properties usually strongly depends on the starting position in the phase diagram and the chemical composition.
This requires a thorough understanding of the phase diagram. Thus, measuring solubility curves is a crucial
step in crystallization studies and process development. Different methods are used to measure solubility, all
based on the principle of measuring the concentration of a saturated solution. For instance, attenuated total
reflection – Fourier transform infrared (ATR-FTIR)1-2and Raman3 spectroscopies were reported for in situ
solubility measurements. Small-scale (mL range) dedicated set-ups using turbidimetry 4-5 and optical
microscopy6 were also developed. But sometimes only an extremely small quantity of material is available,
which poses the problem of further reducing material consumption. Thus, there is a need for a set-up and a
methodology to obtain reliable solubility in extremely small volume (µL range) and different solvents. The
microfluidics systems increasingly used over the past decade7 could be the answer: they can manipulate fluids
on the submillimeter scale8-9. Here, we propose a simple and versatile microfluidics-based tool for solubility
measurements. Suitable for different conditions, chemical mediums and temperatures, our device is based on
the generation of saturated solutions starting directly from powder and compatible with most of solvents and
molecules. The device measures solubility with extremely small quantities and is easily incorporated into any
laboratory, even those not specialized in microfluidics. In this communication, we describe our setup and how
it is used to measure solubility. Here it is applied to the pharmaceutical molecules paracetamol and gliclazide,
in both aqueous and organic solvents. The device allows us to measure the entire solubility curve of a
compound at a variety of temperatures ranging from 20 to 60°C using extremely small quantity of material
(here, only 30 mg) in just 4 hours.
EXPERIMENTAL SECTION
Testing molecules
Paracetamol (4-Acetamidophenol), stable form I, was purchased from Alfa Aesar (A11240, batch 10162567).
Gliclazide, C15H21N3O3S - 1-(cis-3-Azabicyclo[3.3.0]oct-3-yl)-3-p-tolylsulphonylurea, was furnished by
Technologie Servier (TES) and is used in the treatment of non-insulin-dependent diabetes mellitus.
Solvents are analytical grade.
Microfluidics set-up
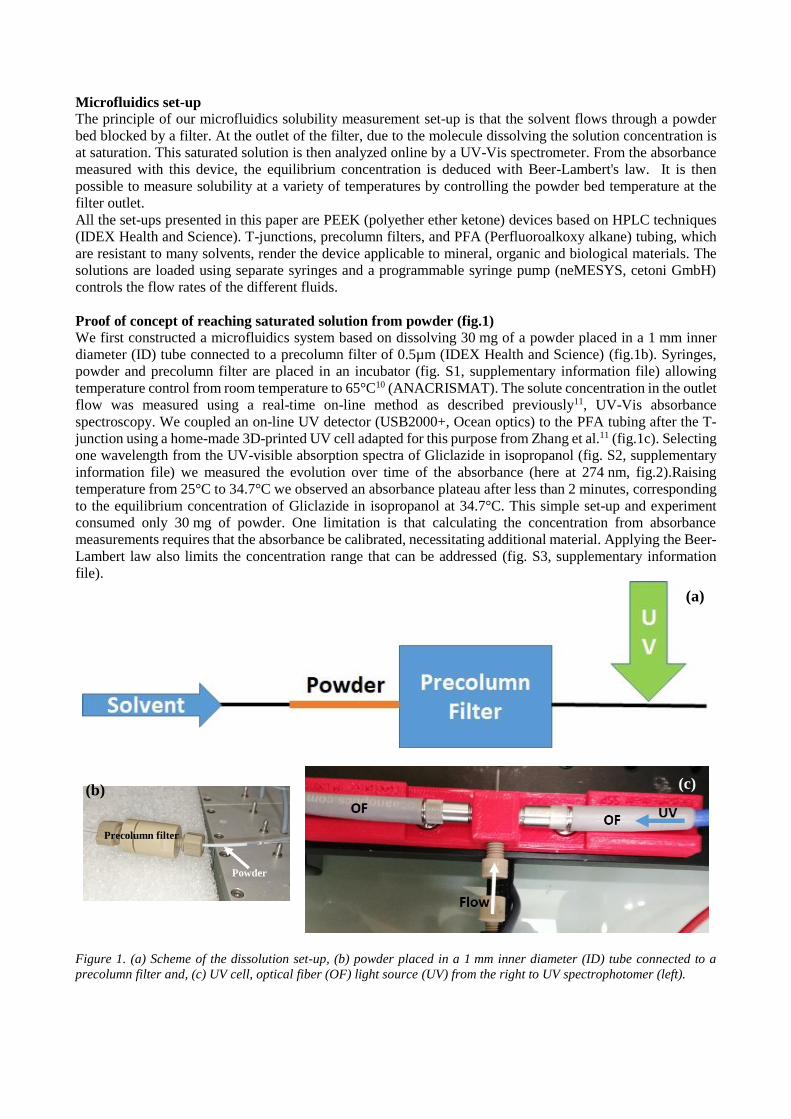
The principle of our microfluidics solubility measurement set-up is that the solvent flows through a powder
bed blocked by a filter. At the outlet of the filter, due to the molecule dissolving the solution concentration is
at saturation. This saturated solution is then analyzed online by a UV-Vis spectrometer. From the absorbance
measured with this device, the equilibrium concentration is deduced with Beer-Lambert's law. It is then
possible to measure solubility at a variety of temperatures by controlling the powder bed temperature at the
filter outlet.
All the set-ups presented in this paper are PEEK (polyether ether ketone) devices based on HPLC techniques
(IDEX Health and Science). T-junctions, precolumn filters, and PFA (Perfluoroalkoxy alkane) tubing, which
are resistant to many solvents, render the device applicable to mineral, organic and biological materials. The
solutions are loaded using separate syringes and a programmable syringe pump (neMESYS, cetoni GmbH)
controls the flow rates of the different fluids.
Proof of concept of reaching saturated solution from powder (fig.1)
We first constructed a microfluidics system based on dissolving 30 mg of a powder placed in a 1 mm inner
diameter (ID) tube connected to a precolumn filter of 0.5µm (IDEX Health and Science) (fig.1b). Syringes,
powder and precolumn filter are placed in an incubator (fig. S1, supplementary information file) allowing
temperature control from room temperature to 65°C10 (ANACRISMAT). The solute concentration in the outlet
flow was measured using a real-time on-line method as described previously11, UV-Vis absorbance
spectroscopy. We coupled an on-line UV detector (USB2000+, Ocean optics) to the PFA tubing after the T-
junction using a home-made 3D-printed UV cell adapted for this purpose from Zhang et al.11 (fig.1c). Selecting
one wavelength from the UV-visible absorption spectra of Gliclazide in isopropanol (fig. S2, supplementary
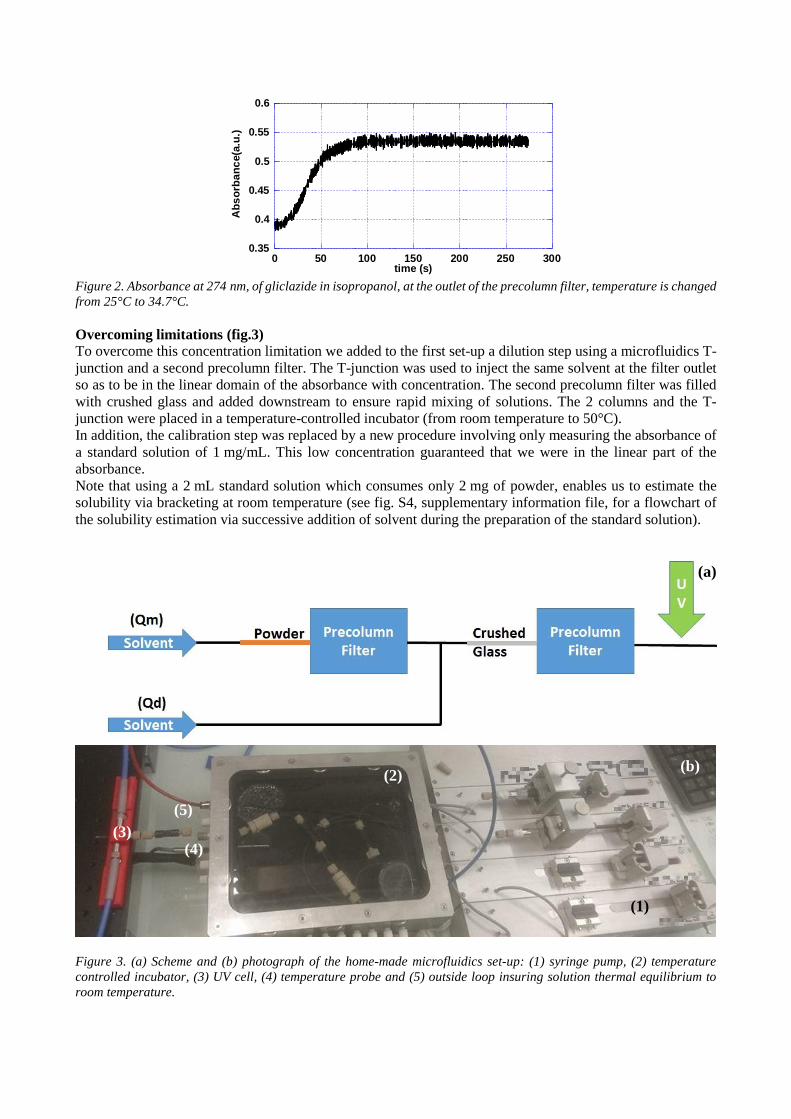
information file) we measured the evolution over time of the absorbance (here at 274 nm, fig.2).Raising
temperature from 25°C to 34.7°C we observed an absorbance plateau after less than 2 minutes, corresponding
to the equilibrium concentration of Gliclazide in isopropanol at 34.7°C. This simple set-up and experiment
consumed only 30 mg of powder. One limitation is that calculating the concentration from absorbance
measurements requires that the absorbance be calibrated, necessitating additional material. Applying the Beer-
Lambert law also limits the concentration range that can be addressed (fig. S3, supplementary information
file).
Figure 1. (a) Scheme of the dissolution set-up, (b) powder placed in a 1 mm inner diameter (ID) tube connected to a
precolumn filter and, (c) UV cell, optical fiber (OF) light source (UV) from the right to UV spectrophotomer (left).
(a)
(c) (b)
Precolumn filter
Powder
0.35
0.4
0.45
0.5
0.55
0.6
0 50 100 150 200 250 300
Ab
so
rba
nc
e(a
.u.)
time (s) Figure 2. Absorbance at 274 nm, of gliclazide in isopropanol, at the outlet of the precolumn filter, temperature is changed
from 25°C to 34.7°C.
Overcoming limitations (fig.3) To overcome this concentration limitation we added to the first set-up a dilution step using a microfluidics T-
junction and a second precolumn filter. The T-junction was used to inject the same solvent at the filter outlet
so as to be in the linear domain of the absorbance with concentration. The second precolumn filter was filled
with crushed glass and added downstream to ensure rapid mixing of solutions. The 2 columns and the T-
junction were placed in a temperature-controlled incubator (from room temperature to 50°C).
In addition, the calibration step was replaced by a new procedure involving only measuring the absorbance of
a standard solution of 1 mg/mL. This low concentration guaranteed that we were in the linear part of the
absorbance.
Note that using a 2 mL standard solution which consumes only 2 mg of powder, enables us to estimate the
solubility via bracketing at room temperature (see fig. S4, supplementary information file, for a flowchart of
the solubility estimation via successive addition of solvent during the preparation of the standard solution).
Figure 3. (a) Scheme and (b) photograph of the home-made microfluidics set-up: (1) syringe pump, (2) temperature
controlled incubator, (3) UV cell, (4) temperature probe and (5) outside loop insuring solution thermal equilibrium to
room temperature.
(a)
(b)
(3)
(2)
(1)
(4)
(5)

Solubility measurement using the set-up The experimental protocol consists in first measuring the intensity of the UV light transmitted by the pure
solvent solution (I0) and by the standard solution (Istandard) as a reference. Second, the solvent is injected at a
given flow rate (Qm) to dissolve the powder placed in the tube and the transmitted intensity is measured and
compared to that of the standard solution. Third, this solution is diluted by a stepwise increase of the flow rate
of the solvent (Qd) at the filter outlet until the transmitted intensities of diluted and standard solutions match
(fig.4a), for an application see figure 4b. When transmitted intensities of diluted and standard solutions match,
the solubility value (Cs) is given by:
Cs=Cstandard / (Qm/(Qm+Qd)) (Eq.1)
where Cstandard is the concentration of the standard solution.
Note that the dilution is defined by the ratio Qm/(Qm+Qd) of Eq.1 with Qm and Qd variables. In practice, it is
impossible to have exact matching between transmitted intensities of diluted and standard solutions; thus, to
be rigorous, a correction needs to be made using the absorbances according to Eq.2 (here we suppose that the
Beer-Lambert law applies).
Cmeas / Ameas = Cstandard / Astandard (Eq.2)
Where Astandard = -log (Istandard /I0) and Ameas = -log (Imeas /I0) represent the absorbances of the standard solution
and experimental measurement (fig. 4).
Cs=Cmeas / (Qm/(Qm+Qd)) (Eq.3)
This operation is repeated for all temperatures and thus provides the solubility at a variety of temperatures in
a given solvent. Using this method it is also possible, when powder is not completely dissolved, to change the
solvent by replacing syringes with others containing a new solvent. It takes only 4 hours and approximately
30 mg of powder to obtain one solubility curve for a solvent at 6 different temperatures ranging from 20 to
60°C.
Note that adding a dilution step prevents the solution from unwanted nucleation events during the
measurement.
1 10
4
1.5 104
2 104
2.5 104
3 104
3.5 104
1000 1500 2000 2500 3000 3500 4000
Tra
nsm
itte
d In
ten
sit
y (
a.u
.)
Time (s)
(b)
(1)
(2)
(3)
(4)
(6)(5)Istandard
Figure 4. (a) Principle of the stepwise dilution for solubility measurement, and (b) Evolution of the transmitted intensity
at 274 nm as a function of time with increasing dilution ratio, with I0= 40268, Istandard=30165 and Imes=30200 in a.u..
Plateau (1) corresponds to Qm=1000µL/h and Qd=1000µL/h, (2) to Qm=500µL/h and Qd=1000µL/h, , (3) to Qm=500µL/h
and Qd=1500µL/h, , (4) to Qm=500µL/h and Qd=2000µL/h, , (5) to Qm=500µL/h and Qd=2250µL/h and (6) to
Qm=500µL/h and Qd=2350µL/h.
(a)
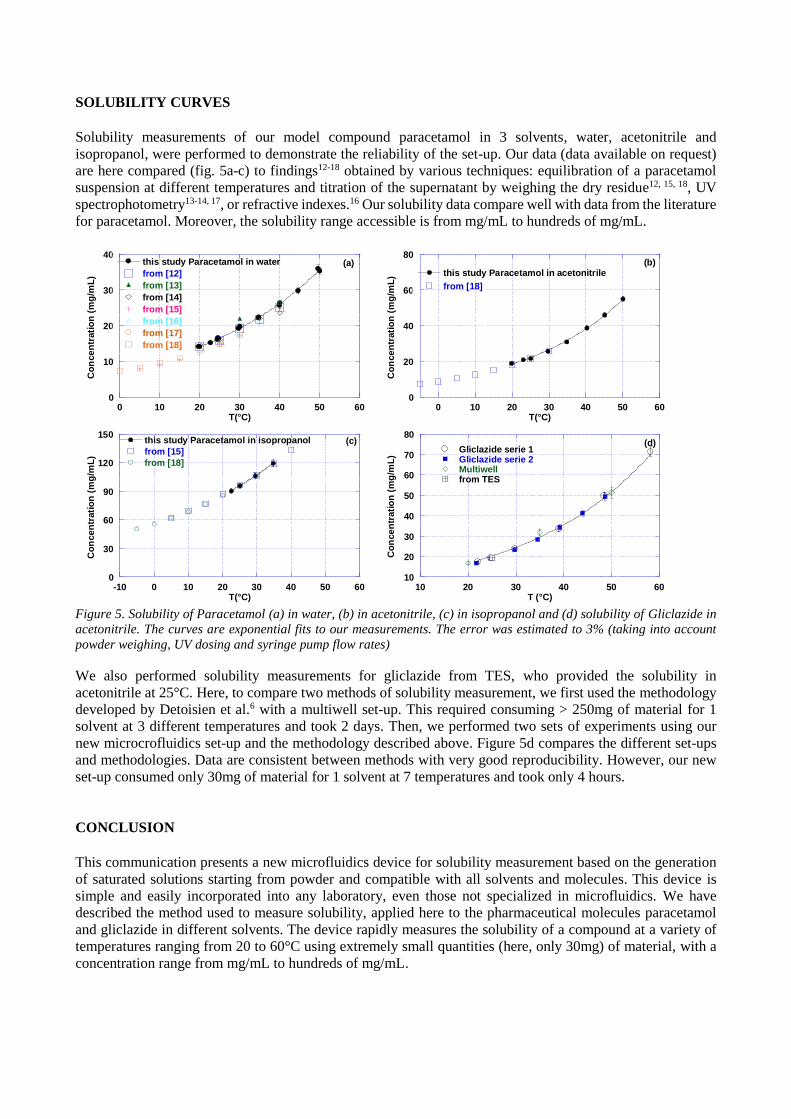
SOLUBILITY CURVES Solubility measurements of our model compound paracetamol in 3 solvents, water, acetonitrile and
isopropanol, were performed to demonstrate the reliability of the set-up. Our data (data available on request)
are here compared (fig. 5a-c) to findings12-18 obtained by various techniques: equilibration of a paracetamol
suspension at different temperatures and titration of the supernatant by weighing the dry residue12, 15, 18, UV
spectrophotometry13-14, 17, or refractive indexes.16 Our solubility data compare well with data from the literature
for paracetamol. Moreover, the solubility range accessible is from mg/mL to hundreds of mg/mL.
0
10
20
30
40
0 10 20 30 40 50 60
this study Paracetamol in water
from [12]
from [13]
from [14]
from [15]
from [16]
from [17]
from [18]
Co
nce
ntr
ati
on
(m
g/m
L)
T(°C)
(a)
0
20
40
60
80
0 10 20 30 40 50 60
this study Paracetamol in acetonitrile
from [18]
Co
nce
ntr
ati
on
(m
g/m
L)
T(°C)
(b)
0
30
60
90
120
150
-10 0 10 20 30 40 50 60
this study Paracetamol in isopropanol
from [15]
from [18]
Co
nce
ntr
ati
on
(m
g/m
L)
T(°C)
(c)
10
20
30
40
50
60
70
80
10 20 30 40 50 60
Gliclazide serie 1Gliclazide serie 2Multiwellfrom TES
Co
nce
ntr
ati
on
(m
g/m
L)
T (°C)
(d)
Figure 5. Solubility of Paracetamol (a) in water, (b) in acetonitrile, (c) in isopropanol and (d) solubility of Gliclazide in
acetonitrile. The curves are exponential fits to our measurements. The error was estimated to 3% (taking into account
powder weighing, UV dosing and syringe pump flow rates)
We also performed solubility measurements for gliclazide from TES, who provided the solubility in
acetonitrile at 25°C. Here, to compare two methods of solubility measurement, we first used the methodology
developed by Detoisien et al.6 with a multiwell set-up. This required consuming > 250mg of material for 1
solvent at 3 different temperatures and took 2 days. Then, we performed two sets of experiments using our
new microcrofluidics set-up and the methodology described above. Figure 5d compares the different set-ups
and methodologies. Data are consistent between methods with very good reproducibility. However, our new
set-up consumed only 30mg of material for 1 solvent at 7 temperatures and took only 4 hours.
CONCLUSION
This communication presents a new microfluidics device for solubility measurement based on the generation
of saturated solutions starting from powder and compatible with all solvents and molecules. This device is
simple and easily incorporated into any laboratory, even those not specialized in microfluidics. We have
described the method used to measure solubility, applied here to the pharmaceutical molecules paracetamol
and gliclazide in different solvents. The device rapidly measures the solubility of a compound at a variety of
temperatures ranging from 20 to 60°C using extremely small quantities (here, only 30mg) of material, with a
concentration range from mg/mL to hundreds of mg/mL.

ACKNOWLEDGMENTS: We thank Technologie Servier for financial support. We are grateful to T.
Bactivelane (CINaM) and M. Audiffren (ANACRISMAT) for technical assistance. We thank Marjorie Sweetko
for English revision.
SUPPLEMENTARY MATERIAL
See supplementary material for Temperature controlled incubator, UV-visible absorption
spectra of Gliclazide in isopropanol and the flowchart of the solubility estimation.
REFERENCES:
1. Dunuwila, D. D.; Berglund, K. A., ATR FTIR spectroscopy for in situ measurement of
supersaturation. J. Cryst. Growth 1997, 179 (1-2), 185-193.
2. Lewiner F.; Klein J.P.; Puel F.; Févotte G., On-line ATR FTIR measurement of
supersaturation during solution crystallization processes. Calibration and applications on three
solute/solvent systems. Chem. Engineering Science 2001, 56, 2069-2084.
3. Schwartz A.M.; Berglund K.A., The use of Raman spectroscopy for in situ monitoring of
lysozyme concentration during crystallization in a hanging drop. J. Crystal Growth 1999, 203, 599-
603.
4. Yi, Y.; Hatziavramidis, D.; Myerson, A. S.; Waldo, M.; Beylin, V. G.; Mustakis, J.,
Development of a Small-Scale Automated Solubility Measurement Apparatus. Ind. Eng. Chem. Res.
2005, 44 (15), 5427-5433.
5. Jiang, S.; Ter Horst, J. H., Crystal Nucleation Rates from Probability Distributions of
Induction Times. Cryst. Growth Des. 2011, 11 (1), 256-261.
6. Detoisien, T.; Forite, M.; Taulelle, P.; Teston, J.; Colson, D.; Klein, J. P.; Veesler, S., A Rapid
Method for Screening Crystallization Conditions and Phases of an Active Pharmaceutical Ingredient.
Organic Process Research & Development 2009, 13 (6), 1338-1342.
7. Leng J.; Salmon J.B., Microfluidic crystallization. Lab on a Chip 2009, 9, 24-34.
8. Squires, T. M.; Quake, S. R., Microfluidics: Fluid physics at the nanoliter scale. Rev. Mod.
Phys. 2005, 77 (3), 977.
9. Lorber N.; Sarrazin F.; Guillot P.; Panizza P.; Colin A.; Pavageau B.; Hany C.; Maestro P.;
Marre S.; Delclos T.; Aymonier C; Subra P.; Prat L.; Gourdon C.; Mignard E, Some recent advances
in the design and the use of miniaturized droplet-based continuous process: Applications in chemistry
and high-pressure microflows Lab on a Chip 2011, 11, 779-787.
10. Zhang, S.; Ferté, N.; Candoni, N.; Veesler, S., Versatile Microfluidic Approach to
Crystallization. Organic Process Research & Development 2015, 19, 1837-1841.
11. Zhang, S.; Gerard, C. J. J.; Ikni, A.; Ferry, G.; Vuillard, L. M.; Boutin, J. A.; Ferte, N.;
Grossier, R.; Candoni, N.; Veesler, S., Microfluidic platform for optimization of crystallization
conditions. J. Cryst. Growth 2017, 472, 18-28.
12. Bustamante, P.; Romero, S.; Peña, A.; Escalera, B.; Reillo, A., Enthalpy–entropy
compensation for the solubility of drugs in solvent mixtures: Paracetamol, acetanilide, and nalidixic
acid in dioxane–water. J. Pharm. Sci. 1998, 87 (12), 1590-1596.
13. Nagai, T.; Prakongpan, S., Solubility of Acetaminophen in Cosolvents. Chem. Pharm. Bull.
(Tokyo) 1984, 32 (1), 340-343.
14. Bustamante, P.; Romero, S.; Reillo, A., Thermodynamics of Paracetamol in Amphiprotic and
Amphiprotic-aprotic Solvent Mixtures. Pharmaceutical Sciences 1995, 1, 505-507.
15. Hojjati, H.; Rohani, S., Measurement and Prediction of Solubility of Paracetamol in
Water−Isopropanol Solution. Part 1. Measurement and Data Analysis. Organic Process Research &
Development 2006, 10 (6), 1101-1109.
16. Jiménez, J. A.; Martínez, F., Thermodynamic Study of the Solubility of Acetaminophen in
Propylene Glycol + Water Cosolvent Mixtures. J. Braz. Chem. Soc. 2006, 17, 125-134.

17. Jouyban, A.; Chan, H.-K.; Chew, N. Y. K.; Khoubnasabjafari, M.; Acree, J. W. E., Solubility
Prediction of Paracetamol in Binary and Ternary Solvent Mixtures Using Jouyban–Acree
Model. Chem. Pharm. Bull. 2006, 54 (4), 428-431.
18. Granberg, R. A.; Rasmuson, Å. C., Solubility of Paracetamol in Pure Solvents. J. Chem. Eng.
Data 1999, 44 (6), 1391-1395.

Supplementary Information File
Microfluidics set-up rapidly measures solubility directly from powder.
Guillem Peybernès1,2, Romain Grossier1, Frédéric Villard2, Philippe Letellier2, Mehdi Lagaize1, Nadine
Candoni1, Stéphane Veesler1,
1CNRS, Aix-Marseille University, CINaM (Centre Interdisciplinaire de Nanosciences de Marseille),
Campus de Luminy, Case 913, F-13288 Marseille Cedex 09, France, 2Technologie Servier, 27 Rue EugèneVignat,45000 Orléans, France
Figure S1. Temperature controlled incubator.
0
0.5
1
1.5
220 230 240 250 260 270 280 290 300
Ab
so
rba
nc
e (
a.u
.)
(nm) Figure S2. UV-visible absorption spectra of Gliclazide in isopropanol at room temperature, light source: DT-
MINI-2-GS and spectrophotometer USB2000+ from Ocean Optics.

0
0.1
0.2
0.3
0.4
0.5
0.6
0 1 2 3 4 5 6
y = 0.10158x
Ab
so
rban
ce (
a.u
.)
Concentration(mg/mL) Figure S3. Linear part of the absorbance curve in function of the Gliclazide concentration in isopropanol at 274nm
and at room temperature, light source: DT-MINI-2-GS and spectropotometer USB2000+ from Ocean Optics.
Figure S4. Flowchart of the solubility estimation (bracketing) via successive addition of solvent during the
preparation of the standard solution.