I&M Bank Annual Report 2011
100
-
Upload
khangminh22 -
Category
Documents
-
view
1 -
download
0
Transcript of I&M Bank Annual Report 2011


CONTENTS PAGE
Board of directors 2
Senior management 4
Directors, officials and administration 6
I&M news 8
Chairman’s statement 13
Report of the directors 16
Statement on corporate governance 17
Statement of directors’ responsibilities 24
Report of the independent auditors 25
Consolidated statement of comprehensive income 26
Company statement of comprehensive income 28
Consolidated statement of financial position 29
Company statement of financial position 30
Consolidated statement of cash flows 31
Company statement of cash flows 32
Consolidated statement of changes in equity 33
Company statement of changes in equity 35
Notes to the consolidated financial statements 37
CSR news 93

Seated Left to Right:M SoundararajanPCM KibatiSBR Shah, MBS (Chairman) Christina GabenerNP Kothari (Secretary)
Standing Left to Right: Arun S Mathur (CEO)GMM AïnachèSarit S Raja Shah (Executive Director)Sachit S Raja Shah
Board of directors
PAGE 2 | I&M BANK LTD REPORT & CONSOLIDATED FINANCIAL STATEMENTS 2011

PAGE 3 | I&M BANK LTD REPORT & CONSOLIDATED FINANCIAL STATEMENTS 2011
Missing in photo:
EM Kimani MBS
MJ Karanja

I&M Senior Management StaffSenior management
Joseph Njomo, Head of Operations
Gauri Gupta,Head of Corporate & Strategic Planning
Henry Kirimania,Head of Treasury
Ruma Shah,Head of Internal Audit
Suprio Sen Gupta, Head of Marketing & Product Development
PAGE 4 | I&M BANK LTD REPORT & CONSOLIDATED FINANCIAL STATEMENTS 2011
Samuel Mbori,Head of Special Projects

VS Sekhara Reddy, Head of Cards and Alternate Channels
L A Sivaramakrishnan, Head of Business Development
Ravi Ramamoorthy, Head of Corporate Banking
Rohit Gupta, Head of Information & Communication Technology
Lucy Thegeya, Head of Business Support
Srinivasan Parthasarthy,Head of Commercial Banking
PAGE 5 | I&M BANK LTD REPORT & CONSOLIDATED FINANCIAL STATEMENTS 2011

DIRECTORS
SBR Shah, MBS (Chairman)Sarit S Raja Shah (Executive Director)MJ Karanja Sachit S Raja Shah EM Kimani MBSPCM KibatiM Soundararajan*Christina Gabener**(Appointed 13 September 2011)GMM Aïnachè***(Appointed 8 December 2011)Dr EO Kidero (Resigned 30 May 2011)Ms C Boeing**(Ceased 1 July 2011 - Alternate: E Kaleja**)Ghislain de Valon***(Ceased 29 August 2011)
* Indian ** German *** French
SECRETARY
NP Kothari – FCPS (Kenya) AUDITORS
KPMG Kenya 16th Floor, Lonrho House Standard Street PO Box 40612 00100 Nairobi GPO REGISTERED OFFICE
I&M Bank House2nd Ngong AvenueP O Box 3023800100 Nairobi GPO
CORRESPONDENT BANKS
ABSA Bank Commerzbank AGStandard Chartered Bank Deutsche Bank AGBarclays Bank PLC Citibank NA HSBC ICICI Bank UBS AG Bank One, Mauritius I&M Bank (T) Limited JP Morgan Chase BHF Bank The Standard Bank of South Africa
Directors, officials and administration
PAGE 6 | I&M BANK LTD REPORT & CONSOLIDATED FINANCIAL STATEMENTS 2011

I&M Bank House I&M Bank Tower Sarit Centre 2nd Ngong Avenue Kenyatta Avenue WestlandsPO Box 30238 PO Box 30238 PO Box 3023800100 Nairobi GPO 0100 Nairobi GPO 00100 Nairobi GPO
Ansh Plaza Biashara Bank Building Changamwe RoadBiashara Street Nyerere Avenue Industrial AreaPO Box 30238 PO Box 86357 PO Box 3023800100 Nairobi GPO 80100 Mombasa 0500 Nairobi
Tivoli Centre Karen Connection Panari CentreCourt Road Karen Road Mombasa RoadPO Box 424 PO Box 30238 PO Box 3023840100 Kisumu 00100 Nairobi GPO 00100 Nairobi GPO
Centre Point Ongata Rongai Wilson AirportParklands Road Rongai Business Centre Pewin HousePO Box 30238 PO Box 30238 PO Box 3023800100 Nairobi GPO 00100 Nairobi GPO 00100 Nairobi GPO
South C Shopping Centre Nyali Cinemax Langata LinkPO Box 30238 PO Box 86357 PO Box 3023800100 Nairobi GPO 80100 Mombasa 00100 Nairobi GPO
Gitanga Road Zion Mall Polo CentreLavington Uganda Road Kenyatta AvenuePO Box 30238 PO Box 9362 PO Box 1844500100 Nairobi GPO 30100 Eldoret 20100 Nakuru
14 Riverside DriveRiverside DrivePO Box 3023800100 Nairobi GPO
Branches
PAGE 7 | I&M BANK LTD REPORT & CONSOLIDATED FINANCIAL STATEMENTS 2011

I&M BANK LAUNCHES SELECT BANKING
I&M Bank has launched Select Banking to recognise its highest category of individual customers and to offer them personalised and differentiated services. Select status is offered by invitation only and accords the Select customer many recognition benefits, offers several complimentary and concessional services and makes some specialised products available to them.
Select customers have exclusive access to the new I&M Select Centre, situated at Hanover, 14 riverside, Riverside Drive, Nairobi. The I&M Select Centre is an exclusive servicing facility where customers can do their everyday banking transactions and access specialised products and services available to Select customers. The Select Centre also offers meeting room facilities, lounge facilities and business centre facilities including an internet hotzone for exclusive and complimentary use by Select customers.
MALAIKA ACCOUNT
The new Malaika Account is an account designed exclusively to suit the financial requirements and lifestyle of women. It is a personal transaction account, with an optional free linked auto-facility to save monthly as a Recurring Deposit earning high interest rates.
The Malaika Account recognises the special status of women with special requirements and offers a package of features and benefits that does just that. The account also comes with a specially designed personalised membership card that entitles ladies to attractive discounts at a host of places where they would go to pamper themselves.
NOBLE ACCOUNT
I&M Bank’s new Noble Account is a transaction account in Kenya Shillings or foreign currency, specifically for any organisation registered as an NGO , Charitable organisation and other such organisations. The Account comes with a variety of features including no ledger fees, set up of online payment facility to receive payment through the Bank’s Webpay E-Commerce platform , interest earning balances and a dedicated relationship manager.
I&M news
PAGE 8 | I&M BANK LTD REPORT & CONSOLIDATED FINANCIAL STATEMENTS 2011
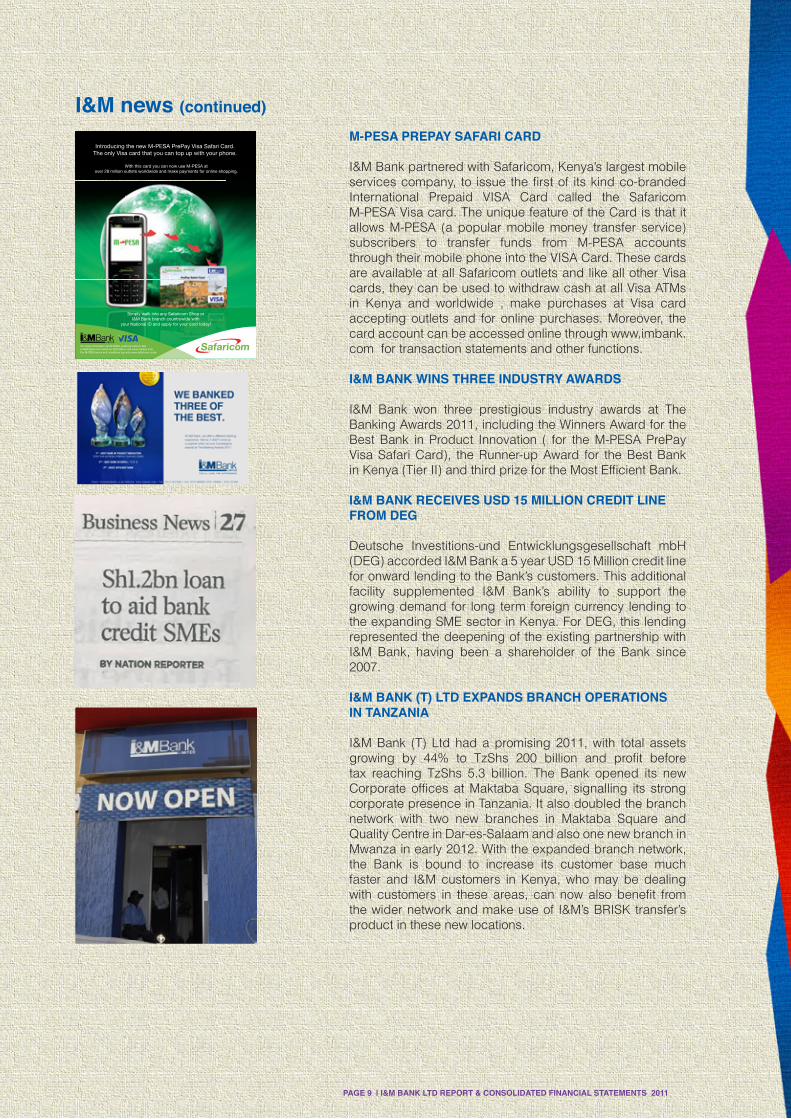
M-PESA PREPAY SAFARI CARD
I&M Bank partnered with Safaricom, Kenya’s largest mobile services company, to issue the first of its kind co-branded International Prepaid VISA Card called the Safaricom M-PESA Visa card. The unique feature of the Card is that it allows M-PESA (a popular mobile money transfer service) subscribers to transfer funds from M-PESA accounts through their mobile phone into the VISA Card. These cards are available at all Safaricom outlets and like all other Visa cards, they can be used to withdraw cash at all Visa ATMs in Kenya and worldwide , make purchases at Visa card accepting outlets and for online purchases. Moreover, the card account can be accessed online through www.imbank.com for transaction statements and other functions.
I&M BANK WINS THREE INDUSTRY AWARDS
I&M Bank won three prestigious industry awards at The Banking Awards 2011, including the Winners Award for the Best Bank in Product Innovation ( for the M-PESA PrePay Visa Safari Card), the Runner-up Award for the Best Bank in Kenya (Tier II) and third prize for the Most Efficient Bank.
I&M BANK RECEIVES USD 15 MILLION CREDIT LINE FROM DEG
Deutsche Investitions-und Entwicklungsgesellschaft mbH (DEG) accorded I&M Bank a 5 year USD 15 Million credit line for onward lending to the Bank’s customers. This additional facility supplemented I&M Bank’s ability to support the growing demand for long term foreign currency lending to the expanding SME sector in Kenya. For DEG, this lending represented the deepening of the existing partnership with I&M Bank, having been a shareholder of the Bank since 2007.
I&M BANK (T) LTD EXPANDS BRANCH OPERATIONS IN TANZANIA
I&M Bank (T) Ltd had a promising 2011, with total assets growing by 44% to TzShs 200 billion and profit before tax reaching TzShs 5.3 billion. The Bank opened its new Corporate offices at Maktaba Square, signalling its strong corporate presence in Tanzania. It also doubled the branch network with two new branches in Maktaba Square and Quality Centre in Dar-es-Salaam and also one new branch in Mwanza in early 2012. With the expanded branch network, the Bank is bound to increase its customer base much faster and I&M customers in Kenya, who may be dealing with customers in these areas, can now also benefit from the wider network and make use of I&M’s BRISK transfer’s product in these new locations.
I&M news (continued)
PAGE 9 | I&M BANK LTD REPORT & CONSOLIDATED FINANCIAL STATEMENTS 2011

I&M news (continued)
BANK ONE LTD – MAURITIUS
Despite challenging economic conditions, I&M’s sister bank Bank One, Mauritius posted better results in 2011, delivering post tax profits of MRs 175m in 2011 as against MRs 168m in 2010. However, excluding exceptional gains of Rs 59m in 2010 out of recovery of assets earlier written off, the profits in 2011 were 61% higher than last year’s profits.
During 2011, Bank One was the first bank to launch the Prepaid Card in Mauritius. The POSH Cards allow for planned expenditure on travel, education as well as salary or other benefit payments. Neo Investments, a unique Capital guaranteed Mauritian rupee investment product, investing on the domestic stock market, was launched. The first Emma Awards were held in March 2011 to acclaim women having excelled in their specific field of endeavour.
The Quatre Bornes branch was relocated, bank products upgraded, bank processes re-engineered and back office activities relocated. The branch network is expected to grow further in 2012 with 2 new branch openings in the West and in the North.
Bank One is in well advanced negotiations to acquire a significant stake in a bank regionally along with strategic partners and institutional investors. Financial closure is expected during 2012.
PAGE 10 | I&M BANK LTD REPORT & CONSOLIDATED FINANCIAL STATEMENTS 2011

I&M news (continued)
I&M Bank now opening in Nakuru...
Nakuru Branch
Eldoret Branch
Riverside Drive Branch, Nairobi.
I&M BANK KENYA OPENS 3 NEW BRANCHES
In line with Bank’s strategic objectives regarding local expansion within Kenya, 2011 saw I&M Bank open 3 new branches in Eldoret, Nakuru and Nairobi’s Riverside Drive, increasing its branch network from 16 to 19.
PAGE 11 | I&M BANK LTD REPORT & CONSOLIDATED FINANCIAL STATEMENTS 2011


The little engine that could
As I reflect on the years past, I am reminded of the story of the little engine. This little engine had been built to pull a few cars at the station yard. One morning when a long train of freight cars needed to go over the hill, the little engine stepped up to the challenge, put itself in front of the great heavy train and began to bravely puff faster and faster, “I think I can, I think I can, I think I can.” As it neared the top of the hill, it kept the mantra going. It reached the top and then went on the down slope in a triumph jubilation saying “I thought I could, I thought I could, I thought I could.”
That story incredibly captures the spirit and history of I&M Bank. The one branch bank that stepped up to the challenges of a very competitive industry in 1996 has since grown by leaps and bounds and today boasts of a branch network of 19 in Kenya, 14 in Mauritius and 6 in Tanzania. Likewise, our total assets have grown from KShs. 4.8 billion in 1996 to KShs. 108.06 billion as at end of 2011. This incredible journey and growth could not have been possible without the Bank’s loyal customers and partners who have supported it over the years. Our desire to better serve our customers is the reason that has kept the Bank focused on its core principles of offering premium banking experiences to all customers aimed at exceeding their expectations in terms of quality of service and by offering a wide choice of innovative products.
The year that was 2011
2011 was an especially tough year not only for Kenya, but also globally as a well. The financial crisis continued in the Eurozone, with more countries seeking bail outs, the rippling effects of which have in some way been felt in Africa, as funding budgets were cut and lowered demand for exports to these markets. We also saw the revolutionary protests against the financial institutions in the Americas spread to parts of Europe. Closer to home, there had been the fear that the uprising in the Middle East & North Africa would spread to the rest of Africa, but thankfully, that did not ensue.
In Kenya, the greatest challenge was the continuous rise in inflation, resulting mainly from the effects of the rising costs of oil and food. The country’s inflation rate rose from 5.42 per cent in January 2011 to 18.93 per cent in December 2011. To add to our tribulations, the Kenyan Shilling was also very volatile for most part of the year, and depreciated against most currencies in 2011. As a result, in order to tame the rising cost of living, the Central Bank of Kenya increased the Central Bank Rate to 18% and introduced further monetary tightening measures to tighten liquidity in the market. Consequently, commercial banks gradually increased the lending rates reaching an average of 20.04 per cent as at December 2011.The effects of these measures have certainly been felt in all sectors of the country, and more so in real estate, which has witnessed a slowdown in the take up of new property. Undoubtedly, measures to tighten money supply are not taken positively, as costs for our borrowers goes up but, in Kenya, the measure has helped to curb speculation and hoarding of some essential commodities.
One key discussion that has generated a lot of debate is the proposed finance bill, which aims to cap the interest rates that banks levy on advances and pay to customers on deposits. However, this debate has completely drowned the voice of banks and the effects that this would have on the economy. While banks may sometimes have to vary interest rates (as we do not have a fixed rate product) , this is usually necessitated by the rise in the administrative costs of lending and deposit taking. Key among them is the indirect costs of lending and associated risks that are entirely borne by banks, and which increase significantly in an unstable economic condition. The banking industry has been highlighting issues that have resulted in increasing costs to our customers. A study conducted by independent experts, called ‘the cost of collateral’ has highlighted the challenges faced by the industry. These include costs arising out of (i) delays in registration of charges at the Companies and Land Registries; (ii) consents required from Land Control Board for agricultural land (iii) delays in getting council approvals and consents and (iv) absence of regulatory framework to use standardized legal documentation even for smaller advances requiring each case of security perfection to be referred to external law firms. While all these challenges continue, banks still have a fiduciary duty to shareholders to ensure that even in difficult operating environments, they provide a positive return for the investments shareholders have made. Additionally, a cap on interest rates reduces the risks that investors are willing to take, as the returns are lower. Banks, like all other businesses, need to make returns to make their services viable. A cap in the interest rates would therefore result in lower availability of funding to other sectors of the economy from banks, which would stifle the overall investment and growth of the economy. Fortunately, it is banks in third world countries which have been able to brave the economic storms and it is remarkable that in East Africa, the banking industry has shown improvement in critical ratios, thus providing some degree of stability in the financial sector.
Chairman’s statement
PAGE 13 | I&M BANK LTD REPORT & CONSOLIDATED FINANCIAL STATEMENTS 2011

The banking sector
Despite the volatile economic conditions, by December 2011, the total banking sector balance sheet had grown by 20.4 per cent compared to December 2010. Loans and advances to customers, which also grew by 31.5 per cent over the same period, made up 57 per cent of the total banking sector balance sheet. This growth was attributed to increased lending to trade, households and manufacturing sectors. Deposits, which are the primary source of funding for the banking sector grew by 20.3 per cent over the same period, while non-performing loans improved to a from 6.3 per cent to 4.5 per cent of gross advances. The Banking Sector also continued to expand its reach across the country with an additional 85 Bank branches excluding agency banking arrangements.
Though implemented in January 2012, one of the key achievements in the banking sector has been the introduction of the cheque truncation system (CTS), which has automated certain processes resulting in a reduction of the clearing cycle of cheques to 2 days, enabling customers to receive their money faster and makes the process more efficient for banks. We should take pride in recognising that Kenya is one of the few countries in the world to have a properly functioning cheque truncation system which requires huge capital investment and excellent project planning.
The bank
Every year, we endeavour to introduce new products and services aimed at fulfilling customer needs and enhancing the quality of their banking experience at the Bank. Keeping this in mind, we introduced four new products – (i) The Noble Account, (ii) The Step-Up Home Loan, (iii) The Malaika Account and (iv) “Select” Banking. The NOBLE Account is a modification and enhancement of our earlier BINGO account, and is a specially designed product for our Non-Governmental Organisations and Institutional clients to suit their specific needs. Likewise, our STEP -UP HOME LOAN product is a flexible variation of our existing mortgage-lending product intended for the younger homeowners. The MALAIKA account, on the other hand caters for the unique banking needs and requirements of women. We also launched the I&M SELECT services in December 2011, as our way of recognizing our high-value customers who often have different and personalised banking requirements.
2011 also saw us spread our branch network to Eldoret and Nakuru. In Nairobi we opened our 13th branch at Riverside Drive, bringing the entire I&M branch network to 19. After a year of significant efforts by our team, the Bank recently rolled out its long awaited Internet Banking platform aptly called “I - Click”. This facility has several distinct features, unique in this market, and is likely to transform the way our customers transact in the future.
One of our major achievements for 2011 has been the establishment of an Employee Share Ownership Plan (ESOP). The ESOP allowed employees of the Bank to acquire shares in the Bank. This not only improves the morale of the employees, but also gives them a reason to better support the vision and objectives of the Bank. The ESOP was extremely well received by the staff with the offer having been oversubscribed by 30%, an indication of the pride and faith that the employees have in their Bank.
During the year, the Bank augmented its long-term debt capital by signing an agreement with DEG for a 5-year credit line of USD 15.00 Million to supplement I&M Bank’s ability to support the growing demand for long-term foreign currency lending to the expanding SME sector in Kenya.
As a result of all these initiatives, it is with immense pride that I report to you on your Bank’s commendable performance in 2011. Profits for the year aggregated KShs. 3.47 billion, an increase of 37.5% from 2010. Notwithstanding the fact that 2011 was characterized by uncertainty volatility in interest and currency rates, the Bank focused on its core activities that ensured its uninterrupted growth, thereby increasing its loans portfolio by 32% to KShs. 66.36 billion and reducing gross non-performing loans by 15%. Similarly, the customer deposits grew by 25% to reach KShs. 85.21 billion. Overall the I&M Bank Group balance sheet recorded a growth of 24% and crossed the KShs. 100 billion mark to reach KShs. 108 billion. Profit before tax increased by 40% to close at KShs. 4.95 billion for the year. I&M Bank (T) and Bank One contributed 9% and 20% respectively to the Group’s total assets.
The Bank continues to improve on its financial ratios. A traditional strength of I&M Bank has been its Efficiency Ratio, which remains one of the lowest in the Kenyan Banking Industry at 33.3%, while the Net NPA ratio dropped to 0.43% from 1.19% as at December 2010.
Chairman’s statement (continued)
PAGE 14 | I&M BANK LTD REPORT & CONSOLIDATED FINANCIAL STATEMENTS 2011

The Bank continues looking for opportunities to enhance its presence across the region and efforts are currently underway to acquire a controlling investment of a banking entity within the region.
I&M Bank (T) Limited – Tanzania
After the acquisition of the bank in early 2010, your Bank has made great strides in integrating the subsidiary and offering innovative products and services to its customers in both Kenya and Tanzania with both sets of customers being able to benefit from the efficiencies of banking with one group. Our subsidiary also doubled its branch network from 3 to 6 branches to spread its presence to the major centres in Tanzania. These initiatives have all assisted I&M Bank (T) Ltd in delivering a decent performance despite an uncertain and volatile economic environment registering a 44 per cent growth in total assets to Tzs. 199.98 billion (approx. KShs. 11.08 billion) and a 7 per cent increase in Profit Before Tax to Tzs. 5.34 billion (approx. KShs. 296 million).
The Bank also witnessed a change of leadership in early 2012, with the CEO, Mr. S Gopalan, retiring after dedicatedly serving the institution for 14 years. I would like to take this opportunity to thank Mr. S Gopalan for his service over the years and welcome the new Chief Executive Officer, Mr. Anurag Dureha, who brings with him a wealth of international experience. I am confident that under the leadership of Mr. Anurag Dureha, the team at I&M Bank (T) Ltd will continue to steer the bank to new heights. I am also appreciative of all the support received from our fellow shareholders, Proparco, The Kibo Fund LLC and Mr. Michael Shirima, guidance from the Directors of I&M Bank (T) Ltd as well as from the Bank of Tanzania.
Bank One Limited – Mauritius
Against a challenging and stressful economic situation in 2011, Bank One delivered a 61% increase in Net Profit before Exceptional Items and Tax, from MUR 109 million (approximately KShs. 301 million) in 2010 to MUR 175 million (Approximately KShs. 484 million) in 2011. I equally take this opportunity to thank the team at Bank One, under the able leadership of Mr. Raj Dussoye, the CEO, for this excellent performance. The guidance offered by Bank One’s Board of Directors and the support of our Partners, CIEL Investment Limited, is deeply appreciated. As always, the constructive and innovative supervision, as well as the guidance offered by the Bank of Mauritius during 2011, has been invaluable. With the Eurozone crisis on going, the resilience of the Mauritian economy will likely be severely tested in 2012. Against this outlook, Bank One intends to place greater focus on the profitability and quality of its assets, even as it forges onward on its growth trajectory.
Outlook
As we go into 2012, our greatest concern will be the general elections in Kenya – how they are carried out and the effects that it shall have, both on our Country, and on the Bank. We join our fellow fellow citizens in seeking peace and stability for our country so that it can focus on realising its full potential. As we strive to gear ourselves for the challenging year ahead, we continue to look for opportunities to serve all our esteemed customers better, by incessantly improving our service delivery standards, as well as the bouquet of products and services to remain as the Bank of Choice.
I take this opportunity to thank the Central Bank of Kenya for its guidance and encouragement at all times, and especially during the particularly volatile market conditions experienced last year. A sincere note of appreciation goes out to the management and team at I&M Bank, under the seasoned guidance of its CEO, Mr. Arun S Mathur, for the outstanding performance of your Bank during 2011 despite the turbulent market conditions in the second half of 2011.
I thank my fellow directors for their valued contributions in various Board and Board Committee meetings, which has helped steer your Bank from strength to strength. A heartfelt Asante Sana goes out to all our customers, for the support and trust placed in the Bank. As we look forward to 2012, though cautious, we are optimistic that the year will bring the much awaited recovery and stability in the industry. Like the little engine, we persist knowing that the hard times will pass, and our perseverance will reward us in accomplishing all that what we set out to do.
S.B.R SHAH, Chairman
Chairman’s statement (continued)
PAGE 15 | I&M BANK LTD REPORT & CONSOLIDATED FINANCIAL STATEMENTS 2011

Report of the directors for the year ended 31 December 2011The directors have pleasure in submitting their report together with the audited financial statements for the year ended 31 December 2011, which disclose the state of affairs of the company and the group.
1. SHARE CAPITAL
On 22 July 2011, the Bank increased its issued and paid up share capital by issuance of 100,000 ordinary shares of KShs 100 each at a premium of KShs 835 per share thus increasing the issued and paid up share capital to KShs 2,880,245,300 to a trust created for the benefit of the Bank’s employees under an Employee Share Ownership Plan.
2. ACTIVITIES
The Bank provides an extensive range of banking, financial and related services permitted under the Banking Act (Cap.488).
3. RESULTS
The consolidated results for the year are as follows:
4. DIVIDEND
The directors recommend the payment of a final dividend of KShs 747,424,874 (2010 – KShs 527,212,930).
5. DIRECTORS
The directors who served during the year and up to the date of this report are set out on page 6
6. AUDITORS
The auditors, KPMG Kenya to continue in office in accordance with Section 159(2) of the Kenyan Companies Act (Cap.486) and subject to Section 24(1) of the Banking Act (Cap.488).
7. APPROVAL OF FINANCIAL STATEMENTS
The financial statements were approved at a meeting of the directors held on 22 March 2012.
BY ORDER OF THE BOARD
N P KothariSecretary
DATE: 22 March 2012
PAGE 16 | I&M BANK LTD REPORT & CONSOLIDATED FINANCIAL STATEMENTS 2011
2011KShs
Profit before taxation 4,953,892,690Taxation (1,481,168,719Profit after taxation 3,472,723,971

Statement on corporate governanceThe Board of Directors and Management of I&M Bank LIMITED, (I&M), are committed to enforcing high standards of corporate governance at the Bank as well as its controlled entities (the Group). Underpinning this commitment is a Corporate Governance Framework that has been established by the Bank’s Board, which includes policies and practices designed to ensure that the Board is focused on its responsibilities to its stakeholders and on creating long term shareholder value while also focussing on its wider role and responsibility to the society at large.
In its approach to Governance, the Board has attempted to embrace international best practices and principles so as to ensure optimal stewardship of the Group’s assets and resources. The Bank has an established Code of Conduct and Code of Ethics that bind the Directors and Employees to ensure that the Bank’s business is carried out in an ethical, fair and transparent manner. Simultaneously the Board has placed strong emphasis on ensuring local regulatory compliance within the jurisdictions in which the Group operates, as part of its internal risk management parameters.
In an increasingly uncertain financial environment, the Bank has over the last few years, put in place the following key policies and procedures to manage risk:
• Anti-Money Laundering Policies and Procedures that are rigorously adhered to.• A Policy for Social and Environment Management, with efforts being devoted to improving its Environment
and Social Risk Management Systems.• An Enterprise Risk Management Framework.
The Bank has established a mechanism for carrying out periodic reviews of the above policies and procedures in a bid to improve and strengthen them.
Conscious of the fact that, effective corporate governance practices are essential to achieve and maintain our stakeholders’ trust and confidence in the Bank, and in light of constantly evolving corporate governance environment, I&M has consistently strived to enhance and improve upon the Corporate Governance Framework within the Bank. During 2011, in a move to improve on the efficiency and efficacy of the Board, I&M set up two additional Board Committees:
• The Board Share Transfers Committee; and • The Board Nomination and Remuneration Committee.
The roles and membership of these two new Committees are detailed under the item ‘Board Committees” below.
THE BOARD OF DIRECTORS
Constitution, appointment and composition
The Bank’s Board is led by the Chairman Mr. SBR Shah and consists of four independent non-executive Directors, four non-executive Directors and one Executive Director. The Directors, collectively have vast experience arising from their varied backgrounds in different disciplines, which include, inter alia Banking, General Management, Law, Accounting and Investment Analysis, apart from hands on experience in various industries. The unique collective experience of our Board members provides a superior mix of skills the Board requires in order to effectively discharge its responsibilities.
In appointment of new Directors of the Bank, consideration is given to each individual Director’s personal qualities and abilities, the collective Board members’ skills and aptitudes for conducting oversight of the Bank and its management, as well as discharging duties and obligations imposed by law. At I&M, of the eight non-executive Directors, 50% are independent. The Bank recognizes and appreciates that all Directors, whether as Independent Directors, or as Directors who are deemed not independent, make valuable contributions to the Board and to the Bank by virtue of their experience and judgment.
BOARD MEETINGS
The Board meets quarterly each year for scheduled meetings and on other occasions to deal with specific matters that require attention between scheduled meetings. During the year, four scheduled Board meetings were held. Except for two of the Directors, each member attended at least 75% of the board meetings.
PAGE 17 | I&M BANK LTD REPORT & CONSOLIDATED FINANCIAL STATEMENTS 2011

Board members receive board papers well in advance of their meetings, thereby facilitating meaningful deliberations therein. They also have full and unlimited access to the Bank’s records and consult with employees and independent professional advisors, as the Board or its Committees deem appropriate.
BOARD EVALUATION
The Board has in place, a process of an annual self-evaluation. Taking into consideration the Board’s duties and responsibilities, the self-evaluation process includes matters covered not only under the Central Bank requirements but also those prescribed under global best practices as regards good governance. Further, as an improvement of the corporate governance practices in the Bank, we have established an additional process for evaluation of ‘independence’, which will help the Bank to assess the continued independence of directors appointed as independent Directors. For the year 2011, the peer review and self-evaluation of the Board of Directors was completed on the 22nd March 2012.
GOVERNANCE PRINCIPLES
All I&M Bank Directors and employees adhere to the principles of the Code of Conduct in all their dealings on behalf of the Bank. The Code of Conduct ensures that all actions are in the overall best interests of the Bank and reflects our commitment to maintaining highest standards of integrity, ethical behaviour and compliance with all applicable internal and external laws and regulations. The Board ensures that Accountability is enhanced through a system of objective goal setting for all employees and periodic performance appraisals, which cuts across all levels of staff. Additionally, the Board has delegated financial and other powers with clearly defined accountabilities on each matter.
The Board also emphasizes on high levels of efficiency and effectiveness. This is made possible by ensuring that the Bank has a good pool of well-trained staff with the appropriate skills required to perform their duties. The Board has set up seven Board Committees and several top level Management Committees to assist in discharging its responsibilities. These include:
Board committees:
Board Audit Committee (BAC)An independent non-executive Director chairs this Committee consisting of four Directors. BAC, which meets at least once every quarter, assists the Board in fulfilling its responsibilities by reviewing the financial condition of the Bank, its internal controls, performance and findings of both the Internal Audit and Compliance functions.
Board Risk Management Committee (BRC)The BRC, comprising six members, is chaired by an independent non-executive Director, and meets at least once every quarter. Through the Bank’s risk management function, BRC is responsible for translating the Risk Management Framework established by the Board of Directors into specific policies, processes and procedures that can be implemented and verified within the different business units, so that risks faced by the Bank are adequately considered and mitigated.
Board Credit Committee (BCC)The BCC, which consists of five Directors is chaired by an independent non-executive Director and is responsible for the review of the Bank’s overall lending policy, conducting independent loan reviews, delegation and review of lending limits, ensuring compliance with all statutory regulations and is overall responsible for the management of credit risk. The Credit Risk Management Committee (CRMC), the Credit Risk Sub-Committee, NPA Committee and the Card Centre Credit Appraisal Committees assist the BCC in its role.
Board Procurement Committee (BPC)The Board Procurement Committee comprising five members, excluding the Secretary, is chaired by an independent non-executive Director, and meets at least half-yearly and on other occasions to deal with specific matters. The BPC is responsible for reviewing and approving significant Capital Expenditure, procurement proposals as well as proposed consultancy assignments. It also approves any unbudgeted
Statement on corporate governance (continued)
PAGE 18 | I&M BANK LTD REPORT & CONSOLIDATED FINANCIAL STATEMENTS 2011

capital expenditure beyond the Delegated Authority of Executive Management in addition to review and approval of procurement of goods and services from related parties.
Board Capital Structure Strategy Committee (BCSSC)This committee comprising six members, excluding the Secretary, is chaired by an independent non-executive Director, and meets at least once every quarter. It assists the Board in fulfilling its responsibilities by considering matters pertaining to raising of equity and debt capital of the Bank from time to time.
Board Share Transfers Committee (BSTC)The BSTC, comprising three members excluding the Secretary, is chaired by a non-executive Director, and meets at least once every quarter. It assists the Board in fulfilling its responsibilities by considering matters pertaining to the transfers and allotment of ordinary shares of the Bank from time to time, to ensure that the Bank is also compliant with the guidelines issued by the Central Bank as regards shareholding of the Bank.
Board Nomination and Remuneration Committee (BNRC)The Board has delegated responsibility to the BNRC to undertake structured assessment of candidates for membership of the Board and Executive Management, and establishment of an appropriate framework for remuneration of the Board and Executive Management members, in line with clearly defined remuneration principles. This Committee is also responsible for assessment of individual Board member’s performance as well as overall performance/effectiveness of the Board and recommending any changes/improvements deemed necessary for consideration by the full Board.
Management committees:
Business Strategy & Coordination CommitteeThis Committee provides the link between the Board and the Management in terms of formulating, implementing and monitoring of the Bank’s Strategic direction, intent and objectives.
Executive Committee (EXCO)This Committee provides the link between the Board, Top Management and Unit Heads. It is responsible for reviewing and benchmarking the Bank’s financial and business performance, reviewing progress of special projects, identification of risks or opportunities and overseeing successful implementation of all key performance improvement initiatives across the Bank.
Assets & Liabilities Committee (ALCO)The Bank’s Assets & Liabilities Committee is responsible for overall management of the Bank’s Balance Sheet, to optimize the Bank’s Returns while closely monitoring and managing these within an acceptable risk/reward matrix. ALCO closely monitors and manages the following risks; liquidity, interest rate, maturity gap, Exchange rate movements, counter party and settlements risk. It also closely reviews and evaluates the Bank’s investment strategies to ensure no undue exposure to liquidity risk but taking into consideration the need to maximize the risk-adjusted returns over the long term.
Credit Risk Management Committee (CRMC)This Committee is the link between the Board and Management in terms of establishing and implementing the credit and lending policies of the Bank. It is responsible for the sanction of credit proposals in line with the Bank’s Credit Policy, effective follow-up of all Credit-related matters and review of Non-Performing Accounts.
Human Resources Committee (HRC)HRC, in liaison with the Board Nomination and Remuneration Committee (BNRC) assists the Board in fulfilling its Human Resource Management responsibilities, with due recognition to this key resource available to the Bank. It periodically reviews existing HR policies to ensure these are well aligned to the industry, with a view of ensuring the Bank is able to attract and retain good talent to meet its overall Strategic and Corporate Objectives on a sustainable basis. It also reviews and approves, within its Delegated Authority, all other major HR Initiatives and provides necessary guidance to HR department to ensure the Bank’s Human Resources remain well motivated and engaged.
Statement on corporate governance (continued)
PAGE 19 | I&M BANK LTD REPORT & CONSOLIDATED FINANCIAL STATEMENTS 2011

IT Steering Committee (ITSC)This Committee is responsible for overall IT governance in a growing IT based banking environment, with emphasis on identification, assessment and management of IT risks, ensuring optimum use of IT resources, determining prioritization of IT investments in line with the Bank’s strategy, monitoring service levels and adopting best practices.
Corporate Social Responsibility (CSR)
The Bank’s role in corporate social responsibility has been increasing over the years and the Bank endeavors to create a sustainable relationship with the institutions/individuals it supports. Every year, a review of the previous year’s CSR activities is carried out, taking into consideration the inflation rates and additional funding required for the current year. The Bank’s CSR activities are broad-based and include providing bursary support programmes, feeding programmes, HIV/AIDS Positive Living support & awareness programs and, environment care amongst others.
The Bank has a formal structure and policies for social and environmental care to ensure green consciousness among all the staff and to ensure that the Bank’s activities are carried out in an eco-friendly manner.
PAGE 20 | I&M BANK LTD REPORT & CONSOLIDATED FINANCIAL STATEMENTS 2011
Statement on corporate governance (continued)

Boa
rd C
omm
ittee
s
Tab
ulat
ed b
elow
are
Boa
rd C
omm
ittee
s, th
eir
com
pos
ition
and
mem
ber
ship
, fun
ctio
ns a
nd th
e fre
que
ncy
of m
eetin
gs:
PAGE 21 | I&M BANK LTD REPORT & CONSOLIDATED FINANCIAL STATEMENTS 2011
Stat
emen
t on
corp
orat
e go
vern
ance
(con
tinue
d)
Boa
rd A
udit
Com
mitt
eeB
oard
Ris
k C
omm
ittee
Boa
rd C
redi
t Com
mitt
eeB
oard
Pro
cure
men
t C
omm
ittee
Boa
rd C
apita
l St
ruct
ure
Stra
tegy
C
omm
ittee
Boa
rd S
hare
Tra
nsfe
rs
Com
mitt
eeB
oard
Nom
inat
ion
&
Rem
uner
atio
n C
omm
ittee
Cha
irman
In
dep
end
ent N
on-
Exe
cutiv
e D
irect
orIn
dep
end
ent N
on-
Exe
cutiv
e D
irect
orIn
dep
end
ent N
on-
Exe
cutiv
e D
irect
orIn
dep
end
ent N
on-
Exe
cutiv
e D
irect
orIn
dep
end
ent N
on-
Exe
cutiv
e D
irect
orN
on-E
xecu
tive
Dire
ctor
Ind
epen
den
t Non
-Exe
cutiv
e D
irect
or
Mem
bers
(incl
udin
g C
hairm
an)
• 3
Non
-exe
cutiv
e In
dep
end
ent D
irect
ors;
• 1
Non
-exe
cutiv
e D
irect
or•
Hea
d o
f Int
erna
l Aud
it (S
ecre
tary
)
Invi
tees
:
• E
xecu
tive
Dire
ctor
• C
EO
• H
ead
of B
usin
ess
Sup
por
t•
Hea
d o
f Bus
ines
s D
evel
opm
ent
• 3
Ind
epen
den
t Non
-ex
ecut
ive
Dire
ctor
s,
• 1
Non
-exe
cutiv
e D
irect
or,
• 1
Exe
cutiv
e D
irect
or,
• H
ead
of R
isk
&
Com
plia
nce
(Sec
reta
ry)
Invi
tees
:
• C
EO
• 3
Ind
epen
den
t Non
-ex
ecut
ive
Dire
ctor
s,
• 1
Non
–exe
cutiv
e D
irect
or,
• 1
Exe
cutiv
e D
irect
or,
• C
hief
Exe
cutiv
e O
ffice
r (C
EO
)•
Hea
d o
f Cre
dit
(Sec
reta
ry)
• 3
Ind
epen
den
t Non
-ex
ecut
ive
Dire
ctor
s,•
1 E
xecu
tive
Dire
ctor
,•
CE
O,
• H
ead
of B
usin
ess
Sup
por
t •
Hea
d o
f Fin
ance
(S
ecre
tary
)
• 2
Ind
epen
den
t Non
-ex
ecut
ive
Dire
ctor
s•
1 E
xecu
tive
Dire
ctor
• C
EO
• 1
Ext
erna
l Ad
viso
r•
Hea
d –
Cor
por
ate
&
Str
ateg
ic P
lann
ing
(C
SP
)•
Chi
ef M
anag
er-C
SP
(S
ecre
tary
)
• 2
Non
-exe
cutiv
e D
irect
ors
• 1
Exe
cutiv
e D
irect
or•
Com
pan
y S
ecre
tary
(S
ecre
tary
)
• 2
Ind
epen
den
t Non
-exe
cutiv
e D
irect
ors
• 1
Exe
cutiv
e D
irect
or
Invi
tees
:
• C
EO
• H
ead
of B
usin
ess
Sup
por
t•
Hea
d o
f HR
(S
ecre
tary
)
Freq
uenc
y of
m
eetin
gsQ
uart
erly
Qua
rter
lyQ
uart
erly
Qua
rter
lyQ
uart
erly
Qua
rter
lyQ
uart
erly
Mai
n fu
nctio
ns•
Rev
iew
str
uctu
re a
nd
adeq
uacy
of i
nter
nal
cont
rols
•
Rev
iew
act
iviti
es a
nd
scop
e of
Inte
rnal
A
udit
& C
omp
lianc
e D
epar
tmen
ts
and
ass
ess
thei
r ef
fect
iven
ess
• R
evie
w &
co-
ord
inat
e
bet
wee
n E
xter
nal
Aud
itors
& In
tern
al
Aud
it D
epar
tmen
t•
Rev
iew
and
rece
ive
CB
K In
spec
tion
Rep
ort,
and
put
in p
lace
m
easu
res
to im
ple
men
t re
com
men
dat
ions
th
ereo
f.
• E
nsur
e th
at th
e R
isk
Mg
mt F
ram
ewor
k &
the
pro
cess
es a
s ap
pro
ved
ar
e i
mp
lem
ente
d•
Rev
iew
, m
onito
r &
d
elib
erat
e on
the
app
rop
riate
ris
k m
itig
atio
n ap
pro
ach
• E
nsur
e B
CP
is
form
ulat
ed, t
este
d a
nd
revi
ewed
per
iod
ical
ly
• R
evie
w o
f pol
icie
s,
pro
ced
ures
and
ex
pos
ure
limits
•
Rev
iew
of p
rop
osed
st
rate
gic
initi
ativ
es
• C
reat
ing
aw
aren
ess
abou
t Ris
k M
anag
emen
t P
roce
ss in
the
Ban
k.
• R
evie
w le
ndin
g p
olic
y•
Con
sid
er lo
an
app
licat
ions
bey
ond
d
iscr
etio
nary
lim
its
gra
nted
to C
RM
C•
Rev
iew
lend
ing
by
CR
MC
• D
irect
, mon
itor,
revi
ew
all a
spec
ts th
at w
ill
imp
act u
pon
pre
sent
an
d fu
ture
Cre
dit
risk
man
agem
ent a
t the
B
ank
• E
nsur
e co
mp
lianc
e w
ith B
anki
ng A
ct a
nd
Pru
den
tial G
uid
elin
es
• C
ond
uct i
ndep
end
ent
loan
revi
ews
as a
nd
whe
n ap
pro
pria
te.
• R
evie
w &
ap
pro
ve th
e P
rocu
rem
ent P
olic
y•
Rev
iew
& c
onsi
der
si
gni
fican
t pro
cure
men
t p
rop
osal
s / c
onsu
ltanc
y as
sig
nmen
ts a
bov
e M
anag
emen
t’s
Del
egat
ed A
utho
rity
lim
its
• R
evie
w a
nd a
pp
rove
p
rocu
rem
ent o
f goo
ds
and
ser
vice
s fro
m
rela
ted
par
ties.
• R
evie
w &
rat
ify
unb
udg
eted
cap
ital
exp
end
iture
ab
ove
Man
agem
ent’s
D
eleg
ated
Aut
horit
y lim
its
• R
evie
w a
nd a
pp
rove
S
trat
egy
& o
bje
ctiv
es
on a
dd
ition
al c
apita
l ne
eds.
• E
nsur
e op
timal
ca
pita
l str
uctu
re
with
ap
pro
pria
te m
ix
of d
ebt a
nd e
qui
ty
to s
upp
ort B
ank’
s S
trat
egy
• R
isk
asse
ssm
ent &
ap
pro
val o
f cap
ital
rais
ing
ave
nues
p
rop
osed
by
man
agem
ent
• R
egul
arly
revi
ew
stru
ctur
e an
d te
rms
of d
ebt c
apita
l.
• E
nsur
e th
at a
ny n
ew
shar
ehol
der
s m
eet t
he
Boa
rd’s
crit
eria
of g
ood
st
and
ing
.•
Ap
pro
ve /
reje
ct
app
licat
ions
for
the
tran
sfer
of s
hare
s an
d
app
rove
reg
istr
atio
n of
su
ch tr
ansf
ers.
• G
ive
gui
dan
ce a
nd
app
rove
any
sha
re
allo
tmen
t aris
ing
out
of a
b
onus
/ rig
hts
issu
e.•
Sig
n th
e S
hare
C
ertif
icat
es, u
nder
C
omp
any
Sea
l, to
b
e is
sued
to a
ny
shar
ehol
der
.
• A
sses
smen
t of B
oard
re
qui
rem
ents
for
Non
-exe
cutiv
e D
irect
ors,
incl
udin
g re
qui
site
co
mp
eten
cies
.•
Dev
elop
men
t pro
gra
ms
to b
uild
in
div
idua
l ski
lls a
nd im
pro
ve
Boa
rd e
ffect
iven
ess.
• B
oard
and
Sen
ior
Man
agem
ent
succ
essi
on p
lann
ing
.•
Per
form
ance
eva
luat
ion
of th
e B
oard
, Ind
ivid
ual D
irect
ors
and
of
the
ED
& C
EO
.•
Set
rem
uner
atio
n p
olic
ies
&
stra
teg
ic o
bje
ctiv
es o
f Boa
rd, E
D
& C
EO
• S
et E
SO
P S
chem
e P
olic
y an
d
pro
vid
e re
qui
site
gui
dan
ce to
S
chem
e Tr
uste
e.

Tab
ulat
ed b
elow
are
Man
agem
ent C
omm
ittee
s, th
eir
com
pos
ition
and
mem
ber
ship
, fun
ctio
ns a
nd th
e fre
que
ncy
of m
eetin
gs:
Bus
ines
s st
rate
gy c
omm
ittee
Exec
utiv
e co
mm
ittee
Ass
ets
& li
abili
ties
com
mitt
eeC
redi
t ris
k m
anag
emen
t co
mm
ittee
Hum
an re
sour
ces
com
mitt
eeIT
ste
erin
g co
mm
ittee
Cha
irman
E
xecu
tive
Dire
ctor
(E
D)
Exe
cutiv
e D
irect
or (
ED
)E
xecu
tive
Dire
ctor
(E
D)
Exe
cutiv
e D
irect
or (
ED
)E
xecu
tive
Dire
ctor
(E
D)
Chi
ef E
xecu
tive
Offi
cer
(CE
O)
Mem
bers
(Incl
udin
g ch
airm
an)
ED
, CE
O,
Sen
ior
Gen
eral
Man
ager
Hea
ds o
f:
• B
usin
ess
Dev
elop
men
t•
Bus
ines
s S
upp
ort
• C
orp
orat
e &
Str
ateg
ic P
lann
ing
. (S
ecre
tary
)
ED
, CE
O,
Hea
ds o
f :
• B
usin
ess
Dev
elop
men
t•
Bus
ines
s S
upp
ort
• R
isk
• Tr
easu
ry•
Cor
por
ate
& S
trat
egic
Pla
nnin
g.
Chi
ef M
anag
er –
CE
O’s
Offi
ce
(Sec
reta
ry)
Invi
tees
:
• H
ead
– In
tern
al A
udit
ED
, CE
O,
Sen
ior
Gen
eral
Man
ager
Hea
ds o
f:
• B
usin
ess
Dev
elop
men
t•
Bus
ines
s S
upp
ort
• R
isk
• Tr
easu
ry (
Sec
reta
ry)
Invi
tees
:
• H
ead
– F
inan
ce
• C
hief
Man
ager
– C
orp
orat
e &
Str
ateg
ic P
lann
ing
ED
, CE
OS
enio
r G
ener
al M
anag
erS
enio
r E
xecu
tive
Man
ager
Hea
ds o
f :
• B
usin
ess
Dev
elop
men
t•
Ris
k•
Cre
dit
(Sec
reta
ry)
ED
, CE
O,
Sen
ior
Gen
eral
Man
ager
Hea
ds o
f:
• B
usin
ess
Dev
elop
men
t•
Bus
ines
s S
upp
ort
• H
R (
Sec
reta
ry)
CE
O,
Hea
ds o
f :
• B
usin
ess
Dev
elop
men
t•
Bus
ines
s S
upp
ort
• C
entr
al M
arke
ting
• C
hief
Man
ager
– C
EO
’s
Offi
ce•
ICT
(Sec
reta
ry)
Freq
uenc
y of
m
eetin
gsQ
uart
erly
Mon
thly
Mon
thly
Fort
nig
htly
Mon
thly
Qua
rter
ly
Mai
n fu
nctio
ns•
Lead
and
dire
ct S
trat
egic
P
lann
ing
Pro
cess
, inc
lud
ing
fo
rmul
atio
n, im
ple
men
tatio
n an
d
eval
uatio
n of
Str
ateg
y.•
Rev
iew
& re
com
men
d m
id-
stre
am c
orre
ctio
ns in
Str
ateg
ic
Dire
ctio
n•
Ens
ure
ban
k-w
ide
stra
teg
ic
focu
s b
y se
tting
med
ium
/sho
rt
term
ob
ject
ives
.•
Eva
luat
e p
rog
ress
on
Str
ateg
ic
and
Cor
por
ate
Ob
ject
ives
• P
erio
dic
ally
eva
luat
e p
erfo
rman
ce ta
rget
s.
• R
evie
w &
ben
chm
ark
Ban
k’s
finan
cial
& b
usin
ess
per
form
ance
• R
evie
w is
sues
that
war
rant
pol
icy
chan
ges
for
othe
r m
anag
emen
t co
mm
ittee
s •
Rev
iew
pro
gre
ss o
f sp
ecia
l pro
ject
s an
d im
ple
men
tatio
n st
atus
of p
olic
y in
itiat
ives
• R
evie
w &
form
ulat
e m
arke
ting
st
rate
gie
s.•
Man
age
key
risks
and
ens
ure
Ris
k M
anag
emen
t Com
mitt
ee h
as
acce
ss to
req
uisi
te in
form
atio
n•
Rev
iew
dis
aste
r p
rep
ared
ness
and
b
usin
ess
cont
inui
ty.
• Li
qui
dity
man
agem
ent
• In
tere
st R
ate
Man
agem
ent
• M
atur
ity G
ap M
anag
emen
t•
Det
erm
inin
g th
e in
vest
men
t st
rate
gie
s of
the
Ban
k fo
r m
axim
izat
ion
of r
isk
adju
sted
retu
rns
over
the
long
term
.•
Cou
nter
Par
ty &
Set
tlem
ents
R
isk
Man
agem
ent
• C
urre
ncy
Ris
k M
anag
emen
t
• S
et C
red
it P
olic
y &
Cre
dit
Ris
k M
anag
emen
t Pol
icy
• S
anct
ion
Cre
dit
Pro
pos
als
in li
ne w
ith P
olic
y an
d C
BK
G
uid
elin
es•
Rev
iew
NPA
s•
Con
sid
er &
ap
pro
ve n
ew
asse
t-b
ased
pro
duc
ts.
• C
ontro
l & fo
llow
-up
on
cred
it-re
late
d m
atte
rs.
• R
egul
arly
rep
ort t
o B
oard
C
red
it C
omm
ittee
.
• R
evie
w &
mon
itor
imp
lem
enta
tion
of v
ario
us
staf
f dev
elop
men
t and
w
elfa
re in
itiat
ives
to e
nsur
e m
aint
enan
ce o
f pro
duc
tive
and
hea
lthy
staf
f rel
atio
ns.
• R
evie
w o
f Ban
k’s
Man
pow
er
Pla
n•
Rev
iew
and
take
dec
isio
ns o
n d
isci
plin
ary
issu
es.
• R
evie
w s
taff
rem
uner
atio
n vi
s-à-
vis
over
all B
ank’
s p
erfo
rman
ce a
nd in
dus
try
to e
nsur
e th
e B
ank
rem
ains
co
mp
etiti
ve in
attr
actin
g a
nd
reta
inin
g ta
lent
.•
Up
dat
e B
oard
on
HR
Mat
ters
.
• D
raw
up
the
Str
ateg
ic IC
T P
lan
• G
uid
e d
evel
opm
ent o
f the
in
form
atio
n ar
chite
ctur
e an
d
det
erm
ine
the
tech
nolo
gic
al
dire
ctio
n.•
Def
ine
ICT
pro
cess
es,
org
anis
atio
n an
d
rela
tions
hip
s.•
Iden
tify,
ass
ess
and
man
age
IT r
isks
• D
efin
e an
d m
anag
e IC
T an
d
ICT-
dep
end
ent p
roje
cts.
• E
nsur
e op
timum
use
of I
T re
sour
ces
& m
anag
e IC
T in
vest
men
ts.
PAGE 22 | I&M BANK LTD REPORT & CONSOLIDATED FINANCIAL STATEMENTS 2011
Stat
emen
t on
corp
orat
e go
vern
ance
(con
tinue
d)

PAGE 23 | I&M BANK LTD REPORT & CONSOLIDATED FINANCIAL STATEMENTS 2011
The Art of Banking

Statement of directors’ responsibilitiesThe Directors are responsible for the preparation and fair presentation of the group and company financial statements of I&M Bank LIMITED set out on pages 26 to 92 which comprise the consolidated and company statement of financial position as at 31 December 2011, statement of comprehensive income, statement of changes in equity and statement of cash flows for the year then ended, and a summary of significant accounting policies and other explanatory notes, in conformity with International Financial Reporting Standards and in the manner required by the Kenyan Companies Act. The Directors are of the opinion that the financial statements give a true and fair view of the state of the financial affairs and the operating results of the group and the company.
The Directors’ responsibilities include: determining that the basis of accounting described in Note 3 is an acceptable basis for preparing and presenting the financial statements in the circumstances, preparation and presentation of financial statements in accordance with International Financial Reporting Standards and in the manner required by the Kenyan Companies Act and for such internal control as the directors determine is necessary to enable the preparation of financial statements that are free from material misstatements, whether due to fraud or error.
Under the Kenyan Companies Act the Directors are required to prepare financial statements for each financial year which give a true and fair view of the state of affairs of the group and the company as at the end of the financial year and of the operating results of the group for that year. It also requires the Directors to ensure the group keeps proper accounting records which disclose with reasonable accuracy the financial position of the group and the company.
The Directors accept responsibility for the maintenance of accounting records which may be relied upon in the preparation of financial statements, as well as adequate systems of internal financial control.
The Directors have made an assessment of the group and the company’s ability to continue as a going concern and have no reason to believe the group and the company will not be a going concern for at least the next twelve months from the date of this statement.
APPROVAL OF THE FINANCIAL STATEMENTS
The group and company financial statements, as indicated above, were approved by the Board of Directors on 22 March 2012 and were signed on its behalf by:
S B R ShahDirector
Sarit S Raja ShahDirector
M SoundararajanDirector
PAGE 24 | I&M BANK LTD REPORT & CONSOLIDATED FINANCIAL STATEMENTS 2011

Report of the independent auditors to the members of I&M Bank LimitedWe have audited the consolidated and company financial statements of I&M Bank LIMITED set out on pages 26 to 92 which comprise the consolidated and company statement of financial position as at 31 December 2011, statement of comprehensive income, statement of changes in equity and statement of cash flows for the year then ended, and a summary of significant accounting policies and other explanatory notes.
DIRECTORS’ RESPONSIBILITY FOR THE FINANCIAL STATEMENTS
As stated on page 24, the directors are responsible for the preparation and fair presentation of these financial statements in accordance with International Financial Reporting Standards and in the manner required by the Companies Act of Kenya, and for such internal control as the directors determine is necessary to enable the preparation of financial statements that are free from material misstatement, whether due to fraud or error.
AUDITOR’S RESPONSIBILITY
Our responsibility is to express an opinion on these financial statements based on our audit. We conducted our audit in accordance with International Standards on Auditing. Those standards require that we comply with relevant ethical requirements and plan and perform the audit to obtain reasonable assurance whether the financial statements are free from material misstatement.
An audit involves performing procedures to obtain audit evidence about the amounts and disclosures in the financial statements. The procedures selected depend on our judgement, including the assessment of the risks of material misstatement of the financial statements, whether due to fraud or error. In making those risk assessments, we consider internal control relevant to the entity’s preparation and fair presentation of the financial statements in order to design audit procedures that are appropriate in the circumstances, but not for the purpose of expressing an opinion on the effectiveness of the entity’s internal control. An audit also includes evaluating the appropriateness of accounting policies used and the reasonableness of accounting estimates made by management, as well as evaluating the overall presentation of the financial statements. We believe that the audit evidence we have obtained is sufficient and appropriate to provide a basis for our opinion.
OPINION
In our opinion, the financial statements give a true and fair view of the consolidated and separate financial position of I&M Bank LIMITED at 31 December 2011, and the consolidated and separate financial performance and consolidated and separate cash flows for the year then ended in accordance with International Financial Reporting Standards and the Kenyan Companies Act.
REPORT ON OTHER LEGAL REQUIREMENTS
As required by the Kenyan Companies Act we report to you, based on our audit, that:
• We have obtained all the information and explanations, which to the best of our knowledge and belief were necessary for the purpose of our audit;
• In our opinion, proper books of account have been kept by the Bank, in so far as appears from our examination of those books; and,
• The statement of financial position and statement of comprehensive income of the Bank are in agreement with the books of account.
KPMG KenyaDATE: 22 March 2012
PAGE 25 | I&M BANK LTD REPORT & CONSOLIDATED FINANCIAL STATEMENTS 2011
KPMG KenyaCertififed Public Accountants16th Floor, Lonrho House,Standard Street P.O. Box 40612 00100 GPONairobi Kenya
Telephone: +254 20 2806000Fax: +254 20 2215695Email: [email protected]:www.kpmg.co.ke
KPMG Kenya is a Kenyan partnership and a member firm of the KPMG network of Independent member firms affiliated with KPMG International Cooperative (“KPMG International”), a Swiss entity.
Partners EE Aholi PC Mwema PC Appleton* JL Mwaura BC D’Souza RB Ndung’u JM Gathecha AW Pringle* JM Kiruthu AZ Sheikh(*British)

2011 2010Note KShs KShs
Interest income 7 9,031,130,752 6,552,914,370
Interest expense 8 (3,468,274,810 (2,779,117,368
Net interest income 5,562,855,942 3,773,797,002
Fee and commission income 9 1,360,600,603 997,962,488
Fee and commission expense 9 ( 74,560,531 ( 51,440,440
Net fee and commission income 9 1,286,040,072 946,522,048
Net trading income 6,848,896,014 4,720,319,050
Other operating income 10 1,110,553,805 1,200,097,330
OPERATING INCOME 7,959,449,819 5,920,416,380
Staff costs 11 (1,484,091,145 (1,196,757,026
Premises and equipment costs 11 ( 201,043,272 ( 154,674,759
General administrative expenses 11 ( 865,777,640 ( 544,336,865
Depreciation and amortisation 11 ( 204,692,395 ( 197,852,242
OPERATING EXPENSES (2,755,604,452) (2,093,620,892)OPERATING PROFIT BEFORE IMPAIRMENT LOSSES AND TAXATION 5,203,845,367 3,826,795,488
Net impairment losses on loans and advances 18 (c) ( 249,952,677 ( 300,314,014
PROFIT BEFORE INCOME TAX 12 4,953,892,690 3,526,481,474
INCOME TAX EXPENSE 13 (1,481,168,719 (1,001,913,927
NET PROFIT FOR THE YEAR 3,472,723,971 2,524,567,547
OTHER COMPREHENSIVE INCOMENet change in fair value of available for sale financial assets (1,791,653,542 1,478,280,843
Foreign currency translation differences 88,686,887 7,575,251
TOTAL OTHER COMPREHENSIVE INCOMEFOR THE YEAR ( 1,702,966,655 1,485,856,094
TOTAL COMPREHENSIVE INCOME FOR THE YEAR 1,769,757,316 4,010,423,641
Consolidated statement of comprehensive income for the year ended 31 December 2011
PAGE 26 | I&M BANK LTD REPORT & CONSOLIDATED FINANCIAL STATEMENTS 2011
)

Consolidated statement of comprehensive income for the year ended 31 December 2011 (continued)
2011 2010Note KShs KShs
PROFIT ATTRIBUTABLE TO:Equity holders of the company 3,384,037,932 2,438,680,282
Non controlling interest 88,686,039 85,887,265
3,472,723,971 2,524,567,547
TOTAL COMPREHENSIVE INCOME ATTRIBUTABLE TO:Equity holders of the company 1,690,740,504 3,940,172,040
Non controlling interest 79,016,812 70,251,601
1,769,757,316 4,010,423,641
BASIC AND DILUTED EARNINGSPER SHARE - (KShs) 14 117.72 92.51
DIVIDEND PER SHARE - (KShs) - Final 15 26.00 20.00
The notes set out on pages 37 to 92 form an integral part of these financial statements.
PAGE 27 | I&M BANK LTD REPORT & CONSOLIDATED FINANCIAL STATEMENTS 2011

2011 2010Note KShs KShs
Interest income 7 7,171,265,480 5,165,118,246
Interest expense 8 (2,515,825,273 (2,057,499,240
Net interest income 4,655,440,207 3,107,619,006Fee and commission income 9 1,094,852,551 806,342,925
Fee and commission expense 9 ( 39,564,601 ( 26,022,378
Net fee and commission income 9 1,055,287,950 780,320,547Net trading income 5,710,728,157 3,887,939,553Other operating income 10 873,019,931 989,424,845
Dividend income 10 61,311,323 -
934,331,254 989,424,845
OPERATING INCOME 6,645,059,411 4,877,364,398Staff costs 11 (1,079,080,233 ( 890,115,323
Premises and equipment costs 11 ( 138,028,337 ( 110,990,450
General administrative expenses 11 ( 647,506,239 ( 392,090,960
Depreciation and amortisation 11 ( 143,231,097 ( 149,402,792
OPERATING EXPENSES (2,007,845,906) (1,542,599,525)
OPERATING PROFIT BEFORE IMPAIRMENTLOSSES AND TAXATION 4,637,213,505 3,334,764,873Net impairment losses on loans and advances 18 (c) ( 179,882,130 ( 330,282,426
PROFIT BEFORE INCOME TAX 12 4,457,331,375 3,004,482,447
INCOME TAX EXPENSE 13 (1,362,712,977 ( 887,081,587
NET PROFIT FOR THE YEAR 3,094,618,398 2,117,400,860
OTHER COMPREHENSIVE INCOMENet change in fair value of available for sale
financial assets (1,784,158,894 1,486,279,527
TOTAL OTHER COMPREHENSIVE INCOME FOR THE YEAR (1,784,158,894 1,486,279,527
TOTAL COMPREHENSIVE INCOMEFOR THE YEAR 1,310,459,504 3,603,680,387
BASIC AND DILUTED EARNINGSPER SHARE - (KShs) 14 107.65 80.32
DIVIDEND PER SHARE - (KShs) 15
- Final 26.00 20.00
Company statement of comprehensive income for the year ended 31 December 2011
The notes set out on pages 37 to 92 form an integral part of these financial statements.
PAGE 28 | I&M BANK LTD REPORT & CONSOLIDATED FINANCIAL STATEMENTS 2011
)

PAGE 29 | I&M BANK LTD REPORT & CONSOLIDATED FINANCIAL STATEMENTS 2011
Consolidated statement of financial position at 31 December 2011 2011 2010
Note KShs KShsASSETSCash and balances with Central Banks 16 6,998,087,179 5,478,824,847
Loans and advances to banks 17 9,909,058,869 6,095,811,170
Loans and advances to customers 18 (a) 66,365,869,990 50,257,348,920
Investment securities 19 19,685,791,796 20,787,432,263
Property and equipment 21 1,915,489,873 1,734,367,046
Intangible asset - Goodwill 22 (a) 1,116,975,611 1,115,093,937
Intangible assets - software 22 (b) 108,047,505 59,174,050
Prepaid operating lease rentals 23 250,883,040 139,594,697
Deferred tax asset 24 324,148,418 299,808,134
Other assets 25 1,389,360,098 914,698,425
TOTAL ASSETS 108,063,712,379 86,882,153,489
LIABILITIES AND SHAREHOLDERS’ EQUITYLiabilitiesDeposits from banks 26 2,546,060,409 1,393,755,221
Deposits from customers 27 85,212,903,828 68,208,428,320
Tax payable 326,369,628 346,275,667
Other liabilities 28 1,375,934,460 940,007,309
Long term borrowings 29 3,435,773,450 2,143,250,130
92,897,041,775 73,031,716,647
Shareholders’ equity (Page 33&34)Share capital 30 (a) 2,880,245,300 2,870,245,300
Share premium 30 (d) 3,773,237,119 3,690,214,995
Retained earnings 7,185,254,003 4,605,636,550
Revaluation reserve 30 (e) 142,330,963 142,330,963
Statutory loan loss reserve 30 (f) 91,470,947 34,475,342
Translation reserve 30 (g) 124,672,483 26,316,369
Available-for-sale reserve 30 (h) ( 327,832,140 1,463,821,402
Proposed dividends 747,424,874 527,212,930
14,616,803,549 13,360,253,851
Equity attributable to owners of the companyNon controlling interest 549,867,055 490,182,991
TOTAL SHAREHOLDERS’ EQUITY 15,166,670,604 13,850,436,842
TOTAL LIABILITIES AND SHAREHOLDERS’ EQUITY 108,063,712,379 86,882,153,489
The financial statements set out on pages 26 to 92 were approved by the Board of Directors on 22 March 2012 and were signed on its behalf by:
S B R Shah Sarit S Raja Shah M Soundararajan N P Kothari Director Director Director Secretary
The notes set out on pages 37 to 92 form an integral part of these financial statements.

Company statement of financial position at 31 December 2011 2011 2010
Note KShs KShsASSETSCash and balances with Central Bank of Kenya 16 4,194,306,060 3,243,399,025
Loans and advances to banks 17 5,249,410,628 1,029,423,036
Loans and advances to customers 18 (a) 46,778,935,277 35,642,514,986
Investment securities 19 15,638,392,183 17,919,595,908
Investment in joint venture 20 (a) 1,245,537,610 1,245,537,610
Investment in subsidiary 20 (b) 1,122,911,360 1,122,911,360
Property and equipment 21 1,311,990,698 1,246,472,112
Intangible asset - Goodwill 22 (a) 10,746,998 10,746,998
Intangible assets - Software 22 (b) 41,766,239 16,897,583
Prepaid operating lease rentals 23 250,883,040 139,594,697
Deferred tax asset 24 261,725,834 230,713,760
Other assets 25 796,665,507 688,767,590
TOTAL ASSETS 76,903,271,434 62,536,574,665
LIABILITIES AND SHAREHOLDERS’ EQUITYLiabilitiesDeposits from banks 26 1,977,206,300 932,454,803
Deposits from customers 27 56,943,705,296 45,994,961,254
Tax payable 311,262,090 339,792,151
Other liabilities 28 845,599,170 517,466,690
Long term borrowings 29 2,969,262,405 1,771,932,292
63,047,035,261 49,556,607,190
Shareholders’ equity (Page 35&36)Share capital 30 (a) 2,880,245,300 2,870,245,300
Share premium 30 (d) 3,773,237,119 3,690,214,995
Retained earnings 6,609,634,053 4,285,491,453
Revaluation reserve 30 (e) 138,233,119 138,233,119
Statutory loan loss reserve 30 (f) 23,050,924 -
Available-for-sale reserve 30 (h) ( 315,589,216 1,468,569,678
Proposed dividends 747,424,874 527,212,930
13,856,236,173 12,979,967,475
TOTAL LIABILITIES AND SHAREHOLDERS’ EQUITY 76,903,271,434 62,536,574,665
PAGE 30 | I&M BANK LTD REPORT & CONSOLIDATED FINANCIAL STATEMENTS 2011
The financial statements set out on pages 26 to 92 were approved by the Board of Directors on 22 March 2012 and were signed on its behalf by:
S B R Shah Sarit S Raja Shah M Soundararajan N P Kothari Director Director Director Secretary
The notes set out on pages 37 to 92 form an integral part of these financial statements.
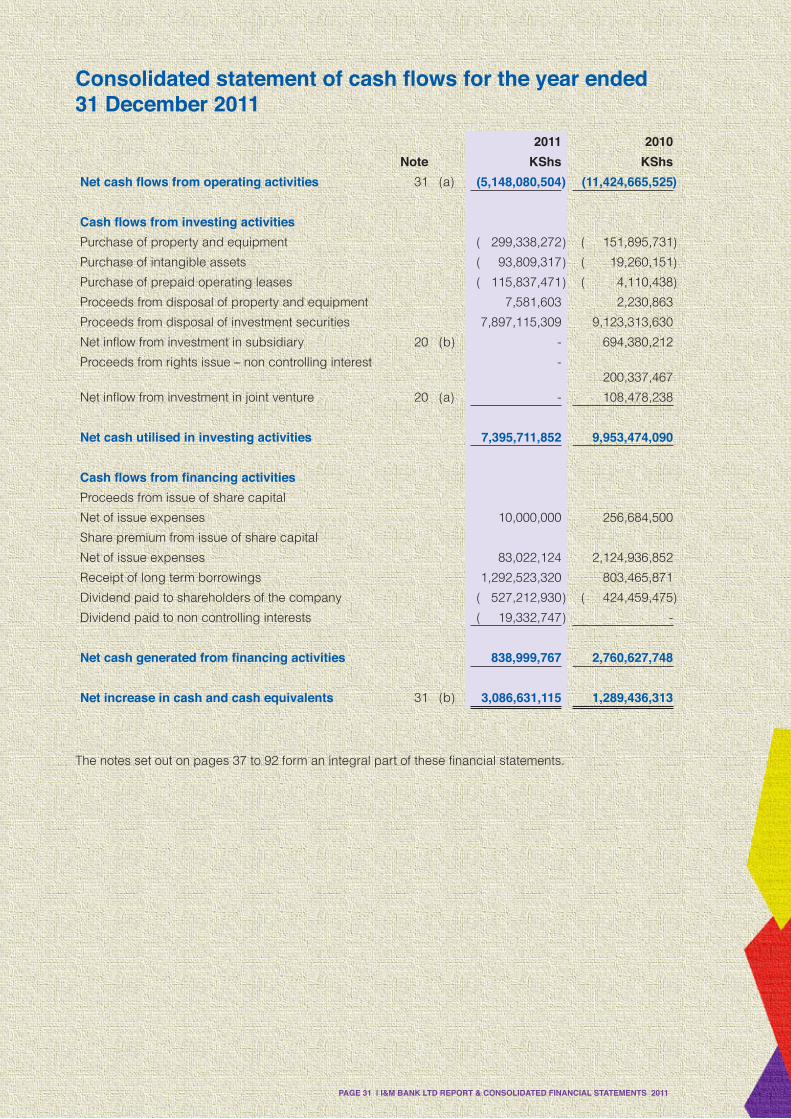
PAGE 31 | I&M BANK LTD REPORT & CONSOLIDATED FINANCIAL STATEMENTS 2011
Consolidated statement of cash flows for the year ended 31 December 2011
2011 2010Note KShs KShs
Net cash flows from operating activities 31 (a) (5,148,080,504 (11,424,665,525
Cash flows from investing activitiesPurchase of property and equipment ( 299,338,272 ( 151,895,731
Purchase of intangible assets ( 93,809,317 ( 19,260,151
Purchase of prepaid operating leases ( 115,837,471 ( 4,110,438
Proceeds from disposal of property and equipment 7,581,603 2,230,863
Proceeds from disposal of investment securities 7,897,115,309 9,123,313,630
Net inflow from investment in subsidiary 20 (b) - 694,380,212
Proceeds from rights issue – non controlling interest -200,337,467
Net inflow from investment in joint venture 20 (a) - 108,478,238
Net cash utilised in investing activities 7,395,711,852 9,953,474,090
Cash flows from financing activitiesProceeds from issue of share capital
Net of issue expenses 10,000,000 256,684,500
Share premium from issue of share capital
Net of issue expenses 83,022,124 2,124,936,852
Receipt of long term borrowings 1,292,523,320 803,465,871
Dividend paid to shareholders of the company ( 527,212,930 ( 424,459,475
Dividend paid to non controlling interests ( 19,332,747 -
Net cash generated from financing activities 838,999,767 2,760,627,748
Net increase in cash and cash equivalents 31 (b) 3,086,631,115 1,289,436,313
The notes set out on pages 37 to 92 form an integral part of these financial statements.

The notes set out on pages 37 to 92 form an integral part of these financial statements.
Company statement of cash flows for the year ended 31 December 2011
2011 2010Note KShs KShs
Net cash flows from operating activities 31 (c) (4,025,280,104 ( 11,918,197,460
Cash flows from investing activitiesPurchase of property and equipment ( 175,287,810 ( 162,474,140
Purchase of intangible assets ( 57,387,294 ( 10,516,529
Purchase of prepaid leases ( 115,837,471 ( 4,110,438
Proceeds from disposal of property and equipment 7,416,999 1,502,000
Dividends received 61,311,323 -
Investment in joint venture 20 (a) - ( 323,240,000
Investments in subsidiary 20 (b) - ( 1,122,911,360
Proceeds on investment securities 6,833,035,347 9,110,156,708
Net cash utilised in investing activities 6,553,251,094 7,488,406,241
Cash flows from financing activitiesProceeds from issue of share capital
Net of issue expenses 10,000,000 256,684,500
Share premium from issue of share capital 83,022,124 2,124,936,852
Net proceeds of long term borrowings 1,197,330,113 658,017,196
Dividend paid ( 527,212,930 ( 424,459,475
Net cash generated from financing activities 763,139,307 2,615,179,073
Net increase in cash and cash equivalents 31 (d) 3,291,110,297 ( 1,814,612,146
PAGE 32 | I&M BANK LTD REPORT & CONSOLIDATED FINANCIAL STATEMENTS 2011

Con
solid
ated
sta
tem
ent o
f cha
nges
in e
quity
for t
he y
ear e
nded
31
Dec
embe
r 201
1
The
note
s se
t out
on
pag
es 3
7 to
92
form
an
inte
gra
l par
t of t
hese
fina
ncia
l sta
tem
ents
.
PAGE 33 | I&M BANK LTD REPORT & CONSOLIDATED FINANCIAL STATEMENTS 2011
Sh
are
Shar
eR
etai
ned
Stat
utor
yR
eval
uatio
nAv
aila
ble-
for
Tran
slat
ion
Prop
osed
Non
con
trol
ling
2010
:C
apita
lpr
emiu
mea
rnin
gsre
serv
ere
serv
e-s
ale
rese
rve
rese
rve
divi
dend
s T
otal
inte
rest
Tota
l
K
Shs
KSh
sK
Shs
KSh
sK
Shs
KSh
sK
Shs
KSh
s K
Shs
KSh
s K
Shs
At 1
Jan
uary
201
0 2,
613,
560,
800
1,56
5,27
8,14
3 2,
728,
644,
540
-14
2,33
0,96
3 (
14,4
59,4
41 3
,105
,454
42
4,45
9,47
5 7,
462,
919,
934
-7,
462,
919,
934
Tota
l com
preh
ensi
ve in
com
e fo
r the
yea
r
Net
pro
fit a
fter
taxa
tion
-
-
2,43
8,68
0,28
2
-
-
-
-
-
2,43
8,68
0,28
2 85
,887
,265
2,52
4,56
7,54
7
Oth
er c
ompr
ehen
sive
inco
me
Tran
slat
ion
rese
rve
--
--
--
23,2
10,9
15
-23
,210
,915
( 1
5,63
5,66
47,
575,
251
Ava
ilab
le fo
r sa
le re
serv
e -
--
--
1,47
8,28
0,84
3 -
-1,
478,
280,
843
-1,
478,
280,
843
Sta
tuto
ry lo
an lo
ss re
serv
e
-
-
(
34,4
75,3
42
(34,
475,
342
-
-
-
-
-
-
-
Tota
l oth
er c
ompr
ehen
sive
inco
me
-
-
(
34,4
75,3
4234
,475
,342
-
1,47
8,28
0,84
323
,210
,915
-1,
501,
491,
758
( 15
,635
,664
1,48
5,85
6,09
4
Tota
l com
preh
ensi
ve in
com
e
-
-2,
404,
204,
940
34,4
75,3
42
-1,
478,
280,
843
23,2
10,9
15
-
3,94
0,17
2,04
0 70
,251
,601
4,
010,
423,
641
Tran
sact
ions
with
ow
ners
, rec
orde
d di
rect
ly in
equ
ity
Sha
re c
apita
l - a
dd
ition
al s
hare
s is
sued
25
6,68
4,50
0 2,
143,
315,
575
--
--
--
2,40
0,00
0,07
5 20
0,32
7,91
52,
600,
327,
990
Exp
ense
s on
incr
ease
of s
hare
cap
ital
-(
18
,378
,723
--
--
--
(
18,3
78,7
23-
(
18,
378,
723
Div
iden
d p
aid
- 2
009
final
-
--
--
--
(424
,459
,475
( 4
24,4
59,4
75-
( 4
24,4
59,4
75
Div
iden
d p
rop
osed
- 2
010
final
-
- (
527
,212
,930
--
--
527,
212,
930
--
-
Tota
l tra
nsac
tions
with
ow
ners
for t
he y
ear
256,
684,
500
2,12
4,93
6,85
2
( 52
7,21
2,93
0
-
-
-
-10
2,75
3,45
5 1,
957,
161,
877
200,
327,
915
2,15
7,48
9,79
2
Cha
nges
in o
wne
rshi
p in
tere
sts
in
subs
idia
ry:
Non
con
trolli
ng in
tere
st o
n sh
are
cap
ital
at a
cqui
sitio
n of
sub
sid
iary
- -
--
--
--
-44
,661
,619
44,6
61,6
19
Ret
aine
d e
arni
ngs
at a
cqui
sitio
nof
sub
sid
iary
--
--
--
--
-17
4,94
1,85
6 17
4,94
1,85
6
Tota
l cha
nges
in o
wne
rshi
p in
tere
sts
insu
bsid
iary
(not
e 20
(b))
-
-
-
-
-
-
-
-
-
219,
603,
475
219,
603,
475
Bal
ance
as
at 3
1 D
ecem
ber 2
010
2,87
0,24
5,30
0 3,
690,
214,
995
4,60
5,63
6,55
0 34
,475
,342
14
2,33
0,96
3 1,
463,
821,
402
26,3
16,3
69
527,
212,
930
13,3
60,2
53,8
51
490,
182,
991
13,8
50,4
36,8
42

Con
solid
ated
sta
tem
ent o
f cha
nges
in e
quity
for t
he y
ear e
nded
31
Dec
embe
r 201
1 (c
ontin
ued)
The
note
s se
t out
on
pag
es 3
7 to
92
form
an
inte
gra
l par
t of t
hese
fina
ncia
l sta
tem
ents
.
PAGE 34 | I&M BANK LTD REPORT & CONSOLIDATED FINANCIAL STATEMENTS 2011
Sh
are
Shar
eR
etai
ned
Stat
utor
yR
eval
uatio
nAv
aila
ble-
for
Tran
slat
ion
Prop
osed
Non
con
trol
ling
2011
:ca
pita
lpr
emiu
mea
rnin
gsre
serv
ere
serv
e-s
ale
rese
rve
rese
rve
divi
dend
s T
otal
inte
rest
Tota
l
K
Shs
KSh
sK
Shs
KSh
sK
Shs
KSh
sK
Shs
KSh
s K
Shs
KSh
s K
Shs
At 1
janu
ary
2011
2,87
0,24
5,30
0 3,
690,
214,
995
4,60
5,63
6,55
0 34
,475
,342
14
2,33
0,96
3 1,
463,
821,
402
26,
316,
369
527,
212,
930
13,3
60,2
53,8
51
490,
182,
990
13,8
50,4
36,8
41
Tota
l com
preh
ensi
ve in
com
e fo
r th
e ye
ar
Net
pro
fit a
fter
taxa
tion
-
-
3,38
4,03
7,93
2
-
-
-
-
-3,
384,
037,
932
88,6
86,0
393,
472,
723,
971
Oth
er c
ompr
ehen
sive
inco
me
Tran
slat
ion
rese
rve
--
--
--
98,3
56,1
14-
98,3
56,1
14(
9,6
69,2
2788
,686
,887
Ava
ilab
le fo
r sa
le re
serv
e -
--
--
(1,7
91,6
53,5
42-
-(
1,79
1,65
3,54
2-
( 1,
791,
653,
542
Sta
tuto
ry lo
an lo
ss re
serv
e
-
-(
56
,995
,605
56,9
95,6
05
-
-
-
-
-
-
-
Tota
l oth
er c
ompr
ehen
sive
inco
me
--
( 5
6,99
5,60
556
,995
,605
-(1
,791
,653
,542
98,3
56,1
14-
(1,6
93,2
97,4
28)
( 9
,669
,227
( 1,7
02,9
66,6
55
Tota
l com
preh
ensi
ve in
com
e
-
-3,
327,
042,
327
56,9
95,6
05
-(1
,791
,653
,542
98,3
56,1
14
-
1,69
0,74
0,50
479
,016
,812
1,76
9,75
7,31
6
Tran
sact
ions
with
ow
ners
, re
cord
ed d
irect
ly in
equ
ity
Sha
re c
apita
l - a
dd
ition
al s
hare
s is
sued
10,0
00,0
0083
,500
,000
--
--
--
93,5
00,0
00-
93,5
00,0
00
Exp
ense
s on
incr
ease
of s
hare
ca
pita
l -
(
4
77,8
76-
--
--
-(
47
7,87
6-
(
477,
876
Div
iden
d p
aid
- 2
010
final
-
--
--
--
(527
,212
,930
( 5
27,2
12,9
30(
19,3
32,7
47(
546
,545
,677
Div
iden
d p
rop
osed
- 2
011
final
-
-(
747
,424
,874
-
-
-
-74
7,42
4,87
4
-
-
-
Tota
l tra
nsac
tions
with
ow
ners
for t
he y
ear
10,0
00,0
0083
,022
,124
( 74
7,42
4,87
4
-
-
-
-22
0,21
1,94
4(
434
,190
,806
( 19,
332,
747
( 4
53,5
23,5
53
Bal
ance
as
at 3
1 D
ecem
ber 2
011
2,88
0,24
5,30
03,
773,
237,
119
7,18
5,25
4,00
391
,470
,947
142,
330,
963
( 3
27,8
32,1
4012
4,67
2,48
374
7,42
4,87
414
,616
,803
,549
549,
867,
055
15,1
66,6
70,6
04

The
note
s se
t out
on
pag
es 3
7 to
92
form
an
inte
gra
l par
t of t
hese
fina
ncia
l sta
tem
ents
.
Com
pany
sta
tem
ent o
f cha
nges
in e
quity
for t
he y
ear e
nded
31
Dec
embe
r 201
1
PAGE 35 | I&M BANK LTD REPORT & CONSOLIDATED FINANCIAL STATEMENTS 2011
Shar
eSh
are
Ret
aine
d St
atut
ory
Avai
labl
e fo
rR
eval
uatio
n P
ropo
sed
2010
:ca
pita
lpr
emiu
mea
rnin
gsre
serv
esa
le re
serv
ere
serv
edi
vide
nds
Tota
l
KSh
sK
Shs
KSh
sK
Shs
KSh
sK
Shs
KSh
s K
Shs
At 1
janu
ary
2010
2,61
3,56
0,80
0 1,
565,
278,
143
2,69
5,30
3,52
3 -
(
17,7
09,8
4913
8,23
3,11
9 42
4,45
9,47
5 7,
419,
125,
211
Tota
l com
preh
ensi
ve in
com
e fo
r th
e ye
arN
et p
rofit
afte
r ta
xatio
n
-
-
2,11
7,40
0,86
0
-
-
-
-
2,11
7,40
0,86
0
Oth
er c
ompr
ehen
sive
inco
me
Ava
ilab
le fo
r sa
le re
serv
e
-
-
-
-1,
486,
279,
527
-
-
1,48
6,27
9,52
7
Tota
l com
preh
ensi
ve in
com
e
-
-
2,11
7,40
0,86
0
-
1,48
6,27
9,52
7
-
-3,
603,
680,
387
Tran
sact
ions
with
ow
ners
re
cord
ed d
irect
ly in
equ
ityS
hare
cap
ital -
ad
diti
onal
sha
res
issu
ed25
6,68
4,50
0 2,
143,
315,
575
--
--
-2,
400,
000,
075
Exp
ense
s on
incr
ease
of s
hare
ca
pita
l-
(
18,3
78,7
23-
--
--
(
18,
378,
723
Div
iden
d p
aid
- 2
009
final
--
--
--
(42
4,45
9,47
5 (
4
24,4
59,4
75
Div
iden
d p
rop
osed
- 2
010
final
-
-
( 5
27,2
12,9
30
-
-
-52
7,21
2,93
0
-
Tota
l tra
nsac
tions
with
ow
ners
for t
he y
ear
25
6,68
4,50
0 2,
124,
936,
852
( 52
7,21
2,93
0
-
-
-10
2,75
3,45
5 1,
957,
161,
877
Bal
ance
as
at 3
1 D
ecem
ber 2
010
2,87
0,24
5,30
0 3,
690,
214,
995
4,28
5,49
1,45
3
-
1,46
8,56
9,67
8 13
8,23
3,11
9 52
7,21
2,93
0 12
,979
,967
,475

Com
pany
sta
tem
ent o
f cha
nges
in e
quity
for t
he y
ear e
nded
31
Dec
embe
r 201
1 (c
ontin
ued)
The
note
s se
t out
on
pag
es 3
7 to
92
form
an
inte
gra
l par
t of t
hese
fina
ncia
l sta
tem
ents
.
PAGE 36 | I&M BANK LTD REPORT & CONSOLIDATED FINANCIAL STATEMENTS 2011
Shar
eSh
are
Ret
aine
dSt
atut
ory
Avai
labl
e fo
rR
eval
uatio
nPr
opos
ed
2011
:ca
pita
lpr
emiu
mea
rnin
gsre
serv
esa
le re
serv
ere
serv
edi
vide
nds
Tota
l
KSh
sK
Shs
KSh
sK
Shs
KSh
sK
Shs
KSh
s K
Shs
At 1
Jan
uary
201
12,
870,
245,
300
3,69
0,21
4,99
5 4,
285,
491,
453
-1,
468,
569,
678
138,
233,
119
527,
212,
930
12,9
79,9
67,4
75
Tota
l com
preh
ensi
ve in
com
e fo
r th
e ye
arN
et p
rofit
afte
r ta
xatio
n
-
-3,
094,
618,
398
-
-
-
-3,
094,
618,
398
Oth
er c
ompr
ehen
sive
inco
me
Ava
ilab
le fo
r sa
le re
serv
e
--
--
(1,
784,
158,
894
--
( 1
,784
,158
,894
Sta
tuto
ry lo
an lo
ss re
serv
e
-
-(
23
,050
,924
23,
050,
924
-
-
-
-
Tota
l oth
er c
ompr
ehen
sive
inco
me
-
-(
23,
050,
924
23,
050,
924
(1,7
84,1
58,8
94
-
-
( 1,7
84,1
58,8
94To
tal c
ompr
ehen
sive
inco
me
-
-3,
071,
567,
474
23,
050,
924
(1,7
84,1
58,8
94
-
-
1,31
0,45
9,50
4 Tr
ansa
ctio
ns w
ith o
wne
rs
reco
rded
dire
ctly
in e
quity
Sha
re c
apita
l - a
dd
ition
al s
hare
s is
sued
10,0
00,0
00
83,
500,
000
--
--
-93
,500
,000
Exp
ense
s on
incr
ease
of s
hare
ca
pita
l -
(
4
77,8
76-
--
--
(
477
,876
Div
iden
d p
aid
- 2
010
final
--
--
--
(527
,212
,930
(
527,
212,
930
Div
iden
d p
rop
osed
- 2
011
final
- -
( 7
47,4
24,8
74
-
-
-
747,
424,
874
-
Tota
l tra
nsac
tions
with
ow
ners
for
the
year
10,0
00,0
0083
,022
,124
( 74
7,42
4,87
4
-
-
-
220,
211,
944
( 4
34,1
90,8
06
Bal
ance
as
at 3
1 D
ecem
ber 2
011
2,88
0,24
5,30
03,
773,
237,
119
6,60
9,63
4,05
323
,050
,924
( 3
15,5
89,2
1613
8,23
3,11
974
7,42
4,87
413
,856
,236
,173

Notes to the consolidated financial statements for the year ended 31 December 20111. REPORTING ENTITY
I&M Bank LIMITED is a limited liability company incorporated in Kenya under the Kenyan Companies Act, and is domiciled in Kenya. The consolidated financial statements of the group as at and for the year ended 31 December 2011 comprise the company, its joint venture and a subsidiary (together referred to as the “Group”). The Bank has 50% (2010 - 50%) interest in Bank One Limited, Mauritius (formerly First City Bank Limited), the joint venture in a bank licensed in Mauritius and 55.03% shareholding in I&M Bank (T) Limited. Both Banks are licensed in the respective countries and are in the business of banking and the provision of financial services. The Bank primarily is involved in provision of an extensive range of banking, financial and related services permitted under the Kenyan Banking Act (Cap.488). The address of its registered office is as follows:
I&M Bank House2nd Ngong AvenuePO Box 3023800100 Nairobi GPO
2. BASIS OF PREPARATION
(a) Statement of compliance
The financial statements have been prepared in accordance with International Financial Reporting Standards (IFRSs).
(b) Basis of measurement
The financial statements have been prepared under the historical cost basis of accounting except for the following:
• derivative financial instruments are measured at fair value • available-for-sale financial assets are measured at fair value
(c) Functional and presentation currency
These financial statements are presented in Kenya Shillings (KShs), which is the Bank’s functional currency.
Items included in the financial statements are measured using the currency of primary economic environment in which the entity operates i.e. Kenya Shillings
(d) Use of estimates and judgments
The preparation of financial statements in conformity with IFRS requires management to make judgments, estimates and assumptions that affect the application of policies and reported amounts of assets and liabilities and disclosures of contingent assets and liabilities at the date of the financial statements and the reported amounts of revenues and expenses during the reporting period. The estimates and assumptions are based on the Directors’ best knowledge of current events, actions, historical experience and various other factors that are believed to be reasonable under the circumstances, the results of which form the basis of making the judgments about the carrying values of assets and liabilities that are not readily apparent from other sources. Actual results may differ from these estimates.
The estimates and underlying assumptions are reviewed on an ongoing basis. Revisions to accounting estimates are recognized in the period in which the estimate is revised if the revision affects only that period or in the period of the revision and future periods if the revision affects both current and future periods.
In particular, information about significant areas of estimation and critical judgments in applying accounting policies that have the most significant effect on the amount recognized in the financial statements is described in Note 5.
PAGE 37 | I&M BANK LTD REPORT & CONSOLIDATED FINANCIAL STATEMENTS 2011

Notes to the consolidated financial statements for the year ended 31 December 2011 (continued)
3. SIGNIFICANT ACCOUNTING POLICIES
The principal accounting policies adopted in the preparation of these financial statements are set out below:
(a) Basis of consolidation
(i) Jointly controlled entityJointly controlled entities are accounted for using the proportionate consolidation method. The balance sheet of the Group includes its share of the assets and liabilities and the income statement includes its share of income and the expenses of the jointly controlled entity. The Bank has 50% (2010 - 50%) control over Bank One Limited (formerly First City Bank Limited – Mauritius) with the other joint venturer, CIEL Investments Limited.
(ii) SubsidiarySubsidiaries are those entities controlled by the Group. Control exists when the Group has the power, directly or indirectly, to govern the financial and operating policies of an enterprise so as to obtain the benefits from its activities. In assessing control, potential voting rights that currently are exercisable are taken into account. The financial statements of the subsidiaries are included in the consolidated financial statements from the date that control commences until the date that control ceases.
The purchase method of accounting is used to account for the acquisition of subsidiaries by the Group. The cost of an acquisition is measured as the fair value of the assets given, equity instruments issued and liabilities incurred or assumed at the date of exchange, plus costs directly attributable to the acquisition. Identifiable assets acquired and liabilities and contingent liabilities assumed in a business combination are measured initially at their fair values at the acquisition date, irrespective of the extent of any non-controlling interest. The excess of the cost of acquisition over the fair value of the Group’s share of the identifiable net assets acquired is recorded as goodwill. If the cost of acquisition is less than the fair value of the net assets of the subsidiary acquired, the difference is recognised directly in the income statement.
Inter-company transactions, balances and unrealised gains on transactions between group companies are eliminated. Unrealised losses are also eliminated unless the transaction provides evidence of an impairment of the asset transferred. Accounting policies of subsidiaries have been changed where necessary to ensure consistency with the policies adopted by the Group. (b) Foreign currencies
Foreign currency transactions are translated into the functional currency using the exchange rates prevailing at the dates of the transactions. Foreign exchange gains and losses resulting from the settlement of such transactions and from the translation at year-end exchange rates of monetary assets and liabilities denominated in foreign currencies are recognised in the income statement in the year in which they arise.
Translation differences on non-monetary items, such as equities held at fair value through profit or loss, are reported as part of the fair value gain or loss. Translation differences on non-monetary items, such as equities classified as available-for-sale financial assets, are included in the fair value reserve in equity.
The results and financial position of the joint venture and subsidiary have been translated into the presentation currency as follows:
i. assets and liabilities at each reporting period are translated at the closing rate;ii. income and expenses for each income statement are translated at average exchange rates (unless this
average is not a reasonable approximation of the cumulative effect of the rates prevailing on the transaction dates, in which case income and expenses are translated at the dates of the transactions); and
iii. all resulting exchange differences are recognised as a separate component of equity.
On consolidation, exchange differences arising from the translation of the net investment in foreign entities, and of borrowings and other currency instruments designated as hedges of such investments, are taken to shareholders’ equity. When a foreign operation is sold, such exchange differences are recognised in the income statement as part of the gain or loss on sale.
PAGE 38 | I&M BANK LTD REPORT & CONSOLIDATED FINANCIAL STATEMENTS 2011

3. SIGNIFICANT ACCOUNTING POLICIES (continued)(b) Foreign currencies (continued)
Goodwill and fair value adjustments arising on the acquisition of a foreign entity are treated as assets and liabilities of the foreign entity and translated at the closing rate.
(c) Income recognition
Income is derived substantially, from banking business and related activities and comprises net interest income, fee and commission income and net trading income.
For available-for-sale assets and financial assets and liabilities held at amortised cost, interest income and interest expense is recognised in the income statement using the effective interest rate method.
Gains and losses arising from changes in the fair value of financial assets and liabilities at fair value through the income statement, as well as any interest receivable or payable, is included in the income statement in the period in which they arise. Gains and losses arising from changes in the fair value of available-for-sale financial assets, other than foreign exchange gains or losses from monetary items, are recognised directly in equity, until the financial asset is derecognised or impaired at which time the cumulative gain or loss previously recognised in equity is recognised in the income statement.
(i) Net interest incomeInterest income and expense on available-for-sale assets and financial assets or liabilities held at amortised cost is recognised in the income statement using the effective interest method. The effective interest method is a method of calculating the amortised cost of a financial asset or a financial liability and allocating interest income or interest expense over the relevant period.
The effective interest rate is the rate that discounts estimated future cash payments or receipts through the expected life of the financial instrument or, when appropriate, a shorter period, to the net carrying amount of the financial asset or financial liability.
The effective interest rate is established on initial recognition of the financial asset and liability and is not revised subsequently. When calculating the effective interest rate, the Bank estimates the cash flows considering all contractual terms of the financial instrument but does not consider future credit losses. The calculation includes all fees and points paid or received, between the parties to the contract that are an integral part of the effective interest rate, transaction costs and all other discounts and premiums. Transaction costs are incremental costs that are directly attributable to the acquisition, issue or disposal of a financial asset or liability.
Once a financial asset or a group of similar financial assets has been written down as a result of an impairment loss, interest income is recognised using the rate of interest used to discount the future cash flows for the purpose of measuring the impairment loss.
Interest income and expense on all trading assets and liabilities are considered to be incidental to the Group’s trading operations and are presented together with all other changes in the fair value of trading assets and liabilities in net trading income.
(ii) Fee and commission incomeFee and commission income and expenses that are integral to the effective interest rate of a financial asset or liability are included in the measurement of the effective interest rate. Other fee and commission expense relates mainly to transaction and service fees, which are expensed as the services are received.
(iii) Net trading incomeNet trading income comprises gains less losses related to trading assets and liabilities and includes all realised and unrealised fair value changes, interest and foreign exchange differences.
(iv) Rental income – other operating incomeRental income from I&M Tower is recognised in the income statement on a straight-line basis over the term of the lease.
PAGE 39 | I&M BANK LTD REPORT & CONSOLIDATED FINANCIAL STATEMENTS 2011
Notes to the consolidated financial statements for the year ended 31 December 2011 (continued)

3. SIGNIFICANT ACCOUNTING POLICIES (continued)(c) Income recognition (continued)
(v) Dividends Dividends income is recognised when the right to receive income is established. Dividends are reflected as a component of operating income. (d) Income tax expense
Income tax expense comprises current and deferred tax. Income tax expense is recognised in the income statement except to the extent that it relates to items recognised directly in equity, in which case it is recognised in equity.
Current tax is the expected tax payable on the taxable income for the year using tax rates enacted or substantively enacted at the balance sheet date, and any adjustment to tax payable in respect of previous years.
Deferred tax is provided using the balance sheet liability method on all temporary differences between the carrying amounts of assets and liabilities for financial reporting purposes and the amounts used for taxation purposes, except differences relating to the initial recognition of assets or liabilities which affect neither accounting nor taxable profit.
Deferred tax is calculated on the basis of the tax rates currently enacted or substantively enacted at the balance sheet date. A deferred tax asset is recognised only to the extent that it is probable that future taxable profits will be available against which the asset can be utilised. Deferred tax assets are reviewed at each balance sheet date and are reduced to the extent that it is no longer probable that the related tax benefit will be realised.
(e) Financial assets and liabilities
(i) Recognition and measurementThe Group recognises assets on the date it commits to purchase the asset. From this date, any gains or losses arising from changes in fair value of the assets are recognised in the profit and loss account for financial assets at fair value through profit and loss. While gains and losses arising from changes in fair value of available-for-sale financial assets are recognised directly in equity, until the financial asset is derecognised or impaired at which time the cumulative gain or loss previously recognised in equity should be recognised in profit and loss account.
Held to maturity instruments and loans and receivables are recognised on the day they are transferred to the Group.
(ii) DerecognitionA financial asset is derecognised when the Group loses control over the contractual rights that comprise that asset. This occurs when the rights are realised, expire or are surrendered. A financial liability is derecognised when it is extinguished.
Available-for-sale assets and assets held for trading that are sold are derecognised and corresponding receivables from the buyer for the payment are recognised as of the date the Group commits to sell the assets. The Group uses the specific identification method to determine the gain or loss on derecognition.
Held-to-maturity instruments and originated loans and receivables are derecognised on the day they are transferred by the Group.
(iii) Offsetting of financial assets and liabilitiesFinancial assets and liabilities are offset and the net amount reported on the balance sheet when there is a legally enforceable right to offset the recognised amounts and there is an intention to settle on a net basis, or to realise the asset and settle the liability simultaneously.
PAGE 40 | I&M BANK LTD REPORT & CONSOLIDATED FINANCIAL STATEMENTS 2011
Notes to the consolidated financial statements for the year ended 31 December 2011 (continued)

3. SIGNIFICANT ACCOUNTING POLICIES (continued)(e) Financial assets and liabilities (continued)
(iv) Amortised cost measurement
The amortised cost of a financial asset or liability is the amount at which the financial asset or liability is measured at initial recognition, minus principal repayments, plus or minus the cumulative amortisation using the effective interest method of any difference between the initial amount recognised and the maturity amount, minus any reduction for impairment
(v) Identification and measurement of impairment of financial assets At each balance sheet date, the Group assesses whether there is objective evidence that a financial asset not carried at fair value through the income statement is impaired. Financial assets are impaired when objective evidence demonstrates that a loss event has occurred after the initial recognition of the asset, and that the loss event has an impact on the future cash flows on the asset than can be estimated reliably.
The Group considers evidence of impairment at both a specific asset and collective level. All individually significant financial assets are assessed for specific impairment. All significant assets found not to be specifically impaired are then collectively assessed for any impairment that has been incurred but not yet identified. Assets that are not individually significant are then collectively assessed for impairment by grouping together financial assets (carried at amortised cost) with similar risk characteristics.
Objective evidence that financial assets (including equity securities) are impaired can include default or delinquency by a borrower, restructuring of a loan or advance by the Group on terms that the Group would otherwise consider, indications that a borrower or issuer will enter bankruptcy, the disappearance of an active market for a security, or other observable data relating to a group of assets such as adverse changes in the payment status of borrowers or issuers in the group, or economic conditions that correlate with defaults in the Group.
In assessing collective impairment, the Group uses statistical modelling of historical trends of the probability of default, timing of recoveries and the amount of loss incurred, adjusted for management’s judgement as to whether current economic and credit conditions are such that the actual losses are likely to be greater or less than suggested by historical modelling. Default rate, loss rates and the expected timing of future recoveries are regularly benchmarked against actual outcomes to ensure that they remain appropriate. Impairment losses on assets carried at amortised cost are measured as the difference between the carrying amount of the financial assets and the present value of estimated cash flows discounted at the assets’ original effective interest rate. Losses are recognised in the income statement and reflected in an allowance account against loans and advances. Interest on the impaired asset continues to be recognised through the unwinding of the discount.
When a subsequent event causes the amount of impairment loss to decrease, the impairment loss is reversed through the income statement.
Impairment losses on available-for-sale investment securities are recognised by transferring the difference between the amortised acquisition cost and current fair value out of equity to the income statement. When a subsequent event causes the amount of impairment loss on an available-for-sale debt security to decrease, the impairment loss is reversed through the income statement.
However, any subsequent recovery in the fair value of an impaired available-for-sale equity security is recognised directly in equity. Changes in impairment provisions attributable to time value are reflected as a component of interest income.
(vi) Designation at fair value through profit or lossThis category has two subcategories: financial assets held for trading and those designated at fair value through profit or loss at inception. A financial asset is classified in this category if acquired principally for the purpose of selling in the short-term or if so designated by management.
Note 6 sets out the amount of each class of financial asset or liability that has been designated at fair value through profit or loss. A description of the basis for each designation is set out in the note for the relevant asset or liability class.
PAGE 41 | I&M BANK LTD REPORT & CONSOLIDATED FINANCIAL STATEMENTS 2011
Notes to the consolidated financial statements for the year ended 31 December 2011 (continued)

3. SIGNIFICANT ACCOUNTING POLICIES (continued)(f) Cash and cash equivalents
For the purpose of presentation in the cash flow statement in the financial statements, the cash and cash equivalents include cash and balances with the Central Bank of Kenya which are available to finance the Bank’s day to day operations, net balances from banking institutions, and treasury bills and bonds which mature within 90 days or less from the date of acquisition.
(g) Loans and receivables
Loans and receivables are non-derivative financial assets with fixed or determinable payments and fixed maturities that are not quoted in an active market and that the Group does not intend to sell immediately or in the near term. They arise when the Bank provides money directly to a debtor with no intention of trading the receivable. Loans and receivables are initially measured at fair value plus incidental direct cost and subsequently measured at amortised cost using effective interest method. Loans and receivables comprise loans and advances and placement with other banks. (h) Investment securities
Investment securities are initially measured at fair value plus incremental direct transaction costs and subsequently accounted for depending on their classification either as held-to-maturity or available-for-sale.
(i) Held-to-maturityHeld-to-maturity assets are non-derivative financial assets with fixed or determinable payments and fixed maturity that the Group has the positive intent and ability to hold to maturity. Were the bank to sell, other than insignificant amount of held-to-maturity assets, the entire category would be tainted and reclassified as available for sale. These include treasury bills and bonds and other investments.
(ii) Available-for-saleAvailable-for-sale assets are financial assets that are not held for trading purposes, originated by the Bank, or held to maturity. Available-for-sale investments are those intended to be held for an indefinite period of time, which may be sold in response to needs for liquidity or changes in interest rates, exchange rates or equity prices.
Financial liabilities are classified either as trading financial liabilities or other financial liabilities.
Other financial liabilities include customer deposits, borrowings and deposits from banking and non-banking financial institutions.
(i) Property and equipment
Items of property and equipment are stated at historical cost or valuation less accumulated depreciation and impairment losses.
Depreciation is charged on a straight line basis to allocate the cost of each asset, to its residual value over its estimated useful life as follows: -
• Buildings 2%• Leasehold improvements 10-121/2% or over the period of lease if shorter than 8 years• Computer equipment and computer software 20-331/3%• Furniture, fittings & fixtures 10- 121/2% • Motor vehicles 20 -25%
The assets’ residual values and useful lives are reviewed and adjusted as appropriate, at each balance sheet date.
Gains or losses on disposal of property, plant and equipment are determined by reference to their carrying amount and are taken into account in determining the operating profit.
PAGE 42 | I&M BANK LTD REPORT & CONSOLIDATED FINANCIAL STATEMENTS 2011
Notes to the consolidated financial statements for the year ended 31 December 2011 (continued)

3. SIGNIFICANT ACCOUNTING POLICIES (continued)(j) Intangible assets
(i) Computer softwareThe costs incurred to acquire and bring to use specific computer software licences are capitalised. The costs are amortised on a straight line basis over the expected useful lives, from the date it is available for use, not exceeding three years. Costs associated with maintaining software are recognised as an expense as incurred.
(ii) GoodwillGoodwill represents the excess of the cost of an acquisition over the Group’s interest in the net fair value of the acquired company’s identifiable assets, liabilities and contingent liabilities as at the date of acquisition. Goodwill is stated at cost less accumulated amortisation to 31 March 2004 and any subsequent accumulated impairment losses. Effective 1 April 2004, goodwill is no longer amortised but is tested annually for impairment.
(k) Operating leases
(i) Operating leasesLeases where a significant portion of the risks and rewards of ownership are retained by the lessor, are classified as operating leases. Payments made under operating leases arrangements (whether prepaid or post paid) are charged to the income statement on a straight-line basis over the period of the lease.
(ii) Financial lease receiptsMinimum lease receipts are apportioned between the interest income and the reduction of outstanding asset. The interest income is allocated to each period during the lease term so as to produce a constant period of rate of interest on the remaining balance of the liability.
(l) Impairment for non-financial assets
The carrying amounts of the Group’s non-financial assets, other than deferred tax assets, are reviewed at each reporting date to determine whether there is any indication of impairment. If any such indication exists then the asset’s recoverable amount is estimated.
An impairment loss is recognised if the carrying amount of an asset or its cash-generating unit exceeds its recoverable amount. A cash-generating unit is the smallest identifiable asset group that generates cash flows that largely are independent from other assets and group. Impairment losses are recognised in the income statement. Impairment losses recognised in respect of cash-generating units are allocated first to reduce the carrying amount of any goodwill allocated to the units and then to reduce the carrying amount of the other assets in the unit (group of units) on a pro-rata basis.
The recoverable amount of an asset or cash-generating unit is the greater of its value in use and its fair value less costs to sell. In assessing value in use, the estimated future cash flows are discounted to their present value using a pre-tax discount rate that reflects current market assessments of the time value of money and the risks specific to the asset. (m) Derivative financial instruments
The bank uses financial instruments to hedge its exposure to foreign exchange and interest rate risks arising from operational, financing and investment activities.
Derivative financial instruments are recognised initially at fair value on the date the derivative contract is entered into. Subsequent to initial recognition, derivative financial instruments are stated at fair value.
The fair value of forward exchange contracts is the amount of the mark to market adjustment at the balance sheet date.
PAGE 43 | I&M BANK LTD REPORT & CONSOLIDATED FINANCIAL STATEMENTS 2011
Notes to the consolidated financial statements for the year ended 31 December 2011 (continued)

3. SIGNIFICANT ACCOUNTING POLICIES (continued)(n) Provisions
Provisions are recognised when the company has a present legal or constructive obligation as a result of past events and it is probable that an outflow of resources embodying economic benefits will be required to settle the obligation and a reliable estimate of the amount of the obligation can be made
(o) Employee benefits
(i) Defined contribution planThe majority of the Bank’s employees are eligible for retirement benefits under a defined contribution plan.
The assets of the defined contribution scheme are held in a separate trustee administered guarantees scheme managed by an insurance company. Retirement plans are funded by contributions from the employees and the Bank. The Bank’s contributions are charged to the income statement in the year to which they relate.
The Bank also recognizes as a liability the net obligation in respect of long term service benefits being the amount of future benefit that employees have earned in return for their service in the current and prior periods.
The employees of the Bank also contribute to the National Social Security Fund. Contributions are determined by local statute and the Bank’s contributions are charged to the income statement in the year to which they relate.
(ii) Defined benefit planThe joint venture, Bank One Limited – Mauritius, contributes to a defined benefit plan that provides for employees upon retirement and is wholly funded. The assets of the funded plan are held and administered independently by the Anglo Mauritius Assurance Society Limited.
(iii) Leave accrualThe monetary value of the unutilised leave by staff as at year end is carried in accruals as a payable and the movement in the year is debited/credited to the income statement. (iv) Share-based payment transactions The grant date fair value of options granted to employees is recognised as an employee expense, with a corresponding increase in equity, over the period that the employees become unconditionally entitled to the options. The amount recognised as an expense is adjusted to reflect the actual number of share options for which the related service and non-market vesting conditions are met. The Group acquired shares from the market and recognised the expense in the income statement upfront.
The fair value of the amount payable to employees in respect of share appreciation rights, which are settled in cash, is recognised as an expense with a corresponding increase in liabilities, over the period that the employees become unconditionally entitled to payment. The liability is re-measured at each reporting date and at settlement date. Any changes in the fair value of the liability are recognised as staff expense in profit or loss.
(p) Share capital and reserves- share issue costs
Incremental costs directly attributable to the issue of an equity instrument are deducted from initial measurement of the equity instruments.
(q) Earnings per share
Earnings per share are calculated based on the profit attributable to shareholders divided by the number of ordinary shares. Diluted earnings per share are computed using the weighted average number of equity shares and dilutive potential ordinary shares outstanding during the year. During the year there were no outstanding shares with dilutive potential.
PAGE 44 | I&M BANK LTD REPORT & CONSOLIDATED FINANCIAL STATEMENTS 2011
Notes to the consolidated financial statements for the year ended 31 December 2011 (continued)

3. SIGNIFICANT ACCOUNTING POLICIES (continued)(r) Dividends
Dividends on ordinary shares are recognised as a liability in the period in which they are declared and proposed dividends are disclosed as a separate component of equity.
(s) Contingent liabilities
Letters of credit, acceptances, guarantees and performance bonds are accounted for as off balance sheet transactions and disclosed as contingent liabilities. Estimates of the outcome and the financial effect of contingent liabilities is made by management based on the information available up to the date the financial statements are approved for issue by the directors. Any expected loss is charged to the income statement.
(t) Customer loyalty programme
I&M Bank introduced a customer loyalty programme in October 2006, for its Credit card holders. The minimum redemption points is 500 which the customer can redeem at the point of renewing the card. A customer earns 1 point for every KShs 500 transaction.
(u) Related parties
In the normal course of business, the Group enters into transactions with related parties. The related party transactions are at arms length.
(v) Fiduciary activities
The Bank commonly acts as Trustees and in other fiduciary capacities that result in the holding or placing of assets on behalf of individuals, trusts, retirement benefits plans and institutions. These assets and income arising thereon are excluded from these financial statements, as they are not assets of the Bank.
(w) Comparative information
Where necessary, comparative figures have been restated to conform with changes in presentation in the current year.
(x) New standards and interpretations not yet adopted
A number of new standards, amendments to standards and interpretations are not yet effective for the year ended 31 December 2011, and have not been applied in preparing these consolidated financial statements as follows:
• Amendments to IAS 1‘Presentation of Items of Other Comprehensive Income’ (effective 1 July 2012). The amendments require that an entity present separately the items of other comprehensive income that would be reclassified to profit or loss in the future if certain conditions are met from those that would never be reclassified to profit or loss. It however does not change the existing option to present profit or loss and other comprehensive income in two statements but changes the title of the statement of comprehensive income to the statement of profit or loss and other comprehensive income. However, an entity is still allowed to use other titles.
• Amendments to IAS 12 ‘Deferred Tax: Recovery of Underlying Assets Statements’ (effective 1 January 2012).The amendments introduce an exception to the general measurement requirements of IAS 12 ‘ Income Taxes’ in respect of investment properties measured at fair value. The measurement of deferred tax assets and liabilities, in this limited circumstance, is based on a rebuttable presumption that the carrying amount of the investment property will be recovered entirely through sale. The presumption can be rebutted only if the investment property is depreciable and held within a business model whose objective is to consume substantially all of the asset’s economic benefits over the life of the asset.
PAGE 45 | I&M BANK LTD REPORT & CONSOLIDATED FINANCIAL STATEMENTS 2011
Notes to the consolidated financial statements for the year ended 31 December 2011 (continued)

3. SIGNIFICANT ACCOUNTING POLICIES (continued)(x) New standards and interpretations not yet adopted (continued)
• IAS 19 ‘Employee Benefits’ (effective 1 January 2013).The amended IAS 19 requires that actuarial gains and losses are recognised immediately in other comprehensive income; this change will remove the corridor method and eliminate the ability for entities to recognise all changes in the defined benefit obligation and in plan assets in profit or loss, which currently is allowed under IAS 19. It also requires that expected return on plan assets recognised in profit or loss is calculated based on the rate used to discount the defined benefit obligation.
• IFRS 10 ‘Consolidated Financial Statements’ (effective 1 January 2013). This standard replaces the requirements and guidance in IAS 27 relating to consolidated financial statements. The objective of this standard is to improve the usefulness of consolidated financial statements by developing a single basis for consolidation and robust guidance for applying that basis to situations where it has proved difficult to assess control in practice and divergence has evolved. The basis for consolidation is control and it is applied irrespective of the nature of the investee.
• IFRS 11 – ‘Joint arrangements’ (effective 1 January 2013). IFRS 11 supersedes IAS 31 and SIC-13 relating to Jointly Controlled Entities. The objective of this IFRS is to establish principles for financial reporting by entities that have an interest in arrangements that are controlled jointly. It focuses on the rights and obligations of joint arrangements, rather than the legal form (as is currently the case). It further distinguishes joint arrangements between joint operations and joint ventures; and requires the equity method for jointly controlled entities that are now called joint ventures.
• IFRS 12 – ‘Disclosure of interests in other entities’ (effective 1 January 2013). The objective of this IFRS is to require an entity to disclose information that enables users of its financial statements to evaluate: the nature of, and risks associated with, its interests in other entities; and the effects of those interests on its financial position, financial performance and cash flows.
• IFRS 13 – ‘Fair value measurement’ (effective 1 January 2013). IFRS 13 replaces the fair value measurement guidance contained in individual IFRSs with a single source of fair value measurement guidance. It defines fair value, establishes a framework for measuring fair value and sets out disclosure requirements for fair value measurements. It explains how to measure fair value when it is required or permitted by other IFRSs. It does not introduce new requirements to measure assets or liabilities at fair value, nor does it eliminate the practicability exceptions to fair value measurements that currently exist in certain standards.
• IFRS 9 ‘Financial Instruments’ (effective 1 January 2015) is a new standard on financial instruments that will eventually replace IAS 39. The published standard introduces changes to the current IAS 39 rules for classification and measurement of financial assets. Under IFRS 9 there will be two measurement bases for financial assets: amortised cost and fair value. Financial assets at fair value will be recorded at fair value through the profit and loss account with a limited opportunity to record changes in fair value of certain equity instruments through other comprehensive income. Financial liabilities are excluded from the scope of the standard.
The standard also differs from existing requirements for accounting for financial assets in various other areas, such as embedded derivatives and the recognition of fair value adjustments in other comprehensive income.
The standard will be applied retrospectively (subject to the standard’s transitional provisions).
The Group is currently in the process of evaluating the potential effect of this standard. Given the nature of the Group’s operations, this standard is expected to have a pervasive impact on the Group’s financial statements.
Notes to the consolidated financial statements for the year ended 31 December 2011 (continued)
PAGE 46 | I&M BANK LTD REPORT & CONSOLIDATED FINANCIAL STATEMENTS 2011

4. RISK MANAGEMENT
This section provides details of the Bank’s exposure to risk and describes the methods used by management to control risk. The most important types of risk to which the Bank is exposed are liquidity risk, credit risk, market risk and operational risk. Market risk includes currency risk and interest rate risk.
(a) Credit risk
Credit risk is the risk of financial loss to the Bank if a customer or counterparty to a financial instrument fails to meet its contractual obligations, and arises principally from the Bank’s loans and advances to customers and other banks and investment securities. For risk management reporting purposes, the Bank considers and consolidates all elements of credit risk exposure.
The Board of Directors has delegated responsibility of the management of credit risk to its Board Credit Committee. A separate Bank Credit Risk Management Committee reporting to the Board Credit Committee is responsible for oversight of the Bank credit risk.
The Bank’s credit exposure at the balance sheet date from financial instruments held or issued for trading purposes is represented by the fair value of instruments with a positive fair value at that date, as recorded on the balance sheet.
The risk that the counter-parties to trading instruments might default on their obligation is monitored on an ongoing basis. In monitoring credit risk exposure, consideration is given to trading instruments with a positive fair value and to the volatility of the fair value of trading instruments over their remaining life.
To manage the level of credit risk, the Bank deals with counter parties of good credit standing, enters into master netting agreements wherever possible and when appropriate, obtains collateral.
Master netting agreements provide for the net settlement of contracts with the same counter-party in the event of default
An assessment of the extent to which fair values of collaterals cover existing credit risk exposure on loans and advances to customers is highlighted below.
The Bank also monitors concentrations of credit risk that arise by industry and type of customer in relation to Bank loans and advances to customers by carrying a balanced portfolio. The Bank has no significant exposure to any individual customer or counter-party.
To determine impairment of loans and advances, the Bank assesses whether it is probable that it will be unable to collect all principal and interest according to the contractual terms of the loans and advances.
PAGE 47 | I&M BANK LTD REPORT & CONSOLIDATED FINANCIALS STATEMENT 2011
Notes to the consolidated financial statements for the year ended 31 December 2011 (continued)

PAGE 48 | I&M BANK LTD REPORT & CONSOLIDATED FINANCIAL STATEMENTS 2011
Exposure to credit riskCompany:
Loans and advances to customers 2011 2010KShs KShs
Individually impairedGrade 3: Substandard 4,459,551 143,661,900
Grade 4: Impaired – Doubtful 999,994,552 1,040,742,148
1,004,454,103 1,184,404,048
Allowance for impairment ( 795,650,104 ( 746,078,522
Carrying amounts 208,803,999 438,325,526
Collectively impairedGrade 2: Watch 6,030,535,384 5,629,472,196
Grade 1: Normal 41,133,694,352 30,045,012,952
47,164,229,736 35,674,485,148
Portfolio impairment provision ( 594,098,458 ( 470,295,688
Carrying amounts 46,570,131,278 35,204,189,460
Total carrying amounts 46,778,935,277 35,642,514,986
Impaired loans and securitiesImpaired loans and securities are loans for which the Bank determines that it is probable that it will be unable to collect all principal and interest due according to the contractual terms of the loan agreement(s). These loans are graded 3 (substandard) to 5 (loss) in the Bank’s internal credit risk and grading system.
Past due but not impaired loansThese are loans where contractual interest or principal payments are past due but the Bank believes that impairment is not appropriate on the basis of the level of security/collateral available and/or the stage of collection of amounts owed to the Bank.
Loans with renegotiated terms Loans with renegotiated terms are loans that have been restructured due to the deterioration in the borrower’s financial position and where the Bank has made concession that it would not otherwise consider. Once the loan is restructured it remains in this category independent of satisfactory performance after restructuring.
Allowances for impairmentThe Bank establishes an allowance for impairment losses that represents its estimate of incurred losses in its loan portfolio. The main components of this allowance are a specific loss component that relates to individually significant exposures, and a collective loan loss allowance established for homogeneous assets in respect of losses that have been incurred but have not been identified on loans subject to individual assessment for impairment.
Notes to the consolidated financial statements for the year ended 31 December 2011 (continued)
4. RISK MANAGEMENT (continued)(a) Credit risk (continued)

PAGE 49 | I&M BANK LTD REPORT & CONSOLIDATED FINANCIAL STATEMENTS 2011
4. RISK MANAGEMENT (continued)(a) Credit risk (continued)
Write off policy
The Bank writes off a loan balance (and any related allowances for impairment losses) when Credit Committee determines that the loans are uncollectible. This determination is reached after considering information such as the occurrence of significant changes in the borrower/issuer’s financial position such that the borrower/issuer can no longer pay the obligation, or that proceeds from collateral will not be sufficient to pay back the entire exposure.
Set out below is an analysis of the gross and net (of allowances for impairment) amounts of individually impaired assets by risk grade.
Loans and advances Gross NetKShs KShs
Company:31 December 2011Grade 3: individually impaired 4,459,551 2,824,936
Grade 4: individually impaired 999,994,552 205,979,063
1,004,454,103 208,803,999
31 December 2010Grade 3: individually impaired 143,661,900 125,709,174
Grade 4: individually impaired 1,040,742,148 312,616,352
1,184,404,048 438,325,526The Bank holds collaterals against loans and advances to customers in the form of mortgage interests over property, other registered securities over assets, and guarantees. Estimate of fair value are based on the value of collateral assessed at the time of borrowing, and generally are not updated except when a loan is individually assessed as impaired. Collateral generally is not held over loans and advances to banks, except when securities are held as part of reverse repurchase and securities borrowings activity. Collateral usually is not held against investment securities, and no such collateral was held at 31 December 2011 or 2010.
An estimate of the fair value of collateral and other security enhancements held against financial assets is shown below:
Loans and advances to customers 2011 2010KShs KShs
CompanyFair value of collateral held:
- Against impaired loans 232,249,593 434,562,555
(b) Liquidity risk
Liquidity risk includes the risk of being unable to meet the Bank’s financial obligations as they fall due because of inability to liquidate assets at a reasonable price and in an appropriate timeframe.
The Bank continually assesses liquidity risk by identifying and monitoring changes in funding required to meet business goals and targets set in terms of the overall Bank strategy. In addition, the Bank holds a portfolio of liquid assets as part of its liquidity risk management strategy.
Notes to the consolidated financial statements for the year ended 31 December 2011 (continued)

PAGE 50 | I&M BANK LTD REPORT & CONSOLIDATED FINANCIAL STATEMENTS 2011
2011 2010At 31 December 38.32% 43.47%
Average for the period 37.83% 42.25%
Highest for the period 44.13% 44.69%
Lowest for the period 32.26% 36.43%
The table below analyses financial liabilities into relevant maturity groupings based on the remaining period at 31 December 2011 to the contractual maturity date:
Company31 December 2011:
Due on demand
KShs’000
Due within 3 months
KShs’000
Due between
3-12 months
KShs’000
Due between
1-5 yearsKShs’000
Due after 5 years
KShs’000
TotalKShs’000
LiabilitiesDeposits from banksDeposits from customersOther liabilitiesLong-term borrowings
322,66218,861,530
506,543-
1,484,40821,552,006
339,056128,895
170,13616,492,255
-352,528
-37,914
-2,133,389
---
354,450
1,977,20656,943,705
845,5992,969,262
At 31 December 2011 19,690,735 23,504,365 17,014,919 2,171,303 354,450 62,735,772
Deposits from customers represent business transaction, personal transaction, savings, call and fixed deposit balances, which past experience has shown to be stable.
(c) Market risk
Market risk is the risk that changes in market prices, such as interest rate, equity prices, foreign exchange rates and credit spread (not relating to changes in the obligator’s/issuer’s credit standing) will affect the Bank’s income or the value of its holdings of financial instruments.
All trading instruments are subject to market risk, the risk that the future changes in market conditions may make an instrument less valuable or more onerous. The Bank manages its use of trading instruments in response to changing market conditions.
The Board of Directors has delegated responsibility for management of Market Risk to the Board Risk Committee. Exposure to market risk is formally managed within Risk Limits and Policy Guidelines issued by the Board, on recommendation of the Board Risk Committee. ALCO, a Management Committee is charged with the responsibility of ensuring implementation and monitoring of the Risk Management framework in line with Policy Guidelines. The Bank is primarily exposed to Interest Rate and Foreign Exchange Risk. The policy guidelines and procedures in place are adequate to effectively manage these risks.
Company31 December 2010:
Due on demand
KShs’000
Due within 3 months
KShs’000
Due between
3-12 months
KShs’000
Due between
1-5 yearsKShs’000
Due after 5 years
KShs’000 Total
KShs’000LiabilitiesDeposits from banksDeposits from customersOther liabilitiesLong-term borrowings
245,74915,380,086
287,257-
686,70618,095,550
230,21052,489
-12,419,026
-91,219
-100,299
-1,359,051
---
269,173
932,45545,994,961
517,4671,771,932
At 31 December 2010 15,913,092 19,064,955 12,510,245 1,459,350 269,173 49,216,815
The liquidity ratios at the reporting date and during the reporting period (based on month end ratios) were as follows:
Notes to the consolidated financial statements for the year ended 31 December 2011 (continued)
4. RISK MANAGEMENT (continued)(b) Liquidity risk (continued)

PAGE 51 | I&M BANK LTD REPORT & CONSOLIDATED FINANCIAL STATEMENTS 2011
Not
es to
the
cons
olid
ated
fina
ncia
l sta
tem
ents
for t
he y
ear e
nded
31
Dec
embe
r 201
1 (c
ontin
ued)
Exp
osur
e to
Inte
rest
Rat
e R
isk
This
is th
e ris
k of
loss
from
fluc
tuat
ions
in th
e fu
ture
cas
h flo
ws
of fa
ir va
lues
of f
inan
cial
inst
rum
ents
bec
ause
of a
cha
nge
in m
arke
t int
eres
t rat
es. I
nter
est r
ate
risk
is m
anag
ed
prin
cip
ally
thro
ugh
mon
itorin
g in
tere
st ra
te g
aps.
A s
umm
ary
of th
e B
ank’
s in
tere
st ra
te g
ap p
ositi
on re
flect
ing
ass
ets
and
liab
ilitie
s at
car
ryin
g a
mou
nts,
cat
egor
ised
by
the
earli
er o
f con
trac
tual
re-p
ricin
g o
r m
atur
ity d
ates
is s
how
n b
elow
:
4. R
ISK
MA
NA
GEM
ENT
(con
tinue
d)(c
) Mar
ket r
isk
(con
tinue
d)
31 D
ecem
ber 2
011:
Due
on
dem
and
KSh
s’00
0
Due
with
in
3 m
onth
s K
Shs’
000
Due
be
twee
n 3-
12
mon
ths
KSh
s’00
0
Due
be
twee
n1-
5 ye
ars
KSh
s’00
0
Due
afte
r 5
year
s K
Shs’
000
Non
-in
tere
st
bear
ing
KSh
s’00
0To
tal
KSh
s’00
0A
sset
sC
ash
and
bal
ance
s w
ith C
entr
al B
ank
of K
enya
Loan
s an
d a
dva
nces
to b
anks
Loan
s an
d a
dva
nces
to c
usto
mer
sIn
vest
men
t sec
uriti
esO
ther
ass
ets
At 3
1 D
ecem
ber 2
011
Liab
ilitie
sD
epos
its fr
om b
anks
Dep
osits
from
cus
tom
ers
Oth
er li
abili
ties
Long
-ter
m b
orro
win
gs
At 3
1 D
ecem
ber 2
011
-1,
812,
148
18,5
14,8
59 677 -
-2,
461,
623
1,67
7,56
439
5,66
5 -
-97
5,64
02,
270,
049
1,98
2,95
5 -
- -14
,598
,898
5,80
6,80
0 -
- -9,
683,
665
7,45
2,29
5 -
4,19
4,30
6 - - -79
6,66
6
4,19
4,30
65,
249,
411
46,7
78,9
3515
,638
,392
796,
666
20,4
07,6
844,
534,
852
5,22
8,64
420
,405
,698
17,1
35,9
604,
990,
972
72,7
03,8
10
322,
662
18,8
61,5
30- -
1,48
4,40
821
,552
,006
-12
8,89
5
170,
136
16,4
92,2
56-
352,
528
-37
,913
-2,
133,
389
- - -35
4,45
0
- -84
5,59
9 -
1,97
7,20
656
,943
,705
845,
599
2,96
9,26
2
19,1
84,1
9223
,165
,309
17,0
14,9
202,
171,
302
354,
450
845,
599
62,7
35,7
72
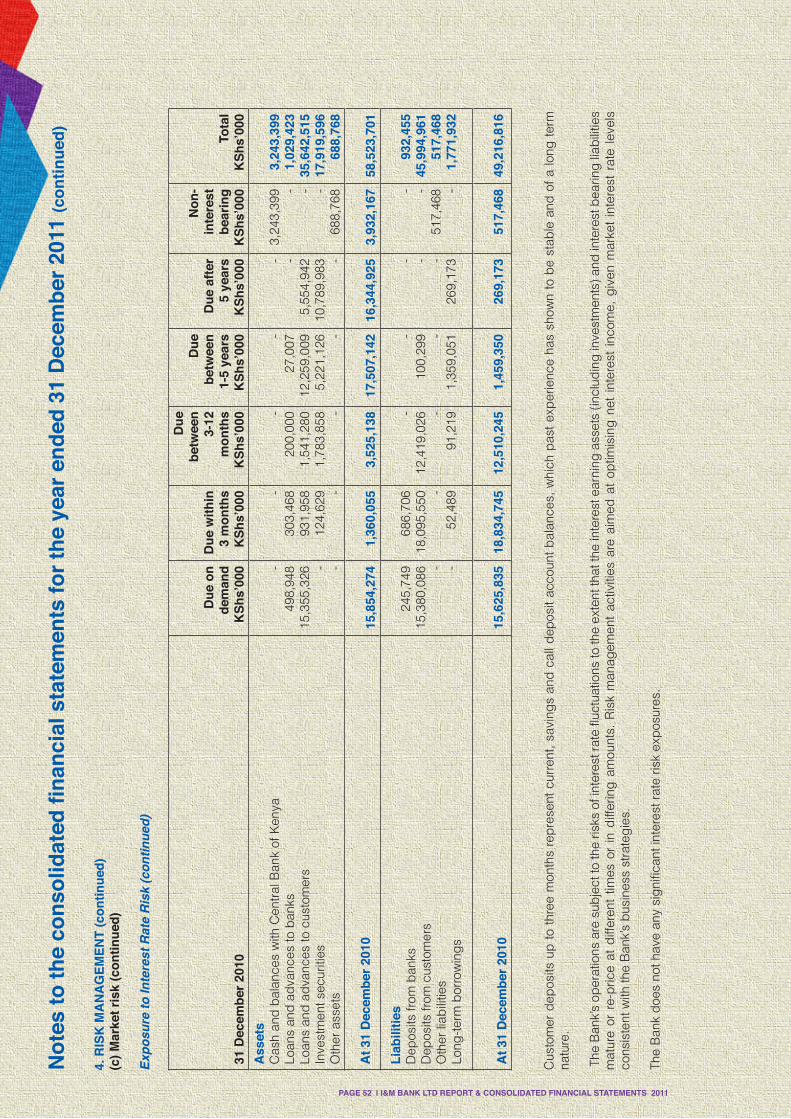
PAGE 52 | I&M BANK LTD REPORT & CONSOLIDATED FINANCIAL STATEMENTS 2011
Not
es to
the
cons
olid
ated
fina
ncia
l sta
tem
ents
for t
he y
ear e
nded
31
Dec
embe
r 201
1 (c
ontin
ued)
Cus
tom
er d
epos
its u
p t
o th
ree
mon
ths
rep
rese
nt c
urre
nt,
savi
ngs
and
cal
l dep
osit
acco
unt
bal
ance
s, w
hich
pas
t ex
per
ienc
e ha
s sh
own
to b
e st
able
and
of
a lo
ng t
erm
na
ture
.
The
Ban
k’s
oper
atio
ns a
re s
ubje
ct to
the
risks
of i
nter
est r
ate
fluct
uatio
ns to
the
exte
nt th
at th
e in
tere
st e
arni
ng a
sset
s (in
clud
ing
inve
stm
ents
) and
inte
rest
bea
ring
liab
ilitie
s m
atur
e or
re-
pric
e at
diff
eren
t tim
es o
r in
diff
erin
g a
mou
nts.
Ris
k m
anag
emen
t ac
tiviti
es a
re a
imed
at
optim
isin
g n
et i
nter
est
inco
me,
giv
en m
arke
t in
tere
st r
ate
leve
ls
cons
iste
nt w
ith th
e B
ank’
s b
usin
ess
stra
teg
ies.
The
Ban
k d
oes
not h
ave
any
sig
nific
ant i
nter
est r
ate
risk
exp
osur
es.
4. R
ISK
MA
NA
GEM
ENT
(con
tinue
d)(c
) Mar
ket r
isk
(con
tinue
d)
Exp
osur
e to
Inte
rest
Rat
e R
isk
(con
tinue
d)
31 D
ecem
ber 2
010
Due
on
dem
and
KSh
s’00
0
Due
with
in
3 m
onth
s K
Shs’
000
Due
be
twee
n 3-
12
mon
ths
KSh
s’00
0
Due
be
twee
n1-
5 ye
ars
KSh
s’00
0
Due
afte
r 5
year
s K
Shs’
000
Non
-in
tere
st
bear
ing
KSh
s’00
0To
tal
KSh
s’00
0A
sset
sC
ash
and
bal
ance
s w
ith C
entr
al B
ank
of K
enya
Loan
s an
d a
dva
nces
to b
anks
Loan
s an
d a
dva
nces
to c
usto
mer
sIn
vest
men
t sec
uriti
esO
ther
ass
ets
At 3
1 D
ecem
ber 2
010
Liab
ilitie
sD
epos
its fr
om b
anks
Dep
osits
from
cus
tom
ers
Oth
er li
abili
ties
Long
-ter
m b
orro
win
gs
At 3
1 D
ecem
ber 2
010
-49
8,94
815
,355
,326
- -
-30
3,46
893
1,95
812
4,62
9 -
-20
0,00
01,
541,
280
1,78
3,85
8 -
-27
,007
12,2
59,0
095,
221,
126 -
- -5,
554,
942
10,7
89,9
83-
3,24
3,39
9 - - -68
8,76
8
3,24
3,39
91,
029,
423
35,6
42,5
1517
,919
,596
688,
768
15,8
54,2
741,
360,
055
3,52
5,13
817
,507
,142
16,3
44,9
253,
932,
167
58,5
23,7
01
245,
749
15,3
80,0
86- -
686,
706
18,0
95,5
50-
52,4
89
-12
,419
,026
-91
,219
-10
0,29
9 -1,
359,
051
- - -26
9,17
3
- -51
7,46
8 -
932,
455
45,9
94,9
6151
7,46
81,
771,
932
15,6
25,8
3518
,834
,745
12,5
10,2
451,
459,
350
269,
173
517,
468
49,2
16,8
16

PAGE 53 | I&M BANK LTD REPORT & CONSOLIDATED FINANCIAL STATEMENTS 2011
Not
es to
the
cons
olid
ated
fina
ncia
l sta
tem
ents
for t
he y
ear e
nded
31
Dec
embe
r 201
1(co
ntin
ued)
Cur
renc
y R
ate
Ris
k
The
Ban
k is
exp
osed
to
curr
ency
ris
k th
roug
h tr
ansa
ctio
ns in
for
eig
n cu
rren
cies
. Th
e B
ank’
s tr
ansa
ctio
nal e
xpos
ure
giv
es r
ise
to f
orei
gn
curr
ency
gai
ns a
nd lo
sses
tha
t ar
e re
cog
nise
d in
the
inco
me
stat
emen
t. In
res
pec
t of m
onet
ary
asse
ts a
nd li
abili
ties
in fo
reig
n cu
rren
cies
, the
Ban
k en
sure
s th
at it
s ne
t exp
osur
e is
kep
t to
an a
ccep
tab
le
leve
l by
buy
ing
and
sel
ling
fore
ign
curr
enci
es a
t sp
ot ra
tes
whe
n co
nsid
ered
ap
pro
pria
te. T
he ta
ble
bel
ow a
naly
ses
the
curr
enci
es to
whi
ch th
e B
ank
is e
xpos
ed to
as
at 3
1 D
ecem
ber
201
1 an
d 3
1 D
ecem
ber
201
0
4. R
ISK
MA
NA
GEM
ENT
(con
tinue
d)(c
) Mar
ket r
isk
(con
tinue
d)
31 D
ecem
ber 2
011:
USD
KSh
s’00
0G
BP
KSh
s’00
0Eu
roK
Shs’
000
Oth
erK
Shs’
000
Tota
lK
Shs’
000
Ass
ets
Cas
h an
d b
alan
ces
with
cen
tral
ban
k of
ken
yaLo
ans
and
ad
vanc
es to
ban
ksLo
ans
and
ad
vanc
es to
cus
tom
ers
Oth
er a
sset
s
185,
947
2,69
2,22
413
,563
,249
39,3
72
27,5
411,
258,
686
191,
497 -
63,4
551,
211,
654
2,04
6,55
863
3
392
67,8
20- -
277,
335
5,23
0,38
415
,801
,304
40,0
05A
t 31
Dec
embe
r 201
116
,480
,792
1,47
7,72
43,
322,
300
68,2
1221
,349
,028
Net
bal
ance
she
et p
ositi
on2,
645,
271
( 6
5,85
6(
77,
183
6,66
62,
508,
898
Net
not
iona
l off
bala
nce
shee
t pos
ition
( 2,5
13,8
0162
,281
87,4
98(1
3,06
0(2
,377
,083
Ove
rall
net p
ositi
on 2
011
131,
470
(
3,57
510
,315
( 6,
394
131,
816
Liab
ilitie
sD
epos
its fr
om b
anks
Dep
osits
from
cus
tom
ers
Oth
er li
abili
ties
Long
-ter
m b
orro
win
gs
454,
716
10,8
33,4
2522
2,37
62,
325,
004
29,1
621,
507,
803
6,61
5 -
-3,
289,
423
66,0
3144
,029
1,01
649
,157
11,3
73-
484,
894
15,6
79,8
0830
6,39
52,
369,
033
At 3
1 D
ecem
ber 2
011
13,8
35,5
211,
543,
580
3,39
9,48
361
,546
18,8
40,1
29

PAGE 54 | I&M BANK LTD REPORT & CONSOLIDATED FINANCIAL STATEMENTS 2011
Not
es to
the
cons
olid
ated
fina
ncia
l sta
tem
ents
for t
he y
ear e
nded
31
Dec
embe
r 201
1(co
ntin
ued)
4. R
ISK
MA
NA
GEM
ENT
(con
tinue
d)(c
) Mar
ket r
isk
(con
tinue
d)
Cur
renc
y R
ate
Ris
k (c
ontin
ued)
31 D
ecem
ber 2
010:
USD
KSh
s’00
0G
BP
KSh
s’00
0Eu
roK
Shs’
000
Oth
erK
Shs’
000
Tota
lK
Shs’
000
Ass
ets
Cas
h an
d b
alan
ces
with
cen
tral
ban
k of
ken
yaLo
ans
and
ad
vanc
es to
ban
ksLo
ans
and
ad
vanc
es to
cus
tom
ers
Oth
er a
sset
s
97,4
7727
5,47
510
,688
,844
27,8
12
26
,050
27,8
3926
1,34
9 -
19,6
5295
,294
865,
005
552
1,90
911
3,13
114
,987
-
145,
088
511,
739
11,8
30,1
8528
,364
At 3
1 D
ecem
ber 2
010
11,0
89,6
0831
5,23
898
0,50
313
0,02
712
,515
,376
Liab
ilitie
sD
epos
its fr
om b
anks
Dep
osits
from
cus
tom
ers
Oth
er li
abili
ties
Long
-ter
m b
orro
win
gs
841,
832
6,38
5,73
116
2,27
51,
107,
235
68,4
471,
111,
530
10,5
82-
-56
2,67
266
464
,583
7,88
743
,183
33,5
41-
918,
166
8,10
3,11
620
7,06
21,
171,
818
At 3
1 D
ecem
ber 2
010
8,49
7,07
31,
190,
559
627,
919
84,6
1110
,400
,162
Net
bal
ance
she
et p
ositi
on2,
592,
535
( 875
,321
352,
584
45,4
162,
115,
214
Net
not
iona
l off
bala
nce
shee
t pos
ition
(2,3
77,0
1977
7,47
2(4
47,7
33(3
81,7
84(2
,429
,064
Ove
rall
net p
ositi
on 2
010
215,
516
( 9
7,84
9(
95,1
49(3
36,3
68(
313
,850

PAGE 55 | I&M BANK LTD REPORT & CONSOLIDATED FINANCIAL STATEMENTS 2011
4. RISK MANAGEMENT (continued)(d) Operational risk
The overall responsibility of managing Operational Risks - the risk arising from failed or inadequate internal processes, people, systems and external events - is vested with the Board of Directors. The Board through the Board Risk Committee, issues policies that guide management on appropriate practices of operational risk mitigation. An independent Risk Manager assures the Board Risk Committee of the implementation of the said policies.
The following are key measures that the bank undertakes in managing operational risk:
• Documentation of procedures and controls, including regular review and updates to reflect changes in the dynamic business environment.
• Appropriate segregation of duties, including the independent authorisation of transactions • Reconciliation and monitoring of transactions • Compliance with regulatory and other legal requirements• Reporting of operational losses and ensuring appropriate remedial action to avoid recurrence. • Development and implementation of Business Continuity and Disaster Recovery Plans • Training and professional development of employees to ensure they are well equipped to identify and
mitigate operational risks in a timely manner.• Establishment of ethical practices at business and individual employee’s level. • Implementation of Risk mitigation parameters, including insurance where this is considered effective.
The entire operational risk management framework is subjected to periodic independent audits (internal) in order for the bank to obtain an independent opinion on the effectiveness and efficiency of the framework. Further, the findings of the Internal Audit department are reviewed by the Board Audit Committee and recommendations made implemented in line with the agreed timeframe.
(e) Capital management
Regulatory capitalThe Central Bank of Kenya sets and monitors capital requirements for all banks. The objective of the Central Bank of Kenya is to ensure that a bank maintains a level of capital which:
• Is adequate to protect its depositors and creditors; • Is commensurate with the risks associated with its activities and profile • Promotes public confidence in the bank. In implementing current capital requirements, the Central Bank of Kenya requires banks to maintain a prescribed ratio of total capital to total risk-weighted assets. Capital adequacy and use of regulatory capital are monitored regularly by management employing techniques based on the guidelines developed by the Basel Committee, as implemented by the Central Bank of Kenya for supervisory purposes.
The Central Bank of Kenya requires a bank to maintain at all times:
• a core capital of not less than 8% of total risk weighted assets, plus risk weighted off -balance sheet items• a core capital of not less than 8% of its total deposit liabilities• a total capital of not less than 12% of its total risk weighted assets, plus risk weighted off-balance sheet
items
In addition a bank must maintain a minimum core capital of KShs 1,000 million. The bank’s regulatory capital is analysed into two tiers:
• Tier 1 capital. This includes ordinary share capital , share premium, retained earnings and after deduction of investment in subsidiaries, goodwill, other intangible assets and other regulatory adjustments relating to items that are included in equity which are treated differently for capital adequacy purposes.
• Tier 2 capital. This includes 25% of revaluation reserves of property and equipment, subordinated debt not exceeding 50% of core capital, collective impairment allowances and any other approved reserves.
Risk weighted assets are arrived at using a framework of four weights applied to both on-balance sheet and off-balance sheet items to reflect the relative risk of each asset and counterparty.
Notes to the consolidated financial statements for the year ended 31 December 2011 (continued)

PAGE 56 | I&M BANK LTD REPORT & CONSOLIDATED FINANCIAL STATEMENTS 2011
The Bank’s regulatory capital position at 31 December was as follows:
Company: 2011 2010KShs KShs
Core capital (Tier 1)Share capital 2,880,245,300 2,870,245,300
Share premium 3,773,237,119 3,690,214,995
Retained earnings 6,609,634,053 4,285,491,453
13,263,116,472 10,845,951,748
Less: Goodwill ( 10,746,998 ( 10,746,998
Investment in joint venture (1,245,537,610 (1,245,537,610
Investment in subsidiary (1,122,911,360 (1,122,911,360
Total core capital 10,883,920,504 8,466,755,780
Supplementary capital (Tier 2)Term subordinated debt 337,500,000 457,500,000
Statutory loan loss reserve 23,050,924 -
360,550,924 457,500,000
Total capital 11,244,471,428 8,924,255,780
Risk weighted assetsOn-balance sheet 48,032,609,200 35,995,735,100
Off-balance sheet 12,046,222,600 8,811,464,200
Total risk weighted assets 60,078,831,800 44,807,199,300
Deposits from customers 57,250,845,000 46,632,072,586
Capital ratiosCore capital/total deposit liabilities (CBK min 8%) 19.01% 18.16%
Core capital /total risk weighted assets (CBK min 8%) 18.12% 18.90%
Total capital /total risk weighted assets (CBK min 12%) 18.72% 19.92%
(f) Compliance and regulatory risk
Compliance and regulatory risk includes the risk of bearing the consequences of non-compliance with regulatory requirements. The Compliance function is responsible for establishing and maintaining an appropriate framework of Bank compliance policies and procedures. Compliance with such policies and procedures is the responsibility of all Managers.
Notes to the consolidated financial statements for the year ended 31 December 2011 (continued)
4. RISK MANAGEMENT (continued)(e) Capital management (continued)
Regulatory capital (continued)

PAGE 57 | I&M BANK LTD REPORT & CONSOLIDATED FINANCIAL STATEMENTS 2011
5. USE OF ESTIMATES AND JUDGEMENT
The Directors are responsible for selection and disclosure of the Bank’s critical accounting policies and estimates and the application of these policies and estimates.
Key sources of estimation uncertainty - Allowance for credit losses
Assets accounted for at amortised costs are evaluated for impairment on a basis described in accounting policy 3(f)(iv). The specific component of total allowances for impairment applies to loans and advances evaluated individually for impairment and is based upon management’s best estimate of the present value of cash flows that are expected to be received. In estimating these cash flows, management makes judgements about a debtor’s financial situation and the net realizable value of any underlying collateral. Estimate of cash flows considered recoverable are independently approved by the Credit Risk committee.
Collectively assessed impaired allowances cover credit losses inherent in portfolios of loans and advances with similar economic characteristics when there is objective evidence to suggest that they contain impaired loans and advances but the individual impaired items cannot yet be identified. In considering the collective loan loss allowances, management considers the historical loan loss rate and the emergence period. The accuracy of the allowance depends on how well these estimate future cash flows for specific debtor’s allowances and the model assumptions and parameters used in determining collective allowances
Critical accounting judgements in applying the bank’s accounting policies
Critical accounting judgements made in applying the bank’s accounting policies include financial asset and liability classification. The bank’s accounting policies provide scope for assets and liabilities to be designated at inception into different accounting categories in certain circumstances.
In classifying financial assets as held to maturity, the Bank has determined that it has both positive intention and ability to hold the assets until their maturity date as required by accounting policy 3(i)(i).
Notes to the consolidated financial statements for the year ended 31 December 2011 (continued)

PAGE 58 | I&M BANK LTD REPORT & CONSOLIDATED FINANCIAL STATEMENTS 2011
Not
es to
the
cons
olid
ated
fina
ncia
l sta
tem
ents
for t
he y
ear e
nded
31
Dec
embe
r 201
1 (c
ontin
ued)
6. F
INA
NC
IAL
ASS
ETS
AN
D L
IAB
ILIT
IES
Acc
ount
ing
clas
sific
atio
ns a
nd fa
ir va
lues
The
tab
le b
elow
set
s ou
t the
Ban
k’s
clas
sific
atio
n of
eac
h cl
ass
of fi
nanc
ial a
sset
s an
d li
abili
ties,
and
thei
r fa
ir va
lues
:
31 D
ecem
ber 2
011
Hel
d to
m
atur
ityK
Shs‘
000
Loan
s an
d re
ceiv
able
sK
Shs‘
000
Avai
labl
e-fo
r-sa
leK
Shs‘
000
Oth
er
amor
tised
co
stK
Shs‘
000
Tota
l ca
rryi
ng
amou
ntK
Shs‘
000
Fair
valu
esK
Shs‘
000
Fina
ncia
l ass
ets
Cas
h an
d b
alan
ces
with
Cen
tral
Ban
k of
Ken
yaIn
vest
men
t sec
uriti
esLo
ans
and
ad
vanc
es to
ban
ksLo
ans
and
ad
vanc
es to
cus
tom
ers
Oth
er a
sset
s
Fina
ncia
l lia
bilit
ies
Dep
osits
from
ban
ksD
epos
its fr
om c
usto
mer
sLo
ng te
rm b
orro
win
gs
Oth
er li
abili
ties
-9,
147,
812 - - -
- -5,
249,
411
46,7
78,9
35-
-6,
490,
580 - - -
4,19
4,30
6 - - -79
6,66
6
4,19
4,30
615
,638
,392
5,24
9,41
146
,778
,935
796,
666
4,19
4,30
615
,638
,392
5,24
9,41
146
,778
,935
796,
666
9,14
7,81
252
,028
,346
6,49
0,58
04,
990,
972
72,6
57,7
1072
,657
,710
- - - -
- - - -
- - - -
1,97
7,20
656
,943
,705
2,96
9,26
284
5,59
9
1,97
7,20
656
,943
,705
2,96
9,26
284
5,59
9
1,97
7,20
656
,943
,705
2,96
9,26
284
5,59
9
--
-62
,735
,772
62,7
35,7
7262
,735
,772
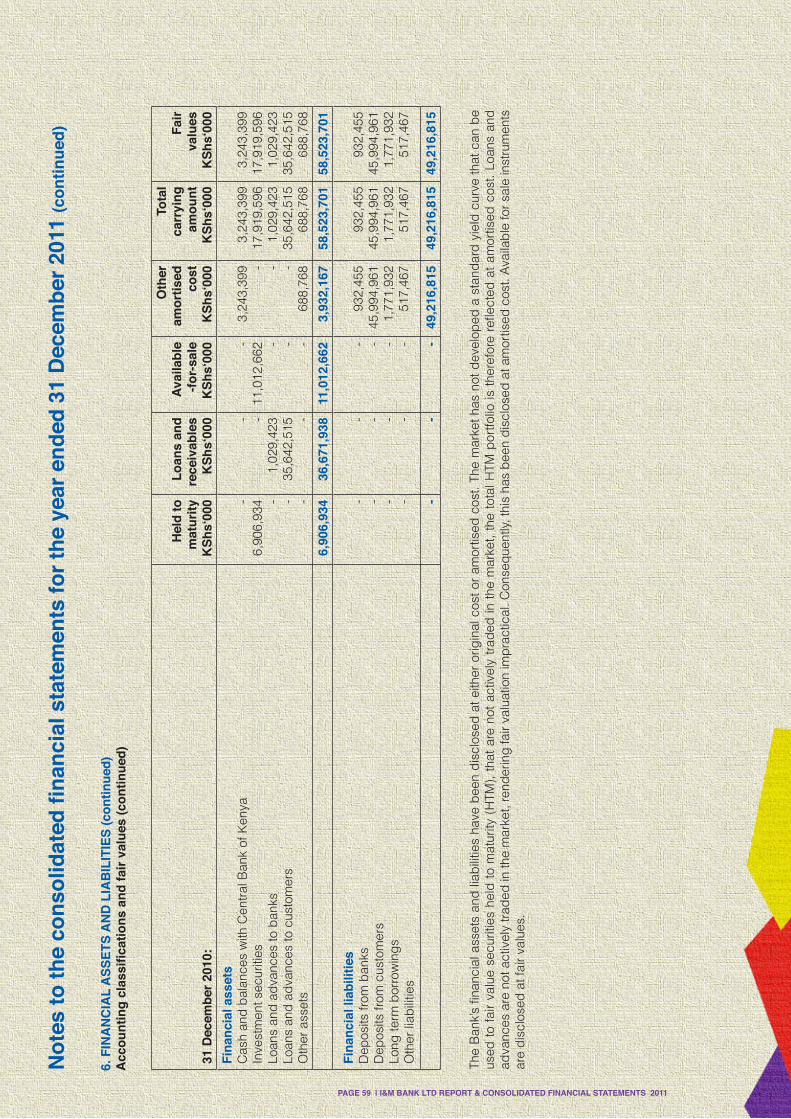
PAGE 59 | I&M BANK LTD REPORT & CONSOLIDATED FINANCIAL STATEMENTS 2011
The
Ban
k’s
finan
cial
ass
ets
and
liab
ilitie
s ha
ve b
een
dis
clos
ed a
t eith
er o
rigin
al c
ost o
r am
ortis
ed c
ost.
The
mar
ket h
as n
ot d
evel
oped
a s
tand
ard
yie
ld c
urve
that
can
be
used
to
fair
valu
e se
curit
ies
held
to
mat
urity
(H
TM),
tha
t ar
e no
t ac
tivel
y tr
aded
in t
he m
arke
t, th
e to
tal H
TM p
ortfo
lio is
the
refo
re r
efle
cted
at
amor
tised
cos
t. Lo
ans
and
ad
vanc
es a
re n
ot a
ctiv
ely
trad
ed in
the
mar
ket,
rend
erin
g fa
ir va
luat
ion
imp
ract
ical
. Con
seq
uent
ly, t
his
has
bee
n d
iscl
osed
at a
mor
tised
cos
t. A
vaila
ble
for
sale
inst
rum
ents
ar
e d
iscl
osed
at f
air
valu
es.
Not
es to
the
cons
olid
ated
fina
ncia
l sta
tem
ents
for t
he y
ear e
nded
31
Dec
embe
r 201
1 (c
ontin
ued)
6. F
INA
NC
IAL
ASS
ETS
AN
D L
IAB
ILIT
IES
(con
tinue
d)A
ccou
ntin
g cl
assi
ficat
ions
and
fair
valu
es (c
ontin
ued)
31 D
ecem
ber 2
010:
Hel
d to
m
atur
ityK
Shs‘
000
Loan
s an
d re
ceiv
able
sK
Shs‘
000
Avai
labl
e-fo
r-sa
leK
Shs‘
000
Oth
er
amor
tised
co
stK
Shs‘
000
Tota
l ca
rryi
ng
amou
ntK
Shs‘
000
Fair
valu
esK
Shs‘
000
Fina
ncia
l ass
ets
Cas
h an
d b
alan
ces
with
Cen
tral
Ban
k of
Ken
yaIn
vest
men
t sec
uriti
esLo
ans
and
ad
vanc
es to
ban
ksLo
ans
and
ad
vanc
es to
cus
tom
ers
Oth
er a
sset
s
Fina
ncia
l lia
bilit
ies
Dep
osits
from
ban
ksD
epos
its fr
om c
usto
mer
sLo
ng te
rm b
orro
win
gs
Oth
er li
abili
ties
-6,
906,
934 - - -
- - 1
,029
,423
35
,642
,515
-
-11
,012
,662
- - -
3,2
43,3
99 - - -
688,
768
3,2
43,3
9917
,919
,596
1,0
29,4
2335
,642
,515
688,
768
3,24
3,39
9 17
,919
,596
1,02
9,42
3 35
,642
,515
688,
768
6,90
6,93
4 36
,671
,938
11,0
12,6
623,
932,
167
58,5
23,7
0158
,523
,701
- - - -
- - - -
- - - -
932
,455
45
,994
,961
1,7
71,9
32
517,
467
93
2,45
5 45
,994
,961
1,7
71,9
32
517,
467
932
,455
45
,994
,961
1,77
1,93
2 51
7,46
7
--
-49
,216
,815
49,2
16,8
1549
,216
,815

PAGE 60 | I&M BANK LTD REPORT & CONSOLIDATED FINANCIAL STATEMENTS 2011
7. INTEREST INCOME
2011 KShs
2010 KShs
(a) GroupLoans and advances to customers 7,125,260,716 4,926,830,959
Loans and advances to bank 72,860,113 33,157,744
Investment securities:
- Held-to-maturity 1,049,150,301 614,969,912
- Available-for-sale 783,859,622 977,955,755
9,031,130,752 6,552,914,370
(b) CompanyLoans and advances to customers 5,608,041,124 3,789,441,157
Loans and advances to bank 32,131,164 20,302,321
Investment securities:
- Held-to-maturity 780,220,311 407,257,709
- Available-for-sale 750,872,881 948,117,059
7,171,265,480 5,165,118,246
2011 KShs
2010 KShs
(a) GroupDeposits from customers 3,001,337,288 2,628,335,151
Deposits from banks 466,937,522 150,782,217
3,468,274,810 2,779,117,368
(b) CompanyDeposits from customers 2,120,839,632 1,931,120,623
Deposits from banks 394,985,641 126,378,617
2,515,825,273 2,057,499,240
8. INTEREST EXPENSE
Notes to the consolidated financial statements for the year ended 31 December 2011 (continued)

PAGE 61 | I&M BANK LTD REPORT & CONSOLIDATED FINANCIAL STATEMENTS 2011
2011KShs
2010KShs
(a) GroupFee and commission incomeCommissions 963,139,043 700,755,081
Service fees 397,461,560 297,207,407
1,360,600,603 997,962,488
Fee and commission expenseInter bank transaction fees ( 33,589,998 ( 22,193,105
Other ( 40,970,533 ( 29,247,335
( 74,560,531 ( 51,440,440
Net fee and commission income: 1,286,040,072 946,522,048
(b) CompanyFee and commission incomeCommissions 706,526,490 516,516,290
Service fees 388,326,061 289,826,635
1,094,852,551 806,342,925
Fee and commission expenseInter bank transaction fees ( 30,359,435 ( 18,993,583
Other ( 9,205,166 ( 7,028,795
( 39,564,601 ( 26,022,378
Net fee and commission income 1,055,287,950 780,320,547
Notes to the consolidated financial statements for the year ended 31 December 2011 (continued)
9. NET FEE AND COMMISSION INCOME

PAGE 62 | I&M BANK LTD REPORT & CONSOLIDATED FINANCIAL STATEMENTS 2011
2011 KShs
2010 KShs
(a) Other operating income(i) GroupIncome from foreign exchange dealings 722,675,599 450,034,075
Rental income 70,616,073 65,575,986
Profit on sale of property and equipment 4,680,060 1,360,250
Profit on sale of available-for-sale
investment securities 301,658,206 679,080,769
Other 10,923,867 4,046,250
1,110,553,805 1,200,097,330
(ii) CompanyIncome from foreign exchange dealings 476,155,467 253,532,842
Rental income 70,616,073 65,575,986
Profit on sale of property and equipment 4,680,060 1,360,250
Profit on sale of available-for-sale
investment securities 301,245,059 665,923,847
Management fees 17,695,000 -
Other 2,628,272 3,031,920
873,019,931 989,424,845
(b) Dividend income(i) CompanyDividend from subsidiary 23,657,573 -
Dividend from joint venture 37,653,750 -
61,311,323 -
Notes to the consolidated financial statements for the year ended 31 December 2011 (continued)
10. OTHER INCOME

PAGE 63 | I&M BANK LTD REPORT & CONSOLIDATED FINANCIAL STATEMENTS 2011
2011 KShs
2010 KShs
(a) GroupStaff costsSalaries and wages 1,064,662,835 875,220,852
Contributions to defined contribution plan 38,636,644 30,431,154
Other staff costs 380,791,666 291,105,020
1,484,091,145 1,196,757,026
Premises and equipment costs Rental of premises 116,887,380 85,889,953
Electricity 21,885,267 16,189,266
Other premises and equipment costs 62,270,625 52,595,540
201,043,272 154,674,759
General administration expensesDeposit protection fund contribution 70,533,160 54,946,709
Loss on disposal of property and equipment 868,954 443,569
General administrative expenses 794,375,526 488,946,587
865,777,640 544,336,865
Depreciation and amortisationLeasehold improvements 43,526,153 33,453,456
Fixtures, fittings and equipment 54,368,655 45,490,416
Computers 14,707,726 19,576,997
Motor vehicles 12,838,938 14,887,991
Leasehold building 26,514,534 26,220,116
Depreciation on property and
Equipment (Note 21) 151,956,006 139,628,976
Amortisation of intangible assets (Note 22(b)) 48,187,261 56,255,883
Amortisation of prepaid operating
Lease rentals (Note 23) 4,549,128 1,967,383
204,692,395 197,852,242
Notes to the consolidated financial statements for the year ended 31 December 2011 (continued)
11. OPERATING EXPENSES

PAGE 64 | I&M BANK LTD REPORT & CONSOLIDATED FINANCIAL STATEMENTS 2011
2011 KShs
2010 KShs
(b) CompanyStaff costsSalaries and wages 830,601,912 696,401,419
Contributions to defined contribution plan 27,298,445 21,548,143
Other staff costs 221,179,876 172,165,761
1,079,080,233 890,115,323Premises and equipment costs Rental of premises 78,910,412 61,980,319
Electricity 11,202,053 8,000,346
Other premises and equipment costs 47,915,872 41,009,785
138,028,337 110,990,450
General administration expensesDeposit protection fund contribution 63,520,361 50,490,079
Loss on disposal of property and equipment 868,954 443,569
General administrative expenses 583,116,924 341,157,312
647,506,239 392,090,960
Depreciation and amortisationLeasehold improvements 38,723,640 33,505,457
Fixtures, fittings and equipment 30,931,968 23,533,903
Computers 10,206,834 14,568,711
Motor vehicles 6,335,915 9,661,693
Leasehold building 19,964,974 19,964,974
Depreciation on property and
Equipment (Note 21) 106,163,331 101,234,738
Amortisation of intangible assets (Note 22(b)) 32,518,638 46,200,671
Amortisation of prepaid operating
Lease rentals (Note 23) 4,549,128 1,967,383
143,231,097 149,402,792
Notes to the consolidated financial statements for the year ended 31 December 2011 (continued)
11. OPERATING EXPENSES (continued)

PAGE 65 | I&M BANK LTD REPORT & CONSOLIDATED FINANCIAL STATEMENTS 2011
12. PROFIT BEFORE INCOME TAX
2011KShs
2010KShs
(a) Group Profit before income tax is arrived at after charging:
Depreciation 151,956,006 139,628,976
Amortisation of intangible assets 48,187,261 56,255,883
Directors’ emoluments: - Fees 17,938,706 7,973,030
- Other 15,172,127 13,610,400
Auditors’ remuneration 9,956,194 7,716,754
Amortisation of prepaid operating lease rentals 4,549,128 1,967,383
Net Profit On Sale of Property and Equipment ( 3,811,106 ( 916,682
(b) CompanyProfit before income tax is arrived at after charging:
Depreciation 106,163,331 101,234,738
Amortisation of intangible assets 32,518,638 46,200,671
Directors’ emoluments: - Fees 9,690,000 6,730,000
- Other 14,427,024 13,610,400
Auditors’ remuneration 6,080,000 5,220,000
Amortisation of prepaid operating lease rentals 4,549,128 1,967,383
Net profit on sale of property and equipment ( 3,811,106 ( 916,682
2011KShs
2010KShs
(a) GroupCurrent year’s tax 1,484,023,032 1,046,531,738
Under provision in prior year - Current tax 16,218,464 3,584,497
Over provision in prior year - Deferred tax 4,159,822 -
1,504,401,318 1,050,116,235
Deferred tax credit (Note 24) ( 23,232,599 ( 48,202,308
Income tax expense 1,481,168,719 1,001,913,927
The tax on the Bank’s profit differs from the theoretical amount using the basic tax rate as follows:
2011KShs
2010KShs
Accounting profit before taxation 4,953,892,690 3,526,481,474
Computed tax using the applicable
corporation tax rate 1,425,360,544 984,831,914
Under provision in the prior year 16,218,464 3,584,497
Effect on non-deductible costs 39,589,711 13,497,516
1,481,168,719 1,001,913,927
Notes to the consolidated financial statements for the year ended 31 December 2011 (continued)
13. INCOME TAX EXPENSE
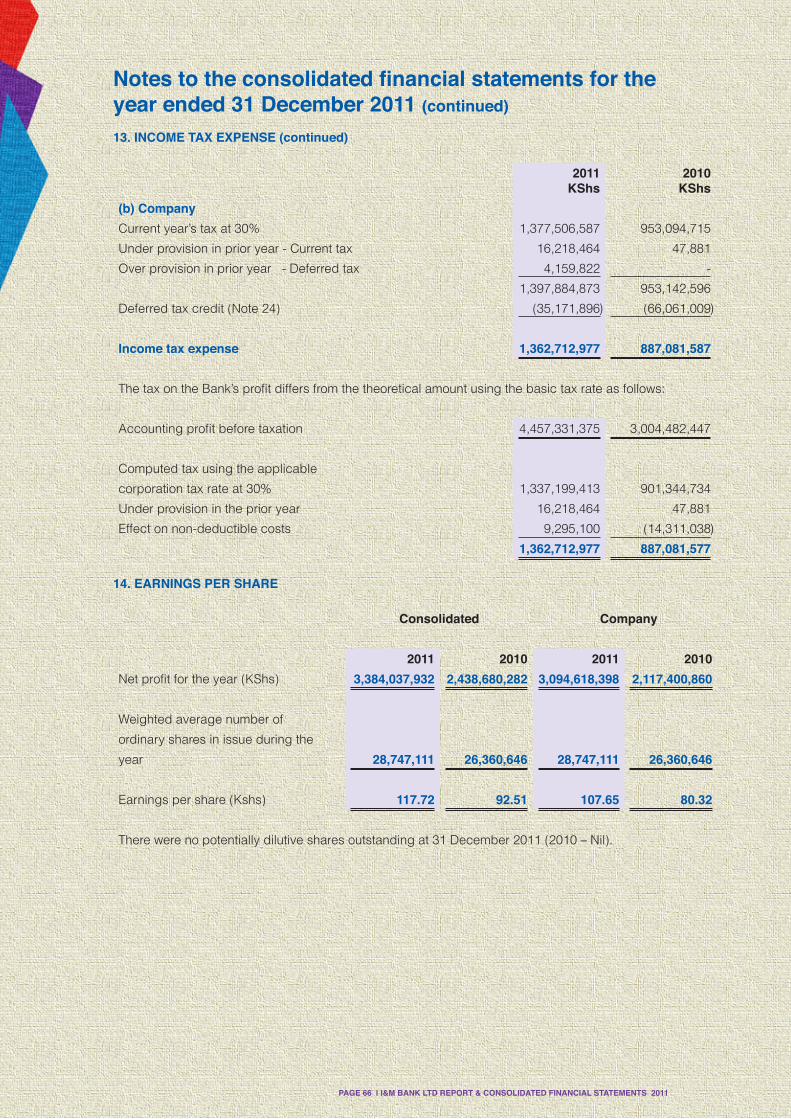
PAGE 66 | I&M BANK LTD REPORT & CONSOLIDATED FINANCIAL STATEMENTS 2011
2011KShs
2010KShs
(b) CompanyCurrent year’s tax at 30% 1,377,506,587 953,094,715
Under provision in prior year - Current tax 16,218,464 47,881
Over provision in prior year - Deferred tax 4,159,822 -
1,397,884,873 953,142,596
Deferred tax credit (Note 24) (35,171,896 (66,061,009
Income tax expense 1,362,712,977 887,081,587
The tax on the Bank’s profit differs from the theoretical amount using the basic tax rate as follows:
Accounting profit before taxation 4,457,331,375 3,004,482,447
Computed tax using the applicable
corporation tax rate at 30% 1,337,199,413 901,344,734
Under provision in the prior year 16,218,464 47,881
Effect on non-deductible costs 9,295,100 (14,311,038
1,362,712,977 887,081,577
Consolidated Company
2011 2010 2011 2010Net profit for the year (KShs) 3,384,037,932 2,438,680,282 3,094,618,398 2,117,400,860
Weighted average number of
ordinary shares in issue during the
year 28,747,111 26,360,646 28,747,111 26,360,646
Earnings per share (Kshs) 117.72 92.51 107.65 80.32
There were no potentially dilutive shares outstanding at 31 December 2011 (2010 – Nil).
Notes to the consolidated financial statements for the year ended 31 December 2011 (continued)
13. INCOME TAX EXPENSE (continued)
14. EARNINGS PER SHARE

PAGE 67 | I&M BANK LTD REPORT & CONSOLIDATED FINANCIAL STATEMENTS 2011
15. DIVIDEND PER SHARE
2011KShs
2010KShs
The calculation of dividend per share is based on:
Final dividend proposed during the year (KShs) 747,424,874 527,212,930
Weighted average number of ordinary shares in issue
during the year 28,747,111 26,360,646
Final dividend per share (KShs) 26.00 20.00
The payment of dividends is subject to withholding tax at the rate of 10% for all non-residents, 5% for Kenyan residents and nil for resident Kenyan companies with shareholding of 12.5% or more.
16. CASH AND BALANCES WITH CENTRAL BANKS
2011KShs
2010KShs
(a) GroupCash on hand 762,300,573 773,189,668
Balances with Central Bank of Kenya:
- Restricted balances (Cash Reserve Ratio) 4,000,077,056 2,906,503,328
- Unrestricted balances 2,235,709,550 1,799,131,851
6,998,087,179 5,478,824,847
(b) CompanyCash on hand 519,827,690 483,477,600
Balances with Central Bank of Kenya:
- Restricted balances (Cash Reserve Ratio) 2,877,257,303 2,042,224,470
- Unrestricted balances 797,221,067 717,696,955
4,194,306,060 3,243,399,025
The Bank’s Cash Reserve Ratio is non-interest earning and is based on the value of deposits as adjusted for the Central Bank of Kenya requirements. As at 31 December 2011, the Cash Reserve Ratio requirement was 5.25% of all deposits (2010 – 4.50%). Effective 29 August 2011 banks are required to maintain their CRR based on monthly average basis, free to deviate from the 5.25% on any given day but not to fall below 3%, provided that the overall average for the month will be at least 4.75%. These funds are not available for use by the Bank in its day to day operations.
Notes to the consolidated financial statements for the year ended 31 December 2011 (continued)
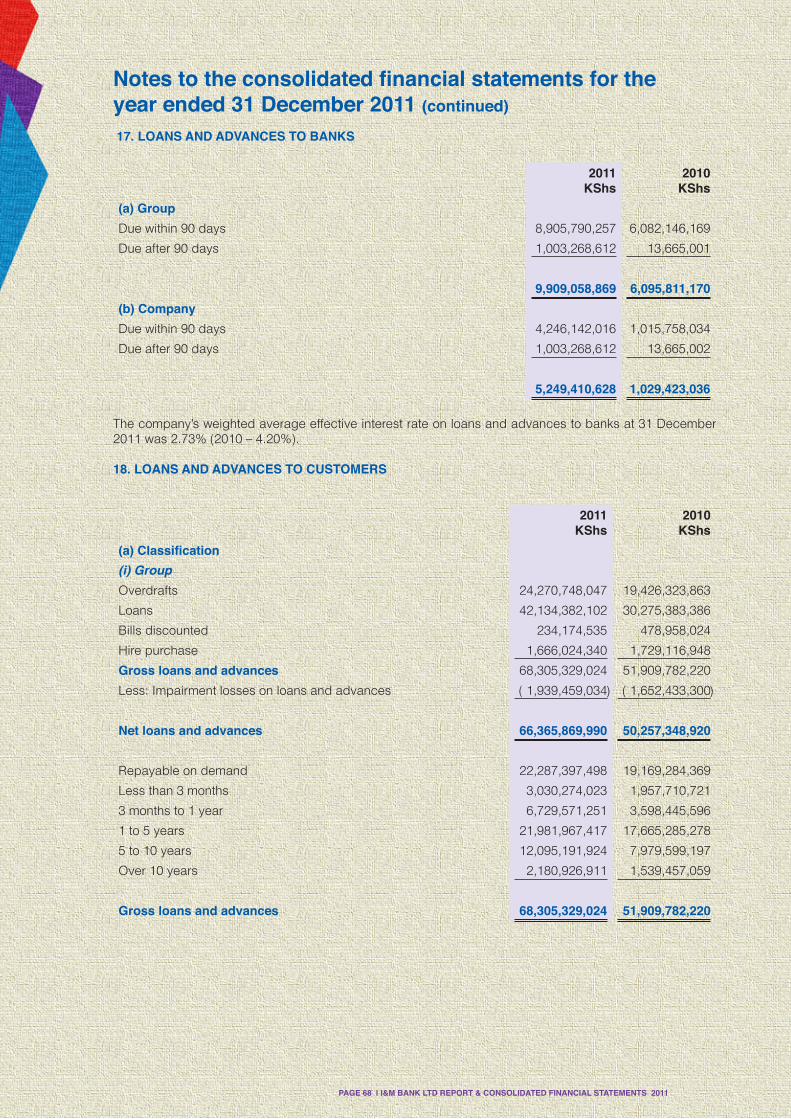
PAGE 68 | I&M BANK LTD REPORT & CONSOLIDATED FINANCIAL STATEMENTS 2011
17. LOANS AND ADVANCES TO BANKS
2011KShs
2010KShs
(a) GroupDue within 90 days 8,905,790,257 6,082,146,169
Due after 90 days 1,003,268,612 13,665,001
9,909,058,869 6,095,811,170(b) CompanyDue within 90 days 4,246,142,016 1,015,758,034
Due after 90 days 1,003,268,612 13,665,002
5,249,410,628 1,029,423,036
2011KShs
2010KShs
(a) Classification(i) GroupOverdrafts 24,270,748,047 19,426,323,863
Loans 42,134,382,102 30,275,383,386
Bills discounted 234,174,535 478,958,024
Hire purchase 1,666,024,340 1,729,116,948
Gross loans and advances 68,305,329,024 51,909,782,220
Less: Impairment losses on loans and advances ( 1,939,459,034 ( 1,652,433,300
Net loans and advances 66,365,869,990 50,257,348,920
Repayable on demand 22,287,397,498 19,169,284,369
Less than 3 months 3,030,274,023 1,957,710,721
3 months to 1 year 6,729,571,251 3,598,445,596
1 to 5 years 21,981,967,417 17,665,285,278
5 to 10 years 12,095,191,924 7,979,599,197
Over 10 years 2,180,926,911 1,539,457,059
Gross loans and advances 68,305,329,024 51,909,782,220
The company’s weighted average effective interest rate on loans and advances to banks at 31 December 2011 was 2.73% (2010 – 4.20%).
18. LOANS AND ADVANCES TO CUSTOMERS
Notes to the consolidated financial statements for the year ended 31 December 2011 (continued)

PAGE 69 | I&M BANK LTD REPORT & CONSOLIDATED FINANCIAL STATEMENTS 2011
2011KShs
2010KShs
(ii) CompanyOverdrafts 18,720,925,713 14,746,825,900
Loans 27,872,505,327 20,195,338,012
Bills discounted 1,341,078,265 478,958,023
Hire purchase 234,174,535 1,437,767,261
Gross loans and advances 48,168,683,840 36,858,889,196
Less: Impairment losses on loans and advances ( 1,389,748,563 ( 1,216,374,210
Net Loans and Advances 46,778,935,277 35,642,514,986
Repayable on demand 19,938,506,040 16,571,700,546
Less than 3 months 1,677,564,373 931,958,054
3 months to 1 year 2,270,049,384 1,541,280,131
1 to 5 years 14,598,898,295 12,259,009,319
5 to 10 years 8,793,152,373 4,731,555,209
Over 10 years 890,513,375 823,385,937
Gross loans and advances 48,168,683,840 36,858,889,196
(b) Impairment losses reserveSpecific Portfolio
impairment impairmentlosses provision Total
(i) Group KShs KShs KShs2011:At 1 January 2011 1,070,790,553 581,643,049 1,652,433,602
Impairment made in the year 376,066,529 135,653,744 511,720,273
Recoveries and impairment no
longer required ( 237,679,559 - ( 237,679,559
Amounts written off during the year ( 25,987,787 - ( 25,987,787
Translation difference 28,505,758 10,466,747 38,972,505
At 31 December 2011 1,211,695,494 727,763,540 1,939,459,034
2010:At 1 January 2010 914,242,921 398,396,406 1,312,639,327
Acquisition of Subsidiary 918,832 - 918,832
Impairment made in the year 444,470,754 183,246,644 627,717,398
Recoveries and impairment no
longer required ( 106,928,973 - ( 106,928,973
Amounts written off during the year ( 181,913,284 - ( 181,913,284
At 31 December 2010 1,070,790,250 581,643,050 1,652,433,300
Notes to the consolidated financial statements for the year ended 31 December 2011 (continued)
18. LOANS AND ADVANCES TO CUSTOMERS (continued)

PAGE 70 | I&M BANK LTD REPORT & CONSOLIDATED FINANCIAL STATEMENTS 2011
(b) Impairment losses reserve (continued)
Specific Portfolio impairment impairment
losses provision Total(ii) Company KShs KShs KShs2011:At 1 January 2011 746,078,522 470,295,688 1,216,374,210
Impairment made in the year 265,413,909 123,802,770 389,216,679
Recoveries and impairment no
longer required (199,795,635 - ( 199,795,635
Amounts written off during
the year ( 16,046,691 - ( 16,046,691
At 31 December 2011 795,650,105 594,098,458 1,389,748,563
2010:At 1 January 2010 476,668,096 307,295,688 783,963,784
Impairment made in the year 385,282,868 163,000,000 548,282,868
Recoveries and impairment no
longer required ( 95,617,904 - ( 95,617,904
Amounts written off during
the year ( 20,254,538 - ( 20,254,538
At 31 December 2010 746,078,522 470,295,688 1,216,374,210
(c) Impairment losses on loans and advances2011
KShs2010
KShs(i) GroupImpairment made in the year 511,720,273 627,717,398
Recoveries and impairment no longer required ( 96,976,798 (106,928,973
Recoveries of loans and advances written off in prior years (138,803,011 ( 38,561,126
Amount written off during the year ( 25,987,787 (181,913,285
249,952,677 300,314,014
(ii) CompanyImpairment made in the year 389,216,679 548,282,868
Recoveries and impairment no longer required ( 59,092,874 ( 95,617,904
Recoveries of loans and advances written off in prior years (134,194,984 (102,128,000
Amount written off during the year ( 16,046,691 ( 20,254,538
179,882,130 330,282,426
Notes to the consolidated financial statements for the year ended 31 December 2011 (continued)
18. LOANS AND ADVANCES TO CUSTOMERS (continued)

PAGE 71 | I&M BANK LTD REPORT & CONSOLIDATED FINANCIAL STATEMENTS 2011
(d) Non-performing loans and advances - Company
The company’s loans and advances include an amount of KShs 410,356,104 (2010 – KShs 438,325,372) net of impairment losses which are non-performing. The estimated realisable value of securities held against this balance is KShs 232,249,593 (2010 – KShs 434,562,555).
2011KShs
2010KShs
Interest on impaired loans and advances
which has not yet been received in cash 320,439,342 253,736,413
2011 2010KShs % KShs %
Manufacturing 11,824,818,120 24.55 8,607,054,615 23.35
Wholesale and retail trade 4,736,004,137 9.83 2,962,950,692 8.04
Building and construction 4,308,816,570 8.94 3,227,567,553 8.76
Agriculture 3,325,263,809 6.90 1,936,231,309 5.25
Real estate 8,467,872,872 17.58 8,164,463,688 22.15
Transport and communication 2,287,773,038 4.75 2,171,247,726 5.89
Business services 11,506,925,919 23.89 8,320,727,356 22.57
Electricity and water 102,628,526 0.21 125,559,137 0.34
Finance and insurance 65,873,845 0.41 30,637,921 0.08
Mining and quarrying 130,623,373 0.27 124,137,576 0.34
Others 1,412,083,631 2.94 1,188,311,623 3.22
48,168,683,840 100.00 36,858,889,196 100.00
(f) Finance leases - Company
Loans and advances to customers include finance leases receivable as follows:
2011 2010KShs KShs
Receivable no later than 1 year 182,600,033 185,251,326
Receivable later than 1 year and no later than 5 years 1,158,478,232 1,252,515,935
1,341,078,265 1,437,767,261
Notes to the consolidated financial statements for the year ended 31 December 2011 (continued)
18. LOANS AND ADVANCES TO CUSTOMERS (continued)
The company’s weighted average effective interest rate on loans and advances to customers at 31 December 2011 was 12.36% (2010 – 11.59%).
(e) Loans and advances concentration by sector - Company
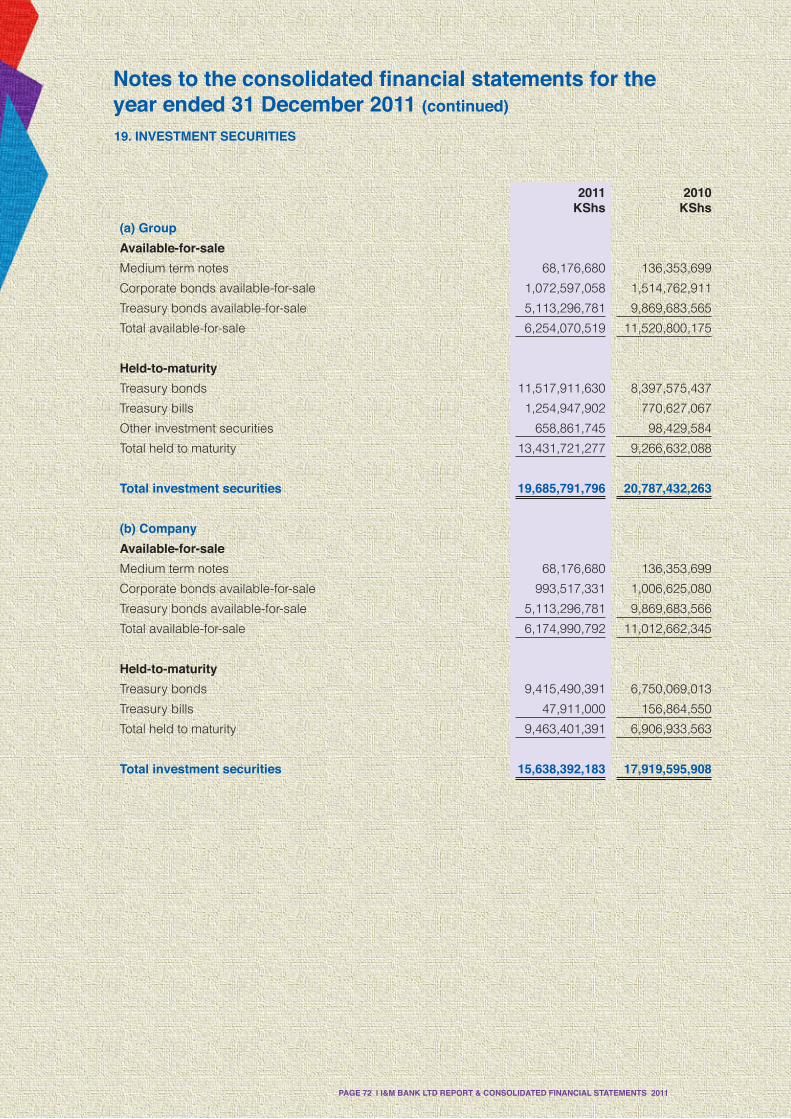
PAGE 72 | I&M BANK LTD REPORT & CONSOLIDATED FINANCIAL STATEMENTS 2011
19. INVESTMENT SECURITIES
2011KShs
2010KShs
(a) GroupAvailable-for-saleMedium term notes 68,176,680 136,353,699
Corporate bonds available-for-sale 1,072,597,058 1,514,762,911
Treasury bonds available-for-sale 5,113,296,781 9,869,683,565
Total available-for-sale 6,254,070,519 11,520,800,175
Held-to-maturityTreasury bonds 11,517,911,630 8,397,575,437
Treasury bills 1,254,947,902 770,627,067
Other investment securities 658,861,745 98,429,584
Total held to maturity 13,431,721,277 9,266,632,088
Total investment securities 19,685,791,796 20,787,432,263
(b) CompanyAvailable-for-saleMedium term notes 68,176,680 136,353,699
Corporate bonds available-for-sale 993,517,331 1,006,625,080
Treasury bonds available-for-sale 5,113,296,781 9,869,683,566
Total available-for-sale 6,174,990,792 11,012,662,345
Held-to-maturityTreasury bonds 9,415,490,391 6,750,069,013
Treasury bills 47,911,000 156,864,550
Total held to maturity 9,463,401,391 6,906,933,563
Total investment securities 15,638,392,183 17,919,595,908
Notes to the consolidated financial statements for the year ended 31 December 2011 (continued)

PAGE 73 | I&M BANK LTD REPORT & CONSOLIDATED FINANCIAL STATEMENTS 2011
The change in the carrying amount of investment securities held by the company is as shown below:
Treasury bonds
and billsKshs
CorporatebondKshs
Medium term
floating notes Kshs
TotalKshs
31 December 2011:At 1 januaryAdditionsDisposals and maturitiesChanges in fair valueAmortisation of discounts and premiumsUnearned interestInterest receivable
16,776,617,130
7,803,750,000( 7,851,700,000( 1,769,681,949
22,211,531( 415,549,752
11,051,213
1,006,625,080--
( 14,476,946
328,785-
1,040,411
136,353,699-
( 67,500,000-
--
( 677,019
17,919,595,9097,803,750,000
( 7,919,200,000( 1,784,158,895
22,540,316( 415,549,752
11,414,605
At 31 December 14,576,698,173 993,517,330 68,176,680 15,638,392,183
31 December 2010:At 1 JanuaryAdditionsDisposals and maturitiesChanges in fair valueAmortisation of discounts and premiumsUnearned interestInterest receivable
10,297,378,422 12,178,250,000( 7,594,591,344
1,455,038,287
( 92,975,496476,131,561
57,385,700
905,452,830 200,000,000
( 148,581,35431,241,240
( 274,315-
18,786,678
137,033,705 -
( 2,033,705-
--
1,353,699
11,339,864,957 12,378,250,000( 7,745,206,403
1,486,279,527
( 93,249,811476,131,561
77,526,076
At 31 December 16,776,617,130 1,006,625,079 136,353,699 17,919,595,908
The weighted average effective interest rate on Government securities at 31 December 2011 was 10.56% (2010 – 9.71%).
The weighted average effective interest rate on corporate bonds at 31 December 2011 was 12.05% (2010 – 12.02%).
The weighted average effective interest rate on medium floating term notes at 31 December 2011 was 5.99% (2010 – 6.90%).
At 31 December 2011, unamortized premiums on investment securities amounted to KShs 348,354,376 (2010 – KShs 703,037,305) and unamortized discounts amounted to KShs 311,411,970 (2010 – KShs 287,375,209).
Notes to the consolidated financial statements for the year ended 31 December 2011 (continued)
19. INVESTMENT SECURITIES (continued)

PAGE 74 | I&M BANK LTD REPORT & CONSOLIDATED FINANCIAL STATEMENTS 2011
20. I
NVE
STM
ENT
IN S
UB
SID
IARY
AN
D J
OIN
T VE
NTU
RES
(a) I
nves
tmen
t in
join
t ven
ture
– B
ank
One
Lim
ited,
Mau
ritiu
s
Dur
ing
the
yea
r en
ded
31
Dec
emb
er 2
008,
the
Ban
k en
tere
d in
to a
join
t ve
ntur
e w
ith C
IEL
Inve
stm
ents
(M
aurit
ius)
to
acq
uire
Ban
k O
ne L
imite
d (
form
erly
Firs
t C
ity B
ank
Lim
ited
), M
aurit
ius
and
the
Ban
k ef
fect
ivel
y he
ld 4
0.6%
inte
rest
in B
ank
One
Lim
ited
.
As
at 3
1 D
ecem
ber
200
9, I&
M B
ank
effe
ctiv
ely
held
41.
64%
inte
rest
in B
ank
One
Lim
ited
, 50%
inte
rest
bei
ng h
eld
by
CIE
L In
vest
men
ts L
imite
d (M
aurit
ius)
and
the
rem
aini
ng
8.36
% b
eing
hel
d b
y M
inar
d H
old
ing
s Li
mite
d (
Ken
ya).
Pro
ced
ures
wer
e in
itiat
ed in
Nov
emb
er 2
009,
for
the
tran
sfer
by
Min
ard
Hol
din
gs
Lim
ited
of a
ll its
sha
reho
ldin
g in
B
ank
One
Lim
ited
to I&
M B
ank.
Req
uire
d a
utho
risat
ions
wer
e ob
tain
ed a
nd th
e sh
are
tran
sfer
was
reg
iste
red
on
14 F
ebru
ary
2010
afte
r w
hich
the
Ban
k ef
fect
ivel
y ho
lds
50%
inte
rest
in B
ank
One
Lim
ited
.
The
acq
uisi
tion
and
rig
hts
issu
e ha
d th
e fo
llow
ing
effe
ct o
n th
e co
nsol
idat
ed a
sset
s an
d li
abili
ties
on th
e re
spec
tive
acq
uisi
tion
dat
e:
Not
es to
the
cons
olid
ated
fina
ncia
l sta
tem
ents
for t
he y
ear e
nded
31
Dec
embe
r 201
1 (c
ontin
ued)
2010
2009
2008
Tota
lA
t 31
Dec
embe
r 201
1 an
d 20
10K
Shs
KSh
sK
Shs
KSh
sC
ash
and
bal
ance
s w
ith C
entr
al B
ank
1
21,0
66,2
63
1
5,89
6,69
7
632
,423
,713
769
,386
,673
Loan
s an
d a
dva
nces
to b
anks
3
10,6
51,9
75
6
3,34
2,23
2
169
,608
,787
543
,602
,994
Loan
s an
d a
dva
nces
to c
usto
mer
s 1
,427
,230
,443
1
47,0
79,8
94
1,3
63,8
65,9
11
2,9
38,1
76,2
48
Inve
stm
ents
sec
uriti
es24
0,41
7,03
2
28,
435,
972
1,9
62,8
72,6
32
2,2
31,7
25,6
36
Inta
ngib
le a
sset
10,
084,
305
1,25
1,12
9
705
,021
1
2,04
0,45
5
Pro
per
ty a
nd e
qui
pm
ent
69,
896,
589
8,58
4,60
9
324
,972
,522
403
,453
,720
Def
erre
d ta
x as
set
14,
745,
262
1,80
9,69
7
8
0,18
2,52
7
9
6,73
7,48
6
Oth
er a
sset
s
3
0,78
3,66
9
9,
722,
596
3
39,9
91,5
33
3
80,4
97,7
98
Dep
osits
(1,9
96,2
75,9
68(2
48,7
64,3
75(4
,184
,132
,766
(6,4
29,1
73,1
09
Oth
er li
abili
ties
(
51,
218,
504
(
5,82
2,27
2(
122
,906
,165
(
179,
946,
941
Bor
row
ing
s(
3
8,23
6,96
3 (
4
,686
,299
(
15,
322,
569
(
58,
245,
831
Tax
pay
able
- (
14
,013
-
(
14,
013
Net
iden
tifiab
le a
sset
s an
d lia
bilit
ies
139,
144,
103
1
6,83
5,86
7
552
,261
,146
70
8,24
1,11
6G
ood
will
on
acq
uisi
tion
[not
e 22
(a)]
184,
095,
897
(
2,5
06,4
6029
3,81
6,21
4 47
5,40
5,65
1
Tota
l con
side
ratio
n32
3,24
0,00
0 1
4,32
9,40
7 84
6,07
7,36
0 1,
183,
646,
767
Rig
hts
issu
e -
61,8
90,8
43-
61,8
90,8
43
323,
240,
000
76,2
20,2
5084
6,07
7,36
01,
245,
537,
610
Con
sid
erat
ion
pai
d in
cas
h (c
omp
any
cash
flow
– 2
010)
( 3
23,2
40,0
00 (
76,
220,
250
( 4
37,6
47,9
60(
837
,108
,210
Bal
ance
pay
able
incl
uded
und
er o
ther
liab
ilitie
s
-
-
408,
429,
400
408,
429,
400
Cas
h ac
qui
red
4
31,7
18,2
38
7
9,23
8,92
9
554
,228
,806
1
,065
,185
,973
Con
sid
erat
ion
pai
d in
cas
h 20
10 (
excl
udin
g r
ight
s is
sue)
( 3
23,2
40,0
00(
14,
329,
407
( 4
37,6
47,9
60(
775
,217
,367
Net
cas
h in
flow
(con
solid
ated
cas
h flo
w –
201
0)10
8,47
8,23
8 6
4,90
9,52
2 11
6,58
0,84
6 2
89,9
68,6
06

PAGE 75 | I&M BANK LTD REPORT & CONSOLIDATED FINANCIAL STATEMENTS 2011
(b) Investment in subsidiary - I&M Bank (T) Limited
On 14 January 2010 I&M Bank LIMITED acquired 55.03% shareholding of CF Union Bank Limited (CFUB), a commercial bank registered and operating in Tanzania. CFUB was re-named I&M Bank (T) Limited in September 2010.
On 30 July 2010, CFUB, raised additional share capital through a rights issue of 645 shares. The Bank took up its full rights of 355 shares at a cost of Kshs 245,229,000 of which the share premium on the rights issue was Kshs 225,766,381.
The acquisition of I&M Bank (T) Limited had the following effect on the consolidated assets and liabilities on the acquisition date:
At 31 December 2011 and 2010 KShsCash and balances with central bank 805,766,361
Loans and advances to banks 766,296,211
Loans and advances to customers 2,449,576,215
Investments securities 475,853,900
Intangible asset 1,288,757
Property and equipment 25,524,670
Deferred tax asset ( 3,132,995
Other assets 16,297,016
Deposits (3,910,384,240
Other liabilities ( 136,111,021
Borrowings -
Tax payable ( 2,641,588
Net identifiable assets and liabilities 488,333,286Non controlling interest ( 219,603,475
Attributable to company 268,729,811
Goodwill on acquisition (note 22(a)) 608,952,549
Total consideration 877,682,360Consideration paid in cash ( 877,682,360
Balance payable included under other liabilities -Cash acquired 1,572,062,572
Consideration paid in cash ( 877,682,360
Net cash inflow (consolidated cash flow – 2010) 694,380,212Investment in subsidiary at costConsideration paid on acquisition 877,682,360
Cash paid on rights issue 245,229,000
Total cash paid (company cash flow – 2010) 1,122,911,360
Notes to the consolidated financial statements for the year ended 31 December 2011 (continued)
20. INVESTMENT IN SUBSIDIARY AND JOINT VENTURES (continued)

PAGE 76 | I&M BANK LTD REPORT & CONSOLIDATED FINANCIAL STATEMENTS 2011
21. P
RO
PER
TY A
ND
EQ
UIP
MEN
T- G
RO
UP
AN
D C
OM
PAN
Y
Not
es to
the
cons
olid
ated
fina
ncia
l sta
tem
ents
for t
he y
ear e
nded
31
Dec
embe
r 201
1 (c
ontin
ued)
(a) G
roup
Leas
ehol
d bu
ildin
gsK
Shs
Leas
ehol
d im
prov
emen
tsK
Shs
Furn
iture
, fitti
ngs,
fixt
ures
& o
ffice
, equ
ipm
ent
KSh
sC
ompu
ters
KSh
sM
otor
veh
icle
sK
Shs
Cap
ital w
ork
in p
rogr
ess
KSh
sTo
tal
KSh
s20
11:
Cos
t / V
alua
tion
At 1
Jan
uary
201
11,
319,
502,
000
373,
516,
860
628,
884,
140
184,
942,
171
77,2
19,3
10
50,5
79,1
132,
634,
643,
594
Ad
diti
ons
-88
,110
,042
99
,291
,146
21
,021
,412
6,
783,
590
84,1
32,0
82
299,
338,
272
Tran
sfer
s -
72,4
55,1
74
11,0
39,1
03
-
-
(83,
494,
277
-
Dis
pos
als/
writ
e of
f -
- (
9,1
84,6
92 -
(1
2,88
3,77
3-
( 2
2,06
8,46
5
Tran
slat
ion
diff
eren
ce
34,
783,
700
-27
,010
,313
1,
345,
615
2,47
9,06
7 (
5
81,4
1165
,037
,284
At 3
1 D
ecem
ber
201
11,
354,
285,
700
534,
082,
076
757,
040,
010
207,
309,
198
73,5
98,1
94
50,6
35,5
07
2,97
6,95
0,68
5
Dep
reci
atio
nA
t 1 J
anua
ry 2
011
72,9
90,8
13
209,
118,
481
423,
850,
621
147,
483,
699
46,8
32,9
34
-90
0,27
6,54
8
Cha
rge
for
the
year
26
,514
,534
43
,526
,153
54
,368
,655
14
,707
,726
12
,838
,938
-
151,
956,
006
On
dis
pos
als
- -
( 7
,722
,696
-
(10,
575,
272
-(
18,
297,
968
Tran
slat
ion
diff
eren
ce
3,
876,
519
(
3
7,95
221
,715
,740
71
6,57
9 1,
255,
340
-
27,5
26,2
26
At 3
1 D
ecem
ber
201
1
103,
381,
866
252,
606,
682
492,
212,
320
162,
908,
004
50,3
51,9
40
-1,
061,
460,
812
Net
boo
k va
lue
At 3
1 D
ecem
ber 2
011
1,25
0,90
3,83
4 28
1,47
5,39
4 26
4,82
7,69
0 44
,401
,194
23
,246
,254
50
,635
,507
1,91
5,48
9,87
3

PAGE 77 | I&M BANK LTD REPORT & CONSOLIDATED FINANCIAL STATEMENTS 2011
21. P
RO
PER
TY A
ND
EQ
UIP
MEN
T- G
RO
UP
AN
D C
OM
PAN
Y (c
ontin
ued)
Not
es to
the
cons
olid
ated
fina
ncia
l sta
tem
ents
for t
he y
ear e
nded
31
Dec
embe
r 201
1 (c
ontin
ued)
(a) G
roup
(con
tinue
d)
Leas
ehol
d bu
ildin
gsK
Shs
Leas
ehol
d im
prov
emen
tsK
Shs
Furn
iture
, fitti
ngs,
fixt
ures
& o
ffice
, equ
ipm
ent
KSh
sC
ompu
ters
KSh
s
Mot
or
vehi
cles
KSh
s
Cap
ital w
ork
in p
rogr
ess
KSh
s
Tota
lK
Shs
2010
:C
ost /
Val
uatio
nA
t 1 J
anua
ry 2
010
1,24
4,19
6,59
4 28
2,39
6,43
0 43
3,35
1,14
4 18
6,66
1,62
9 62
,584
,465
28
,374
,649
2,
237,
564,
911
Acq
uisi
tion
of
JV/s
ubsi
dia
ry60
,027
,475
-
59
,600
,253
24
,977
,962
7,
290,
041
-15
1,89
5,73
1
Ad
diti
ons
-
25,8
97,0
10
63,3
67,7
84
16,0
98,6
84
8,89
6,33
1 11
9,55
0,46
7 23
3,81
0,27
5
Rec
lass
ifica
tion
-
( 2
,414
,811
36,8
20,4
12
(41,
767,
051
- -
(
7,3
61,4
49
Tran
sfer
s -
67
,638
,231
28,8
62,6
52
845,
120
-(9
7,34
6,00
3 -
Dis
pos
als/
writ
e of
f -
-
( 3
,593
,216
( 1
,424
,943
(2,2
93,6
95 -
(
7,3
11,8
54
Tran
slat
ion
diff
eren
ce
15,
277,
931
-
10,4
75,1
11
(
449
,230
742,
168
-
26,0
45,9
79
At 3
1 D
ecem
ber
201
01,
319,
502,
000
373,
516,
860
628,
884,
140
184,
942,
171
77,2
19,3
10
50,5
79,1
132,
634,
643,
594
Dep
reci
atio
nA
t 1 J
anua
ry 2
010
40,2
90,3
97
167,
806,
790
308,
046,
741
159,
568,
876
31,4
40,0
13
-70
7,15
2,81
7
Acq
uisi
tion
of
JV/s
ubsi
dia
ry5,
165,
579
-38
,688
,523
9,
743,
513
2,49
9,44
3 -
56,0
97,0
58
Rec
lass
ifica
tion
-7,
858,
235
25,3
31,5
72(4
0,37
2,09
4 -
-(
7
,182
,287
Cha
rge
for
the
year
26
,220
,116
33
,453
,456
45
,490
,416
19
,576
,997
14
,887
,991
-
139,
628,
976
On
dis
pos
als
- -
( 2
,959
,017
(
805
,187
(2,
233,
469
-(
5
,997
,673
Tran
slat
ion
diff
eren
ce
1
,314
,721
-9,
252,
386
(
228
,406
238,
956
-
10
,577
,657
At 3
1 D
ecem
ber
201
0
72,
990,
813
209,
118,
481
423,
850,
621
147,
483,
699
46,8
32,9
34
-90
0,27
6,54
8
Net
boo
k va
lue
At 3
1 D
ecem
ber 2
010
1,24
6,51
1,18
7 16
4,39
8,37
9 20
5,03
3,51
9 37
,458
,472
30
,386
,376
50
,579
,113
1,
734,
367,
046

PAGE 78 | I&M BANK LTD REPORT & CONSOLIDATED FINANCIAL STATEMENTS 2011
Not
es to
the
cons
olid
ated
fina
ncia
l sta
tem
ents
for t
he y
ear e
nded
31
Dec
embe
r 201
1 (c
ontin
ued)
21. P
RO
PER
TY A
ND
EQ
UIP
MEN
T- G
RO
UP
AN
D C
OM
PAN
Y (c
ontin
ued)
(b) C
ompa
ny
Leas
ehol
dbu
ildin
gsK
Shs
Leas
ehol
dim
prov
emen
tsK
Shs
Furn
iture
, fitti
ngs,
fixt
ures
& o
ffice
, equ
ipm
ent
KSh
sC
ompu
ters
KSh
s
Mot
orve
hicl
esK
Shs
Cap
ital
wor
k in
pr
ogre
ssK
Shs
Tota
lK
Shs
2011
:
Cos
t / V
alua
tion
At 1
Jan
uary
201
195
0,00
0,00
037
3,51
6,86
032
4,01
9,51
414
3,72
5,35
345
,134
,983
13,5
01,9
591,
849,
898,
669
Ad
diti
ons
-35
,105
,733
46,4
22,9
1717
,966
,842
5,80
0,00
069
,992
,318
175,
287,
810
Rec
lass
ifica
tion
--
--
--
-
Tran
sfer
s -
72,4
55,1
7411
,039
,103
--
(83,
494,
277
-
Dis
pos
als
--
( 4
,066
,146
-(1
2,88
3,77
3-
( 1
6,94
9,91
9
Sur
plu
s on
reva
luat
ion
-
-
-
-
-
-
-
At 3
1 D
ecem
ber
201
195
0,00
0,00
048
1,07
7,76
737
7,41
5,38
816
1,69
2,19
538
,051
,210
-2,
008,
236,
560
Dep
reci
atio
nA
t 1 J
anua
ry 2
011
34,
938,
703
209,
118,
481
195,
374,
726
129,
855,
830
34,1
38,8
17-
603,
426,
557
Rec
lass
ifica
tion
--
--
--
-
Cha
rge
for
the
year
19
,964
,974
38,7
23,6
4030
,931
,968
10,2
06,8
346,
335,
915
-10
6,16
3,33
1
On
dis
pos
als
--
( 2
,768
,754
-(1
0,57
5,27
2-
( 1
3,34
4,02
6
Rev
ersa
l on
reva
luat
ion
-
-
-
-
-
-
-
At 3
1 D
ecem
ber
201
1 5
4,90
3,67
724
7,84
2,12
122
3,53
7,94
014
0,06
2,66
429
,899
,460
-69
6,24
5,86
2
Net
boo
k va
lue
at 3
1 D
ecem
ber 2
011
895,
096,
323
233,
235,
646
153,
877,
448
21,6
29,5
318,
151,
750
-1,
311,
990,
698

PAGE 79 | I&M BANK LTD REPORT & CONSOLIDATED FINANCIAL STATEMENTS 2011
In th
e op
inio
n of
the
dire
ctor
s, th
ere
is n
o im
pai
rmen
t of p
rop
erty
and
eq
uip
men
t. In
clud
ed in
the
pro
per
ty a
nd e
qui
pm
ent a
re a
sset
s w
ith a
gro
ss v
alue
of K
Shs
391
,435
,175
(2
010
– K
Shs
377
,886
,780
) w
hich
are
ful
ly d
epre
ciat
ed b
ut s
till i
n us
e. I
f d
epre
ciat
ion
had
bee
n ch
arg
ed d
urin
g t
he y
ear
on t
he c
ost
of t
hese
ass
ets
at a
nom
inal
rat
e, it
w
ould
hav
e am
ount
ed to
KS
hs 8
1,45
8,36
5 (2
010
– K
Shs
73,
705,
981)
.
Not
es to
the
cons
olid
ated
fina
ncia
l sta
tem
ents
for t
he y
ear e
nded
31
Dec
embe
r 201
1 (c
ontin
ued)
21. P
RO
PER
TY A
ND
EQ
UIP
MEN
T- G
RO
UP
AN
D C
OM
PAN
Y (c
ontin
ued)
(b) C
ompa
ny (c
ontin
ued)
Leas
ehol
d bu
ildin
gsK
Shs
Leas
ehol
d im
prov
emen
tsK
Shs
Furn
iture
, fitti
ngs,
fixt
ures
& o
ffice
, equ
ipm
ent
KSh
sC
ompu
ters
KSh
s
Mot
or
vehi
cles
KSh
s
Cap
ital
wor
k in
pr
ogre
ssK
Shs
Tota
lK
Shs
2010
:C
ost /
Val
uatio
nA
t 1 J
anua
ry 2
010
950
,000
,000
2
82,3
96,4
30
217
,239
,579
1
74,4
32,5
07
44,
878,
033
28,
374,
650
1,69
7,32
1,19
9
Ad
diti
ons
-25
,897
,010
42,4
89,0
3710
,214
,777
1,40
0,00
082
,473
,312
162,
474,
136
Rec
lass
ifica
tion
- (
2,
414,
811
36,8
20,4
12(4
1,76
7,05
1-
- (
7
,361
,450
Tran
sfer
s -
67,6
38,2
3128
,862
,652
845,
120
-(9
7,34
6,00
3-
Dis
pos
als
-
-
( 1
,392
,166
-(
1,14
3,05
0
-
(
2,5
35,2
16
Sur
plu
s on
reva
luat
ion
-
--
--
--
At 3
1 D
ecem
ber
201
0 9
50,0
00,0
0037
3,51
6,86
032
4,01
9,51
414
3,72
5,35
345
,134
,983
.13
,501
,959
1,84
9,89
8,66
9
Dep
reci
atio
nA
t 1 J
anua
ry 2
010
14
,973
,730
1
67,8
06,7
90
147
,264
,100
1
55,6
59,2
13
25,
620,
174
-51
1,32
4,00
7
Rec
lass
ifica
tion
-7,
858,
235
25,3
31,5
72(4
0,37
2,09
4-
-(
7
,182
,287
Cha
rge
for
the
year
19
,964
,973
33,4
53,4
5623
,585
,905
14,5
68,7
119,
661,
693
-10
1,23
4,73
8
On
dis
pos
als
--
(
80
6,85
1-
( 1,
143,
050
-(
1
,949
,901
Rev
ersa
l on
reva
luat
ion
-
-
-
-
-
-
-
At 3
1 D
ecem
ber
201
0
34,9
38,7
0320
9,11
8,48
119
5,37
4,72
612
9,85
5,83
034
,138
,817
-60
3,42
6,55
7
Net
boo
k va
lue
at 3
1 D
ecem
ber 2
010
915
,061
,297
164,
398,
379
128,
644,
788
13,8
69,5
2310
,996
,166
13,5
01,9
591,
246,
472,
112

PAGE 80 | I&M BANK LTD REPORT & CONSOLIDATED FINANCIAL STATEMENTS 2011
2011 2010KShs KShs
(a) Goodwill(i) GroupAt 1 January 1,095,105,198 302,056,752
On acquisition during the year:
- Bank One Limited (Note 20(a)) - 184,095,897
- I&M Bank (T) Limited Note 20(b)) - 608,952,549
- Total, Company and Subsidiary 1,095,105,198 1,095,105,198
- Bank One Limited 21,870,413 19,988,739
Carrying amount at 31 December 1,116,975,611 1,115,093,937
(ii) CompanyGoodwill on assets purchased from Biashara Bank of Kenya Limited 15,632,000 15,632,000
AmortisationAt 1 January and 31 December ( 4,885,002 ( 4,885,002
Carrying amount at 31 December 10,746,998 10,746,998
(b) Computer software(i) GroupCostAt 1 January of previously stated 346,276,883 295,003,335
Acquisition of JV/subsidiary - 21,151,248
Reclassified from property and equipment - 7,361,451
Additions 93,809,317 19,260,151
Disposals - ( 205,469
Exchange differences 9,721,088 3,706,167
At 31 December 449,807,288 346,276,883
AmortisationAt 1 January of previously stated 287,102,831 208,422,485
Acquisition of subsidiary - 12,888,795
Reclassified from property and equipment as restated - 7,182,287
Amortisation for the year 48,187,261 56,255,883
Exchange differences 6,469,691 2,353,383
341,759,783 287,102,833
Net carrying amount at 31 December 108,047,505 59,174,050
22. INTANGIBLE ASSETS
Notes to the consolidated financial statements for the year ended 31 December 2011 (continued)

22. INTANGIBLE ASSETS
PAGE 81 | I&M BANK LTD REPORT & CONSOLIDATED FINANCIAL STATEMENTS 2011
(b) Computer software (continued)2011 2010
KShs KShs(ii) CompanyCostAt 1 January of previously stated 236,369,187 218,491,207
Reclassified from property and equipment - 7,361,451
Additions 57,387,294 10,516,529
At 31 December 293,756,481 236,369,187
AmortisationAt 1 January of previously stated 219,471,604 166,088,646
Transfer from property and equipment - 7,182,287
Amortisation for the year 32,518,638 46,200,671
At 31 December 251,990,242 219,471,604
Net carrying amount at 31 December 41,766,239 16,897,583
The company’s assets with a gross value of KShs 183,463,137 (2010 – KShs 196,192,974) are fully amortised but still in use. In the opinion of the directors, there was no impairment of goodwill during the year.
23. PREPAID OPERATING LEASE RENTALS
2011 2010KShs KShs
Group and CompanyCostAt 1 January and 31 December 147,115,472 143,005,034
Additions 115,837,471 4,110,438
At 31 December 262,952,943 147,115,472
AmortisationAt 1 January 7,520,775 5,553,392
Charge for the year 4,549,128 1,967,383
At 31 December 12,069,903 7,520,775
Net carrying amount at 31 December 250,883,040 139,594,697
Notes to the consolidated financial statements for the year ended 31 December 2011 (continued)
22. INTANGIBLE ASSETS (continued)

PAGE 82 | I&M BANK LTD REPORT & CONSOLIDATED FINANCIAL STATEMENTS 2011
24. DEFERRED TAX ASSET
Deferred tax assets at 31 December 2011 and 31 December 2010 are attributable to the following:
Notes to the consolidated financial statements for the year ended 31 December 2011 (continued)
Balance at 1 January
KShs
Prior year under/(over)
provision KShs
Exchange difference
KShs
Recognised in income statement
KShs
Balance at 31 December
KShs
(a) Group2011:
Property and equipment 5,296,396 (4,159,822) (2,198,485 2,638,871 1,576,960
General provisions 226,496,280 - 5,811,173 30,370,236 262,677,689
Other provisions 45,824,224 - 610,314 13,459,231 59,893,769
Tax losses 22,191,234 - 1,044,505 (23,235,739 -
299,808,134 (4,159,822) 5,267,507 23,232,599 324,148,418
2010:Property and equipment (4,094,203 - ( 900,694 10,291,293 5,296,396
General provisions 187,718,986 - 2,683,504 36,093,790 226,496,280
Other provisions 35,805,963 - 248,365 9,769,896 45,824,224
Tax losses 29,093,649 - 1,050,256 ( 7,952,671 22,191,234
248,524,395 - 3,081,431 48,202,308 299,808,134
2010:Property and equipment 22,950,851 - 9,187,054 32,137,905
General provisions 111,589,763 - 48,900,000 160,489,763
Other provisions 30,112,137 - 7,973,955 38,086,092
164,652,751 - 66,061,009 230,713,760
Balance at 1 January
KShs
Prior year under/(over)
provision KShs
Recognised in income statement
KShs
Balance at
31 December KShs
(b) Company2011:
Property and equipment 32,137,905 (4,159,822) 5,514,567 33,492,650
General provisions 160,489,763 - 17,739,774 178,229,537
Other provisions 38,086,092 - 11,917,555 50,003,647
230,713,760 ( 4,159,822) 35,171,896 261,725,834

PAGE 83 | I&M BANK LTD REPORT & CONSOLIDATED FINANCIAL STATEMENTS 2011
2011 2010KShs KShs
(a) GroupItems in transit 429,977,305 313,363,995
Rent receivable 8,940,969 4,095,497
Prepayments 189,523,816 246,695,276
Other receivables 760,918,008 350,543,657
1,389,360,098 914,698,425
(b) CompanyItems in transit 345,100,177 304,839,884
Rent receivable 8,940,969 4,095,497
Prepayments 150,051,863 213,321,837
Other receivables 292,572,498 166,510,372
796,665,507 688,767,590
2011 2010KShs KShs
(a) GroupPayable within one year - Company and subsidiary 2,546,060,409 1,393,755,221
(b) CompanyPayable within one year - Company 1,977,206,300 932,454,803
25. OTHER ASSETS
26. DEPOSITS FROM BANKS
2011 2010KShs KShs
(a) GroupGovernment and Parastatals 2,017,119,682 593,242,075
Private sector and individuals 83,195,784,146 67,615,186,245
85,212,903,828 68,208,428,320
(b) CompanyGovernment and Parastatals 1,328,272,092 95,604,219
Private sector and individuals 55,615,433,204 45,899,357,035
56,943,705,296 45,994,961,254
Notes to the consolidated financial statements for the year ended 31 December 2011 (continued)
The company’s weighted average effective interest rate on deposits from other banks and banking institutions at 31 December 2011 was 20.49% (2010 – 3.32%).
27. DEPOSITS FROM CUSTOMERS
The company’s weighted average effective interest rate on interest bearing deposits from customers at 31 December 2011 was 4.08% (2010 – 5.28%).

PAGE 84 | I&M BANK LTD REPORT & CONSOLIDATED FINANCIAL STATEMENTS 2011
2011 2010KShs KShs
(a) GroupBankers cheques payable 259,127,196 179,111,058
Accruals 491,993,124 394,284,247
Other accounts payables 624,814,140 366,612,004
1,375,934,460 940,007,309
(b) CompanyBankers cheques payable 130,093,745 117,433,531
Accruals 262,097,635 193,653,599
Other accounts payables 453,407,790 206,379,560
845,599,170 517,466,690
28. OTHER LIABILITIES
2011 2010KShs KShs
(a) GroupLess than one year 738,791,709 209,331,427
One to five years 2,342,531,325 1,933,918,703
Over five years 354,450,416 -
3,435,773,450 2,143,250,130
(b) CompanyLess than one year 481,423,432 143,707,872
One to five years 2,133,388,557 1,628,224,420
Over five years 354,450,416 -
2,969,262,405 1,771,932,292
During 2010, an additional long term borrowing agreement in the amount of USD 25mn was entered into with FMO (Nederlandse Financierings-Maatschappij Voor Ontwikkelingslanden N.V.). An amount of USD 10mn had been drawn down towards the end of 2010 and the balance of USD 15mn was drawn down in February 2011.
Notes to the consolidated financial statements for the year ended 31 December 2011 (continued)
Included in other liabilities is an amount relating to customer loyalty programme amounting to KShs 2,295,167 (2010 – KShs 1,947,179). The policy is to redeem the customer points at the point of annual renewal of the credit card. The minimum redemption points are 500. A customer earns 1 point for every KShs 500 transaction.
29. LONG TERM BORROWINGS

PAGE 85 | I&M BANK LTD REPORT & CONSOLIDATED FINANCIAL STATEMENTS 2011
The Company’s long term borrowings constituted the following: (i) USD 3,000,000 facility granted on 17 June, 2005 by the International Finance Corporation repayable semi
annually over six years. This facility was fully repaid by March 2011.
(ii) USD 1,250,000 facility granted on 5 August 2004 by PROPARCO repayable semi annually over six years. This facility was fully repaid by April 2011.
(iii) USD 5,500,000 facility granted on 12 November 2008 by PROPARCO repayable quarterly over five years. (iv) EUR 1,000,000 facility granted on 12 November 2008 by PROPARCO repayable quarterly over five years. (v) USD 25,000,000 facility granted on 24 November 2010 by FMO repayable over seven years after an initial
one year two months grace period. (vi) KShs 600,000,000 subordinated unsecured floating rate notes issued on 12 June 2008. The tenor is 7
years from the issue date and each note shall be redeemed in four equal instalments on 2 January 2014, 2 July 2014, 2 January 2015 and 11 July 2015.
The Company’s average effective interest rate on foreign currency long term borrowings was 4.31% (2010 – 3.15%).
The Company’s average effective interest rate on the unsecured Floating Rate Note was 9.92.% (2010 – 7.85%).
2011 2010KShs KShs
(a) Share capitalAuthorised30,000,000 Ordinary shares of KShs 100 each 3,000,000,000 3,000,000,000
Issued and fully paidAt 1 January
28,702,453 (2010 –26,135,608)
Ordinary shares of KShs 100 each 2,870,245,300 2,613,560,800
100,000 (2010 – 2,566,845) new shares of KShs 100
each issued at a premium of KShs 835 each
(2010 – KShs 835) 10,000,000 256,684,500
At 31 December28,802,453 (2010 – 28,702,453) Ordinary shares of kshs 100 each 2,880,245,300 2,870,245,300
(b) Additional capital injection
During the year, I&M Bank LIMITED issued 100,000 ordinary shares of KShs 100 at a premium of KShs 835 per share, thus increasing the issued and paid up share capital to KShs 2,880,245,300.
The holders of ordinary shares are entitled to receive dividends as declared from time to time and are entitled to one vote per share at annual and other general meetings of the Bank.
Notes to the consolidated financial statements for the year ended 31 December 2011 (continued)
29. LONG TERM BORROWINGS (continued)
30. SHARE CAPITAL AND RESERVES

PAGE 86 | I&M BANK LTD REPORT & CONSOLIDATED FINANCIAL STATEMENTS 2011
(c) Major ShareholdersThe major shareholders at 31 December 2011 and 2010 were as follows:
2011: Number of shares
%
1. Minard Holdings Limited 4,475,759 15.61%
2. Biashara Securities Ltd 4,008,740 13.97%
3. Ziyungi Limited 4,000,000 13.94%
4. Tecoma Limited 4,000,000 13.94%
5. DEG 3,100,000 10.80%
6. Proparco 2,575,000 8.97%
7. City Trust Limited 2,097,458 7.31%
8. Others 4,545,496 15.46%
28,802,453 100.00%
2010:1. Minard Holdings Limited 4,484,259 15.61%
2. Biashara Securities Ltd 4,008,740 13.97%
3. Ziyungi Limited 4,000,000 13.94%
4. Tecoma Limited 4,000,000 13.94%
5. DEG 3,100,000 10.80%
6. Proparco 2,575,000 8.97%
7. City Trust Limited 2,097,458 7.31%
8. Others 4,436,996 15.46%
28,702,453 100.00%
Notes to the consolidated financial statements for the year ended 31 December 2011 (continued)
30. SHARE CAPITAL AND RESERVES (continued)
The distribution of shareholders as at 31 December 2011 and 2010 was as follows:
2011 2010Share range Number of
shareholdersShares
held% Number of
shareholdersShares
held%
Less than 1m shares 105 4,545,496 15.78 85 4,436,996 15.46
>1m <2m - - - - - -
>2m <3m 2 4,672,458 16.22 2 4,672,458 16.28
>3m 5 19,584,499 68.00 5 19,592,999 68.26
Total 112 28,802,453 100.00 92 28,702,453 100.00

PAGE 87 | I&M BANK LTD REPORT & CONSOLIDATED FINANCIAL STATEMENTS 2011
(d) Share Premium2011 2010
KShs KShsAt 1 January 3,690,214,995 1,565,278,143
Share premium arising from issue of
shares at a premium 83,500,000 2,143,315,575
Expenses incurred in issuance of share capital ( 477,876 ( 18,378,723
At 31 December 3,773,237,119 3,690,214,995
The share premium arose from issuance of 100,000 ordinary shares of par value KShs 100 issued at a premium of KShs 835 per share.
(e) Revaluation ReserveThe revaluation reserve relates to the revaluation of property, plant and equipment.
(f) Statutory loan loss reserveWhere impairment losses required by legislation or regulations exceed those computed under International Financial Reporting Standards (IFRSs), the excess is recognised as a statutory reserve and accounted for as an appropriation of retained profits and the reverse for reductions. These reserves are not distributable.
(g) Translation reserveThe translation reserve comprises foreign exchange difference arising from the translation of the financial statements of foreign operations (namely the joint venture in Bank One Limited – Mauritius and the subsidiary I&M Bank (T) Limited - Tanzania), into the functional currency of the Parent company.
(h) Available-for-sale reserveThe available-for-sale reserve includes the cumulative net change in the fair value of available-for-sale investment, excluding impairment losses, until the investment is derecognised.
Notes to the consolidated financial statements for the year ended 31 December 2011 (continued)
30. SHARE CAPITAL AND RESERVES (continued)

PAGE 88 | I&M BANK LTD REPORT & CONSOLIDATED FINANCIAL STATEMENTS 2011
Consolidated (a) Reconciliation of profit before taxation to net cash flow
from operating activities2011 2010
KShs KShsProfit before income tax 4,953,892,690 3,526,481,475
Adjustments for:
Depreciation 151,956,006 139,628,976
Amortisation of intangible asset 48,187,261 56,255,883
Amortisation of prepaid operating lease rentals 4,549,128 1,967,383
Profit on sale of property and equipment ( 3,811,106 ( 916,682
Profit on sale of available for sale securities ( 301,658,206 ( 679,080,679
Exchange reserves 40,775,248 ( 92,305,043
4,893,891,021 2,952,031,223
Increase in operating assetsMovement in loans and advances to customers (16,108,521,070 (15,900,189,716
Investment in securities ( 8,285,470,178 (14,558,715,812
Cash and balances with central banks:
– Cash reserve ratio (crr) ( 1,093,573,728 ( 1,124,689,578
Other assets ( 474,661,673 277,205,607
(25,962,226,649 (31,306,389,499
Increase in operating liabilitiesCustomer deposits 17,004,475,508 17,542,620,507
Other liabilities 435,927,151 64,191,600
17,440,402,659 17,606,812,107
Cash flows from operating activities ( 3,627,932,969 ( 10,747,546,169
Tax paid ( 1,520,147,535 ( 677,119,356
Net cash flows from operating activities ( 5,148,080,504 ( 11,424,665,525
(b) Analyses of cash and cash equivalents – ConsolidatedChange in
2011 2010 the yearKShs KShs KShs
Cash and balances with Central Banks – excluding CRR 2,998,010,123 2,572,321,519 425,688,604
Deposits and balances due from banking institutions 9,909,058,869 6,095,811,170 3,813,247,699
Deposits and balances due to banking institutions (2,546,060,409 (1,393,755,221 ( 1,152,305,188
10,361,008,583 7,274,377,468 3,086,631,115
Notes to the consolidated financial statements for the year ended 31 December 2011 (continued)
31. NOTES TO THE CASH FLOW STATEMENT

PAGE 89 | I&M BANK LTD REPORT & CONSOLIDATED FINANCIAL STATEMENTS 2011
Company2011 2010
KShs KShs(c) Reconciliation of profit before taxation to net cash flow
from operating activitiesProfit before income tax 4,457,331,375 3,004,482,447
Adjustments for:
Depreciation 106,163,331 101,234,738
Amortisation of intangible asset 32,518,638 46,200,671
Amortisation of prepaid operating lease rentals 4,549,128 1,967,383
Profit on sale of property and equipment ( 3,811,106 (916,682
Profit on sale of Available for sale securities ( 301,245,059 ( 665,923,847
Dividend income ( 61,311,323 -
4,234,194,984 2,487,044,710
Increase in operating assetsMovement in loans and advances to customers (11,136,420,291 (11,051,015,120
Investment in securities ( 6,034,745,457 (13,537,684,285
Cash and balances with Central Bank of Kenya:
Cash Reserve Ratio (CRR) ( 835,032,833 ( 560,829,330
Other assets ( 107,897,917 66,777,976
(18,114,096,498 (25,082,750,759
Increase in operating liabilitiesCustomer deposits 10,948,744,042 11,195,956,491
Other liabilities 328,132,480 62,095,327
11,276,876,522 11,258,051,818
Cash flows from operating activities ( 2,603,024,992 ( 11,337,654,231Tax paid ( 1,422,255,112 ( 580,543,229
Net cash flows from operating activities ( 4,025,280,104 ( 11,918,197,460
(d) Analyses of cash and cash equivalents – CompanyChange
2011 2010 during the year
KShs KShs KShsCash and balances with Central Bank of Kenya
– excluding CRR (Note 16) 1,317,048,757 1,201,174,555 115,874,202
Deposits and balances due from
banking institutions 5,249,410,628 1,029,423,036 4,219,987,592
Deposits and balances due to
banking institutions (1,977,206,300 ( 932,454,803 (1,044,751,497
4,589,253,085 1,298,142,788 3,291,110,297
Notes to the consolidated financial statements for the year ended 31 December 2011 (continued)
31. NOTES TO THE CASH FLOW STATEMENT (continued)

PAGE 90 | I&M BANK LTD REPORT & CONSOLIDATED FINANCIAL STATEMENTS 2011
32. OFF BALANCE SHEET CONTINGENCIES AND COMMITMENTS
(a) Legal proceedings - company
There were a number of legal proceedings outstanding against the Bank at 31 December 2011. No provision has been made as professional advice indicates that it is unlikely that any significant loss will arise.
(b) Contractual off-balance sheet financial investments
In the ordinary course of business, the Bank conducts business involving guarantees, acceptances, letters of credit and bills for collection. These facilities are offset by corresponding obligations of third parties. At the year end, the contingencies were as follows:
2011 2010KShs KShs
Contingencies related to:
Letters of credit 7,056,848,537 5,505,654,646
Guarantees - Advances 8,579,627,894 6,618,343,278
- Central Bank of Kenya 62,179,677 56,150,026
Acceptances 5,394,258,550 3,756,955,817
Bills for collection 2,196,433,201 1,567,241,982
23,289,347,859 17,504,345,749
Commitments related to:
Outstanding spot/forward contracts 9,680,515,042 7,274,999,587
32,969,862,901 24,779,345,336
(c) Nature of contingent liabilities
Guarantees are generally written by a bank to support performance by a customer to third parties. The Bank will only be required to meet these obligations in the event of the customer’s default.
Letters of credit commit the Bank to make payment to third parties, on production of documents, which are subsequently reimbursed by customers.
An acceptance is an undertaking by a bank to pay a bill of exchange drawn on a customer. The Bank expects most acceptances to be presented and reimbursement by the customer is almost immediate.
Bills for collection are undertakings by the Bank to collect money from their customers for payment to a third party. They do not bestow any obligations to the Bank.
Forward contracts are arrangements to buy or sell a specified quantity of foreign currency, usually on a specified future date at an agreed rate.
The fair values of the respective currency forwards are carried on the face of the balance sheet.
33. ASSETS PLEDGED AS SECURITY - COMPANY
As at 31 December 2011, Treasury Bonds with a face value of KShs 2,225,000,000 (2010 – KShs 1,255,000,000) were held under lien in favour of the Central Bank of Kenya.
Notes to the consolidated financial statements for the year ended 31 December 2011 (continued)

PAGE 91 | I&M BANK LTD REPORT & CONSOLIDATED FINANCIAL STATEMENTS 2011
34. RELATED PARTY TRANSACTIONS - COMPANY
2011KShs
2010KShs
(a) Transactions with directors/shareholdersLoans to related parties 1,418,979 1,217,868
The related interest income for loans was KShs 67,445 (2010 – KShs 64,304).
2011KShs
2010KShs
(b) Transactions with related companiesDeposits from related companies 33,700,828 -
Interest expense on deposits from related companies was KShs 1,771,572 (2010 – KShs 1,928,338).
2011KShs
2010KShs
(c) Transactions with employeesStaff loans 221,080,086 154,122,865
Interest earned on these loans was KShs 11,213,230 (2010 – KShs 9,385,891).
In the normal course of business, transactions have been entered with certain related parties. These transactions are at arm’s length.
35. CAPITAL COMMITMENTS
2011 2010KShs KShs
Consolidated 161,517,845 68,839,732
Notes to the consolidated financial statements for the year ended 31 December 2011 (continued)
36. FUTURE RENTAL COMMITMENTS UNDER OPERATING LEASES - COMPANY
(a) Lessee
The Bank leases nineteen bank premises under operating leases. The leases typically run for an initial period of six years with an option to renew the lease after that date. None of the leases include contingent rentals. During the year, KShs 78,910,412 (2010 – KShs 61,980,319) was charged to the income statement in respect of operating leases. Future minimum lease payments under these operating leases are as follows:
2011 2010KShs KShs
Less than one year 89,218,736 60,589,070
One to five years 237,914,865 210,810,238
Over five years 29,791,066 61,671,417
356,924,667 333,070,725

PAGE 92 | I&M BANK LTD REPORT & CONSOLIDATED FINANCIAL STATEMENTS 2011
2011 2010KShs KShs
Less than one year 68,293,507 61,347,708
One to five years 152,263,052 239,261,291
Over five years - 41,363,080
220,556,559 341,972,079
(b) Lessor
The company leases out its building under operating leases (Note 19). Non-cancellable operating lease rentals are receivable as follows:
During the year, KShs 70,616,073 (2010 – KShs 65,575,986) was recognized as rental income in the income statement in respect of operating leases. In addition, KShs 7,800,000 (2010 – KShs 7,800,000) in respect of management expenses was recognized as an expense in the income statement in respect of the building.
Notes to the consolidated financial statements for the year ended 31 December 2011 (continued)
36. FUTURE RENTAL COMMITMENTS UNDER OPERATING LEASES - COMPANY (continued)

BLOOD DONATION
I&M Bank staff responded in large numbers to an appeal for blood donation for the victims of what became known as the Sinai Fire tragedy in September 2011. The fire started by a petrol leak from a fuel pipeline and saw nearly 100 people dead and over 100 people admitted at the Kenyatta National Hospital with serious burns. Sinai is a densely populated slum in Nairobi’s Industrial area.
DIGNITAS PROJECT
Part of I&M Bank’s CSR Policy is to try and improve the quality of life of the local communities it operates in. It is with this in mind that the bank partnered with Dignitas project by way of a donation worth KShs.2 million to assist in enabling the organisation to empower children and families in poor communities specifically in Nairobi’s Mathare valley through education and opportunity. With this donation and others from various sponsors Dignitas was able to induct 85 teachers, principals and school committee members into a 1 year leadership program that provides on-site support, professional development, technical assistance and coaching.
KIBAGARE GOOD NEWS CENTRE – ANNUAL FEEDING PROGRAMME
I&M Bank continued to support Kibagare Good News Centre through a monthly feeding programme that sees over 1500 children from the nearby slums enjoy a hearty meal served by bank staff. Kibagare center is run by the Assumption Sisters of Nairobi who initially run it as a settlement for the hungry children.
KENYA ORCHID SOCIETY
Kenya Orchid Society is a non-profit organisation that was formed in 1952 with its principal objective being to create and increase interest in orchids, their cultivation and conservation throghout Kenya and other East African Countries. The bank sponsored the Society’s Annual Orchid show which assisted the organisers to attract 1,000 vistors to unique orchid displays and access to information on various types of of orchids.
I&M Bank is committed to improving the quality of life of the society in which it operates. In this regard, the Bank has been supporting needy deserving projects, institutions and individuals around the country through its Corporate Social Responsibility programme and creating long term relationships with them. Some of these projects are highlighted hereunder:
PAGE 93 | I&M BANK LTD REPORT & CONSOLIDATED FINANCIAL STATEMENTS 2011
KENYA RED CROSS- KENYANS FOR KENYA
I&M Bank joined Kenyans in the ‘Kenyans for Kenya’ initiative to assist those hit by one of the worst droughts the country had experienced in recent times. The bank staff pooled together and contributed cash while the bank also contributed through its CSR kitty a total of KShs1 million. The Bank also committed to funding the cost of putting up 4 greenhouses at an estimated cost of KShs. 1.16 million in some of the worst hit areas to try and ensure that they can sustain themselves in the future.
CSR news

LIONS CLUB GREATER NAIROBI
I&M Bank sponsored 50 wheelchairs and 10 corneal transplants through Lions Club Greater Nairobi. The wheelchairs benefited disabled persons while the corneal transplants ensured that 10 needy patients have their sight transformed. Lions Club Nairobi is part of the larger international service organization that endeavors to assist the less fortunate.
NEST CHILDRENS HOME
I&M Bank committed to continue purchasing baby formula for children at the Nest Children’s home for the year 2011. In 2010 the bank started a relationship with the Nest to purchase formula for the infants rescued by the home after the imprisonment of their mothers.
PORT RIETZ APDK CLINIC IN MOMBASA
I&M Bank together with Sarova Whitesands Beach Resort and Spa each contributed an amount of KShs 500,000 to Port Rietz APDK Clinic towards the facilitation of corrective surgeries for handicapped children in Mombasa.
Numerous lives of young children have been changed through operations carried out by APDK, a project of the Association for the Physically Disabled of Kenya Coast Branch which depends solely on donor funding.
CORNEL NGALEKU CHILDRENS CENTRE (CNCC), TANZANIA
Cornel Ngaleku Children Centre is one of the orphanages in Tanzania, located in a drought stricken remote village in the Rombo District along the lower eastern slopes of Mt. Kilimanjaro. The donation of KShs. 2 million from I&M Bank (T) Ltd went to the upkeep of the children who were either orphaned due to loss of parents through HIV AIDS, or abandoned and left in the care of relatives who are unable to provide quality care due to poverty, old age or mental illness.
CSR news (Continued)
PALMHOUSE FOUNDATION
I&M Bank donated KShs. 1.6 million to the Palmhouse Foundation and Education Trust which enables needy and deserving students realise their dreams through the pursuit of secondary education. The bank has been making donations to the foundation since 2007 and has enabled bright and deserving students to attend some of Kenya’s leading schools in pursuit of good education.
PAGE 94 | I&M BANK LTD REPORT & CONSOLIDATED FINANCIAL STATEMENTS 2011

DONATION TO EAST POKOT IN CONJUNCTION WITH VISA OSHWAL COMMUNITY, NAKURU
In December 2011, as the festive season approached, Visa Oshwal Community, Nakuru together with I&M Bank embarked on a donation activity in the dry and remote villages – Loruk and Koomolion in East Pokot. 300 families benefited, receiving a food pack consisting of beans, rice, sugar, salt, uji mix, cooking fat and bar soap, juice packs, pens and diaries.
ROHO KWA ROHO FOUNDATION
Roho Kwa Roho Foundation is the charitable arm of Peak Performance International that seeks to highlight the plight of vulnerable children in the society. It specifically supports two categories of children:
a. HIV orphans living in the slums. Most of the children are located in the vast slum of Kawangware.
b. Mentally impaired children from poor families drawn from Kibera, Githurai and Mukuru Kwa Njenga slums as well as from rural areas of Kirinyaga
KARURA FOREST
In 2005, I&M Bank in conjunction with Kenya Forest Service decided to help champion the cause against destruction of the country’s forests by undertaking to replant with indigenous trees and develop and maintain 10 hectares of the forest. Unfortunately, part of the Karura including the I&M Forest was destroyed by fire in 2009 and there was need to replant again. I&M Bank then replanted the forest in 2011 with indigenous Kenyan trees and has taken all steps to ensure that the growth of the trees are well managed to ensure that they thrive as they should.
AMARA CHARITABLE TRUST
Enable,enhance,educate and empower are some of the driving principals behind Amara Trust that have seen the organisation provide clean drinking water plus transform the lives of communities in some Kenya’s arid areas. I&M Bank has in the past happily contributed to Amara to assist them in ensuring that they are able to attain their goals. In 2011 the bank contributed KShs. 600,000 towards the ongoing upgrade of the Kwa Kalusya school through the development of new classrooms for the needy students.
CSR news (Continued)
PAGE 95 | I&M BANK LTD REPORT & CONSOLIDATED FINANCIAL STATEMENTS 2011

RHINO CHARGE
I&M Bank donated funds in support of 2 teams who took part in the annual Rhino Charge event. In fact, one of the two teams the bank sponsored – Car 15, turned out to be one of the top 5 fund raisers at the event, raising over Kshs 2.3 million. The Rhino Charge is an annual off-road motorsport competition event organized by Rhino Ark Charitable Trust to help raise funds for the conservation of Kenya’s Aberdare Eco System.
LOCAL AID CENTRE
I&M Bank supported Local Aid, a not-for-profit organisation registered in 2009 and formed to empower marginalized communities and vulnerable children in Kenya.
CSR news (Continued)
ST.ANNE GICHOCHO OFFICIAL OPENING OF SPONSORED DORMITORY
Members of I&M Bank’s Board of Directors, senior management and staff joined St.Anne’s students and their teachers in the official opening of the new dormitory funded by I&M Bank. The Bank’s Chairman and Executive Director spoke at the function and expressed their gratitude to the School’s principal and Board for allowing the Bank to be part of a venture that would help the girls concentrate on their education without worrying about how and where they would sleep. The dormitory was constructed at a total cost KShs. 15 million.
NAIROBI HOSPICE
I&M Bank espouses the Nairobi Hospice which cares for and supports patients and families facing life limiting illnesses especially cancer, HIV&AIDS. Services are provided at the Hospice on out-patient basis, in hospitals and at the patients’ homes within a 20km radius.
FARAJA - CANCER SUPPORT
Faraja Cancer Support Trust is a charitable trust established in 2010 with the aim of providing emotional, practical and healing support to anyone affected by cancer. Faraja has given hope to many cancer survivors and I&M Bank was happy to assist in their noble work
PAGE 96 | I&M BANK LTD REPORT & CONSOLIDATED FINANCIAL STATEMENTS 2011