Helle, M., Ravaja, N. et al. 2011 MEDIAEXPERIENCE. Theoretical Model of Media Experience. Next Media...
75
Next Media - a Tivit Programme WP0 D4.1 AND D4.2 WP0 D0.4.1 AND D0.4.2 MEDIA EXPERIENCE 1 (74) A Theoretical Model of Media Experience and Research Methods for Studying It D 0.4.1 D 0.4.2 A Theoretical Model of Media Experience and Research Methods for Studying It Author(s): Merja Helle, Niklas Ravaja, Harri Heikkilä, Jan Kallenbach, Anu Kankainen, Jari Kätsyri, Janne Laine, Dorina Marghescu Confidentiality: Public Date and status: Final version 15.8.2011
Transcript of Helle, M., Ravaja, N. et al. 2011 MEDIAEXPERIENCE. Theoretical Model of Media Experience. Next Media...

Next Media - a Tivit Programme
WP0 D4.1 AND D4.2
WP0 D0.4.1 AND D0.4.2 MEDIA EXPERIENCE
1 (74)
A Theoretical Model of Media Experience and Research
Methods for Studying It
D 0.4.1
D 0.4.2
A Theoretical Model of Media Experience
and Research Methods for Studying It
Author(s): Merja Helle, Niklas Ravaja, Harri Heikkilä, Jan Kallenbach,
Anu Kankainen, Jari Kätsyri, Janne Laine, Dorina Marghescu
Confidentiality: Public
Date and status: Final version 15.8.2011

Next Media - a Tivit Programme
WP0 D4.1 AND D4.2
WP0 D0.4.1 AND D0.4.2 MEDIA EXPERIENCE
2 (74)
This work was supported by TEKES as part of the next Media programme of TIVIT
(Finnish Strategic Centre for Science, Technology and Innovation in the field of ICT)
Version history:
Version Date State
(l)
Author(s) OR
Editor/Contributors
Remarks
1.0
0.2
30.4..2011
2.5. 2011
Version 0.9
Version 2.0 final
Merja Helle, Niklas
Ravaja, Jari Kätsyri,
Janne Laine, Anu
Kankainen, Jan
Kallenbach, Harri
Heikkilä
3.0 20.6.2011 Version 3.0 final Merja Helle, Niklas
Ravaja, Jari Kätsyri,
Janne Laine, Anu
Kankainen, Jan
Kallenbach, Harri
Heikkilä, Dorina
Marghescu
Participants
Name Organisation
ASE Niklas Ravaja, Jari Kätsyri,
Dorina Marghescu
Aalto University School of Economics
AST Jan Kallenbach Aalto University School of Science and
Technology
HIIT Anu Kankainen Aalto University School of Science, HIIT
AALTO TAIK Merja Helle, Harri Heikkilä Aalto University School of Art and Design
VTT Janne Laine Technical Research Centre of Finland

Next Media - a Tivit Programme
WP0 D4.1 AND D4.2
WP0 D0.4.1 AND D0.4.2 MEDIA EXPERIENCE
3 (74)
Alma Media Heli Virola
Alma Media Kari Hurtola
Otavamedia Kirsi Kupila
Otavamedia Hannele Spring
SanomaNews Johanna Maula
SanomaNews Reetta Meriläinen
SanomaNews Jaakko Kuivalainen
SanomaNews Petteri Putkiranta
SanomaNews Kaisa Aula
SanomaMagazines Kirsi Kupila
Talentum Elina Yrjölä
Yleisradio Susanna Snell
Yleisradio Annika Ruoranen
Yleisradio Katja Lahti
next Media
www.nextmedia.fi
www.tivit.fi
Next Media - a Tivit Programme
WP0 D4.1 AND D4.2
WP0 D0.4.1 AND D0.4.2 MEDIA EXPERIENCE
4 (74)
Table of Contents
Executive Summary................................................................................................................................... 7
1. Introduction ........................................................................................................................................ 7
1.1. Task overview and objectives ............................................................................................................................. 7
1.2. Report structure ........................................................................................................................................................ 8
2. General overview of media experience model .......................................................................... 8
3. Media experience dimensions .................................................................................................... 11
3.1. Visuality and presentational factors ............................................................................................................ 11
3.2. Feeling dimensions................................................................................................................................................ 12
3.2.1. Emotions ............................................................................................................................................................ 12
3.2.2. Flow ...................................................................................................................................................................... 13
3.2.3. Spatial presence.............................................................................................................................................. 14
3.2.4. Social presence ................................................................................................................................................ 15
3.2.5. Sensory perception ....................................................................................................................................... 16
3.3. Appraisal dimensions........................................................................................................................................... 17
3.3.1. Usefulness .......................................................................................................................................................... 18
3.3.2. Interestingness................................................................................................................................................ 18
3.3.3. Understandability .......................................................................................................................................... 18
3.3.4. Trustworthiness ............................................................................................................................................. 18
3.3.5. Familiarity ......................................................................................................................................................... 18
3.3.6. Unexpectedness .............................................................................................................................................. 19
3.3.7. Brand experience ........................................................................................................................................... 19
3.3.8. Price/value ........................................................................................................................................................ 19
3.3.9. Playfulness (entertainingness) ............................................................................................................... 19
3.4. Interaction dimensions ....................................................................................................................................... 21
3.4.1. Usability .............................................................................................................................................................. 21
3.4.2. Interactivity ...................................................................................................................................................... 22
4. Research methods .......................................................................................................................... 23
4.1. Psychophysiology ................................................................................................................................................... 23
4.1.1. Facial electromyography (EMG) ............................................................................................................ 24
4.1.2. Electroencephalography (EEG) .............................................................................................................. 24

Next Media - a Tivit Programme
WP0 D4.1 AND D4.2
WP0 D0.4.1 AND D0.4.2 MEDIA EXPERIENCE
5 (74)
4.1.3. Electrodermal activity (EDA) .................................................................................................................. 24
4.1.4. Heart rate (HR) and related measures ............................................................................................... 24
4.2. Self-reporting .......................................................................................................................................................... 25
4.2.1. Sensory evaluation ........................................................................................................................................ 25
4.2.2. Spatial presence questionnaires ............................................................................................................ 27
4.2.3. Social presence questionnaire ................................................................................................................ 27
4.2.4. Flow questionnaires ..................................................................................................................................... 28
4.2.5. Emotion ratings .............................................................................................................................................. 28
4.2.6. Playfulness scales .......................................................................................................................................... 28
4.2.7. Brand experience scale ............................................................................................................................... 28
4.3. Behavioural measurements .............................................................................................................................. 29
4.3.1. Eye tracking ...................................................................................................................................................... 29
4.3.2. User logging ...................................................................................................................................................... 30
4.4. Media ethnography .............................................................................................................................................. 31
4.4.1. Video recording .............................................................................................................................................. 32
4.4.2. Close reading .................................................................................................................................................... 33
4.5. Usability evaluation.............................................................................................................................................. 34
5. Research methods tapping different experience dimensions ........................................... 35
5.1. Psychophysiological measurements ............................................................................................................. 36
5.1.1. Facial EMG ......................................................................................................................................................... 36
5.1.2. EEG ........................................................................................................................................................................ 37
5.1.3. EDA ........................................................................................................................................................................ 38
5.1.4. Heart rate ........................................................................................................................................................... 39
5.2. Self-reports ............................................................................................................................................................... 39
6. Conclusion ........................................................................................................................................ 41
7. Appendix ........................................................................................................................................... 42
7.1. Meta-level: Society, technology, economy and new media products and practices ............... 42
7.1.1. Emerging techno-economic paradigm changes the media field ........................................... 42
7.1.2. New audience measurement system emerging ............................................................................. 45
7.2. Media practices, habits and needs ................................................................................................................. 47
7.2.1. Everyday media practices ......................................................................................................................... 47
7.2.2. Needs and media content .......................................................................................................................... 50

Next Media - a Tivit Programme
WP0 D4.1 AND D4.2
WP0 D0.4.1 AND D0.4.2 MEDIA EXPERIENCE
6 (74)
7.3. Macro-level: Social interaction ....................................................................................................................... 51
7.3.1. Co-experience .................................................................................................................................................. 51
7.3.2. Social presence ................................................................................................................................................ 52
7.4. Interaction with media artefact ..................................................................................................................... 52
7.4.1. Usability .............................................................................................................................................................. 52
Measuring usability with qualitative emphasis .............................................................................................. 54
From error finding to solutions for enhanced UX.......................................................................................... 54
7.4.2. Interaction ......................................................................................................................................................... 54
Experience and Interaction ....................................................................................................................................... 55
The Role of Effort ............................................................................................................................................................ 57
Interaction Experience and Quality ...................................................................................................................... 57
7.4.3. Interactivity ...................................................................................................................................................... 58
Theoretical background .............................................................................................................................................. 58
Interactivity and Experience .................................................................................................................................... 60
7.5. From sensory evaluation to mental impressions on media ............................................................... 61
7.6. User dimensions............................................................................................................................................................ 65
7.6.1 Personality.............................................................................................................................................................. 65
7.6.2. Values ....................................................................................................................................................................... 67
8. References ........................................................................................................................................ 68
Next Media - a Tivit Programme
WP0 D4.1 AND D4.2
WP0 D0.4.1 AND D0.4.2 MEDIA EXPERIENCE
7 (74)
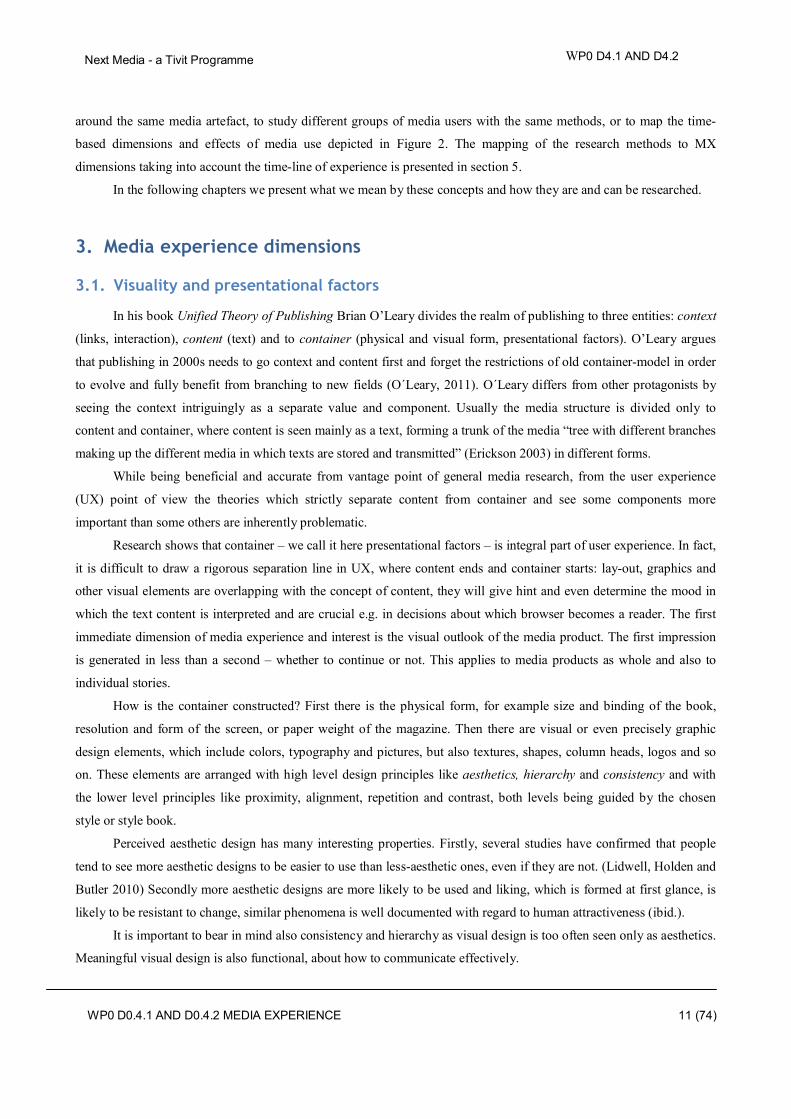
Executive Summary
The importance of taking media experience into account when creating new media content, services and
technologies is well established. There are several methodological approaches and measurement techniques (e.g.,
interview, self-report, psychophysiological assessment, tracking of behavioural indicators of media experience, media
ethnography) to assess media experience, but they are not well integrated with each other.
In this report, we introduce a model of media experience which identifies the media experience dimensions and
their relationships. Moreover, we present a framework which maps the media experience dimensions to several possible
research and measurement methods. The model takes into account three levels of looking at media experience: a meta-
level, a macro-level, and a micro-level. First, the meta-level refers to the societal, economic and technological changes
which alter media use and media products. Second, the macro-level deals with the increasingly important social aspect
of media use and media experience. Third, the micro-level represents individual dimensions of the media experience
including everyday media practices, interaction with the media artefact, what the media feels like, and evaluation of
media content. In addition to these experience dimensions at the micro-level, the motives and context of use (e.g., goals
and habits), the user dimensions (e.g., personality and values), and the media characteristics (especially interactivity)
are discussed.
Research partners include Aalto School of Economics, Aalto School of Basic Sciences, Aalto TAIK, HIIT and
VTT. Each partner brings into media experience research their own theoretical background and research methods which
are presented in this report.
The aim is to utilize these different approaches in pilot studies with media companies to test and evaluate the
methods and results in order to develop combinations of methods which give a deeper understanding of changing media
use and media experience.
1. Introduction
1.1. Task overview and objectives
The objective of this work is to integrate the different media experience assessment methodologies. An
important research question is how the various methods employed in media experience research could be combined in
order to get more accurate and comprehensive information on media experience. In this connection, the validity (e.g.,
convergent validity) of the different methods will be assessed in the pilot research to be conducted in fall 2011.
Specific objectives are:
to identify the most relevant media-specific experience dimensions;
to examine/assess the validity of the different measures as indices of these dimensions;
to develop/identify methods to assess co-experience and playfulness and to identify the factors that contribute
to them. Co-experience and playfulness are emerging features of media experience because media
consumption can be viewed as a social activity that takes place in connection with family member and friends,
for example. Playfulness has also been identified as an important factor in media experience;
to compare the media experience elicited by traditional and digital media.

Next Media - a Tivit Programme
WP0 D4.1 AND D4.2
WP0 D0.4.1 AND D0.4.2 MEDIA EXPERIENCE
8 (74)
In particular, this report focuses on identifying and describing the dimensions of the media experience. The
output of this task is a model of media experience. Both traditional dimensions known as influencing media experience
and new dimensions emerging from the advances of media in terms of interactivity and social factors embedded in the
media products are discussed. Our previous research has identified four main categories of research methods of media
experience, namely psychophysiological, self-reporting, behavioural and ethnographic. Finally, we provide a
framework for mapping the experience dimensions to suitable methods of research taking also into account whether the
experience is described through feeling or appraisal dimensions. By providing also a time-based mapping of experience
dimensions to different research methods, the report tries also to identify how the objective measurements of different
media experience dimensions can be used to assess/predict immediate and long-term (engaging) effects of media use.
This in turn can have an impact on designing new product concepts and on identifying target groups and attraction plans
of customers.
Media products can be classified based on the type of content as static content, interactive content, and moving
picture content (e.g., video). In the present project and report, we focus on the evaluation of media experience with print
and digital media that can contain interactive elements and video (however, movies and games are mainly excluded).
1.2. Report structure
The report starts with Executive Summary which summarizes the aim and the contents of the report, as well as
the project partners. Chapter 1 presents an introduction of the task carried out.
Chapter 2 introduces the media experience model. To capture the diversity and interconnectedness of media
experience dimensions, we have divided the model into three levels, which we named meta, macro and micro, and
which influence each other and also have impact on the actual media use and media experience. The Appendix presents
in detail the meta- and macro-levels, while Chapter 3 describes the dimensions at the micro-level. Chapter 4 discusses
in more detail the characteristics of the research methods used to measure the media experience (i.e., collect and analyse
data). Chapter 5 presents a framework which maps the media experience dimensions to several possible research and
measurement methods. Chapter 6 concludes the report by highlighting possible research directions and challenges. In
Appendix there are detailed the aspects of media experience that are not addressed in the main document or addressed
briefly, such as the meta-level, the macro-level describing the social dimensions of media experience, interactivity
elements of the media artefact and user interaction models, sensory perception experience map, and user dimensions.
2. General overview of media experience model
The model of media experience developed in this project is presented in Figure 1. It is developed based on
theoretical and practical knowledge of audience behaviour and audience or media experience methods. We have also
interviewed media representatives both from research, editorial and digital departments about how their organizations
do audience research, how they define media experience, and what needs they have for research about media use.

Next Media - a Tivit Programme
WP0 D4.1 AND D4.2
WP0 D0.4.1 AND D0.4.2 MEDIA EXPERIENCE
9 (74)
The media experience model presented below does not include time-based phases of media use, nor does it show
the causal or temporal relationships between different dimensions using arrows. The dimensions of media experience
can occur at different phases of becoming exposed to media. The phases of exposure of a user to a media product and
how the engagement/disengagement can occur in time are presented in Figure 2, based on the audience model by Napoli
(2010a, p. 91). The dimensions of the experience model in Figure 1 are highly intertwined and in our different research
approaches we have different starting points and different research contexts, ranging from the household and individual
everyday media practices to laboratory settings with electrodes, to measure emotions.
MODEL OF MEDIA EXPERIENCE (MX)
Medium Print Broadcast Digital platforms Terminal and operating system
META-LEVEL – Societal situation SOCIETY – ECONOMY – TECHNOLOGY New media products and practices
SHORT-TERM AND LONG-TERM EFFECTS Engagement Attitude Recall Choice Adoption Habits
MACRO-LEVEL – Social interaction FACE-TO-FACE INTERACTION Co-located use of media Discussing Social action Involvement in social groups Playing
WEB/MEDIATED SOCIAL INTERACTION Communicating Sharing Recommending Producing content Circulating content Evaluating content Commenting Social filtering
MICRO-LEVEL – Individuals and artefacts MOTIVES Goals Needs Habits Lifestyle Practices Daily media use Emerging media use Simultaneous media use Time and place
CONTENT Text Images Sound Visuality and presentational factors INTERACTION Usability Interactivity Personalization
FEELING Emotions Flow Spatial presence Social presence Sensory perception APPRAISAL Usefulness Interestingness Understandability Trustworthiness Familiarity Unexpectedness Brand experience Price/value Playfulness
USERS Demographics Personality Values Attitudes Beliefs
Figure 1. Model of media experience (the dimensions in italics are described in detail and considered for measurement in further studies)
The model is first divided into meta-, macro- and micro-levels – from societal change to how the paper of a
magazine feels like, for example. The meta-level is introduced because the changing media field and the societal and
cultural context are essential in understanding media use and experience, as well as the need to develop existing and
new media experience methods. The macro-level, the social uses of media, is a fairly new phenomenon, but with
digitalization has emerged not only in web use but also e.g. in e-reading programs as online book club discussions,

Next Media - a Tivit Programme
WP0 D4.1 AND D4.2
WP0 D0.4.1 AND D0.4.2 MEDIA EXPERIENCE
10 (74)
online sharing and social filtering. News are circulated by sharing and recommending, they can be commented on or
become personalized like in Negroponte’s (1996, p. 153) idea of an electronic personalized newspaper, “The Daily Me”
like a “a printed edition of one”.
The micro-level of media experience depends first of all on the medium because print, broadcast and digital
platforms provide different types of content to the readers/users. Besides the content (that is, text, images and sounds),
the visual format (visuality) in which the content is presented also influences the media experience. The interaction
feature as defined by the interactivity elements of the media products influences usability and hence the user experience
with the media. The core components of the media experience are the feeling and appraisal dimensions which define the
way the user feels and thinks about the media he/she uses. The media practices, needs and user dimensions such as
personality and values are described in the Appendix. The dimensions highlighted in italics are described in the main
document.
To illustrate a time line of media use and engagement/disengagement, we refer to Napoli’s model of audience
dimensions (Napoli 2010a) describing the phases of audience behaviour starting with awareness of a media product and
ending with behaviour or action (Figure 2).
Figure 2. Audience dimensions (Napoli 2010a, 91).
The audience model starts with awareness of media products which can then lead to interest and exposure. This
is a crucial issue in the fragmented and competitive media environment. In American magazine shops there can be
thousands of magazines to choose. Or how can a new media product be introduced? One way bookstores have set up is
a coffee shop inside bookstores where you can browse books, newspapers and magazines. If one starts browsing or
watching a program interest can follow but also disinterest. Napoli places attentiveness and loyalty in parallel with
exposure as they are described usually with exposure data. They are also placed under the broad headline of
engagement which includes appreciation and emotional response. These in turn influence recall and attitude and lead to
behavioural changes.
We have presented a comprehensive model of media experience, but do not claim or suggest that all dimensions
and methods presented in the following chapters should or even could be used in the same study. Depending on the
research questions and theoretical and practical interests, it is possible to combine several dimensions and methods
Next Media - a Tivit Programme
WP0 D4.1 AND D4.2
WP0 D0.4.1 AND D0.4.2 MEDIA EXPERIENCE
11 (74)
around the same media artefact, to study different groups of media users with the same methods, or to map the time-
based dimensions and effects of media use depicted in Figure 2. The mapping of the research methods to MX
dimensions taking into account the time-line of experience is presented in section 5.
In the following chapters we present what we mean by these concepts and how they are and can be researched.
3. Media experience dimensions
3.1. Visuality and presentational factors
In his book Unified Theory of Publishing Brian O’Leary divides the realm of publishing to three entities: context
(links, interaction), content (text) and to container (physical and visual form, presentational factors). O’Leary argues
that publishing in 2000s needs to go context and content first and forget the restrictions of old container-model in order
to evolve and fully benefit from branching to new fields (O´Leary, 2011). O´Leary differs from other protagonists by
seeing the context intriguingly as a separate value and component. Usually the media structure is divided only to
content and container, where content is seen mainly as a text, forming a trunk of the media “tree with different branches
making up the different media in which texts are stored and transmitted” (Erickson 2003) in different forms.
While being beneficial and accurate from vantage point of general media research, from the user experience
(UX) point of view the theories which strictly separate content from container and see some components more
important than some others are inherently problematic.
Research shows that container – we call it here presentational factors – is integral part of user experience. In fact,
it is difficult to draw a rigorous separation line in UX, where content ends and container starts: lay-out, graphics and
other visual elements are overlapping with the concept of content, they will give hint and even determine the mood in
which the text content is interpreted and are crucial e.g. in decisions about which browser becomes a reader. The first
immediate dimension of media experience and interest is the visual outlook of the media product. The first impression
is generated in less than a second – whether to continue or not. This applies to media products as whole and also to
individual stories.
How is the container constructed? First there is the physical form, for example size and binding of the book,
resolution and form of the screen, or paper weight of the magazine. Then there are visual or even precisely graphic
design elements, which include colors, typography and pictures, but also textures, shapes, column heads, logos and so
on. These elements are arranged with high level design principles like aesthetics, hierarchy and consistency and with
the lower level principles like proximity, alignment, repetition and contrast, both levels being guided by the chosen
style or style book.
Perceived aesthetic design has many interesting properties. Firstly, several studies have confirmed that people
tend to see more aesthetic designs to be easier to use than less-aesthetic ones, even if they are not. (Lidwell, Holden and
Butler 2010) Secondly more aesthetic designs are more likely to be used and liking, which is formed at first glance, is
likely to be resistant to change, similar phenomena is well documented with regard to human attractiveness (ibid.).
It is important to bear in mind also consistency and hierarchy as visual design is too often seen only as aesthetics.
Meaningful visual design is also functional, about how to communicate effectively.

Next Media - a Tivit Programme
WP0 D4.1 AND D4.2
WP0 D0.4.1 AND D0.4.2 MEDIA EXPERIENCE
12 (74)
Visual hierarchy in which elements are emphasized and content is organized logically and predictably is crucial
variable in UX. Purpose of hierarchy is to make it easy for a reader to use the product. It is about user experience design
but also about usability.
Especially important is the brand visuality, the basic visual elements that are produced from issue to issue, or in a
series’ episodes in consistent way. Consistency forms the identity, which of course can and have to be varied with limits
that are still recognizable for brand. Visuality remains much the same, but cannot be directly copied in its details from
one issue to another. Also the visual consistency creates differences between different media products and genres.
Sandboxing the media elements – content, container and context – can also lead to quality problems in
production. If visual form is seen as part of content, they are designed simultaneously which leads to different solution
as seeing visuality as something that can be added afterwards, like candy wrap. In modern editorial environment the art
director is more often seen as a right hand of the editor, taking part in editorial decisions not as an separate artist who
tries to visualize text after it has been created (Helle 2010; Helle and Töyry 2009). Bad example of sandboxing is the
common phenomena in media web sites, which live in a separate universum not giving much support the main product.
Reactions on visuality can be studied with many methods: interviews, questionnaires, close reading, giving tasks,
self-reporting, eye-tracking and measuring emotions in reading situations.
3.2. Feeling dimensions
3.2.1. Emotions
Emotions are a powerful force influencing the behaviour of humans as well as several other species (Plutchik,
2002), and as such there is no reason to expect that they would not be involved in media experiences as well. Emotions
are intimately related to the four primary goals of media messages: to attract attention, to be remembered, to entertain
and to persuade (Bolls et al., 2001; Ravaja, 2004a). It is likely that media that succeed to move their users emotionally
capture more attention and are remembered better, are more entertaining and more persuasive.
Although various definitions of emotions have been proposed, most emotion theorists endorse a multi-
component view where emotions are constituted by three aspects or components: subjective feelings, expressive
behaviours, and physiological responses; others add cognitive appraisal and/or action tendencies as well (e.g., Oatley et
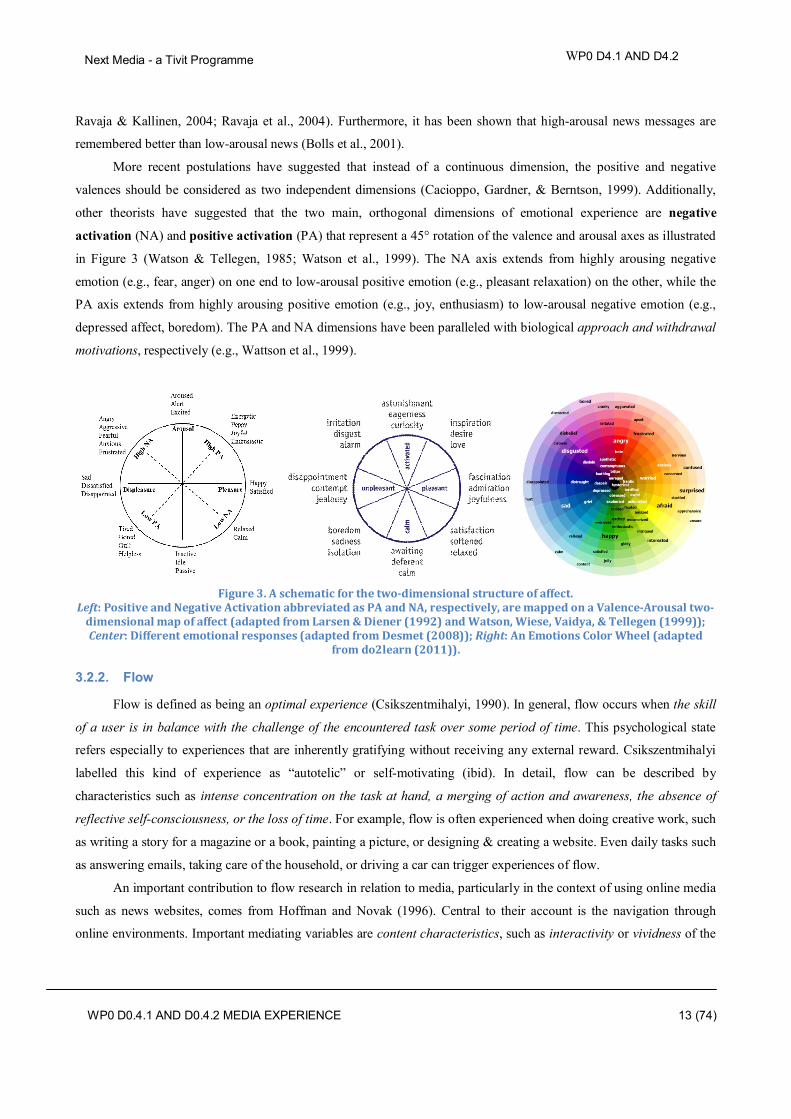
al., 2006; Plutchik, 2002). Dimensional emotion theories hold that subjective emotional experiences can be reduced into
a space spanned by a small number of emotional dimensions, such as valence and arousal (Posner et al., 2005; Russell,
1980). Figure 3 displays such two-dimensional space schematically.
The valence dimension reflects the degree to which an affective experience is negative (unpleasant) or positive
(pleasant), whereas the arousal dimension indicates the level of activation associated with the emotional experience
ranging from very calm or sleepy to very excited or energized. It has been suggested that together the valence and
arousal dimensions constitute the ‘core affect’; that is, an ever-present emotional state underlying one’s consciousness
(Russell, 2003). Several studies have clearly demonstrated that news messages presented as text, radio and video
messages evoke emotional responses that vary on the valence and arousal dimensions (Bolls et al., 2001; Ravaja 2004b;
Next Media - a Tivit Programme
WP0 D4.1 AND D4.2
WP0 D0.4.1 AND D0.4.2 MEDIA EXPERIENCE
13 (74)
Ravaja & Kallinen, 2004; Ravaja et al., 2004). Furthermore, it has been shown that high-arousal news messages are
remembered better than low-arousal news (Bolls et al., 2001).
More recent postulations have suggested that instead of a continuous dimension, the positive and negative
valences should be considered as two independent dimensions (Cacioppo, Gardner, & Berntson, 1999). Additionally,
other theorists have suggested that the two main, orthogonal dimensions of emotional experience are negative
activation (NA) and positive activation (PA) that represent a 45° rotation of the valence and arousal axes as illustrated
in Figure 3 (Watson & Tellegen, 1985; Watson et al., 1999). The NA axis extends from highly arousing negative
emotion (e.g., fear, anger) on one end to low-arousal positive emotion (e.g., pleasant relaxation) on the other, while the
PA axis extends from highly arousing positive emotion (e.g., joy, enthusiasm) to low-arousal negative emotion (e.g.,
depressed affect, boredom). The PA and NA dimensions have been paralleled with biological approach and withdrawal
motivations, respectively (e.g., Wattson et al., 1999).
Figure 3. A schematic for the two-dimensional structure of affect.
Left: Positive and Negative Activation abbreviated as PA and NA, respectively, are mapped on a Valence-Arousal two-dimensional map of affect (adapted from Larsen & Diener (1992) and Watson, Wiese, Vaidya, & Tellegen (1999)); Center: Different emotional responses (adapted from Desmet (2008)); Right: An Emotions Color Wheel (adapted
from do2learn (2011)).
3.2.2. Flow
Flow is defined as being an optimal experience (Csikszentmihalyi, 1990). In general, flow occurs when the skill
of a user is in balance with the challenge of the encountered task over some period of time. This psychological state
refers especially to experiences that are inherently gratifying without receiving any external reward. Csikszentmihalyi
labelled this kind of experience as “autotelic” or self-motivating (ibid). In detail, flow can be described by
characteristics such as intense concentration on the task at hand, a merging of action and awareness, the absence of
reflective self-consciousness, or the loss of time. For example, flow is often experienced when doing creative work, such
as writing a story for a magazine or a book, painting a picture, or designing & creating a website. Even daily tasks such
as answering emails, taking care of the household, or driving a car can trigger experiences of flow.
An important contribution to flow research in relation to media, particularly in the context of using online media
such as news websites, comes from Hoffman and Novak (1996). Central to their account is the navigation through
online environments. Important mediating variables are content characteristics, such as interactivity or vividness of the
Next Media - a Tivit Programme
WP0 D4.1 AND D4.2
WP0 D0.4.1 AND D0.4.2 MEDIA EXPERIENCE
14 (74)
medium, as well as process characteristics, such as motivation or utilitarian or hedonic benefits that contribute,
moderate, or condition the experience of involvement, focused attention, (tele-) presence, and, eventually, flow.
Flow has also been studied in relation to media enjoyment. Because experiences of flow are inherently gratifying
and enjoyable, Sherry (2004) argues that they may also occur when media users are in balance between the message
difficulty and their usage or interpretation skills. Message difficulty is strongly linked to the narrative structure or
writing style, for example. The classical structures, such as tragedy or comedy, are easily understood by the majority of
people. However, departures from their inherent characteristics, such as “the purposeful violation of conventions to
push the medium forward” (ibid, p. 334), increase the difficulty to understand the message. In order to understand a
message a media user must interpret it (see the sense-making process “interpretation” from Wright et al., (2003) and
McCarthy & Wright (2004)). However, the outcome of this process depends on the user’s skills, such as on formal
training in the interpretation of media content or on accumulated specialized knowledge. If the balance between the
difficulty of the message, on the one hand, and a user’s message interpretation skills, on the other hand, is not given,
then flow and thus enjoyable experiences of media content cannot emerge.
An empirical study showed that flow occurs both for task-oriented activities (i.e. when website users are in the
goal-mode) and for experiential or recreational activities (i.e. when website users are in action-mode) (Novak et al.,
2003). However, the task-oriented activities implying goal-achievement may facilitate flow experiences more likely
than explorative, experiential, or recreational activities.
3.2.3. Spatial presence
Quite obviously, media that successfully capture the attention of their users and evoke the feeling of
engagement, presence or immersion, are likely to become more popular. The concepts of engagement, presence and
immersion have been used in several research contexts, sometimes synonymously and sometimes with slightly
different connotations, without an agreed upon consensus for their external references. These concepts have received
interest particularly in the context of digital media such as computer games, virtual environments and social media.
Within these media uses, all of the mentioned concepts revolve around a common phenomenon: how engaged, present
or immersed in the media experience the media users are. These media also share a common denominator as they all
involve an artificially created, mediated, environment. Presence has been likened to the feeling of being personally and
physically present in such an environment; in a sense to the illusion that the mediated experience is not mediated (cf.
Ravaja et al., 2006). Lombard and Ditton (1997) have suggested three types of “transportation” into a mediated
environment: i) “You are there”, in which the user is transported to the environment, (ii) “It is here”, in which the
environment is transported to the user (for example a television program brings events and objects from an environment
into that of the user), and iii) “We are together”, in which two or more users are exported into a common space. The last
type of “transportation” is discussed in section 3.2.4 Social presence. Below, we discuss spatial presence and its related
concepts in more detail.
Immersion, according to a common definition, “is a metaphorical term derived from the physical experience of
being submerged in water” (Murray, 1997) and hence characterizes a deep involvement in a media experience. Brown
and Cairns (2004), for example, performed a number of interviews to investigate what computer game players
themselves mean when talking about immersion. Their results describe a progression of three stages of immersion with

Next Media - a Tivit Programme
WP0 D4.1 AND D4.2
WP0 D0.4.1 AND D0.4.2 MEDIA EXPERIENCE
15 (74)
increasing levels of involvement: engagement, engrossment and total immersion. Engagement is a prerequisite for the
other levels and refers to the lowest level of immersion necessary for the players to invest their time in playing.
Engrossment, the second level, describes a state where the players’ attention and emotions are directly affected by the
game. The emotional investment in the game urges players to keep playing and may even lead to emotional fatigue after
the playing is stopped. The final level, total immersion, refers to a temporary state of being cut off from external reality
so that the game was all that mattered.
If presence refers to the illusion of considering a mediated environment as a non-mediated one, digital media that
concentrate on providing realistic visual, audiovisual and multimodal stimulation would seem to have a knack over the
traditional media. Traditional media such as news magazines, radio and even television have a hard time competing
with the sense of realness provided by modern computer games, virtual reality environments and 3-D cinema. It is
nevertheless true that books showing black ink on white paper can be as engaging as computer games powered by the
latest graphics cards and even provide a strong sense of “transportation” into the book’s imaginary environment. Quite
clearly, these examples illustrate the importance of both spatial and psychological involvement in a mediated
environment, which should be kept separate in the context of different media. The existing measurement scales (see
section 4.2.2 Spatial presence questionnaires) in fact appear to do so.
3.2.4. Social presence
Social presence is a component of the so-called co-experience dimension of media experience (see Appendix).
Social presence is itself a multidimensional concept that involves the feeling of being together with other person(s) in a
real or virtual environment, as well as the possibilities and needs for communicating with the other person(s). This
construct can be measured using self-reported data that are gathered using for example the social presence inventory
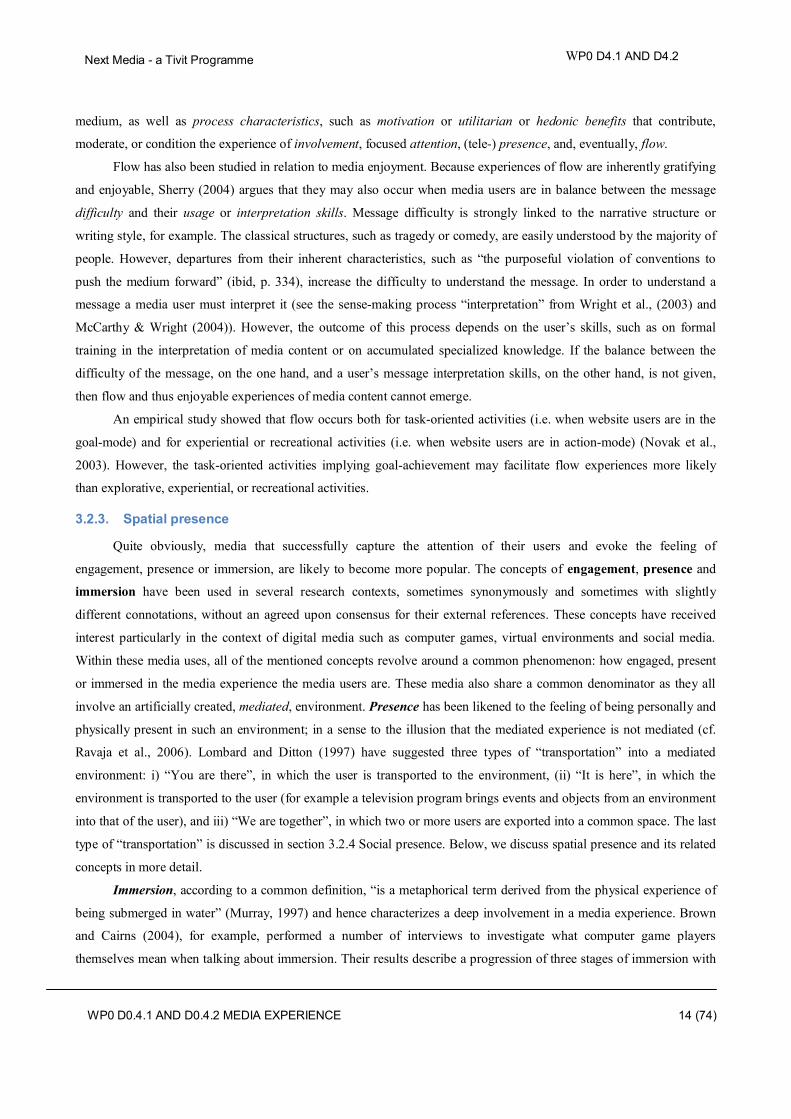
developed by Biocca et al. (2001) and Harms and Biocca (2004). In this questionnaire, the social presence is determined
by three dimensions, i) co-presence; ii) psychological involvement; and iii) behavioural engagement. First, a trivial
prerequisite for social presence is physical co-presence, i.e. that the observer is aware that he/she is not alone and
secluded. The requirement of physical co-presence is not sufficient for social presence; however, any more than being
in the same space with a person would suffice for meaningful social interaction. The second level of social presence
refers to psychological involvement with the other actor. This dimension includes, first, mutual understanding of the
communication between the actors, but also emotional empathy between them. That is, at this level, the actors are
capable of understanding each other’s emotions during the communication and also experience empathy so that their
emotions influence each other. Behavioural engagement, the third dimension, refers to the extent to which an actor’s
behaviour affects and is affected by the other actor’s behaviour. Figure 4 presents the theoretical dimensions of the
social presence construct.
Next Media - a Tivit Programme
WP0 D4.1 AND D4.2
WP0 D0.4.1 AND D0.4.2 MEDIA EXPERIENCE
16 (74)
Figure 4. Theoretical dimensions and factors of the Networked Minds Social Presence Inventory. Adapted from
Biocca, Harms & Gregg (2001).
There are also other research methods that can potentially be employed to study the degree of social presence,
for example, observation, psychophysiological measurements, interviews, and behavioral measurements by the means
of eye-tracking.
3.2.5. Sensory perception
Sensory perception dimensions (or sensory attributes) are the properties of media that we perceive through our
senses, such as colourfulness of pictures, gloss or roughness of paper. These properties are known to affect our overall
media experience in many ways, either strengthening or weakening the mental impressions that are desirable for a given
media product. Only a fraction of sensory information in real-life situations enters our conscious perception, but
nonetheless these lower-level perceptual attributes shape our higher-level psychological response to media products in
various ways, even if we are not aware of it. An important goal in sensory evaluation studies is to better understand and
ultimately control these perceptual effects in the development of media products and concepts.
In the following we present examples of typical sensory media attributes. The list is not meant to be exhaustive
but indicates the kind of attributes that are typically measured. Somewhat different sets of attributes are required for
describing the sensory perception in the context of different media types. It should also be noted that human perception
of the world is fundamentally multimodal, the information from different senses interacting with one another: what we
feel with our fingers or hear with our ears may affect what we see with our eyes, and vice versa.
Visual attributes
Most visual attributes apply to all kinds of visual media, and depend both on the properties of the media and the
processing of visual content. Further sensory attributes may be necessary in specific research tasks, for example when
dealing with moving images, stereoscopic 3D media, real 3D shapes and forms, or the effect of different textures in
surfaces or layout elements, for instance. Also the colour perception can be broken down to more detailed visual
dimensions. Together these lower-level visual attributes mould the higher-level experience of visuality.
Gloss refers to the perceived magnitude of ambient light that is specularly (as from a mirror) reflected from the
surface of a printed product. Flare is a similar attribute for self-luminous displays. While flare is mostly considered
Next Media - a Tivit Programme
WP0 D4.1 AND D4.2
WP0 D0.4.1 AND D0.4.2 MEDIA EXPERIENCE
17 (74)
to be an annoyance, gloss can be a desired attribute in printed products and can strongly affect the mental
impressions associated with the product.
Whiteness refers to the perceived similarity of an object to a “perfect” (preferred or standard reference) white.
Whiteness is associated with colour stimuli that are categorized as white, but whitish surfaces such as paper may
show a degree of departure from the perfect white. Departures along specific perceptual hue axes, such as reddish-
greenish, may be further specified.
Contrast refers to the magnitude of perceived tonal differences of a view, from the darkest black to the lightest
white. Here a “view” may refer to a single image, a printed page, a whole magazine, or a self-luminous display.
Vividness refers to the perceived overall colourfulness or chromatic contrast of a view.
Sharpness refers to the perceived clarity of edges and small details in view.
Readability: The perceived ease of reading text on a given media product.
Artifactual attributes refer to a general class of unwanted visual attributes such as perceived noise in images, or
unevenness of colour surfaces.
Tactile surface, structure, and handling attributes
These attributes are typically used in describing those properties of printed products that are felt with the sense
of touch, some of them being also applicable to other types of media surfaces.
Perceived Roughness of the surface, ranging from smooth to rough.
Slipperiness refers to the perceived lack of friction when sliding one’s finger on a surface.
Stickiness refers to be perceived tendency of paper (or other surface) to stick to one’s fingers.
Rigidity describes the perceived structure of paper, ranging from flexible to rigid.
Stiffness refers to perceived floppiness or stiffness of the paper when being handled.
The perceived durability and page turnability are also important attributes for print media.
Auditory and other sensory attributes
In print media the sound of handling a book, magazine, or newspaper can be described by attributes such as
sound intensity (quiet-loud) or sound quality (soft-hard). A wider range of applicable attributes arises when describing
the auditory perception of the broadcast media and on digital platforms.
The sense of smell (interacting with taste) is known to often evoke strong responses and to affect our emotions,
and to strengthen and trigger memories. This has been taken advantage of in the print media by the use of scented inks
and varnishes.
3.3. Appraisal dimensions
Appraisal dimensions are those that characterize the meaning of media to its user. These dimensions are likely to
influence the user’s engagement with the media and its emotional evaluation. Cognitive appraisal theories of emotion
describe emotion as a process where the emotional experience of an event is based on its (conscious and unconscious)
appraisal in terms of, e.g., self-relevance, familiarity, coping potential (Scherer, 1999). For example media items that
Next Media - a Tivit Programme
WP0 D4.1 AND D4.2
WP0 D0.4.1 AND D0.4.2 MEDIA EXPERIENCE
18 (74)
are considered more interesting are likely to be more self-relevant and to evoke more positive emotional reactions in
their users. Below, we suggest eight dimensions for evaluating the properties of media. These dimensions can be
measured via media users’ self-ratings for example on a 5-point Likert scale ranging from response options “Strongly
disagree” to “Strongly agree”. Additionally, we present brand experience with an associated self-rating scale.
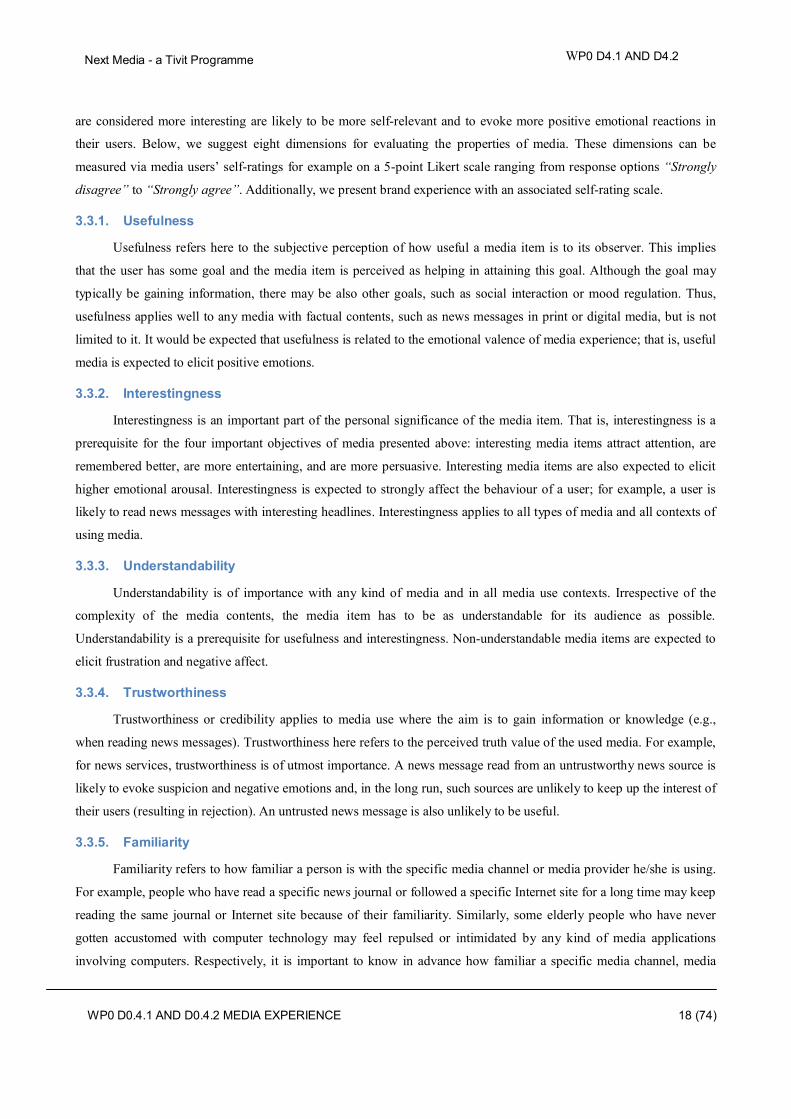
3.3.1. Usefulness
Usefulness refers here to the subjective perception of how useful a media item is to its observer. This implies
that the user has some goal and the media item is perceived as helping in attaining this goal. Although the goal may
typically be gaining information, there may be also other goals, such as social interaction or mood regulation. Thus,
usefulness applies well to any media with factual contents, such as news messages in print or digital media, but is not
limited to it. It would be expected that usefulness is related to the emotional valence of media experience; that is, useful
media is expected to elicit positive emotions.
3.3.2. Interestingness
Interestingness is an important part of the personal significance of the media item. That is, interestingness is a
prerequisite for the four important objectives of media presented above: interesting media items attract attention, are
remembered better, are more entertaining, and are more persuasive. Interesting media items are also expected to elicit
higher emotional arousal. Interestingness is expected to strongly affect the behaviour of a user; for example, a user is
likely to read news messages with interesting headlines. Interestingness applies to all types of media and all contexts of
using media.
3.3.3. Understandability
Understandability is of importance with any kind of media and in all media use contexts. Irrespective of the
complexity of the media contents, the media item has to be as understandable for its audience as possible.
Understandability is a prerequisite for usefulness and interestingness. Non-understandable media items are expected to
elicit frustration and negative affect.
3.3.4. Trustworthiness
Trustworthiness or credibility applies to media use where the aim is to gain information or knowledge (e.g.,
when reading news messages). Trustworthiness here refers to the perceived truth value of the used media. For example,
for news services, trustworthiness is of utmost importance. A news message read from an untrustworthy news source is
likely to evoke suspicion and negative emotions and, in the long run, such sources are unlikely to keep up the interest of
their users (resulting in rejection). An untrusted news message is also unlikely to be useful.
3.3.5. Familiarity
Familiarity refers to how familiar a person is with the specific media channel or media provider he/she is using.
For example, people who have read a specific news journal or followed a specific Internet site for a long time may keep
reading the same journal or Internet site because of their familiarity. Similarly, some elderly people who have never
gotten accustomed with computer technology may feel repulsed or intimidated by any kind of media applications
involving computers. Respectively, it is important to know in advance how familiar a specific media channel, media

Next Media - a Tivit Programme
WP0 D4.1 AND D4.2
WP0 D0.4.1 AND D0.4.2 MEDIA EXPERIENCE
19 (74)
provider or type of media item is to the person experiencing media. Familiarity is likely to increase perceived
trustworthiness, may increase understandability and is closely associated with brand. Familiarity applies to all types of
media but it can be considered at several levels (that is, in different contexts): familiarity with the media channel itself
(e.g., computers), familiarity with a specific media service (news magazine or Internet news provider) and familiarity
with a type of media item or media activity (reading books, kinds of journals, computer game genres etc.).
3.3.6. Unexpectedness
Entertainment media in particular requires that the media item contains unexpected elements in order to maintain
the interest of the observer, that is, unexpectedness is related to interestingness and positive emotional evaluation of the
item. In other contexts unexpectedness may be considered annoying, and it may hinder understandability and usefulness
of the media item. Unexpectedness, when understood in a positive sense, applies best to all entertainment media. That
is, unexpectedness is an important part of amusement so that the media users continue to keep up their interest.
3.3.7. Brand experience
Brand experience is conceptualized as “sensations, feelings, cognitions, and behavioural responses evoked by
brand-related stimuli that are part of a brand’s design and identity, packaging, communications, and environments”
(Brakus, Schmitt & Zarantonello, 2009). Brand experience is expected to contribute to the overall emotional responses
to a given media. It is also expected to affect the behaviour of the user (adoption vs. rejection).
3.3.8. Price/value
Price pays an important role in decision to form a sustainable readership relation with media products and their
content. Consumers are used to paying for digital services like broadband, mobile phones, TV channels and so on. But
as the perceived value exists in consumer’s head and opinions the pricing strategy is not self-evident and should not be
based on old print-media pricing systems.
Research has shown that people are willing to pay around 100 dollars for e-ink eReaders and 200-300 for colour
tablets (on a mass scale). For e-books the price has settled between 10-120 dollars. Consumers are not willing to pay for
basic news services as there are so many news providers for free. As magazines and newspaper circulation is in Finland
based on yearly subscriptions people are not used to pay in the web either for singular copies or news articles. Some
kind of packaging and value added services are possible scenarios for the future. But the news should not be over-
emphasized; they are not the main focus of the general public’s media consumption. Therefore the pricing methods
should be carefully studied and piloted before implementation.
Media companies should take into account other methods for revenue creation besides charging for content.
Communities around consumption of travel, wines, books, gardening etc. can create extra revenue, as well as organizing
events, useful interactive advisory services etc. can also generate money as the consumers trust the media brand and its
recommendations.
3.3.9. Playfulness (entertainingness)
Playfulness is a powerful motivator for behavior, as is exemplified by the recent “Digitalkoot” project organized
by The National Library of Finland and Microtask company (URL: http://www.digitalkoot.fi/; accessed 18. April 2011).

Next Media - a Tivit Programme
WP0 D4.1 AND D4.2
WP0 D0.4.1 AND D0.4.2 MEDIA EXPERIENCE
20 (74)
The goal of this project is to recruit people to help in digitalizing old Finnish newspapers. Most of the newspapers have
already been digitized using computerized text recognition; however, the recognition algorithm is not able to identify all
words and it also makes some mistakes. To correctly recognize such words, Digitalkoot have created games where
players proceed by writing words where the computer failed or by identifying words the computer has misread (see
Figure 5). According to the Digitalkoot webpage, Internet players have at the time devoted more than 170,000 minutes
to these games.
Playfulness appears to be a concept whose meaning everyone knows, but which is very difficult to define.
Existing research literature describes several characteristics of playfulness. However, there are two distinct perspectives
of looking at this concept: 1) as a feature of the users; 2) as a feature of the system/product. When referring to people,
playfulness is characterized by cognitive, physical, and social spontaneity; manifest joy and a sense of humour in
children (Barnett, 1990); and gregariousness, uninhibitedness, comedic expression, and dynamicity in adults (Barnett,
2007). When referring to a (media) product, in order to be considered playful, this should enable a playing activity and
elicit the aforementioned mental states in the user.
Figure 5. Mole Hunt game created in Digitalkoot where the aim is to identify words that were misread by the
computer. Image copied from URL: http://www.digitalkoot.fi/.
Most of the existing studies seem to consider playfulness as a trait of the user rather than an activity (Barnett,
2007; Glynn & Webster, 1992). Woszczynski and co-workers (2002) have suggested that playfulness as an activity
corresponds to the behaviorally observable component of flow experience (Woszczynski et al., 2002); however, they do
not define what these behavioral components are. We think that the view of playfulness as a trait of the user holds only
partially true. That is, a more fruitful approach may be to view playfulness as a state characterized by those behaviors
and mental processes listed by Barnett (1990, 2007; see above) and elicited by the characteristics of a media
product/service in interaction with the traits of the user. The question then arises as to which are the characteristics of a
media product or a service that elicit playfulness. The concept of playfulness seems to apply best to media channels and
media artefacts that are designed for entertainment. In particular, digital computer games have become one of the most
popular and socially acceptable ways to experience and express playfulness among adults. For example popular party
games (e.g., Singstar, Guitar Hero, Kinect and Move games) obviously fulfil the characteristics of playfulness in adults
(Barnett, 2007): they involve gregariousness (sociality), uninhibitedness, comedy and dynamicity. However, even
characteristics of a user interface (e.g., in iPhone) may potentially elicit more subtle forms of playfulness.
Next Media - a Tivit Programme
WP0 D4.1 AND D4.2
WP0 D0.4.1 AND D0.4.2 MEDIA EXPERIENCE
21 (74)
3.4. Interaction dimensions
In the context media experience research the term interaction refers to the process of using a media product in a
given context for particular reasons. Given this perspective, interaction has consequently a considerable impact on how
a media product is experienced by the user. Interaction is commonly understood as a iterative process that starts with a
person’s goal. A phase follows in which the person creates a plan on how to achieve the goal. A translation into
concrete behavioral sequences follow that are then executed against the environment. The sequences reflect the way a
person believes to achieve the goal. Then the person perceives the feedback from the environment, if any, interprets it
and evaluates whether the changes in the environment reflect the expected change correctly. If not the action sequence
will be modified and adapted so that the expected outcome will be achieved after later execution. The person repeats the
cycle until the overall goal is achieved.
From an experience perspective, two of the most important components determining it are the usability of a
product and its interactivity.
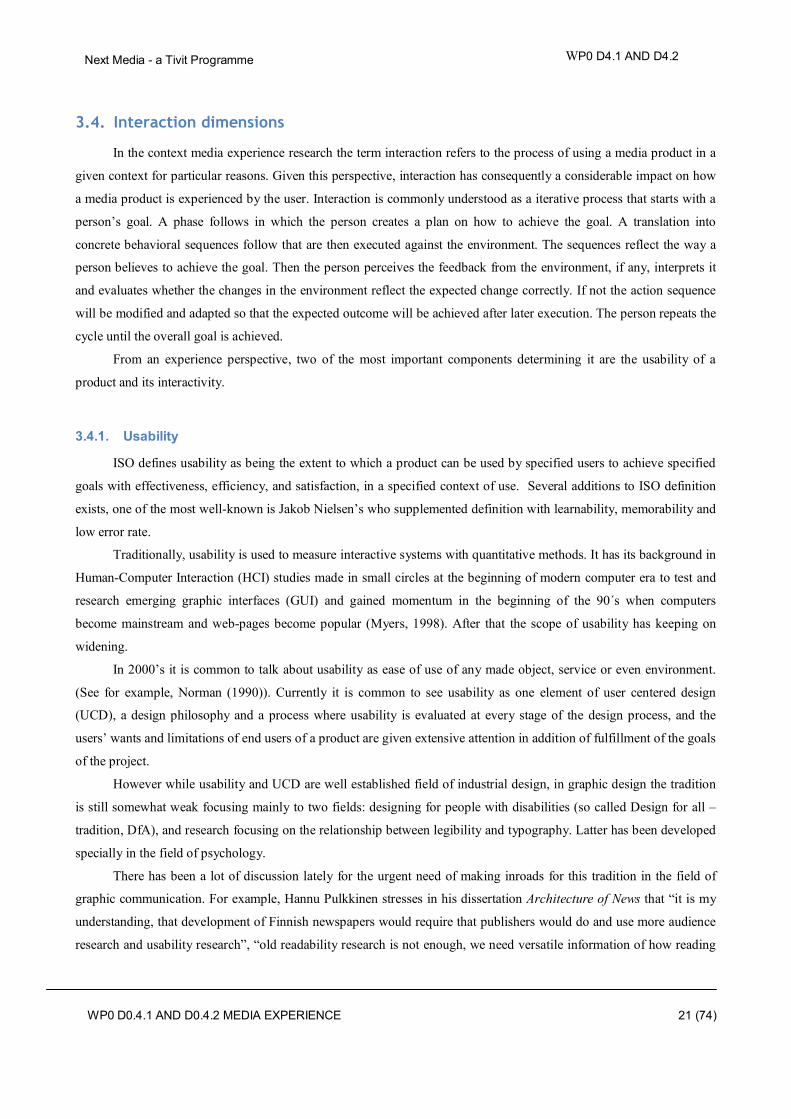
3.4.1. Usability
ISO defines usability as being the extent to which a product can be used by specified users to achieve specified
goals with effectiveness, efficiency, and satisfaction, in a specified context of use. Several additions to ISO definition
exists, one of the most well-known is Jakob Nielsen’s who supplemented definition with learnability, memorability and
low error rate.
Traditionally, usability is used to measure interactive systems with quantitative methods. It has its background in
Human-Computer Interaction (HCI) studies made in small circles at the beginning of modern computer era to test and
research emerging graphic interfaces (GUI) and gained momentum in the beginning of the 90´s when computers
become mainstream and web-pages become popular (Myers, 1998). After that the scope of usability has keeping on
widening.
In 2000’s it is common to talk about usability as ease of use of any made object, service or even environment.
(See for example, Norman (1990)). Currently it is common to see usability as one element of user centered design
(UCD), a design philosophy and a process where usability is evaluated at every stage of the design process, and the
users’ wants and limitations of end users of a product are given extensive attention in addition of fulfillment of the goals
of the project.
However while usability and UCD are well established field of industrial design, in graphic design the tradition
is still somewhat weak focusing mainly to two fields: designing for people with disabilities (so called Design for all –
tradition, DfA), and research focusing on the relationship between legibility and typography. Latter has been developed
specially in the field of psychology.
There has been a lot of discussion lately for the urgent need of making inroads for this tradition in the field of
graphic communication. For example, Hannu Pulkkinen stresses in his dissertation Architecture of News that “it is my
understanding, that development of Finnish newspapers would require that publishers would do and use more audience
research and usability research”, “old readability research is not enough, we need versatile information of how reading

Next Media - a Tivit Programme
WP0 D4.1 AND D4.2
WP0 D0.4.1 AND D0.4.2 MEDIA EXPERIENCE
22 (74)
is done (Pulkkinen, 2007). Other veteran of newspaper design, Carl Henning, has also brought this subject up
(Lamberg, 2005).
The problem is that traditional methods like heuristics (see for example, Shneiderman (2005)) are geared for
interaction design and are not directly applicable to print. The other caveat is that currently visual designers receive only
small amount - if any- expertise in the field of usability. Educational needs have been underlined for example by Steven
Heller (Heller, 2006) and Jorge Frascara (Frascara, 1997). Academically educated graphic designer should be able to
fulfill the old roles of commercial artist and author, he should be able to advance designs with quantitave methods and
point out why certain solutions are appropriate to certain needs (ibid.)
Importance of usability and UCD is still likely to increase due to the growing amount of elderly people and the
new transition of print to digital media via eReading devices and tablets. More characteristics of usability of eReading
devices and products are presented in Appendix, section 7.4.1.
Methods of measuring usability are described in section 4.5 and also in the Appendix. New possibilities for
gathering the user data are opening through the emergence of tablets, for example it will be possible in future to
measure how much time a user spends in particular section with automatic logging measurements.
3.4.2. Interactivity
The concept of interactivity of a product can refer to multiple meanings that are still under debate in science.
However, three meanings can be distinguished. First, interactivity refers to the degree of relatedness of exchanged
messages in the interaction with an interactive artifact or in the communication with another person (Rafaeli, 1988).
This relatedness reflects the variability of the dynamics of interaction and communication (Kiousis, 2002) and, besides
the number exchanged messages, is an important indicator of the “hotness” of a discussed topic in the comment section
of an online newspaper, for example. The second meaning is influenced by the technological capabilities a medium
itself. Interactivity is characterized by the speed, range, and mapping capabilities of a medium that influence the “extent
to which users can participate in modifying the form and content of a mediated environment in real-time” (Steuer, 1992,
p. 84). The third conceptualization comes from researches addressing the perceptual side of experiencing interactivity of
a medium or artifact. From this perspective interactivity is described as a psychological state and linked to self-efficacy
(Newhagen, Cordes, & Levy, 1995). That is, users evaluate the interactivity of a medium based on the quality and
quantity of feedback they get from the receiver after sending a message. But also direction of communication, time
flexibility, sense of place, level of control, responsiveness, and perceived purpose of communication play a role
(Downes and McMillan, 2000).
In the context of Media Experience we consider interactivity to refer to the set of perceived and accessible
choice alternatives that allow a user to actually interact with the product, i.e. decide the next step in using the product.
For media products these choice alternatives may refer to a number of visible affordances, such as pages, buttons, menu
items, checkboxes, or any other interactable user interface components. In web environments, such as on an online news
website, for example, links to different news sections, i.e. politics, economics, sports, etc., represent such a set of choice
options. In a magazine application on a tablet computer choice options may refer to the way a reader can navigate
Next Media - a Tivit Programme
WP0 D4.1 AND D4.2
WP0 D0.4.1 AND D0.4.2 MEDIA EXPERIENCE
23 (74)
through the magazine, how s/he can access additional content within an article or in which ways new or other issues of
the magazine can be obtained.
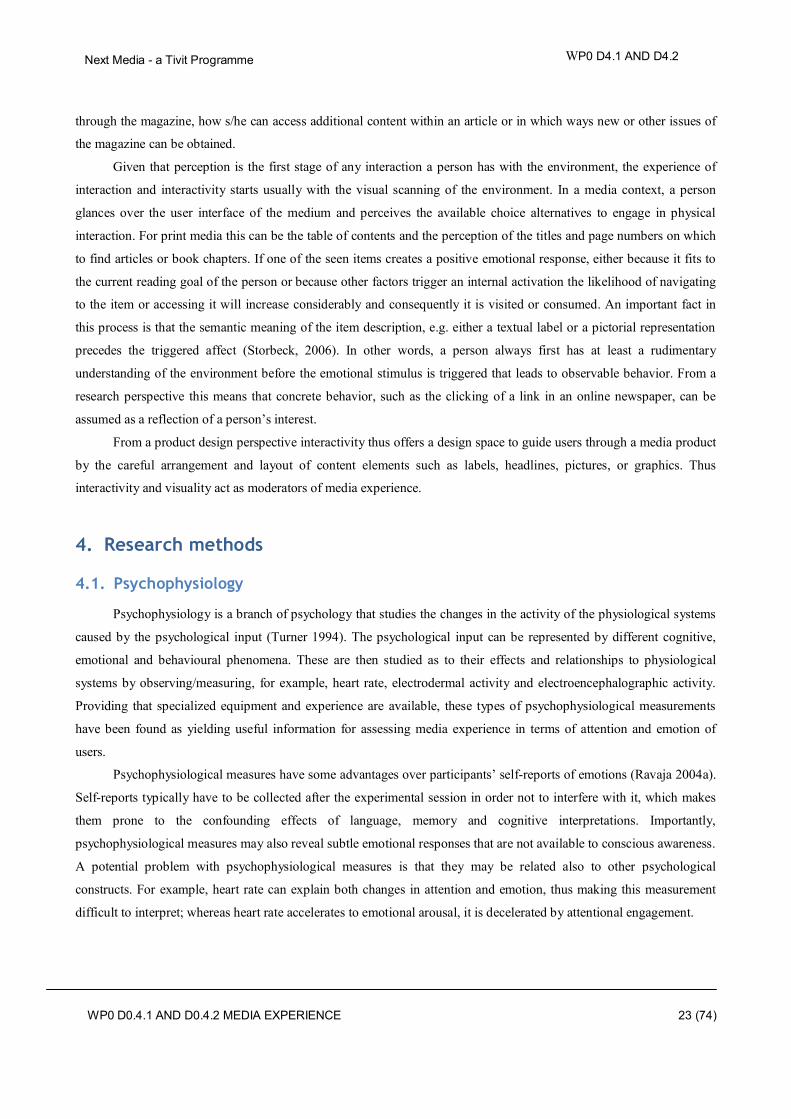
Given that perception is the first stage of any interaction a person has with the environment, the experience of
interaction and interactivity starts usually with the visual scanning of the environment. In a media context, a person
glances over the user interface of the medium and perceives the available choice alternatives to engage in physical
interaction. For print media this can be the table of contents and the perception of the titles and page numbers on which
to find articles or book chapters. If one of the seen items creates a positive emotional response, either because it fits to
the current reading goal of the person or because other factors trigger an internal activation the likelihood of navigating
to the item or accessing it will increase considerably and consequently it is visited or consumed. An important fact in
this process is that the semantic meaning of the item description, e.g. either a textual label or a pictorial representation
precedes the triggered affect (Storbeck, 2006). In other words, a person always first has at least a rudimentary
understanding of the environment before the emotional stimulus is triggered that leads to observable behavior. From a
research perspective this means that concrete behavior, such as the clicking of a link in an online newspaper, can be
assumed as a reflection of a person’s interest.
From a product design perspective interactivity thus offers a design space to guide users through a media product
by the careful arrangement and layout of content elements such as labels, headlines, pictures, or graphics. Thus
interactivity and visuality act as moderators of media experience.
4. Research methods
4.1. Psychophysiology
Psychophysiology is a branch of psychology that studies the changes in the activity of the physiological systems
caused by the psychological input (Turner 1994). The psychological input can be represented by different cognitive,
emotional and behavioural phenomena. These are then studied as to their effects and relationships to physiological
systems by observing/measuring, for example, heart rate, electrodermal activity and electroencephalographic activity.
Providing that specialized equipment and experience are available, these types of psychophysiological measurements
have been found as yielding useful information for assessing media experience in terms of attention and emotion of
users.
Psychophysiological measures have some advantages over participants’ self-reports of emotions (Ravaja 2004a).
Self-reports typically have to be collected after the experimental session in order not to interfere with it, which makes
them prone to the confounding effects of language, memory and cognitive interpretations. Importantly,
psychophysiological measures may also reveal subtle emotional responses that are not available to conscious awareness.
A potential problem with psychophysiological measures is that they may be related also to other psychological
constructs. For example, heart rate can explain both changes in attention and emotion, thus making this measurement
difficult to interpret; whereas heart rate accelerates to emotional arousal, it is decelerated by attentional engagement.

Next Media - a Tivit Programme
WP0 D4.1 AND D4.2
WP0 D0.4.1 AND D0.4.2 MEDIA EXPERIENCE
24 (74)
4.1.1. Facial electromyography (EMG)
Facial EMG is a noninvasive method, where the facial muscle activation level is measured by attaching
electrodes on specific facial locations, and which is used frequently as a psychophysiological index of positive and
negative valences (P. Lang et al., 1993). There are three muscles whose responses are usually recorded using
electromyography: zygomaticus major (lip corner raiser muscle), corrugator supercilii (brow furrower muscle), and the
outer region of the orbicularis oculi (cheek raiser muscle).
4.1.2. Electroencephalography (EEG)
EEG is based on the recording of the electrical activity of the brain with electrodes placed in a special cap (2-256
electrodes). The EEG data are typically analyzed using spectral analysis. One of the most important indices derived
from EEG data is brain prefrontal asymmetry that has been used to index emotional valence and motivational
direction. Accumulated research suggests that relatively greater left frontal cortical activation is associated with
positive activation (PA) and approach motivation, whereas relatively greater right frontal activation is associated with
negative activation (NA) and withdrawal motivation.
In addition, alpha activity has been found to correlate with attention, emotional arousal, interest and recall
(Simons et al. 2003). Alpha wave power is defined as the amplitude of brainwaves in the 8-13 Hz frequency band.
The EEG measurements have also been used in measuring social presence by assessing the synchronicity of
biosignals of two persons/users while engaging in a decision making game (Basiloni et al., 2007). That study stimulates
further research in this area to measure social presence of users engaged in media use. Moreover, simpler biosignal
recordings, such as skin conductance (see below for EDA), facial electromyography (facial EMG) and heartbeat
intervals (see below) could be evaluated as to their validity to measure social presence in media use.
4.1.3. Electrodermal activity (EDA)
EDA measurement is commonly known as skin conductance and it measures changes in the electrical
conductance of the skin caused by the level of sweat in the eccrine sweat glands. EDA is frequently monitored to
measure the activation of the sympathetic nervous system (Ravaja, 2004a). Consequently, EDA is an excellent index for
the physiological component of arousal, and it has been shown to correlate with subjective ratings of arousal (P. Lang
et al., 1993). Specific measures based on EDA can index the occurrence of involuntary attention (see Ravaja, 2004a).
In contemporary electrodermal research, EDA is usually measured with a constant voltage bridge. For skin
conductance measurement, specific electrodes are placed on the palmar side of the second phalanx of the first and
second fingers of the nonpreferred hand although other placements are also possible.
4.1.4. Heart rate (HR) and related measures
Heart rate refers to the number of heart beats in a minute (Ravaja, 2004a). HR is influenced by both sympathetic
and parasympathetic arousal. In order to measure the heartbeats, one can measure the electrical potentials generated by
the heart during each cardiac cycle using electrocardiography (ECG). In psychophysiological studies, only the reliable
identification of the R peaks on the ECG is usually required which indicates the time when the left ventricle contracts
and pump the blood out to the body. The time between R peaks represents the interbeat interval (IBI).
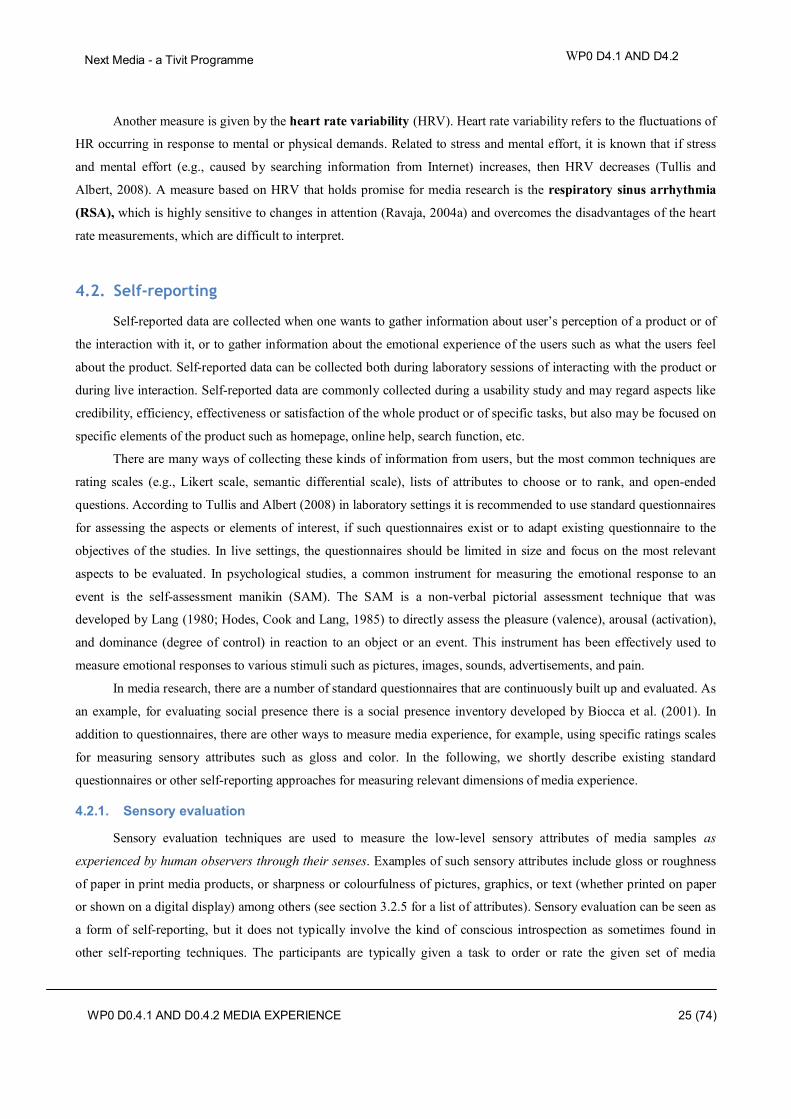
Next Media - a Tivit Programme
WP0 D4.1 AND D4.2
WP0 D0.4.1 AND D0.4.2 MEDIA EXPERIENCE
25 (74)
Another measure is given by the heart rate variability (HRV). Heart rate variability refers to the fluctuations of
HR occurring in response to mental or physical demands. Related to stress and mental effort, it is known that if stress
and mental effort (e.g., caused by searching information from Internet) increases, then HRV decreases (Tullis and
Albert, 2008). A measure based on HRV that holds promise for media research is the respiratory sinus arrhythmia
(RSA), which is highly sensitive to changes in attention (Ravaja, 2004a) and overcomes the disadvantages of the heart
rate measurements, which are difficult to interpret.
4.2. Self-reporting
Self-reported data are collected when one wants to gather information about user’s perception of a product or of
the interaction with it, or to gather information about the emotional experience of the users such as what the users feel
about the product. Self-reported data can be collected both during laboratory sessions of interacting with the product or
during live interaction. Self-reported data are commonly collected during a usability study and may regard aspects like
credibility, efficiency, effectiveness or satisfaction of the whole product or of specific tasks, but also may be focused on
specific elements of the product such as homepage, online help, search function, etc.
There are many ways of collecting these kinds of information from users, but the most common techniques are
rating scales (e.g., Likert scale, semantic differential scale), lists of attributes to choose or to rank, and open-ended
questions. According to Tullis and Albert (2008) in laboratory settings it is recommended to use standard questionnaires
for assessing the aspects or elements of interest, if such questionnaires exist or to adapt existing questionnaire to the
objectives of the studies. In live settings, the questionnaires should be limited in size and focus on the most relevant
aspects to be evaluated. In psychological studies, a common instrument for measuring the emotional response to an
event is the self-assessment manikin (SAM). The SAM is a non-verbal pictorial assessment technique that was
developed by Lang (1980; Hodes, Cook and Lang, 1985) to directly assess the pleasure (valence), arousal (activation),
and dominance (degree of control) in reaction to an object or an event. This instrument has been effectively used to
measure emotional responses to various stimuli such as pictures, images, sounds, advertisements, and pain.
In media research, there are a number of standard questionnaires that are continuously built up and evaluated. As
an example, for evaluating social presence there is a social presence inventory developed by Biocca et al. (2001). In
addition to questionnaires, there are other ways to measure media experience, for example, using specific ratings scales
for measuring sensory attributes such as gloss and color. In the following, we shortly describe existing standard
questionnaires or other self-reporting approaches for measuring relevant dimensions of media experience.
4.2.1. Sensory evaluation
Sensory evaluation techniques are used to measure the low-level sensory attributes of media samples as
experienced by human observers through their senses. Examples of such sensory attributes include gloss or roughness
of paper in print media products, or sharpness or colourfulness of pictures, graphics, or text (whether printed on paper
or shown on a digital display) among others (see section 3.2.5 for a list of attributes). Sensory evaluation can be seen as
a form of self-reporting, but it does not typically involve the kind of conscious introspection as sometimes found in
other self-reporting techniques. The participants are typically given a task to order or rate the given set of media

Next Media - a Tivit Programme
WP0 D4.1 AND D4.2
WP0 D0.4.1 AND D0.4.2 MEDIA EXPERIENCE
26 (74)
samples according to the perceived magnitude of the given sensory attribute, and a perceptual scale for the media
samples is calculated from the raw data from multiple participants. When conducting a task in sensory evaluation
experiment, the participant effectively compares certain aspects (defined by the sensory attribute being evaluated) of the
internal experiences evoked by different external stimuli (the media samples being evaluated).
As an example, a sensory evaluation study could be carried out to study the perceived sharpness of pictures. For
instance, the variation in sharpness could be caused by different properties of various paper grades, printing or display
technologies, or numerous variables in media production processes, starting from photography.
A number of different experimental techniques can be used in sensory evaluation, the designer of the
experimental setup choosing the optimal one based on factors such as the number and type of media samples, the range
of attribute levels present in the sample set (from just noticeable differences to differences of large perceptual
magnitudes), the available resources, and the desired mathematical descriptive power of the resulting perceptual scale
(whether it is enough to simply have the samples roughly ordered according to a given attribute, or if accurate
indication the relative magnitudes of perceived differences between the samples are needed) .
Common techniques include direct interval scaling by using a physical ruler (for example, asking the observers
to place the sample with the picture of highest perceived sharpness on one end of the scale, the least sharp sample on the
other end of the scale, and the others between them so that the distances on the scale correspond to perceived
differences in sharpness), or indirect interval scaling techniques such as rank ordering of the samples according to the
magnitude of the given attribute (from the least sharp sample through to the sharpest sample) or paired comparison
(repeatedly choosing the sharpest sample of the pair from the samples presented in pairwise manner). All three
experimental techniques, when combined with appropriate data analysis methods, yield interval scales on which
numerical differences correspond to perceptual differences between the samples.
Use of trained sensory evaluation panels (such as those trained to efficiently and consistently evaluate and report
differences in certain sensory attributes between different paper grades) allows sensory evaluation studies to be carried
out efficiently, while a larger number of observers and additional time dedicated to introducing the observers to the
evaluation task is needed when using untrained consumers. Nonetheless, low-level sensory perception is considered to
be relatively similar across different observers (apart from those with abnormal sensory physiologies, such as color-
blind individuals) and thus the sensory scales of media products resulting from sensory evaluation studies are expected
to be independent of the group of observers participating in the experiment, although less random variation is expected
with trained panels than with untrained observers, all other factors being equal.
When multiple sensory attributes of different media product samples have been measured, profiles comprised of
values of different sensory attributes can be used to describe and compare the sensory experiences evoked by different
samples. For example, Figure 6 compares the sensory profiles of three different print media products.
Further, we have used similar evaluation techniques to measure aspects of higher perceptual level, such as the
overall pleasantness of a media product or perceived harmony of layout. Indeed, a goal of a sensory evaluation study
can be to find out how low-level sensory attributes contribute to such higher-level perceptions. The experience map
shown in the Appendix provides an example of how the relationships between different products and their attributes can
be visualized.
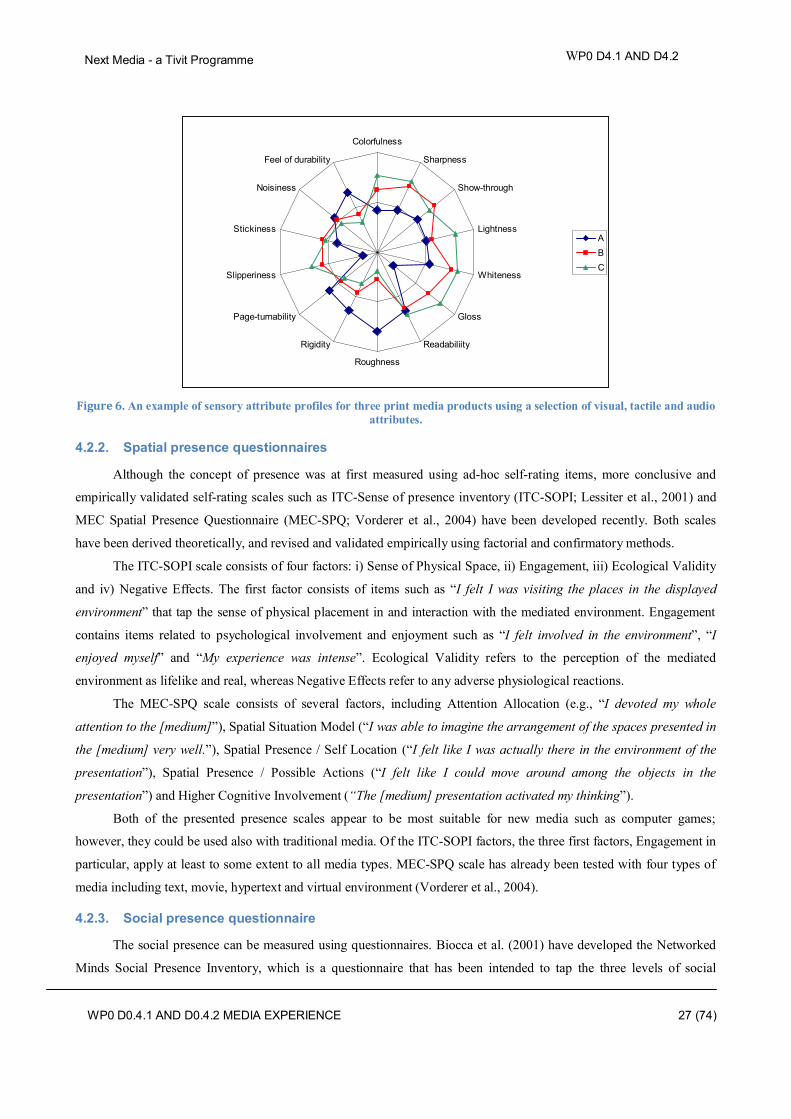
Next Media - a Tivit Programme
WP0 D4.1 AND D4.2
WP0 D0.4.1 AND D0.4.2 MEDIA EXPERIENCE
27 (74)
Figure 6. An example of sensory attribute profiles for three print media products using a selection of visual, tactile and audio
attributes.
4.2.2. Spatial presence questionnaires
Although the concept of presence was at first measured using ad-hoc self-rating items, more conclusive and
empirically validated self-rating scales such as ITC-Sense of presence inventory (ITC-SOPI; Lessiter et al., 2001) and
MEC Spatial Presence Questionnaire (MEC-SPQ; Vorderer et al., 2004) have been developed recently. Both scales
have been derived theoretically, and revised and validated empirically using factorial and confirmatory methods.
The ITC-SOPI scale consists of four factors: i) Sense of Physical Space, ii) Engagement, iii) Ecological Validity
and iv) Negative Effects. The first factor consists of items such as “I felt I was visiting the places in the displayed
environment” that tap the sense of physical placement in and interaction with the mediated environment. Engagement
contains items related to psychological involvement and enjoyment such as “I felt involved in the environment”, “I
enjoyed myself” and “My experience was intense”. Ecological Validity refers to the perception of the mediated
environment as lifelike and real, whereas Negative Effects refer to any adverse physiological reactions.
The MEC-SPQ scale consists of several factors, including Attention Allocation (e.g., “I devoted my whole
attention to the [medium]”), Spatial Situation Model (“I was able to imagine the arrangement of the spaces presented in
the [medium] very well.”), Spatial Presence / Self Location (“I felt like I was actually there in the environment of the
presentation”), Spatial Presence / Possible Actions (“I felt like I could move around among the objects in the
presentation”) and Higher Cognitive Involvement (“The [medium] presentation activated my thinking”).
Both of the presented presence scales appear to be most suitable for new media such as computer games;
however, they could be used also with traditional media. Of the ITC-SOPI factors, the three first factors, Engagement in
particular, apply at least to some extent to all media types. MEC-SPQ scale has already been tested with four types of
media including text, movie, hypertext and virtual environment (Vorderer et al., 2004).
4.2.3. Social presence questionnaire
The social presence can be measured using questionnaires. Biocca et al. (2001) have developed the Networked
Minds Social Presence Inventory, which is a questionnaire that has been intended to tap the three levels of social
Colorfulness
Sharpness
Show-through
Lightness
Whiteness
Gloss
Readabiliity
Roughness
Rigidity
Page-turnability
Slipperiness
Stickiness
Noisiness
Feel of durability
ABC
Next Media - a Tivit Programme
WP0 D4.1 AND D4.2
WP0 D0.4.1 AND D0.4.2 MEDIA EXPERIENCE
28 (74)
presence described in section 3.2.4. The self-rating items in the scale have been selected from an initial set of questions,
and the validity of the resulting factors (Figure 4) has been confirmed via factor analytic methods. Different types of
media channels have been used when validating the scale.
4.2.4. Flow questionnaires
Several scales have been derived for measuring flow (e.g., Novak & Hoffman, 1997; Poels et al. 2006). In a self-
report scale developed for measuring various components of gaming experience (Poels et al., 2006), the flow
component is operationalized as a sum of the following self-report items that are rated on a 5-step scale: “I was fully
occupied with the game”, “I forgot everything around me”, “I lost track of time”, “I was deeply concentrated in the
game” and “I lost connection with the outside world”. As can be seen from these items, flow shares similar
characteristics as spatial presence (see section 3.2.3 and section 4.2.2).
4.2.5. Emotion ratings
Self-ratings are the most commonly used measures for emotional dimensions. For example, valence and arousal
dimensions are routinely measured via graphical or textual Likert scales. In a commonly used measurement scheme
(Lang, 1994), the valence scale consists of nine graphic depictions of human faces ranging from sad to happy
expression, whereas arousal scale contains nine graphical characters varying from a calm state to a state of high visceral
agitation. Positive and negative activation (PA and NA) are often measured as sum variables of self-rated items such as
joyful, enthusiastic and peppy (high PA) or distressed, anxious and fearful (high NA) (e.g., Ravaja 2004b; Watson et al.,
1999).
4.2.6. Playfulness scales
Playfulness seems to be an elusive concept to study experimentally. In addition to the lack of clear theoretical
specification and existing research methodology, playfulness is easily confounded with other positive emotional
phenomena such as joy, happiness and cheerfulness (cf. Kruger, 1995).
Self-evaluation scales exist for evaluating the playfulness as a personality trait among adults. For example,
Glynn and Webster (1992) have developed a self-evaluation scale for adult playfulness, (however, see Kruger 1995 for
heavy criticism) and Barnett (2007) lists 15 qualities (e.g., “cheerful”, “spontaneous”, “jokes/teases”) that uniquely
describe a playful individual based on factor analysis. Although playfulness may show overlap with more established
personality traits (Woszczynski et al., 2002), in particular the work by Barnett (2007) appears to be useful in evaluating
the playfulness trait of media users. The existing playfulness self-evaluation scales could also be used to measure the
playfulness experienced during media use rather than playfulness trait. For example, the playfulness characteristics of
Barnett (2007) translate easily from traits into activities; e.g. “I felt cheerful”, “I acted spontaneously” and “I felt like
making jokes”. Because the scales have not been validated for such use, however, their validity needs to be re-
established after such evaluation data has been collected.
4.2.7. Brand experience scale
Brakus and co-workers (2009) have constructed a brand experience scale and confirmed its reliability and
validity using a range of analytic methods. The scale consists of four dimensions, which on their part consist of a total
Next Media - a Tivit Programme
WP0 D4.1 AND D4.2
WP0 D0.4.1 AND D0.4.2 MEDIA EXPERIENCE
29 (74)
of 12 self-evaluation items. The four dimensions (with example items) are sensory (“…makes a strong impression on
my visual sense or other senses”), affective (“induces feelings and sentiments”), intellectual (“stimulates my curiosity
and problem solving”) and behavioural (“results in bodily experiences”) brand experience.
4.3. Behavioural measurements
Behavioural measures capture the physical actions that humans target at information technology. These actions
are usually produced to exert some form of influence on the given user interface. Users usually combine several actions
into patterns of behaviour allowing them to accomplish their goals. From an observers perspective such patterns not
only indicate the goals users have, but also allow to deduce users underlying motivations of using information
technology. Typical actions include eye movements, mouse movements, click streams, keyboard presses, or any other
information that comes from an input device connected to a computer observing and recording human behaviour.
4.3.1. Eye tracking
Eye-tracking refers to the measurement of human visual attention by recording a person’s eye movements. For
experience research this is particularly important as visual attention can tell the investigator where a person looks at, i.e.
the object of interest in the surrounding environment. In the context of media experience, eye-tracking reveals which
type and part of content a person is paying attention to.
To measure visual attention three basic types of eye movements are of primary interest: saccades, smooth
pursuit, and fixations. Saccades are fast movements or jumps of the eye “used in repositioning the fovea (the focal
point on the retina of the eye) to a new location in the visual environment”. Saccades may be executed both in a
voluntary and reflexive fashion and last between 10 and 100ms. Smooth pursuit occurs when a person visually tracks a
target moving in the environment. The constant focus on the moving target requires the brain to continuously update the
eye positions, manifested as a simple negative feedback loop based on a few neurons. Fixations are non-moving points
of interest in the environment on which a person focuses. Unlike what the term suggests, fixations do not imply that the
eye is fixed on a particular point. Rather, miniature movements such as tremor, drift, and micro-saccades move the eye
constantly over and around the object of interest. The reason for the constant eye movements is the motion-sensitive
nature of the human vision system: the brain needs motion in order to make sense out of the sensory information
coming from the retina. Without the miniature eye movements the image on the retina fades away, as the photo-
sensitive cells in the retina no longer fire any signal.
Eye movements are of interest to media and experience research as they provide information about a person’s
interest. A typical measure of visual attention, for example, is the duration of fixations. Measured in milliseconds, this
metric can take values between 200 and about 600ms; longer ones occur very seldom. In general, the longer the eye
focuses on a certain object or area of interest in the environment, the more interesting this object may be to the
observing person. Saccades can also tell something about a person’s behaviour. The longer the span of a saccade, i.e.
the higher its amplitude measured in degrees of visual angle, the more likely it is that a person searches through the
visual scene she or he is seeing as compared to reading, for example. This has implications for media and experience

Next Media - a Tivit Programme
WP0 D4.1 AND D4.2
WP0 D0.4.1 AND D0.4.2 MEDIA EXPERIENCE
30 (74)
research, as real-time analysis of such data can be used to deduce whether a person consumes the content that she or he
is seeing or whether she or he is looking for more content, for example.
Eye movements are recorded by a video camera that continuously observes one or both eyes of a test subject.
The camera operates in the infra-red bandwidth of the electromagnetic spectrum. This is particularly important because
of two reasons. First, measuring the eye via infrared makes the camera insensitive to surrounding changes in the
luminance of visible light. Consequently, it can even track eyes in total darkness. Thus this property makes eye tracking
robust and reliable in this regard. Second, this measure remains unobtrusive for the test subject as infra-red light does
not have any harmful effect on the retina or other sensitive tissues of the eye.
4.3.2. User logging
User logging refers to the recording of actions users exert against a computer input device, such as a touch screen, a
mouse, a keyboard or any other device translating human behaviour into computer-understandable signals. In a media
context user logs mirror the path users take through contents. Therefore, a classical analysis result from such data is the
average path. An average path is the “typical” path users follow when using an online newspaper, for example. The
analyst can find out how stable that path is across users, e.g. how often users start to read the cover page and then
immediately go into the “foreign news” section of the paper.
The data produced is often voluminous because many different user actions can be easily captured at the same
time. Although the data is usually present in a numerical form, automatic analyses, such as correlations are hard to
conduct due to the diverse nature of the recorded data. For example, mouse moves and clicks are recorded in two-
dimensional screen coordinates in pixels, whereas recording keyboard presses captures particular key characters or
codes. Moreover, every investigator is interested in different events, and isolating them from the data stream requires
additional work. Thus, log data is usually coded in a manual intermediate step of editing the raw data by assigning
certain agreed codes to certain (sequences of) data values. In other words, when a user clicks on a button in a window
and then presses a certain key, a researcher interested in this particular behaviour assigns the code “A” to it. Another
type of behaviour becomes associated with the code “B”, and so on. The resulting code sequences represent the basis
for comparing the behaviour of one user with another. Thus, behavioural logs allow identifying similar average paths
among groups of users and their variation under influence of a content change, for example. An analyst can find out
how stable that path is across users, e.g. how often users start to read the cover page and then immediately go into the
“foreign news” section of the paper.
More advanced analyses of log files cover the prediction of user behaviour under the influence of certain
elements of the user interface of a medium. This method called sequential analysis offers insight into why people
behave in one way and not another. The key structure of this method is the creation of Markov chains, a mathematical
sequence of behavioural states linked via corresponding transition probabilities. The basic idea behind Markov chains
is: how likely is it that a user will visit the webpage B, for example, given that she/he is currently visiting webpage A
and the link to page B is prominently visible? By combining several of these likelihoods, a probability can be calculated
showing that a user reading content on page A will, via page B and C, eventually end up on page D. Although the initial
states have to be coded again manually and the probabilities of navigating from page to page will have to be measured

Next Media - a Tivit Programme
WP0 D4.1 AND D4.2
WP0 D0.4.1 AND D0.4.2 MEDIA EXPERIENCE
31 (74)
manually via controlled experiments, this approach offers a promising way of deducing and creating general models of
human behaviour with media.
Given that media become increasingly complex in both user interface and presentation terminal (e.g. print vs.
tablet computers) it becomes possible to log a substantial amount of user behaviour, especially in digital media
products, such as digital magazines or newspapers applications. The drastically increasing amount of information in a
user log then becomes more and more time-consuming to code and analyse with traditional methods. Therefore data
mining methods represent a viable alternative. Data mining algorithms parse the logs and can mine a multitude of
tentatively interesting behavioural patterns for media companies. However data mining methods have also their
limitations as the real-time mining of patterns across multiple logs or different user actions is still not possible.
However, recently good progress in this research field has been achieved as researchers have begun to tackle the
problems in analysing data streams coming from multiple sensors or sources, such as sensor networks. These methods
can be applied to media experience research as media companies face similar problems when combining the
information from multiple user logs and aforementioned emotional measurements.
4.4. Media ethnography
Traditional anthropology and ethnography have been interested in understanding and describing stability, not
change. However, there is an increasing emphasis on change and development e. g., in applied ethnography, which
aims at contributing to solving problems and decision-making. Interest of applying anthropology/ethnography to
organizational change has been visible since the 80’s in organization research. Moreover, it represents a way of
understanding the customers.
In the rapidly changing media field of production and consumption there is an urgent need to understand the
daily media practices of users at different times and places. It is not enough to observe one person or use of one type of
media or one media product as media use is inherently social, multimodal and consists also of simultaneous use of
different media.
The meaning and motivation of media use is generated and sustained in the practical lifeworlds of people.
Ethnography is aimed at understanding meaning and motivation e.g., choices of media use. Media use is not mainly for
gaining political or economic information, but for building communities, own identity, having useful information for
everyday tasks, talking and sharing about media content, how to influence one’s surroundings, relaxation and
entertainment. With ethnographic methods we can gain information about how media can serve the everyday needs and
practices of people and what kind of media concepts are needed for today and the near future.
This complexity calls for a reflexive and participative ethnography with multiple methods and sites as well as
multiple timescales in data gathering and analysis. Besides being depicted as ethnography of change, it is also
“processual” research, a case study of “a sequence of individual and collective events, actions, and activities unfolding
over time in context”. It advocates using ethnography to make different voices visible and interact and help construct a
new zone of proximal development for a media organization, its personnel and media users.
This means also addressing several issues ethnographers face: what and whom to observe, from which
theoretical and personal standpoints, home or abroad, how long, what other data is needed; what is the audience we
write for. The main methods proposed for MX research are interviews, questionnaires, close observation of
Next Media - a Tivit Programme
WP0 D4.1 AND D4.2
WP0 D0.4.1 AND D0.4.2 MEDIA EXPERIENCE
32 (74)
individual people (shadowing) in their daily practice from home to work/study, hobbies and back home, different kinds
and methods of media diaries, videotaping homes morning and evenings and stimulated recall interviews.
In the recall interviews, the ethnographic data (e.g., videos) are showed to the participant and he/she is asked to
think out and talk about the events with the researcher. Close observation includes for example, video recording and
close reading. Both are described in more detail further in this section. Automatic tracking of devices used for media
consumption is also a part of the methods repertoire. This is described in detail in section 4.3 Behavioural
measurements.
Despite many methods available, there is also need for many new methods in ethnography: hanging out,
immersion, visits, email, phones etc. and "it is the circumstances which define the method rather than the method
defining the circumstance".
Traditional anthropology uses ethnography as its main research method. “Proper ethnography is described as
participant observation done during fieldwork". Participation nowadays often refers not to actual participation (living
with the people observed) but close observation of everyday practices. Delamont (2004) describes two main types of
fieldwork as 'total immersion' and 'partial immersion'. The first one refers to traditional anthropological tradition where
a researcher lives in the community s/he studies. The latter one is applied in sociology, education and the applied
disciplines where the researcher spends part of his or her time oscillating between the field, university, and home.
The focus in ethnography has been shifting towards finding out how people strive to find meaning and solve
problems in "their continually changing relationships and circumstances". Therefore is an example of applied research,
which is defined as an "inquiry that is intentionally developed within a context of decision making and that is directed
toward the interests of one or more clients".
In MX pilot research we aim to use all the above mentioned methods in the framework of rapid ethnography.
The subjects will be chosen after discussions with the companies. As the methods are quite time consuming, to analyse
a small sample is used in the pilot next fall. Rapid ethnographic methods are also utilized in human computer
interaction research, design and consumer behaviour.
Rapid ethnography emphasizes several principles that also characterize the approach used to do ethnography and
developmental interventions. Extensive, but time-limited ethnography, research teams, iterative methods of gathering
knowledge, emphasis on emic knowledge and giving space to silenced or disagreeing voices and an interest of solving
problems of importance for the stakeholders are common characteristics with rapid ethnography and developmental
interventions of creating media concepts, testing and developing them in an iterative process in next year’s MX
activities.
There is strong need in media and audience research to differentiate between normative accounts of media use,
like the importance of news and how they are used and shared with conversations and technologically mediated
practices. Media practices can be more adequately understood as places for the successive divergence, convergence and
realignment of multiple, shifting lines of activity.
4.4.1. Video recording
Video recording provides a shared resource to overcome gaps between what people say they do, and what they in
fact do. It makes it possible to record permanently the primary data in its richness and makes it possible to go over the
Next Media - a Tivit Programme
WP0 D4.1 AND D4.2
WP0 D0.4.1 AND D0.4.2 MEDIA EXPERIENCE
33 (74)
data and analyse it repeatedly, also with the people appearing in the videotapes and with other researchers. But of
course video does not capture all data, only where the lens is focused. Smell or heat does not show on the video, nor the
passing moments of sharing what has been learned from media during the day.
"There is reason to suspect that what we call cognition is in fact a complex social phenomenon. The point is not
so much that the arrangements of knowledge in the head correspond in a complicated way to the social outside the head,
but that they are socially organized in such a fashion as to be invisible. "Cognition" (or media use also) observed in
everyday practice is distributed - stretched over, not divided among - mind, body, activity and culturally organized
settings (which include other actors)" (Lave, 1988, 1).
4.4.2. Close reading
Although different kinds of audience research is frequently conducted in connection with magazines, most of
them are studies that do not reach the experience of being a reader, but are focused more on the interests of the reader.
This sort of research is done mainly in the context of the commercial media sector and serves the publishers’ marketing
departments. The main contradiction that is associated with the marketing research viewpoint is whether we talk about
being the receiving audience or being an active audience in consumption of media. We think that audience research
needs to focus on the practices of experiences and the actions of audiencing.
The purpose of close reading method is to research the readership and the engagement between the reader and
the magazine or its' brand. We will focus on printed and online magazines and examine the readership and media
experience from different viewpoints in the cultural studies framework. These viewpoints are the practices of reading
and meaning construction of audiencing starting with needs, values, interests, identity and community.
The practices of reading can be researched with many methods, e.g. using probes and media diaries. Probes are
commonly used in design and interface research to gain information e.g. on how the users use certain artifacts and how
those artifacts should be re-designed or improved. In this study the participants could be given specific tasks and be
asked to record the situations when reading magazines or capturing it with other media on film, video or text. Media
diaries or smart phones (for dictating or photographing or filling questionnaires about what happened with immediate
media use) could complement the probes as the readers or users would be able to write down or record their thoughts,
feelings and needs in the situation.
Audience studies that focus only on a particular medium distort the meanings of that medium. In the study we try
to avoid the over-emphasis of the meanings and use of a single magazine by examining the magazines as a part of the
readers’ media use and comparing the meaningful contents in magazines to contents in other mediums. To gain proper
results on media practices it is necessary to position the use of magazines in their relevant place in the readers’ media
landscape. Outlining the media landscape could be done interviewing the participants on their media use. These
questions could include the needs of the people, magazines responses to them, other mediums or contents that respond
to similar needs, and the difference between these mediums, contents and their meaningfulness to the reader.
To reveal the meanings given to the magazines that produce the engagement we will conduct deep interviews
with the participants. The themes in the interviews could involve the reader's expectations of the magazine, the
magazine's and reader's values, interest and disinterest of certain stories, the meaning of the images and lay-out, ways
constructing identity and belonging to the imaginary community that the readers create. It is also beneficial to read the

Next Media - a Tivit Programme
WP0 D4.1 AND D4.2
WP0 D0.4.1 AND D0.4.2 MEDIA EXPERIENCE
34 (74)
magazines out loud (together with the researcher) to clarify the thoughts and meanings on the content. As Hermes
(1995, 12) points, the readers, in fact, do not recall very well the articles they have read, but they need to browse the
magazines to discuss them in detail.
This part of research can also be supplemented with sensory perception conducted by VTT analysing the paper
feel and touch with the same subjects as above and asking them how these factors relate to their media experience.
4.5. Usability evaluation
Tradition of usability evaluation methodology can be divided to two branches: User testing and expert
evaluation, both with corresponding specialized methods as pictures in Figure 7.
Figure 7. Two branches of usability evaluation
Every method has its own strong points and weaknesses and it is generally accepted that evaluation should be a
combination of various methods. Menu of methods is chosen on a case basis and is part of usability professionals’
skills. However, in its simplest form, a usability test can be performed even in-house. Basic usability test consists of 1)
Task & scenario; 2) Talking out loud – observing & note taking; and 3) Report and suggest fixings. Task is a small job
or mission which user is supposed to accomplish. For example “Find a book x in eReader device”. Scenario is the
described situation, which helps the user to adjust to test situation. For example “You are in your home and have just
received this device by post and…”
Talking out loud is a method where the user tells the observer what s/he is does and why. Usually user testing
consists of at least usability test and interview. User testing is frequently reinforced with expert evaluation. This method
is to identify usability problems based on established human factors principle. It commonly utilizes established
guidelines or principles (heuristics), noting down their observations and ranking them in order of severity.
Usability evaluation can also be carried out using self-reporting methods, by using questionnaires that are
administered to users after they interacted with the media product. For a review of questionnaires applied to usability
evaluation see Tullis and Albert (2008).
User testing
• usability test käytettävyystesti• pluralistic usability walkthrough ryhmäläpikäynti• observation havainnointi• interview & questionnaire haastattelujakysely • focus groups focus ryhmät• usability round table käytettävyyden pyöreä pöytö• visual walkthrough visuaalinen läpikäynti• informal walkthrough vapaa läpikäynti
• usability test käytettävyystesti
Expert evaluations
• heuristic evaluation heuristinen arviointi• kognitive walkthrough kognitiivinen läpikäynti• standard reviews standardikatselmukset • heuristc walkthrough heuristimen läpikäynti
• heuristic evaluation heuristinen arviointi
USABILITY EVALUATION

Next Media - a Tivit Programme
WP0 D4.1 AND D4.2
WP0 D0.4.1 AND D0.4.2 MEDIA EXPERIENCE
35 (74)
5. Research methods tapping different experience dimensions
In this chapter, for each distinctive research method, where appropriate, we present the feeling and appraisal
dimensions that can be measured with that method, adding also examples of studies as well as ideas of further research
(hypotheses that would be interesting/feasible to study). The mapping method-dimensions are then presented in two
separate tables, one for feeling dimensions (Table 1) and the other for the appraisal dimensions (Table 2).
We have placed the Playfulness in Table 1 because of space limitations, but also because this concept is difficult
to define and it can easily be associated with a feeling or mood dimension. The discussion in this chapter concentrates
on the psychophysiological measurements, because they are more likely to be correlated with a wider range of
dimensions, while other measurements focus on specific dimensions, such as flow self-reports are used to measure flow,
ethnographic methods are used to study media practices, choices and motivations, usability evaluation investigates the
usability dimension, and behavioural measurements focus on patterns of use. Thus, Table 1 and Table 2 represent
starting points for integrating different research methods with the aim to study in depth and from different perspectives
the same or similar MX dimensions. Figure 8 summarizes the MX research framework for further studies by mapping
different dimensions to different methods in a time-based model of media experience.
Figure 8. Research framework for MX dimensions in a time-based model

Next Media - a Tivit Programme
WP0 D4.1 AND D4.2
WP0 D0.4.1 AND D0.4.2 MEDIA EXPERIENCE
36 (74)
5.1. Psychophysiological measurements
5.1.1. Facial EMG
Facial EMG is frequently used to index positive and negative valences (P. Lang et al. 1993). The activity
recorded at three groups of facial muscles is typically measured to index different types of emotional responses to
psychological stimuli. Increased activities at the zygomaticus major (ZM) and corrugator supercilii (CS) regions
have been associated with positive and negative valences, respectively (P. Lang et al., 1993; Witvliet & Vrana, 1995),
especially when studies are framed in the picture-viewing paradigm. When the stimuli were unpleasant or negatively-
valenced sounds, words, or vocal expressions of anger, only the CS muscle showed a higher activity (see Ravaja 2004a
for examples of studies). Activation of the outer region of orbicularis oculi (OO) region has been associated with high-
arousal positively-valenced emotions (Jäncke, 1994; Ravaja, 2004a). Moreover, increased activity at OO is thought to
be involved in the expression of enjoyment smile and genuine pleasure (Ekman et al., 1990) and also has been found to
discriminate between positive and negative or neutral states in picture viewing (e.g., Jäncke 1994). Bradely and Lang
(2000) have presented also evidence that the OO muscle has elevated activity for arousing versus neutral sounds.
In media research, some studies show similar evidence of the activity at CS and ZM when participants are
presented with affective content of films (i.e., dynamic medium compared with still pictures) that supports the
associations between facial EMG and negative and positive valence of stimuli, respectively (see Ravaja, 2004a for
examples). Similarly, Bolls et al. (2001) show evidence of CS and ZM higher activity when exposed to negative and
positive radio ads, respectively.
When studying the effect of more neutral messages as conveyed by financial video news messages on the
affective dimensions of valence and arousal, Ravaja et al. (2004) found that corrugator activity was significantly higher
during a priori negative, compared to positive, messages, but negative and positive messages were not differentiated by
zygomatic activity. In addition, OO activity was higher during a priori positive messages and high-arousal messages as
compared to negative messages and low-arousal messages, respectively. In that experiment the stimuli variation was
represented by small reliable differences in the emotional tone of the messages.
A study by Hazlett and Hazlett (1999) compared facial EMG to self-report as a measure of emotional responses
to television advertisements containing many emotional cues. They found that facial EMG measures discriminated
emotional responses more effectively than self-report. In addition, the facial EMG was more strongly related to recall
than self-report (although, this association was not convincingly established). Furthermore, peaks in facial EMG
responses elicited during the commercial were temporally related to specific emotion-congruent events in the
commercial. However, this study demonstrated that a commercial that has a high likability rating can elicit negative
emotions (as measured by EMG) related to tension and drama. Therefore, it is not straightforward to conclude on the
basis of EMG data which commercial to be selected for publication, because there is some evidence that a good
advertisement may elicit a strong overall emotional response, whether positive (indexed by zygomatic activity) or
negative (indexed by corrugator activity). Thus relying only on EMG data may not be warranted in many situations; it is
possible that a combination of facial EMG and cognitive response analysis resolves some of the problems (Ravaja,
2004a).
Next Media - a Tivit Programme
WP0 D4.1 AND D4.2
WP0 D0.4.1 AND D0.4.2 MEDIA EXPERIENCE
37 (74)
The aforementioned studies suggest that corrugator EMG activity can be used as a valid indicator of negative
emotional responses in media studies, whereas zygomatic EMG activity should be interpreted with caution as an index
of positive emotional responses, especially when the emotional messages are less extreme. As a further caveat, a slight
increase in zygomatic activity (e.g., a facial grimace) may also be produced by very unpleasant stimuli (e.g., pictures of
mutilated bodies) (P. Lang et al., 1993).
With regard to OO muscle activity, this is a potentially useful measure of positive emotional responses also
during media messages, although OO activity may increase also during high-arousal stimuli (see also Witvliet & Vrana,
1995). Another related measure uses the blink reflex at OO which is found to associate with affective valence of the
message in the context of presenting brief startle stimuli in media perception (P. Lang et al. 1990).
To summarize, the facial EMG measures are useful to index pleasantness, and positive high-arousal emotions. It
is, however, also conceivable that facial EMG can be used to index other media experience dimensions involving
emotional components, such as flow (involves positive affect by definition), playfulness (through enjoyment and
pleasantness), spatial presence (when spatial presence is high, emotional content is likely to elicit more extreme
positive or negative responses), social presence (social relationships are intrinsically rewarding, thereby eliciting
positive affect), usability (satisfaction elicited by good usability), usefulness (useful media would be expected to elicit
stronger positive affect compared to non-useful media), interestingness (more interesting content is expected to elicit
stronger positive affect compared to uninteresting content), understandability (understandable content is expected to
elicit more positive affect compared to non-understandable content), trustworthiness (media perceived as trustworthy
would be expected to elicit more positive emotions compared to untrustworthy media), brand experience (good brand
experience should be accompanied by positive affect), perceived price/value (low price/value should elicit positive
affect), and familiarity (familiar products may elicit positive affect). The relationship of facial EMG measures with
these other dimensions of media experience has, however, not been thoroughly examined and further studies are needed
in this area to validate facial EMG as a measure of these dimensions.
5.1.2. EEG
EEG measures have been found in many studies to correlate with positive affect and approach motivation. There
are two main physiological responses that can be captured using EEG: frontal EEG asymmetry and alpha power. The
measurements of the left frontal cortical activation have been found to correlate with positive activation and approach
motivation, while right frontal cortical activation associates with negative activation and withdrawal motivation. The
alpha power EEG measure correlates with attention, emotional arousal, interest and recall (Simons et al., 2003;
Mulholland, 1978; Appel et al., 1979; Reeves et al., 1985).
Examples of studies that are based on EEG measures to investigate the response of users to different media
stimuli are in the domain of television viewing (e.g., Simons et al. [2003] investigated the effect of image motion on
users attention when compared to still images), TV commercials (e.g., Appel et al. [1979] and Reeves et al. [1985]
investigated the relationships between recall and alpha power, while Ohme et al. [2010] applied frontal EEG asymmetry
to investigate the effectiveness of TV ads in generating approach motivation).
Given the relationship of frontal EEG asymmetry with positive affect and approach motivation, it would be
expected that frontal EEG asymmetry might be able to index the same media experience dimensions as suggested in the

Next Media - a Tivit Programme
WP0 D4.1 AND D4.2
WP0 D0.4.1 AND D0.4.2 MEDIA EXPERIENCE
38 (74)
case of facial EMG (see above). The established relationship of the EEG alpha power with attention and interest
suggests that alpha power can be used to index perceived unexpectedness and interestingness of media stimuli.
However, as is the case for facial EMG, further studies are needed to validate EEG-based measures as measures of these
other media experience dimensions. Tables 1 and 2 summarize the established and hypothetical links of EEG with the
different media experience dimensions.
5.1.3. EDA
Based on different conceptual definitions of arousal, EDA is an excellent operational description of it.
Moreover, empirical studies using the picture-viewing paradigm have also shown that EDA is highly correlated with
self-reported emotional arousal (e.g., P. Lang et al., 1993). Accordingly, arousing pictures of either valence result in
increased EDA as compared to low-arousal pictures.
A number of studies have also suggested that EDA is associated with various theoretical constructs of processes
such as activation, attention, and the task significance or affective intensity of a stimulus as experienced by a subject
(Dawson et al., 2000). However, these theoretical constructs do not relate to EDA separately or directly, but in the
context of other variables and processes. Therefore, because EDA measures can be associated with many psychological
constructs, it is difficult to interpret them in empirical studies, and hence the experiments should be designed carefully.
In this respect, to be able to infer the psychological process mediating the resultant electrodermal response, one has to
control experimental conditions so that only a single process is varied at a time (e.g., emotional arousal as influenced by
emotional tone of the messages). This ensures that the differences in EDA between the conditions are not due to
message confounds, but to the specific factor under analysis.
Studies on media have showed increased arousal as indexed by EDA during exposure to television and radio
messages with arousing content, television messages with a high rate of cuts and edits, and video messages presented on
a large screen (see examples of studies in Ravaja, 2004a). Grabe et al. (2000) found that differences in education level
are associated with differences in arousal as measured by EDA and in information encoding (as measured by a verbal
recognition test) when people are exposed to messages containing negatively compelling images. Moreover, the same
study showed that, in that experimental setting, self-report and psychophysiological measures provided different
conclusions. A similar study was conducted by Grabe and Kamhawi (2006) who showed that there are gender
differences in processing negative news in terms of skin conductance measures of arousal.
To summarize, EDA measures can be used to index arousal and attention, as well as task significance and
affective intensity. Thus, EDA can potentially be used to index also other media experience dimensions involving
arousal and attention, such as usability (poor usability elicits frustration accompanied by increased arousal), flow (that is
accompanied by relatively high positively-valenced arousal), spatial presence (when spatial presence is high, high-
arousal content will elicit higher subjective and physiological arousal), social presence (social interactions are
arousing), playfulness (involves at least moderately high arousal), interestingness (interesting content elicits higher
arousal), understandability (non-understandable content elicits frustration and arousal), brand experience (good brand
experience would be expected to be accompanied by at least moderately high arousal), and unexpectedness
(unexpectedness may elicit arousal). Also in the case of EDA, validation studies are needed to establish its relationship

Next Media - a Tivit Programme
WP0 D4.1 AND D4.2
WP0 D0.4.1 AND D0.4.2 MEDIA EXPERIENCE
39 (74)
with some of the experience dimensions, although some of the suggested relationships are quite obvious (e.g., with
usability, interestingness, understandability).
5.1.4. Heart rate
In media research, there are several studies that have used heart rate measures to observe the role of attentional
and emotional factors in message processing (Ravaja, 2004a). Ravaja (2004a) points out that HR has been shown to be
a good measure of both short-term attentional selection (ie., automatic resource allocation; phasic analysis) and long-
term attentional effort (i.e., voluntary attention; tonic analysis). Accordingly, two studies by A.Lang et al. (2000) and
Bolls et al. (2001) found that a decrease in tonic HR is related to increased attention in the context of media perception
when the situation does not require cognitive effort. The picture-viewing literature has also shown that moving images
prompted a stronger HR deceleration compared to still images (Simons et al., 2003; Reeves et al., 1985). Potter (2000)
and Thorson and Lang (1992) concluded that a decrease in phasic HR is associated with orienting response (involuntary
attention or short-term change in attention) in the context of presenting a novel, unexpected, or signal stimulus via a
structural features of video messages. Moreover, a decrease in tonic or phasic RSA measure has been found to be
associated with increased attentional engagement in two studies on media perception (Porges, 1991; Ravaja, 2004b).
Lacey and Lacey (1970) have, in turn, shown that an increase in tonic HR is related to cognitive effort, stress and
emotional arousal in a sensory rejection task (mental arithmetic). Usability studies have also shown that heart rate
decreases when users interact with a well-designed website (Ward and Marsden, 2003).
However, the HR has the disadvantage of being difficult to interpret; due to the fact that the heart is innervated
by both the sympathetic and parasympathetic branches of the autonomous nervous system, the HR is not univocally
attributable to any single source. Increased cardiac parasympathetic activity causes the heart to slow down and is
associated with information intake, attention, and approach behaviour, while increased cardiac sympathetic activity
causes the heart to speed up and is associated with emotional arousal, general preparation for action, and mobilization
of resources (Ravaja, 2004a).
To summarize, though the common HR measures are ambiguous, they could be used to measure emotional
arousal, attention, cognitive effort and stress. It would also be expected that HR measures can be used to indirectly
index the same media experience dimensions as EDA (see above). For example, one would expect HR to be positively
associated with interestingness and social presence.
5.2. Self-reports
In section 4.1, standard questionnaires and self-reporting scales have been presented for measuring specific
dimensions of the media experience. In Tables 1 and 2, there are summarized the mappings from measurement to
feeling and appraisal dimensions, respectively. As shown in section 4.2.1 and in Appendix, sensory evaluation can be
extended to the evaluation of mental impression or subjective evaluation of media products.

Next Media - a Tivit Programme
WP0 D4.1 AND D4.2
WP0 D0.4.1 AND D0.4.2 MEDIA EXPERIENCE
40 (74)
Table 1. Applicability of the research methods to assess the feeling dimensions
Method Measurement Feeling dimensions
Pleasantness Arousal Sensory perception Flow Spatial
presence Social
presence Playfulness
Psychophysiological Facial EMG yes partially - ind ind ind ind EEG yes yes - ind ind ind ind EDA - yes - ind ind ind ind HR - yes - ind ind ind ind
Self-reporting Self-assessment manikin
yes yes - - yes - -
Sensory evaluation yes yes yes - - - -
Spatial presence questionnaires
ind ind - ind yes - -
Social presence inventory
- - - - ind yes -
Flow questionnaires ind ind - yes ind - ind
Playfulness scales ind ind - ind - - yes
Behavioral Eye-tracking - - - ind - - - User logging - - - - - - -
Ethnographic Media diaries yes yes - - - ind ind Interview yes yes - ind ind ind ind Observation ind ind - yes yes yes yes
ind= indirectly (establishment of a relationship may require additional studies)
Table 2. Applicability of the research methods to assess the appraisal dimensions
Method Measurement Appraisal dimensions
Useful ness Interestingness Understanda
bility Trustworthin
ess Familiarity Unexpectedness Brand Price/
value Psychophysiological Facial EMG ind ind ind ind ind - ind ind
EEG ind ind ind ind ind ind ind ind EDA - ind ind - - ind ind - HR - ind ind - - ind ind -
Self-reporting 1-item Likert scales yes yes yes yes yes yes yes yes
Sensory evaluation - - - ind ind - ind ind
Brand experience scale
- - - - - - yes -
Behavioral Eye-tracking yes ind - - ind - - User logging ind yes - - - - - -
Ethnographic Media diaries yes yes yes yes ind yes ind ind Interview yes yes yes yes yes yes yes yes Observation ind yes ind yes yes yes yes yes
ind= indirectly (establishment of a relationship may require additional studies)
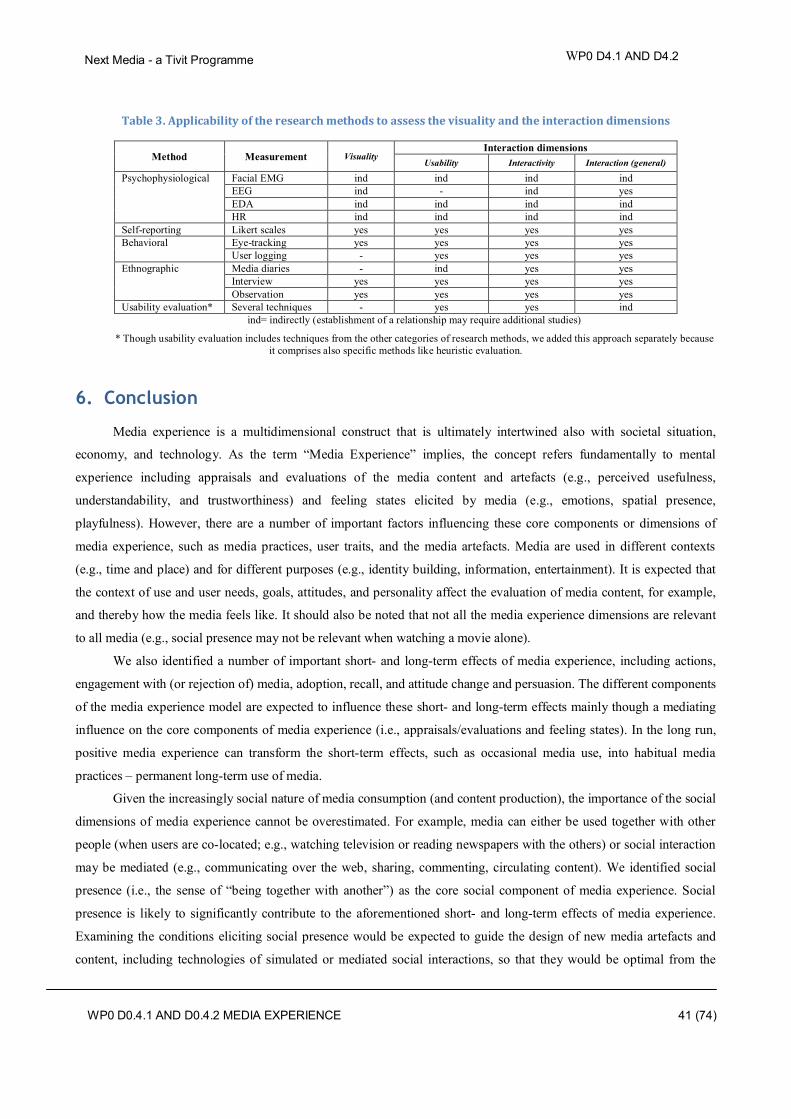
Next Media - a Tivit Programme
WP0 D4.1 AND D4.2
WP0 D0.4.1 AND D0.4.2 MEDIA EXPERIENCE
41 (74)
Table 3. Applicability of the research methods to assess the visuality and the interaction dimensions
Method Measurement Visuality Interaction dimensions
Usability Interactivity Interaction (general)
Psychophysiological Facial EMG ind ind ind ind EEG ind - ind yes EDA ind ind ind ind HR ind ind ind ind
Self-reporting Likert scales yes yes yes yes Behavioral Eye-tracking yes yes yes yes
User logging - yes yes yes Ethnographic Media diaries - ind yes yes
Interview yes yes yes yes Observation yes yes yes yes
Usability evaluation* Several techniques - yes yes ind ind= indirectly (establishment of a relationship may require additional studies)
* Though usability evaluation includes techniques from the other categories of research methods, we added this approach separately because it comprises also specific methods like heuristic evaluation.
6. Conclusion
Media experience is a multidimensional construct that is ultimately intertwined also with societal situation,
economy, and technology. As the term “Media Experience” implies, the concept refers fundamentally to mental
experience including appraisals and evaluations of the media content and artefacts (e.g., perceived usefulness,
understandability, and trustworthiness) and feeling states elicited by media (e.g., emotions, spatial presence,
playfulness). However, there are a number of important factors influencing these core components or dimensions of
media experience, such as media practices, user traits, and the media artefacts. Media are used in different contexts
(e.g., time and place) and for different purposes (e.g., identity building, information, entertainment). It is expected that
the context of use and user needs, goals, attitudes, and personality affect the evaluation of media content, for example,
and thereby how the media feels like. It should also be noted that not all the media experience dimensions are relevant
to all media (e.g., social presence may not be relevant when watching a movie alone).
We also identified a number of important short- and long-term effects of media experience, including actions,
engagement with (or rejection of) media, adoption, recall, and attitude change and persuasion. The different components
of the media experience model are expected to influence these short- and long-term effects mainly though a mediating
influence on the core components of media experience (i.e., appraisals/evaluations and feeling states). In the long run,
positive media experience can transform the short-term effects, such as occasional media use, into habitual media
practices – permanent long-term use of media.
Given the increasingly social nature of media consumption (and content production), the importance of the social
dimensions of media experience cannot be overestimated. For example, media can either be used together with other
people (when users are co-located; e.g., watching television or reading newspapers with the others) or social interaction
may be mediated (e.g., communicating over the web, sharing, commenting, circulating content). We identified social
presence (i.e., the sense of “being together with another”) as the core social component of media experience. Social
presence is likely to significantly contribute to the aforementioned short- and long-term effects of media experience.
Examining the conditions eliciting social presence would be expected to guide the design of new media artefacts and
content, including technologies of simulated or mediated social interactions, so that they would be optimal from the

Next Media - a Tivit Programme
WP0 D4.1 AND D4.2
WP0 D0.4.1 AND D0.4.2 MEDIA EXPERIENCE
42 (74)
perspective of natural social interaction. In our forthcoming empirical studies, we will also focus on the social aspects
of media experience.
There are a number of different methodological approaches and measurement techniques (e.g., self-report,
psychophysiological assessment, tracking of behavioural indicators of media experience, media ethnography) to assess
the different components or dimensions of media experience. Different methodological approaches are optimal for
assessing the different components of the media experience model. For example, media ethnography is particularly well
suited for studying media practices, whereas continuous psychophysiological recordings are a strong method for
acquiring information on the emotional aspects of media experience. In the empirical studies, our aim is to integrate the
different media experience assessment methodologies, an important research question being how the various methods
employed in media experience research should be combined in order to get accurate and comprehensive information on
media experience.
One potential way to see the relation of media ethnography with the psychophysiological approach, for example,
is that the use of media ethnography precedes in time quantitative research approaches aiming to test specific
hypotheses. That is, media ethnography may reveal the usages of a given media in different contexts, thereby
facilitating theory construction and pinpointing the important research questions that can then be addressed using
quantitative approaches, such as emotion-related psychophysiological measurements. In the empirical studies, we will
address these issues in collaboration with the company partners.
7. Appendix
7.1. Meta-level: Society, technology, economy and new media products and
practices
7.1.1. Emerging techno-economic paradigm changes the media field
Media experience research task is related to the critical issue for media companies and society. How is media
behaviour changing and how can this change be researched and measured to provide information for new business
models and advertisers as well as for engaging content.
A lot of hype has been produced about the wonderful possibilities for media production and consumption
starting with the telegraph (Im, 1997), the internet (Negroponte, 1996) and in the past year iPad or other multimodal
tablet devices. However the rosy future does not always materialize and the consumers reject the offerings based on
new technologies. Curran (2010) has presented four examples of much hyped digital “revolutionary” products that were
supposed to transform media use and fill the coffins of media organizations. In the 1980’s in England reporters and
analysts put their faith in interactive cable-TV to become the entertainment centre at home. In the 1990’s the talk turned
to digital TV as the solution for all communication and entertainment needs at home – also in Finland. In England local
community TV in the 1980’s was the catchword. The collapse of the IT-bubble around 2000 was an example of what
happens when customers/media users do not care about the new offerings.
Next Media - a Tivit Programme
WP0 D4.1 AND D4.2
WP0 D0.4.1 AND D0.4.2 MEDIA EXPERIENCE
43 (74)
Nowadays buzz words like social media (Youtube, Facebook, Four Square), web journalism (Politico,
Huffington Post, The Daily Beast), content aggregators like Flipbord, Zite, Pulse or HitPad), user-generated content,
ebooks, ubimedia, smart phones, augmented reality, wearable media and so on have emerged as new media products
changing the mediascape and media practices. These changes in media practices also impact media experiences of the
audiences and methods of how to measure them.
Increased literacy, increased per capita income, availability of broadband at home, mobile (smart )phones,
competition for readers time and money have characterized the changes in the global media field. However change in
media products, their production and user practices is slow and unpredictable (Domingo, 2008). It takes decades from
innovations in the labs to become durable consumer goods produced for profit by large organizations and available to
wide segments of the consumers (Pisano, 1997). Lasting change in media production and use is not just a question of
inventing new technological gadgets or repackaging the same content for different delivery platforms but a journey
lasting years or decades from the first innovations to consumer goods and change in the whole techno-economic
paradigm.
Another issue complicates the adaption of new media products or contents. Media industries are unlike many
other industries because they operate in a “dual product marketplace”. They seek to manufacture and sell two different
sets of content to the audiences and audiences to the advertisers. However these two are highly interrelated and have an
effect on each other (Napoli 2010a,b, 2003). The interest of media companies in media experience research has mostly
been in providing exposure measurements for the advertisers.
When media organizations gather statistical information about its audience the measured audience emerges.
Some information is also gathered through ethnographic methods of citizens/consumers and their media behavior in the
everyday life to try to understand what Napoli calls the actual audience - people who read or watch the media. However
the actual audience always remains unknowable to a certain degree. It is a more or less accurate perception of an
audience by media firms and advertisers (Napoli, 2003, pp. 29-34).
Not all technological innovations are turned into commercial products and everyday use. What is technologically
feasible may not be economically profitable or socially and culturally acceptable. Technological innovations do not just
produce “ready-made” new products or services for consumers. Each technological revolution provides a set of generic
technologies, infrastructures and organizational principles — a new techno-economic paradigm — which is capable of
gradually modernizing and increasing the productivity of the whole economy (Perez, 2005).
According to Perez (2005) technological revolutions begin to emerge in cycles of 40-50 years beginning with an
innovation and installation period and they gradually mature into the deployment period until new radical innovations
begin to challenge existing technologies and the techno-economic paradigm. In the figure below Perez depicts each
cycle of technological paradigm changes as going through the same phases The first half of each surge is called the
installation period – where old and new technologies and products confront each other.
”After this battle against resistance has been won that the decisions are taken –through various social processes–
as to the specific shape that the full flourishing of the new potential will take. This usually happens after the collapse of
a frenzied bubble of intensified investment in the new technologies and infrastructures, which has regularly occurred
midway along the propagation of each technological revolution” (Perez 2005, 7).

Next Media - a Tivit Programme
WP0 D4.1 AND D4.2
WP0 D0.4.1 AND D0.4.2 MEDIA EXPERIENCE
44 (74)
During the installation period economy is typically led by short term criteria of financial capital searching for
extraordinary profits. In the deployment period economy returns into the hands of renewed and strengthened production
capital. The whole potential of technological revolution is deployed across the economy. Between installation and
deployment periods the turning point period reigns and the tension left by the bursting of the technological bubble needs
to be resolved.
Figure 9. Phases of technological revolutions (Perez, 2002, 37).
The installation period is characterized by constant innovation forced by investor expectations and fierce
competition. Target markets are small and sophisticated and industry structures fluid. The established industries are
pushed to modernize or they become obsolete and many companies disappear.
The media business seems to be at present at the installation period and in the deployment period in which the
new digital media innovations are being developed into sustainable commercial products. Thus understanding the
everyday media practices of people has become a central concern in business models. Innovations change from high-
risk technology push to innovations and services that are pulled by demand (ibid).
The deployment period is characterized by product and market expansion, successful business models relying on
new technology-based products and services, stability of industry structures and wider target markets.
Technological innovations do not entail rapid growth only in new industries but it also rejuvenates many so
called old industries, emphasizes Perez (2005). According to her technology does not determine the content or speed of
change as technological change takes place through an interactive and social process which includes social, political and
managerial change. Each recurring technological revolution has a double nature writes Perez. “The great wealth
creating potential provided by each of them stems from the combination of the new technologies, industries and

Next Media - a Tivit Programme
WP0 D4.1 AND D4.2
WP0 D0.4.1 AND D0.4.2 MEDIA EXPERIENCE
45 (74)
infrastructures with a set of generic technologies and organizational principles capable of modernizing the rest of the
economy” (Perez, 2005, 5). Each technological revolution brings forth also a new techno-economic paradigm which
influence organizational structures and work processes as well as consumer and their behavior.
7.1.2. New audience measurement system emerging
Digitalization influencing new products and audience measurement tools form a dual motor of change in
conceptualizing audiences and their preferences. Napoli (Napoli, 2010a) calls this process an intertwined process of
evolution of audience consumption of media and the emergence of a new audience measurement system.
This intertwined development has influenced discussions about how to understand and measure audiences and
their media behavior and media experience. The concept of what is an audience is a debated and contested area and one
should remember that "particular re-conceptualizations of audiences are beneficial to certain stakeholders interests
while harmful to others” (Napoli 2010, 117).
Napoli (2010) points out the media field has changed in the last decades in two fundamental ways: fragmentation
of media and audience fragmentation and autonomy. Media fragmentation (ibid. 54-77) means e.g. increased television
channel options, more and more niche magazines and in general more publishing platforms with closely targeted
content for niche audiences (Figure 10). For example in the States 90% of television channels have less than 1 % of the
audiences (Napoli, 2010, 67). Hansel (Hansel, 2006) 57 has developed a new concept sliver casting instead of narrow
casting. This affects the development of new and usability of present audience measurement methods.
Audience fragmentation and autonomy is the second great surge of change. Audiences can decide what media
content to consume, when where and how. They can choose their choice of content, time and place especially with
digital media. Also the line between producers and users of media content is blurring. Audiences can no longer be seen
as in traditional mass communication as passive recipients of information but as active actors of media consumption.
Masses can communicate to masses or individuals to masses or with each other through a plethora of digital media
channels (see (Deuze, 2006). But how to measure the amount, time, motivation for this audience work which is based
on free labor (Napoli, 2010b). All these developments could also be monetized if there where proper methods of
researching the changes in media practice and media experience outside the mass media focus.
Figure 10. The fragmentation of media environment (Napoli 2010, 57).
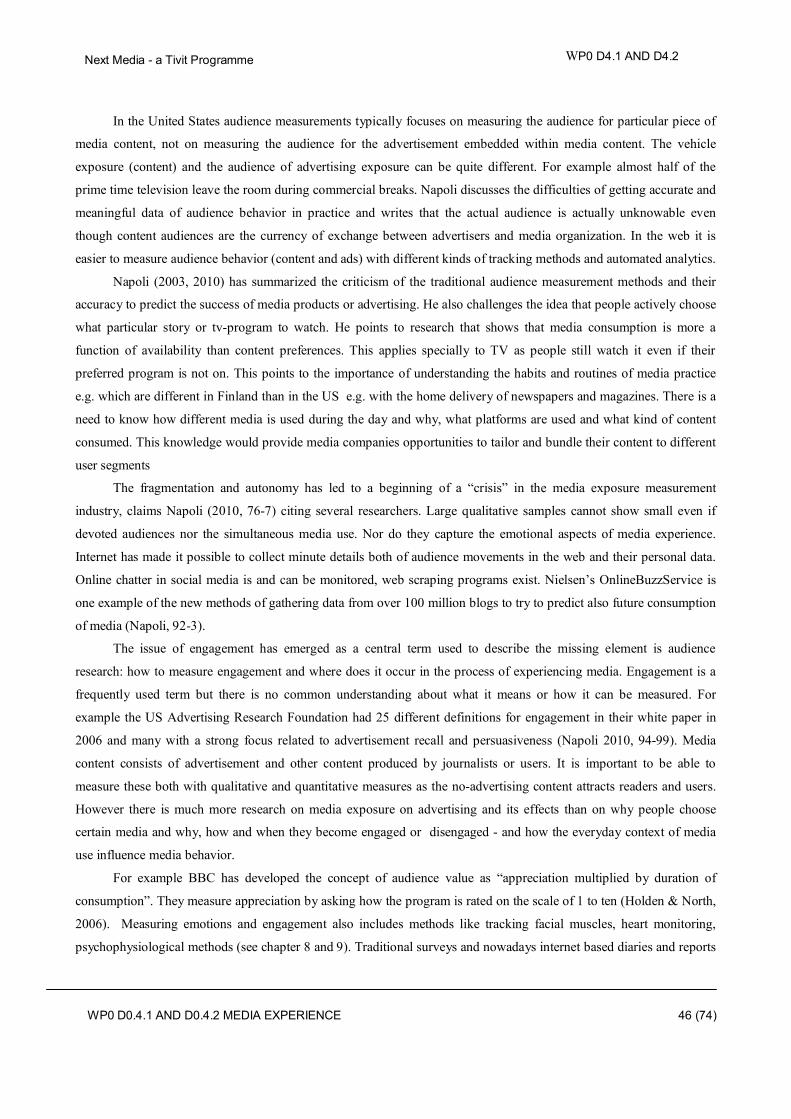
Next Media - a Tivit Programme
WP0 D4.1 AND D4.2
WP0 D0.4.1 AND D0.4.2 MEDIA EXPERIENCE
46 (74)
In the United States audience measurements typically focuses on measuring the audience for particular piece of
media content, not on measuring the audience for the advertisement embedded within media content. The vehicle
exposure (content) and the audience of advertising exposure can be quite different. For example almost half of the
prime time television leave the room during commercial breaks. Napoli discusses the difficulties of getting accurate and
meaningful data of audience behavior in practice and writes that the actual audience is actually unknowable even
though content audiences are the currency of exchange between advertisers and media organization. In the web it is
easier to measure audience behavior (content and ads) with different kinds of tracking methods and automated analytics.
Napoli (2003, 2010) has summarized the criticism of the traditional audience measurement methods and their
accuracy to predict the success of media products or advertising. He also challenges the idea that people actively choose
what particular story or tv-program to watch. He points to research that shows that media consumption is more a
function of availability than content preferences. This applies specially to TV as people still watch it even if their
preferred program is not on. This points to the importance of understanding the habits and routines of media practice
e.g. which are different in Finland than in the US e.g. with the home delivery of newspapers and magazines. There is a
need to know how different media is used during the day and why, what platforms are used and what kind of content
consumed. This knowledge would provide media companies opportunities to tailor and bundle their content to different
user segments
The fragmentation and autonomy has led to a beginning of a “crisis” in the media exposure measurement
industry, claims Napoli (2010, 76-7) citing several researchers. Large qualitative samples cannot show small even if
devoted audiences nor the simultaneous media use. Nor do they capture the emotional aspects of media experience.
Internet has made it possible to collect minute details both of audience movements in the web and their personal data.
Online chatter in social media is and can be monitored, web scraping programs exist. Nielsen’s OnlineBuzzService is
one example of the new methods of gathering data from over 100 million blogs to try to predict also future consumption
of media (Napoli, 92-3).
The issue of engagement has emerged as a central term used to describe the missing element is audience
research: how to measure engagement and where does it occur in the process of experiencing media. Engagement is a
frequently used term but there is no common understanding about what it means or how it can be measured. For
example the US Advertising Research Foundation had 25 different definitions for engagement in their white paper in
2006 and many with a strong focus related to advertisement recall and persuasiveness (Napoli 2010, 94-99). Media
content consists of advertisement and other content produced by journalists or users. It is important to be able to
measure these both with qualitative and quantitative measures as the no-advertising content attracts readers and users.
However there is much more research on media exposure on advertising and its effects than on why people choose
certain media and why, how and when they become engaged or disengaged - and how the everyday context of media
use influence media behavior.
For example BBC has developed the concept of audience value as “appreciation multiplied by duration of
consumption”. They measure appreciation by asking how the program is rated on the scale of 1 to ten (Holden & North,
2006). Measuring emotions and engagement also includes methods like tracking facial muscles, heart monitoring,
psychophysiological methods (see chapter 8 and 9). Traditional surveys and nowadays internet based diaries and reports
Next Media - a Tivit Programme
WP0 D4.1 AND D4.2
WP0 D0.4.1 AND D0.4.2 MEDIA EXPERIENCE
47 (74)
are also used. A new concept call eGPR’s (engagement cross metric points) tries to integrate old and new methods of
audience methods. Morissey (2009) has even called for a “cost-per-engagement” pricing model online.
Napoli has modeled the evolvement of the conception of the institutionalized conceptualization of audiences as
in Figure 11.
Figure 11. The decline of exposure and the rise of alternative audience conceptions (Napoli 2010, 151).
Instead of the traditional way of focusing on exposure the model depicts audience autonomy and fragmentation
at the center changing the exposure to media. The two phenomena change exposure to media and therefore media
organizations want and need to understand also audience interests, appreciation, engagement and response. We also
deal with these new issues with slightly different terms in our model of media experience presented in the next chapters.
7.2. Media practices, habits and needs
7.2.1. Everyday media practices
How is media use changing? Why do people use one media and not the other? Why do they choose one story to
read from a magazine and note the other? What is the strength of attention of particular media use? What is interesting
or useful about media content? Question like these have risen to the forefront in audience research with media
fragmentation and audience autonomy. These issues need more versatile research methods than just exposure measures
and duration of media use (Napoli 2010, 2003).
Media practices bring longer time perspective into media experience discussions than approach for measuring
reactions to a single interaction situation. We approach audiences as active users of media in their particular life
situations from the viewpoints of cultural studies, sociology and co-design. Especially in the rapidly changing media
environment we can have difficulties in finding a stable core of media use or experience. Instead we approach media
use as a meaning making process, which is not only individual but also shared in face to face situations (Couldry,

Next Media - a Tivit Programme
WP0 D4.1 AND D4.2
WP0 D0.4.1 AND D0.4.2 MEDIA EXPERIENCE
48 (74)
Livingstone, & Markham, 2010) and across the nodes of the web in interactive ways of recommending, sharing and
producing digital media content (Domingo, et al., 2008; Jenkins, 2008; Thurman 2011).
Studying media practices calls for a variety of methods both quantitative and qualitative. In this chapter we focus
on qualitative methods which include e.g. ethnography, interviews, media diaries, focus groups etc. But they can also be
combined with technology aided methods like automatic use measurements of the computer or reading device,
reporting media use and emotions on a mobile phone etc.
An ethnographic study by Karapanos et al. (2009) on iPhone users illustrates well the importance of
understanding the habitual use of media products and services. In their study iPhone users were followed from the
actual purchase to four weeks usage with qualitative methods, such as diaries. As a result the authors found out that the
meaningfulness of iPhones emerged through it appropriation in specific contexts and the changes this brought to the
participants’ life. They also noticed that the usage of iPhone became gradually part of people’s daily rituals and suggest
that designing interactions should focus on designing for habituated activities as well.
Also Wilson (2010) found out that the use of mobile use can be highly individualized. For example a Chinese
Malaysian woman in Kuala Lumpur used the phone to only read message or answer phone calls from familiar numbers
– meaning only from her family. It was not a tool for connecting to the wider world outside her family circle.
Korkman’s (2006) has emphasized that on service development: “the objective of service development becomes
thus not the creation of meaningful service, but the cultural production of new forms of practices.” This practice
approach could be called an anti- individualistic (Schatzki, 2002), and anti-subjective stance. Consumption practice is
not only what the customer thinks, feels, and decides to do (subjectivism), but also the consumption the customer takes
part in (objectivism). Many consumption theorists also stress the symbolic as a signal of status and identity, whereas
practice theory implies that material is used rather directly in the reproduction of daily life. Moreover, Korkman (2006)
points out that many practices are embedded in collective understanding, which at times can be either restricting or
enabling for service marketing and management. For instance, when developing a new service, the company should
acknowledge the historical development and understanding embedded in the practice it relates to. Concerning service
marketing and management, it appears that service providers can create a certain dynamics that creates value for the
customers involved in the practice.
We can look at practices both as emerging new ways of acting in the everyday life and at the emerging and
hybrid practices of media consumption e.g. with the new technologically available media products and contents but at
the same time also at the routinized habits of media use as part of the daily life.
We could also look at practices as individual or inherently social and shared. Schatzky (2001, 12) emphasizes
that "knowledge is no longer even the property of individuals, but instead a feature of groups, together with their
material setting". In this report we emphasize the social and interactional dynamics of media use (see chapter 6).
Reckwitz is often referred when attempting to define what practices are (Reckwitz, 2002, 249-250): ‘A
‘practice’ (Praktik) is a routinized type of behavior, which consists of several elements, interconnected to one other:
forms of bodily activities, forms of mental activities, ‘things’ and their use, a background knowledge in the form of
understanding, know-how, states of emotion and motivational knowledge. A practice – a way of cooking, of
consuming, of working, of investigating, of taking care of oneself or of others, etc- forms so to speak of the ‘block’

Next Media - a Tivit Programme
WP0 D4.1 AND D4.2
WP0 D0.4.1 AND D0.4.2 MEDIA EXPERIENCE
49 (74)
whose existence necessarily depends on the existence and interconnectedness of these elements, and which cannot be
reduced to any one of these elements.’
Qualitative audience research focuses on how people come to see their media involvement. ”Accurate
description is as important as correctly counting in quantitative research emphasizes (Wilson, 2008, p. 21).
New challenges of research on media practices are posed by the fact that media use is increasingly simultaneous
or overlapping. A person can turn on the TV and the set-top-box dutifully records the hours spent in front of television.
But in reality the person might be simultaneously be also using his laptop tor mobile to search for news, make phone
calls, listen to the radio, eating dinner and so on. So he or she is not necessarily actively engaged in watching TV-
programs and their ads.
How then we can do research on media practices and measure them? We use different qualitative methods like
in-depth interviews, questionnaires, focus groups, media diaries and ethnographic observation.
Traditional anthropology uses ethnography as its main research method. “Proper ethnography is described as
participant observation done during fieldwork" (Delamont, 2004, p. 218). Participation nowadays often refers not to
actual participation in the activity but close observation of practices. Delamont describes two main types of fieldwork as
'total immersion' and 'partial immersion'. The first one refers to traditional anthropological tradition where a researcher
lives in the community s/he studies. The latter one is applied in sociology, education and the applied disciplines where
the researcher spends part of his or her time oscillating between the field, university, and home (ibid).
There is a need for many methods: hanging out, immersion, visits, email, phones etc and "it is the circumstances
which define the method rather than the method defining the circumstance" (Amit, 1999, p. 11).
We approach studying media research from an applied research perspective which is defined "inquiry that is
intentionally developed within a context of decision making and that is directed toward the interests of one or more
clients" (E. Chambers, 2001, p. 852). Applied ethnography (Beebe, 2001) is one commonly used method for studying
practices in the product development and testing. It can focus on certain elements of practices (Reckwitz, 2002), such as
routinized bodily activities, sets of mental activities, using particular things in a certain way when carrying out a
practice, collective understanding of the phenomena, discursive practices, etc.
Extensive, but time-limited ethnography, research teams, iterative methods of gathering knowledge, emphasis on
emic knowledge and giving space to silenced or disagreeing voices and an interest of solving problems of importance
for the stakeholders are common characteristics with rapid ethnography (Beebe, 1995; R. Chambers, 1980; Millen,
2000).
We also use ethnograhic methods in a way that could called micro-ethnography (Helle, 2009). This means
detailed observation of everyday practices with video-taping or shadowing persons all day. This is done also in
combination with different portable measurement methods like automatic tracking of computer or mobile phone use,
using mobile phones to insert or record “media diary” information or “mood maps”, small video camera attached to the
person, self made mobile videos or pictures of media use etc.
When we think of using ethnographic information on product development one interesting question that
Karapanos et al. (2009) raises is how can we design for contexts (or products) that we cannot anticipate? For example
completely new media products when people do no know they want. Usually, it is believed that studying current
practices with applied ethnography can lead to insights that help in designing new practices. Moreover, there are set of

Next Media - a Tivit Programme
WP0 D4.1 AND D4.2
WP0 D0.4.1 AND D0.4.2 MEDIA EXPERIENCE
50 (74)
so called innovative methods, such as co-design methods (Beyer & Holtzblatt, 1997; Holtzblatt & Jones, 1993;
Hyysalo, 2006; Keinonen, 2003; Kankainen et al. in press) that can be used for both historical understanding of
practices as well as co-designing future designs.
Moreover, as general design guideline Redström (2006) and Karapanos et al. (2009) suggest that the design of
interactive systems should leave room for the users to invent their own ways of using the system. Designs that are
specific enough to address one single need, but flexible enough to enable the artful appropriation in diverse contexts are
more successful that over-defined designs.
The time and space of media use are important components of media practices For example, measuring how
often certain media service is used during a media day or week and whether there is certain rhythm or pattern in the
usage can reveal whether certain media service has become as part of daily routines of customers. With web-related
measurements it is possible to gain detailed data about how users move in the web, how long they stay in one page etc.
Smart phones record and can deliver dozens of categories of information and social media like Facebook has a wealth
of information about every user and can be used as data.
7.2.2. Needs and media content
From the view point of Cultural Historical Activity Theory all human action is object oriented and materially
mediated (Cole, 1996; Engeström, 1987). This object orientedness is what separates activity from concepts that operate
under the stimulus-response paradigm. All forms of behavior can be explained as part of a subject’s object oriented
behavior instead of only as response to external stimuli. The latter are regarded as reactions as opposed to conscious
object oriented activity. This means that to understand for example media practices we have to explore the motives,
needs and activity of media users in their everyday practice.
Cultural-historical activity theory regards emotions as an integral mechanism in activity. According to (Leontjev,
1978) emotions color actions according to the motives that the subject has constructed from activity. “The special
feature of emotions is that they reflect relationships between motives (needs) and success, or the possibility of success,
or realizing the action of the subject that responds to these motives” (Leontjev 1978, 120).
This does not mean that stimuli-response type of research should or could not be practiced in studying media
experiences. These are just two different theoretical approaches which produce different results with differing methods.
Activity theory is interested in the broader life world of the media users and what motivates them.
Another central concept from activity theory used in media research is the concept of contradiction.
"Contradictions are not just inevitable features of activity. They are 'the principle of its self-movement and ...the form in
which the development is cast” (Helle, 2000; Helle & Töyry, 2009b; Helle 2010, Ilyenkov, 1977). In media business the
focus is on the content and providing solutions the contradictions in the lives of the audience. Special attention is paid to
solving contradictions in their reader’s lives so that a permanent audience interest is maintained. Different issues can be
addressed in different ways e.g. in different sections of a magazine or newspaper. The recipes and advertisers urge to
purchase and consume all kinds of food while in another part of the magazine there might be a long story about losing
weight as the summer season approaches. And the editorial might in the same paper demand new legislation banning
unhealthy food in school menu’s and candy machines (see (Helle & Töyry, 2007; Töyry, 2005).
Next Media - a Tivit Programme
WP0 D4.1 AND D4.2
WP0 D0.4.1 AND D0.4.2 MEDIA EXPERIENCE
51 (74)
The media tries at the same time to fulfill the needs of their readers, but at the same they also uphold them and
create new needs. For example in the production of magazine content two fundamental needs of readers are addressed:
the reader is constructed and accepted as who she/he is but also as who she/he wants to be. This means different things
at different historical time frames and cultural conditions, and therefore they are important issues in localization. For in
the production of magazine content two fundamental needs of readers are addressed: the reader is constructed and
accepted as who she/he is but also as who she/he wants to be. This means different things at different historical time
frames and cultural conditions.
Medias user’s needs can be characterized (Helle & Töyry, 2009a, p. 19) into five main components:
1. need for information and knowledge
2. need for belonging to a group or community
3. need for entertainment
4. need to influence personal and social surroundings
5. need for building identity
These needs can be overlapping and simultaneous and change with time and space in everyday life. They are
behind in the everyday practices of media use and form a basis for more detailed analysis of specific instances of media
use like reading a story or searching in the web.
7.3. Macro-level: Social interaction
The activities listed in the model at the macro-level are enabled when social interaction between people takes
place, either face-to-face or through a computer-mediated environment such as a website. The conditions that such
social interaction activities occur are conceptualized in the literature under the name of co-experience and social
presence. While co-experience is a broader concept, more difficult to measure, social presence is a component of it, for
which there exist established measures, such as a social presence inventory. Social presence and established methods
for measuring it are discussed in more detail in sections 3.2.4 and 4.2.3. As social presence can be considered as a
subcategory of co-experience, the presented methods can be of direct relevance to co-experience as well.
7.3.1. Co-experience
Co-experience is an experience that is created when two or more people co-experience episodes of life through
their conjoined interaction involving content, technologies, and events (Battarbee, 2003; Battarbee & Koskinen, 2005).
Thus co-experience allows the creation and sharing of single experiences and emerges in collaborative settings. For
example, it emerges at work in designing a product with colleagues, in sports in a hockey-team playing against another,
or in leisure time when a parent reads a fairy-tale to a child. In the context of print and hybrid media co-experiences
manifest when reading a magazine or viewing an online video together. “Co-experience reveals how the experiences an
individual has and the interpretations that are made of them are influenced by the physical or virtual presence of others”
(Forlizzi & Battarbee 2004, p. 263). (Adapted from Kallenbach, 2009). According to Battarbee and Koskinen (2005),
the defining feature of co-experience is what people choose to share with others from a specific experience. This
suggestion is exemplified by the sharing of a particular holiday photograph in social media service (e.g., Facebook) to
one’s friends.

Next Media - a Tivit Programme
WP0 D4.1 AND D4.2
WP0 D0.4.1 AND D0.4.2 MEDIA EXPERIENCE
52 (74)
Co-experience, or the creation of experiences together in a social context, is a wide concept which incorporates
various phenomena. Among them is social presence which can be characterized as the feeling of being together with
another person in a real or artificial environment.
7.3.2. Social presence
As discussed in section 3.2.3 Spatial presence, presence refers not only to the illusion of “being there” in a
mediated environment but also to “being there together with others”. Social presence refers to the latter component of
presence. Mediated social presence is “the moment-by-moment awareness of the co-presence of another sentient being
accompanied by a sense of engagement with the other” (Biocca, Harms, & Gregg, 2001). Trivially, a prerequisite for
social presence is then the existence of another social actor, who may be either another real person or a human-like
computer character (cf. Lee, 2004). The human tendency for interpreting behaviour of even inanimate objects as
intentional (Dennett, 1987) allows for a level of social interaction even with relatively simple computer-generated
actors. Interaction with the other actor may be mediated via technology ranging from simple textual exchange (e.g. chat
room) to audiovisual virtual environment (computer games or virtual reality).
7.4. Interaction with media artefact
7.4.1. Usability
Traditionally usability has been seen as an assessment of how easy user interfaces are to use in field of HCI. This
easiness is measured by breaking usability to several sub categories like learnabilty, efficiency, memorability,
correctness and pleasantness (Nielsen 1994)
Several researchers have claimed that this traditional assessment of usability from the early days of internet is
too narrow in the days of the visual Web 2.0, that it focuses too much on finding errors, and that it has a too little to say
about qualitative and emotional variables of the product. Even Jacob Nielsen has recently pointed out the importance of
a “more sooth” user experience (UX). Nielsen has pointed out that “beauty” is the most common world with what users
described the UX of iPad, where as “busy” was the most frequent word when dealing with the UX of web pages (Budiu
& Nielsen, 2010).
Clearly the traditional usability approach explains only part of people´s interactional dynamics and their
judgment of satisfaction when trying to use technology (Kallenbach, 2010).
A broader definition sees usability as a quality of use. It moves its function from mere avoiding dissatisfaction to
produce satisfaction. Some scholars propose an even wider definition. Hassenzahl (2001), for example, contents that
even broad definitions neglect the contribution of perceived fun and enjoyment to user satisfaction and preferences.
The importance of a new holistic view about usability has an additional relevance when we are dealing with
artifacts which go beyond the traditional scope of HCI. For example, the production of content for new dedicated
eReaders and tablets is more closely related to traditional publishing that has experienced over 500 years of evolution of
qualitative values in typography and lay-out. There, production relies more strongly on aesthetical design than web
publications or computer programs. This new wave of publishing introduces new kinds of customers, who desire the
best parts of traditional publications (visuality) combined with the best things of the web (hyperlinks, frequent updates,
interactivity) (Ihlström-Eriksson, 2004).

Next Media - a Tivit Programme
WP0 D4.1 AND D4.2
WP0 D0.4.1 AND D0.4.2 MEDIA EXPERIENCE
53 (74)
Measuring UX and usability separately is complicated because they are interrelated; good usability affects UX
but is not determined by it. UX is constructed by quality of content and easiness of use but also by usefulness. The
perceived content quality, ease of use, and usefulness have all a positive effects on gratification. Gratification in turn
correlates strongly on the decision of using the product continuously (Shin, 2011).
Research of UX with media is complicated, because it involves more variables than conventional UX with user
interfaces and computer programs running on a standard PC. This can become a problem because old methods cannot
be applied directly to new phenomena. For example, former and current eReading research has largely concentrated on
“e-book” or “digital magazine” without identifying that content is not the only source of UX. In eReading, users are
dealing with new kinds of devices and programs they have never encountered before.
In order to validly analyze usability and UX it is important to clarify what are the actual sources, for example, of
the perceived pleasantness. Is good UX an attribute of the beautiful execution of the software, related to the easy
navigation provided by the software, or a consequence of the attractiveness of the device where these latter two are run
on?
In the Next Media 2010 research the sources of e-reading UX were broken to three levels: the device, the
software and the content. (Heikkila et al., 2011). In order to grasp the entire scope of the eReading UX and usability, we
have also to take into account the access to content. Several studies have pointed out that the abundance of the available
content and the easy access to it are very critical factors in the diffusion of eReading applications and services. An
extensive selection of content was the most wished attribute along with easiness of reading (Pietilä, 2005).
Thus the market place, the convenient way of shopping, and managing purchased items has to take an important
role in evaluation of eReading media experiences. The attributes of good eReading UX are described in figure 8 as
nested UI-areas. The design of the publication is the core asset, but in order to succeed in areas the entity should have
acceptable quality and capacity to work seamlessly together from a user point of view.
Figure 12. Nested sources of UX in eReading
Next Media - a Tivit Programme
WP0 D4.1 AND D4.2
WP0 D0.4.1 AND D0.4.2 MEDIA EXPERIENCE
54 (74)
Measuring usability with qualitative emphasis
The discussion of how the usability approach can be utilized in the assessment of media experiences can be
divided to two approaches.
Firstly, we could evolve the traditional usability evaluation to contain more qualitative aspects. This was the case
in testing the eReading devices in the research of Next Media 2010 (Heikkila et al. 2011). Tests were constructed in a
multifaceted way and interviews and probes were used to find out not only problems that were perhaps missed in
observational methods, but also to enrich the measured data and to reveal more qualitative issues. In error finding, both
methods produced quite similar findings, but interviews and probes revealed many positive remarks, which would be
missed otherwise. People liked the lightness of some eReaders. Also, the Apple iPad gained many positive remarks; it
was seen as a playful and intuitive product. Users were intrigued to explore the product and there were even problems to
get the device back for others to test.
Another finding from eReading usability testing was that several problems were inherited from the situation in
beginning of 2000´s. Page navigation was difficult because of a missing or poorly implemented navigation bar, but also
because text in the book appeared to be too similar from page to page. Users complained that it was easy to get lost in
the interface and buttons were small and not clearly marked. It is remarkable that these weaknesses were all found
already in the tests in the beginning of 2000´s. It can be concluded that for some reason users have not been established
as important stakeholders in the technological development of eReading devices.
Traditional heuristic evaluation (Jacob Nielsen´s 10 principles and parts taken from Donald Norman´s 7 rules,
Tognazziini´s 16 principles and Schneiderman´s 8 golden rules) is most suitable to error-finding and should be updated
in some way to include qualitative issues as well. For example, the evaluation of typographic quality can be based on a
check-list created by Hannu Pulkkinen (Pulkkinen 2007).
Secondly, traditional usability tests could be used with the fact of their inherited limitations in mind. This means
that usability results should not be considered to reflect the whole picture, but as an important assessment of areas
needing more attention.
From error finding to solutions for enhanced UX
The process of user-centric process modelling (UCD) has an emphasis on iteration. It is about producing
different design solutions and evaluating them against user requirements and producing new designs if results of
evaluation do not meet requirements. Although plain usability evaluation does not usually include product development,
it could be nevertheless beneficial to include hypothetical solutions to problems that researcher have encountered.
Solutions not only visualize the problem, but act also as a bias for possible future developments.
7.4.2. Interaction
Interaction has been the central element of investigation for as long as Human–Computer Interaction and related
research fields exist. Numerous theoretical models have been developed mostly describing its generic stages or phases
occurring in a variety of, if not all, situations in which a human interacts with some kind of interactive artefact for some
purpose. The model of 7-stages of interaction from Don Norman (1988) is perhaps the most well-known (Figure 13). A
human actor with a goal in mind (1) forms an intention to act on the world or environment surrounding her/him (2).

Next Media - a Tivit Programme
WP0 D4.1 AND D4.2
WP0 D0.4.1 AND D0.4.2 MEDIA EXPERIENCE
55 (74)
This intention must then be translated into some sequence of concrete actions (3). In stage (4) the actor executes the
action sequence against the world. Her or his perception of the state of the world marks stage (5). The actor then
interprets the perceptions according the previously formed intention (6) and finally evaluates the result against the
initially formed goal (7). Stage 2 to 4 are commonly labeled “gulf of execution” whereas stages 5 to 7 are commonly
labeled “gulf of evaluation”.
Figure 13. Seven Stages of Interaction.
Monk (1998) introduces an account describing cyclic interaction. This approach builds on just three components
inherent in any interaction sequence: goals, actions, and effects. It recognizes the fact that for a single action of, for
example, saving a document on disk multiple interaction cycles are needed that follow after another. Figure 14
illustrates the relationships between goals, actions, and effects.
Figure 14. Cyclic Interaction for a document saving task (Ryu & Monk, 2009).
Experience and Interaction
With regard to user and media experience, interaction is commonly considered to be its requirement as the
absence of interaction with an interactive (media) artefact will reveal only little or even nothing about its nature,
Next Media - a Tivit Programme
WP0 D4.1 AND D4.2
WP0 D0.4.1 AND D0.4.2 MEDIA EXPERIENCE
56 (74)
purpose, or functionality to the potential user (e.g. Beauregard & Corriveau, 2007; Hassenzahl, 2003). Interaction,
however, acts also as a driver of user experiences as at least some continuous interaction with a product is necessary for
user experiences to unfold. Given the centrality of emotions in user experiences an important question arises: how is
interaction related to emotions and vice versa? Clearly, both Norman’s stages of interaction and Monk’s cyclic
interaction model represent a rather rational perspective on interaction involving generic stages or components that
occur every time a person uses an interactive artifact. Both consider interaction solely at an obvious and observable
level of sequences of actions and behavior and cannot account for its properties reflecting its dynamics, e.g. its speed,
its progress, or why a person first executes action B and then action A in order to achieve a goal. Evidently, neither
approach involves the role of emotions, and thus neither do the introduced approaches allow explaining user experience
in its facets nor its dynamics over the time of interaction. Consequently, they cannot describe the dynamics of user
experience. Therefore, a different approach is needed to explain users’ experience of interaction as it unfolds over time.
One approach to link interaction and emotions is to take into account the choices that users make when
interacting with a media artifact. In other words people’s judgments and decisions cause their emotions during
interaction when they compare (judge) the outcomes of their (decided ) actions with their intended interaction goals.
In order to integrate judgment and decision making and interaction we propose here a change in perspective. If
emotional responses are caused by anticipations and their comparison with actual observed consequences in choice
situations then it may be beneficial for experience research to view interaction not only as a sequence of actions but
foremost as a sequence of judgments and decisions. In other words, choices, represented by judgments and decisions,
serve now as the primary unit of analysis in the research of interaction experiences. From this perspective, actions, as
described in Norman’s model of interaction, would then be the consequential behavioral response occurring as real-
world results of judgments and decisions.
However, what judgments and decisions do exist in interaction? Superficially, one could argue that choice is
omnipresent during interaction: we chose what kind of software product we want to use for what purpose, in what order
we want to carry out tasks and activities, and so on. This is certainly true but again an obvious observation. What is
more important is to look for choice classes that re-occur during interaction; in other words, choices that are building
blocks of interaction and user experiences.
Based on Norman’s model of interaction it is here proposed that (at least) the following three classes of choices
occur frequently during interaction: First, before an actor engages in any action s/he usually chooses a goal s/he wants
to achieve as part of the overall activity s/he is engaged in. This choice is the most important one as it may determine
fundamentally the course of actions within a given activity. Second, an actor then selects the appropriate user interface
element whose function is expected to achieve the previously chosen goal sufficiently. This “right” element is chosen
based on a judgment that integrates the semantics of the textual label or graphical icon of the element with the actor’s
goal and her or his prototypical cognitive representation of a function that would help achieving it on the basis of its
anticipated outcome (see e.g. Hommel & Elsner, 2009; Storbeck, Robinson, & McCourt, 2006). The third choice is
finally the appropriate instrument that allows activating the element and executing its function, e.g. a physical
interaction device such as a mouse or a keyboard, or a finger in case of touch-based interaction. The combination of a
single instance of all three choices constitutes a single action. Given that interaction involves usually more than one
action an actor therefore makes repeatedly these choices throughout the life-time of interaction. Consequently we argue

Next Media - a Tivit Programme
WP0 D4.1 AND D4.2
WP0 D0.4.1 AND D0.4.2 MEDIA EXPERIENCE
57 (74)
that in combination with the relationships between choices and emotion they account for and determine most interaction
experiences.
The Role of Effort
Interaction does not take place without an investment or a cost. In other words, whenever an actor interacts with
the world s/he can do so only by exerting some form of effort. Effort maybe purely mental most of the time but may
also be physical, i.e. when moving the mouse. The influence of effort on experiences should not be underestimated.
Numerous recent studies have prominently shown that even small additional costs change user behaviour profoundly.
Bhavnani and John (2000), for example, have shown that even skilled users of software do not use it efficiently.
In fact, people maintain least-effort strategies, even though these incorporate a higher number of actions and take longer
to execute than (theoretically) optimal strategies. Payne, Howes, and Reader (2001) argue that people actively and
adaptively distribute cognition. That is they often interleave planning and action and “off-load” certain cognitive efforts
onto the interface. For example, Payne (1991) showed that people often cannot remember the labels of frequently used
menu commands, even in software that was familiar to them. Instead they rely on their recognition memory to judge if a
label semantically fits to the meaning of the action they have in mind. If it fits approximately then they (decide to) click
it. Gray, Sims, Fu, and Schoelles (2006) have shown that people’s micro-behavior during interaction is constrained by
their cost/benefit tradeoffs due to the availability and nature of interactive elements on the user interface. In other
words, people optimize the costs of their interactive behavior locally at the micro-level (1/3 – 3 seconds) while
neglecting to optimize global costs for the task at hand. More precisely, they adapt their mouse moves, clicks, and
keyboard presses on the basis of the topography of available interactive elements (e.g. buttons, links, etc.) in the user
interface as long as this adaptation does not violate the global strategy achieving the overall goal of the current activity.
Interaction Experience and Quality
To contribute to user experience and human-computer interaction research a predictive model of interaction
experience would help to explain users’ emotional responses during interaction with daily graphical user interfaces.
Therefore we propose an initial predictive model of interaction experience based on two aforementioned accounts. First,
Mellers et al’s (1999, 2001) decision-affect theory with its distinction of anticipated and actual pleasure serves as the
basis. It allows predicting emotional responses from users that make repeated choices of goals, user interface elements,
and appropriate instruments during interaction in order to carry out a task. Second, to reflect the important role of effort
during interaction we expand decision-affect theory by integrating also anticipated and experienced effort given the
aforementioned results from Bhavnani and John(2000) or Gray et al. (2006), for example.
However, with respect to choice and interaction the term pleasure deserves a more specific definition. The
question is what makes an interaction pleasurable? Taking the assumption that humans usually behave in a goal-
directed manner when carrying out tasks we propose to define pleasure more concretely as the degree or magnitude of
progress towards the final outcome or end goal of a given task that is experienced by making a (single) choice.
This elaboration results in the initial predictive model of interaction experience. For the progress component the
mechanism of emotional response generation works as follows: A comparison of the anticipated magnitude of progress
with the actual one results in the emotional response of elation if the actual magnitude is equal or greater than the

Next Media - a Tivit Programme
WP0 D4.1 AND D4.2
WP0 D0.4.1 AND D0.4.2 MEDIA EXPERIENCE
58 (74)
anticipated; otherwise the emotional response will be disappointment (according to Mellers et al. 1999, 2001). For the
effort component the mechanism is similar: A comparison of the anticipated magnitude of effort with the actual one
results in the emotional response of stress if the actual magnitude is equal or greater than the anticipated; otherwise the
emotional response will be relief.
Subjective interaction quality builds upon the initial predictive model of interaction experience and represents a
user’s overall evaluation of her or his interaction (and/or user) experience for activity.
In a first step of integration the framework considers both components of progress and effort as necessary. In
fact, given that people constantly perform cost/benefit tradeoffs during interaction, progress and effort form a ratio:
progress represents the numerator whereas effort represents the denominator. In general, a ratio value of around 1
indicates that progress and effort are about equal. Values significantly smaller than 1 indicate that effort is greater that
progress, and values significantly greater than 1 indicate that progress much higher than the invested effort.
Furthermore, for a single choice during interaction a user then evaluates in fact two cost benefit ratios (see Figure 15).
The first one is the ratio between the anticipated progress and effort whereas the second one is the ratio between the
progress and effort actually experienced by the user.
In a second step the framework then integrates the three choice classes by combining the single choice ratios into
a construct constituting a single action. Subjective interaction quality is then a user’s evaluated average of the resulting
emotions from the three choices, ultimately summed over all actions over the life-time of interaction during a task. Thus
the framework allows describing and predicting the quality of interaction with an interactive artifact.
Figure 15. Comparisons of anticipated and actual progress vs. effort within a single choice during interaction.
7.4.3. Interactivity
Theoretical background
During the last 15 years a number of researchers attempted to explain and define the terms interactive and
interactivity. Especially the latter notion received increased attention by the scientific community. However, scholars
discussing the topic noticed the differences in the various definitions along with the resulting confusion and arising

Next Media - a Tivit Programme
WP0 D4.1 AND D4.2
WP0 D0.4.1 AND D0.4.2 MEDIA EXPERIENCE
59 (74)
problems (e.g. Heeter, 1989; Newhagen, Cordes, & Levy, 1995; Steuer, 1992). Jensen (1998) points out the multi-
discursive nature of the concept interaction. Kiousis (2002) categorizes the literature according to where interactivity is
believed to exist by the authors.
The central questions of interactivity research are: Why do people evaluate various media as being differently
interactive? What are the determinants of these differences? What are the effects of interactivity? Scholars discussing
the notion of interactivity during the past two decades generally agree that the concept emerged along with new media
technologies. However, they also make note of the differences that exist in the various conceptualizations along with the
resulting confusion and arising problems (e.g. Downes & McMillan, 2000; Heeter, 1989; Newhagen, Cordes, & Levy,
1995; Steuer, 1992). Jensen (1998) classifies the various models dependent on the number of dimensions they provide
(one-, two-, three-, and n-dimensional models). Generally, interactivity can be understood having structural and
processual/experiential properties (Burgoon et al., 2002; Liu & Shrum, 2002). Kiousis (2002) categorizes the literature
according to where authors believe interactivity exists. He distinguishes three schools of thought according to which
interactivity is either a dynamic characteristic of information exchange in a given communication setting, a structural
attribute of technology, or a human perception.
As one of the pioneers investigating the concept, Rafaeli (1988) considers interactivity as “a process-related,
variable characteristic of communication settings” (p. 111). His formal definition of interactivity is based on message
exchange and involves relatedness: “interactivity is an expression of the extend that in a given series of communication
exchanges, any third (or later) transmission (or message) is related to the degree to which previous exchanges referred
to even earlier transmissions” (Rafaeli, 1988, p. 111). This third-order dependency is important as it addresses the
dynamic aspects of interactivity (Kiousis, 2002).
Technology-based definitions come from Steuer (1992), for example. He contributes a three-dimensional model
of interactivity in where the user is always in control. The speed, range, and mapping capabilities of a medium influence
the “extent to which users can participate in modifying the form and content of a mediated environment in real-time”
(1992, p. 84). Also Heeter’s (1989) six dimensions of interactivity derived from communication technologies belong to
the technology perspective. They are complexity of choice or selectivity, the “amount of effort users must exert to
access information” (Heeter, 1989, p. 222), responsiveness of the medium to the user, the monitoring of information use
by content and technology providers, the ease of adding information by the users, and the ability of a medium to
facilitate interpersonal communication.
Newhagen, Cordes, and Levy (1995) were among the first in introducing a perceptual-based definition of
interactivity. Described as a psychological state and linked to self-efficacy, users evaluate interactivity of a medium
based on the quality and quantity of feedback they get from the receiver after sending a message. The multi-dimensional
models of McMillan and others address the perceptual aspect of interactivity. Downes and McMillan (2000) identify six
dimensions of interactivity: direction of communication, time flexibility, sense of place, level of control,
responsiveness, and perceived purpose of. Later the model has been reduced offering three dimensions: direction of
communication, user control, and time (McMillan & Hwang, 2002).
Currently all models of the three intellectual perspectives fail to provide a solid explanation how interactivity can
be coherently understood in other contexts than their own. Thus, Kiousis (2002), for example, concludes that the true
nature of the term interactivity may be identified by “combining the cogent aspects of interactivity discussions from the
Next Media - a Tivit Programme
WP0 D4.1 AND D4.2
WP0 D0.4.1 AND D0.4.2 MEDIA EXPERIENCE
60 (74)
fields of communication, sociology, psychology, and computer science/design”. Most importantly, however, due to the
inherent vagueness of the models’ dimensions the creation of operationalisations, that is concrete influenceable or
measurable variables of the real world, has turned out to be difficult. As a result of this confusion and lack of clarity
only few studies exists that attempt to empirically verify the validity of models (e.g. Burgoon et al., 2002; Chung &
Zhao, 2004; Wu, 1999). If, their results reflect a too narrow focus (Sundar, 2003) or their validity may be questioned
(Cho & Leckenby, 1999).
Interactivity and Experience
Even though the theoretical discussion of interactivity has been the object of increasing interest during the last
two decades the concept is still under-theorized . All presented models are higher level models and thus do not support
researchers to study the notion in greater detail. In relation to the introduced conceptualizations of interactivity we point
out major problems in the following paragraphs.
First, none of the models or definitions is able to describe interactivity in its entirety. Even though Kiousis
(2002) offers a definition consisting of technological, communicative, and perceptual aspects, the model represents
merely a fusion of former definitions without specifying relations among them. Furthermore, the definition of Rafaeli
(1988) does not take into account the influences of technological variables, whereas the technological models do not
address user perceptions or cognitive properties. We argue that a deeper understanding of interactivity can only be
achieved if all three aspects and their relationships are considered.
Second, most of the models emphasize on real-time responsiveness of a medium or a system addressing its
capability of providing fast feedback to a user as a key dimension of interactivity. However, these issues are not
considered when the user seen as a creator of a message. It seems that user responsiveness to a message or a system is
assumed to happen mostly in real-time. The work a user has to perform in order to create a response is rarely
mentioned. Only Heeter (1989) considers dimensions such as the effort or the ease how users can access information
from or add new information to a medium or system. Based on that we argue that if we want to understand why people
evaluate various media and systems as being differently interactive then we have to consider also cognitive processes in
greater depth, such as judgment and decision making or message production (e.g. Green, 1997).
Finally, third, the inclusion of message production into the discussion of interactivity leads to the consideration
of interaction goals. In human-computer interaction (HCI) this has been a long tradition, for example in the area of task-
based user interface design, as goals or even goal hierarchies can be derived from given tasks using GOMS (John &
Kieras, 1996). Interestingly no studies are known to the authors that address interactivity and integrate or consider
explicitly the influences of goals. We argue that interactivity research would be enriched by the explicit inclusion of
goals and their influences.
Considering this problems we the take the position of Kiousis (2002) stating that the true nature of the term
interactivity may be identified by “combining the cogent aspects of interactivity discussions from the fields of
communication, sociology, psychology, and computer science/design.”
Next Media - a Tivit Programme
WP0 D4.1 AND D4.2
WP0 D0.4.1 AND D0.4.2 MEDIA EXPERIENCE
61 (74)
7.5. From sensory evaluation to mental impressions on media
Some experimental evidence shows that sensory perception and bodily sensations (such as those associated with
sitting comfortably on a cushioned chair, holding a warm cup of tea) can affect our feelings and attitudes (Niedenthal,
2007). Regarding the role of sensory perception in the context of media experience, consider the soft rustle of pages as
you browse through a magazine to the section of your interest, perhaps stopping along the way to gaze at an interesting
editorial picture or an advertisement that caught your attention. Various sensory attributes of the magazine (such as
smoothness, slipperiness and glossiness of the paper, colourfulness and sharpness of the pictures, as well as attributes
related to the visual design, and also the sound of the magazine when it is handled) interact to modify the overall
subjective media experience. The sensory attributes (which can be affected by the media producers and publishers via
factors such as paper choice and layout, for example) of the magazine shape the mental impressions associated with it,
and a given combination of sensory attributes can either strengthen or weaken desirable mental impressions, such as
trustworthiness.
In the case of new digital media or broadcast media the sensory attributes similarly shape the overall experience.
In these cases the set of applicable sensory attributes and the perceptual range of these attributes depend on the media
device as well as content.
One of the motivations for measuring sensory attributes is that often a relationship can be found between sensory
attributes and mental impressions associated with media products, and also between sensory attributes and technical or
creative variables of media devices and content. In some cases it is possible to describe these relationships with
mathematical functions fit to experimental data, making it feasible to simulate and predict the effects of different
variables on sensory attributes and further on higher-level cognitive and emotional experience dimensions. The
experience maps discussed below are a step in this direction, the aim being to extend them with further mathematical
modeling, enabling illustrative simulations of how different variables mold the sensory perception and higher-level
media experience.
Sensory attributes can thus be understood as an intermediate level between physical properties of the media
artifact and the higher-level cognitive and emotional experience dimensions. Color (as described by dimensions of
lightness, hue, and chroma) is an example of a sensory attribute whose effect has been widely studied from the points of
view of emotion, cognition, physiological response, human welfare, aesthetics, symbolism and cultural meanings in
diverse fields ranging from art and architecture to psychiatry (Birren, 1978).
Sensory evaluation methods can be used to define and compare sensory attribute profiles of given media
products. Multivariate statistical methods can be further used to analyse and describe how different sensory attributes
contribute to the mental impressions associated with the products.
The approach centred on what we call the experience map concept falls mostly under the discipline of
experimental psychology. Experimental setups are designed in which observers make judgments of perceived attributes
of media samples presented to them in a systematic manner. Statistical analysis of the raw judgment data from the
experiments allows numerical scales of perceptual attributes to be built and the location of the media samples on those
scales to be estimated. Sensory evaluation research tradition can be traced back to psychophysical theory. Gescheider
(1997) describes the fundamentals psychophysical measurement methods. While classic psychophysics studies the

Next Media - a Tivit Programme
WP0 D4.1 AND D4.2
WP0 D0.4.1 AND D0.4.2 MEDIA EXPERIENCE
62 (74)
perception of stimuli that vary along a single physically measurable dimension, the psychometric scaling methods, such
as Thurstone’s Law of Comparative Judgment (Thurstone, 1927), allow perceptual differences between (possibly
multivariate) stimuli to be measured without necessarily referring to the instrumentally measured physical differences
between the stimuli. Modern psychometrics is widely applied in the measurement of mental properties such as
intelligence, attitudes, and personality traits. The approach described in this section is closer to the fields of sensory
evaluation and image quality research. In these fields psychometric scaling methods are used to measure attributes of
physical objects (stimuli), as perceived by human observers.
Sensory evaluation is widely used in studying sensory perception of products such as foods, beverages,
cosmetics, or textiles. Closer to the topic of media experience is the sensory evaluation of paper products such as
printed media. Although the term ‘sensory evaluation’ is seldom used in the field of image quality research (‘subjective
assessment’ or ‘judgment’ being used instead), the methods in both fields are very similar, both being derived from the
classical psychophysics and psychometrics. Image quality includes the perception of moving images. When audio
quality is added to video quality, we are in the field of multimedia quality experience.
For the evaluation of printed products a set of sensory attributes that is well suited to describing the perceived
differences (at the level of sensory perception) resulting from the use of different materials (paper grades, printing inks,
etc.) and pre-press, printing, and finishing techniques has been relatively firmly established (Aikala et al. (2003) and
Civille et al. (1990) describe definition of tactile attributes for print media and other paper products, for instance). Some
of the visual attributes used in the evaluation of printed products are the same as those typically used with electronic
media. Moving images naturally add new dimensions to the visual perception (Winkler, 2005). Different display
techniques may further require new kinds of visual attributes to be used to account for the perceptual factors specific to
the particular technology. Typically these are display-technology specific image quality impairments (so-called
artifactual visual attributes). More work is needed to establish the necessary and sufficient sensory attributes for the
description of the new digital media. Stereoscopic display technologies used in 3D cinema and television, as well as in
3D lenticular prints, invoke stereoscopic vision, enhancing depth perception (but possibly also introducing visual
artifacts), and affecting dimensions such as presence, naturalness, and interestingness (Seuntiens, 2006; Hakala et al.,
2011). Other kinds of special techniques, such as metallic inks or special varnishing in printed products, can be used to
enrich the sensory perception and the overall experience (Laine et al., 2009, 2010)
Interactions between different senses, and also interactions between different sensory attributes within a single
since, are known to occur (see Fiore (1993) for an example in the context of sensory evaluation). Lindberg et al. (2009)
and Mensonen et al. (2010) discuss experimental approaches to both unimodal and multimodal evaluation of samples.
A number of different experimental methods can be used in sensory evaluation, the choice of method depending
on the nature of the media samples, the range of attribute variation within the sample set (for example, methods based
on confusion between observations are good for accurately analyzing small perceptual distances between media
samples but are unsuitable for large perceptual distances which are better handled with direct rating methods), and
available resources, among other things. Typically the observers rank order the media samples, or place the samples on
a ruler according to their perceived differences in the given sensory attribute, or judge the samples pair-wise. Usually an
interval scale is derived by analysis of the raw judgment data. The numerical differences on an interval scale correspond
to the perceived differences between the samples. With established evaluation procedures and a trained sensory

Next Media - a Tivit Programme
WP0 D4.1 AND D4.2
WP0 D0.4.1 AND D0.4.2 MEDIA EXPERIENCE
63 (74)
evaluation panel (a group of people selected trained to evaluate the given sensory attributes, according to the guidance
of standards ISO 8586-1 (1993) and ASTM committee E –97), the sensory evaluation can be performed relatively
efficiently. Same sensory attribute scales (no significant differences between the scales) can be obtained for the same
set of media samples from separate sensory evaluation studies with different panels, at different locations (but in
controlled conditions), and with different experimental methods. Meilgaard et al. (1999) provide an extensive
description of sensory evaluation techniques.
Sensory evaluation by itself does not reveal higher-level psychological dimensions involved in the subjective
media experience. In the experience map concept we combine the lower-level sensations to the higher-level mental
impressions associated with the media samples. In the psychometric scaling of mental impressions the observers
indicate how strongly they associate the given mental impression (an attribute such as trustworthiness, freshness, or
relaxedness) with the given media sample using a graphical rating scale.
The point of doing both sensory evaluations and the mental impression assessment is that regularly a connection
between the two can be found: typically differences in mental impressions evoked by the media samples can be fairly
well predicted by the sensory attributes (assuming the perceived differences arise from the physical differences between
the samples). When such a relationship can be found, it can be inferred that an increase or decrease in a given sensory
attribute can strengthen or weaken a certain kind of mental impression associated with the product. Further, the location
of a new sample on the experience map (and thus mental impressions associated with it) can be estimated based on
relatively efficient sensory evaluation. Further still, for some sensory attributes objective metrics can be found that can
predict the sensory attribute scale value based on instrumental measurements only.
In the experience map concept we use multivariate data reduction methods such as principal component analysis
(from the factor analysis family of methods traditionally used in psychometrics) in order to visualize the perceived
differences between media samples (see Jackson (2003) for a detailed description of principal component analysis).
Mensonen et al. (2010) provide an example of using the experience map approach to study the effect of sensory
attributes on the subjective evaluation of print media samples. For example, the experience map in Figure 16 for 9
media samples (red squares labelled with letters from A to I) with identical content but printed on different paper grades
illustrates the most significant perceived differences between the samples. The differences are shown both in terms of
selected sensory attributes (blue vectors ending in circles) and mental impressions associated with the samples in
subjective evaluation (green vectors ending in circles).For examples, media samples A and B differ from the other
samples mainly by feeling more stiff in the reader’s hands and appearing less colourful than the other samples. These
samples were also evaluated as being more trustworthy but less relaxed, for example, than the other samples.

Next Media - a Tivit Programme
WP0 D4.1 AND D4.2
WP0 D0.4.1 AND D0.4.2 MEDIA EXPERIENCE
64 (74)
Figure 16. An example of an experience map visualization, showing relative differences in sensory attributes and mental impressions associated with a set of printed media samples, each sample being printed on different paper
grade. (Mensonen et al., 2010).
The experience map visualization such as the one shown in Figure 13 should not be considered an end-point of
analysis. Rather, it can depict relationships in typically highly multivariate media experience data that would not be
readily apparent otherwise, and this can serve as a starting point for further analysis. This further analysis can involve
further investigation of individual perceptual scales, investigation of interactions between different variables
(perceptual, technological, and creative) by means of statistical analysis, and different kinds of visualizations to further
explore the data.
Sensory evaluation approach is well suited to studying the effects of the properties of the physical media artifact
on the media experience, and can be combined with subjective evaluation of media, as well as measures for the
emotional response. As such sensory evaluation does not cover the activities or practices in which people engage when
using media, or the social aspects or personal meaning associated with media. Ethnography, surveys and other audience
research approaches described elsewhere in this document provide access to the study of these aspects of media
experience. Sensory evaluation can be used in conjunction with these approaches as well. For instance, media
ethnography might reveal the values that a certain audience segment prioritizes when evaluating media in a given
context (a top-down approach); sensory evaluation (a bottom-up approach) could then provide information on how to
modify the media product to strengthen attributes associated with the identified values (by selecting the optimal paper
grade for a print magazine or modifying the layout of an electronic publication, for instance).
Outlining future extensions to the experience map approach, both quantitative and qualitative data obtained from
other kinds of methods could be used in conjunction of this kind of visualization. For instance, descriptive words from
interviews could be directly overlaid on the graph. Other quantitative experience scales could be plotted on the graph.
While above the perceptual effect of technical variables has been used as an example, the perceived variation to be
studied could also result from the creative decisions in the content creation and presentation (layout, color palette, etc.),

Next Media - a Tivit Programme
WP0 D4.1 AND D4.2
WP0 D0.4.1 AND D0.4.2 MEDIA EXPERIENCE
65 (74)
or from interactions between different kinds of variables. Consumer groups with different kinds of attitudes and values
could be identified and located on an experience map based on their preferences and attributes that they value in media
products in a given context. This would combine the experience map (showing perceived differences between media
samples) with the preference map concept (showing groups of people with different preferences). For example, specific
mental impression dimensions from subjective evaluation (say, trustworthiness and usefulness) could be factored from
the data and rotated to align with the horizontal and vertical axes of the graph for the sake of clarity. Media samples
could then be plotted in this diagram, along with consumer clusters with different preferences. Sensory attributes could
be included as vectors, as in the experience map example shown above, clearly illustrating their contribution to the
selected experience dimensions of interest. This would indicate in a straightforward manner how a given modification
of the sensory attributes would mold the media experience and whether this modification would make the given media
sample more or less preferable to a given group of consumers.
While in this section the emphasis has been on the measurement of sensory attributes, the possibilities for
mathematically modelling the relationships between various perceptual, technical or creative variables have been hinted
at. Multivariate statistical models fitted to the measured data would allow the interactions between different perceptual
attributes to be simulated, possibly providing a useful tool for the development of media products and services. Further,
in some instances it could be possible to use mathematical algorithms emulating sensory perception mechanisms to
predict and control the perception evoked by a certain instance of media. For example, Laine (2003) has experimented
with using colour appearance modelling to predict and control the perceived colour of pictures displayed on computer
monitors in varying ambient illumination conditions and also (Laine, 2000) to automatically adjust colour reproduction
so as to convey a feel of certain lighting conditions in photographs.
In summary, sensory evaluation can be used as a tool for benchmarking and development of media products
from the point of view of sensory perception. The experience map approach illustrates the relationships between
sensory attributes and subjective evaluation of media. Various paths are seen for extending and integrating the approach
with other methods.
7.6. User dimensions
7.6.1 Personality
Media preferences are likely to be subjective. Various factors such as upbringing, personal history, education
and social context are likely to contribute to this subjective component. In the present chapter, however, we discuss
findings on the relations between personality traits and media experience based on three psychological views:
Eysenck’s personality model, “Big Five” models of personality and the behavioural inhibition and activation (BIS/BAS)
model. The first two models and their putative associations with media preferences are illustrated in Figure 17. Both
models describe extensive personality traits that supposedly remain stable in an individual regardless of context or time
(Pervin, 2002). Given the long history of these models, well established self-rating scales exist for both.
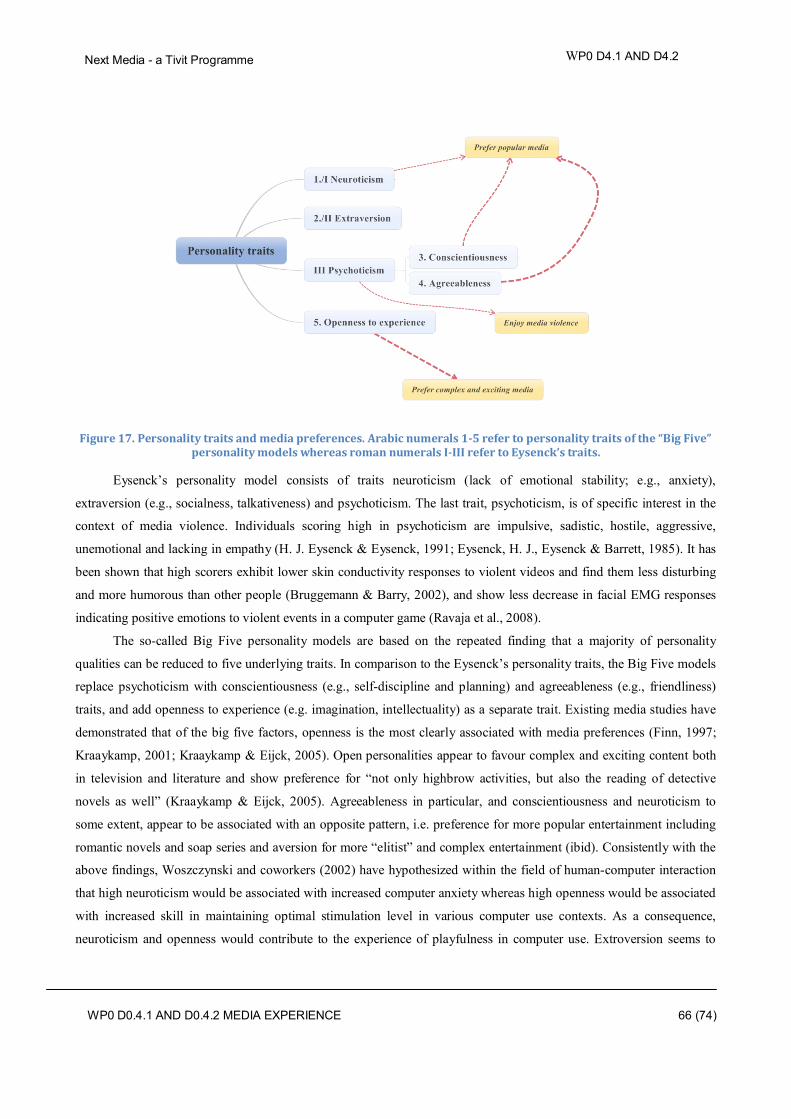
Next Media - a Tivit Programme
WP0 D4.1 AND D4.2
WP0 D0.4.1 AND D0.4.2 MEDIA EXPERIENCE
66 (74)
Figure 17. Personality traits and media preferences. Arabic numerals 1-5 refer to personality traits of the “Big Five”
personality models whereas roman numerals I-III refer to Eysenck’s traits.
Eysenck’s personality model consists of traits neuroticism (lack of emotional stability; e.g., anxiety),
extraversion (e.g., socialness, talkativeness) and psychoticism. The last trait, psychoticism, is of specific interest in the
context of media violence. Individuals scoring high in psychoticism are impulsive, sadistic, hostile, aggressive,
unemotional and lacking in empathy (H. J. Eysenck & Eysenck, 1991; Eysenck, H. J., Eysenck & Barrett, 1985). It has
been shown that high scorers exhibit lower skin conductivity responses to violent videos and find them less disturbing
and more humorous than other people (Bruggemann & Barry, 2002), and show less decrease in facial EMG responses
indicating positive emotions to violent events in a computer game (Ravaja et al., 2008).
The so-called Big Five personality models are based on the repeated finding that a majority of personality
qualities can be reduced to five underlying traits. In comparison to the Eysenck’s personality traits, the Big Five models
replace psychoticism with conscientiousness (e.g., self-discipline and planning) and agreeableness (e.g., friendliness)
traits, and add openness to experience (e.g. imagination, intellectuality) as a separate trait. Existing media studies have
demonstrated that of the big five factors, openness is the most clearly associated with media preferences (Finn, 1997;
Kraaykamp, 2001; Kraaykamp & Eijck, 2005). Open personalities appear to favour complex and exciting content both
in television and literature and show preference for “not only highbrow activities, but also the reading of detective
novels as well” (Kraaykamp & Eijck, 2005). Agreeableness in particular, and conscientiousness and neuroticism to
some extent, appear to be associated with an opposite pattern, i.e. preference for more popular entertainment including
romantic novels and soap series and aversion for more “elitist” and complex entertainment (ibid). Consistently with the
above findings, Woszczynski and coworkers (2002) have hypothesized within the field of human-computer interaction
that high neuroticism would be associated with increased computer anxiety whereas high openness would be associated
with increased skill in maintaining optimal stimulation level in various computer use contexts. As a consequence,
neuroticism and openness would contribute to the experience of playfulness in computer use. Extroversion seems to
Next Media - a Tivit Programme
WP0 D4.1 AND D4.2
WP0 D0.4.1 AND D0.4.2 MEDIA EXPERIENCE
67 (74)
have the least effect on media preferences; however, a study by Finn (1997) has suggested that higher extroversion is
associated with less time spent on recreational reading, television watching and radio listening.
Behavioural inhibition and behavioural activation systems (BIS/BAS) are considered as the two main
motivational brain systems underlying behaviour and affect (Gray 1982, 1991; Pickering & Gray, 1999). The BIS
system is assumed to regulate aversive motivation, is sensitive to signals of punishment, non-reward and novelty, and to
be associated with increased arousal and attention toward negative cues. The BAS system regulates appetitive
motivation, is sensitive to reward and non-punishment signals, directs attention toward the positive cue, and is
associated with greater proneness to experience positive feelings when exposed to cues of impending reward (Gray
1982, 1991; Pickering & Gray, 1999). The BIS and BAS systems have also been associated with the Negative
Activation and Positive Activation dimensions presented in Figure 14 (chapter 8.2 Emotions). Self-report scales have
been developed to assess individual differences in the sensitivities of these inhibitive and activating systems (Carver &
White, 1994).
Previous media studies have demonstrated that the BIS/BAS systems are of relevance for the experience of
media. For example, in a news reading study by Ravaja and Kallinen (2004), individuals scoring high in BAS
dimension showed higher interest ratings and facial EMG responses associated with positive emotions to news
messages that were presented with startling background music. That is, high-BAS individuals were more “excitable” to
external factors during news reading.
7.6.2. Values
An individual’s personal values are the qualities, traits, or principles that he or she finds important. Generally
speaking, values can be understood as a driving force behind a person’s goals, actions, and priorities, in life in general
and also in media use. Personal values are a relatively stable aspect of an individual’s mentality, but usually evolve
throughout life and are affected by experiences with immediate family, especially early in life, and other social contacts,
as well as the prevailing cultural values in the surrounding society. Strong life-changing experiences, such as traumatic
events, or changes in social status, may also affect an individual’s personal values.
Schwartz (1992) has conducted influential theoretical and experimental studies of personal values. He divides
the personal values, which were found to be similar to but not identical with cultural values, into ten categories
(motivational value types). Experimental data from 20 countries confirmed that people in a large number of cultures
implicitly distinguish these ten value types when assessing the importance of specific values as guiding principles in
their lives. The eleven potentially universal value types are (examples of single values primarily representing each value
type are given in parentheses): power (wealth, authority, social recognition), achievement (capable, successful,
influential), hedonism (pleasure, enjoying life), stimulation (an exciting life, a varied life, daring), self-direction
(freedom, creativity, curious), universalism (equality, social justice, protecting the environment), benevolence
(responsible, honest, loyal, meaning in life), tradition (respect for tradition, devout, humble), conformity (obedient, self-
discipline, politeness), and security (healthy, clean, sense of belonging).
Universal value structures postulated by Schwartz indicate relations of conflict and compatibility among values.
Value priorities or hierarchies, on the other hand, refer to the relative importance of values to individuals (or groups).
Next Media - a Tivit Programme
WP0 D4.1 AND D4.2
WP0 D0.4.1 AND D0.4.2 MEDIA EXPERIENCE
68 (74)
Schwartz (1992) conceptually defines values as follows: Values are concepts or beliefs, pertain to desirable end
states or behaviours, transcend specific situations, guide selection or evaluation of behaviour and events, and are
ordered by relative importance. Schwartz further proposes that values express goals, and can be seen to represent three
universal requirements of human existence: needs of individuals as biological organisms, requisites of coordinated
social interaction, and survival and welfare needs of groups.
Values can be understood to differ from attitudes by being more general or abstract and by having a hierarchical
ordering by importance. The difference between the concepts of trait and value is highlighted by the following example:
a person may find creativity important (a value) without being creative himself (a trait), while a creative person may put
little importance to creativity as a guiding principle.
From the media experience point of view, it is useful to think of values as those aspects of media experience to
which an individual (whether consciously or subconsciously) attributes at least moderate importance as criteria of
evaluation. The values that an individual emphasizes are likely to vary from one instance of media use to another. These
values may be more specific than the universal values discussed above. When reading, watching, or listening news,
trustworthiness or efficiency, for example, may be considered valuable, while pleasure, beauty, excitement, or challenge
may be attributed a lot of value when playing a game or watching a movie. Identification of significant values
associated with different types of media in different contexts (by different types of people) would allow the media
experience to be enhanced by emphasizing the desirable values associated with the media (assuming that the
corresponding aspects of media experience can be measured and analyzed, and their connection to the variables in
media production can be determined).
8. References
Aikala M., Nieminen S., Poropudas, L. & Seisto, A. (2003). The end user aspects in print product development. Proceedings of the 30th iarigai Conference, Dubrovnik, Croatia.
Amit, V. (1999). Introduction: Constructing the field. In V. Amit (Ed.), Constructing the field. Ethnographic fieldwork in the contemporary world (pp. 1-18). London, New York: Routledge.
Appel, V., Weinstein, S., & Weinstein, C. (1979). Brain activity and recall of TV advertising. Journal of Advertising Research, 19, 7–15.
ASTM committee E –97, ASTM Standard guide for selection, evaluation and training of observers. Barnett, L. (1990). Playfulness: Definition, design, and measurement. Play & Culture, 3, 319-336. Barnett, L. (2007). The nature of playfulness in young adults. Personality and Individual Differences, 43, 949-958. Basiloni, F. et al. (2007). Cortical activity and connectivity of human brain during the prisoner’s dilemma: an EEG
hyperscanning study. In Proc. 29th Annual International Conference of the IEEE EMBS, Lyon, France. Battarbee, K., & Koskinen, I. (2005). Co-experience: user experience as interaction. CoDesign, 1 (1), 5-18. Beauregard, R. & Corriveau, P. (2007). User Experience Quality: A Conceptual Framework. In: Duffy, V.G. (ed.) HCII
2007, LNCS, vol. 4561, pp. 325-332. Springer, Heidelberg, Germany. Beebe, J. (1995). Basic concepts and techniques of rapid appraisal. Human Organization, 54(1), 42-51. Beebe, J. (2001). Rapid assessment process: An introduction review. Walnut Creek, CA: AltaMira Press. Beyer, H., & Holtzblatt, K. (1997). Contextual Design: A Customer-Centered Approach to Systems Designs: San
Fransisco:Morgan Kaufman. Bhavnani, S.K. & John, B.E. (2000). The Strategic Use of Complex Computer Systems. Human Computer Interaction
15(2/3), 107-137. Biocca, F., Burgoon, J., Harms, C., & Stoner, M. (2001). Criteria and scope conditions for a theory and measure of
social presence. Paper presented at Presence 2001 Conference, Philadelphia, CA.

Next Media - a Tivit Programme
WP0 D4.1 AND D4.2
WP0 D0.4.1 AND D0.4.2 MEDIA EXPERIENCE
69 (74)
Biocca, F., Harms, C., & Gregg, J. (2001). The networked minds measure of social presence: Pilot test of the factor structure and concurrent validity. Paper presented at Presence 2001 Conference, Philadelphia, CA.
Birren, F (1978). Color and human response, John Wiley & Sons, U.S.A., 141 p. Bolls, P. D., Lang, A., & Potter, R. F. (2001). The effects of message valence and listener arousal on attention, memory,
and facial muscular responses to radio advertisements. Communication Research, 28, 627-651. Bradley, M. M., & Lang, P. J. (2000). Affective reactions to acoustic stimuli. Psychophysiology, 37, 204–215. Brakus, J. J., Schmitt, B. H., & Zarantonello, L. (2009). Brand experience: What is it? How is it measured? Does it
affect loyalty? Journal of Marketing, 73, 52-68. Brown, E., & Cairns, P. (2004). A grounded investigation of game immersion. In the proceedings of CHI 2004, ACM
Press, 1279-1300. Bruggemann, J. M., & Barry, R. J. (2002). Eysenck’s P as a modulator of affective and electrodermal responses to
violent and comic film. Personality and Individual Differences, 32, 1029–1048. Budiu, R. & Nielsen, J. (2010). Usability of iPad Apps and Websites. In: First Research Findings: Nielsen Norman
Group. Burgoon, J.K., Bonito, J.A., Ramirez, A., Jr., Dunbar, N.E., Kam, K., Fischer, J. (2002). Testing the Interactivity
Principle: Effects of Mediation, Propinquity, and Verbal and Nonverbal Modalities in Interpersonal Communication. Journal of Communication, Vol. 52, pp. 657-677.
Cacioppo, J. T., Gardner, W. L., Berntson, G. G. (1999). The affect system has parallel and integrative processing components: Form follows function. Journal of Personality and Social Psychology, 76(5), 839-855.
Carver, C. S., & White, T. L. (1994). Behavioral inhibition, behavioral activation, and affective responses to impending reward and punishment: The BIS/BAS scales. Journal of Personality and Social Psychology, 67, 319-333
Chambers, E. (2001). Applied ethnography. In N. K. Denzin & Y. Lincoln, S. (Eds.), Handbook of qualitative research. Second edition (pp. 851-869). Thousand Oaks; London; New Delhi: Sage.
Chambers, R. (1980). Rapid Rural Appraisal: Rationale and Repertoire Discussion Paper No.155. Brighton: Institute of Development Studies. Chichester: Columbia University Press.
Cho, C. & Leckenby, J. D. (1999). Interactivity as a Measure of Advertising Effectiveness: Antecedents and Consequences of Interactivity in Web Advertising. In: M. S. Roberts, (Ed.), Proceedings of the 1999 Conference of the American Academy of Advertising, Gainesville, FL: University of Florida, USA.
Chung, H. & Zhao, X. (2004). Effects of Perceived Interactivity on Web Site Preference and Memory: Role of Personal Motivation. Journal of Computer-Mediated Communication 10(1), 1-31.
Civille G.V., Dus C.A. (1990). Development of terminology to describe the handfeel properties of paper and fabrics, Journal of Sensory Studies 5 (1990), p. 19-32.
Cole, M. (1996). Cultural psychology. A once and future discipline. Cambridge, Mass., London: Belknap Press. Couldry, N., Livingstone, S., & Markham, T. (2010). Media consumption and public engagement. Beyond the
presumption of attention. New York: Palgrave MacMillan. Csikszentmihalyi, M. (1990). Flow: The Psychology of Optimal Experience. New York: Harper & Row. Curran, J. (2010). Technology Foretold. In N. Fenton (Ed.), New media, old news. Journalism & democracy in the
digital age (pp. 19-34). London: Sage. Delamont, S. (2004). Ethnography and participant observation. In C. G. Seale, G.; Gubrium, J. F.;. Silverman, D. (Ed.),
Qualitative Research Practice (pp. 217-229). London; Thousand Oaks; New Delhi: Sage. Dennett, D. C. (1987). The intentional stance. Cambridge, MA: The MIT Press. Deuze, M. (2006) .Participation, remediation, bricolage: Considering principal components of digital culture.
Information Society, 2(2), 63-75. Domingo, D. (2008). Interactivity in the daily routines of online newsrooms: Dealing with an uncomfortable myth.
Journal of Computer-Mediated Communication, 13, 680-704. Domingo, D., Quandt, T., Heinonen, A., Paulussen, S., Singer, J., & Vujnovic, M. (2008). Participatory journalism
practices in the media and beyond. An international comparative study of initiatives in online newspapers. Journalism Practice, 2(3), 327-342.
Downes, E.J., McMillan, S.J. (2000). Defining interactivity. A qualitative identification of key dimensions. New Media & Society, Vol. 2, pp. 157-179.
Dawson, M. E., Schell, A. M., & Filion, D. L. (2000). The electrodermal system. In J. T. Cacioppo, L. G. Tassinary, & G. G. Berntson (Eds.), Handbook of psychophysiology (2nd ed., pp. 200–223). New York: Cambridge University Press.
Ekman, P., Davidson, R. J., & Friesen, W. V. (1990). The Duchenne smile: Emotional expression and brain physiology II. Journal of Personality and Social Psychology, 58, 342–353.

Next Media - a Tivit Programme
WP0 D4.1 AND D4.2
WP0 D0.4.1 AND D0.4.2 MEDIA EXPERIENCE
70 (74)
Engeldrum, P. G. (2000). Psychometric Scaling: A Toolkit for Imaging Systems Development, Imcotek Press, U.S.A, 185 p.
Engeström, Y. (1987). Learning by expanding: An activity-theoretical approach to developmental work research. Helsinki: Orienta-Konsultit.
Erickson, P. (2003) Help or Hindrance? The History of the Book and Electronic Media, in Rethinking the Media Change The Aestetics of Transition: The MIT Press.
Eysenck, H. J., & Eysenck, S. B. G. (1991). Manual of the Eysenck personality scales. London: Hodder & Stoughton. Eysenck, S. B. G., Eysenck, H. J., & Barrett, P. (1985). A revised version of the Psychoticism Scale. Personality and
Individual Differences, 6, 21–29. Fiore, A. M. (1993). Multisensory Integration of Visual, Tactile, and Olfactory Aesthetic Cues of Appearance, Clothing
and Textiles Research Journal January 1993 vol. 11 no. 2, 45-52. Forlizzi, J. & Battarbee, K. (2004). Understanding experience in interactive systems. In: Proceedings of the 2004
conference on Designing Interactive Systems (DIS 04): processes, practices, methods, and techniques. New York: ACM.
Frascara, J. (1997) User-centred graphic design: mass communications and social change. London, Bristol Taylor & Francis.
Gescheider, G. A. (1997). Psychophysics: The Fundamentals, 3rd edition, Psychology Press, 448 p. Glynn, M., & Webster, J. (1992). The adult playfulness scale: an initial assessment. Psychological Reports, 71, 83-103. Grabe, M. E., Lang, A., Zhou, S., Bolls, P. D. (2000). Cognitive access to negatively arousing news: An experimental
investigation of the knowledge gap. Communication Research, 27, 3–26. Grabe, M.E. and Kamhawi, R. (2006) Hard wired for negative news? Gender differences in processing broadcast news.
Communication Research, 33 (5), 346-369. Gray, J. A. (1982), The neurophysiology of anxiety: An enquiry into the functions of the septohippocampal system.
New York: Oxford University Press. Gray, J. A. (1991). The neuropsychology of temperament. In J. Strelau & A. Angleitner (Eds.), Explorations in
temperament: International perspectives on theory and measurement (pp. 105-128). New York: Plenum Press. Gray, W.D., Sims, C.R., Fu, W., & Schoelles, M.J. (2006). The Soft Constraints Hypothesis: A Rational Analysis
Approach to Resource Allocation for Interactive Behavior. Psychological Review 113(3), 461-482. Green, J.O. (1997). A Second Generation Action Assembly Theory. In: Green, J.O. (ed.): Message Production.
Advances in Communication Theory. Lawrence Erlbaum Associates, pp. 151-170. Hakala, J., Nuutinen, M., Oittinen, P. (2011). Interestingness of stereoscopic images, In: Proceedings of SPIE, Vol.
7863, Stereoscopic Displays and Applications XXII, Editors: Andrew J. Woods; Nicolas S. Holliman; Neil A. Dodgson.
Hansel, S. (2006). As Internet TV aims at niche audiences, the slivercast is born. New York Times, March 12. Retrieved April 29, 2008, from http://www.nytimes.com/2006/03/12/business/yourmoney/12sliver.html.
Harms, C., Biocca, F. (2004). Internal consistency and reliability of the networked minds social presence measure. Paper presented at Presence 2004 Conference, Valencia, Spain.
Hassenzahl, M. (2001). The Effect of Perceived Hedonic Quality on Product Appealingness. International Journal Of Human–Computer Interaction, 3(4), pp. 481–99.
Hassenzahl, M. (2003). The Thing and I: Understanding the Relationship between User and Product. In: M.A. Blythe, K. Overbeeke, A.F. Monk, & P.C. Wright (Eds.), Funology – From Usability to Enjoyment (pp. 31-42). Dordrecht, the Netherlands: Kluwer Academic Publishers.
Hazlett, R. L., & Hazlett, S. Y. (1999). Emotional response to television commercials: Facial EMG vs. self-report. Journal of Advertising Research, 39, 7–23.
Heeter, C. (1989): Implications of New Interactive Technologies for Conceptualizing Communication. In: Salvaggio, J.L., Bryant J. (eds.): Media Use in the Information Age: Emerging Patterns of Adoption and Computer Use. Lawrence Erlbaum, Hillsdale, pp. 217–235.
Heikkila, H., Hytönen, K., Helle, M., Kallinen, K., Ravaja, N. & Kallenbach, J. (2011). eReading – Media Use, Experience & Adoption. NextMedia 2010 Final Report.
Helle, M. (2000). Disturbances and contradictions as tools for understanding work in the newsroom. Scandinavian Journal of Information systems, 12, 81-113.
Helle, M. (2009). Toimitustyön muutos ja sen etnografinen tutkimus. In E. Väliverronen (Ed.), Journalismi murroksessa (pp. 91-111). Helsinki: Gaudeamus.
Helle, M., & Töyry, M. (2007). Changing media concepts. Paper presented at the 18th Nordic Media Conference. Oslo 2007.

Next Media - a Tivit Programme
WP0 D4.1 AND D4.2
WP0 D0.4.1 AND D0.4.2 MEDIA EXPERIENCE
71 (74)
Helle, M., & Töyry, M. (2009a). Changing Journalistic Work Practices. In P. Oittinen & H. Saarelma (Eds.), Print Media - Principles, Processes and Quality (pp. 13-39). Helsinki: Paper Engineers' Association/Paperi ja Puu Oy.
Helle, M., & Töyry, M. (2009b). Media Concept as a Tool for Analyzing Change in Media. In P. Oittinen & H. Saarelma (Eds.), Print Media. Principles, Processes and Quality (pp. 497-530). Helsinki: Paper Association/Paperi ja Puu Oy.
Helle, Merja 2010. Toimitustyö muutoksessa. Toiminnan teoria ja mediakonseptin käsite tutkimuksen kehyksenä. Tampere: Tampere University Press. (Changing journalism. Activity Theory and media concept as frames for research).
Heller, S. (2006). Better skills through better research, in Design studies: theory and research in graphic design. New York: Princeton Architectural Press.
Hérault, J. (2010) Vision: Images, Signals, and Neural Networks – Models of Neural Processing in Visual Perception, World Scientific Publishing Co. Pte. Ltd., Singapore, 287 p.
Hodes, R., Cook, E. W. III, & Lang, P. J. (1985). Individual differences in autonomic response: conditioned association or conditioned fear? Psychophysiology, 22,545-560.
Hoffman, D.L., & Novak, T.P. (1996). Marketing in hypermedia computer-mediated environments: conceptual foundations. Journal of Marketing, 60(3), 50-68
Holden, & North (2006) and North, N (2008). Audience value across media: Beyond a mesure of exposure. Paper presented at the ESOMAR Worldwide Multimedia measurement Conference, Budapest, Hungary, June. (Cited in Napoli 2010).
Holtzblatt, K., & Jones, S. (1993). Contextual Inquiry: A participatory technique for system design. In D. Schuler & A. Namioka (Eds.), Participatory Desigßn: Principles and Practices (pp. 177-210). Hillsdale, New Jersey: Lawrence Erlbaum Associates.
Hommel, B. & Elsner, B. (2009). Acquisition, Representation, and Control of Action. In: Morsella, E. Bargh, J.A., & Gollwitzer, P.M. (Eds.). New York: Oxford University Press, pp. 371-398.
Hyysalo, S. (2006). Käyttäjätieto ja käyttäjätutkimuksen menetelmät. Helsinki: Edita. Ihlström-Eriksson, C., Åkesson, M., & Nordqvist, S. (2004). From print to web to e-paper – the challenge of designing
the e-newspaper. in 8th ICCC International Conference on Electronic Publishing. Brazil. Ilyenkov, E. (1977). Dialectical logic. Essays on its history and theory. Moscow: Progress. Im, Y.-H. (1997). Towards a labor-process history of newsworkers. Javnost/The Public, 4(1), 31-46. ISO 8586-1 (1993): Sensory analysis – General guidance for the selection, training and monitoring of assessors. Part 1:
Selected assessors. Jackson, J. E. (2003). A User’s guide to principal components. John Wiley & Sons, USA 2003, 569 p. Jenkins, H. (2008). Convergence culture. Where the old and new media collide. New York: New York University Press. Jensen, J.F. (1998). Interactivity: Tracing a New Concept in Media and Communication Studies. NordiCom Review 19,
185-204. John, B.M., Kieras, D.E. (1996). The GOMS Family of User Interface Analysis Techniques: Comparison and Contrast.
ACM Transactions on Computer-Human Interaction, Vol. 3, pp. 320-351. Jäncke, L. (1994). An EMG investigation of the coactivation of facial muscles during the presentation of affect-laden
stimuli. Journal of Psychophysiology, 8, 1-10. Kallenbach, J. (2009). Media Experience. In: Oittinen, P., Saarelma, H. (eds.), Print Media - Principles, Processes and
Quality. Helsinki, Paper Engineers' Association/Paperi ja Puu Oy, p. 372-410. Kallenbach, J. (2010). Users´ Experience of Interaction. Manuscript in preparation. Aalto University, School of Science. Keelan, W. (2002). Handbook of Image Quality: Characterization and Prediction, Marcel Dekker, Inc., U.S.A, 516 p. Keinonen, T. J., Vesa (Ed.). (2003). Tuotekonseptointi. Helsinki: Teknologiainfo Tenova Oy. Kiousis, S. (2002). Interactivity: a concept explication. New Media & Society 4(3), 355-383. Kraaykamp, G. (2001). Parents, personality and media preferences. Communications, 26(1), 15-38. Kraaykamp, G., & van Eijck, K. (2005). Personality, media preferences, and cultural participation. Personality and
Individual Differences, 38, 1675-1688. Kruger, 1995. The adult playfulness scale: A review. Psychology: A Journal of Human Behavior, 32, 36-38. Lacey, J. I., & Lacey, B. C. (1970). Some autonomic-central nervous system interrelationships. In P. Black (Ed.),
Physiological correlates of emotion (pp. 205–227). New York: Academic. Laine, J. (2003). Adapting softcopy color reproduction to ambient illumination, Journal of the Society for Information
Display. Vol. 11 (2003) No: 2, 359 – 369 Laine, J. S., Leppänen, T., Nurmi, O. (2009) Perception of printed special effects, Advances in Printing and Media
Technology, Vol. XXXVI: Proceedings of the 36th International Research Conference of iarigai, p. 91 -97.
Next Media - a Tivit Programme
WP0 D4.1 AND D4.2
WP0 D0.4.1 AND D0.4.2 MEDIA EXPERIENCE
72 (74)
Laine, J. S., Leppänen, T., Nurmi, O. (2010) The influence of special effects on the perception of printed product, Advances in Printing and Media Technology, Vol. XXXVII: Proceedings of the 37th International Research Conference of iarigai, p. 47 -54.
Laine, J., Saarelma, H. (2000). Illumination-Based Color Balance Adjustments, Proceedings of the 8th Color Imaging Conference. Scottsdale, AZ, US, 7 - 10 Nov. 2000. The Society for Imaging Science and Technology (IS&T), 202 – 206
Lamberg, J. (2005) Sanomalehden leipätekstin ladelman typogra nen analyysi Typogra sen mittaustavan arviointia toimialan haastatteluihin perustuen. Kymenlaakson ammattikorkeakoulu.
Lang, P. J. (1980). Behavioral treatment and bio-behavioral assessment: computer applications. In J. B. Sidowski, J. H. Johnson, & T. A. Williams (Eds.), Technology in mental health care delivery systems (pp. 119-l 37). Norwood, NJ: Ablex.
Lang, A., Zhou, S., Schwartz, N., Bolls, P. D.,&Potter, R. F. (2000). The effects of edits on arousal, attention, and memory for television messages: When an edit is an edit can an edit be too much? Journal of Broadcasting & Electronic Media, 44, 94–109.
Lang, P. J. (1994). Measuring emotion: The self-assessment manikin and the semantic differential. Journal of Behavior Therapy and Experimental Psychiatry, 25(1), 49-59.
Lang, P. J., Bradley, M. M., & Cuthbert, B. N. (1990). Emotion, attention, and the startle reflex. Psychological Review, 97, 377–395.
Lang, P. J., Greenwald, M. K., Bradley, M. M., & Hamm, A. O. (1993). Looking at pictures: affective, facial, visceral, and behavioral reactions. Psychophysiology, 30, 261-273.
Larsen, R. J., & Diener, E. (1992). Promises and problems with the circumplex model of emotion. In M. Clark (Ed.), Review of personality and social psychology (Vol. 13), (pp. 25–59). Newbury Park, CA: Sage.
Lee, K. M. (2004). Presence, explicated. Communication Theory, 14(1), 27-50. Leontjev, A. N. (1978). Activity, consciousness, and personality. Englewood Cliffs: Prentice-Hall. Lessiter, J., Freeman, J., Keogh, E., & Davidoff, J. (2001). A cross-media presence questionnaire: The ITC-sense of
presence inventory. Presence, 10(3), 282-297. Lidwell, W., Holden, K., and Butler, J. (2010) Universal principles of design: 125 ways to enhance usability, influence
perception, increase appeal, make better design decisions, and teach through design. Beverly, Mass.: Rockport.
Lindberg, S., Kihlstedt, A. (2009) A product semantic study of the influence of touch and vision on the evaluation of different paper grades, Advances in Printing and Media Technology, Vol. XXXVI: Proceedings of the 36th International Research Conference of iarigai.
Liu, Y., Shrum, L.J. (2002). What Is Interactivity and Is It Always Such a Good Thing? Implications of Definition, Person, and Situation for the Influence of Interactivity on Advertising Effectiveness. Journal of Advertising, Vol. XXXI, pp. 53-64.
Lombard, M., & Ditton, T. (1997). At the heart of it all: The concept of presence. Journal of Computer Mediated Communication [Online], 3(2). URL: http://jcmc.indiana.edu/vol3/issue2/lombard.html
McCarthy, J., & Wright, P. (2004). Technology as Experience. Interactions, 11(5), 42-43. McMahan, A. (2003). Immersion, Engagement, and Presence. In The Video Game Theory Reader, Wolf, M. J. P , &
Perron, P. (Eds.). New York: Routledge. McMillan, S.J. & Hwang, J.-S. (2002). Measures of Perceived Interactivity: An Exploration of the Role of direction of
Communication, User Control, and Time in Shaping Perceptions of Interactivity. Journal of Advertising Research, Vol. XXXI, 29-42.
Meilgaard, M., Civille, G. V., Carr, B. T. (1999). Sensory Evaluation Techniques, CRC Press, U.S.A., 387 p. Mellers, B., Schwartz, A., & Ritov, I. (1999). Emotion-Based Choice. Journal of Experimental Psychology: General
128(3), 332-345. Mellers, B.A. & McGraw, A.P. (2001). Anticipated Emotions as Guides to Choice. Current Directions in Psychological
Science 10(6), 210-214. Mensonen., A. Aikala, M.., Laine, J. (2010) Multisensory evaluation of paper products, Advances in Printing and Media
Technology, Vol. XXXVII: Proceedings of the 37th International Research Conference of iarigai, p. 41-46 Millen, D. (2000). Rapid ethnography: Time deepening strategies for HCI. Proceedings of the ACM 2000, 280-286. Monk, A. (1998). Cyclic interaction: a unitary approach to intention, action and the environment. Cognition, 68(2), 95-
110. Mulholland, T. (1978). A program for the EEG study of attention in visual communication. In B. S. Randhawa & W. E.
Coffman (Eds.), Visual learning, thinking and communication (pp. 77–92). New York: Academic Press.

Next Media - a Tivit Programme
WP0 D4.1 AND D4.2
WP0 D0.4.1 AND D0.4.2 MEDIA EXPERIENCE
73 (74)
Murray, J. (1997). Hamlet on the Holodeck: The Future of Narrative in Cyberspace. Cambridge, MA: The MIT Press, 98-99. Cited from McMahan (2003).
Myers, B. (1998) A Brief History of Human Computer Interaction Technology. ACM Interactions, 5 (2): 44–54. Napoli, P. (2003). Audience economics. Media institutions and the audience marketplace. New York: Columbia
University Press. Napoli, P. (2010a). Audience evolution. New technologies and the transformation of media audiences. New York:
Columbia University Press. Napoli, P. (2010b). Revisiting ‘mass communication’and the ‘work’ of the audience in the new media environment.
Media, Culture & Society, 32(3), 505-516. Negroponte, N. (1996). Being digital. New York: Vintage Books. Newhagen, J.E., Cordes, J.W., & Levy, M.R. (1995). [email protected]: Audience Scope and the Perception of
Interactivity in Viewer Mail on the Internet. Journal of Communication 45(3), 164–175. Niedenthal, P. (2007). Embodying Emotion, Science, Vol. 316, p. 1002-1005. Nielsen, J. (1994). Usability engineering. San Francisco, Calif.: Morgan Kaufmann Publishers. Norman, D. A. (1988) The Psychology of Everyday Things: Basic Books. Norman, D. A. (1990) The design of everyday things. New York: Doubleday. Novak, T. P., & Hoffman, D. L. (1997). Measuring the flow among web users. Paper presented at Interval Research
Corporation, July 31, 1997. Novak, T. P., Hoffman, D. L., & Duhachek, A. (2003). The Influence of Goal-Directed and Experiential Activities on
Online Flow Experiences. Journal of Consumer Psychology, 13(1&2), 3-16. Oatley, K., Keltner, D., Jenkins, J. M. (2006). Understanding emotions (2nd edition). Oxford, UK: Blackwell
Publishing. Ohme, R., Reykowska, D., Wiener, D., and Choromanska, A. (2010) Application of frontal EEG asymmetry to
advertising research. Journal of Economic Psychology, 31, 785-793. O´Leary, B. (2011) Context first: A unified field theory of publishing, in TOC 2011. NYC. Palomba, D., Sarlo, M., Angrilli, A., Mini, A., & Stegagno, L. (2000). Cardiac responses associated with affective
processing of unpleasant film stimuli. International Journal of Psychophysiology, 36, 45–57. Payne, S. J. (1991). Display-based action at the user interface. International Journal of Man-Machine Studies 35, 275-
289. Payne, S.J., Howes, A., & Reader, W.R. (2001). Adaptively distributing cognition: a decision-making perspective on
human-computer interaction. Behaviour & Information Technology 20(5), 339-346. Perez, C. (2005). Respecialization and the deployment of the ICT pradigm. An essay on the present challenges of
globalisation. In R. Compano (Ed.), The Future of the information society in Europe: Contributions to the debate. Brussels: European Comission, Joint Reserch Center and Institute for Prospective Technological Studies.
Pervin, L. (2002). The science of personality. Oxford University Press. Pickering, A. D. & Gray, J. A. (1999). The neuroscience of personality. In L. A. Pervin & O. P. John (Eds.), Handbook
of personality: Theory and research (2nd e., pp. 277-299). New York: The Guilford Press. Pietilä, K. (2005). The Readability And Usability Of eBooks. Helsinki University Of Technology. Pisano, G. (1997). The development factory. Unlocking the potential of process innovation. Cambridge, MA: Harvard
Business School Press. Plutchik, R. (2002). Emotions and life: Perspectives from psychology, biology, and evolution. American Psychological
Association. Poels, K., de Kort, Y., Ijsselsteijn, W. (2006). The fun of gaming: Measuring the human experience of media
enjoyment. Technical report to FUGA STREP / NEST-PATH. Deliverable D3.3. Porges, S.W. (1991). Vagal tone: An autonomic mediator of affect. In J. Garber & K. A. Dodge (Eds.), The
development of emotion regulation and dysregulation (pp. 111–128). Cambridge, UK: Cambridge University Press.
Posner, J., Russell, J. A., & Petersen, B. S. (2005). The circumplex model of affect: an integrative approach to affective neuroscience, cognitive development, and psychopathology. Development and Psychopathology, 17(3), 715-734.
Potter, R. F. (2000). The effects of voice changes on orienting and immediate cognitive overload in radio listeners. Media Psychology, 2, 147–177.
Pulkkinen, H. (2007). Uutisten arkkitehtuuri – sanomalehden ulkoasun rakenteiden järjestys ja jousto. Jyväskylä: Jyväskylän yliopisto.

Next Media - a Tivit Programme
WP0 D4.1 AND D4.2
WP0 D0.4.1 AND D0.4.2 MEDIA EXPERIENCE
74 (74)
Rafaeli, S. (1988). Interactivity: From New Media to Communication. In: Hawkins, R.P., Wieman, J.M., Pingree, S. (eds.): Advancing Communication Science: Merging Mass and Interpersonal Processes. Sage, Newbury Park, USA, pp. 110-134.
Ravaja, N. (2004a). Contributions of psychophysiology to media research: Review and recommendations. Media Psychology, 6, 193-235.
Ravaja, N. (2004b). Effects of small talking facial image on autonomic activity: the moderating influence of dispositional BIS and BAS sensitivities and emotions. Biological Psychology, 65, 163-183.
Ravaja, N., & Kallinen, K. (2004). Emotional effects of startling background music during reading news reports: the moderating influence of dispositional BIS and BAS sensitivities. Scandinavian Journal of Psychology, 45, 231-238.
Ravaja, N., Kallinen, K., Saari, T., Keltikangas-Järvinen, L. (2004). Suboptimal exposure to facial expressions when viewing video messages from a small screen: effects on emotion, attention and, memory. Journal of Experimental Psychology: Applied, 10(2), 120-131.
Ravaja, N., Saari, T., Turpeinen, M., Laarni, J., Salminen, M., & Kivikangas, M. (2006). Spatial presence and emotions during video game playing: does it matter with whom you play? Presence, 15 (4), 381-392.
Reeves, B., Thorson, E., Rothschild, M., McDonald, D., Hirsch, J., & Goldstein, R. (1985). Attention to television: Intrastimulus effects of movement and scene changes on alpha variation over time. International Journal of Neuroscience, 25, 241–255.
Russell, J. A. (1980). A circumplex model of affect. Journal of Personality and Social Psychology, 39(6), 1161-1178. Russell, J. A. (2003). Core affect and the psychological construction of emotion. Psychological Review, 110(1), 145-
172. Ryu, H & Monk, A. (2009). Interaction Unit Analysis: A New Interaction Design Framework. Human-Computer
Interaction 24(4), pp. 367-407. Scherer, K. R. (1999). Appraisal theory. Chapter 30 in Handbook of Cognition and Emotion (eds T. Dalgleish & M.
Power), John Wiley & Sons Ltd. Schwartz, S.H. (1992) Universals in the content and structure of values: Theoretical advances and empirical tests in 20
countries. In Zanna M.P. (Ed.), Advances in experimental social psychology 25, 1-65. New York: Academic Press.
Seuntiens, P. J.H. (2006). Viewing experience of 3D TV, Doctoral Thesis, Technische Universiteit Eindhoven, 135 p. Sherry, J. L. (2004). Flow and media enjoyment. Communication Theory, 14(4), 328–347. Shin, D. H. (2011). Understanding e-book users: Uses and gratification expectancy model. New Media & Society 13(2)
260–78. Shneiderman, B. and Plaisant, C. (2005) Designing the user interface: strategies for effective human-computer
interaction. Boston: Pearson/Addison Wesley. Simons, R.F., Detenber, B.H., Cuthbert, B.N., Schwartz, D.D., and Reiss (2003) Attention to television: Alpha power
and its relationship to image motion and emotional content. Media Psychology, 5, 283-301. Steuer, J. (1992). Defining virtual reality: Dimensions Determining Telepresence. Journal of Communication, 42(4), 73-
93. Storbeck, J., Robinson, M.D., & McCourt, M.E. (2006). Semantic Processing Precedes Affect Retrieval: The
Neurological Case for Cognitive Primacy in Visual Processing. Review of General Psychology 10(1), 41-55. Sundar, S.S., Kalyanaraman, S., & Brown, J., (2003). Explicating Web Site Interactivity. Communication Research,
30(1), 30-59. Thorson, E., & Lang, A. (1992). The effects of television videographics and lecture familiarity on adult cardiac
orienting responses and memory. Communication Research, 19, 346–369. Thurman, N., & (2011). Making "The Daily Me". Technology, economics and habit in the mainstream assimilation of
personalization of news. To be published in 2011 Journalism: Theory and Practice & Criticism Journalism: Theory and Practice & Criticism, 12(4).
Thurstone, L. L. (1927), A law of comparative judgment, Psychological Review, Vol 34(4), Jul 1927, 273-286. Tononi, G., Koch, C. (2008). The Neural Correlates of Consciousness - An Update. Ann. N.Y. Acad. Sci., 1124 . pp.
239-261. Tullis, T. and Albert, B. (2008) Measuring the User Experience: Collecting, Analyzing, and Presenting Usability
Metrics. Morgan Kauffman Publ. Turner, J.R. (1994) Cardiovascular Reactivity and Stress: Patterns of Physiological Response. New York: Plenum. Töyry, M. (2005). Varhaiset naisten lehdet ja naisten elämä. Neuvotteluja lukijasuhteesta. . Helsinki: Helsingin
Yliopisto.
Next Media - a Tivit Programme
WP0 D4.1 AND D4.2
WP0 D0.4.1 AND D0.4.2 MEDIA EXPERIENCE
75 (74)
Vorderer, P., et al. (2004). Development of the MEC Spatial Presence Questionnaire (MEC-SPQ). Technical report to the European Community IST Programme “Presence Research Activities”. Initiative Deliverable D5.
Wandell, B. A. (1995). Foundations of Vision, Sinauer Associates, Inc., U.S.A, 476 p. Ward, R. and Marsden, P. (2003) Physiological responses to different WEB page designs. International Journal of
Human-Computer Studies, 59: 199-212. Watson, D., & Tellegen, A. (1985). Toward a consensual structure of mood. Psychological Bulletin, 98, 219–235. Watson, D., Wiese, D., Vaidya, J., & Tellegen, A. (1999). The two general activation systems of affect: Structural
findings, evolutionary considerations, and psychobiological evidence. Journal of Personality and Social Psychology, 76, 820–838.
Wilson (2008). Understanding media users. From theory to practice. Chichester: Wiley-Blackwell. Winkler, S.(2005). Digital video quality: vision models and metrics, John Wiley & Sons Ltd., England, 175 p. Witvliet, C. V. O., & Vrana, S. R. (1995). Psychophysiological responses as indices of affective dimensions.
Psychophysiology, 32, 436-443. Woszczynski, A. B., Roth, P. L., & Segars, A. H. (2002). Exploring the theoretical foundations of playfulness in
computer interactions. Computers in Human Behavior, 18, 369-388.Battarbee K. (2003). Defining Co-experience. In: Proceedings of the 2003 international conference on Designing pleasurable products and interfaces (DPPI’03), Pittsburgh, PA, USA. New York: ACM Press.
Wright, P. McCarthy, J., & Meekison, L. (2003). Making Sense of Experience. In: M.A. Blythe, K. Overbeeke, A.F. Monk, & P.C. Wright (Eds.), Funology – From Usability to Enjoyment (pp. 43-53). Dordrecht, the Netherlands: Kluwer Academic Publishers.
Wu, G. (1999). Perceived Interactivity and Attitude Toward Websites. Paper presented at the American Academy of Advertising annual conference, Albuquerque, NM, USA.