AN OVERVIEW ON PLANNING AND MANAGEMENT OF RURAL WATER SUPPLY—A CASE STUDY
Upload
khangminh22Category
view
2download
0
1
Independent Verification of the
Information provided by the State of
Punjab to Rank the States on a
Devolution Index (DI)
SUBMITTED TO
INDIAN INSTITUTE OF PUBLIC ADMINISTRATION (IIPA) NEW DELHI
SUBMITTED BY
CENTRE FOR RURAL MANAGEMENT (CRM)
KOTTAYAM, KERALA
February 2013

2
Independent Verification of the Information provided
by the State of Punjab to Rank the States on a
Devolution Index (DI)
CONTENT Abstract 5
Introduction 7
Approach & Methodology 8
Devolution in Punjab 10
Gram Sabha 16
District Planning Committee 18
Capacity Building Framework 18
Infrastructure& Other Facilities 21
Transparency and Anti- Corruption 22
Social Audit 22
Parallel Bodies 23
Autonomy of the Panchayats 23
National Finance Commission 25
State Finance Commission. 26
Functions of the Panchayats 27
Centrally sponsored Schemes and State Schemes 28
Panchayat Finance 28
Conclusion 42

3
Independent Verification of the Information provided
by the State of Punjab to Rank the States on a
Devolution Index (DI)
CONTENT TABLE Table No. 1: Total amount received by one each sample Panchayats (Gram Panchayat, Panchayat Samithi and Zilla Parishad) from National Finance
Commission Award
26
Table No. 2: Fund Availability with Panchayats in the State (Rs. in Lakhs) 31
Table No. 3: Available Fund of Kherakalan (Sample) Gram Panchayat 36
Table No.5: Available Fund of Mansa (Sample)Panchayat Samithi 38
Table No.6: Expenditure Details of Mansa (Sample)Panchayat Samithi 39
Table No.7: Fund Available of Mansa (Sample)Zilla Parisha 41
Table No.8: Expenditure Details of Mansa (Sample)Zilla Parishad 42
Annexure 1: Details of Gram Sabha of the Selected Gram Panchayats 44
Annexure No. 2 : Details of NFC of the Selected Gram Panchayat 45
Annexure No.3: Details of NFC of the Selected Panchayat Samithi 46
Annexure No.4: Details of NFC of the Selected Zilla Parishad 47
Annexure No. 5: Details on Available Fund from different sources and expenditure
of the selected 10 Gram Panchayats in Punjab for the year 2010-11
47
Annexure No. 6: Details on Available Fund from different sources and expenditure
of the selected 10 Gram Panchayats in Punjab for the year 2011-12
Annexure No. 7: Details on Available Fund from different sources of the selected
Panchayat Samiti in Punjab for the year 2010-11
48
Annexure No. 8: Details on Available Fund from different sources of the selected
Panchayat Samiti in Punjab for the year 2011-12
48
Annexure No. 9: Details on Expenditure from different sources of the selected
Panchayat Samiti in Punjab for the year 2010-11
49
Annexure No. 10: Details on Expenditure from different sources of the selected
Panchayat Samiti in Punjab for the year 2011-12
49
Annexure No. 11: Details on Available Fund from different sources of the selected
two Zilla Parishad in Punjab for the year 2010-11
49
Annexure No. 12: Details on Available Fund from different sources of the selected
two Zilla Parishad in Punjab for the year 2011-12
50
Annexure No. 13: Details on expenditure of the selected two Zilla Parishad in Punjab
for the year 2010-11
50
Annexure No. 14: Details on expenditure of the selected two Zilla Parishad in Punjab
for the year 2011-12
50
Annexure No. 15: Infrastructure Facilities 50
Annexure No. 16: Physical Infrastructure Panchayat Samithi(Punjab) 51

4
Independent Verification of the Information provided by the
State of Punjab to Rank the States on a Devolution Index (DI)
CONTENT DIAGRAM Diagram No. 1: Participation of the Training program by the Panchayat Functionaries
of Gram Panchayat
19
Diagram No.2: Participation of the Training program by the Panchayath Functionaries
of Panchayat Samithi
20
Diagram No.3: Participation of the Training program by the Panchayath Functionaries
of Zilla Parishad
20
Diagram No.4: Item Wise Comparison of Available Fund with Gram Panchayat in
2010-11
30
Diagram No.5: Item Wise Comparison of Available Fund with Gram Panchayat in
2011-12
31
Diagram No.6: Fund Availability with Panchayats in the State for two Consecutive
Financial Years (Rs. in Lakhs)
32
Diagram No. 7: Average Fund Availability of Kherakalan(Sample ) Gram Panchayat 35
Diagram No. 8: Comparison of Fund Availability of Kherakalan (Sample ) Gram
Panchayat in 2010-11 and 2011-12 (Rs.in lakhs)
35
Diagram No. 9: Average Expenditure of Kherakalan(Sample ) Gram Panchayat 36
Diagram No. 10: Comparison of Expenditure of Kherakalan (Sample) Gram
Panchayat in 2010-11 and 2011-12 (Rs.in lakhs)
36
Diagram No. 11: Average Fund Available of Mansa (Sample)Panchayat Samithi 37
Diagram No. 12: Comparison of Fund Available of Mansa (Sample)Panchayat
Samithi in 2010-11 and 2011-12 (Rs.in lakhs)
38
Diagram No. 13: Average Expenditure of Mansa (Sample)Panchayat Samithi 39
Diagram No. 14: Comparison of Expenditure of Mansa (Sample)Panchayat Samithi in
2010-11 and 2011-12 (Rs.in lakhs)
39
Diagram No. 15: Average Fund Available of Mansa (Sample)Zilla Parishad 40
Diagram No. 16: Comparison of Fund Available of Mansa (Sample) Zilla Parishad in
2010-11 and 2011-12 (Rs.in lakhs)
40
Diagram No. 17: Average Expenditure of Mansa (Sample)Zilla Parishad 41
Diagram No. 18: Comparison of Expenditure of Mansa (Sample) Zilla Parishad in
2010-11 and 2011-12 (Rs.in lakhs)
41

5
Abstract
The verification brings out the extent of devolution carried out by the State of Punjab
in the recent years. It shows the current dynamics in devolution of power, finances,
functions and functionaries in the existing three tier system of Panchayati Raj in the
State. The process of decentralization in Punjab has not kept pace with many other
States and that devolution in Punjab is thriving to build successful models.
The primary objective that is the framework Criteria had been fulfilled. Some of the
major achievements include the formation of Election Commission, State Finance
Commission and The District Planning Committee. The rate of participation in the
Gram Sabhas is good. Since it is an agrarian society the two Gram Sabha meetings are
related to the agriculture seasonality of the State. However it is to be noted that no
finance is being provided by the State to convene Gram Sabhas. Even though the
DPCs are constituted none of them have submitted the district plans. The State has its
own capacity building framework to train the elected representatives and officials of
the Panchayats which in turn had positive results. The field verification shows that
majority of the functionaries (both elected representatives and officials) from the
selected Panchayats had undergone training on different subjects during last two
years.
As far as the physical infrastructure the State have to move a long way. Only 48.12
per cent of the Gram Panchayats are having proper building (ghar) .All facilities of e-
connectivity are totally absent in the Gram Panchayats .The absence of an institutional
mechanism to undertake the complaints of Panchayats other than government agency
is a major lacuna in the area of transparency and anti-corruption in the State. The
institutions of Panchayat Ombudsman and Lokayukta are yet to be introduced in the
State. Social audit is also in a rudimentary stage in the State and is conducted only in
the domain of MGNREGA at the Gram Sabha meetings under the supervision of
Panchayat Samitis. The parallel bodies exist both at the village and the district level in
the State. Many sections in the State Act may create impediments in the autonomy of
Panchayats.

6
The funds are timely released based on the recommendations from the National
Finance Commission (NFC) and the fund flow to the Panchayats is stable. The PRI’s
are not receiving any SFC grant owing legal issues. Electronic transfer system of
funds has yet to be introduced in the State.
It is to be stated that decentralized planning for socio economic development and
social justice in its complete sense has not fully evolved in the State of Punjab. The
decentralization and devolution process is still in its initial stages. It is high time to
clear all the backlogs and address the existing gaps. A new approach is to be
formulated in this regard which would help in taking forward the decentralization
process and will help in evolving a new dynamics in local self governance. It could,
however, be concluded by stating that the information provided by the State is clear,
legible and authentic.

7
STATUS PAPER ON DEVOLUTION IN PUNJAB
Introduction
The local self governments are the best instruments for democratic decentralization in
India. The Panchayati Raj system has occupied an important role in the democratic
system of India. The 73rd amendment of the Constitution marks a major change t in
the history of democratic decentralization in India. It was after the 73rd amendment
that the institutions of Panchayati Raj became systematic and devolution of power
could be seen penetrating to the lower rungs of administration. Such type of
democratic decentralization creates better administration and developmental
perspectives resulting in for quick rural development through effective local
participation.
The Panchayat System in Punjab dates back to the 1912 which was substantially
expanded there after. With the 73rd Constitutional Amendment Act, 1992, the state
government enacted, the Punjab Panchayati Raj Act, which replaced the Gram
Panchayat Act in Punjab. The Act has endowed Panchayats with powers and
authority necessary to enable them to function as institutions of self-government. The
PRIs in Punjab comprised of three institutions namely gram Panchayats, Panchayat
samitis and zilla parishads. After the 73rd Constitutional amendment, State
Governments are devolving functions, functionaries and funds to PRIs in order to
enable them to function as an effective self-government. The Government of Punjab,
in January 2004, through a notification transferred six departments to local self-
government. The distribution of functions among the three tiers of PRIs also varies
from state to state.
It is observed that devolution and decentralization process is still in its initial stages in
Punjab and it is noticed that the line department functionaries still continue to exercise
power and authority. An overlap in the functions of three different tiers of PRIs i.e.
could be noticed. The Punjab Panchayati Raj Act, 1994, envisaged that the Panchayat
secretaries should act under the control of Panchayats. The Panchayat secretaries,

8
however, are posted at the Panchayat samiti headquarters and do not consider
themselves as employees of the Panchayats. One Panchayat secretary has to deal with
four to five villages.
The Panchayats are the grass root democratic institutions and need to be further
empowered through effective devolution of functions, finances and functionaries. This
asks for an evaluation of the current devolution status and the existing gaps, the
fulfillment of which will result in a sound Panchayati Raj System. This should also be
read in the context of the Panchayat Empowerment and Accountability Incentive
Scheme (PEAIS) and the devolution index.
Hence, for assessing the existing devolution pattern and for finding the inherent gaps,
creation of a set of parameters and indicators becomes necessary. This would result in
a Panchayat strengthening index. It is in the above context that a verification
procedure is envisaged and the assignment will attempt to analyze the overall
processes and dimensions of the local self governance and decentralization. The
verification assignment is intended to support the Panchayat strengthening index and
to certify the status of development in Punjab.
Approach & Methodology
The Indian Institute of Public Administration (IIPA) was consulted for working out
the sample size and as such the State of Punjab was selected for the proposed
assignment. A minimum sample of 10 Gram Panchayats, five Panchayat Samitis and
two Zilla Parishads were covered for the assignment. Steps were taken to collect
relevant information from the officials at the State headquarters. The opinion of the
officials at the higher levels was taken and their suggestions were considered in the
selection of Panchayats for the verification.
Panchayats which stood in a moderate range in terms of its performance were selected
as suggested by the Officials. The sample Panchayats considered were by and large
‘representative in nature’ despite the smaller sample size. However, as the purpose of
the sample verification is to assess performance of the Panchayats a slight edge was
given in favor of the relatively better performed Panchayats.

9
The performance of the Panchayats is evaluated and assessed based on certain
indicators like the framework criteria, its implications, accountability, transparency
and aspects related to functions, finances and functionaries. To support this purpose
ground verification was undertaken for which a structured questionnaire was used and
all the major stakeholders were considered. State level officials, District level
officials, officers at the AG office, at the Local Fund office etc were consulted during
the exercise. Field works were carried out to verify the case studies provided by the
Panchayats. In some cases local citizens’ response and the level of efficacy towards
the local Panchayats were collected.
The list of Panchayati Raj Institutions taken for Survey is produced below:
Sl
No
Zilla Parishads Panchayat Samithis Gram Panchayats
1 Mansa
2 Ludhiyana
1 Sardur Garh
2 Sudhar
3 Budhlada
4 Dorha
5 Mansa
1 Tugal
2 Guman
3 Heerkak
4 Hissowal
5 Kalloho
6 Kherakalan
7 Bagowal
8 Jhanda Khurd
9 Aspal
10 Katana

10
First hand information, existing reports, existing literature, and websites were referred
for drafting the report. Panchayat offices were contacted for information and focus
group discussions were conducted. Discussions were held with various committees
and stakeholders.
Methodology Flow Chart
Devolution in Punjab
As in the case of any other state, the historical evolution of Panchayati Raj in Punjab
can also be classified in three phases and they are the phase during British rule, the
phase after independence and the phase of post 73rd constitutional amendment period.
After independence, the Gram Panchayat Act, 1952 was enacted by the Government
of Punjab, which replaced the Village Panchayat Act 1939. In1961, a three tier
structure of the Panchayati Rraj system (with Gram Panchayat at the village level,
Panchayat Samiti at the block level and Zilla Parishad at the district level) was
introduced by abolishing the earlier existing of districts boards. In the functional
history of Gram Panchayats there was no disconti Constitutional Amendment Act,
1992, the earlier Gram Panchayat Act, 1952 was replaced by the Punjab Panchayati
Schedule Preparation
Consulting the State and District Level Officials
Primary and Secondary Data Collection
Ground Verification
Stake Holder Consultation
Data Coding
Documentation
Meeting with Panchayat Officials and Elected Representatives
Focus Group Discussions

11
Raj Act, 1994. It is observed that, though all the major features of the Act are in
conformity with central legislation, the functional domb.
In this context one may raise a question, why there is vide difference in the
functional domain of Panchayats across the states, when the features of the Panchayati
Raj Acts of the Indian states are more or less same with little variation. In order to
probe the question and to improve the working of the Panchayati Raj system, the
Government of Punjab had appointed several committees (Rajinder Singh Committee,
Badal Committee, Harcharan Singh Committee and Departmental Officers
Committee) The Badal Committee may be one who could understand the reasons of
the deficiencies and the poor performance of the Panchayati Raj system in Punjab and
it may be worthwhile to refer. “Panchayati raj was introduced in this state more as a
result of the National Policy of the Central Government rather than as an act of faith
and as a means to bring about effective decentralization. Although comprehensive
legislation was brought about through Panchayati Raj Acts, yet these institutions
suffered from lacks of funds and genuine transfer of power and responsibly” The
devolution process had started only in 2004, after a decade of passing the Punjab
Panchayati Raj Act 1994 , by transferring six departments to the Panchayats by the
Government of Punjab. The activity mapping has been conducted and as per the role
is fixed. The departments are; social security women and child development, welfare
of Scheduled castes and backward classes, public health , rural department &
Panchayati raj ,health & family welfare ,and school education . As per the activity
mapping, the Gram Panchayats have been given the power to select beneficiaries and
implementation of certain development programmes, Panchayat Samitis to provide
technical support to the Gram Panchayats for the implementation of the programmes
whereas Zilla Parishads have to allocate and monitor different schemes. However, it
is observed that the real autonomy in discharging the activities of the transferred
subjects is not vested with the Panchyats and Panchayats are having only consultative
role. It is observed that the concerned department of the state decides the final
selection of beneficiaries though legally it is assigned to the Gram Panchayats. In any
developmental issue it is argued that the final decision is vested with officials rather
than the elected representatives and in real judgment, the Panchayats are only

12
permitted to assist the departments of the Government. Since the process of
decentralization has been started very late in Punjab, the level and passion of
devolution is also very slow as compared to other states of India
As per the Constitutional requirement, in the State there is an Election place for
conducting elections to the Panchayats and who is appointed by the Governor of the
State for a period of five years. The emoluments service conditions and provisions for
removal are at par with a Judge of the High Court. In the State all elections are
conducted in regular intervals of five years and the last elections were conducted in
2008 and the next elections are due in 2013. In all the case of vacancy of seats due to
death, resignation and suspension and removal of the elected representatives, by
elections were held with in the time limit except in the case of special circumstances
state election, preparation of electoral rolls and census survey. Since the State
Government did not provide any support to purchase electronic voting machines
(EVM), Panchayats had not been used it for elections .So far no attempt is made to
introduce EVM for Panchayat elections
The Panchayatt Raj system consists of a three tier structure with the Gram Panchayat
at village level, Panchayat Samiti at the block level and Zilla Parishad at the district
level. There are altogether 12775 Gram Panchayats ,143 Panchayat Samitis and 22
Zilla Parishads (including newly formed districts of Fazilla and Pathankot). A Gram
Panchayat consists of a Sarpanch and five to 13 members. Under the Panchayat Raj
Act, it is envisaged a Gram Panchayat will discharge duties and responsibilities
relating to the subject mentioned in the 11th Schedule of the Constitution. Among the
powers, preparation of annual development plans and budget are the major assigned
activities of the Gram Panchayats. There is a provision for constituting three standing
committees in Gram Panchayats and they are :( a) Production Committee, (b) Social
Justice Committee, and (c) Amenities Committee. The production committee is for
performing functions relating to agriculture, animal husbandry, rural industries and
poverty alleviation programmes. Promotion of education, protection of the interest of
Scheduled Castes, Backward Classes and other weaker sections and welfare of women
and children are the major assigned function of the Social Justice Committee.

13
Amenities Committee is proposed to perform functions in respect of education, public
health, public works and other functions of the Gram Panchayats. Each committee
consists of members between three to five including the Sarpanch who is the ex-
officio chairman of all the three committees .Provisions are made to accommodate at
least one member who is a woman and another member who is either a Scheduled
Caste or Backward Classes. According to the sub section of the Act, each standing
committee is empowered to co-opt members of farmers club, mahila mandals, yuvak
mandals and other similar bodies recognized by the State Government. It is surprise to
note that any of the standing committees are not even constituted in any of the 10
selected Gram Panchayats in the State. So far, no attempt has been made for the
constitution and functioning of the standing committees .The Secretary is in charge of
the office of the Gram Panchayat who has to perform the duties and exercise the
powers. As per the provision in the Act, the Secretary has to work in all maters under
the control of the Sarpanch and through he /she is responsible to the Gram Panchayat .
The secretaries are appointed on regular basis and the post is subjected to both
recruitment and service rules. The Panchayat Director is the recruiting authority of the
post subjected to post is regular. During the time of field work not even single
occurrence has been noticed as it is mentioned above .On the contrary, what it is
noticed in the selected Gram Panchayats, is the overall supervision and control of the
Secretary rather than the ‘Secretary is being controlled by the Sarpanch . In the
State, the total sanctioned strength for the post of Panchayat Secretary is 2242 as
against the total number of 12776 Gram Panchayats. Again the actual strength is only
1741 by keeping around more than 501 posts are being vacant. It shows that as per the
sanctioned strength more than five Gram Panchayats have to share the service of one
Secretary. But in practice, as per the actual strength, the service of one secretary has to
share among more than seven Gram Panchayats on an average. This has been clearly
reflected in the selected Gram Panchayats. In the sample Gram Panchayats on an
average, the service of one secretary has to share among eight Gram Panchayats. It is
reported that there are cases in which one secretary has to cover 12 Gram Panchayats.
Though it is be justified by arguing the very small size of the Gram Panchayats in
Punjab ,the ratio between number of Gram Panchayats and the number of the

14
Secretary is crossed the natural wisdom of administrative dynamics and thereby
making impediments in the efficiency of the system. This may be one of the reasons
for the poor performance of the Gram Panchayats in the State .Though there is another
category of staff in the Gram Panchayat known as Gram Sewak , the official data on
their strength at the State level in not available. Among the selected Gram Panchayats
only a few of them are having the service of Gram Sewak . As in the case of
Secretaries in the Gram Panchayats, the staff in the Panchayat Samitis is also regular
with recruitment and service rules .And their designation of recruiting authority is the
State Government. There may be 15 to 25 members in the Panchayat Samiti whereas
the number of the Zilla Parishad is between 10 and 25. It is noticed that 26 functions
are assigned to Panchayat Samiti. In each Panchayat Samiti, there is one Block
Development and Panchayat Officer , one Social Education and Panchayat Officer
,one Panchayat Officer (samiti side) , one Accountant , one Superintendent, four
clerks (including two for samite side) and one Mukh Sawika . In the case of Zilla
Parishad, the Act assigns 22 function. In every Zilla Parishad there is one Chief
Executive Officer (CEO), one Deputy Chief Executive Officer, one Superintendent,
one Accountant, four to five ministerial staff and other sub staff. The recruiting
authority of the staff under Zilla Parishad is the State Government and they are under
regular appointment subjected to recruitment and service rules. There is a provision in
the Act to constitute standing committees in all three levels of Panchayats. There are
three standing committees for every Gram Panchayat and Panchayat Samiti. At the
Zilla Parishad level there are five standing committees .Though the functions of the
standing committees are envisaged in the Act, in practice it is surprise to note that
these committees are not functional in any of the Panchayats in the state. Though the
District Planning Committees are in operational there are certain impediments for the
democratic functioning of the institution. The chairperson of the DPC is not an elected
representative of Panchayat or Municipality .It is observed that in 2010-2011 not even
a single DPC had prepared and submitted an integrated district plan to the state
government. And the record if DPCs in 2011-2012 is also poor, only two of them had
submitted the district plan. The autonomy of the Panchayats may be explained by
examining the ‘control mechanism exerted by either the department or the

15
government. The autonomy of the Panchayats is challenged by certain provisions in
the State Act .1) The representatives of the Panchayat Samitis and Gram Panchayats
can be suspended by the State Government and Director of Panchayat respectively.
2).The state Government is vested with the power of suspending the Panchayat
committee. 3). A state level officier (the director of rural development & Panchayatas)
the power to resent the resolutions of the Panchayats . The real status of the
Panchayats in the state has been reflected in the devolution index prepared by the
Eleventh Finance Commission and as per the index Punjab scores only 2. 0, as against
the score value of 9.6, 9.1, and 5.9 by Madhya Pradesh, Maharastra, and Karnataka,
respectively.
While exploring the answer of a major question related to devolution (Why
Government Devolve), Mitra and Verma have tried to work out possible determinants
of devolution. Two determinants of the authors may be applied to explain the status of
devolution in Punjab. First is the attitudes and perception of the governing elite at the
state level and it is known as willingness to devolve (WTD). WTD tries to measure
the attitudes and perceptions of the ruling elite. These may be the possible factors
worked behind the policy decision of the government on the degree of devolution. It is
hypothesized that poor the WTD, more negative the attitude of the ruling elite towards
the devolution of power to local bodies and poor the extent of devolution. The degree
of the willingness of the governing elite at the state level to share power and patronage
to the local governments shows the reflection of the poor status of devolution in
Punjab. Ethno-linguistic fractionalization (EFI) is the second determinant of
devolution in a given state. EFI shows the probability that any two persons selected by
random sample from within a group belong to different ethno-linguistic fractions
(Mauro, 1995). It is hypothesized that the lower the EFI, the lower the extent of ethnic
diversity in the concerned state. An index is worked out, which is known as diversity
index (DI) by considering the diversity of the population (number of caste/community
/linguistic groups within a state). Low level of diversity among the Punjabi population
estimates fairly low DI. While measuring the quality and level of devolution in the
state of Punjab, the fairly low value of the two major determinants (WTD and DI)

16
works against. The combination of two factors along with others factors may be a
possible explanation of the poor record of decentralization in the state of Punjab.
Gram Sabha
According to the Punjab Panchayat Raj Act, there are two mandatory meetings per
year, one is in the month of December (Sawni Meeting) and other is in the month of
June (Hari Meeting).The quorum of the Gram Sabha is one –fifth of the total number
of its voters . Since it is an agrarian society the two Gram Sabha meetings are related
to the agriculture seasonality of the State. The Sawni Meeting takes place after the
harvest of the sawni crop and Hari Meeting after the harvest of hari crop. The dates of
the Gram Sabha meetings can be fixed by the Sarpanch .The Sarpanch presides over
the meeting of the Gram Sabha and in the absence any Panch to be elected for
presiding the meeting .The secretary and the Gram Sewak attend every general the
meetings of the Gram Sabha . It is also mentioned that in the absence of two
consecutive general meeting of the Gram Sabha, the Sarpanch ceases to hold the
office. There is a provision for special Gram Sabha and it is known as ‘extraordinary
general meeting of the Gram Sabha’. However, no special Gram Sabha meetings had
been reported in the State during 2011-2012. No financial support was provided from
the State to convene the meetings. Out of the ten selected Gram Panchayats five of
them had reported that an average of Rs 600 had been utilized to convene the
meetings. The eight functions are assigned to the Gram Sabha and they are; (a) to
approve annual budget and plan of development programmes and rewiew annual
statement of accounts and progress report ; (b) to render assistance in the
implementation of development schemes pertaining to the village ;(c)to identify
beneficiaries for the implementation of development schemes pertaining to the village
; (d)to mobilize voluntary labou and contribution in kind or cash or both for the
community welfare programmes ;(e) to promote programme of adult education and
family welfare with in the village (f) to promote unity and harmony among all the
sections of the society in the village;(g)to seek clarifications from the Sarpanch and
Panchasof the Gram Panchayats about any particular activity, scheme, income and

17
expenditure; and to perform such other functions as may be prescribed . In accordance
with the above provisions in the Panchayat Raj Act, the Gram Sabha conducts the
activities in the area of planning, budget preparation, and passing of accounts, social
audit, preparation of BPL list, preparation of beneficiary list and preparation of labour
budget. It is observed that among the selected Gram Panchayats, majority of them
are doing the assigned roles. Development plans are discussed in the Gran Sabha,
generally budget and accounts are passed in the month of April and beneficiaries lists
are finalized in the Gram Sabha). In addition to this, there is a recent initiative to
conduct four meetings in a year and the dates are fixed as, 26th January, 1
st May, 15
th
August and 2nd October. Annexure 1 gives an impression that more than the
mandatory number of Gram Sabha meetings was held during 2011-2012 in all the
selected 10 Gram Panchayats. A system has been developed in the State to monitor
and ensure the two general meetings of the Gram Sabha .The Panchayats are asked to
display the dates of the Gram Sabha on the notice board at common places in the
Panchayat area. The Extension Officers of the Block are deputed to monitor the Gram
Sabha meetings. Very little measures are taken by the State to promote peoples’
participation through associational life such as Ward Sabha ,Mahila Sabha and others
below Gram Sabha . It is reported by the State officials that Mahila Sabhas are
formed at Gram Sabha level but there are no evidence from the selected Gram
Panchayats to substantiate the presence of them. In 2011-2012, the State has not
recommended any Gram Panchayat for Gaurav Gram Sabha .
As per the Constitutional requirement, the State of Punjab has a three tier structure
of Panchayat Raj with 12776 Gram Panchayats, 145 Panchayat Samiti and 22 Zilla
Parishads at the villages, block and district level respectively. Altogether there are
total 84138 elected representatives under the Panchayat Raj System in the State. Out
of this one third are women representatives and nearly 30 of the seats are reserved for
the Scheduled Castes. With in the reserved seats for women and Scheduled Caste,
some seats are again reserved for women belong to the Scheduled Castes . As per the
Act, one seat is reserved for Backward Classes in a Gram Panchayat where the
population of Backward Classes in the area is more than 20 per cent of the total
population of that area. However, there is no reservation in the offices of Sarpanches

18
for Backward Classes. There is no scheduled tribe population in the State. Apart from
the reservation of seats, there is no State specific support for Scheduled Caste
population.
District Planning Committee
Section 214 of the Panchayat Raj Act deals with the District Planning Committee
(DPC).This is really a verbatim of the provisions of the Article 234 ZD of the
Constitution. Though it is reported that DPCs are functional, holding meetings for
planning purposes (for integrating rural and urban plans to district plans) and issued
guidelines for the preparation of district, so far no DPC had been submitted district
plans to State Government. And hence, the Plans of the DPCs have nothing to do with
the State plan.
Capacity Building Framework
The State has its own capacity building framework to train the elected representatives
and officials of the Panchayats. The institutional support for training is available
throughout the year and usually it takes six to nine months to complete the training of
all the functionaries. The State Institute of Rural Development (SIRD) has empanelled
195 trainers for conducting training to the functionaries of the Panchayats (both
elected representatives and officials). The academic profile of the trainers gives an
impression that they are highly qualified young professionals with post graduation in
social sciences, education, medicine, law, agriculture, and engineering. There are
some senior retired officials from different line departments and retired faculty of
different training and academic institutions among the trainers. In addition to this, the
support of 45 trainers from CRRID is also availed for the training purposes. Though
no training needs assessment (TNA) has been conducted in the last three years , some
recent training programmes has been organized for Panchayats under different
subjects such as BRGF, NRHM, RGSY, PEAIS, SGSY Gran Sabha ,financial
management of PRIs ,Women development ,Consumer Protection Act, Right to
Information Act ,village development Plan , drinking water and sanitation etc.

different methods of tools (lecture, grou
participatory exercises) are applied for conducting training.
Panchayat Resource Centres are proposed to launch in 2013
through satellite based training has yet to launch in
participation of Panchayat functionaries on
during the last few years and the data on sex wise breakup is not available in the State
.It is reported that only 28 per cent of members
the training programme. Apart from the feedback from the participants at the end of
the programme, there is no mechanism to assess the impact of the training
programme. The reasons for low level attendance of the training programmes is to be
probed further and a scientific training needs assessment study may be
However during the field work it was noticed that the situation was entirely different.
The primary data shows that all
officials) from the selected Panchayat
during last two years. The Diagram No.1,2 &3 clearly indicate the status of capacity
building exercise among the elected representatives and officials for a period of three
years (2010-11,2011-12 & 2012
Diagram No. 1: Participation of the Training program by
Functionaries of Gram Panchayat
Source: Based on the data furnished by the State Officials
2010-11 2011-12 2012-13
80920 80920 80920
32261
4770
TRAINING OF ELECTED REPRESENTATIVES :
GRAM PANCHAYATH
ELECTED REPRESENTATIVES
TRAINED ELECTED REPRESENTATIVES
19
0
5000
2010-11 2011-12 2012
2020 202020201920
972
TRAINING OF PANCHAYATH OFFICIALS : GRAM
PANCHAYATH
PANCHAYATH OFFICIALS
TRAINED PANCHAYATH OFFICIALS
different methods of tools (lecture, group discussions, field work and other
participatory exercises) are applied for conducting training. It is revealed that 20
are proposed to launch in 2013-2015.Distance learning
through satellite based training has yet to launch in the State. The official data
functionaries on different training programme
the data on sex wise breakup is not available in the State
is reported that only 28 per cent of members from Scheduled Castes have attended
the training programme. Apart from the feedback from the participants at the end of
there is no mechanism to assess the impact of the training
The reasons for low level attendance of the training programmes is to be
probed further and a scientific training needs assessment study may be
field work it was noticed that the situation was entirely different.
y data shows that all the functionaries (both elected representatives and
Panchayats had undergone training on different sub
The Diagram No.1,2 &3 clearly indicate the status of capacity
ercise among the elected representatives and officials for a period of three
12 & 2012-13)
Participation of the Training program by the
Panchayat
Source: Based on the data furnished by the State Officials
13
80920
49540
TRAINING OF ELECTED REPRESENTATIVES :
TRAINED ELECTED REPRESENTATIVES
2012-13
2020 3107
TRAINING OF PANCHAYATH OFFICIALS : GRAM
TRAINED PANCHAYATH OFFICIALS
p discussions, field work and other
It is revealed that 20
Distance learning
The official data on the
training programme is poor
the data on sex wise breakup is not available in the State
from Scheduled Castes have attended
the training programme. Apart from the feedback from the participants at the end of
there is no mechanism to assess the impact of the training
The reasons for low level attendance of the training programmes is to be
probed further and a scientific training needs assessment study may be suggested.
field work it was noticed that the situation was entirely different.
the functionaries (both elected representatives and
on different subjects
The Diagram No.1,2 &3 clearly indicate the status of capacity
ercise among the elected representatives and officials for a period of three
the Panchayat

0
200
400
2010-11 2011-12 2012-13
324 324 324
791
TRAINING OF ELECTED REPRESENTATIVES
: ZILLA PARISHAD
ELECTED REPRESENTATIVES
TRAINED ELECTED REPRESENTATIVES
0
1000
2000
3000
2010-11 2011-12 2012-
2712 2712 2712
1617
285
TRAINING OF ELECTED REPRESENTATIVES
: PANCHAYATH SAMITI
ELECTED REPRESENTATIVES
TRAINED ELECTED REPRESENTATIVES
Diagram No.2: Participation of the Training program by the
Functionaries of Panchayat Samithi
Source: Based on the data furnished by the State Officials
Diagram No.3: Participation of the Training program by the
Functionaries of Zilla Parishad
Source: Based on the data furnished by the State Officials
Out of the total Panchayats in the State, only 40.03 percent have conducted
performance audit during the last financial year of 2011
response for furnishing information
39.94 per cent of Gram Panchayat
cent of Zilla Parishads have participated the scheme.
structure had been constituted under
20
0
1000
2000
2010-11 2011-12 2012
1119 1119 11191063827
TRAINING OF PANCHAYATH OFFICIALS :
PANCHAYATH SAMITI
PANCHAYATH OFFICIALS
TRAINED PANCHAYATH OFFICIALS
0
100
200
2010-11 2011-12 2012-13
152 152 152146
33
124
TRAINING OF PANCHAYATH OFFICIALS :
ZILLA PARISHAD
PANCHAYATH OFFICIALS
TRAINED PANCHAYATH OFFICIALS
13
73
TRAINING OF ELECTED REPRESENTATIVES
TRAINED ELECTED REPRESENTATIVES
-13
2712
1169
TRAINING OF ELECTED REPRESENTATIVES
TRAINED ELECTED REPRESENTATIVES
Participation of the Training program by the
Samithi
Source: Based on the data furnished by the State Officials
Participation of the Training program by the
arishad
Source: Based on the data furnished by the State Officials
s in the State, only 40.03 percent have conducted
performance audit during the last financial year of 2011-2012. There was a good
response for furnishing information for PEAIS in 2011-2012 and it is reported that
Panchayats, 44.14 per cent of Panchayat Samitis and
cent of Zilla Parishads have participated the scheme. It is reported that a three level
been constituted under PEAIS at State, District and Block for assessing
2012-13
1119 931
TRAINING OF PANCHAYATH OFFICIALS :
TRAINED PANCHAYATH OFFICIALS
124
TRAINING OF PANCHAYATH OFFICIALS :
TRAINED PANCHAYATH OFFICIALS
Participation of the Training program by the Panchayath
Participation of the Training program by the Panchayath
s in the State, only 40.03 percent have conducted
There was a good
is reported that
Samitis and 63.64 per
It is reported that a three level
PEAIS at State, District and Block for assessing

21
the performance of the Panchayats. First, the Gram Panchayats may be asked to
submit the relevant information in a structured format to the block level committee.
The committee prepares the merit list and then verifies the records of the top five
Gram Panchayats from the list and recommends one to the district level committee.
The district level committee after its verification recommends one best Gram
Panchayat to the State committee. In addition to this, the Panchayat Samities also may
be asked to submit the format to the district level committee. And the District level
committee has to verify the list, prepare the rank and submit to the State level
committee. The State level committee prepares the merit list of the Panchayat
Samities and Zilla Parishad and verifies the records of top three Zilla Pariahads , six
Panchayat Samitis and one Gram Panchayat from each district. And finally the State
level committee recommends two Zilla Parashads, three Panchayat Samities and eight
Gram Panchayats to the Govt. of India for Award. So far, the State has not instituted
any other incentive for either the best performing Panchayats or the best performing
elected representatives. There is also no support mechanism for the poor performing
Panchayats.
Infrastructure& Other Facilities
As far as the physical infrastructure is concerned only 48.12 per cent of the Gram
Panchayats are having proper building (ghar). All facilities of e- connectivity are
totally absent in the Gram Panchayats whereas it is available in all the Panchayat
Samities and Zilla Parishads. They are equipped with all types of e- connectivity
(computers, scanners, telephones, LAN/WAN, internets, wireless connectivity and e-
mail address.(Refer Annexure No.15 & 16) It is revealed that all Panchayat Samities
and Zilla Parashad are regular in uploading their data online and use Information
Communication Technology (ICT) for delivering services. However, at the State level
there is no specific data to show how many of the services are delivered by applying
ICT. In computer application, 819 officials have been trained in 2011-2012.Two
major software (Plan Plus and PRIA) are in use in the State and the State also has

22
developed its own software for the functioning of the Panchayats It is reported that in
2011 the State has been nominated for the e- Panchayat award .
Transparency and Anti- Corruption
In the area of transparency and anti –corruption very little developments has been
noticed in the State. Under RTI Act, Panchayats provide information to the public and
at each level there are designated information officers, the secretary is in charge of the
Gram Panchayat. Block Development Panchayat Officer (BDPO) is in charge of the
Panchayat Samities whereas the Deputy Chief Executive Officer (DYCEO) holds the
post in Zilla Parishad. The first appellate authority of the Gram Panchayat ,Panchayat
Samitis Zilla Parishad are the Block Development Panchayat Officer ,District
development Panchayat Officer and Additional Deputy Commissioner respectively .
In all the cases the second appellate authority is the State Information Commissioner.
In 2011-2012, all the PRIs in the State have submitted annual reports to their respect
authorities .The State has made policy package for the disclosure of information by
the Panchayats to the public and they are the display boards and website. However, at
any level the provision of Citizen’s Charter is not visible in the State. The absence of
institutional mechanism to undertake the complaints of Panchayats other than
government agency is another lacuna in the area of transparency and anti-corruption in
the State. The institutions of Panchayat Ombudsman and Lokayukta are yet to be
introduced in the State.
Social Audit
Social audit is also in a rudimentary stage in the State. Once in a year, it is conducted
only in the domain of MGNREGA at the Gram Sabha meetings under the supervision
of Panchayat Samitis. No report of the social audit is put in public sphere. No action
taken report (ATR) is discussed in the Gram Sabha. There is no social audit team in
the State. However, efforts are made to create awareness among the members of the
Gram Sabha for their active participation in the social audit process. As part of this,
the SIRD has conducted training programme on social audit for the elected

23
representatives and officials of the PRIs and civil society activists. In the sample
Gram Panchayats only MGNREGA related social audits are conducted.
Parallel Bodies
The parallel bodies exist both at the village and the district level in the State. The
village education committee, village health and sanitation committee watershed
development committee joint forest management committee and sports club are the
major parallel bodies at the village level and no one has merged with Gram Panchayat.
The functional relationship between the Gram Panchayat and the Parallel bodies
varies among organizations. The meeting of village education committee is chaired by
the Sarpanch, the health and sanitation committee and watershed development
committee are accountable to Gram Panchayat. The joint forest management
committee and sports club are totally separated from the Gram Panchayat. The parallel
bodies at the district level also have been analyzed. The DRDA exits separate, not yet
merged with the Zilla Parisha. However the chairman of Zilla Parishad is made the
chairman of the DRDA and it is said that all Panchayats have access to the expertise
of the DRDA. The District unit of Water and Sanitation Mission remains separate.
Though the DRDAis not under the control of the Zilla Parishad, it is presided by the
chairman of the Parishad. The district unit of NRHM maintains separate identity
without the administrative control of the Zilla Parishad .The elected representatives of
the Parishad have representation in the board of the NRHM . As in the case of SSA, it
has no functional linkage with Zilla Prishad and it remains separate.
Autonomy of the Panchayats
Autonomy of the PRIs is another issue which needs separate analysis. The autonomy
of the Panchayats is measured in terms of certain proxy variables such as the existence
and application of the provisions for the suspension of representatives/Panchayats
resend for reconsideration of resolutions and dismiss/supersede/dissolve/quash. The
autonomy of the Panchayats and the existence of the above provisions and its
application are inversely proportionate. In other words, higher the autonomy of the
24
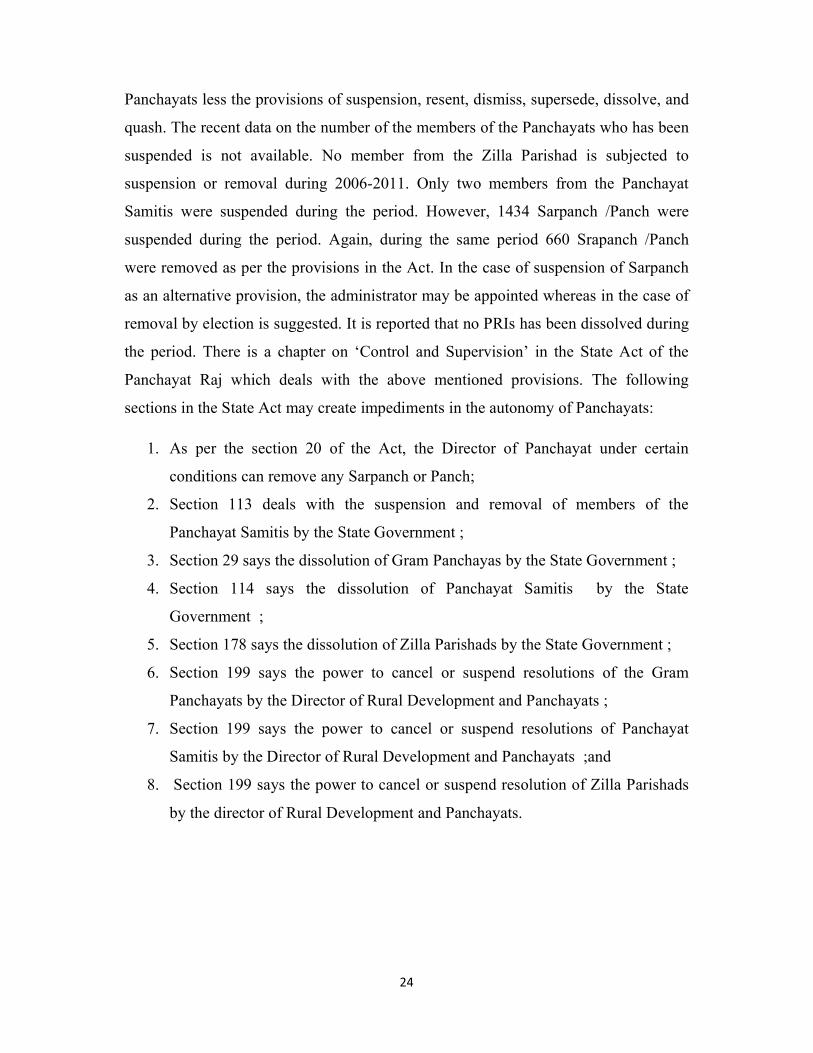
Panchayats less the provisions of suspension, resent, dismiss, supersede, dissolve, and
quash. The recent data on the number of the members of the Panchayats who has been
suspended is not available. No member from the Zilla Parishad is subjected to
suspension or removal during 2006-2011. Only two members from the Panchayat
Samitis were suspended during the period. However, 1434 Sarpanch /Panch were
suspended during the period. Again, during the same period 660 Srapanch /Panch
were removed as per the provisions in the Act. In the case of suspension of Sarpanch
as an alternative provision, the administrator may be appointed whereas in the case of
removal by election is suggested. It is reported that no PRIs has been dissolved during
the period. There is a chapter on ‘Control and Supervision’ in the State Act of the
Panchayat Raj which deals with the above mentioned provisions. The following
sections in the State Act may create impediments in the autonomy of Panchayats:
1. As per the section 20 of the Act, the Director of Panchayat under certain
conditions can remove any Sarpanch or Panch;
2. Section 113 deals with the suspension and removal of members of the
Panchayat Samitis by the State Government ;
3. Section 29 says the dissolution of Gram Panchayas by the State Government ;
4. Section 114 says the dissolution of Panchayat Samitis by the State
Government ;
5. Section 178 says the dissolution of Zilla Parishads by the State Government ;
6. Section 199 says the power to cancel or suspend resolutions of the Gram
Panchayats by the Director of Rural Development and Panchayats ;
7. Section 199 says the power to cancel or suspend resolutions of Panchayat
Samitis by the Director of Rural Development and Panchayats ;and
8. Section 199 says the power to cancel or suspend resolution of Zilla Parishads
by the director of Rural Development and Panchayats.
25
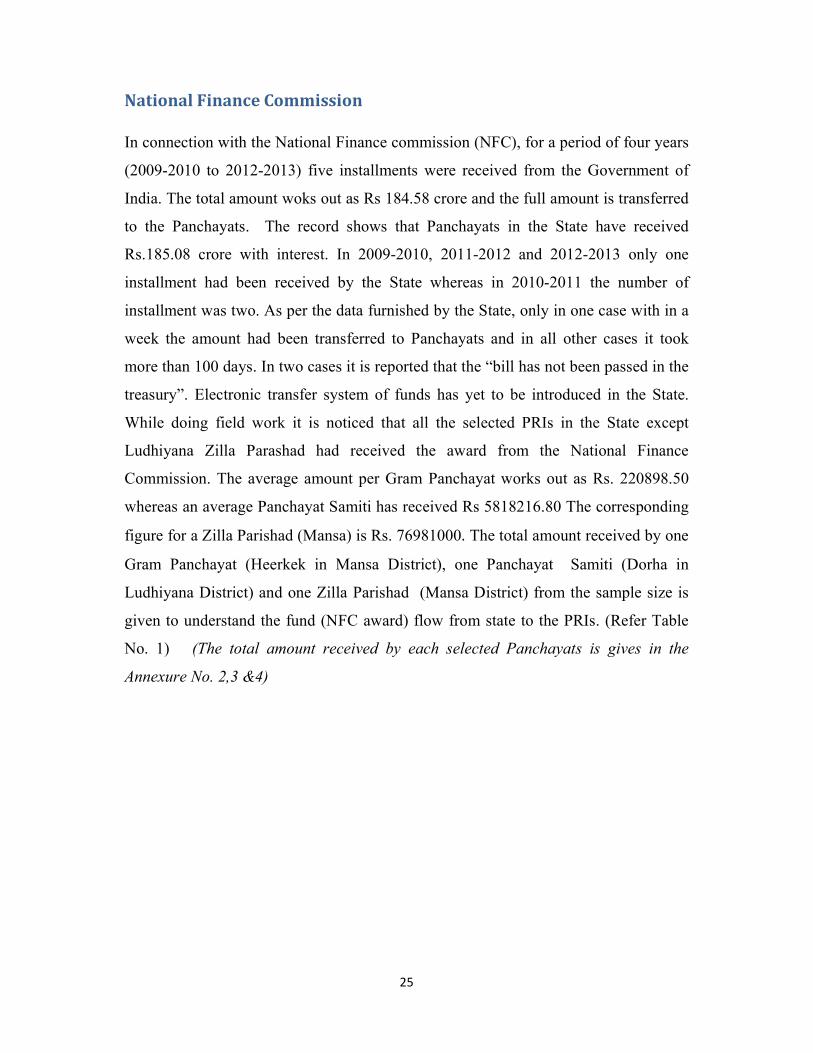
National Finance Commission
In connection with the National Finance commission (NFC), for a period of four years
(2009-2010 to 2012-2013) five installments were received from the Government of
India. The total amount woks out as Rs 184.58 crore and the full amount is transferred
to the Panchayats. The record shows that Panchayats in the State have received
Rs.185.08 crore with interest. In 2009-2010, 2011-2012 and 2012-2013 only one
installment had been received by the State whereas in 2010-2011 the number of
installment was two. As per the data furnished by the State, only in one case with in a
week the amount had been transferred to Panchayats and in all other cases it took
more than 100 days. In two cases it is reported that the “bill has not been passed in the
treasury”. Electronic transfer system of funds has yet to be introduced in the State.
While doing field work it is noticed that all the selected PRIs in the State except
Ludhiyana Zilla Parashad had received the award from the National Finance
Commission. The average amount per Gram Panchayat works out as Rs. 220898.50
whereas an average Panchayat Samiti has received Rs 5818216.80 The corresponding
figure for a Zilla Parishad (Mansa) is Rs. 76981000. The total amount received by one
Gram Panchayat (Heerkek in Mansa District), one Panchayat Samiti (Dorha in
Ludhiyana District) and one Zilla Parishad (Mansa District) from the sample size is
given to understand the fund (NFC award) flow from state to the PRIs. (Refer Table
No. 1) (The total amount received by each selected Panchayats is gives in the
Annexure No. 2,3 &4)

26
Table No. 1: Total amount received by one each sample Panchayats (Gram Panchayat,
Panchayat Samithi and Zilla Parishad) from National Finance Commission Award
Tier Name of the
Panchayats
Year Date Amount (Rs.)
Gram
Panchayat
Heerkek 2009-2010 01-10-2009 76179
2009-2010 11-03-2010 47606
2010-2011 08-11-2010 200000
2011-2012 08-11-2011 38352
2012-2013 10-10-2012 72771
Total 434908
Panchayat
Samiti
Dorha 2009-2010 19-06-2009 2180851
2009-2010 17-09-2009 1019977
2011-2012 09-05-2011 703542
2012-2013 30-08-2012 3033000
Total 6937370
Zilla
Parishad
Mansa 2009-2010 04-05-2009 21271000
2009-2010 07-12-2009 11243000
2010-2011 30-09-2010 10925000
2010-2011 02-02-2011 14258000
2012-2013 09-08-2012 17107000
2012-2013 10-10-2012 2177000
Total 76981000
Source: Data collected from Heerkek Gram Panchayat, Dorha Panchayat Samiti & Mansa Zilla Parishad
State Finance Commission
The State of Punjab is in the forefront in constituting State Finance Commissions
(SFCs) in every five year .So far four commissions have been constituted. The first
SFC (1996-2001) was formed in April, 1994 and submitted its report on December
1995.The action taken report (ATR) has laid before the legislature on 31 December
1995. On due date ,the second SFC was formed (September 2000),submitted its report
on February 2002and laid ATR before the legislature on 15 February 2002.On
September 2004 ,the third SFC(2006-2011) was constituted ,submitted the report on
December 2006 and tabled before the legislature on 28 December 2006 .The present
SFC (fourth one ,2011-2016)was formed on November 2008 and ATR has not yet
been tabled before the legislature. The fourth SFC has critically commented the State

27
Government’s approach to Panchayats, which are starving for funds in Punjab .The
Commission has pointed out wide gap in the funds recommended by the third SFC
and those actually released by the State Government as share of State taxes to the
Panchayats during 2006-2007 to 2010-2011, which in turn had resulted in distortion of
Panchayats’ budgets. Again, presenting on the poor financial conditions of the
Panchayats, the report says how there was a wide gap in the release of funds to the
Panchayats against the recommendations of the first and second SFCs, particularly in
the share of State taxes. As per the recommendations of the SRC reports Rs .305.48
lakhs had been budgeted in 2009-2010 but the sanctioned amount was only 32.90
lakhs (10 %). In 2010-2011 the budgeted amount was Rs. 369 lakhs and out of which
only 50 per cent of the amount had been sanctioned. In both the cases no amount has
been released to the Panchayats and it due to court case as reported. During the field
work selected Panchayats have reported that they have not received any award amount
from the SFC in the State.
Functions of the Panchayats
The functions are assigned to Panchayats mainly by three ways and they are (a)
delegated by legislative process ;( b) activity mapping; and (c) executive order. Under
Section 30 of the State Act a long elaborated list of activities are assigned to the Gram
Panchayats .Section 119 deals with the functions assigned to Panchayat Samitis
whereas functions are assigned to Zilla Parishad by the Section180 of the State. The
State Act has very clearly separated the activities of different subject /function and it
is assigned to each tier. For example take the case of Drinking Water and Water
Supply for Domestic Purpose, and it is noticed that each tier has certain activity under
the subject /function. As per the Section 30, construction, repair, and maintenance of
wells, water pumps, springs, ponds, and tanks for the supply of water for drinking,
washing and bathingare assigned to Gram Panchayat. Again under the same subject
/function as per the Section 119, establishment, repair and maintenance of rural water
supply schemes are allotted to Panchayat Samitis. According to Section 180 some
activities of drinking water and water supply (maintenance and control of tank, ghat,

28
well and channel) are assigned to Zilla Parashad. As in the case of drinking water and
water supply the activities of different subjects are assigned to different tiers based on
the principle of subsidiarity. The activities related to water supply for agriculture
purpose, minor irrigation and water management, watershed management
development are assigned to Panchayat Samitis and Zilla Parishad . Certain functions
are assigned to Panchayats with the support of legislation, activity mapping and
executive order. Examples are drinking water & water supply for domestic purpose,
maintenance of community assets ,streetlight ,parking lots , bus stops ,public
conveniences, parks gardens, playground, primary health centre/community health
centre sanitation and solid watershed management cremation and burial, ,animal
husbandry, poverty alleviation programme, social welfare, welfare of handicapped and
mentally retarded, and elementary education., libraries and rural housing.
Centrally sponsored Schemes and State Schemes
Actual involvement of the Panchayats in the implementation of flagship programmes
has been examined. There are schemes of watershed development progremmes,
MGNREGA, IAY ,SGSY/NRLM, ICDS, NSAP, and other state sponsored schemes in
which Panchayats are actually involving .There are certain other schemes where
Panchayats have no role in implementation and these schemes are National
Horticulture Mission, Macro Management of Agriculture Scheme, Micro Irrigation,
SSA, NRHM, PMGSY and National Food Security Mission.
Panchayat Finance
Section 86 of the Act provides that for each Gram Panchayat there is to be a Gram
Panchayat Fund bearing the name of the Gram Panchayat. Different types of amounts
are included in this fund and they are ;( a) All grants and transfers from the
government and other local authorities, (b) Proceeds of all funds collected for
common secular purposes of the villages in the Gram Sabha, (c) All donations .All
taxes, duties. cesses ,tolls ,and fees imposed and realized under the Act,(d)Sales

29
proceeds of dust, dung or refuge collected by the servants of the Gram Panchayat and
dead bodies of animals trees and other produce,(e) Income from fishers , (f) Income
from common land , (g) Any other amount. As per the Section 88 only with the
authorization of the State and an order to this effect,the Gram Panchayats can impose
any tax. Under Section 89, every Gram Panchayat shall on the recommendation of the
State Finance Commission be entitled to receive grant in aid from the consolidated
fund of the state. The taxation Power of the Gram Panchayat is envisaged in the
Section 88 and it shall impose (a)tax on land and building (b)tax on profession ,trade
,calling and employment, (c)additional stamp duty on all payments for admission to
any entertainment, (d)fees on registration of vehicle, (e) fees on sanitary arrangement,
(f)water rate, (g) light rate and (h) conservancy rate. As in the case of Gram
Panchayat fund, according to Section 138 of the Act there is a provision for Panchayat
Samiti fund and different sources of fund is allowed to poll under the head. The taxes
of Panchayat Samiti are envisaged as per the Section 149. The taxes are (a) toll on
persons, vehicles or animals or any loss of them at any toll-bar (b) toll of any ferry (c)
fees on registration of vehicle other than motor vehicleAct, 1988 (d) fees on providing
sanitary arrangements (e) fees on license for market (f) fees on any other license (g)
water rate (h) lighting rate. Section 188 of the Act provides provision for constituting
a Zilla Parishad fund bearing the name of the Zilla Parishad. It gives a list of polled
resources under the fund. There is a Section (189) which deals the taxation measure
by the Zilla Parishad. It says, “the State Government on the recommendation of the
State Finance Commission under Article243-1of the Constitution India or otherwise
allow a Zilla Parishad to levy any tax, duty, fee, toll and cess”.
1. According to the data furnished by the State, internal revenue mobilization (IRM)
by Grama Panchayats is Rs 613.69 crore in 2010-2011. The corresponding figure
during 1999-2000 was Rs 74 .91 crore, as per the report of the Second State
Finance Commission. The growth has been registered to increase by a factor of 8.2
within a period of 10 years and the field observation gives an impression that it is
mainly due to the contribution of income from common land.
2. In the State ,the total available fund with the Gram Panchayats was calculated as
Rs.71543.00 lakhs and out of which Rs.61369.00 lakhs (85.78%)was from

‘Panchayats Own Revenue including
5426.00 lakhs (7.58%)was under the head of ‘
to the Panchayats tied to any scheme
mentioned as ‘Non- Plan Grant transferred by State to
schemes’ (Ref. Table No.2 & Diagram No.4)
Diagram No.4: Item Wise Comparison of
3. In the Gram Panchayats,
including collection from rental, lease, etc’
2011-2012 at the State level. (During the field work,
collection could gather from the 10 selected Gram
items on ‘Plan grant transferred by the State to
and ‘Non- Plan Grant transferred by the
Rs 3100.00 lakhs and Rs.4966
No.2 & Diagram No.5)
Plan Grant
transferred by
State to
Panchayats
tied to
schemes
7%
Non- Plan
Grant
transferred by
State to
Panchayats
tied to
schemes
7%
30
Revenue including collection from rental, lease etc.
(7.58%)was under the head of ‘Plan Grant transferred by the State
s tied to any scheme’and Rs .4748.00 lakhs (6.64%)
Plan Grant transferred by State to Panchayat
Table No.2 & Diagram No.4)
Item Wise Comparison of Available Fund with Gram
Panchayat in 2010-11
Source: Table No.2
the amount under head of ‘Panchayats Own Revenue
collection from rental, lease, etc’ was not available for the period of
at the State level. (During the field work, Panchayats own revenue
collection could gather from the 10 selected Gram Panchayats). Only the other
Plan grant transferred by the State to Panchayats tied to any scheme’
transferred by the state to Panchayats tied to schemes
and Rs.4966.00 lakhs respectively in 2011-2012.
Panchayats
Own Revenue
including
collection
from
rental, lease, e
tc
86%
collection from rental, lease etc.’ , Rs
Plan Grant transferred by the State
(6.64%) was
Panchayats tied to
Available Fund with Gram
s Own Revenue
not available for the period of
s own revenue
Only the other
tied to any scheme’
tied to schemes’ was
2012. (Ref. Table

Diagram No.5: Item Wise Comparison of
4. In the State an amount of Rs. 8700
in 2010-2011 under the head of
2011-2012, there was a quantum
Rs. 12000 lakhs. (Ref. Table No.2)
5. As per the data furnished by
available to the Zilla Parishad
State to Panchayats tied to
Table No. 2: Fund Availability with
Sl.
No
Break Up of Revenue
Financial Year 2010-11
1 Revenue transferred to
Panchayats by state
2 Panchayats Own Revenue
including collection from rental,
lease, etc
3 Plan Grant transferred by the
State to the Panchayats un
to any scheme
4 Plan Grant transferred by State
to Panchayats tied to scheme
5 Non- Plan Grant transferred by
State to Panchayats untied to
any scheme
Non- Plan Grant
transferred by
State to
Panchayats tied
to schemes
62%
31
Item Wise Comparison of Available Fund with Gram
Panchayat in 2011-12
Source: Table No.2
of Rs. 8700 lakhs was made available to Panchayat
under the head of ‘Revenue transferred to Panchayats by
there was a quantum jump in the corresponding figure an
Table No.2)
As per the data furnished by the State, only an amount of Rs. 352 lakhs
to the Zilla Parishad under the head of ‘Plan Grant transferred by the
ied to any scheme in 2011-2012’. (Ref. Table No.2)
Availability with Panchayats in the State (Rs. in Lakhs)
Break Up of Revenue Gram
Panchayat
Panchayat
Samithi
Zilla
Parishad
8700
s Own Revenue
including collection from rental,
61369
Plan Grant transferred by the
untied
Plan Grant transferred by State
s tied to schemes
5426
Plan Grant transferred by
tied to
Plan Grant
transferred by
State to
Panchayats tied
to schemes
38%
Available Fund with Gram
Panchayat Samitis
s by State.’ In
nd it became
lakhs was made
rant transferred by the
Table No.2)
s in the State (Rs. in Lakhs)
Zilla
Parishad
Total
8700
61369
5426
Plan Grant
transferred by
State to
Panchayats tied
to schemes
38%

6 Non- Plan Grant transferred by
State to Panchayats tied to
schemes
7 Loan Taken by the Panchayat
8 Any Others
Total
1 Revenue transferred to
Panchayats by state
2 Panchayats Own Revenue
including collection from rental,
lease, etc
3 Plan Grant transferred by the
State to the Panchayats un
to any scheme
4 Plan Grant transferred by State
to Panchayats tied to scheme
5 Non- Plan Grant transferred by
State to Panchayats untied to
any scheme
6 Non- Plan Grant transferred by
State to Panchayats tied to
schemes
7 Loan Taken by the Panchayat
8 Any Others
Total
Source: Data Furnished from Punjab State
Diagram No.6: Fund Availability
Consecutive Financial Years (Rs. in Lakhs)
6. The data on resource mobilization (internal revenue) through taxes by the 10
selected Gram Panchayats is Rs.378967.90 in
0
20000
40000
60000
80000
Revenue
transferred
87
00
12
00
0
2010
32
Plan Grant transferred by
s tied to
4748
Panchayats
71543 8700
Financial Year 2011-12
12000
s Own Revenue
including collection from rental,
Plan Grant transferred by the
untied
Plan Grant transferred by State
s tied to schemes
3100 352
Plan Grant transferred by
tied to
Plan Grant transferred by
s tied to
4966
Panchayats
8066 12000 352
State
Fund Availability with Panchayats in the State for two
Consecutive Financial Years (Rs. in Lakhs)
Source: Table No.2
data on resource mobilization (internal revenue) through taxes by the 10
s is Rs.378967.90 in 2010-2011 and it has come down to
Own Revenue Plan Grant tied Non- Plan Grant
tied
61
36
9
54
26
47
48
0 34
52
49
66
2010-11 2011-12
4748
80243
12000
352 3452
4966
352 20418
in the State for two
data on resource mobilization (internal revenue) through taxes by the 10
2011 and it has come down to
Plan Grant

33
Rs 352582.50 in 2011-2012. Again, in 2010-2011 the highest amount was Rs.
1013329.00 and it is from the Aspal Gram Panchayat whereas the lowest is from
Bagowal Gram Panchayat and the corresponding figure is Rs. 15000. In 2011-
2012, the highest amount (Rs.869000) is generated from Jhunda Khurd Gram
Panchayat and no amount is mobilized from Katana Gram Panchayat. (However,
as it is mentioned earlier, at the State level the data is not available for the period
of 2011-2012.) (Refer Annexure No. 5 & 6)
7. In 2010-2011, only three Gram Panchayats had received the amount from National
Finance Commission (NFC) whereas in 2011-2012 all of them had received the
same. Per year (2011-2012) the average amount per Gram Panchayat is estimated
as Rs. 40000. The amount varies from Rs.71331 (Tugal Gram Panchayat in 2011-
2012) to Rs.4445 (Katana Gram Panchayat in 2011-2012). (Refer Annexure No. 2)
8. MGNREGA is another source of available fund in the Gram Panchayats in the
State. Since it is a demand driven project, the flow of fund is based on local
situations .It was available only in three Gram Panchayats in 2010-2011 and the
number has increased in to five in the next year. The highest flow of fund is seen
in the Heerkad Gram Panchayat and it was Rs.3942000. (Refer Annexure No. 5)
9. IAY is another centrally sponsored scheme administered through the Gram
Panchayats. The source of fund is limited in a few and it is seen in only two Gram
Panchayats. Under the scheme in 2010-2011 Heerkad Gram Panchayat had
received an amount of Rs.8190000 and another Gram Panchayat received Rs.
126000 in 2011-2-12 under the same head. (Refer Annexure No. 5)
10. Rural Development Fund (RDF) is another major source which is available in the
Gram Panchayats. Under the scheme in 2010-2011, fund was available only in
three Gram Panchayats and in the next year the number had increased in to nine.
The amount of the fund varies among the Gram Panchayats between Rs. 14.31
lakhs (Kherakalan Gram Panchayat) and Rs. 2.5 lakhs (Kalloho Gram Panchayat ).
The slanted nature of fund flow is very visible under the scheme. (Refer Annexure
No. 5)

34
11. One Gram Panchayat (Kherakalan) under the scheme for the development of
sports among youth (PIYAKA) had received an amount of Rs 3.00 lakahs in 2010-
2011. (Refer Annexure No. 5)
12. Though the item wise data on the expenditure was not available, the general trend
is observed that the fund under the own source and RDF has been spent on rural
construction (culverts and roads) as reported by the functionaries of the selected
Gram Panchayats in the State. In 2010-2011, the total expenditure was Rs
16792557 whereas the total available fund was Rs.17521256 and thereby a balance
of Rs. 728699. The available fund for the year 2011-2012 was Rs.19106419 and
the total expenditure was 18821241 by keeping a closing balance was Rs. 285178.
(Since it was not available, the opening balance has not been considered while
calculating the available find for the two years). (Refer Annexure No. 5 & 6)
13. Actually in the real sense there is no provision for mobilizing own resources by the
Panchayat Samiti as per the Act. However, it is the duty of the Gram Panchayats to
hand over 20 per cent their resource mobilization to the respective Panchayat
Samiti .all the selected five Panchayat Samitis had received the same from the
respective Gram Panchayats .Under the head, in 2010-2011, a total of
Rs.65.89lakhs was available in the selected Panchayat Samitis. Average amount
per Panchayat samiti is worked as Rs.13.18 lakhss . In 2011-2012, the amount has
been increased in to Rs. 125.00 lakhs. A growth rate of 52.62 per cent has been
registered. It is observed that during the last two years large areas of encroached
common land had been took position of by the Gram Panchayats and the land has
given for lease and in turn it added the size of the resource envelop . And finally it
is reflected the internal resource mobilization (IRM) of the Panchayat Samitis
through Gram Panchayats. (Refer Annexure No. 7 & 8)
14. The major source of fund flow to Zilla Parishad are own source, pooled and shared
of liquor tax ,untied fund ,RDO, revenue ,rural development fund and
MGNREGA.
15. Among the two Zilla Parishads it is found that wide variations in the flow of
available fund. During the period of two years (2010-2012) the fund flow to
Ludhiyana Zilla Parishad was only from two sources. (own source and tax liquor

sales) whereas the situation is different in Mansa Zilla Parishad .The data source
indicates that in Mansa Zilla Parishad there
and in turn it is reflected in the total amount
in Mansa Zilla Parishad was Rs.26.77 crore and increased to Rs .34.17crore over a
period of one year. As in the case of Ludhiyana Zilla
figure was Rs. 2.49 crore and Rs.2.12crore in 2010
respectively. (Refer Annexure No. 11 & 12)
16. In Kherakalan Gram Panchayat
from different sources is given in Diagr
%) is from MGNREGA and 36 percent is from RDF
Piyaka is decreased in the year 2011
shown in diagram No. 8. (Refer Table No. 3)
Diagram No. 7: Average Fund Availability of Kherakalan(Sample ) Gram
Diagram No. 8: Comparison of Fund Availability of Kherakalan (Sample )
Gram Panchayat
RDF
36%
0.00
10.00
20.00
30.00
Own
income
0.3
5
4.4
4
35
the situation is different in Mansa Zilla Parishad .The data source
Mansa Zilla Parishad there was fund flow from other sources also
reflected in the total amount .The total available fund in 2010
in Mansa Zilla Parishad was Rs.26.77 crore and increased to Rs .34.17crore over a
As in the case of Ludhiyana Zilla Parishad the corresponding
Rs. 2.49 crore and Rs.2.12crore in 2010-2011 and 2011
(Refer Annexure No. 11 & 12)
Panchayat of Mansa District the availability of fund per
from different sources is given in Diagram No.7 and less than half of the fund (
and 36 percent is from RDF. Fund from MGNREGA and
Piyaka is decreased in the year 2011-12comapred to the same in 2010
. (Refer Table No. 3)
7: Average Fund Availability of Kherakalan(Sample ) Gram
Panchayat
Source: Table No.3
8: Comparison of Fund Availability of Kherakalan (Sample )
Panchayat in 2010-11 and 2011-12 (Rs.in lakhs)
Source: Table No.3
Own
income
10% NFC
1%
MGNREGA
47%
Piyaka
6%
income
NFC MGNREGA RDF Piyaka Total
0.0
0
17
.00
3.7
5
3.0
0
24
.10
4.4
4
0.5
3 6.7
8
14
.31
0.0
0
2010-11 2011-12
the situation is different in Mansa Zilla Parishad .The data source
was fund flow from other sources also
.The total available fund in 2010-2011
in Mansa Zilla Parishad was Rs.26.77 crore and increased to Rs .34.17crore over a
corresponding
2011 and 2011-2012
the availability of fund per year
of the fund (47
Fund from MGNREGA and
12comapred to the same in 2010-11and is
7: Average Fund Availability of Kherakalan(Sample ) Gram
8: Comparison of Fund Availability of Kherakalan (Sample )
Total
24
.10
26
.06

Table No. 3: Available Fund of
Year
Own income NFC
2010-11 0.35
2011-12 4.444 0.52872
Average
per year
2.397 0.26436
Source: Data collected from Kherakalan Gram
17. Average expenditure of Kherakalan Gram
and just less than half (48 %) of the expenditure is from centrally sponsored
schemes and 46 percent is under revenue expenditure. Comparing the two years
expenditure (2010-11 & 2011
and other schemes are decreased in the year 2011
10. (Refer Table No. 4)
Diagram No. 9: Average Expenditure of Kherakalan(Sample ) Gram
Diagram No. 10: Comparison of Expenditure of Kherakalan (Sample)
Gram Panchayat
Centrally
Sponsored
48%
Other
Schemes
0.00
10.00
20.00
30.00
Revenue
Expenditure
4.1
0
2010
36
Available Fund of Kherakalan (Sample) Gram Panchayat
Fund Available (Rs. In Lakhs)
NFC MGNREGA RDF Piyaka
0 17 3.75 3
0.52872 6.78 14.31 0
0.26436 11.89 9.03 1.5
Source: Data collected from Kherakalan Gram Panchayat
expenditure of Kherakalan Gram Panchayat is depicted in Diagram no. 9
just less than half (48 %) of the expenditure is from centrally sponsored
schemes and 46 percent is under revenue expenditure. Comparing the two years
11 & 2011-12) the expenditure on centrally sponsored schemes
and other schemes are decreased in the year 2011-12 and is shown in Diagram no.
9: Average Expenditure of Kherakalan(Sample ) Gram
Panchayat
Source: Table No.4
10: Comparison of Expenditure of Kherakalan (Sample)
Panchayat in 2010-11 and 2011-12 (Rs.in lakhs)
Source: Table No.4
Revenue
Expenditure
46%Centrally
Sponsored
Other
Schemes
6%
Revenue
Expenditure
Centrally
Sponsored
Other
Schemes
Total
17
.00
3.0
0
24
.10
18
.75
6.7
8
0.0
0
25
.53
2010-11 2011-12
Panchayat
Total
24.1
26.06272
25.08136
is depicted in Diagram no. 9
just less than half (48 %) of the expenditure is from centrally sponsored
schemes and 46 percent is under revenue expenditure. Comparing the two years
12) the expenditure on centrally sponsored schemes
12 and is shown in Diagram no.
9: Average Expenditure of Kherakalan(Sample ) Gram
10: Comparison of Expenditure of Kherakalan (Sample)

Table No. 4: Expenditure Details
Year
Revenue Expenditure
2010-
2011
2011-
2012
Average
per
Year Source: Data collected from Kherakalan Gram
18. In Mansa Panchayat Samithi the availability of fund per year from different
sources is given in Diagram No.11
Grant transferred by State to
RDF and 13 percent is from MGNREGA
Non- Plan Grant transferred by State to
increased in the year 2011-
in Diagram No. 12. (Refer Table No. 5)
Diagram No. 11: Average Fund Available of Mansa
RDF
34%
37
Expenditure Details of Kherakalan (Sample) Gram Panchayat
Expenditure (Rs. In Lakhs)
Revenue Expenditure Centrally
Sponsored
Other Schemes
4.1 17
18.754 6.78
11.427 11.89
Source: Data collected from Kherakalan Gram Panchayat
Samithi the availability of fund per year from different
sources is given in Diagram No.11 and two fifth of the fund is from
Grant transferred by State to Panchayats tied to any scheme, 34 percent is from
RDF and 13 percent is from MGNREGA. Only fund from RDF, own income and
Plan Grant transferred by State to Panchayats tied to any scheme
-12 on comparing to the same in 2010-11 and it is g
(Refer Table No. 5)
11: Average Fund Available of Mansa (Sample)Panchayat
Samithi
Source: Table No.5
Own income
4%Liquor tax
5% MGNREGA
13%
IAY
4%
Non plan
untied
0%
Non plan tied
40%
Panchayat
Other Schemes Total
3 24.1
0 25.534
1.5 24.817
Samithi the availability of fund per year from different
and two fifth of the fund is from Non- Plan
, 34 percent is from
Only fund from RDF, own income and
s tied to any scheme are
11 and it is given
Panchayat

Diagram No. 12: Comparison of Fund Available of Mansa
(Sample)Panchayat
Table No.5: Available Fund of Mansa (Sample)
Year Own
income
Liquor
tax
2010-2011 21.33 31
2011-2012 22.78 23.8
Average
Per Year
22.055 27.4
Source: Data collected from Mansa
19. Average expenditure of Mansa
13 and less than half (46 %)
schemes and 45 percent is from
2011-12 ) expenditures onl
decreased in the year 2011
6)
0.00
100.00
200.00
300.00
400.00
500.00
600.00
Own
income
Liquor tax
21
.33
31
.00
22
.78
2010
38
12: Comparison of Fund Available of Mansa
Panchayat Samithi in 2010-11 and 2011-12 (Rs.in lakhs)
Source: Table No.5
Table No.5: Available Fund of Mansa (Sample)Panchayat Samithi
Fund available (Rs. In Lakhs)
Liquor MGNREGA IAY Non
plan
untied
Non plan
tied
138.24 41.35 1.7 194.53
0 0 0 219.374
69.12 20.675 0.85 206.952
Source: Data collected from Mansa Panchayat Samithi
Average expenditure of Mansa Panchayat Samiti is depicted in the Diagram No.
(46 %) of the expenditure is from centrally sponsored
45 percent is from salary state. Comparing two years (2010
12 ) expenditures only revenue expenditure and capital expenditure are
decreased in the year 2011-12 and it is shown in Diagram No.14. (Refer Table No.
Liquor tax MGNREGA IAY Non plan
untied
Non plan
tied
RDF
13
8.2
4
41
.35
1.7
0
19
4.5
3
88
.68
23
.80
0.0
0
0.0
0
0.0
0
21
9.3
7
2010-11 2011-12
12: Comparison of Fund Available of Mansa
12 (Rs.in lakhs)
Samithi
Non plan RDF Total
88.68 516.83
219.374 259.47 525.424
206.952 174.075 521.127
Samiti is depicted in the Diagram No.
of the expenditure is from centrally sponsored
Comparing two years (2010-11 &
y revenue expenditure and capital expenditure are
(Refer Table No.
RDF Total
88
.68
51
6.8
3
25
9.4
7
52
5.4
2

Diagram No. 13: Average
Diagram No. 14: Comparison
Samithi
Table No.6: Expenditure Details
Year
Salary
State
Salary
Panchayat
2010-2011 187.34387 40.18989
2011-2012 253.46193 43.15625
Average Per
Year
220.4029 41.67307
Source: Data collected from Mansa
Capital
Expenditure
0%
Centrally
Sponsored
46%
0.00
100.00
200.00
300.00
400.00
500.00
600.00
Salary State
Panchayath
18
7.3
4
25
3.4
6
2010
39
: Average Expenditure of Mansa (Sample)Panchayat
Source: Table No.6
: Comparison of Expenditure of Mansa (Sample)
in 2010-11 and 2011-12 (Rs.in lakhs)
Source: Table No.6
Expenditure Details of Mansa (Sample)Panchayat Samithi
Expenditure (Rs. In Lakhs)
Salary
Panchayath
Capital
Expenditure
Revenue
Expenditure
Centrally
Sponsored
40.18989 0.355 2.10416 179.59
43.15625 0 1.86129 268.5964
41.67307 0.1775 1.982725 224.0932
Source: Data collected from Mansa Panchayat Samithi
Salary State
45%
Salary
Panchayath
9%
Capital
Expenditure
Revenue
Expenditure
0%
Centrally
Sponsored
Salary
Panchayath
Capital
Expenditure
Revenue
Expenditure
Centrally
Sponsored
40
.19
0.3
6
2.1
0
17
9.5
9
43
.16
0.0
0
1.8
6
26
8.6
0
2010-11 2011-12
Panchayat Samithi
(Sample)Panchayat
Samithi
Centrally
Sponsored
Total
179.59 409.5829
268.5964 567.0759
224.0932 488.3294
Total
40
9.5
8
56
7.0
8

20. In Mansa Zilla Parishad the availability of fund per year from different sources is
given in Diagram No. 15 and 39 percent of the fund is from two sources such as
RDF and MGNREGA and 11 percent is from
income from MGNREGA are decreased in the year 2011
in 2010-11 and is shown in the Diagram No.16.
Diagram No. 15: Average Fund Available of Mansa
Diagram No. 16: Comparison of Fund Available of Mansa
Parishad
Own
income
1%
Revenue
7%
MGNREGA
39%
0
1000
2000
3000
4000
Own
income
Liquor tax
15
.03
26
.52
14
.53
2010
40
the availability of fund per year from different sources is
given in Diagram No. 15 and 39 percent of the fund is from two sources such as
RDF and MGNREGA and 11 percent is from RDO. Own income, revenue and
income from MGNREGA are decreased in the year 2011-12 compared to the same
11 and is shown in the Diagram No.16. (Refer Table No. 7)
15: Average Fund Available of Mansa (Sample)Zilla Parishad
Source: Table No.7
16: Comparison of Fund Available of Mansa (Sample)
Parishad in 2010-11 and 2011-12 (Rs.in lakhs)
Source: Table No.7
Own
incomeLiquor tax
1%Untied fund
2%
RDO
11%
RDF
39%Revenue
7%
Liquor tax Untied
fund
RDO RDF Revenue MGNREGA
26
.52
28
.28
30
0.7
7
70
9.7
4
28
2.5
13
13
.91
39
.48
77
.76
39
0.6
2
16
57
.91
16
3.1
2010-11 2011-12
the availability of fund per year from different sources is
given in Diagram No. 15 and 39 percent of the fund is from two sources such as
Own income, revenue and
12 compared to the same
Zilla Parishad
(Sample) Zilla
MGNREGA Total
13
13
.91 2
67
6.7
5
10
74
.05
34
17
.45

Table No.7: Fund Available
Year Own
income
Liquor
tax
2010-2011 15.03 26.52
2011-2012 14.53 39.48
Average
Per Year
14.78 33.00
Source: Data collected from Mansa
21. Average expenditure of Mansa Zilla Parishad is given
(50 %) of the expenditure is from other schemes and 40 percent is from centrally
sponsored schemes. Only revenue expenditure is decreased in the year 2011
compared to the same in 2010
No. 8)
Diagram No. 17: Average Expenditure of Mansa
Diagram No. 18: Comparison of Expenditure of Mansa
Parishad
Other
Schemes
50%
0
1000
2000
3000
4000
Salary State
24
0.8
3
31
9.2
7
2010
41
Fund Available of Mansa (Sample)Zilla Parishad
Fund Available (Rs. In Lakhs)
Untied
fund
RDO
(Nutrition)
RDF Revenue
28.28 300.77 709.74 282.50
77.76 390.62 1657.91 163.10
53.02 345.70 1183.83 222.80
Source: Data collected from Mansa Zilla Parishad
Average expenditure of Mansa Zilla Parishad is given Diagram No.
(50 %) of the expenditure is from other schemes and 40 percent is from centrally
Only revenue expenditure is decreased in the year 2011
compared to the same in 2010-11 and is given in Diagram No. 18. (Refer Table
17: Average Expenditure of Mansa (Sample)Zilla Parishad
Source: Table No.8
18: Comparison of Expenditure of Mansa (Sample)
Parishad in 2010-11 and 2011-12 (Rs.in lakhs)
Source: Table No.8
Salary State
9%
Salary
Panchayath
1%
Capital
Expenditur
e
0%Revenue
Expenditur
e
0%
Centrally
Sponsored
40%
Schemes
Salary
Panchayath
Capital
Expenditure
Revenue
Expenditure
Centrally
Sponsored
Other
Schemes
29
.9
10 7.5
3
80
8.6
3
12
62
.25
40
.61
13
.55
4.2
1
17
25
.54
2010-11 2011-12
Zilla Parishad
MGNREGA Total
1313.91 2676.75
1074.05 3417.45
1193.98 3047.10
Diagram No. 17 and half
(50 %) of the expenditure is from other schemes and 40 percent is from centrally
Only revenue expenditure is decreased in the year 2011-12
(Refer Table
Zilla Parishad
(Sample) Zilla
Other
Schemes
Total
23
59
.15
18
76
.91
39
80
.08

42
Table No.8: Expenditure Details of Mansa (Sample)Zilla Parishad Year Expenditure (Rs. In Lakhs)
Salary
State
Salary
Panchayath
Capital
Expenditure
Revenue
Expenditure
Centrally
Sponsored
Other
Schemes
Total
2010-2011 240.83 29.90 10.00 7.53 808.63 1262.25 2359.15
2011-2012 319.27 40.61 13.55 4.21 1725.54 1876.91 3980.08
Average
Per Year
280.05 35.26 11.77 5.87 1267.09 1569.58 3169.62
Source: Data collected from Mansa Zilla Parishad
Conclusion
The verification brings out the extent of devolution carried out by the State of Punjab
in the recent years. It throws light on the current dynamics in devolution of power,
finances, functions and functionaries in the existing three tier system of Panchayati
Raj in the State. The process of decentralization in Punjab has not kept pace with
many other States in the country despite all its efforts in this regard. It could be argued
that devolution in Punjab is thriving to build successful models. The efforts of many
Panchayats in local resource mobilization, addressing the issues of social justice and
local economic development should not be left unnoticed.
As it is clear from the study the primary objective that is the Framework Criteria had
been fulfilled. Some of the major achievements include the formation of Election
Commission, State Finance Commission and The District Planning Committee. The
rate of participation in the Gram Sabhas is good and gives the real testimony of the
trust, efficacy and social capital among the people towards the Panchayats. Since it is
an agrarian society the two Gram Sabha meetings are related to the agriculture
seasonality of the State. However it is to be noted that no finance is being provided by
the State to convene grama sabhas. Even though the DPCs are constituted none of
them have submitted the district plans. The State has its own capacity building
framework to train the elected representatives and officials of the Panchayats. The
field verification shows that majority of the functionaries (both elected representatives
and officials) from the selected Panchayats had undergone training on different
subjects during last two years.

43
As far as the physical infrastructure the State have to move a long way. Only 48.12
per cent of the Gram Panchayats are having proper building (ghar) .All facilities of e-
connectivity are totally absent in the Gram Panchayats whereas it is available in all the
Panchayat Samities and Zilla Parishads .The absence of an institutional mechanism to
undertake the complaints of Panchayats other than government agency is a major
lacuna in the area of transparency and anti-corruption in the State. The institutions of
Panchayat Ombudsman and Lokayukta are yet to be introduced in the State. Social
audit is also in a rudimentary stage in the State. Once in a year, it is conducted only in
the domain of MGNREGA at the Gram Sabha meetings under the supervision of
Panchayat Samitis. No report of the social audit is put in public sphere. The parallel
bodies exist both at the village and the district level in the State. Many sections in the
State Act may create impediments in the autonomy of Panchayats.
The State of Punjab is in the forefront in constituting State Finance Commissions
(SFCs) in every five year. However, the PRI’s are not receiving any SFC grant owing
to issues of legalities. The funds are timely released based on the recommendations
from the National Finance Commission (NFC) and the fund flow from NFC is stable.
Electronic transfer system of funds has yet to be introduced in the State.
It is to be stated that decentralized planning for socio economic development and
social justice in its complete sense has not fully evolved. The decentralization and
devolution process is still in its initial stages. It is high time to clear all the backlogs
and address the existing gaps. A new approach is to be formulated in this regard which
would help in taking forward the decentralization process and will help in evolving a
new dynamics in local self governance. It could, however, be concluded by stating
that the information provided by the State is clear, legible and authentic.

44
Annexures
Annexure 1: Details of Gram Sabha of the Selected Gram Panchayats
Sl
No
Name of the Gram Panchayat Date of Gram Sabha
Meetings
No of Participants
1 Tugal 04/07/2011
22/12/2011
12/03/2012
172
126
119
2 Ghuman 23/06/2011
27/12/2011
05/03/2012
32
41
58
3 Heerkek 05/07/2011
06/07/2011
06/12/2011
10/01/2012
93
100
161
63
4 Hissowal 24/12/2011
22/06/2012
184
172
5 Kalloho 04/07/2011
08/12/2011
98
69
6 Kherakalan 02/07/2011
03/07/2011
13/12/2011
15/12/2011
172
123
144
151
7 Bagowal 02/06/2011
15/12/2011
06/03/2012
450
281
219
8 Jhanda Khural 04/01/2012
03/10/2012
16/12/2012
97
61
62
9 Katana 29/06/2011
31/12/2011
03/03/2012
251
210
95
10 Aspal 03/06/2011
18/12/2011
05/03/2012
102
98
111 Source: Data collected from the Panchayats

45
Annexure No. 2 : Details of NFC of the Selected Gram Panchayat
Sl No Name of the GP Year Date Amount (Rs.)
1 Tugal 2009-2010 10-10-2009 50154
2011-2012 25-04-2011 30331
2011-2012 06-05-2011 11000
2011-2012 04-07-2011 30000
Total 121485
2 Ghuman 2009-2010 18-06-2009 32367
2010-2011 05-06-2010 25903
2011-2012 26-05-2011 33000
2011-2012 28-07-2011 25000
2012-2013 30-08-2012 38245
Total 154515
3 Heerkek 2009-2010 1-10-2009 76179
2009-2010 11-03-2010 47606
2010-2011 08-11-2010 200000
2011-2012 08-11-2011 38352
2012-2013 10-10-2012 72771
Total 434908
4 Hissowal 2009-2010 31-10-2009 68971
2010-2011 08-06-2010 41710
2011-2012 28-04-2011 19000
2011-2012 04-08-2011 35000
2012-2013 28-09-2012 63000
Total 227681
5 Kalloho 2009-2010 01-09-2009 63751
2009-2010 16-01-2010 39393
2010-2011 27-12-2010 24650
2011-2012 21-07-2011 32214
160008
6 Kherakalan 2009-2010 03-10-2009 101740
2009-2010 25-02-2010 57382
2011-2012 24-11-2011 52872
2012-2013 11-10-2012 95104
Total 307098
7 Bagowal 2009-2010 19-06-2009 105826
2009-2010 15-03-2010 63981
2010-2011 18-01-2011 18964
2011-2012 09-05-2011 23252
2012-2013 08-08-2012 44737

46
Total 256760
8 Jhanda Khurd 2009-2010 07-10-2009 101606
2009-2010 08-03-2010 163419
2011-2012 08-11-2011 51601
2012-2013 11-10-2012 94978
411604
9 Katana 2009-2010 10-09-2009 20116
2009-2010 15-10-2009 12162
2010-2011 18-01-2011 15403
2011-2012 09-06-2011 4445
2012-2013 08-08-2012 19029
Total 71155
10 Aspal 2009-2010 08-09-2009 25460
2010-2011 02-05-2010 15466
2010-2011 15-12-2010 9910
2011-2012 01-08-2011 12935
Total 63771 Source: Data collected from the Panchayats
Annexure No.3: Details of NFC of the Selected Panchayat Samithi
Sl No Name of the Panchayat
Samithi
Year Date Amount (Rs.)
1 Sardur Garh 2010-2011 19-09-2010 2717700
2011-2012 08-11-2011 2544000
Total 5261700
2 Sudhar 2009-2010 18-06-2009 2410534
2009-2010 09-03-2010 1459749
2010-2011 12-01-2011 1399815
2011-2012 22-12-2011 2206000
Total 7476098
3 Budhlada 2009-2010 Information is Not
Available 6486000
2009-2010 Information is Not
Available 3872000
2010-2011 Information is Not
Available 3480000
2011-2012 Information is Not
Available 4425000
2012-2013 Information is Not
Available 5891000
2012-2013 Information is Not
Available 750000
Total 24904000
4 Dorha 2009-2010 19-06-2009 2180851
2009-2010 17-09-2009 1019977
2011-2012 09-05-2011 703542

47
2012-2013 30-08-2012 3033000
Total 6937370
5 Mansa 2009-2010 02-06-2009 5820000
2009-2010 07-07-2009 4141000
2012-2013 13-09-2012 3231000
2012-2013 10-10-2012 411000
Total 13603000 Source: Data collected from the Panchayats
Annexure No.4: Details of NFC of the Selected Zilla Parishad
Sl No Name of the Zilla
Parishad
Year Date Amount (Rs.)
1 Mansa 2009-2010 04-05-2009 21271000
2009-2010 07-12-2009 11243000
2010-2011 30-09-2010 10925000
2010-2011 02-02-2011 14258000
2012-2013 09-08-2012 17107000
2012-2013 10-10-2012 2177000
Total 76981000 Source: Data collected from the Panchayats
Annexure No. 5: Details on Available Fund from different sources and expenditure of
the selected 10 Gram Panchayats in Punjab for the year 2010-11
Sl
No
Name of
the GP
Fund Available (Rs) Expenditure
Own
income
NFC MGNREGA IAY RDF Piyka Total
1 Tugal 606500 606500 143530
2 Guman 337500 25903 363403 809361
3 Heerkak 150000 1150000 8190000 630000 10120000 10120000
4 Hissowal 446250 41710 487960 841571
5 Kalloho 291100 400000 691100 617516
6 Kherakalan 35000 1700000 375000 300000 2410000 2410000
7 Bagowal 15000 18964 33964 15000
8 Jhanda
Khurd
847000 900000 1747000 1747000
9 Aspal 1013329 1013329 44579
10 Katana 48000 48000 44000
Total 3789679
86577
3750000
8190000 1405000
300000 17521256 16792557
Source: Data collected from the Panchayats

48
Annexure No. 6: Details on Available Fund from different sources and expenditure of
the selected 10 Gram Panchayats in Punjab for the year 2011-12
Sl
N
o
Name of
the GP
Fund Available (Rs) Expenditur
e (Rs) Own
income
NFC MGNRE
GA
IAY RDF Total
1 Tugal 640000 71331 711331 968917
2 Guman 384825 58000 550000 992825 946125
3 Heerkak 269600 38352 3942000 630000 4879952 4879952
4 Hissowal 573300 54000 780000 1407300 858682
5 Kalloho 302000 32214 460000 250000 1044214 1023348
6 Kherakala
n
444400 52872 678000 1431000 2606272 2553400
7 Bagowal 20000 23252 500000 543252 500000
8 Jhanda
Khurd
869000 51601 3195399 126000 1110000 5352000 5352000
9 Aspal 1112108* 12935 253685 1378728 1122817
10 Katana 4445 675000 679445 616000
Total 4615233 399002 8275399 126000 19058685 19595319 18821241 * It includes amount received from railway for leasing the land
Annexure No. 7: Details on Available Fund from different sources of the selected
Panchayat Samiti in Punjab for the year 2010-11
Sl
No
Name of the
PS
Fund available (in Rs)
Own
income
Liquor
tax
MGNREGA IAY Non plan
untied
Non plan
tied
RDF Total
1 Budhalada 2574000 16500000 18857145 20733000 36491000 249960 95405105 2 Mansa 2133000 3100000 13824000 4135000 170000 19453000 8868000 51683000 3 Sardar Garh 680870 3800000 15343000 15570000 35393870 4 Sudhar 722168 1718490 1155554 678658 4274870 5 Dorha 478772 17496000 17974772 Total
6588810 42614490 49179699 41116658 36661000 19702960 8868000 204731617
Source: Data collected from the Panchayats
Annexure No. 8: Details on Available Fund from different sources of the selected
Panchayat Samiti in Punjab for the year 2011-12
Sl
No
Name of
the PS
Fund available (in Rs)
Own
income
Liquor
tax
MGNREGA IAY Non plan
untied
Non plan
tied
RDF Total
1 Budhlada 2860000 12080000 1335000 16279820 75765000 321550 1000000 109641370
2 Mansa 2278000 2380000 21937400 25947000 52642400
3 Sardur
Garh
5380000 12248000 22155000 1775650 37400000 9935000 88893650
4 Sudhar 856344 2389132 1018999 737895 5002370
5 Dorha 1145748 28750000 29895748
Total 12520092 16849132 14601999 39172715 106290650 59658950 36882000 285975538 Source: Data collected from the Panchayats
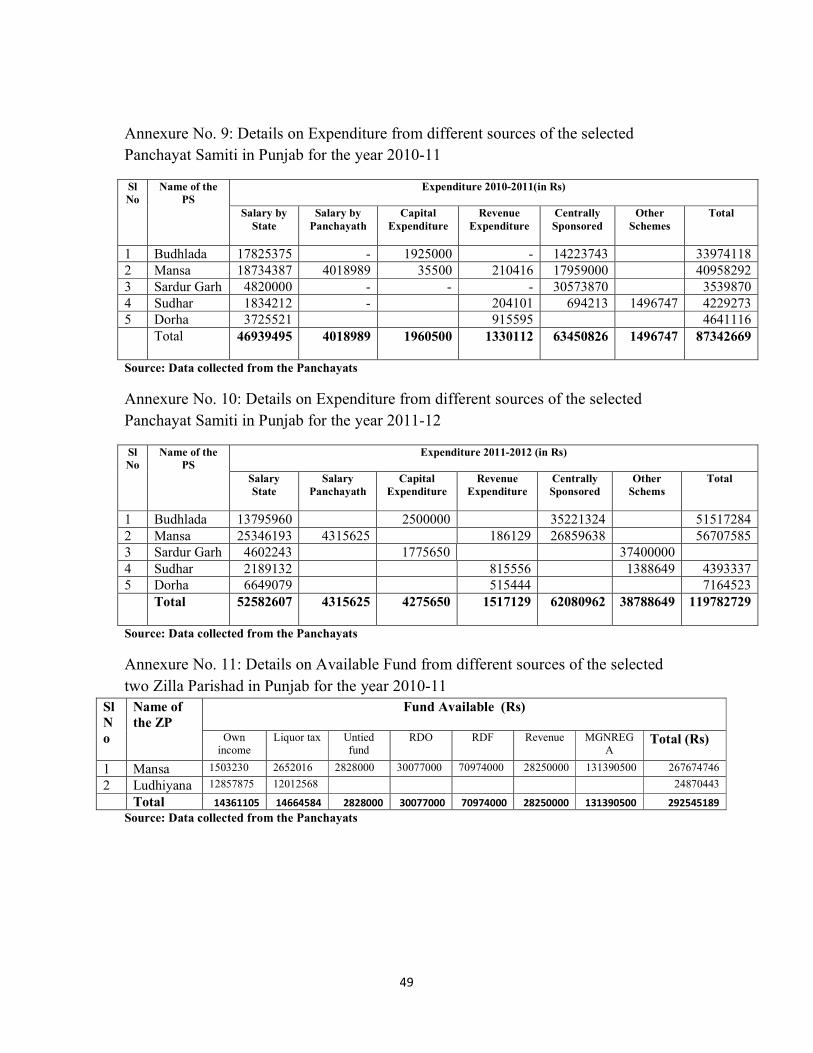
49
Annexure No. 9: Details on Expenditure from different sources of the selected
Panchayat Samiti in Punjab for the year 2010-11
Sl
No
Name of the
PS
Expenditure 2010-2011(in Rs)
Salary by
State
Salary by
Panchayath
Capital
Expenditure
Revenue
Expenditure
Centrally
Sponsored
Other
Schemes
Total
1 Budhlada 17825375 - 1925000 - 14223743 33974118
2 Mansa 18734387 4018989 35500 210416 17959000 40958292
3 Sardur Garh 4820000 - - - 30573870 3539870
4 Sudhar 1834212 - 204101 694213 1496747 4229273
5 Dorha 3725521 915595 4641116
Total 46939495
4018989 1960500
1330112
63450826
1496747 87342669
Source: Data collected from the Panchayats
Annexure No. 10: Details on Expenditure from different sources of the selected
Panchayat Samiti in Punjab for the year 2011-12
Sl
No
Name of the
PS
Expenditure 2011-2012 (in Rs)
Salary
State
Salary
Panchayath
Capital
Expenditure
Revenue
Expenditure
Centrally
Sponsored
Other
Schems
Total
1 Budhlada 13795960 2500000 35221324 51517284
2 Mansa 25346193 4315625 186129 26859638 56707585
3 Sardur Garh 4602243 1775650 37400000
4 Sudhar 2189132 815556 1388649 4393337
5 Dorha 6649079 515444 7164523
Total 52582607 4315625 4275650 1517129
62080962
38788649
119782729
Source: Data collected from the Panchayats
Annexure No. 11: Details on Available Fund from different sources of the selected
two Zilla Parishad in Punjab for the year 2010-11
Sl
N
o
Name of
the ZP
Fund Available (Rs)
Own income
Liquor tax Untied fund
RDO RDF Revenue MGNREGA
Total (Rs)
1 Mansa 1503230 2652016 2828000 30077000 70974000 28250000 131390500 267674746
2 Ludhiyana 12857875 12012568 24870443
Total 14361105 14664584 2828000 30077000 70974000 28250000 131390500 292545189
Source: Data collected from the Panchayats

50
Annexure No. 12: Details on Available Fund from different sources of the selected
two Zilla Parishad in Punjab for the year 2011-12
Sl
N
o
Name of
the ZP
Fund Available (in Rs)
Own income Liquor tax Untied fund RDO RDF Revenue MGNREGA Total (Rs)
1 Mansa 1453366 3948000 7776000 39062000 165791000 16310000 107405000 341745366
2 Ludhiyana 7812719 13400000 21212719
Total 9266085 17348000 7776000 39062000 165791000 16310000 107405000 362958085
Source: Data collected from the Panchayats
Annexure No. 13: Details on expenditure of the selected two Zilla Parishad in Punjab
for the year 2010-11
Sl
No
Name of the
ZP
Expenditure 2010-2011(in Rs)
Salary by
State
Salary by
Panchayat
Capital
Expenditure
Revenue
Expenditure
Centrally
Sponsored
Other
Schemes
Total
1 Mansa 24083000 2990233 1000032 753157 80863000 126225305 235914727
2 Ludhiyana 20792422 - - 1411763 - - 22204185
Total 44875422 2990233 1000032 2164920 80863000 126225305 258118912
Source: Data collected from the Panchayats
Annexure No. 14: Details on expenditure of the selected two Zilla Parishad in Punjab
for the year 2011-12
Sl
No
Name of the
ZP
Expenditure 2010-2011
Salary
State
Salary
Panchayath
Capital
Expenditure
Revenue
Expenditure
Centrally
Sponsored
Other
Schems
Total
1 Mansa 31927000 4060828 1354511 420943 172554000 187691000 398008282
2 Ludhiyana 25955987 - - - - - 25955987
Total 57882987 4060828 1354511 420943 172554000 187691000 423964269
Source: Data collected from the Panchayats
Annexure No. 15: Infrastructure Facilities
Sl
No
Name of the GP Pucca Building Furniture Computer
Printer
Scanner Phone Interest
1 Tugal No 20 Chair 2 Table No No Yes (1) No
2 Guman Yes 15 Chair Table No No Yes (1) No
3 Heerkak Yes Chair – 40
Table-2
Stool -20 Cupboard -2
No No No No
4 Hissowal Yes 10 Chair 1 Table No No Yes (1) No
5 Kalloho Yes 12 Chair 1 Table
1Cupboard
No No Yes (1) No
6 Kherakalan Yes Chair-8
Cupboard-1
Tabe-1
No No Yes (1) No
7 Bagowal Yes Chair -15 Table- No No Yes (1) No

51
1 Cupboard
8 Jhandakhurd Yes 20 Chair, 2
Table,
1 cupboard
No No Yes (1) No
9 Aspal Yes 1 Table
23 Chair 1 cupboard
No No No No
10 Katana Yes 6 Chair 1 Table
No No Yes No
Source: Data collected from the Panchayats
Annexure No. 16: Physical Infrastructure Panchayat Samithi(Punjab)
Sl
No
Name of
the PS
Pacca
Building
Computer&Printer Scanner Telephone Internet
1 Budhlada Yes 2Computer&2Printer 1 Nos 1 Nos 1 Nos
2 Mansa Yes 2Computer&2Printer 1 Nos 1 Nos 1 Nos
3 Sardur
Garh
Yes 3Computer&3Printer 1 Nos 1 Nos 1 Nos
4 Sudhar Yes 5Computer&5Printer 1 Nos 1 Nos 1 Nos
5 Dorha Yes 2Computer&2Printer 1 Nos 2Nos 1 Nos
Source: Data collected from the Panchayats
Copyright © 2022 FDOKUMEN