ifile copy - World Bank Documents
132
Las<-><7-TQ IFILE COPY DOCUMENT OF INTERNATIONAL BANK FOR RECONSTRUCTION AND DEVELOPMENT INTERNATION):L DEVEL(2MENT ASSOCIATION Not For Public Ui; ,,,e, C$!e-E,' L~ '-"y TQ BL - 1 1z? ' U, zf :-- f; r-^ AReport No. 46-IN APPRAICAL OF NANGAL FERTILIZER PROJECT FERTILIZER CORPORATION OF INDIA INDIA January 2, 1973 Industrial Projects Department This report was prepared for official u se only by the Bank Group. It may not be published, quoted or cited without bink Group authorization. The Bank Group does not accept responsibility for the accuracy or completen;-sof thc report. Public Disclosure Authorized Public Disclosure Authorized Public Disclosure Authorized Public Disclosure Authorized
-
Upload
khangminh22 -
Category
Documents
-
view
2 -
download
0
Transcript of ifile copy - World Bank Documents
Las<-><7-TQ IFILE COPYDOCUMENT OF INTERNATIONAL BANK FOR RECONSTRUCTION AND DEVELOPMENT
INTERNATION):L DEVEL(2MENT ASSOCIATION
Not For Public Ui;
,,,e, C$!e-E,' L~ '-"y
TQ BL - 1 1z? ' U, zf :-- f; r-^ AReport No. 46-IN
APPRAICAL OF
NANGAL FERTILIZER PROJECT
FERTILIZER CORPORATION OF INDIA
INDIA
January 2, 1973
Industrial Projects Department
This report was prepared for official u se only by the Bank Group. It may not be published, quotedor cited without bink Group authorization. The Bank Group does not accept responsibility for theaccuracy or completen;-sof thc report.
Pub
lic D
iscl
osur
e A
utho
rized
Pub
lic D
iscl
osur
e A
utho
rized
Pub
lic D
iscl
osur
e A
utho
rized
Pub
lic D
iscl
osur
e A
utho
rized

CURENCY EQIUVALEIUTS
, 1.0 = $0.137bls 7.28 $1.0Rs 1,000,000 = '137,40o
WEET=G. A,'D F7AURE.3
All weights and measures are in metric units1 Metric Ton (t) = 1,000 Kilograms (kg)1 Metric Ton (t) = 2,20L Pounds1 Kilometer (kn) = 0.62 Miles1 Hectare = 2.47 Acres
PRINCIPAL- ABRE7IATIOiS AND ACRq0I4YS USED
GOT, Government The Central Government of IndiaFCI, Coor-oration The Fertilizer Corooration of lndiaP & D Pia-in3ng and Development Divison of FCIFACT '-'ertilisers and Chernicals-Travancore-Ltd.indian Ujiil Indian Oil Corporation Ltd.P31:3 F-ILlPnjab 5tate Electricity PoardC mP 'Jnitad lations 1ievelonment Procran-eTPY 'etric Tons Per YearT7.D Metric Tons Per DayCIF Cost, lnsurance and iFreightF02 Free On Board
Fee l-egawattI4VH Megawatt "ourr%.i.' H Kilowatt hour4 '?Iitrogen
Fiscal fear
April 1 - March 31

NANGAL FERTILIZER PROJECT
TABLE OF CONTENTS
Page No.
SUMMARY AND CONCLUSIONS ................................ i
I. INTRODUCTION ...o ....................................... 1
II. FCI'S OPERATIONSA. History and Organization ........... .. 1............. B. FCI Management ...................... 2C. Financial Analysis of FCI - Past and Future ....... 3
III. NANGAL'S OPERATIONSA. Production Facilities ............................. 7B. Financial Analysis of Existing Nangal -
Past and Future ................................. 8C. Availability and Cost of Power .................... 9
IV. MA&KET AND MARKETINGA. Past Fertilizer Growth in India .... ............... 10B. Fertilizer Market Forecast for India .... .......... 11C. Fertilizer Markets in Northern India .... .......... 12D. Nangal Marketing System ........... a ............... 13
V. THE NANCAL EXPANSION PROJECTA. Project Scope .. ................................ 14B. Project Description ............................... 15C. Raw Materials and Utilities ........................ 15D. Employment ................... I .................... 16E. Ecology ........................................... 16
VI. PROJECT COST AND FINANCIAL PLANA. Capital Costs ..................................... 17B. Working Capital Requirements .. 18................... t8C. Financial Plan ... ..... e ........ .................. 18D. Allocation of IDA Credit ........... .. ............. 19
VII. PROJECT EXECUTIONA. Project Management and Execution .................. . 20B. Project Scheduling, Procurement and
Contractor's Guarantees ......................... 20
VIII. FINANCIAL ANALYSIS OF THE PROJECTA. Revenues and Operating Costs ...................... 21B. Feedstock Costs ................... 22C. Financial Forecasts ............................... 22D. Financial Return .................... I 24E. Risk ............. ................................. 24
IX. ECONOMIC ANALYSIS OF THE PROJECTA. Urea World Market Prices ........................ 26B. Economic Return and Competitive Position vis-a-vis
Imports ....................................... 26C. Foreign Exchange Aspects ........................ 27
X. RECONiiENDATIONS ....................................... 27
ANNEXES
1 Technical Terms2-1 FCI - Description of the Corporation2-2 FCI - Existing Units and Planned Expansion Program2-3 FCI - Management - Board of Directors2-4 FCI - Organization Chart2-5 FCI - Consolidated Income StateAnents (1964-72)2-6 FCI - Consolidated Income Statements, Forecast2-7 FCI - Comparison of Capacity and Production of Operating Units2-8 FCI - Production Forecasts2-9 FCI - Consolidated Balance Sheets (1964-72)2-10 FCI - Consolidated Balance Sheets, Forecast2-11 FCI - Consolidated Source and Application of Funds (1964-72)2-12 FCI - Consolidated Lo'.rce and Application of Funds Statements,
Forecast
3-1 Nangal Unit - Existing Operations at Nangal3-2 Nangal Unit - Income Statements without Expansion3-3 Nangal Unit - Balance Sheets without Expansion3-4 Nangal Unit - Source and Applicaticn of Funds Statements,
without Expansion3-5 Nangal Unit - Availability and Cost of Power
4-1 Past and Present Fertilizer Situation in India4-2 Market Forecast for India4-3 State of Agriculture in Lhe Nangal Marketing Area4-4 The Nangal Marketing System and Environment
5-1 Nangal Unit after Expansion - Schematic Flowsheet5-2 Nangal Expansion Project - Technical Description
6-1 Nangal Expansion Project Capital Cost Estimates6-2 Nangal Unit after Expansion - Working Capital Requirements6-3 Nangal Expansion Project - Projected Disbursement of IDA Crec t
7 Nangal Expansion Project - Implementation Schedule

8-1 Nangal Unit before and after Expansion - Income Statements -Forecast
8-2 Nangal Expansion Project - Iocremental Income Statements8-3 Nangal Expansion Project - Assumptions for Financial and Economic
Revenues and Costs8-4 Nangal Unit after Expansion - Balance Sheets - Forecast8-5 Nangal Unit after Expansion - Source and Application of Funds
Statements - Forecast8-6 Nangal Unit after Expansion - Financial Break-Even Chart
9-1 Nangal Expansion Project - Rates of Return and Sensitivities9-2 Urea World Market Prices9-3 Nangal Expansion Project - Economic Return Sensitivity to Different
Price Assumptions for Urea (Chart)9-4 Nangal Expansion Project - Incremental Annu:" Foreign Exchange Savings
Map 1 Present and Proposed Major Fertilizer Plants in India.
This report has been prepared by Messrs. D. Brown, M. Ferber, R. Pigossiand C. Pratt of the Industrial Projects Department.

SUMMARY AND CONCLUSIONS
i. This report appraises a proposed project for the exparsion of theNangal unit of the Fertilizer Corporation of India (FCI), a Govf'rnment ofIndia (GOu) owned entity and the largest fertilizer producer ir the country.Estimated total cost of the project is US$105.6 million equivalent includinga mAximum of about US$58 million in foreLgn exchange, which the InternationalDevelopment Association has been asked ta provide. Ine proceeds of the IDAcredit would be re-lent to FCI at 8.5% and be used primarily to financeinternationally-bid equipment, engineerirg, erection and process licenses.The remainder of the financing required, about US$48. million, would be pro-vided by the Government as equity funds.
ii. Located in the State of Punjab in Northern India, the existingNangal - -nt has an annual design capacity of 80,000 tons per year of nitrogenin the t of calcium azmonium nitrate (CAN) fertilizer and 14 tons peryear of i zt heavy water. The expansion project would add 152,000tons per nitrogen in the form of urea, India's most popular andeffective LeL.' izer. This tonnage is adequate to stimulate production of10 million tons of food grains annually based on India's current nitrogento food giain ratio. Furthermore, the project by replacing the high powerconsuming, electrolysis section of the present, fully depreciated ammoniaplant, would permit the release of a large amount of hydroelectric powerfor more economic uses in the area. Manufacture of heavy water would bediscontinued, but existing fertilizer production (CAN) and off-site facili-ties would be retained. Thsefeedstock for the existing and additionalfertilizer production would be heavy fuel oil of which, in contrast tonaphtha, India has relatively ampYe quantities at its disposal.
iii. The Nangal unit Fegan operations in 1961 and has been FCI'smost profitable plant because it haa been operated efficiently and becauseof a low power price, of about one fourth of the present opportunity cost ofpower. The plant operated consistently at close to full capacity untilpower shortages arose about two years ago. These have reduced fertilizeroutput by about 30%. The power shortages are likely to continue and arean added reason for shutting dowa the existing electrolysis - ammonia plant.Nangal has no outstanding long-term debt.
iv. The project forms part of an ambitious expansion program of FCI,involving several plants now under construction and others in an advancedplanning stage, that by 1980 is to increase nitrogenous and phosphaticfertilizer production 5.4 and 9.3 times respectively over 1970 levels.While projects have been financed on a conservative 50:50 debt to equityratio, FCI's earnings record has been unsat4sfactory (about 1.5% returnon capital in recent years) due mainly to operating problems in existingplants and serious delays in plant construction. In the next two yearsannual losses of about Rs. 20 million are anticipated for FCI because ofcontinuing production difficulties plus the expected start-up losses ofthree large fertilizer plants which are more than two years behind schedule.
- ii -
During that period, the ability of FCI to service debt out of its ownresources without help from the Government will be limited but GOI recognizesthis fact and is demonstrating not only a willingness to provide the neces-sary financing, but also attack the causes of the problem.
v. Thereafter, FCI's financial situation should show substantial im-provement provided it will devote a major portion of its energies to bring-Ing new plants into operation more quickly and to increasing overall utili-zation of existing capacity. An examination of the Corporation's furtherexpansion plans is needed to bring them better in line with FCI's resources -human, technical and financial. Therefore, FCI and GOI propose to takedecisive steps to overcome FCI's :resent and anticipated difficulties andurgently concentrate efforts directed primarily towards maximum use of exist-ing capacity with a critical review of proposed new plants.
vi. In executing the Nangal project, commercially proven processeswill be used and FCI will be the overal contractor; however, much of theengineering and procurement has been made the responsibility of the ammoniaplant contractor (Uhde, F.R. of Germany) and the urea plant contractor(Montedison, Italy). PCI has appointed a suitable project manager and hisresponsibilities plus a detailed project implementation plan have been jointlydefined by FCI and the contractors. Thus there is reasonable assurance thatthe project will be executed on schedule and without major technical diffi-culties. It is expected that the project will start commercial productionin December 1975 after a construction period of about 34 months.
vii. Based on detailed marketing studies, no problems in sellingNangal's urea are foreseen. India will continue to face a nitrogen fertili-zer shortage throughout the 1970's, especially in Nangal's main sales area -Punjab, Haryana and Northern Rajasthan - where most farmers are progressive,irrigation is extensive and nitrogen consumDtion ner unit of cropped area isover three times the national average. Well developed private dealer andcooperative distribution systems exist, backed by adequate storage, trays-portation and credit facilities. Furthermore, even if all approved ureaprojects within commercial reach of the marketing aLea were completed onschedule and operated as planned, there would still be a demand for fertil-izer .equivalent to the production of two more large nitrogen fertilizerplants in Northern India.
viii. Upon project complction, the Nangal unit is expected to have asatisfactory financial structure (debt/equity ratio of 35:65 and debt ser-vice coverage well above two). Export urea prices have recently significantlyincreased, reflecting in part rising investment costs and also operatingcosts in major supolying countries. Nevertheless, a conservative ureaimport price of US$65 per ton, c.i.f. India has been assumed to determinethe economic rate of return of the project. On this basis, the economicrate of return of the project is about 15%, which is very satisfactory fora fertilizer project. If revenues and costs of the project are consideredon an incremental basis, and thereby include the power savings from shut-ting down part of the existing plant the economic return would be even greater
- iii -
(about 22%). The return is sensicive to changes in sales prices, projectdelay3 and to a lesser degree, fluctuations in raw material prices, andoperating levels. Even if operating levels were reduced from 90% to 85% ofcapacity, and the project was delayed by one year - this probably being thesingle most serious risk the project faces - the economic return would stillbe about 10%.
ix. Apart from the workers required during project construction and inthe fertilizer distribution system, the use of additional labor will be small,since existing labor from the phased-out ammonia plant will be largely usedto staff the expanded plant. There will be significant foreign exchangebenefits; the net annual foreign exchange savings are estimated at US$13million, once the plant is operating normally at its predicted level of 90%of capacity. The ecological effects of the proposed project have beenassessed and are considered minimal.
x. The Bank Croup has recently been active in the fertilizer fieldin India. IDA has made tno credits for expansions by the government-ownedFertilisers and Chemicals-Travancore-Ltd., (FACT) in Cochin and the FCIGorakhpur Unit. These have experienced some delays but are now proceedingsatisfactorily. IFC has participated in two private sector projects:Indian ExplDsives Ltd., in Kanpur, Uttar Pradesh and Zuari Agro ChemicalsLtd., in Coa. Indian Explosives, a competitor of Gorakhpur is alreadyoperating and Zuari Agro is about to commence operations. rhe Bank is alsoExecuting Agencv for a tN P project evaluating phosphate deposits inRajasthan. The Bank Group, in addition, is currently considering two otherfertilizer projects: FCI Trombay near Bombay and Tata Chemicals in GujaratState.
xi. Based on the agreements rea.hed during negotiations, the projectis suitable for an IDA credit of US$58 million.

I. INTRODJCrION
1.01 The Government of India (COI) has requested financing from theInternational Development Association (IDA) equivalent to USS58 millionwhich is the maximum estimated foreign exchange requirement to expandfacilities at the Nangal Unit of the Fertilizer Corporation of India (FCI).The expansion would add 330,000 metric tons per year (TPY) of urea capacity,equivalent to 152,000 TPY of nitrogen (N), to the existing calcium ammoniumnitrate (CAN) plant (80,000 TPY of N) and replace the ammonia section of theexisting plant at Nangal which is based on a power-intensive process.
1.02 Nangal, located in Punjab State, abotut 100.km north-west ofChandigarh, is one of five FCI operating units (Map IBRD 3559 R2). Theplant, which began production in 1961 1/ has until 1971 consistently oper-ated at high levels of available capacity and has significantly contributedto FCI's profits and cash generation. Nangal's profitability, however,largely results from the low price it pays for power. Conversely, *n recentyears capacity utilization and earnings have oeen substantially affected bypower shortages, which are expected to continue.
1.03 The Nangal project was identified by an IDA mission in June/July1969 and a feasibility study was submitted to the Bank in early 1971. Afterthe first appraisal mission in August/September 1971 three basic projecEalternatives were discussed between IDA, FCI and GOI out of which the alter-native now proposed emerged.
1.04 This appraisal report was prepared by Messrs. Donald Brown,Manfred Ferber, Richard Pigossi and Christopher Pratt of the IndustrialProjects Department, based on missions to India in August 1971, June andAugust 1972.
1.05 A glossary of technical terms used in the report is attached asAnnex 1.
II. TIE FERTILIZER CORPORATION OF INDIA (FCI)
A. History and Organization
2.01 FCI was incorporated in 1961 under the Companies Act of India,representing a merger of two existing public sector companies - SindriFertilizers and Chemicals Ltd. at Sindri, Bihar and Hindustan Chemicals ,andFertilizers Ltd. at Nangal, Punjab. These two companies began productionin 1948 and 1961, respectively. The Corporation's authorized share copitalat present is Rs 2,000 million (US$275 million) with Rs 1,375 nillion in
1/ All years refer to fiscal years ending March 31.

-2-
shares outstanding and paid in, all owned by GOI. FCI is the largest pro-ducer of fertilizer in India with 30% of nitrogen and 10% of phosphatecapacity. Given FCI's large expansion program, its market share will growsubstantially through the 1970's. a12.02 The operating units (or divisions) are (1) Trombay, (2) Nangal,(3) Gorakhpur, (4) Sindri and (5) Namrup. Another division, Planning andDevelopment (1 & D), is responsible for engineering, research and develop-ment. In addition, the Corporation has several major projects under con-struction: (1) Durgapur, (2) Barauni, (3) Namrup Expansion, (4) Ramagundam,(5) Talcher, (6) Sindri Rationalization, (7) Corakhpur Expansion, 2/ (8)Haldia, and (9) Korba. Three other projects are being actively consideredby FCI, namely (1) Nangal Expansion - the sublect of this report - (2) TrombayExpansion, and (3) Sindri Expansion. These divisions and projects are de-scribed in Annex 2-2 including capacities and capital costs. After cempletionof the expansion program in the late 1970's, FCI will have an installed fer-tilizer capacity of about 2.2 million TPY of N and 0.4 million TPY of phosphate(P?0'/ and should then be one of the largest fertilizer companies in the world.
2.03 Exlsting employment of the Corporation is approximately 19,000people; this is high even recognizirg that this figure includes not onlyoperating personnel but also ancillary employment for company-operatedschools, hospitals, town.hips and trainirg programs at each factory.
B. FCI Management
2.04 FCI is managed by a 12-member Board of Directors of which fiveare senior officers of FCI, three are from Government mi;uistries, two fromgovernment-owned corporations and two from other industries (Annex 2-3).The present Chairman of the Board is Mr. H. N. Sethna and the ManagingDirector is Dr. K. R. Chakravorty. The Board is designed to function as apolicy-making and controlling body and as a liaison and coordinating groupbetween FCI and the Government. The influence of GOI on operations, financeand expansion planning is felt strongly in the Corporation's management.
2.05 The Managing Director and four Functional Directors (Productionand Marketing, Project, Finance, and Personnel) direct the Corporation'soverall policy, growth and daily operations through a "Committee of Manage-ment." 3/ These officers, who are also on the Board, in effect are selectedby GOI although formally they are appointed bv the Board. The Functional
I/ A more detailed description of the Corporation is shown in Annex 2-1.,
'/ Partly financed by an IDA Credit of US$10 million (Credit No. 279 - IN,dated December 22, 1971).
I/ An organization chart of the Corporation is shown in Annex 2-4.
-3 -
Directors' posts are now filled by men with substaratial industrial experi-ence in FCI. Improvement in corporate management &iince the IDA mission inJune/July 1969 is evident, but, furtheL improvement is needed. f
2.06 Each unit is managed as a separate cost center and day-to-dayp:oduction functions are controlled by the Unit General Managers. FC'.senior management is aware of the continuing problems it faces in correct-ing deficiencies in operation and project implementation. These have serl-ously burdened management and financial results. The Cor,,ration's futurewill depend on the extent to which these deficiencies are overcom,e. Thelarge expansion program has created a need for a breat number o- experiencedstaff at the higher middle management level for both the execution of pro-jects and their operation. Filling these positions with qualified personneland improving iPS organization to implement new projects effectively, is oneof the biggest challenges currently facing FCI's senior management. The in-crease in operating activity and sales volume, resulting from great expan-sion projects expected to be completed during the forthcoming years, willalso require better management techniques, especially financial reportingand planning and the buildup of a more efficient marketing system in certainareas.
C. Financial Analvsis of FCI - Past and Future
2.07 Historical and projected income statements for FCI throligh 1981are shown in detail in Annexes 2-5 and 2-6 and are summarized bSlow up to1975:
-4
Summary Income 'tatements for FCI(Millions of' Rs)
ACTUAiM FORECAST-./Fiscal Years (Ending lNarch 31; 1968 1969 1970 1971 1972 13 1974 1975
Number of perating Plants 3 4 5 5 5 6 8 9Aitrogen Production as %of Capacity 69 70 76 68 69 74 68 75
Phosohate Produ,ction as %of Ca,.acity2/ 39 48 39 48 76 65 65 82
.ales (axcluding Excise Duty)Y/ 393 483 597 730 897 908 1160 1526Costs of Goods $old 141 198 221 293 380 339 410 474inventory Changes 6 32 48 (15) (60) - - -
Gross Profit 258 317 424 422 457 569 750 1052C0erating Rxpenses 163 182 260 277 310 413 507 586Deoreciation 74 85 117 119 120 151 215 266Interest on tong-Term DebtV 24 25 38 29 22 30 51 68",her Income (less: OtherAxpenses) 11 1 8 17 16 1 1 (6)
Net Tncom. (before taxes)&/ 8 26 17 14 21 (24) (22) 126
N4et Incame 9s % of CapitalEmfloyecf' 0.9 1.9 1.3 1.3 1.9 (1.6) (1.0) 5.6
Debt Service Coverage 1.3 1.5 1.6 1.2 0.9 0.9 1.2 1.9
1/ tosses in 1973 and 1974 mainly result from start-up of large new plants.2/ Dacrease in capacity utilization in 1973 and 1974 due to switch t-o lower
nhosDhate content in finished products Ltsed on marketing aspects of 1rombay unit.3/ Lncludes sales of nurehased fertilizer (1971: Rs 46 million; 1972: Rs 102
m.iLlion).E Excludes interest on rrcjects under construction which is capitalized.
2/ The Cornoration is not expected to incur income tax liabilities before1980.
bi Capital Employec defined as working capital, net fixed assets (excludingTro.,Iects under construction) and other assets.
2.08 FCI has been profitable in all but one year since 1961 but itsearnings have been unsatisfactory. During the period 1968-72 net profitsaveraged 3% of sales and represented an average of about 1.5% return on capi-tal employed. This poor showing is caused by the operating losaes of severalunits as well as the considerable construction delays in implementing newproJects. Production (in terms of N) averaged about 70% of design capacityover the past five years (Annex 2-7). Considering individual existing plants,the losses at Sindri (Rs 34 million in 1972), the Corporation's oldest and bynow largely obsolete plant, have particularly affected FCI's financial re-sults and offset the favorable development of other plants. Sindri's per-formance cannot be expected to improve substantially in the forthcoming twoyears until a modernization project, now being implemented, is completed.Production performance of the other FC1 plants in general has improv'- overthe past years. At Nanga] performance has deteriorated d*ie to a power short-age which is beyond FCI's control. Trombay and Namrup, which commenced op-erations in 1966 and 1970 respectively, have improved to about 70% capacityutilization in the past year and Trombay's performance has further improvedduring the current year.
2.09 Additional to FCI's difficulties in overcoming operational problemsin the existing plants is the likelihood of similar problems in the large-scale plants, shortly nearing completion (Durgapur, Barauni, Namrup), eachmore than two years behind schedule. Even assuming satisfactory oroductionlevels after start-up, the financial burden of lost production and capitalcost overruns due to delays are seriously affecting FCI's financial per-formance theagh all costs -- mainly financed wi'2l funds from OI -- arecapitalized until the projects operate commercially. The estimated produc-tion losses in 1972 from the under-utilization of existing plants (below90a' of designed capacity) equal about 85,000 tons of nitrogen and those ofthe three large projects which are seriously delayed an additional 400,000tons equivalent to an estimated import value of about US$65 million. Tofurther illustrate the costliness of Gelays and under-utilized capacity, anassumed proiect with an estimated 15;' rate of return over its life would findthis return virtually eliminated if there was a two year delay in completioncombined with a 10% cost overrun or a zero return if the plant would continueto operate at about 70%1 of capacity. Recently both the Government and FCIhave become increasingly aware of this problem and are taking definite stepsfor overcoming it. Also IDA has specifically structured the fertilizerprojects it is helping to finance to minimize these deficiencies.
2.10 Income projections for the Corporation (Annex 2-6) show net lossesfor the next two years, mainly because of expected start-up losses for newplants. Thereafter, FCI should have stead.ly increasing earnings but theirlevels will largely depend on the operating performance of the three newlarge plants (Durgapur, Barauni, Namrup) and -- though to a lesser extent --to increased capacity utilization in the existing factories. The forecastsare based on assumptions for capacity attainmen' (Anaex 2-8) and new projectimplementation schedules, that, although reasonable, may prove optimisticbased on FCI's past record unless GOI and FCI effectively resolve FCI'scurrent problems and follow a sound plan of further growth which does not

-6-
overtax the Coporation's resources. Since FCI intends to increase its pro-durtion fourfold by 1979 from its present level, the importance of FCI'sexpansion program for its future financial position as well as for the fer-tilizer production in India becomes obvious. Also in view of FCI's respon-sibilities to optimize the use of its human, technical and capital resources,it should concentrate its efforts even more to overcome the difficulties en-countered in the implementation of current projects and operations and notconsider further expansion projects until these difficulties will have beenlargely overcome. In preparing its fertilizer program for the Fifth Five-Year Plan (April 1, 1974 - March 31, 1979) the Government is now systemat-ically studying the broader issues connected with it, including the organ-izational and management structure of the public sector. The Associationwill have an opportunity to discuss the issues with the Government withinthe next 'ew months.
2.'1 Historical and projected balance sheets for FCI (Annexes 2-9 and2-1J) are summarized below:
Summary Balance Sheets for FCI(Millions of Rs)
Fiscal Years ACTUAL FORECAST'-(Ending March 31) 1968 1969 1970 1971 1972 1973 1974 1975
Current Assets 325 457 450 476 452 506 596 845Less:Current Liabilities 249 300 318 413 507 405 476 719
WorKing Capital 76 157 132 63 (55) 101 120 126Net Fixed AssetsOperating Plants 776 1192 1151 1105 1074 1439 2168 2103Projects Under
Construction 586 416 823 1142 1492 1772 1807 2436Other Assets 20 20 24 21 62 55 58 79
1458 1735 2130 2331 2573 3367 4153 4744Less:Net Long-Term Debt 656 892 998 1010 1011 1282 1584 1790Net Worth 802 893 1132 1321 1562 2085 2569 2954
Current Ratio 1.3:1 1.5:1 1.4:1 1.2:1 0.9:1 1.2:1 1.2:1 1.2:1Debt/Equity Ratio 45:55 50:50 47:53 43:57 39:61 38:62 38:62 38:62
/1 For Forecasts beyond 1975 see Annex 2-10.
2.12 Historical balance sheets show that FCI has been financed on asound basis with a present debt/equity ratio of about 40:60 (Annex 2-11).As a rule GOI at present finances FCI's projects 50% by debt and 50% byequity after consideration of cash surpluses of existing operations on a

-7-
corporate basis. The fi::ed assets of FCI show the large amount for projectsunder construction (about Rs. 1.5 billion) as compared to a net value of theexisting plants of about Rs 1.1 billion. Total capital costs for the projectsunder construction (Annex 2-2) are estimated at about Rs 5.6 billion (US$770million) and for the projects under consideration at Rs 2.2 billion (US$290million).
2.13 With low profits and high debt service obligations, partly causedby the delayed projects under construction, FCI would have difficulties asan independent company in meeting its debt service out of its own resourcesin the forthcoming year. However, since the Corporation's debt/equity ratiois low, the debt service ratio is expected to imprnve rapidly in future yearseven if FCI does not fully achieve the projected pro.its (Annex 2-12).
2.14 During negotiations, assurances were obtained that GOI will providethe necessary funds to FCI to meet its financial obligations, particularlyto maintain a current ratio of FCI of at least 1.2:1 and not declare dividendsor prepay any of its debt to GOI or others if such payments would reduce itscurrent ratio below 1.5:1, as already stated in the IDA Development Creditfor FCIts Gorakhpur fertilizer plant expansion.
III. NANGAL'S EXISTINC. OPERATIONS
A. Production Facilities
3.01 The present Nangal Unit, which began production !n 1961, has adesign capacity of 100,000 TPY of ammonia (310 TPD) based on the electrol-ysis of water (Annex 3-1). The ammonia is converted first to nitric acidand then to CAN, a rather low nutrient fertilizer (25% of N as compared to46% of N in urea) with a capacity of 80,000 TPY N. The electrolysis ofwater consumes a large amount of power (149 FW) and uses no natural gas orpetroleum feedstock as do most modern ammonia plants. The plant containsall necessary ancillary facilities such as maintenance shops, storage, powerand steam facilities, offices and township; it is located on the Sutlej Rivernear the Bakhra Dam in Punjab State. Transportation and distribution facil-ities in that area are well developed.
3.02 Heavy water (14,000 kg per year design), which is used in theatomic energy industry, is also produced from the hydrogen gas followingelectrolysis. All hydrogen (about 19,000 TPY) passes through the heavywater plant, but only a negligible fraction (2.5 TPY) is removed xnd con-verted to heavy water. The remaining hydrogen is processed into ammonia.
3.03 Except for the electrolysis and heavy water sections, the Nangalfactory represents conventional and commercially accepted technology (Annex3-1) although production units are small by today's standardis. Tne Nangalplant has always been operated and mnaintained well. Top management, recent-ly changed, is complemented by good middle management. No serious laborproblems have been experienced at Nangal in recent years.
-8-
B. Financial Analysis of Existing Nangal - Past and Future
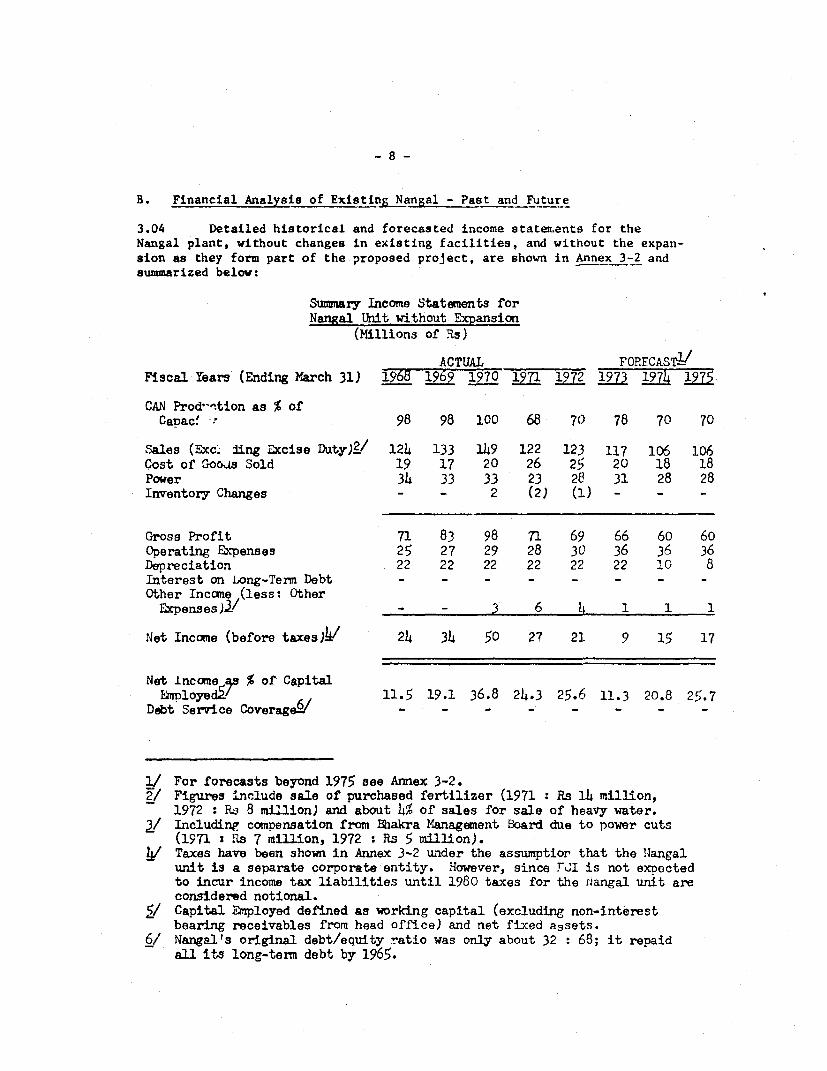
3.04 Detailed historical and forecasted income statements for theNangal plant, without changes in existing facilities, and without the expan-sion as they form part of the proposed project, are shown in Annex 3-2 andsummarized below:
Summary Income Statements forNangal Unit without Expansion
(Millions of Rs)
ACTUAL FORECAST "'Fiscal Years (Ending March 31) 1968 1969 1970 1971 1972 1973 1914 U72
CAN Prod'-ntion as % ofCarac! r 98 98 100 68 70 78 70 70
Sales (Exc:. ding Excise Duty)Z/ 124 133 149 122 123 117 106 106Cost of Goods Sold 19 17 20 26 25 20 18 18Power 34 33 33 23 28 31 28 28Inventory Changes - - 2 (2) (1) - - -
Gross Profit 71 83 98 71 69 66 60 60Operating Expenses 25 27 29 28 30 36 36 36Depreciation 22 22 22 22 22 22 10 8Interest on Long-Term Debt - - - - - - - -Other Income (less: Other
ExpensesJW/ - - 3 6 4 1 1 1
Net Income (before taxes)l 24 34 50 27 21 9 15 17
Net Income % of CapitalEIployed' 11.5 19.1 36.8 24.3 25.6 11.3 20.8 25.7
Debt Service Coverage6/ - - - - - -
1/ For forecasts beyond 1975 see Annex 3-2.2/ Figures include sale of purchased fertilizer (1971 : Rs 14 million,
1972 R: 8 million) and about 4%5 of sales for sale of heavy water.3/ Including compensation from Bbakra Management Board due to power cuts
(1971 : Rs 7 million, 1972 : Rs 5 million).v Taxes hav been shown in Annex 3-2 under the assumptior that the Nlangal
unit is a separate corporate entity. However, since FJI is not exDectedto incur income tax liabilities until 1980 taxes for the Aangal unit areconsidered notional.
/ Capital Employed defined as working capital (excluding non-interestbearing receivables from head office) and net fixed a3sets.
6/ Nangal's original debt/equity ratio was only about 32 : 68; it repaidall its long-term debt by 1965.
-9-
3.05 From 1964-1970 Nangal operated on average at 95% of capacityreaching 100% in 1970 and generated average net annual income of Rs 23million (US$3.2 million), or approximately 11% return on capital and 20%on sales. Production was down to about 70% in 1971 and 1972 due to powershortage (para. 3.07) but profits were still satisfactory, averaging Rs24 million per year, as compared to Rs 36 million during the three previ-ous years. As enlarged upon below, the relatively high earnin-s are dueto the low power rates Nangal has been paying. During the 1968-1972period Nangal accounted for about 25% of the Corporation's nutrient sales.
3.06 Although continuing power shortages would not allow plant utiliza-tion to rise above 70% over extended periods, projected income statementsshow satisfactory profits mainly because the plant will be almost fully de-preciated in 1973. Nangal has no outstanding long-term debt; with result-ing low capital charges, the profit and cash break-even points after 1973will be about 44% of capacity 1/.
C. Availability and Costs of Power
3.07 The existing Nangal plant consumes about 164 W of power at fullcapacity, 149 S. in the ammonia section alone. The original decision forchoosing this power-intensive process to produce ammonia, was based on theample availability of hydro-power in North India at prices which economicallyand financially justified the process at the time Nangal was built (Annex 3-5Subsequently, the supply and demand situation has changed, power demand hasincreased and generating cost of new facilities has gone up substantially.
3.08 Nangal has not only been experiencing power shortages since 1971which have severely limited production (para. 3.04), but from 1966 onwardhas had to pay power prices above those stipulated in the original 25 yearcontract; further increases are under discussion. At present, Nangal ispaying Rs 23/MWH (3.1 US mi'ls/KWH) 2/ based on a renegotiated contract asat January 1971. The normal rate for large industrial coLLsumers in thearea is Rs 84/MWH.
3.09 The future power shortage for Nangal is a function of supply as wellas of cost. The cost of supplying power to Nangal is estimated to be aboutRs 40/MWH from new hydro facilities and about Rs 95/kWH from thermal plants,the latter also being considered the economic cost of power (..nnex 3-5). IfNangal could afford to pay the regular rate for industrial consumers (Rs 84/.MWH)it could probably obtain its full power requirements relatively easily; butNangal could only pay about double its present power rate (or about Rs 40-45/WMH), before incurring losses, even with its almost fully depreciatedplant. At present Nangal, therefore, is receiving highly subsidized~ powerin both financial and economic terms.
1/ Detailed historical balance sheets and source and application of fundsstatements for Nangal are shown in Annexes 3-3 and 3-4.
2/ Quoted power prices exclude 25% excise tax levied against all consumers.
- 10 -
3.10 In view of the changed power situation, continued use of thepower-intensive process of producing ammonia in the existing Nangal plantis neither financially nor economically viable. However, the likelihood ofGOI and FCI shutting down the plant is remote, because of the urgent needfor fertilizer and the existence of a trained labor force plus supporting in-frastructure. Hence, closing the uneconomic part of the existing plant canonly be realized in combination with a new project that includes replacementof the ammonia section.
IV. FERTILIZER MARKET AND MARKETING
4.01 Past and future developments of fertilizer demand and supply inIndia and especially in Nangal's marketing area as well as the major fac-tors, including fertilizer pricing policies, that have contributed to thesedevelopments are discussed in detail in Annex 4. The Annex also containsan international comparison in fertilizer consumption (Annex 4-1).
A. Past Fertilizer Growth in India
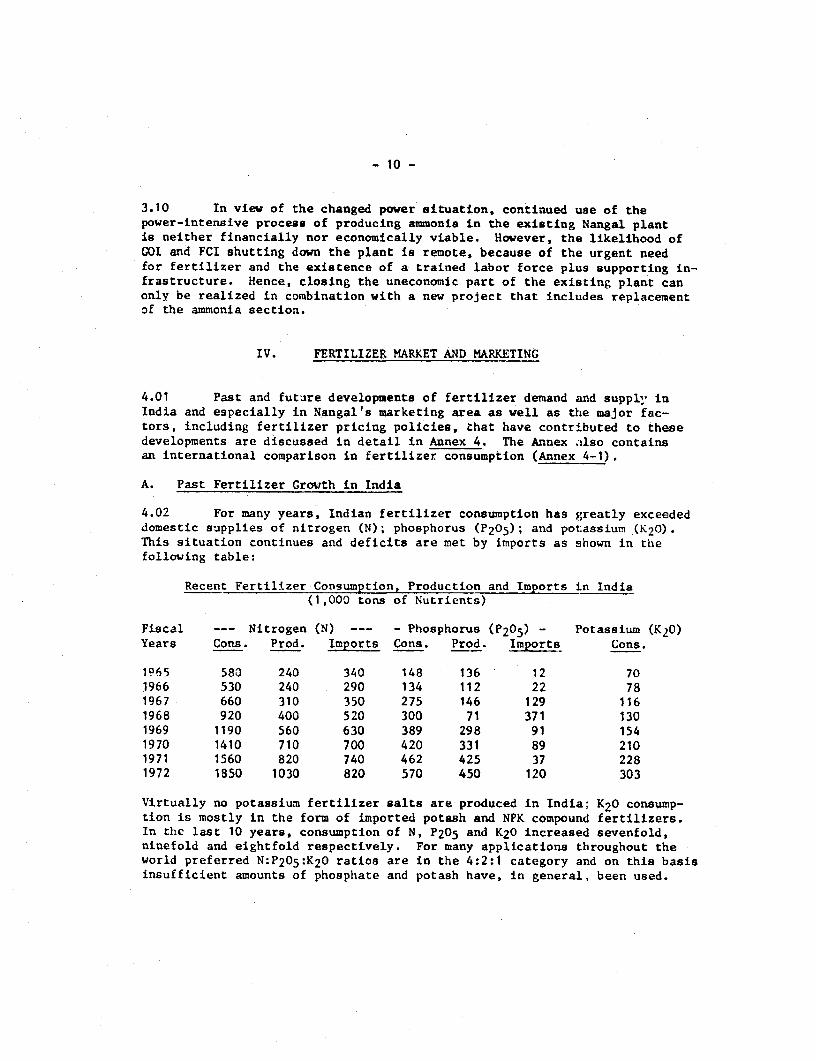
4.02 For many years, Indian fertilizer consumption has greatly exceededdomestic supplies of nitrogen (N); phosphorus (P205); and potassium (K20).This situation continues and deficits are met by imports as shown in thefollowing table:
Recent Fertilizer-Consumption, Production and Imports in India(1,000 tons of Nutrients)
Fiscal --- Nitrogen (N) --- - Phosphorus (P205) - Potassium (K20)Years Cons. Prod. Imports Cons. Prod. imports Cons.
1965 583 240 340 148 136 12 701966 530 240 290 134 112 22 781967 660 310 350 275 146 129 1161968 920 400 520 300 71 371 1301969 1190 560 630 389 298 91 1541970 1410 710 700 420 331 89 2101971 1560 820 740 462 425 37 2281972 1850 1030 820 570 450 120 303
Virtually no potassium fertilizer salts are produced in India; K20 consump-tion is mostly in the form of imported potash and NPK compound fertilizers.In the last 10 years, consumption of N, P205 and K20 increased sevenfold,ninefold and eightfold respectively. For many applications tbroughout theworld preferred N:P205:K20 ratios are in the 4:2:1 category and on this basisinsufficient amounts of phosphate and potash have, in general, been used.

- 11 -
B. Fertilizer Market Forecast for India
4.03 Demand/supply projections for N, P and K fertilizers are discussedin Annex 4-2 and are summarized below:
Projected Fertilizer Demand-Supply for India(1,000 tons of Nutrients)
Fiscal -- Nitrogen (N) -- -- PhosphorLS (P205) -- Potassium (K-3)Year Demand Supply Deficit Demand Supp:v Deficit Demand
1973 2300 1370 930 830 540 290 3201974 2650 1740 910 1000 650 350 3851975 2960 2090 870 1150 780 370 4601976 3320 2465 855 1320 940 380 5,01977 3720 3230 490. 1520 1130 390 6601978 4160 3670 490 1750 1370 380 8001979 4600 3920 680 2000 1630 370 960
Nitrogen projections a_e based on Bank studies 1/ plus data from the IndianPlanning Commission and the Mini .ry of Agriculture. Phosphate and potashdemand forecasts cannot readily be made on the basis of historical projec-tions because of irregular previous patterns. Indicated figures correspondto likely future attempts to bring P205 and K20 consumption more in linewith the previously mentioned, desirable 4:2:1 nutrient balance. Phosphateproduction includes ground rock and other products of indigenous origins.
4.04 The nitrogen demand projectior. assumes nitrogen consumption willgrow at 20% compounded annually to 1974 and at 11.7% subsequently. Annex4-2 shows how demand is expected to develop in each of the four major re-gions in India. The production estimate was made by IDA using informationobtained from GOI; Annex 4-2 also shows individual plant contributions andthe expectation that FCI's contribution to the domestic production of Nwill increase from 30Z in 1970 to 56Z in 1979. Average annual compoundgrowth rate is 28% to 1974 and 17.5% thereafter, based on optimistic butattaiinable start-up schedules and operating performances of new projects.Should these goals nit be met, production could be 10% to 20% less. Whileprecise forecasts canmot he made, substantial nitrogen fertilizer productionshortages are indicated tlhroughout the period 1972 to 1979. In this period,anticipated urea production will rise from about 60% to 74% in terms of totalN reflecting its popul.rity in terms of results and lowest delivered nitrogencost.
1/ "Effective Demand f^r Fertilizer in India" by W.B. Donde (COI) andDorris D. Brown (IBRD), May 1971.

- 12 -
C. Fertilizer Markets in Northern India
4.05 Fertilizer consumption per unit of cropped area is much greater
in Punjab than in all India, as the following comparison for 1970 shows:
Kg per Hectare
N P205 K20 Total
Punjab 28.4 4.1 1.2 33.7
All India 8.7 2.6 1.3 12.6
In both cases low application rates for P205 and K20 are evident comparedto the generally advisable 4:2:X balance and greater amounts of phosphorus
and potassium will be needed in the future as these elenents are graduallyremoved from the soil by intensive cropping. Because CAN and urea arethe only materials under consideration for Nangal, thib report will cover
in detail only nitrogen fertilizers.
4.06 The main marketing area for the Nangal plant is Punjab, Haryana,
Himachal Pradesh, Jammu and Kashmir states, plus Delhi and parts ofRajasthan. Due to present supply limitations, about 80% of Nangal's pro-
duction (CAN) is sold in Punjab and Haryana. As reviewed in Annex 4-3,these states represent one of the most advanced farming regions in India;
while comprising only 6% of the national area under foodgrains, theyproduce 10% of the nation's corresponding crops.
4.07 The demand-supply forecast for nitrogen fertilizer for northern
India is shown in greater detail in Annex 4-2. Projections for 1972-1979
including possibly available shipments from other regions (except: the dis-
tant southern states) are:
Demand-Supply Balance for Nitrogen Fertilizer in Northern Iodia(1,000 tons N)
Fiscal Years 1972 1975 1976 1977 1978 1979
Demand 350 570 630 690 760 840Supply 170 170 205 280 300 320
Possible Surplusesfrom East andWest India 0 0 0 130 250 170
Net Deficit 180 400 425 280 210 350
4.08 It is unlikely that all projected apparent surpluees in the eastand west regions would ever be shipped to the north; however, even if they
were, a shortage equivalent to two additional large urea plants would still
persimt an ihowi in Antiex 4-4. Accordingly, no problems in selling Nangaluroa are foreseen.
- 13 -
D. Nangal Marketing System
4.09 FCI has recently establislei tour mar'leting zotons [UgiOU InJla.Each is responsible for promotion, publicity and market research, and all arecoordinated at hcad office level under guidance from FCI's Director of Produc-tion and Marketing in New Delhi.
1. Transport and Storage
4, 10 Both rail and road haulage are used between the plant and maindistribution centers; good roads enable 34% of present CAN production tobe moved via truck compared to a national average of 20% for fertilizer.Well-developed railroads also exist and the Ministry of Railways has assuredFCI and IDA that corresponding facilities ;o accommodate additional raw ma-terials a,d products after expansion will be provided on tim.e. Extra trafficwill only amount to three trains daily and no problems are fcreseen. Fer-tilizer consumption in Nangal's marketing area if; fairly unifarm throughoutthe year because of double cropping and crop variety. Also, distributionand discount systems used by co-ops and private dealers have helped FCIavoid storing large tonnages in less-active months. Ample additional fac-tory storage (20,000 tons) will be installed, and adequate extra co-op anddealer capacity is available.
2. Distribution Networks
4.11 In Punjab and Haryana, fertilizers reach farmers via two distribu-tion networks: co-ops and private dealers. Competition between these twogroups is more related to obtaining material to sell than price reductionand is likely to remain so. FCI's policy is to make equal quanttites avail-able to both and to limit each private dealer to 500 tons annually.
3. Credit Facilities
4.12 Fertilizers handled "y co-ops and private cealers are sold tovarious groups ranging from large commercial estates to very low-Incomecultivators. Recently, steps have been taken by GOI to provide appropri-ate credit facilities to all levels of the agricultural community parti-cularly low-income groups whose coaly previous recourse was the villagemoney lender. Now, farmers can obtain loans from two major sources:state banks and co-op "banks" or lending agencies. Similarly, additionalcredit facilities have been extended to the growing number of pr-.vatedealers. Such available financing facilities will help to ensure tnat salesof Nangal urea will not be re-.tricted by payment problems, especially asmuch of the market lies in the well-developed States of Punjab and Haryanawhere farmers are relatively prosperous and purchase a subscantial proportionof their agricultural requirements with cash.
- 14 -
4. Urea Pricing
4.13 In principle, Indian fertilizer producers have a certain freedomto establish their own prines but in practice for various reasons this isvery limited. For example, in addition to maximum consumer prices being setby GOI, prices need to be at leve1.E that provide worthwhile returns to dis-tributors and dealers. Although prices and pricing policies have not beenfinally established for Nangal urea, they will probably correspond to thosenow prevailing for FCI, as shown below (Nangal's financial projections arebased on this assumption).
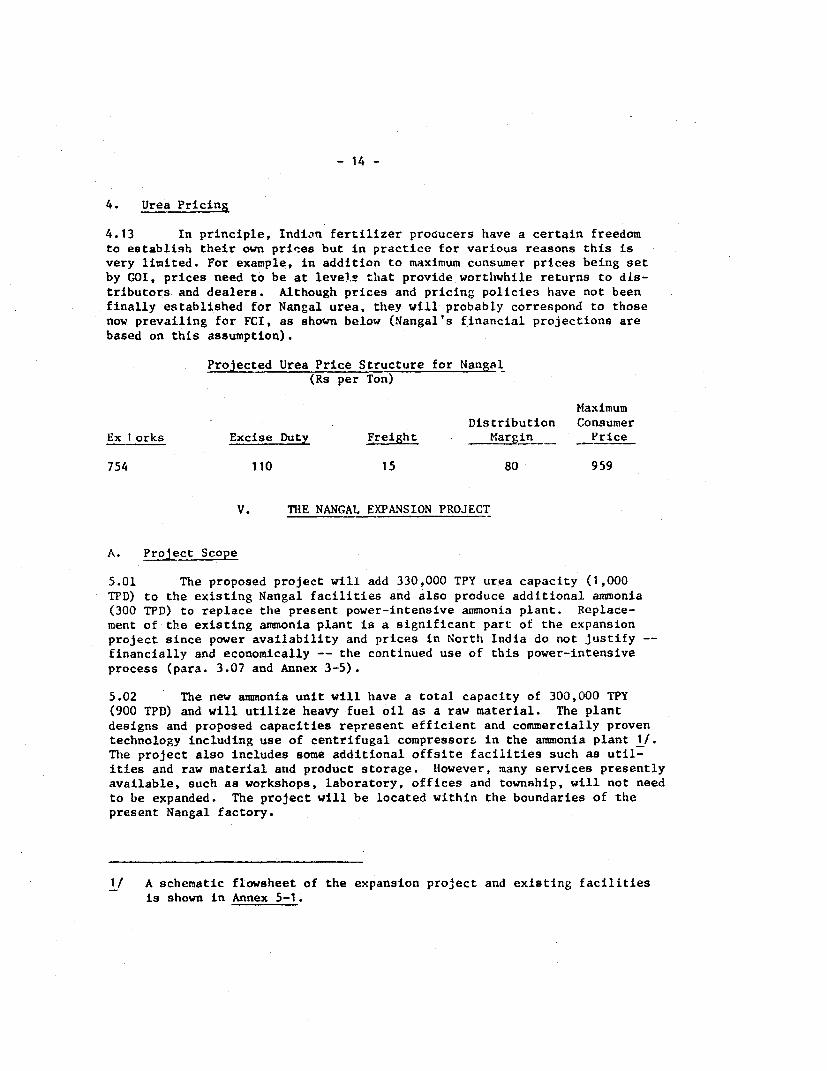
Projected Urea Price Structure for Nangal(Rs per Ton)
MaximumDistribution Consumer
Ex 1orks Excise Duty Freight Margin__ Price
754 110 15 80 959
V. THE NANGAL EXPANSION PROJECT
A. Project Scope
5.01 The proposed project will add 330,000 TPY urea capacity (1,000TPD) to the existing Nangal facilities and also produce additional ammonia(300 TPD) to replace the present power-intensive ammonia plant. Replace-ment of the existing ammonia plant is a significant part of the expansionproject since power availability and prices in North India do not justify --financially and economically -- the continued use of this power-intensiveprocess (para. 3.07 and Annex 3-5).
5.02 The new ammonia unit will have a total capacity of 300,000 TPY(900 TPD) and will utilize heavy fuel oil as a raw material. The plantdesigns and proposed capacities represent efficient and commercially proventechnology including use of centrifugal compressor& in the ammonia plant 1/.The project also includes some additional offsite facilities such as util-ities and raw material and product storage. However, many services presentlyavailable, such as workshops, laboratory, offices and township, will not needto be expanded. The project will be located within the boundaries of thepresent Nangal factory.
1/ A schematic flowsheet of the expansion project and existing facilitiesis shown in Annex 5-1.
- 15 -
B. Project Description
5.03 Anmonia production will be based on the partial oxidation of heavyfuel oil. Several processing steps are required, which arr> described in Annex5-2 and are summarized below together with the relevant process licensors.
Air Separation Plant - To be bi.1 internationl1lyPartial Oxidation - Shell (Netherlands)Sulfur Removal - Lurgi (F.R. of Germany'Shift Conversion - FCI (India) and Lurgi kF.R. o
Germany)C°2 Removal - Lurgi (F.R. of Germany)Nitrogen Wash - To be bid inzernationiallyAmmonia Synthesis - Uhde (F.R. of Germany)/Topsoe
(Denmark)
The use of Shell and Lurgi licensed processes, with which FCI has had p-ev-ious experience, and the Shift Conversion step by FCI are oased on utilizationof FCI engineering and know-how. The ammonia contractor, Ulde (Germany) whowas chosen after international bidding, will use its own anmonia synthesistechnology in conjunction with Haldor Topsoe.
5.04 The ammonia plant will be a single train unit with the exceptionof Partial Oxidation which will require three units and Air Separation whichmay require two units.
5.05 The urea plant will he based on the Montedison (Italy) design andpartly represents an extension of an existing license dgreement betwee.AMontedison and FCI for supply of urea technology. The urea design is con-ventional; total recycle technology being based on an operating plant inthe Netherlands, and will be a single unit. A similar plant, incorporatingtwo 500 [I'D units, is part of FCI's Durgapur and FACT's Cochin plan.s -hichare nearing completion.
C. Raw Materials and Utilities
5.06 The principal raw material required is heavy fuel cii wbizh will bepurchased through Indian Oil Corporation from a refinery that is to be bui'tnear Delhi, some 200 rail km from the Nangai plant and presently ?xpected tobe completed in late 1977 (some two years after the scheduled completion ofthe project). However, the ammonia plant will be designed to process anyliquid hydrocarbon material. Initially, fuel oil will be supplied from anexisting refinery (also owned by Indian Oil) in barauni (Bihar) or will beimported and will be transported to Nangal in heated cank cars. To confirmthe understanding that sufficient feedstock and rolling stock will be avail-able to meet the requirements of the expanded plants it was agreed to duringnegotiations that FCI will enter into satisfactory arrangements wi,h IndianOil and the Railway Authorities.
- 16 -
5.07 The major utilities required e:e power, coal and water. About 30MW of power will be needed, which will be supplied by Punjab Scate Electri-city Board (PSEB) from Bhakra at a normal industrial rate of 84 Rs/MWH.Since Nangal will release about 149 MW of power utilized by the existing unit(at full capacity) and because of Nangal's proximity to the power generatir.gsource (20 Km), no power supply problems are anticipated at Nangal. However,FCI has been asked to enter into satisfactory arrangements with PSEB for itspower requirements.
5.08 Coal, required for steam generation, will be transported by railfrom existing coal mines in-Bihar and Madhya Pradesh. No supply difficultyis anticipated and FCI has been a3ked to obtain satisfactory contracts withthe coal suppliers. Water, for both process and cooling uses will be obtaiaedfrom the adjacent Sutlej River. Ample supply is available and no problem isanticipated.
D. Employment
5.09 About 3,800 people (including about 1,200 for township and generalservices) are currently employed at Nangal and this number will not increasesubstantially after expansion. Operators from phased-out units will be em-ployed in the new plant. Provision has been made in cost calculations foran additional 200 employees to handle increased quantities of raw materialsand products, and also to undertake any additional maintenance and yard work.During plant construction, civil works labor needs are estimated to be about5,000 man years, equivalent to some 2,500 workers over a two year period.
5.10 The Nangal expansion will also create incremental indirect employ-ment in the coal, oil, bag-making and transportation industries but this isdifficult to measure. Urea distribution and sales will require incrementallabor and clerical help of about 300 extra dealers plus perhaps 1,000 part-time distributors. In addition, it is likely that about half of these num-bers will be required to distribute and sell via the co-op organizations.
E. Ecology
5.11 The effect of a modern ammonia-urea plant on its environment isminimal, and in the case of the Nangal project, no appreciable amounts ofharmful wastes will be discharged. The plant will use a high sulfur fueloil but the project includes desulfurization and sulfur recovery facilities.About 6,600 TPY elemental sulfur will be recovered, as a saleable product,which represents about 99.5% of the initial sulfur feed. No ammonia wouldbe discharged to the atmosphere except for accidental spills or leaks whichare an uncommon occurrence.
5.12 Liquid effluents can contain a small amount of absorbed ammonia,and this would be neutralized before discharging to the Sutlej River, Thedownstream use of the river is primarily for irrigationi, with no lakes sothere is no possibility of a build-up of nitrogen. In any case, the quan-tity of nitrogen is so small that the quality of water is not affected.Urea solids (as a fine dust) are a potential effluent but scrubbing equip-ment is to be installed to recover urea which is a valuable product. Theecological facilities included in the project are estimated to cost aboutUS$2 million equivalent, or about 2% of total project costs.
- 17 -
VI. PROJECT COSTS AND FINANCiAL PLAN
A. Capital Costs
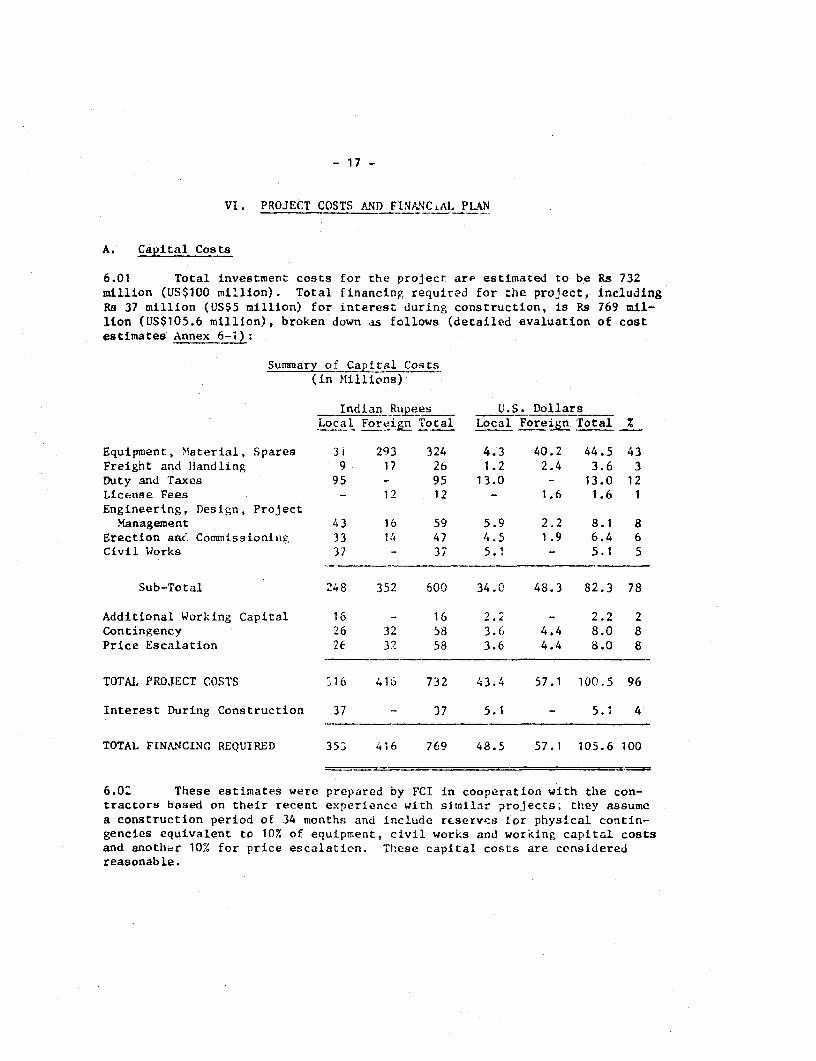
6.01 Total investment costs for the project are estimated to be Rs 732million (US$100 million). Total financing required for the project, includingRs 37 million (US$5 million) for interest during construction, is Rs 769 mil-lion (US$105.6 million), broken down as follows (detailed evaluation of coatestimates Annex 6-t):
Summary of Ca ital Costs(in M1illions)
Indian Rupees U.S. DollarsLocal Foreign Total Local Foreign Total %
Equipment, Material, Spares 3i 293 324 4.3 40.2 44.5 43Freight and Handling 9 17 26 1.2 2.4 3.6 3Duty and Taxes 95 - 95 13.0 - 13.0 12License Fees - 12 12 - 1.6 1.6 1Engineering, Design, Project
Management 43 16 59 5.9 2.2 8.1 8Erection aae Commissioning 33 14 47 4.5 1.9 6.4 6Civil Works 37 - 37 5.1 - 5.1 5
Sub-Total 248 352 600 34.0 48.3 82.3 78
Additional Working Capital 16 - 16 2.2 - 2.2 2Contingency 26 32 58 3.6 4.4 8.0 8Price Escalation 26 32 58 3.6 4.4 8.0 8
TOTAL PROJECT COSTS ;16 415 732 43.4 57.1 100.5 96
Interest During Construction 37 - 37 5.1 - 5.1 4
TOTAL FINANCING REQUIRED 353 416 769 48.5 57.1 105.6 100
6.0 These estimates were prepared by FCI in cooperation with the con-tractors based on their recent experience with similar projects; they assumea construction period of 34 months and include reserves for physical contin-gencies equivalent to 10% of equipment, civil works and working capital costsand anothcr 10% for price escalation. These capital costs are consideredreasonable.

- is -
6.03 The expected foreign exchange costs of US$57 million are based. on
4% of equipment belng re arved for Irdian procurement and the expectation
that Indian suppliers will win 10% of the remaining equipment, all to be bid
internationallv (except US$2.2 million proprietary equipment). The foreign
exchange costs would in^rcr.se to U'S$58 million or drop to US$55 million were
Indian supn-iitrs tc Win raspectively 5i or 20% of the intcrnationally procured
equipment. Tae proioct cost est'.mates iinclude the likely effect of a 15% rar-
gin of preferente '-o- trie>rred domestic. bids when comparing domestic bids
with those from fore-,.n suppliers.
B. WorkinK_LGapltal Recuire.nen:s
6.04 Wor'ir' capi:cl requieamencs for the exOansioni project wil., be
Rs 68 mil o1l, cf .iti ' 's 52 ;mi'1.ion '_5' et7 inventories and receivables)can be carriie- as Slo-~:-:e cot Žrc. 5,tnk credit fronY the State Bank of
Indla (Annex_'-2). Thus, marginal working capital requiring long-termfileanicin, is 6 , i Ll 4c S. o 19 li on)
C. Financil '1?an6.05~ ~ _' . 6'm i'Wt r
6.05 2Ti S \; nl>.ou) pro Jecc financing would be
Drovicct a _C! - ' SO out 55:45 1ebt tr C eqt;Ity as shownb')Iov:
USS titllion
'-ttR, nrl , : 0s'r_
.r.)io-ve. TOX ;r:2di.: 58.0
47.6
Tutal 105.6
6.35 Ihe pF' p' Bsed au ,ount. of USi`8 million for the lI)A credit would
eover the 1e V"' ov^epc! ±oneijn exchange cost. un-ler international com-
petitive bld"-n r . :.½.o-). 'the IDA credit would be relent from GOI to
FCl; it reDreen's .';e -- rl r;bt shown in the proposed financial plan
for t'he prci'ec'-. t 1%i 'y 7cL S neW projects have been financed at 50:50
debt to equity. 'owevor, since existing Nangat has no outstanding long-term
debt. tl'he ie e det to ec,uity ratio of 55:45 for the project financingis accepza:'e -)L .. ro etquitr ratto of Nangal after expansion is not
c xp I ' }.I to { '\ < ( 'ds .~ : #)5.
- 19 -
6.07 Existing Nangal has generated attout Ka 3't) mtIlln if vi.li £:UIu ice
depreciation and earning since 1961. Cash generation during the co.istructionperiod of the project (1974-1976) is estimated at about Rs 40 milliorn (afterconsideration of notional taxes). According to the practice of COI-owi.edcompanies, Nangal's cash surpluses have been transferred to FCI;s head officeand, in turn, any corporate surplus from FCI has been zransferred to GO1.Therefore, Nangal's generated cash, cannot be reused for the financirZ ' theexpansion project, and the equity of the expansion project of US$47.6 millionequivalent will be provided by GOI as new equity.
6.08 The Government would on-lend the proceeds of the IDA credit toFCI as a loan for 15 years, from the date of etfectiveness of 6he credit,including a 5 year period of grace and repayment ir. iO equal annual ins .all-ments, at an interest rate of 8.5%. These terms are similar to those appliedto the recent IDA credits for the Cochin II and Gorakhpur fertilize; expan-sion projects. The credit proceeds would be denominated in rupees, and theexchange risk would remain with GOI.
6.09 To protect against an unexpected overrun in project costs (bothforeign exchange and local costs) GOl will provide additional funds as neces-sary to complete the project.
D. Allocation of the IDA Credit
6.10 Froceeds of the IDA credit woild be used as follows:
Allocation of IDA. Credit(Millions of US$)
1. Equipment and Materials, internationally bid 42.22. Imported Equipment for Standardization 2.53. Engineering, Design, Erection and Commissioning 7.54. Unallocated 5.8
58.)
6.11 The IDA credit will cover CIF costs of all imported equipment ('n-cluding US$2.2 million proprietary equipment) and ex-factory irice (excludingtaxes) of locally procured equipment that is internationallv bid. It willalso include total foreign exchange costs of process licenaes and cousultants'services and a portion of FCI's local costs for engineering and equipnenterection. The project's foreign exchange content is about US$57 million asdiscussed in para. 6.03. Any unused portion of the crediL will be reallo-cated by the Association to FCI's local expenditures for engineering andequipment erection. Projected disbursement schedule for tne IDA credit isgiven in Annex 6-3.

- 20 -
VII. PROJECT EXECUTION
A. Project Management and Execution
7.01 Difficulties experienced by FCI in undertaking projects withinoriginally established time and cost limits have been mentioned previously(para. 2.14). The relatively small urea expansion and debottleneckin- proj-ect at Gorakhpur (financed by IDA in 1971) has, as expected, not imposed astrain on the Company's engineering or management resources. hiowever, theproposed large ammonia and urea project at Nangal is of much greater magni-tude. Accordingly, to reduce the corresponding additional workload for FCI,GOI, FCI and IDA have agreed that the contractors chosen to supply the am-monia and urea processes will respectively be given major responsibility forexecuting substantial parts of the project. Also FCI has appointed an ex-perienced Project Manager, with adequate responsibilities as well as quali-fied senior engineering staff. FCI has been asked to consult with IDA be-fore changing the Nangal general manager or the project manager.
7.02 'rhe Planning and Development Division (P & D) of FCI will act asoverall prime contractor for the project. Design, and erection supervisionof the ammonia plant will be subcontracted to Uhde and similar responsibil-ities for the urea plant subcontracted to Montedison. Uhde was selected viainternational bidding by FCI in consultation with IDA. Montedison was com-mitted to the project before IDA involvement and undertook the design a.ndengineering of the FCI urea plant at Durgapur. This has not yet come onstream, because the ammonia plant is delayed; however, the urea process isoperating successfullv elsewhere.
7.03 P & D staff at Sindri will undertake as much detailed engineeringwork as possible on the ammonia and urea units under the guidance of Uhdeand Montedison specialists. Simultaneously, specialized design work will beperformed in the offices of Uhde and Montedison at Dortrund, and Milan respec-tively, assisted by selected FCI personnel. If it becomes evident that FCI'sstaff at Sindri cannot meet planned deadlines, the balance of work will promptlybe moved to Dortmund or Milan. Uhde and Montedison have agreed to acceptresponsibility for completing design and detailed engineering on time, in-cluding all such work undertaken by FCI staff on the ammonia and urea units.Offsite design and all field conetruction will be undertaken by FCI with theassistance of proven subcontractors. Specialists from Uhde and Montedisonwill supervise the erection of the ammonia and urea units and subsequentstart up, running-in and guarantee tests.
B. Project Scheduling, Procurement and Contractor's Guarantees
7.04 In consultation with Uhde and Montedison, FCI has prepared a de-tailed project schedule network and a project implementation plan. 1/ These
1/ A summarized implementation schedule is shown in Annex 7.
- 21 -
show respectively the critical timing ot all major activitius .,nd Lhe resiukl-sibilities for project execution and management within FCI asd berween FCI andthe contractors. Both documents have been reviewed by IDA and founo realistic.
7.05 The starting date of the project will be January 15, 1973. It i:;anticipated that completion will require 34 months and comiercial productionwill commence in December, 1975. Project scheduling snd cost conLrol will bethe responsibility of FCI, but Uhde and Montedison will act. in £1 consultingrole to assure completion on time and within the calculated budget. Tirae andcost controls will be maintaince by computer-aided critical path proceduresoperated separately by FCI anc the contractorb.
7.06 Equipment procurement responsibility will be shared between FCI,tThae and Montedison. Criticai, long delivery and proprietary itens will betendered, evaluated and expedited from Dortmund and Milani buz purchased ,romFCI, Delhi. Procurement will be aid-d by an agreement letween GOI and IDAthat all necessary import licenses w7ill be promptly issued and processed.Assurances have been givien by GOI that any item orcered in India that isdelayed unreasonably can be procured itmnediately from other countries toavoid possible adverse effects on project completion. As FCI is now familiarwith. IDA procedures; procurement should proceed without difficulty.
7.07 Uhde and Montedison have each agreed to furnish P & D withi completedesign and purchasing data within specified periods. Failure -o meet chesedeadlines will subject the contractors to penalty paymnents. Also, plantperformance guarantees in terms of capacity, product quality and utilityrequirements have been obtained from the contractors, partiy in conjunctionwith the process licensors, furnishing key sections of the ammonla plant(Shell, Lurgi, Haldor-Topsoe). inability to meet these performances willsubject contractors and licensors to penalties if adjustments made in tllefield at their expense prove ineffective.
VIII. FINANCIAL ANALYSIS OF THE PtQO.ECT
A. Revenues and Operating Costs
8.01 Revenues and opeL-ting costs for the modified exf.sting faciliciesand proposed expansion project are shown in Annexes 8-1 and 8-2.
8.02 A comparison of revenues and costs for Nangal before and after ex-pansion (Annex 8-1) shows that production at the unchanged existing facilitieswould be more expensive than after modification even with a fully depreciatedplant and the present low power rate. Assuming the present rate for powerwere to double (Annex 3-5) profits for existing Nangai would, as rLientionedpreviously, almost disappear, even at an increased capacity utilization of90%.
- 22 -
8.03 Marginal labor costs for the expansion project are low, since thereis some overstaffing in the existing plant and many of its labor-intensiveactivities (e.g. repair shop, township facilities, etc.) will not need tobe expanded. The other cost items are directly related to output and wereallocated to the CAN and urea plants to show the approximate costs of pro-ducing each product.
8.04 Raw materials necessary to supply the operations of the expansionproject are desLribed in Chapter V and their prices are shown in Annex 8-3.Fertilizer prices in India are high compared to other countries (Annex 4-1)but they are necessary to partly offset high duties and taxes on capital andoperating costs. Total Indian duties and taxes on imported equipment aloneamount to about 11% of Na'igal's total project tnsts (30% on imported equip-ment). Resulting increased capital charges from these duties on a per tonof finished product (urea) basis are estimated at about Rs 28 (US$3.8).
B. Feedstock Costs
8.05 The main difference in raw materials and operating costs as com-pared to international standards results from high feedstock costs; costsfor other main input materials, such as coal and bags are in line with inter-national prices. Costs for fuel oil or naphtha as feedstock substantiallyexceed costs of natural gas, which is readily available for fertilizer pro-ducers in some countries but not in India. Naphtha, now the feedstock ofmost of the modern urea plants in India, is in short supply and will partlyhave to be imported in the future. Accordingly, it is now GOI policy to basefuture ammonia production on alternative feedstock such as heavy-fuel oil orcoal. Nangal will have the first heavy-fuel based ammonia plant in India.GOI has recertly adjusted heavy fuel oil prices to make lheavy fuel basedfertilizer .roduction at Nangal competitive with that based on naphtha, alsotaking into account higher investment costs (about 10% of total project costs)for heavy-fuel oil process.
C. Financial Forecasts
8.06 Forecasted Income Statements for the Nangal Unit before and afterexpansion given in Annexes 3-2 and 8-1, are summarized below: 1/
1/ 1972 figures are actual and 1973-1976 figures are forecasted for exist-ing Nangal Unit. Construction of the Expansion Project starts in 1973but income statements of the Nangal Unit will onl. be affected from thestArt of commercial production of the Expansion Project in December1975.
- 23 -
Summary Income ForecastsNangal Unit Before and After Expansion /1
(Millions of Rs)
Fiscal Years(Ending /2March 31) 1972 1973 1974 1975 1976- 1977 1978 1979 1980 1981 1982
(Actual) Construction Operations Including ProjectCapacity of Projectin Z
CAN 70 78 70 70 70 73 83 90 90 90 90Urea - - - - 70 73 83 90 90 90 90
Net Sales /3 123 117 106 106 164 289 329 358 358 358 358OperatingCosts 80 86 81 81 116 165 178 189 189 1E, 189
OperatingProfits 43 31 25 25 48 124 151 169 169 169 169
Depreciation 22 22 10 8 24 64 64 64 64 64 64Interest - - - - 11 36 36 32 29 25 22Net Income
Before taxes 21 9 15 17 13 24 51 73 76 80 83Taxes(notional) - 16 13 13 - - - - 9 50 58
.:et Incomeafter taxes 21 (7) 2 4 13 24 51 73 67 30 25
/1 See Table and footnotes for Nangal Unit before Expansion until 1976(para. 3.04).
/2 Includes 4 months of commercial production of expansion project./3 See Annex 8-2 for the incremental effect of the expaasion and Annex 8-3
for assumptions on revenues and costs.
8.07 The Forecasted Income Statements are based on the assumption thatthe existing electrolysis plant will be phased out in December 1975, whlen thenew facilities start operations. The forecasts show incremental profits fromthe expansion project even in the first operating year, and at full capacityNangal's total profits before taxes are expected to be four times Nangal'spresent profits.
8.08 Taxes are difficult to take into consideration for the Nangal unititself since income taxes are paid only on a corporate basis. FCI has notpaid any income taxes due to low profits as well as tax holidays and exclu-sions related to expansion projects. Since capital expenditures resultingin tax holidays will continue at least until 1979, the Corporation willhave substantial tax exclusions which exceed projected profits over the nextyears. Thereafter taxes, have been calculated on a notional basis of 55%on the taxable income (para. 8.10) for Nangal beginaing in 1980 (Annex 8-1).
- 24 -
8.09 Projected balance sheet and cash flow statements for Nangal areshown in Annexes 8-4 and 8-5 and are summarized on the following page.These statements show that the project would be soundly"financed with theNangal unit having a debt to equity ratio of 35:65 at the end of construc-tion. Due to the high cash generation and the low debt/equity ratio, pro-jected debt service coverage always exceeds 2.2. The cash break-even pointof Nangal after expansion is expected to be less than 50% of capacity, where-as the profit break-even point declines from about 60% to 50% of capacityduring the life of the project (Annex 8-6). Nangal is an operating unit ofFCI and is thus liable to have its cash surpluses transferred to head office.However, assurances have been obtained during negotiations that Nangal shouldnot be called upon by FCI to transfer funds to FCI if by so doing its c :rentratio would fall below 1.1:1.
D. Financial Return
8.10 The base fiaancial rate of return for the project is 18.1% beforetaxes and 14.0% after taxes. 1/ The project's financial return would besensitive to changes in urea price, rising to 22.72 or falling to 12.6X withprice fluctuations of plus and minus 10% (Annex 9-1). A feedstock price in-crease of 10% would reduce the return to 16.2X and a. one year start-up delay.together with a 15% cost overrun, would lower the return to 12.0,'. With theexception of project completion delays and changes in the urea price, whicthis controlled by GOI, variations in other factors are not likely to underminethe financial viability of the expansion project.
E. Risk
8.11 The project design is based on commercially proven technologywhich should minimize technical risks with regard to design and efficientoperation. The major difficulty of projects in India, particularly in thepublic sector, is in implementation. The association of the two engineer-ing firms, Uhde and Montedison, which have major responsibility for theNangal project implementation including design, procurement, erection andstart-up, should reduce the risk of a project delay.
8.12 There is no appreciable commercial risk since urea is expected tocontinue being in short supply in India, especially in North India, and pricesare virtually controlled by Government policy. FCI's marketing system inNorth India is well developed and no problem is anticipated in selling Nangal'sproduction. The Nangal project itself has a high debt service coverage, al-though FCI may experience financial difficulties over the next few years(para. 2.10).
1/ Taxes are considered notional since income taxes are paid only on acorporate basis (para. 8.08). Therefore financial returns in thischapter refer to ft.iancial returns before taxes. Detailed returncalculations before and after income taxes of 55% are shown inAnnex 9-1.
- 25 -
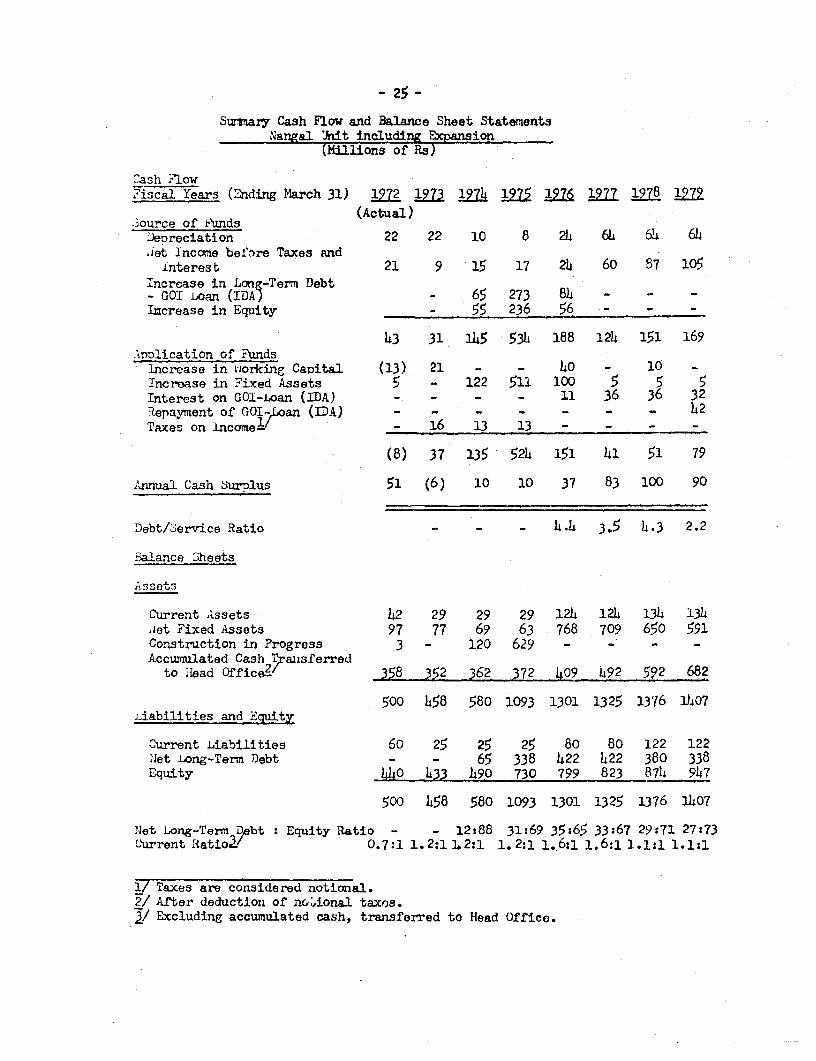
Suwmary Cash Flow and Balance Sheet StatenientsNanRal Unit including Expansion
(Millions of Rs)
Cash Flow.7iscal Years (2nding March 31) 1972 1973 1974 1975 17 1977 1978 1972
2'ource of tunds (Actua1)Deoreciation 22 22 10 8 24 64 614 64.iet Income befere Taxes and
Lnterest 21 9 15 17 24 60 87 1o5Incroase in Long-Term Debt- GOI Loan (IDA) - 65 273 84 - - -
Iucrease in Equity - 55 236 56 - _ -
43 31 145 53h 188 124 151 169Application of Funds
Increase in wJorking Capital (13) 21 - - 40 - 10 -
Incroase in Fixed Assets 5 - 122 511 100 5 5 5Interest on GOI-,oan (IDA) - - - - 11 36 36 32Repayntent of GOI-,oan (IDA) - - - - - - - h2Taxes on 1nconae - 16 13 13 - - - -
(8) 37 135 524 151 41 51 79
Annual Cash SurDlus 51 (6) 10 10 37 83 100 90
Debt/Service Ratio - - - 4-A 3.5 4.3 2.2
ialance Theets
Asset3
Current Assets 42 29 29 29 124 124 1314 1344et Fixed Assets 97 77 69 63 768 709 650 591
Construction in Progress 3 - 120 629 - - - -Accumulated Cash Transferred
to Head Offic e!2 358 352 362 372 409_ 492 592 682
500 458 580 1093 1301 1325 1376 1407Liabilities and Equity
Current Liabilities 60 25 25 25 80 80 122 122Net Long-Term Debt - - 65 338 422 422 380 338Equity 440 433 1490 730 799 823 874 947
500 458 580 1093 1301 1325 1376 1407
Net Long-Term D bt : Equity Ratio - - 12288 31:69 35:65 33:67 29s71 27:73Current Ratioz' 0.7:1 1. 2:1 2 2:1 1. 2:1 1. 6:1 1.6:1 1.1:1 1. 1:1
1/ Taxes are considered notional.2/ After deduction of ncUional taxos.3/ Excluding accumulated cash, transferred to Head Office.

- 26 -
IX. ECONOMIC ANALYSIS OF THE PROJECT
A. Urea World Market Prices
9.01 International urea prices have behaved similarly to those of manyother man-made commodities, moving from an initial high to an unrealisticlow, and then to more rational levels as oversupply diminishes. In the early1960's some export prices for bagged urea, CIF, India, from small plants tnenexisting exceeded US$100 per ton. By 1970, corresponding prices for urea madein plants ten times bigger had fallen in some cases to the US$55-60 range.Recently, however, FOB prices have begun to rise and shipping rates havefallen. In the first half of 1972, India imported 120,000 tons from '.uropeat US$56-59 FOB (US$67-69 CIF) and 270,000 tons from the Middle East at aboutUS$60 FOB (US$65 CIF). These recent Cir (untied) purchases reflect unusuallylow freight rates, which are expected to return to higher levels. In thelatter half of the year, some contracts with untiecd funds were let in the US$75to US$80 per ton CIF range because of generally tight markVet conditions.
9.02 Reasons for rising urea FOB prices include: increasing naturalgas and petroleum ammonia feedstock prices, escalating plant constructionand start-up costs, and higher bag and bagging costs, as reviewed inAnnex 9-2. No major economies of scale or technical breakthroughs are fore-seen that would appreciably reduce these costs. Recent discussions withbrokers and international e-ganizations suggest typical world urea prices,bagged, CIF, India are likely to be at least in the US$65 to US$70 per tonrange for several years and could go US$5 per ton higher, especiaLly forEuropean material. In this appraisal (and for purposes of the economicproject evaluation) a conservative figure of US$65 per ton of urea, hagged,CIF, India has been used, bearing in mind the probability of increased im-ports from the Middle East and their correspondingly lower shipping costs.
B. Economic Return and Competitive Position vis-a-vis Imports
9.03 Indian fertilizer factories have to use fuel oil or naphtha, andtherefore, have higher feedstock costs than plants based on natural gas, inthe United States or the Middle East. However, on the offsetting side, theNangal Project will make use of existing infrastructure and the new invest-ment will also allow the economic use of existing fertilizer production ca-pacity which is now too costly to use economically (i.e., which is now yield-ing a negative economic rate of return). This economic loss could be eliminated,and the overall situation improved, merely by closing down the existing facil-ities. The whole production of the new Nangal complex, as it will stand afterthe completion of the proposed project, as well as its total production costs,can therefore, be properly attributed to the proposed project. Thus, in arepresentative full year of production, the planned investment would allowthe production of about 210,000 tons of nitrogen per year, at an annual eco-nomic cost of US$22 million. Assuming a c.i.f. price of US$65 per ton for urea,the project would generate annual gross revenues of US$37 million, and netrevenues of US$15 million. Taking into account the lag before full capacity
-27-
is achieved as well as the timing of expenditures and revenues, the economicreturn of the project is 14.6% (Annex 9-1). This rate is used as the baserate of economic return in this report.
9.04 The e)isting Nangal unit is still quite profitable financially,because of the artificially low cost of power charged to it. It is a majoradvantage of the proposed project that it allows FCI to improve the economicefficiency of its operations without depressing its financial returns. Itcould well be argued that, had it not been given this opportunity, FCI wouldnot have felt able to close down the existing Nangal unit, because of acutefertilizer needs and also the resulting labor disruption. If so, tihe savingrealized by closing down the existing electrolysis ammonia unit could alsobe attributed to the proposed project. This would raise the project's eco-nomic rate of return to about 22%.
9.05 The calculation of the economic return i6 based on investment andoperating costs, valued at world market prices as far as these goods aretradeable, and on their estimated economic costs where non-tradeable localsupplies are involved (Annex 8-3). For that purpose the identifiable transferpayments, such as excise duty and other direct or indirect taxes, were ex-cluded from the local costs and major components of unskilled labor containedin investment and operating costs have been evaluated at 50Z of the nominalwage rate.
9.06 Sensitivity Analysis of the project for the base case (para. 9.03)was performed using different assumptions as to the economic costs and bene-fits of the most significant and uncertain factors: urea import price, feed-stock price and costs of investment (Annexes 9-1 and 9-3). As usual, thereturn is sensitive to revenue changes, to changes in feedstock prices, andto cost overruns and delays in completion, which have been a serious problemin India. Under the pessimistic assumption of an import price of urea ofUS$60/ton CIF India, the project would still yield a return of 11%. Underthe very adverse circumstances of a construction cost overrun of 15% combinedwith one year's delay in project completion, the return would still be 8.8%.Charts of the sensitivities to different price assumptions for urea are shownin Annex 9-3.
C. Foreign Exchange Aspects
9.07 Net foreign exchange savings for the project are estimated atabout US$13 million per year at 90% of capacity (Annex 9-4).
X. RECOMMENDATIONS
10.01 During credit negotiations, agreement was reached between theGovernment, FCI and IDA on the following principal points:
- 28 -
(i) COI will provide Rs 769 million in financing for theproject including US$53 million (Rs 422 million) in IDAfunds that will be relent to FCI by GOI. Terms for thecredit proceeds to FCI will be 8.5% interest per annumto be amortized over ten years after a grace period offive years. The balance of funds required for the proj-ect, Rs 347 million, will be provided by GOI as equityfunds (paras. 6.05 and 6.08).
(ii) GOI will provide additional funds (for both foreign ex-change and local currency costs) as necessary to completethe project as part of COI's normal lending program toFCI for capital spending (para. 6.09).
(iii) GOI Will assure a sound fip3ncial position for FCI. Thisparticularly includes maint'aining a current ratio for FCIof 1.2:1 and a debt/equity ratio of at least 50:50. FCIwill not declare a dividend or pre-pay any of its debt toGOT or othiers if such payment would reduce its currentratio below 1.5:1 (para. 2.12).
(iv) GOI will promptly issue import licenses as required. andpromptly shift to international procurement aniy itenms tobe procured in India whiclh would adversely affect theproject (para. 7.06).
(v) GOI and FCI will agree to carry out the project accordingto its critical path schedule (paras. 7.02 and 7.04).
(vi) FCI has appointed a project manager who shall be fullyresponsible for project execution, budget, and schedule.FCI has submitted to IDA at the tine of negotiations adetailed plan of project implementation delineating theduties and responsibilities of the unit General Manager,the Project rfanager and P & D and the ammonia and ureacontractors. Furthermore, FCI has agreed that it willconsult with IDA before changing the unit General Manageror Project Manager (paras. 7.01 and 7.04).
(vii) FCI has agreed not to withdraw any cash funds f:om Nangalif by so doing the current ratio of Nangal would fall below1.1-' (para. 8.09).
(viii) FCI will obtain satisfactory assurances and contracts withIndian Oil, Punjab State Electricity Board, Railway Autho-rities and coal companies on supply of fuel oil, power andcoal, respectively (paras. 5.06, 5.07 and 5.08).
10.02 Based on the assurances obtained the proiect constitutes a suitablebasis for an IDA credit of US$58 million.
Industrial Projects DepartnmentJanuary 2, 1973
FCI NLAGAL FERTILIZER PROJECT TECINICA.L TERMS
The following technical descriptions are intended as backgroundmaterial for terminology used in this report and annexes.
1. CAN I
Calcium Ammonium Nitrate, a Nitrogen fertilizer made by mixinganronium nitrate and limestone. The Nangal product contains 25% N, halfin ammonium form and half in nitrate form.
2. Urea
Known chemically as carbamide - the normal amide of carbonicacid; this compound contains about 46% N, all in ammonium form.
3. Electrolysis
The process of separating water into hydrogen and oxygen, bypassing direct current through a weak caustic potash solution.
L. Partial Oxidation or P.O.
A method of producing hydrogen from hydrocarbon fuels of almostany type by a non-catalytic flane reaction with oxygen followed by removalof coproduct carbon monoxide.
5. Feedstock
The hydrocarbon used to nroduce hydrogen for ammonia synthesis;in the pronosed Nangal plant, this would be a heavy, sulfur-containingfuel oil or refinery residue having little alternative use unless purifiedbeforehand.
6. Plant Nutrients
Essential to plant growth are some 16 elements, 6 in large amountsand the remainder in small or micro quantities. Carbon, hydrogen and oxygenplus nitrogen, phosphorus and potassium comprise the first six, and othersin dimishing degrees include calcium, magnesium, sulfur, silicon, iron,aluminum, manganese, boron, sodium, and copper. Carbon, hydrogen and oxygenare readily available from ambient air and water. Nitrogen, phosphorus andpotassium plus other elements are drawn from the soil.
Unless suiplemented by regular additions of materials containingthese nutrients, soils are soon depleted by croppirg. Use of organicmaterials such as animal and vegetable wastes has long been effectivelyundertaken, but the scale and intensity- o modern agriculture have farexceeded the availability of natural "fertilizers". Consequently, themajority of the world's primary plant nutrient needs - nitrogen, phosphorusand potassiUm - are now supplied as manufactured or "chemical" fertilizers.
To an increasing degree, secondary nutrients such as calcium, magnesium,sulfur, and micro nutrients like boron, copper, manganese are also addedto soils along with the primary nutrients in ratios prescribed byagronomists according to specific cron and soil needs.
7. Chemical Fertilizers
Chemical compounds suitable as fertilizers should be: high innutrient content to minimize delivered cost; stable to avoid hazards ancdhandling problems; readily water soluble and available to plant rootsystems. Cornercially-available materials meeting these requirements toa large degree are:
Primary Nutrient
Nitrogen Phosnhorus Potassium
Material N P 0 K 0Urea h6% Diammonium Phosphate PK8N Potash 611,Ammonium Nitrate 3I% Triple Sunerphosphate 46Z Pot. Sulfate 5h4pAmmonium Sulfate 21% Single Superphosphate 181 Langbeinite 22ZCalcitr, Nitrate 17%
The high nutrient contentsof urea, diammonium phosphate andpotash (KCL), plus ample raw material availability and large-scale technologyenabling tens of millions of tons to be provided annually, has led to thesecompounds being the most popular fertilizer materials in the world today.Urea has accordingly been chosen as the optimum fertilizer to produce in theproposed new Nangal plant. (Had today's technology been available a decadeago, when the first Nangal plant was built, no doubt urea would have beenselected then, instead of calcium ammonium nitrate.)
8. Urea Synthesis
Urea is made by reacting ammonia and carbon dioxide. i3ace bothof these materials are produced during ammonia synthesis, urea productionis usually undertaken alongside an ammonia plant. Unfortunately, thecorresDonding acid of carbon dioxide (carbonic acid) does not form stableanmoniuw salts as do nitric, sulfuric or phosphoric acids. Therefore, simpleneutralization as used in making ammoniun nitrate and sulfate fertilizersis not possible. Instead, ammonia and carbon dioxide are combined underheat and pressure to make amionium carbamate which, although unstable, canbe dehydrated under pressure to form urea, a stable compound. Againunfortunately, the overall reaction is completely reversible and even at300 atmospheres pressure and 2000C. the conversion to urea in a single passthrough the reactor is under 70%. This introduces several complications:high pressure must be used to maximise conversion; unconverted reactantsmust be separated and recycled; increased corrosion under the high temperaturesand pressures used must be overcome, and urea decomposition into undcsirableoroducts must be minimized. In recent years, several engineering and producingcompanies have developed ways of surmounting these problems, and large plantscapable of oroducing a thousand tons ner day, or more, of urea to rigidchemical and nhysical soecifications are now onerating successfully for longperiods throughout the world.
Industrial Projects DeDartmentlovember 1972
Page 1
FCI: iNA2GAL FMTIL1ZiZ F.PRJECTFCI: DESCRIPTIO'! OF THE CC:APOYLTIU2:
A. .Existing Ooerating Divisons of FCI
FCI is the largest fertilizer compaxy in India (414,000 TPI' ofN capacity) at present with five operating units, plus the Plarnning andDevelopment Divison, which are described below, These oDerating uni-s,along with rCI's expansion projects are suwmarized in Annex 2-2. Historivalnerfornance for the operating divisons is given in Annex 2-3 which showsthe production capacity and actual production of the units. Capacityutilization has averageu about 70s for nitrogen and about 55t for phosphaueover the past 3 years. An analysis of the data indicates that Gorakhpurand Nangal have had relatively little difficulty (except Nangal's po,ernroblems in 1971-72) and have consistently operated at high effician'zy.iindri and Namrutp have continuing operating problems and operate considerably
below desirable levels of capacity utilization. Trombay has shlown smallorofits only in the recent two years and the c:rrent fiscal year has demonStrateda great Improvement in performance.
)verall performance of FCI has been relatively poor. As indicatedabove, the divisional perfornance has varied widely for comnlex reasons andthese are discussed below:
1. Trombay (iiaharashtra)
The Trombay Unit produces urea, niUrophosphate and methanol.Initial uroduction was begun in 1965. The nlant was financed with fundsrom J..,. AID and GOI and the major plant units are ammonia (Chemico), urea
(Chemico), nitric acid (C & I Girdler) and nitroDhosphate (C & I (Zrcler)with design contractors listed in parenthesis. The olants had highconstruction costs and significant technical difficulties have occurred."'Ci's onerations of the nLants have been at a relatively low outnut levelreflecting both technical and management problems. At the Dresent time FCiis involved in arbitration proceedings against the contractors; claims andcounterclaims amount up to US +28 million. The plants onerated for rmany yearsat about 60i4 canacity or less and have unusually high maintenance co ,ts. Tnefinancial nlan for Trombay's original facilities was much higher :Ln debt thannormal for SCI - 70% - and the high debt services - partly due to the Runeedevaluation In 1967 - has also contributed to the poor profit perfo.r.ance ofTrombay.
FCI has taken some steDs to imDrove the performance of thisdivison. The Tennessee Valley Authority (USA) sent a mission in 1967 andthe lank in 1969. Both missions made recorinendations which have partiallybeen considered by FCI management. An exransion nroject at Tronba- s beennronosed to IDA that includes modernization of the existing facilitits. heex'ansion orogran consists of a NPK fertilizer olaat based on imrnortedarmronia of about 75,000 TPY MN and 75, 000 PoO Trombay Profitability hasimproved substantially and profits for FY 1973 should be about 's.5O million.This project is scheduled for appraisal by IDA in early 1973.

2. Gorakhpur ('Jttar Pradesh)
This divison, which produces urea only, began production inearly 1968. Gorakhpur, financed with Japanese credit plus iunds from G0,was built by Toyo Engineering Corporation of Japan at a total oroject costof about $'45 million. This cost is considered excessive with much of thehigh cost due to certain over-sized equipment and excessive snare equip-ment.
The plant operates very well and can easily exceed 1C0' ofdesign capacity on a daily basis. The limiting factor has been power supDlyand as power reliability improves in Uttar?radesh the performance of thisdivison should steadily increase. The Gorakhpur divi3on is, along withNangal, one of the best operating divisons of FCI, and its urofit shouldincrease as its Dower problems are overcome.
The rlant units at Gorakhpur are ammonia and urea with naphthaas a feedstock. The ammonia planit is designed in two streams each with acapacit.y of 175 TPD NHH3. rhe plant uses electrically-driven reciprocatingcompressors and has a relatively high operating cost as a result. Vperatingcosts are also high because of the high cost of feedstocX and the rprocessingsteps required by the use of cracked naphtha.
In December 1971 IDA approved a US :10 million credit for anexpansion project, which will increase Gorakhpur's capacity from 180,000 TPYto 314,000 rPY urea. The exparnsion project should be conmissioned in 1975.
3. Nangal (Punjab)
The Aangal Divison produces heavy wacer and ualciuii-arimoniumnitrate (25'< i4) fertil'zer (CAN). initial production began in 1961 with arated capacity of 80,000 TPY nitrogen (see annex 3-1 for further details).
14. rJamruD (Assam)
The Namrup factory produces urea and armonii sulfate. The Dlantstarted comnercial production in January 1969 and has never achieved ratedcapacity. The factory was designed by Chemico and contains small processunits for ammonia, urea and ammoniuri sulfate production. Ammonium sulfatesales are low due to competition from Hindustan Steel which produces by-product ammonium sulfate at a lower price than :amrup. As a result, 1iamruip'sfinancial performance has been unsatisfactory.
A detailed evaluation of Namrup was not made but it is doubtfulif the existing facilities can ever be profitable without major revisions.The plant is being expanded (330,000 TPY urea) with the new units expectedon-stream it late 1973 (see below). However, the total market for fertilizerin Assam is low so most of the increased production must be shipped intoBihar and further aw;y.
5. Sindri (Bihar)
The Sindri divison produces ammonium sulfate, urea, and cioublesalt (ammonium sulfate - ammonium nitrate) nlus industrial chemicals. Mostof ths existing Droduction facilities are old, inefficient units with high
ANNEX 2-1Page 3
maintenance costs and the divison has excessively high employment of about8,000 people. The plant operates at about 70% capacity with major causesbeing power and equipment failures. The ammonium sulfate plant is alsoa major cause of losses due to high cost of gyosum feedstock. Sindri'sfinancial performance has deteriorated substantially in the past yearsand it is contributing mach to FCI's poor financial results.
A rationalization program is underway including adding productionfacilities for phosphoric acid and triple superphosphate (TSP), improvingammonium sulfate production and possibly shutting some of the olderfacilities.
6. Planning and Development Divison (Bihar)
The P & D Divison is the engineering and research and developmentarm of FCI. It is located adjacent to the Sindri Unit in Bihar. Total staffof P & D is about 2,000 with about 700 engineers and designers workingdirectly on engineering projects, planning and technical service functionsfor the existing units.
In addition to engineering duties, the divison develops andmanufactures catalyst for use in ammonia plants and has extensive pilotplant and research and development facilities. The catalyst manufacturingprogram is technically sound and some catalyst has been sold and used inplants in India. 0ver the next few years as catalyst consumption grows inthe country, catalyst production should become profitable.
P & D has several license agreements with international processengineering firms; the most notable being:
Montedison - Italy - ammonia and ureaLurgi - Germany - Rectisol C02 removalShell - lNetherlands - fuel oil gasificationKoopers - Germany - coal gasificationNissan - Japan - phosphoric acid
Licensing arrangements for other Drocess technology are obtained when neededfor other projects. P & D has also develoDed its own process know-how forsuch technology as ammonium sulfate, ammonia synthesis gas purification andothers. In all of the present aimaonia-urea works in progress P & D isresponsible for engineering, design, project schedule and procurement basedon process design packages from the various licensors. where supplier'scredits are involved, the foreign process collaborator handles mostprocurement from outside india.
Project implementation in FCI is not clearly defined and theresult has been that a number of new projects have been delayed in completionas long as two or three years. There is no one project manager with overallresponsibility; instead, the functions are divided between the genera'lmanager of a particular unit and P & D. Supervision of work at the site isthe responsibility of the General Manager of that unit. Although P & Dis responsible for project schedule, its completion time can be greatlyaffected by the General Manager's staff. Budget control is another critical
ANNEX 2-1Page 4
area of split responsibility with P & D responsible for design and procure-ment and the divison management responsible for construction costs. P & Dappoints a proiect coordinator to sunervise its activities and maintainsliaison with the unit management. MaJor decisions on design and procure-ment are made by a committee consisting of the top level management of P & Dso the nroject coordinator does not have full resnonsibility for nrojectmanagement. The general engineering capabilities of P & D are quite good.
Tynical design !Irawings and specifications were reviewed for the severalprojects now in the design stage and they appeared to be thorough andprofessionally done.
The overall responsibil'ty of P & D in executing the severalammonia-urea orojects is greater than heretofore generally recognized byIDA. The resDonsibilities of the Process licensors appear to be the initial
nrocess iackage, a limited anount of checldng, and supply of constructVionand conmissioning advisors. The guarantees offered are process guaranteesand are not liksly to be enforceablo to any significant degree. FCI as awhole has total responsibility for project management, project schedule and
budget.
It is in these areas where P & D (FCI) is most lacking. Prolectcoordinators and newly appointed General YSanagers are not always experiencedin the comolex task or designing, assembling and erecting the vast quantityof equioment, materials and manoower required for these projects which havecapital investients of $80-l)O million-;. Many delays are outside P & Dcontrols due to such factors as license restrictions, supplier's creditsli-mtations and domestic difficulties such as transport and fabrication.the presence of such nroblemns, however, requires much more attention to aproJect's critical nath schedule, more advanced nlanning, and leaves lessroor, for error than in more highly industrialized nations.
B. FCU's Ecoansion Progran
CT will be one of the world's largest fertilizer producers afterits expansion orogram is comoleted in 1979 (projected carnacity 2,200,000tons of ). :C1 has nine major projects under imolementation at present.The capacities, costs and exDected on-stream dates are given in Annex 2-2.Al1 these oro4ects are being executed by FCI's P & D Divison with theassistance of various other process and engineering firms.
Durgapur, sjamrup (exoansion) and Barauni are substantiallydunlicate Dlants based on nrocess designs obtained from Montecatini Edison(Italy), aad include process units for armonia and urea. These projectsare being financed with ltalian credits and funds from GOI. The SindriRationalization Project is a triple superphosphate (TSP) unit which includesfacilities for sulfuric and phosphoric acid as well as TSP. Much of theengineering procurement is domestic, including a subcontract with FACT. G01is providing all funds including foreign exchange from Belgiumn and Bulgariancredits.
1/ Furthermore, the exDansion program of FCI has severdrytaxed managementcanabilities especially in the area of middle management.
ANNEX 2-1Page 5
Talcher, Ramagundum, tialdia and Korba are large aMmonia-urea projectswith ammonia being produced by coal gasification. Montedison is themajor engineering collaborator with acditional assistance from Koppers(Germany), Lurgi (Germany), and Technoexport (Czechoslovakia). Coalgasification is relatively unDroved technology and the projects are ambitiousundertakings by GOI and FCI. GOI is also providing the project fundsincluding Italian and Czech credits. The projects are in the early designstage and because of anticipated design problems, are not expected to becompleted before 1976.
All of the above nrojects are being financed about half by equityand half debt and fixed assets of ooerating units represent approximately5M of the total fixed assets of the corooration. All expenses includinginterest during construction are being capitalized, so the company's profitperformance will not be affected by these projects uaitil oroduction starts orunless the urojects are delayed. Three orojects under construction, Durgapur,:'amrun and 7arauni, have exnerienced excessive delays. Durgapur is twoyears late in conmissioning with Drocurernent and project management beingmtajor causes. w'ork on the I'A financed C-orakhpur Expansion Project has juststarted. Agreements on nrocurement between G01 and IDA should prevent anyannreciable delay on this nroject.
In addition, FCI has several projects under active considerationwhich are also given in Annex 2-2. These projects are in various developmentstages and it is difficult to predict their ultimate disposition. The datesgiven are FCI's estimates. * hese data indicate the growing influence ofFCI and the public sector on the fertilizer industry in India. If FCImaintains its caDital expansion program on schedule then in 1979 the companywill have %9f of india's nitrogen capacity and 30% of phosphate CPmacitycompared to 30" and 10% respectively for the current capacity.
C. FCI Doard of Directors and Management
The membershin of the Board is given in Annex 2-3. Of the totalof 12 members, five are from :CI, three from government ministries, twofrom other public sector enterorises and two are from private business.The influence of GOI, rarticularly the Ministries of Finance and Petroleum& Chemicals is seen very strongly in the comDany'e management and operation.
Industrial Projects DepartmentNovember 1972
ANNEX 2-2
FCI: NANGAL FERTILIZER PROJECT
FCI: EXISTING UNITS AND PLANNED EXPANSION PROGRAM
DesignCapital Capacity
Costs '000 TPY On-StreamName Location Products (Rs million) N P2Oc _ Date
Existing Units
Trombay Maharashtra Urea, NPK 90 44 1965Gorakhpur Uttar Pradesh Urea 82 1968Nangai Punjab CAN 1/ 80 1961Namrup Assam rea, AS-_ / 1968Sindri Bihar Urea, AS,
Double Salt i/ 117 19h8
TOTAL 4Th 4
Projects Under Construction
Durgapur West Bengal Urea 486 152 1973iNamrup Assam Urea 470 152 1973Barauni Bihar Urea 526 152 1973Sindri Bihar TSP 340 156 1975Ramragundam Orissa Urea 946 229 1977Talcher Orissa Urea 946 229 1977Gorakhpur Uttar Pradesh Urea 120 62 1974Haldia West Bengal Urea/'NPK 854 152 76 1977Korba Madhya Pradesh Urea 246 229 1978
TOTAL 5,634 1,357 232
Projects in Planning Stage
Nangal Punjab Urea 769 152 1975/6Sindri Bihar Urea 954 169 1977Trombay Maharashtra NPK 3o 132 132 1977
TOTAL 2,153 453 132
Grand Total for FOI 2,2214 08
Total Projected Capacity in India in 1979 4,550 1,340
% of Projected Capacity in 1979 by FCI 49 30
1/ Calcium Ammonium Nitrate7/ Ammonium Sulfate/ Ammonium Sulfate - Ammonium Nitrate
Industrial Projects DepartmentNovember 1972

FCI: NANGAL FERTILIZER PROJECT
FCI. MA1AGEMEN r - BOARD OF DIRECTORS
Years of FCI ServiceBoard Company
1. Mr. H. N. Sethna FCI Board ChairmanChairman, Atomic Energy Commission 12 -
2. Dr. K. R. Chakravorty Managing Director FCI 3 21
3. Mr. 0. K. Ghosh Director (Finance) FCI 3 7
4. Mr. K. C. Sharrma Director (Projects) FCI 3 21
5. Dr. S. K. Mukherjee Director (Production and Marketing) FCI 3 21
6. Mr. R. Hasan Director (Personnel and IndustrialRelations) FCI 1 14
7. Mr. N. K. Sreenivasan Joint SecretaryMinistry of Petroleam and Chemicals 1 -
8. Mr. S. M. H. Burney Joint SecretaryMinistry of Food and Agriculture 4 -
9. Mr. S. K. Majumdar Joint SecretaryMinistry of Finance 3 -
10. Mr. C. R. D-asipta Managing Direc-orIndihn Oil Corporation 2 -
11. Mr. J. S. Patel Private Business 2 -
12. Mr. B. K. Khanna Managin- DirectorFertilizers and Chemicals (Travancore) Ltd. 1 13
Industrial ProJects Departrent: ovemiber

FCI - NANGAL FERTILIZER PROJECTORGANIZATION CFIART OF FERTILtZER CORPORATION OF INDIA
BRD OPOIAR IlS
(ECOMMI1TEtSOF 7I4E BIOAHU
F INA NCf-~~~~~~~~~~~~~~~~~~t1 h_ 0f EI UNS.iiiIIfz. - l*E~~~~~~~PIIOIECIS
FMANA,,N, 1)11, t 1 )
IN|FORMAL CONSU TATI " COMMiB'r- [ CIIMMIITEEOI ;,,NCI1.NAt D|CjjjjJ
____ ____ _ __ _ 1 _DUL TU "lr-S wCTncOH fPERSONNEL IlECO
_ ~ ~ ~ ~ ~ i _ 4v0et*) ~~~~~~~~~~~~~~~~~AN!u INuSH .AL rl f IN'AN CF.I
F7cUR (II0U0cIION AND MAHIC BI NU DUHGAPUR Ri IAKANIIDœ, S K MUKitRJEE) NH _-'q _ _ __K_
___ ,__MLEPE J N B TINIULNA N -bRAHIALNI_
M L LEEKHA [P IISUNINE1 ANI fIIANCE PLANN:NG AND DEVELOP
iN N P AJ,IRIAL A N SIVAPAMA MENT OIVISIONNAIIAIIP EXPANSION RI hAY,0GNS K~p GM OP AGARV.Al-
A _ MiTItA 'A H ONA _ R S G JN GUPTA
PRODUCTION MARIO TING TAI -CIfR S PANA' SE RE'ANY GPOUP S R G PAOIINDHf STAHfi f c} FJCEf7 R SUIIAMANYAM P H JAJIWLIA P K BISVrAS
SINDI'l STRAP CfFICER MANA6LtMLN GM R.IX (OSH N.M VACHRAJANI ITAMALUINNAM H-(TINGD~ Gm BR CHANDRA XV ANTCIN,' A. MENON0I GM Ss SHIVASTAVAr NANGAL *ONFK
NANGAL S N KINSHYAP P tIEANANCAL ~~~~~~~~~~~~~~ cl-IA.IITNA
GM H S KAC.WARA TRC)MbAY ZlONE
GoITAA(1Urs unV (H ANDRASEHARAN ' KDII I' UA ; S XIlLHr,TI
GM KL MEHRA GORAK.HPUH 2-INE
JC PANGE Y-HlB J I PANY IN,' iR UP
G M AK MTROA EAST.AN ZIr.E j Dl. l-'P N,
O| GM Pt KUEIRE JA S.iYAIAAIANErIJCE | | II :
THOMBAY -| iII1
CM ouLtEP SINGP IILOwA
InduLttal Proiects *fHlnartTTentAugu.jt 1 272
ANNEX 2-5 ¶FCI: NANGAL FERTILIZER PROJECT Page I
7Cr - CONMIODATED rNCO0I fATDPIS - IIISTRICAIVi 3
Fiscal Year Ended M4arch 31 1964 1965 1966 1967 1968 1969 1970 1971 1972(InW!Tlion Ruseea) --
Salef 3 269 245 252 312 393 483 597 730 897
Costs of Goods Sold
Raw Material 55 58 66 78 98 127 156 173 195Conounble Stores 11 11 14 17 18 21 25 30 32Bags 21 18 21 25 24 27 37 44 51Finiahed Goods -- - - 1 23 3 46 102
-M 17 IT T2 I;T T n 380Tncrease (Decrease) in InventortiA/ (l6) 5 8 8 6 _32 48 £25) (60)
Gross Proftt 166 1 200 258 3 424 422 457
OperatIng EXDe neS
Salaries Wages5 rnd Benefits 29 38 41 5o 54 66 86 104 114Pow-r d rs eIA 6/ 36 38 43 61 67 71 97 98 113Freight and Handling 2 2 2 3 9 11 25 32 40TaSe, Insurance and Royalties 12 5 4 3 3 4 6 9 10Repairs and Maintenance 21 22 21 32 39 43 54 52 61Intere et on Short-Term Borrovwings - 1 4 !1 4 4 5 7 eDepreciation 50 39 5 72 74 85 127 119 120Adninietrative OverheadbV 4 4 5 7 9 15 25 29 40Consolidation Adjutmente (6) (7) (iI) (10) !10) (12) (16) (24,) (52)Expensee allocated to Projects under
Construcrtion 15) () 12 (20 (22) £2. (24)143 1_ 37 155 2 237 267 377 396 430
Lperati g Proftt 23 18 4 (11) 21 50 7 26 27S,'
Ot.her Inco,ie 6 12 6 16 14 11 12 20 18
Other Expenses
Interest on Long-Term Debt 19 22 27 39 41 52 67 67 68Interest Capitalized for Projectsunder construction (12) (20) (20) (16) (17) (7) (29) (t (i6)
Net interest ChErges 7 2 7 23 24 25 38 29 22
Mis:ellaneou9_/2
1 1 4 3 2Sub-Total 3 T + ' -42- 3 24
Net Profit 19 2 2 (24) 8 6 17 14 21-
I/ These atatments have been adjusted by IDlt staff. A bre>akdown of the kdjustments to the pablished profit figures ispreaerted in Annex 2-5, Page 2.
,?/ The caparative net profita of the individua1 units and conea,ldated income expenditure breskdogi ere presented iAnnex =-,sge 3
3/ Net of excise dity imposed from April 17, 1969.r/ Finished Product Inventoriee.
Retroactive adjuetmneat for inereased power rates for the Nangal unit have been allocated to the respective years.T/ The ircreasee frm 1967 onwards are die to the gradial shift fram distribution through the Ooverrment Fertilizer pool to
direct marketing by FCI.7/ Indirect expensea on repairs, power ard fuel etc., charged to these heads ard also included in othsr heads of expenditure.3/ Includes interest frrm Rourkela contract'(sac Page 2). The figures include 1971 Rs?7 million and 1972 ReS million froms the Shakra
Manapmnt Bard copenesating PCI for losss due to pmer cuta at NengAl.9/ Includes retroactive adJu amats for ctfferent heads of expenses and write-off for Korba Project.10/ In FY1972. RsIl.5 oIlLing and distribution expenses of existing units were capitalixed by FCI for new projecta; FCI may also be
liable for additional excise duty on suphals fertilizer (Troisbay) up to R17 million and on naphthd up to Rs8 million, bothrelated to FY1972.
Industrial Projects DepartmentNovember 1972
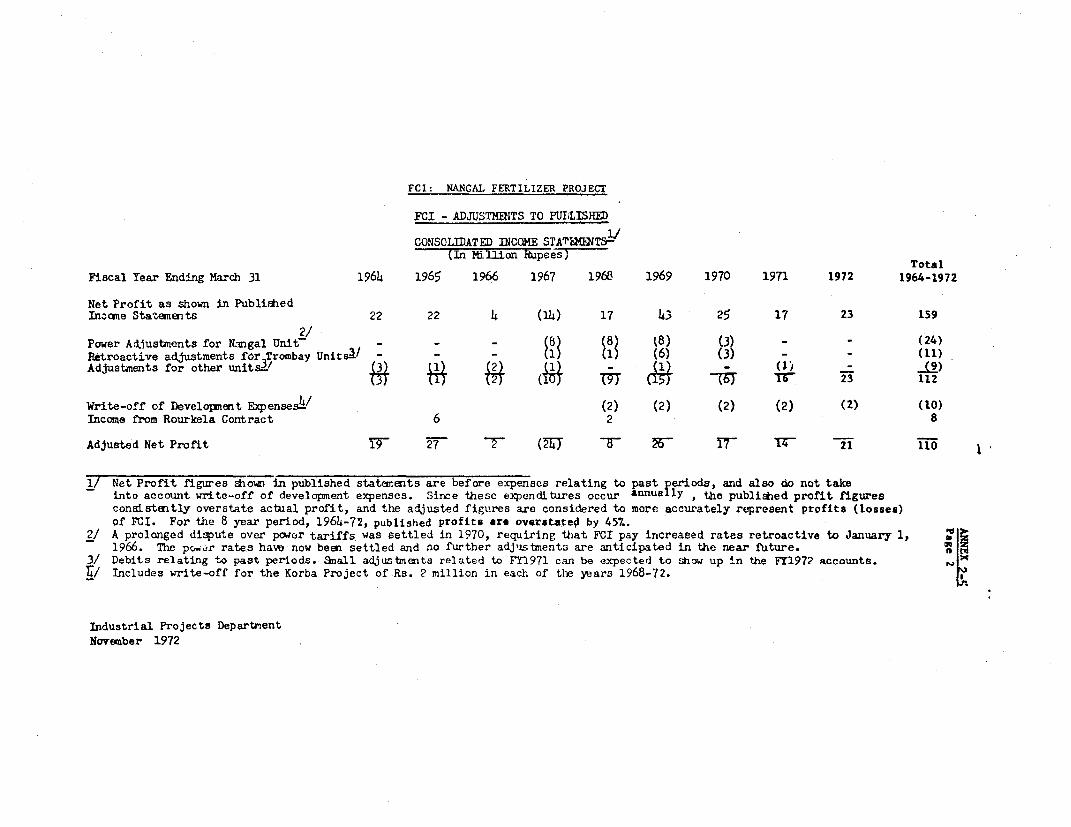
FCI: NANGAL FERTILIZER PROJECT
FCI - ADJUSTENITS TO PULLISHED
CONSOLIDATED INCOME STATUGNTS-;(In Million Rupees) Total
Fiscal Tear Ending March 31 1964 1965 1966 1967 196B 1969 1970 1971 1972 1964-1972
Net Profit as shown in PublishedInhcxme Statments 22 22 4 (14) 17 43 25 17 23 159
Power Adjustments for Nangal Unit - - - 88) (3) ) (24)
Retroactive adjustments for Trombay Units-I - - - 1 1 (6) (3) _ _ (11)
Adjustkents for other units3/ (3) (1 (1 - (1) - - ( -9)
X3 (1 . . (s1 m (Ms _7) 1r- 23 112
Write-off of Development Expenses4/ (2) (2) (2) (2) (2) (10)
Income from Rourkela Contract 6 2 8
Adjusted Net Profit 1Y 27 - (5C7 5 - 7i-
1/ Net Profit figures shown in published statements are before expensos relating to past periods, and also do not take
into account write-off of development expenses. Since these expenditures occur aInnua lY , the published profit figures
consistently overstate actual profit, and the adjusted figures are considered to more accurately represent profits (losses)
of FCI. For the 8 year period, 1964-72, published profits are overstatej by 45%.2/ A prolonged dispute over power tariffs was settled in 1970, requiring that FCI pay increaeed rates retroactive to January 1,
1966. The povar rates have now been settled and no further adjustments are anticipated in the near future.
3/ Debits relating to past periods. Small adjustments related to FY1971 can be expected to show up in the FY1972 accounts. ii/ Includes write-off for the Korba Project of Rs. 2 million in each of the years 1968-72.
Industrial Projects Department
Nov-ember 1972

FCI: NANGAL FERTILIZER PROJECT
OHKPARATIVE NET PROFIT OF FCI UNITS(In Million Rupees,
Total TotalFiscal Year Erded tarch 31 1964 1965 1966 1967 1968 1969 1970 1971 1972 1964-1972 1964-1972
*an Total FCI
Sindri 5 10 15 10 2 (4) (2) (16) (34) (14) (13)Nangal 18 17 2) 5 21 34 50 27 21 207 188Trarbay (20) (41) (18) (3) (27) 6 26 (77) (70)Gorakhpur 1 20 12 13 46 42Nanrup (3) (21) (14) (5) (43) (39)P & D (3) (6) (4) 2 3 (1) I 2 (6) (5)
20 21 2 (24) 8 28 19 16 23 113 103
Rourkela 7 2 9 8Write-off Korba and DevelopmentE-VenditUres 1 1 - - 2 2 2 2 12 11
Total FCI net profit (adJusted) 19 27 2 (?h) 8 26 17 14 21 110 100
2/FCI CONSOLIDATED INa)HE AND E DIENTURE ER&&KIX1ft
(As percentage of Sales)
Fiscal Tear Ending March 31 1964 1965 1966 1967 lutL 1969 1970 1971 1972
Sales 1O0 100 100 100 100 100 10O 100 100Cost of Goods Sold and inventory
changes 39 37 37 36 34 34 29 42, 492/Gross Profi ts 61 63 63 64 66 66 71 i 51Operatinr_ F-xpenses 53 56 62 69 60 S5 63 54 48Operating Prolit 8 7 1 (5) 5 10 o 4 3Other ncane 2 5 2 5 4 2 2 3 2Other Expenses 3 1 3 8 _ 6 5 7 5 3Net Income 7 11 - 2 5 3 2 2 b
Debt Sen-ice Coverage 2.8 5.7 i.6 1.3 1.3 1.5 1.6 1.2 0.9
1/ Thess net profits are based upon published profit statammts, corrected by redistributine expenses relating to past periods.2/ The ad,,'ev-i~nts discussed above have been incorporated in this breakdown.3/ The larCe Increase in this figure over past years represaits the purchase of finished productF for resale of Rs46 million in 1971 and
RsIO2 nili ion in 1972.
Industrial P ie ec ts 'epartmentNovemaber 1972
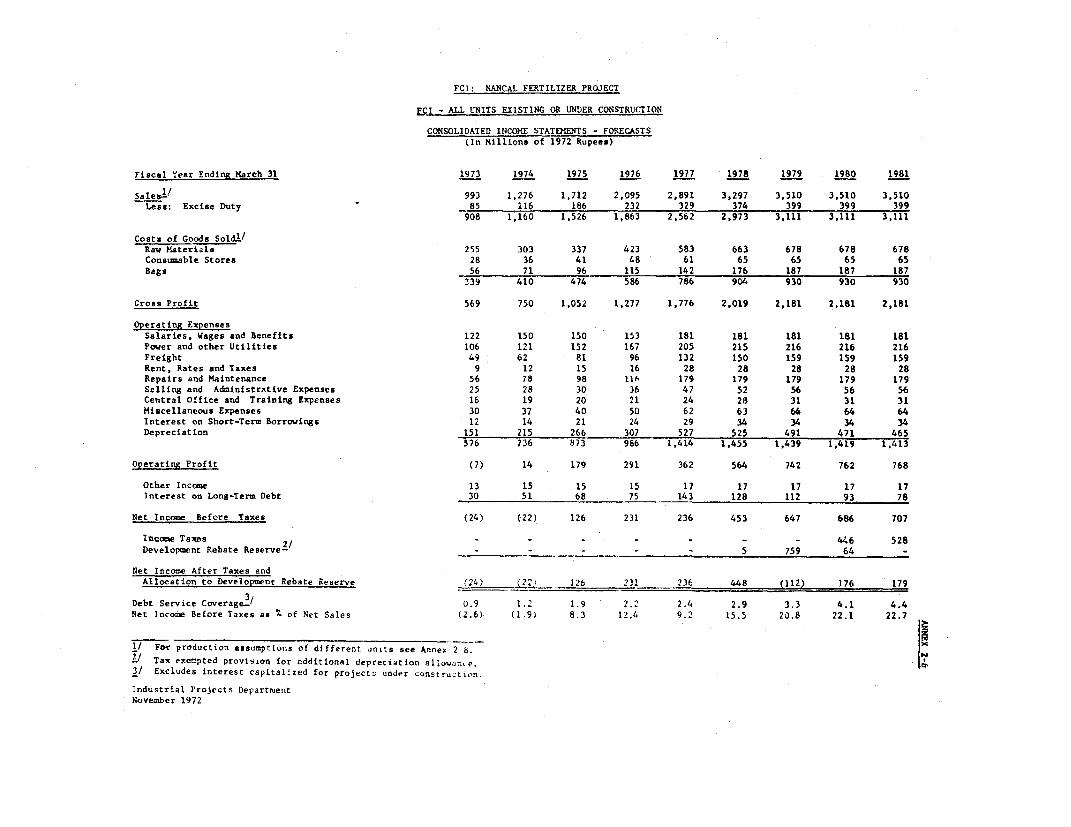
FCI: NANCAL FERTILIZER PROJECT
Fgl - ALL UNITS EXISTING OR UNDER CONSTRUCTION
CONSOLIDATED INCOME STATEMENTS - FORECASTS(In Millions of 1972 Rupees)
Fiscal Year EndinR March 31 1973 1974 1975 1976 1977 1978 1979 1980 1981
Salesi/ 993 1,276 1,712 2,095 2.891 3,297 3,510 3,510 3,510
Less: Excise Duty 85 116 186 232 329 374 399 399 399
908 1,160 1,526 1,863 2,562 2,973 3,111 3,111 3,111
Costs of Goods SoldilRaw Materials 255 303 337 423 583 663 678 678 678
Consumable Stores 28 36 41 48 61 65 65 65 65
Bags 56 71 96 115 142 176 187 187 187
239 410 474 586 786 904 930 930 930
Gross Profit 569 750 1,052 1,277 1,776 2.019 2,181 2,181 2,181
Operating ExpensesSalaries, Wages and Benefits 122 150 150 153 181 181 181 181 181
Power and other Utilities 106 121 152 167 205 215 216 216 216
Freight 49 62 81 96 132 150 159 159 159
Rent, Rates and Taxes 9 12 15 16 28 28 28 28 28
Repairs and Maintenance 56 78 98 116 179 179 179 179 179
Selling and AdministrAtive Expenses 25 28 30 36 47 52 56 56 56
Central Office and Training Expenses 16 19 20 21 24 28 31 31 31
Miscellaneous Expenses 30 37 40 50 62 63 64 64 64
Interest on Short-Term Borrowings 12 14 21 24 29 34 34 34 34
Depreciation 151 215 266 307 527 525 491 471 465
576 736 873 986 1,414 1,455 1,439 1,419 -1,4t13
Operating Profit (7) 14 179 291 362 564 742 762 768
Other Income 13 15 15 15 17 17 17 17 17
Interest on Long-Term Debt 30 51 68 75 143 128 112 93 78
Net Income Before Taxes (24) (22) 126 231 236 453 647 686 707
Income Taxes 2/ - - - - - - 446 528
Development Rebate Reserve- - - - 5 759 64 -
Net Income After Taxes andAllocation to Developmenr Rebate Reserve (2-1 126 231 236 448 (112) 176 179
Debt Service Coverage.. 0.9 1.2 1.9 2.2 2.4 2.9 3.3 4.1 4.4
Net Income Before Taxes as % of Net Sales (2.6) (1 9) 8.3 12.4 9.2 15.5 20.8 22.1 22.7
1/ For production assumptions of different units see Annex 2 8. I
1/ Tax exetpted provision for additional depreciation ailowan.e.
3/ Excludes interest capital!zed for projects under cOnstruction.
Industrial Projects DepartrentNovember 1972
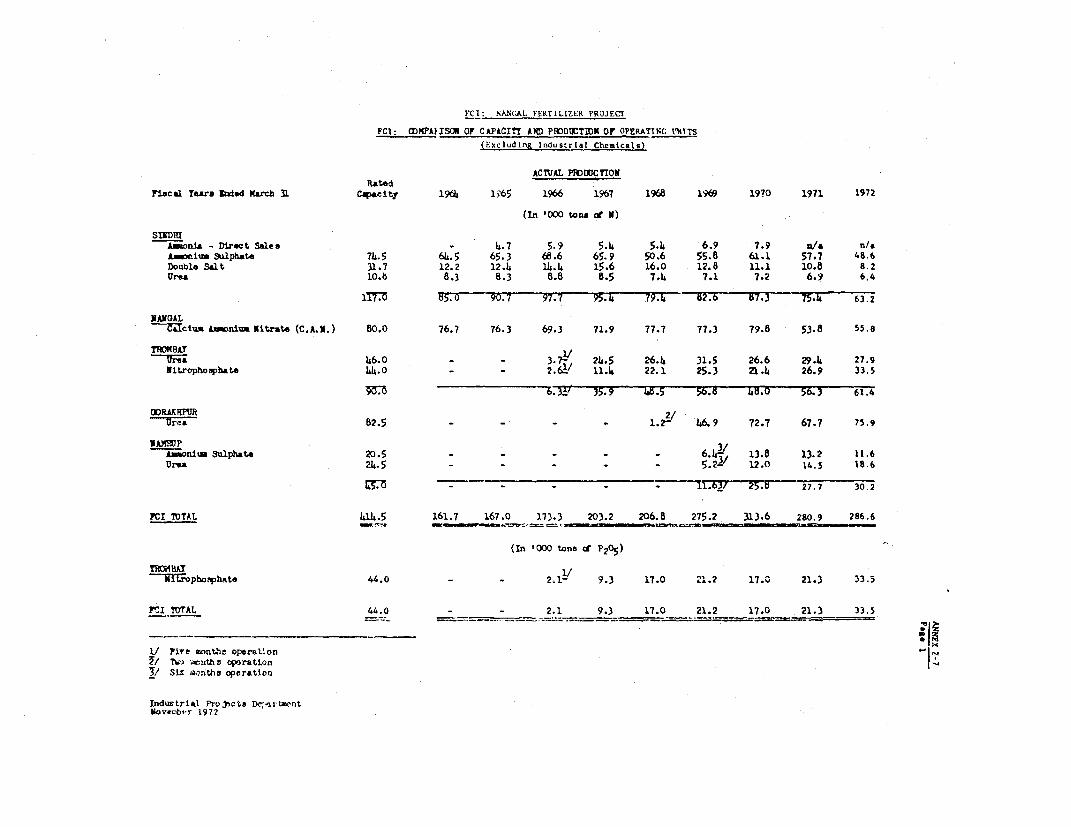
FCI: NAN;CAL FERTILIZER PROJECI
FCI OiO?PA1ISM OF CAPACITT AND PROtOIOTN OF OPERATINC i¶4TTS
(Excluding Industrial Chemicals)
ACTUAL PIODWCTr11
Rated
Fical Year reIEd March 31 C40city 1966 1965 1966 1967 1968 1969 19?0 1971 1972
(In '000 tons cC N)
SDIDhIAmoti - Direct Sales - b.7 5.9 5.4 5.4 6.9 7.9 a/& n/a
oniiun Sulphate 74.5 6.5 65.3 68.6 65.9 50.6 55.8 61.1 57.7 48.6Double Salt 31.7 12.2 12.h 11.4 15.6 16.0 12.8 11.1 10.8 8.2Uresa 10.B 8.3 8.3 8.8 8.5 7.4 7.1 7.2 6.9 6.4
i1l" 115.0 90.7 97.7 95.4i 79.1& 2.6 h7.3 75.4 63.2
NANOALCalcium Aoniu Nitrate (C.AII.) B0.0 76.7 76.3 6S.3 71.9 77.7 77.3 79.8 53.8 55.8
TROBAT I/
Urea 146.0 - - 3.7- 24.5 26.4 31.5 26.6 29.4 27.9
Nitrophospate b4.0 _ _ 2.61/ l1.4 22.1 25.3 21.4 26.9 33.5
6.34/ 35.9 48fi.5 56.11 - 1.O 56.3 61.4
W3RAUQEPlR 2/Ulrea 82.5 - - - - 1.2- 46.9 72.7 67.7 75.9
*IAWP 3
Anwia Sulphate 20.5 _ _ - 64- 13.8 13.2 11.6
Urs 214.5 _ _ _ 5.2/ 12.0 14.5 18.6
- - _ _ _ _ 11.637 25.11 27. 7 30.2
FCI TOTAL 41I.45 161.7 167.0 173.3 203.2 206.8 275.2 313.6 280.9 286.6
(In '000 tOns dt P 2 0 5 )
sRo ch t 1/Mi opihosphette 44.0 _ _ 2=- 9.3 17.0 21.2 17.0 21.3 33.5
FCI "TAL 44 0 - 2.1 9.3 17.0 21.2 17.0 21.3 33.5
V Five month1 operUonT/ TN .Axutha cprationT/ St% zcnthna o,peration
Industrial Pro,icta Dc,e-'rUwntUoveaber 1972

FOI: NANGAL FERPILIZER PROJECT
FCi: PERCENT CAPACITY 'JTILTZATIOII FORpE TING UWITS(Excluding Industrial Chenlicals)
N Production as Percentage of Capacity
Fiscal Years Ended March 31 6 96 i67~ 1 968 1969 1970 971 1972
Sindri 73 78 8L 82 68 71 75 64 54
Narngal 96 95 87 90 97 97 100 68 70
Trombay - - - 4o 63 53 63 68
Gorakhpur -- - 57 88 82 92
Namrup - - - - - - 57 62 67
FCI Total: Capeity ('000 tons)1/ 197.0 197.0 234.5 287.0 300.8 392.0 414.5 414.5 414.5
: Production ('000 tons) 161.7 167.0 173.3 203.2 206.8 275.2 313.6 280.9 286.5
: Production as percentageof capacity 83 85 74 71 69 70 76 68 69
P20 Production as Percentage of Capacity
FCI Total: Trombay Capacity ('000 tons) - - 14.' hh.0 " .0 44.0 4h.0 )44.0 4h.0
: Trombay Production ('000 tons) 2.1 9.3 17.0 21.2 17.0 21.3 33.5
: Production as 2 ercentaceof capacity. - - 11 21 39 h8 39 h8 76,
1/ Adjustied for comrencemen. of podc'I-ctrn in n- lj -
2/ Increased phosphate capacity ut,_ 'iati-. s dm-A r e C: f :.-rri. nhri.sphi-.e (DIF) as well as
improved operations.
Industrial Pro4ects DepartmentNovember 1972
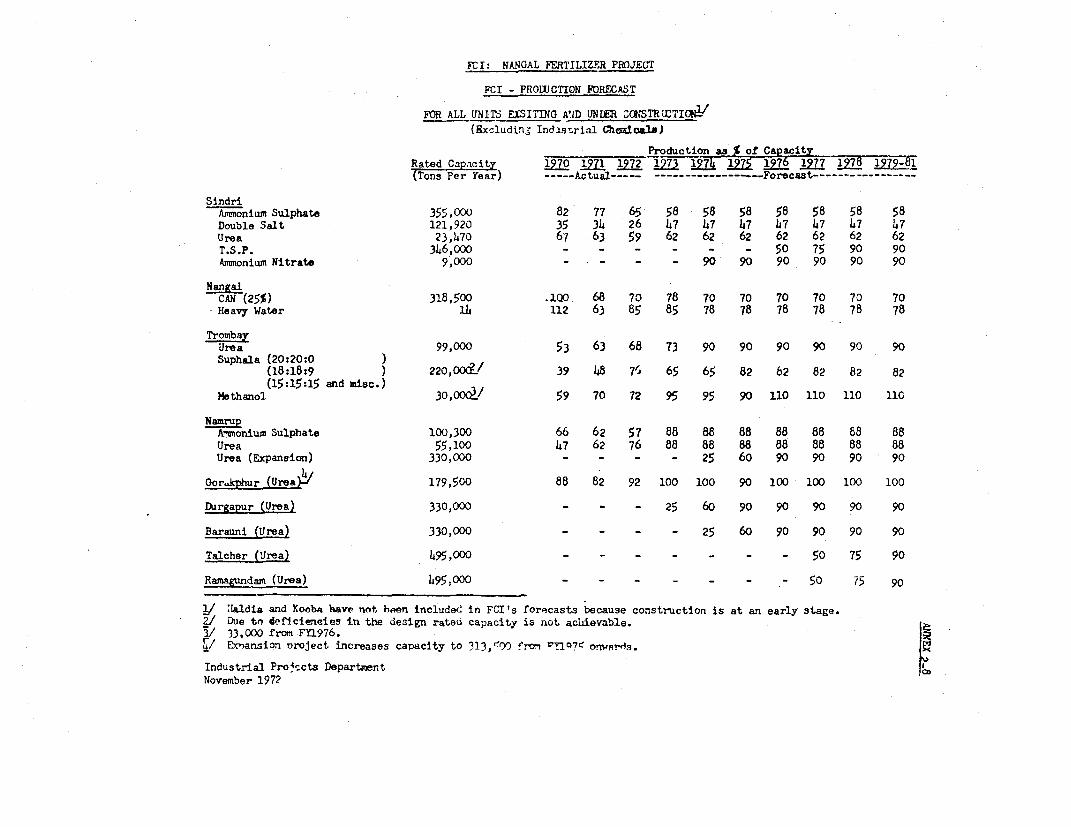
FCI: NANGAL FERTILIZER PROJECT
FCI - PROWJCTION FORECAST
FOR ALL UNITS EXSITTNG A'lD UNDER CGNSThU:TIOI(Hxcluding Indfist.rial Qinda3.U)
Production as S of CaacitYRaed Capacit 129L 1971 1972 1_73 7 .12ja 1976 97 1278(Tons Per Year) -- Actual----- --------------- Forecast-----------------
SindriAmionium Sulphate 355,000 82 77 65 58 58 58 58 58 58 58Double Salt 121,920 35 314 26 47 47 47 47 47 47 47Urea 23,lu70 6'1 63 59 62 62 62 62 62 62 62T.S.P. 346,000 - - - - - - 50 75 90 90Ammonium Nitrate 9,000 - - - - 90 90 90 90 90 90
Nanga1CAN (25%) 318,500 .lQO 68 70 78 70 70 70 70 70 70Heavy Water fi4 112 63 85 85 78 78 78 78 78 78
TrombayUrea 99,000 53 63 68 73 90 90 90 90 90 90Suphala (20:20:0 )
(18:18:9 ) 220,OOc?./ 39 48 7S 65 65 82 62 82 82 82
ethanol(15:15:15 and misc.) 30,00Q/ 59 70 72 95 95 90 110 110 110 l1
A-nonium Sulphate 100,300 66 62 57 88 88 88 88 88 88 88Urea 55,100 47 62 76 88 88 88 88 88 88 88Urea (Expansion) 330,000 - - - - 25 60 90 90 90 90
Gor-kphur lir-e-a) 179,500 88 82 92 100 100 90 100 100 100 100
Durgapur (Urea) 330,000 - - - 25 60 90 90 90 90 90
Barauni (Urea) 330,000 - - - - 25 60 90 90 90 90
Talcher (Urea) 495,000 - - - - - - - 50 75 90
Ramagundam (Urea) 495000 - = _ _ _ - 50 75
/ Ialdia and KoebA have not been included in FCI's forecasts because construction is at an early stage.2/ Due to deficiencies in the design rated capacity is not acihievable.3/ 33,000 from FY1976.4/ EFxansion nroject increases capacity to 313,,¢O0 fro r'YlO?I owerdS.
Industrial Pro 4 -cts Department 'November 1972
AWNFX 2-9FCI: )ANGAL FERTILIZER PROJECT
FC - CONSDLID&TED BALANCE M1TS - H9STORICAL
Fiscal Tear Ending .arch 31 1964 1965 1966 1967 1968 1969 15070 1971 1972
(Millions of Rupees)
ASSETS
Current Aseets
Cash 2 3 3 5 6 17 , 14 35Trade Re:eivables 53 21 22 71 80 112 67 185 108Loans 73 73 46 52 33 64 46 56 49Total Inventories 206 264 3C 31 260Total Current Assets 2; IQ m TT7s m 0ka 7 452
Fixed Aasets
Crosasti3 llunlt 821 846 1162 1315 1360 1865 1941 2018 2104Less: Deprsciatio3 36 433 Q? 584 673 ?90 913 IC3GNot Ftid Assets -T M75 1S T777
b) Expansioa Projects.Capital Work in Progress 283 463 376 432 570 3S4L 756 1OL' 1375Advances to Contractors 16 32 67 99 117
Other Assets1' 2 1 iC 22 19 19 23 20 62
Investments I I 0 1 1 1 1 1
-OTAL ASSETS: 996 1125 1332 1549 1707 2385 2L8 2744 30E-
LIABILITIES AND CAPITAL
Current Liabilities
Accounts Payable andAccrued 7.Veness 37 72 78 75 89 12k 103 136 169Short-Term Debt 11 13 54 71 49 58 67 80 138
Accrued Interest 7 8 17 17 18 26 19 17 17Other Current Liabilities 12 19 21 23 30 21 24 31 41Current Portion of Long-Term Debt 10 29 31 8 63 71 135 149 142
Total Current Liabllities 77R U1 . 3w 7 4 507
Long Term Debt
G0O.I. 228 793 407 488 534 681 636 651 712U.S.A.T.D. 114 119 138 180 16k 147 130 113 92Others 21 135 337 -?5 349
Total M7 ii z 'F 7r 4R 117 153
Leas Current Fortion of LT DebtG.O.I. 10 11 19 42 45 55 61 32 74U.S.A.I.D. - 18 12 16 18 16 17 21 ISOthers - - - - 24 4.6 5K
Sub-Total T: ' 7T T Y4_9 142Net Long-Term Debt 7 610 15 loll 3 Th: 10 0
ku Ity3nare apittal 480 480 515 579 676 728 966 1156 1375Reserves and Surpluses 107 121 122 116 15 165 All '165 187
Total 77 MT 37i PIT U : w T 15T$
Total Liabilities and Capital 996 1125 1332 149 1707 2085 241,8 2744 7M'.
Current Ratio 2.9:1 1.3:1 L.0:1 1.2:1 1.j:1 1.3:1 1.5:1 1. i: 0.491Net Long Tern Debt/Equity Ratio 36:64 39:61 441:56 47:53 45:55 5u:50 47:53 L3:57 39:61
ly deferred re-ue expenIt- such as saIes Prmotion for new projects.2! Include. capital expenditures on ctonbship and other as,ets for providing amenities to staff (IY .972 Re 174 elllion).
Industrial Projects DepartmentNovesber 1972

FCI: NANCAL IERTILIZER PROJECT
FCI - ALL _NITS EXISTfNG_OR _iDER CONSTRUCTION
CONSOLIDATED BALANCE SHEETS - FORECASTSn 7rFR1M n_so_ IT/29- fuppe s)
Fiscal Ycar Er,din1 _.rc h 31 1973 1974 1975 1976 1977 1978 1979 1980 1981
Asaets
Cuirlent Assetsc:.ajhf /18 21 176 441 956 1,665 2,48f 2,965 3,384T.ade Receiv.ables 117 145 186 218 247 247 247 247 247
Loans 52 56 56 58 62 62 62 62 62Total lIventories 319 374 _427 577 599 599 599 599 599Total Currenl Assets 506 596 8415 1,294 1,864 2,573 3,394 3,873 4,292
Fixed AssetsGross Ftxed Assets 2.611 3,539 3,716 4,D3u 6.651 6,671 6,695 6,716 6,735Less: Accnrrm.,lated Dcpreclitfor, 1 172
1,
37
11,673 1- 82 2,382 2,884 3,353 3,824 4,290
Net Fixed Assets TW27 42 2 G3 2.4 6A A9 378 3, 23Construction in Progress 1,772 1.807 2,43h 7,638 36 36 36 36 36Other Assets 55 58 79 80 59 31 31 31 31
Total ,3 4 4 79T3Tv
TOTAL ASSEI'S 3,772 4 629 5,463 6,160 6,228 6,427 6,803 6,832 6,804
Liabil Ities
Current LiabilitiesSundry Creditors 228 ?30 232 2S4 238 238 238 238 238Stiate Baiik of India 29 '1 217 318 374 374 374 374 374Currenit Portion of L.ong-Term Debt 148 175 _ 210 279 253 272 210 206 190
l;cS 1Jl9 i81 865 834 82,2 818 802
Lori-Terj Debt
GOI 9to 1 _45 1,:4 1,-57 "611 1,426 1,223 1,055 873
US-AID 4 53 31 14 - - - - -
Suppliers Credits 476 461 6,5 j36 28 199 131 88 63Th4 7 -1(''- - - -' 8. 6 I,2 1, s4 1 43 TM
Tess: Current I'oition of Lovwt-Tevr D,btrt -t; 9 ,2 7 2 , , 2_,_ 190Net Long-Term Debt i 82 ,,. 2,i if' I353 1,144 937 746
6istre Cnpital ,,f,:3 3,43 3.003 3,003Reserves and Surplus 1-7 ".i - ' ; 34s 2,074 2,253
;; *t, '. < ;: , ,-; *S ' < .,37 5,077 ,256
rTYrAM. . Al:: -r - --: ' ' -, " . . . 6,832 6,804
Current Rar ic 2 . - 9 4 I7 5.4Net Loni9 eriI !)er'Pvujtv :: t :Ž '. =e 1 - I t 12'88
1/ For the rtorpcast, it 11s ' A; jss.:ed ' I
-ndustrial Ira i.t .. r, O
Novem.rer 1972
FCI NANCGAL FERU LIZER PRWECT
FCI - CONSOLIDATED SOURCE AND APPLICATION OF F3NDS(In Million Rupees)
PiscRl Year Mided tarcb 31 1965 1966 1467 1968 1969 1970 1971 1972
Sownes of FundsNet iricome before interest 29 9 (I) 32 51 55 L43 43Depreciatico 3J 51 72 714 85 117 119 120
bE 60 7' lo6 13 172 lb2 163
Increase in Equity -_ 35 64 97 52 238 190 219
Increase in Long-Teru Debt0I 75 124 100 be 192 10 78
143
US-AID 5 17 74) __ __ __Suppliers Credits -- -- -- 21 115 201 82 -
o O 141 174 109 T161 143
Inaras in Sr2t-Teru Bank iBorrowings 2 41 17 (22) 9 9 13 58IneaSee In O*W Current Liabilities 43 17 (1) 22 34 (25) _ 38 43
Totol Sources of Funds 193 294 325 312 538 605 565 626
Applications of FundeIncrease ln Fi xed Asseta - Plants Urder Construction 160 (107) 40 137 (197) 378 28t 343Increase in Fixed Assets - Plants in Coercial Operation 23 328 1I2 40 501 80 70 89Increase tn Inventories (4) 43 23 47 58 39 (2) (41)Irrrease in Receivables and Loans (32) (26) 55 (10) 63 (43) 28 (4)
Int,rest Charged to Profit and Loss Accouct0(1 2 4 14 14 16 30 22 16US-AID - 3 10 10 9 8 7 6
Interest Capitalized for Plants Under ConstructionOOI 13 16 15 17 22 13 18 27US-AID 7 14 -- --
Supplier Credita -- -- -- 5 16 20 1922 27 39 41 52 67 67 68
Loan Repawents001 10 11 19 42 45 55 64 8?US-AID __ 18 12 16 18 16 17 21Suppliers Credits (fow operating units) =- -- * -- -
Suppliers Creditz (for projects under construction) -- -- -- -- -- -- 24 4611)- 29 31 _5 b3 - 7' J 14
Total Applicatiuns of Funds 179 7 g;T13 1 , 540 _ 592 54I
Akznual Cash Surp,rCes 14 -- f1t.) (1) (2) 13 16 21Accumulated Cash 4 4 t'2) (13) (15) (2) 14 35
IT ATuJn t.t ? outstanding Loan Amount due to RLpee Devaluatlon.2) Camh posltitn differs from aounts shown in the Balance Sheets since atJustments for prior years have been nade In the income statesents. Cash o&l1ces
are low since surpluses aLre transferred to 031.
Industria, Pmjects DepartmentNnvember 1972
FCI NAN(AL FERTIL.IZER PROJECT
FCI - ALL UNITS EXISTING AND UNDCR CONSTRUCTION
SOURCE AND APPLICATION OF FUNDS - FORECASTS(Irr Millions of 1972 Rupees)
Fiscal Year Fridi.R March 31 1973 1974 1975 1976 1977 1976 1979 1980 1981
Source of FifndsNet Income Before Interest, Tax2s and Interest Cepitalized 49 63 256 t66 380 581 759p 779 785Depreciation 151 _ 15 266 307 527 525 491 471 465
200 278 522 673 907 1,106 1,250 1,250 1,250
Increase in Equity 547 5t$ 416 316 - - - -
Increcse in Long-Term DcbtGOI 292 397 415 317 - - - - -
Suppliers Credits 126 80 - - - - - -
Increase in Short-Term Bank Borrowings 18 72 49 41 56 - - -Increase in Other Current Liabilities (128) _2 2 2 4 - - -
Total Sources 14,057 135 04 1q49 967 1 106 1 250 1,250 1,250
Application of FundsIncrease in Construction in Progress 272 38 649 203 (2,624) (27) -Increase in Fixed Assets/Operating Plants 516 944 201 '52 2,648 43 45 21 19Increase in Inventories 59 55 53 151 22 - - - -
Increase in Receivables and Loans 12 32 41 34 33 - - -
Interest Charged to Profit and Loss AccountGO1 22 37 52 62 123 113 100 86 73US-AID 5 4 3 2 - - - - _Suppliers Credits 3 10 13 It 20 15 12 7 5
interest CapitalizedcO¶ 27 28 34 48 - - - -Suppliers Credits 16 6 28 12 - - - -
73 45 130 135 144 128 112 93 78
Taxes on Income - - - - - - - 446 528
Loan RepaymentsGO I4 82 96 124 1.6 184 203 168 181US-AID 18 21 22 17 14 - -
Suppliers Credits 50 _7 _ 69 _ _ 9 69 42 25142 _ 14 1.5 _ 10 _229 253 272 210 206
Total Applications 'o -4 1 1,`02 I ?'9 1 184 . 2 397 429 771 831
Annual Cash Surpluses 71 i115 709 821 479 419
Accumulated Cash Srples ' 1 i ,b65 2,486 2,965 3.384
Industrial Projects DepartmentNovember 1972

ANN_~X 3-1Pag- 1
F'CI: NA!iGAL F7VrLTZ -? ?PJWVTTME1IOAL T.3C7TePTTfltT
-XISTTG] OPTrVrIONYS AT rT'NGAL
A. Pro6action 7acilities
Ti exioting maniifacturlng f'.ci'ities of FCI's ',Zan'al Unit arloc2ted near the Bhakra Dam on the Sutlij 'i-rcr in Punjab State. roThy arnbuilt on en! area of &bout 200 hectares for the factory and 600 h-cta?sfor tha PssoriAsted townsnhip and oth'?r facilities. 7Th eyxansicr iacdiit±l.iill hn- Jocat-d ,withitn the aame facto-,r rr'a*. Th3 main plants within th?pr-^ nt fcctcrz i-ncludi: watar troztq-tnt, recti:'ier, 3ol?ctrolysis, heavywator, aioe-.ia, ritric reid, calcium aenoniru nitrate, and bFgoin.. Ct,."
'r-tcrvr fbciliti?s inclul-J tfchrrcal offices, war-hcu-sz .rckshonc, a.ctjfacLliti-'s Ex;4 a trainin7 cenrntor. rh townshin contain- zbcut, ?,'1-^-i-1hnce:; fc- cri'lcy- -? and inClUius? shorriing -r-as, sero1s iicViaS, z-.ar rtiernal nFcilitien, and f trsi->eer hcstel. rotal ?rployrn-nt .t i'&'
is about 2,ro00 p rsonnql, which is high for the existing caoarclty.
Tk- rmain contract for the fertiliz?r olnnts was ent-re?d into iIOctnhi-r 1957. 'onstz-action work bega,F ianddiate1y thnreafter and wa- co-r-oletp?i bh th .-nil o-^ 190. Testing; .nd co-snissioning began i" Dec:rnbcr1960, with tho wpter surrl1y and treatmient facilities. Th9 e1trol'nerJwe-ri- srtrt-d b,- Janu. rr l¶srul and amnenia was *'rst ro!iuc-d in :ebru.rr19161. Production of cal^cium ammonium nitrate (CAN) b-,gan by th- -r.d cfFebriary 1961. The -eavy wnter plant, for which orders were pla.-ed at-rthe main contract, was comlmissioned by Augu3t 196?.
Initially, the CANJ pror.uct h~-id a nutrient content oI' 20. : , ni-trc ' r., aimiJ.ar to amnmcnium sulfate, :.inc Nangal was the first to mnnu-f2ctur- (;M in India. The nutrient eontent was raisad tc 251 nitrob-:n 1n::Up:UFt 1967, thuo introsucing economi-. in use oi limestone, tonnage hand-l-and bc.,ging.
r:l -l-ectrolysir.r ar-. sub-nct to corrosion .nd roquir] r--icov-rhauling to ma4ntain d2sir,ed production levels. (ne adtition.L lin-cf thre- cla ruly!ers was installed in Au-ust 1966 to supplem!nt t- six-ty cletrolvsers install-d earlier ard to facilitate miintenance.
At rated cepaciry, tVlh Do-V r reqir -- m-nt of tlie prnscnt fzili ti 'i.' L{81i T-I. Th_ dra;un .re)!n the Rnakra Power station about 'NJ kmfrom "langal. Thle power ic receiveri rt the, factory's main substation at 1:4KV1 voltn,;yn throu:h three ind&uene('.nt feerir. ;ive 3' YVA transfon-crs I-creas', the .%oltaoe to 11 KV at whicrh l-;el it is ccnv':rted to dir'c, cur-rent by rpecifiers and fed to the busb..rs of the electrolysi.s plant. r -power reoylireirent of the firtilizer plants is met by th- us- of a sixt: 'n?VA transformcr, and a seventh trans3orner is used as standby. A smwll.-rtrannsformrur har been installed for thel heavy water plant.

?'!1 1.X 3-1,Da7. ? ?~
:lant, obt..in-t water Irom th- autlej 'itvrr. 'iSe xt?r rli'upstiticn has six 'tvnpz' ilst.llcd, c,%ch with thl cr:z-ity ot' .bout ll-",O0vaI c ns ),r izuriite. Abotit 280 cubic meters per minute of water is pumped
t, t.t :actOry Aite, vwKl_i'^ thio water is clarifi-d for u-,] in t onc-throuc;coolir%,, w;ter systeri. A s3.p;rate r'mlp houso hzs, be2zn inst,Iled to me?. th ,wct&r mur:.m~,nts of th'i township. The' factory water trcatmcnt facilitiesinclua-e a d.min raIizen water plant for th? el-ctrolysis, a.'ioni, atii
nitric acid plarts.
rne ammonia 2nd nitric aci.i plarts .!iclud2 facilit.-iw for th-r-.covcnry of wastp h-at cs steam. P:he nitric Pcid plant zt,:i- in
-a te heat boilers followin- amronia oxicr-tio: < U ;t un i t;Lr ViInr-SSOr o a:l' .i on t ii. -.- -- t-.
tr-m w:,st' ht at boilr,r o' th'e :,rionia rllont if !'? in -n t t
''h!ci1itiit -r~- o r.Ilv selIf-suffici rnt. in tc n- i-l c. - t- 1,
boilr!r L-: -- :'f;.l cil. i.-1. cli -1: ut'l-t -
T!he ? cec:si r^cI*i. i-:' ~~'tin;- :-i -;. . .Ii
s c_-l1 trlatmi-nt of i ?l3:'. fC' i '1-o occi i wat-r wnic-i.. th t: t:. - - -
tr-- .^:conal>,csist-'M- mrz,inlyr c l'> r]>;n/ ;tii ;v -t;t
?uo ri-b. C. rn, . . 2.
2 C P 1- 'C-t ,AL5'
-' -n ,n.i ---
'- >u.> a ... '~;r;anc, -tc ^-t''t
t4 itct. l~ e,o:sc ?l(Z
re c trc lYS i, - , ".r- 26,50(? -
56o)l_'! 25 '.ti. ris (5f.,q,-;) v6C | ',~~~~~~JIY
?i. .;'. 3
!ce ~'~.5" 'ml'' O, *.;i't .. ' ,lLnt 2oior^ ever th)e .st teny- r;, .ocli f Ac .s.-j _-:: <io i -I( tS 1'? t ? i z, rZo C'i .,
'.. jE',? rc'>i:~tic:i .. t ixt .s , ari:^bs. Thirir- thi rr.-:it~ Q c y-p;_il5'_;*iC in *9 i;-. v;4s'lbilitw ,,s h^ the c:,l.v f.;ict -r fc-a l +2
thFs s:- 10 -; .s., i.ro;: t.cn ano ow rtowr. vailcbtll±l s 1 T.;,ted' CCn'II nu-?~ in .:future-.
rt- ricin prc -u,t in1-t- t i.angnl *-7 ea'icl- n -- t(L.':), orm.- 'te' r,' cc - scT- -t^i' to give 25% nitrogen asavailable -.. tri nt. Th-. rti'-'r i- k: ^!ced Pn6 rirk-t,tct in pcj'eth .lincdl Jut- bags,: of r(0 ;:' -PC2
htomi-:.r~2->-St ; ic > ndi f fc - s-. Ft,omi --. c-
T','t f mI;.ntjti.uis e: f nxno:ii :. ~. t,ric rc± n-: g, Ma '_^--> - *'>I.CnL^ t.>-, alsol ¢r 'mz'k ^+t
C. Production Techniques
Hydrogen for amonia synthesis is produced by electrolysis ofwater. This method is seldom used today, primarily because of high powerconsumption and most ammonia plants obtain hydrogen from hydrocarbcn fuels.The Nangal design requires about 12.5 MWH/ton of ammonia, compared to1.8 MWH/ton for the Gorakhpur design, and 0.2 MWR/ton for a typical modernprocess design as will be used in the Nangal Expansion Project.
-1. Electrolysis. Electric nower for the e'ectrolysis of waterat 66 KV is stepped down with five 35 MVA transformers to 11 K7 and then fedto 21 banks of rectifiers through rectifier-transformers to obtain directcurrent. The rectifiers normally onerate at 685 volts DC and 10,000 amps.Electrolysis is carried out in 63 filter press type de Nora electrolysers,each consisting of 108 cells. The electrolyte contains 26 to 29% potassiumhydroxide. The electrolysers are arranged in a 3 stage cascade utilizingthe condensate from the 3arlier stage as feed to the subsequent stage. Thecascade provides the enriched hydrogen for processing in the heavy waterplant. The electrolysis plant produces 26,500 NM3 per hour H2 and consumeslJ9 MW of power.
2. * t---n * > I ?a.iry ,i..t !' -K1-nt f.F* ' hdroe^*' :ro' t. 5 '.
,;:':r sta- o ^ s-.t.r - ry li act±cn "0 ;'r.ct.lUticr. to r<.7.dcut'-ium '.tich is th-nr combu:t--ir th ox;en tc pro-iice hc!vJ Jr-.. Th;.bal-:roo c t dro-, lar;e dnerl-tcd of d:yterium, is u--J cr a:nirpiA
In.,,f t.-!fZ: i . W"Z I tr :L- 10o,-( wit:, tz . tlri 67 --tc , (ctleutu rilm j C-' -hydrogen (at-omic weight to two rather than one). The isotope is present inall hydrogen components including water but with a concentration of about 0.0h%.This unit wlll be phased out of production when the expansion project isoperating at capacity.

'. t T1 3 - ,L
~~~ '~~~~~ j~~ w- I.'m- ) i- rh;our' o" ' '~~c1
r 4 ~ CO ~~) r''-'yci t-) Lind c' *:
~~~~~~~~~~~~~we t(t'
iq..rr .lc.ac-LcitA.i
.1 r'v ;'i'nOI i- ?...''t. .,d:"'f T' fro1t * I.ww,rS i zI:c i. K .'r ui ; o I,{ rl' cr- i tt , 'io1 ur azi7 t;;T throu,tl tl:c unito irt rar r1 , 1 I c
I':"'t3'-'. ~''" ';;r'* *-U IIrii 1 hyf('T-TS'.' '' rnlv'.i -itf' i'l t.L', r-- r c1 (!.1t. '..-'br *. 'C to ).C)-.600 :.tr,l. 7h "vii-; m l - 'r ;U=:'1n "2C'i COmrr'.i 'r' L ;;ynt,h.' cc:nr-t. r w tnr c.st': -r o :
.";; t C r'f' 'r ~ '; Ce ; -' t ' - !' '~ ~ >e- r:-.t -'.~i ~ -(c r-t r wLt.n tiI.t ; ; i'31' v"i, in:.c2c r-ii ' .: ti ; -:. r;-|j: rJv r r;cct;s ^o :(iltfr. 'l;) _@ 'i i-.:
c -'i : t,- -i coli,r'l" t c C "trc;1 -' ' * "
. ~ .:. utr .n .t _:trro ichod air'- orri r i-
^ -"tY .4. 4 C, oc - : - tris. lit .- .:-t
'''it'. < :nfi,: Or',*it"cr): 3lc (C :'-'.1 -"- 'lt t .;C.),. - n ;:~~~~~~~~!.- .p....... tw;< ^ ;r, at .- ;,; p.}. :ri--- .,- - C8
1:' ;;' I L
{5''~ ''?, ~l-Sclumcat,rly-t at b7Ji'-- tc i, -- fl ) -
L'- isi cn.o tur-b:-u to r
' -i -. Cc;'ocit; (J ' r.-' tr'lC tr r) COr'r' tr r- *,'
!.rcauctin-'
vaci'XI ",4rUnorniu-n 'Uitrpt 4e. Li'i stcn i "cei'e-; ait . rin ri1':ay Wt 'C!-:' c"'J 2tcreri in thl Cr'4 . Tt is r-zlG ilx,-.' nL ""U-.*•25 ¶11 -i CXu..::r- anfi th--n to nirmo IC' mrvsh in Piot+c i. l - " ' 4'
rblnt. Pr-'heat-e .rmmcni;- ano nitri: a . rrc- rat;--Yeti;vmiC racti(.r. Il OUCO ! 2 J tcnThn l.i trrit .3o11i ,i 'i l' c 'I'-th '
conc-ntrat:cl to 94L6 in an ovaDozrator -. d stcr-.d :'cr use in -r- r.iucticn. Ai-ncriuwn nitrato zincl cia3h-c' 11-MVŽ3tcni ;lcns, wit,' '-cJC - lu
cr,ioniurm nitrate areo rersnulat*d in a grLnulu tln.-, Uran ,cn C'-'' -curri-nt dry"r. Th - ciri' id prod-uct is scr- 'n- -i, Cod :dtt: witLh. s.c ;-: t"bc-fora disratch to eith.r storzgI c' fcr bT iini. 2i.: u i. :i-. t.Alt 0V?* ':.I i-
-!'t-r½1l f.rom scr:-Žnin- is rec;clc-o. t41c 'Jr.rlui&to-.
:c:C Citi; - .'ari b ?en provi-.'- _'c ba'04:0 0, '§ ,-
oar' rer or andn lo: in t ':tC r;rron icr rncvir, £l t of th" 't. C'.
TNovie te ci Pr'- 7 ct2:p&:-tr-ntNovember 1972
FCI KA&CAL FERTLLIZER PROECT
YCI - IIANOGAL uwr
INOOal S?AETlMS - HIS5ORICAL(In million ftupeea)
flecal Year Itd. archb 31 1962 1963 1964 15 1966 1967 1968 1969 70 - 1971 1972
Prodetion
CAl Production (tono/year)
20.5S 11 284322 37B162 372241 337952 350499 130597 - -25.51 -- -- -- - -- 192911 3092141 318752 215293 223413
Perrent of Natod l-Capity 73 96 96 87 90 96 96 100 68 70Hevy iater Prvdtiectn (k&year) 521.9 11735 11172 8912 9126 9835 1l2D1 15816 O 870 12100
SWlonl) 45 85 w0e 100 91 100 l2b 133 219 122 123
Dncr,a (Decraee) D invmtories 9 2 (1.) 1 -- (2) - - 2 (2) (1)Costs of ooda 5old 11 17 21 19 l8 21 19 17 20 26 25
Oros Profit 1.3 70 83 82 73 77 105 116 131 Sl 97
Operat~jz. OP 1" 0, vat" ad rmntit, 5 6 7 9 10 10 11 12 13 11 14PFo. 15 20 25 26 23 32 34 33 33 23 Zs
igt and Handing -- -- -- - 1 2 1 5 b 4Tase and Iorance 1 1 3 1 1 -- -- 1 -- --Repolre aad atenaoce b. 5 5 7 7 7 10 10 110 0 12Read Officar i.e -- 1 1 1 1 1 1 1 2 1 _ 2Depreciation 19 20 21 21 21 21 22 22 22 22 22MPsn_*s iwleded in other bead (1) (2) (1) (1) (1) (1) (1) (1) (1) (1) (2)
.3 51 61 64 62 71 81 e2 oh 73 so
operetig Profit 19 22 18 11 6 24 31 1.7 21 17
other Income3) 2 1 1 1 1 1 2 2 3 9 7Other npwase
Interest 2 4 4 1 -- -- -- -- - --miscellaeous 1 1 1 1 1 2 2 2 - 3 3
3 S 5 2 1 2 2 2 -- 3 3
ust Fraoit4' (1) 15 18 17 11 5 21. 31. 50 27 21
eIr1) Net of exxise duty.2) Retroactive adjustnts for Increaasd powr rates ar allocated to the respective years.3) Including coapensation frc Hhakra Managment Board due to cower cuts (1971: R 7 ailito 1972: Rs5 million),4) Due to thie retroctive adjuetont NIot Prfts differ from the Unit's publishednot proate
I7dustrial1 Projects DepartntNovepi,er 1972
FCI EtANGAL rRrILIZEI MORCT
KANKAL UNIT WITH1Ur 2X20AMSlON
11Ca STAT1TS - FOIECA57 (I. Kllla. of 1972 Ropo.*)
Fric.l Yr Endin March 31 1973 1974 1975 1976 1977 1971 1979 198-0 199 1962 jug 94 11981182m19496
UN Production (253 b) ton/yeAr 248,000 224,000 224.000 224.000 224,000 224.000 224,000 224.000 224,000 224.00(1 224,000 224,000 224,000 224,000 224,000 224,000As of astd 1-Ccpaclty 78 70 70 70 70 70 70 70 70 70 70 70 70 70 70 70Reavy hater Pro rcttoo - 1./y7r 12,070 11.000 11,000 11,000 11,000 11,000 11,000 11,000 11,000 11.000 11,000 11,000 11,000 11,000 11,000 11,000
Sales 133 120 120 120 120 120 120 120 120 120 120 120 120 120 120 120LA.9: gxcLe Doty 16 14 14 14 14 14 14 14 14 14 14 14 14 14 14 14
117 106 106 106 106 106 106 106 106 106 106 106 106 106 106 106
Cost. of Goods SoldPAr w terLal 3 3 3 3 3 3 3 3 3 3 3 3 3 3 3 3Cons-ble Scor 4 4 4 4 4 4 4 4 4 44 Bass 13 tl 11 11 11 11 11 11 it 11 11 11 it 11 it 11
20 18 18 18 18 18 18 IS l 18 18 18 1t 18 18 18
Gres Profit 97 88 88 88 88 88 88 88 88 88 s 88 88 88 88 a8
Power 31 28 28 28 28 28 28 28 28 28 28 l8 28 28 28Saleries, Waes and 8 efits 18 18 18 18 18 18 18 18 18 18 18 16 18 18 18 18
reaight and ndllLng 5 5 5 5 5 5 5 5 5 5 5 5 5 5 5Repairs and ainteace 10 10 10 10 10 1^ 10 10 t0 10 10 10 10 10 10 10Sellng .nd Adiaisstrat" pnepe as 3 3 3 3 3 3 3 3 3 3 3 3 3 3 3 3DcprvciatLon_ 22 10 8 7 5 4 4 4 4 4 4 4 4 4 6 4
89 74 72 71 69 68 68 66 66 68 68 68 68 68 68 68
O.r-tnta Proftt 8 14 16 17 19 20 20 20 20 20 20 20 20 20 20 20+Other Ince 3 3 3 3 3 3 3 3 3 3 3 3 3 3 3 3-Other zXP.ns 2 2 2 2 2 2 2 2 2 2 2 2 2 2 2 2
Net income aefor Taxe 3 9 15 17 18 20 21 21 21 21 21 21 .21 21 21 21 21Less: Te .on lo c _ 16 13 13 13 12 12 12 12 12 12 12 12 12 12 12 12
Net Income (7) 2 4 5 5 9 9 9 9 9 9 9 9 9 9 9
1/ Sin"c p-rt of the "iltetg facllttei .11L be replaced by the e.pavoao. project, ti8.res frm FY1979 onvard sre only -ct.lool.2/ For parpos. of th f.or.c.t, 1 h.. bean se.ad that eoIeti.n N.agl c.. FSt it. poo.r at th. proo..t rat.. (.p to 60U capacity at R.22.5/il and fr- 60 ro 757 at 826.0/161d, pl. 232 *cti. d.ty).'/ Teax. .hown are _rely LudicatIve of Neogal Unit's tan obigt 8 lone if It were a apwrat CtCpany. FCI .* a 'hole is not expected to inc.r income tex liabilitie. unttiI Ff1979.
lod.strial Project. OeporteentNoveer 1972

FCI NAMAL FERTILIZER PSOJECT
tCl - IANCKL UNIlT
BALAICE SHE2 - HISTORICALItni Mqillion Nup..s)
Ficoal Tear dered Varh 31 1961 1962 1963 196 4 1965 1966 1967 1968 1969 V70 1971 1972
Current AssetsCas h) ___ ____ __ __ __
Acseirables end Adrmces 31 28 24 22 15 11 25 19 10 10 16 toInrentcri.s 23 27 26 23 27 31 30 30 31 32 32 32PAcetrubl e to Read Office 2) --- -- _- _189 2a 307 358
Total Current Asents 54 55 5O 45 42 42 55 49 230 310 355 400
Fixed Aasets
limes Fixed Assets 283 286 311 315 316 316 321 323 324 326 329 331Less: Accumnulae.d Depreciation - 21 4.1 62 83 1Ci. 126 11.7 169 191 21.2 23'.Net fixed Assets 203 265 270 253 233 212 195 176 155 135 117 97Constrmction In Progress end
Delslopment xp. 26 2 2 2 6 1 1 2 1 1 3
Total Fixed Assets 253 9272 255 235 2LY 190 10 136 llY loO
OTDAL ASMTS 337 346 32? 300 277 260 251 226 387 446 473 500
Liniities
Current LiabilitiesState Bwotf- -- -- 2 2 7 13 13 a 10 13 6 isSwdry Creditors -- 12 7 7 6 6 7 6 8 28 11 42Trae posita od Ade -- -- -- 2 4 b 2 3 1 1 2 1Other LiabUities 109 46 3 2 2 2 1 1 1 1 1 2
Thtal Cwrent Liabilities t0Y 5b 12 13 19 25 23 16 20 43 53 60
Equ ity
Inter Unit Accout/Sb.r Cypitl 228 288 310 282 247 224 221 200 218 218 218 218Rosere and Surplus -- -- -- 5 11 11 7 8 149 185 202 222
Total Equity _ 2_ 310 2__ _56 235__ 720 _ 367 403 42.O 440
TOTAL lIABILITIES 337 346 322 300 277 260 251 :26 387 b46 473 500
1) Surplus cash ti transferred to the Head Office.2) FrC FT1969 onmerds hi item represents the accumulated cash generation of the unit which ha t0ee. transsitted to th~ Head Offie; before Fy 9?69 casb surpluses had
heen shown as deduetions frvo tLk Inter-Unit Awcount.3) Froa Ffl69 onwarda Rererree aend Surplus reprse,nt all accumulated earntngs of Unit.
Indutria1 P-Jerts Departsnt
Novemober 1972

FCI: NANGAL FERTILIZER PROJECT
NANGAL UNIT
SO'RCE AND APPLICATION OF FUNDS - HISTORICAL(In Million Rupees)
Fiscal Year Ended March 31 1962 1963 1964 1965 196 6 1967 1968 1969 1970 1971 1972
Source of FundsNet Income Before Interest 1 19 22 18 11 5 24 34 50 27 21Depreciation 20 20 21 21 21 21 22 22 22 22 22
Total Sources 21 39 43 39 32 26 46 6 72 49 _43
Application of FundsFixed Assets 29 1 4 1 4 - 2 2 1 3 4Inventories Li (1) (3) li 41 (1) - 1 1 - -
Receivables (3) (L4) (2) (7) (4) 14t (6) (9) _ 6 (6)Liabilities 51 L6 (1) (6) (6) 2 5 (2) (23) (10) (7)Interest 2 4 4 1 - - - - - - -
Total Applications 82 __6 2 _7_(2) 15 1 (8) (21) (1) (9)
Annual Cash Surplus (62) (7) 4l 1;6 3L 11 45 64 93 50 52
Accumulated Cash Surplus (62) (69) (28) 18 52 63 108 172 265 315 367
Industrial Projects Departmen;November 1972
AM.1EX 3-5Page 1
FCI: NANGAL FERTILIZER PROJECTAVAILABILITY AND CCST OF POWER
a. Power Situation
E'ngal receives its power directly from the Bhakra h-droelectricplant (about 20 km away) operated by thn Bhakra Ma'rgement Poard (7:B).Currently Nangal pays Ps 22.74C W (3.0 US miis,WH):V for a design powerconsumption of 164 hW, based on a renegotiated contract with BYE datedfrom January 1971; this contract also contairs provisions for compensationto Nargal of Rs 90 per XWF4 for any shortfall in supply below 98 1MJ (60%).The contract guarantees Nangal 75% of design power (120 Y-W), but inpractice, GOI has allowed cuts below this rniniinum level for extendedperiods in the past two years. In view of the fertilizer shortage, GOIrecently asked the power authorities to release more power to langal(up to 75%) at a slightly increased price (Rs 26.O0:WNI). The origiralEangal-Bhakra power contract was negotiated in the rid-1950's, beforethe fertilizer plant was built, for a tern of 25 years. It was intendedthat Yangal would provide the base loeid for the Bhakra hydroelectricpower (and irrigation) piroject. This decision was reasonable at thattime, and it contributed to the financial success of the Rhakra project.In the 195G's and early 1C6G's power demand in the Punjab .3tate was lowand there was no adequate grid system to trans3nt Bh4kra power to otherregions. However, this surplus power situatior no longer exists andthe power now used by I.angal, in the long run, could be used elsewherein the Punjab or transritted to other power-short regions of India viathe rapidly expandinga regional grid network.
B. Power Costs and Prices in Trorthern lrdia
GCI recent,, has adopted a pricing policy for power based on a10% return on capital. BMB estimates its present charges to Nlangal(Rs 22.7A1-i) are about 1C0 below those required to yield the clesiredreturn. On the other hand, the quoted rate for power to the Nangalexpansion project is about Rs 8hMAW. The new power contract would bewith the Punjab State Electricity Board (FSEB), which bases its rates tothe new Nanga). nroject on its normn] level of charges to large industrialconsumers and its average charges for power from its different sources(Hydro- and thermo-plants). All I'argal power will come from Rhakra Dam,and the explanations for the great difference in rates charged to Yangalare (i) the concessional rate normally grarnted to electrochemical industriesand (ii) the fact that BEM rates are based mainly on production costs forits own facilities, whereas PSEPB's prices are dictated mainly by marketforces, with consideration given to the price it Ymst pay for powersupplied from different generating facilities, each with its omrn coststructure.
1/ Quoted power prices exclude 25% excise tax levied against all consumers.
A1J'sRX 3-5Page L
EMB presently is building new hydroelectric facilities upstreamfrom the Bhakra Dam as part of the Beas-Sutle4 Lizk Project. This projectwill. improve water flow (and power generation) at iihakra Reservo-ir. Thesetacilities are rnzitipurpose (powier, irriration, flood control) arid it isdifficult to allocate costs on any reasonable basis. GOI's approximate esti:mateof power production costs for the Tew hydroelectric plant is about Rs hO/AMI,including 1OD profit. This rate is about 658 above B?-'s rate present.lycharged to Nangal, and is well below &, 's marginal costs of productionl.
C. Opportunity Costs of Power in Northern India
The hydroelfctric plants presently urder construc"tion orconsideration cannot, by thermselves, meet the rapid increases expected in1,orthern India's power demard. As a result, marginal increases In derlarndcan be satisfied only bv miore expensive thermalT planlts. It Lierefore- i;thermal, not hydroelectric, productior that would be saved wy any redutt.ionin power requirements of iangal. GOI estimates indicate that the full cosl.of production for a representative therrymal plant presentl,> utdler corstrur+io(near Delhi is about 102 RsA/K4 (13.6 U8 mils/KI- ). This prcvides a bet.2.erbasis for estimating the marginal cost of nower ir. the regi(r served bythe Yorthern Tndia power grid. It does riot, however, take r.-riet. forc-"into consideration.
Public Utilities Department estinrates that ary novwcr release-Aby Nangal could be soldi in the surrounding region for about Rs 11'P1.This estim-tte concurs with figures. given to the appraisal '.nInrza. Assuning a7eragfi trannsnissi an anl(i Iistributloii 1 ,
tho in-Icated ex-nlant nri.7n woul d ;- alout Is -./? , o anowtr -or -The ex-nlant price is anonlicable to ::anga.l sincn it is joectf-;, !o .:,, :.r,ower source and transmissiotn lOsS&f!.' -ttrIbutable to it are nPp'1 "0
the economic analysis, Rs Q% .!; has been t.-Xen as the onnor .un 'tv coci -nower. This figure closely agrees with both marginal nroejuction e-, -e
iaeret conditions.
). Forecasted Power Situation for Nangal
The future power situation for !Tanga] is not so maueh 'i Puncrtionof supply as of costs. If Nangal could afford to pay the regul.r rate forindustrial consumers (Rs 8L/AWH) it could probably obtain its full. powerrequirements relatively easily; but Nangal could only pay about doubleits present rate (or about Rs 40-16 45 i), before starting to make losses,ever. with its almost fully depreciated plant. This indlicates that !!Ingalneeds highly subsidized power for its operations in both financial and(economic terms; therefore the continued use of its power intensive processfor producing anmonia is neither financially nor economically viable.The proposed expansion project based on heavy fuel oi] feedstock includesthe replacement of the anmonia sections of the existing plant, therebyreleasing about l49 M91.
Industrial Proiects Depacrtment
Movember 1972
ANNTEX
FGIt NANGAL FERTILIZER PROJECTMARKET AND MARKETING
A N N E X 4 - C O N T E N T S
4-1 Past and Present Fertilizer Situation in India
A. GeneralB. World Consumption of NitrogenC. Product Pattern for IndiaD. Consumption of Primary NutrientsE. ImportsF. Urea Pricing
i-2 Market Forecast for India
A. ForecastB. ConclusionC. Regional Consumption and Production Tables
4-3 State of Agriculture in the Nangal Marketing Area
A. GeneralB. Land Use PatternC. ClimateD. IrrigationE. Cropping PatternF. Yield TrendsG. Comparative Plant Tutrient Consumptions
4-4 The Nangal Marketing System and Environment
A. GeneralB. Fertilizer Supply and DemandC. Changes in the Fertilizer Consumption PatternD. Future Demand and SupplyE. Production and Competition in Nangal's Marketing AreaF. Transportation, Storage, Distribution and SalesH. CreditI. Marketing and Field Activities
ANNEx 4-iPage 1
FCI: VANQGAL FERTILIZER PROJECTIARKET AND MARKETING
Past and Present Situation in India
A. General
Fertilizer production is a major part of India's program tobecome self-sufficient in Agriculture. Currently about half of the requirednitrogen fertilizer is imported but steps have been taken by GOI to increasedomestic production. Nitrogen is now produced in India primarily as anmoniaand urea based on naphtha from imported petroleum feedstocks. Current planspropose increasing reliance on fuel oil and indigenous coal as raw mkaterialsfor awmonia feedstocks. Several plants have been sanctioned based on importedammonia but few such additional projects are expec.,ed. A major problem hasbeen long delays in getting plants built and operating at or near capacityand this has created large production deficits.
, .itrogen supply and demand for recent years are shown below basedon data from the Fertilizer Association of India, GOI and IDA.
Historical Production and Consumption of Fertilizer
(1,OCO tons M4)
Year Production Consumptiorn Deficit
1953 53 58 51954 53 89 361955 68 95 27
1956 77 107 301957 79 123 4h1958 81 149 68
1959 81 172 911960 8L 229 1451961 U12 212 100
1962 154 292 1381963 194 360 1661964 219 h26 207
1965 240 580 3h01966 240 530 2901967 310 660 3501968 hoo 920 520
1969 560 1190 6301970 710 2l1o 7001971 820 1560 7h0197? 1030 1850 820

fI.i:NE Is-iP.lge2
The statistics show a considlerable shortfall in proc'uction offertilizer in India during, the last 2G years. This eaused heavy inportsof nitrogerous ertilizer which in 1-'6L reached 2 record level of about.cne rillion tons of ntitroger. ProdIuction ir.prove,i sonewhat it! lateryears, with quick expansion in the latter half of the 1960's wher. someof the big fertilizer complexes, namely, r1SiC Baroda, Coromandel Fertilizers,I.S.L. Karpur, -hrirzwm Fertilizers, Kota (i division of Delhi Cloth I-TillsLtd.), FCI rrournly, Gorakhpur and !'rarvp were cor-zisoioned. eut despitethese projects, thie gaa between production and consump'tion was as snlch as7lC,COO tons of ' in 1971.
Snnhasis or. fertilizer production was given ir. t'le thirdFive Year Plan (2962 to 1966) when the role of fert.ilizer ir Attai.rinpself-sufficiency in food production w;is widely recognized. Gil tookmeasures to attract i.ndustrialists an,; financiers both witl. n ari coutsi*iethe couwntry bVy rnkirng changes in th., policy of issning lirerses for fer-t-lizer plants. These measures included greater freedor itt fertilia7erm.arketing ard prici-nr. A good response resulted, w:.-ih is reflected hitne sudden expansion of capacity of both nitroren fertilizers irf + 1
country as shwrr. ir the table.
In the last six years, nitrogen producti,on -nd consrmr ionirireased at iverage annual rates of about 2W ' ard th-* respectavely, '-;?tproduction still lags behiTnd consump-.ion. In cdditioz- to 9as -. r' -ects now built cr i der construction, low ,ro6uction levels (:.r 'ilJ'-about 55 to 63,; of capacity) in existing plants have erlar,-ed .. e
e'ici ns .
,. ..'crld oJnrarison of Fertilizer Consurmption
.. itrogen consurnptJon var-es widly ttrly ghout tthe cr-:idetencIing on nvailability of l-nd res-7urces and tr:e _r.tensit.y -f
5f s,oern ly data taken fron FAC :roduction ve-rxook for i
8'ran 'itrogen Consumntion(kg/hectare)
(Geountrv H a .-
Taiwar. 177.9Japar 13Z.L::etherlands 153.4
United Kingdom L6.5orited States 13.7Paiki.stan] r!.2
India(ranadaInijab (India)
iood grimin production, particularly high yield:ijn varieties ofr4.e and wieat is a function of .fertilizer applicatior rate anj 'ri India
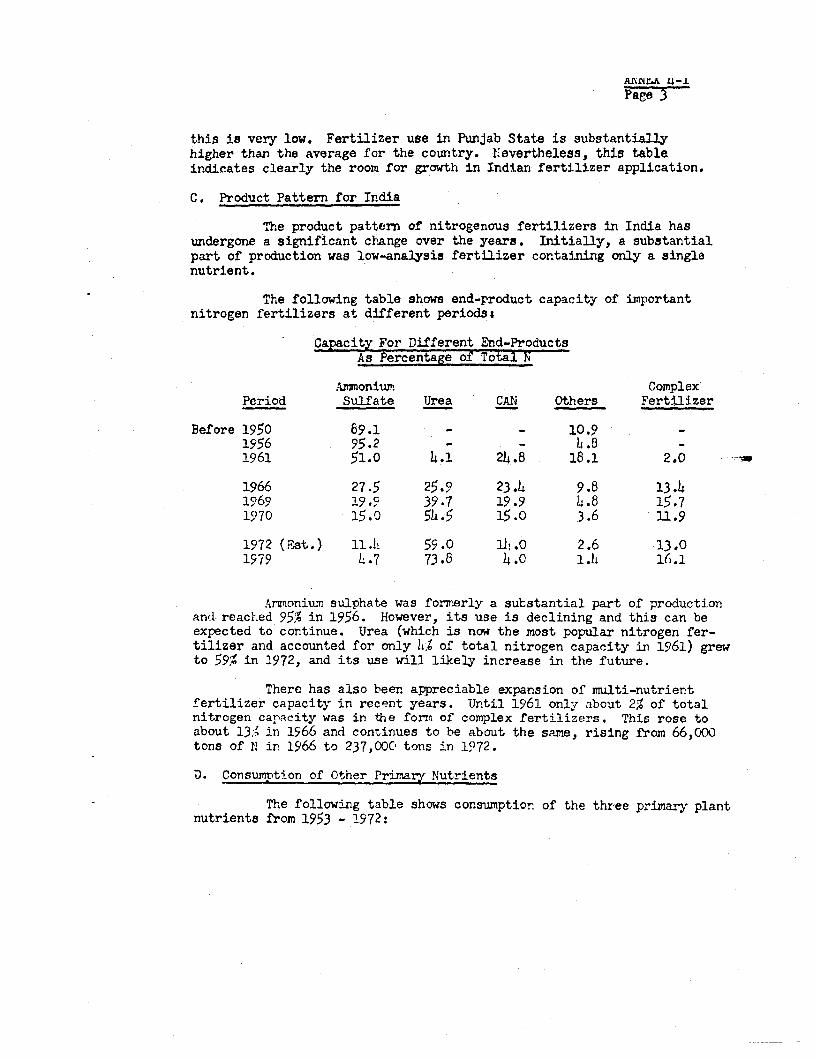
AAVNZA 4-1
Page 3
this is very low. Fertilizer use in Punjab State is substantiallyhigher than the average for the country. I.evertheless, this tableindicates clearly the room for growth in Indian fertilizer application.
C. Product Pattern for India
The product pattern of nitrogenous fertilizers in India hasundergone a significant change over the years. Initially, a substantialpart of production was low-analysis fertilizer containing only a singlenutrient.
The following table shows end-product capacity of importantnitrogen fertilizers at different periodss
Capacity For Different End-ProductsAs Percentage of Total h
Armmonium. ComplexPeriod Sulfate Urea CAN Others. Fertilizer
Before 1950 89.1 - - 10.9 _1956 95.2 - - h.8 -1961 51.0 4.1 24.8 18.1 2.0
1966 27.5 25.9 23.4 9.8 13.41969 19.9 39.7 19.9 4i.8 15.71970 15.0 5h.5 15.0 3.6 11.9
1972 (Est.} 11.h 59.0 3J!.0 2.6 13.01979 L .7 73.6 4.0 11. 16.1
Arwioniuxn sulphate was formerly a substantia'l part of productionand reacLed 95% in 1956. However, its use is declining and this can beexpected to continue. Urea (which is now the most popular nitrogen fer-tilizer and accounted for only W of total nitrogen capacity in 1961) grewto 59% in 1972, and its use will likely increase in the future.
There has also been appreciable expansion of rulti-nutrientfertilizer capacity in recent years. Until 1961 only about 2% of totalnitrogen capacity was in the form. of complex fertilizers. This rose toabout 13;' in 1966 and continues to be about the same, rising from 66,000tons of - ir 1966 to 237,000 tons in 1972.
D. Consumption of Other Primary Nutrients
The following table shows consumption of the three primary plantnutrients from 1953 - 1972:

ANNEX h-1Page i
(1,000 Tons)
Approximate N:P205:K20 Ratio*Year Nitrogen PpOg Ks O N KpO
1953 58 5 3 20 s 2 : 11956 107 13 10 10 *1.3 : 11961 212 53 29 7.5 : 2 : 1
1962 292 64 28 10 :2.3 : 11963 360 81 37 10 :2.2 : 11964 426 121 52 8 :2.3 : 1
1965 580 118 70 8 :2.1 : 11966 530 134 78 7 :1.7 : 11967 660 275 116
1968 920 300 130 7 :2.3 : 11969 1,190 389 154 7.7 2.5 : 11970 1,410 420 210 6.7 : 2 : 1
1971 1,560 462 228 6.8 : 2 : 11972 1,850 570 303 6.1 : 1.9 : 1
The above statistics show consumption of nitrogen fertilizerincreased 7-fold; that of phosphate fertilizer 9-fold, and potassiumfertilizer 8-fold during the last 10 years.
While consumption of phosphate and potassium fertilizersgrew substantially, these started from lodwer bases compared to nitro-gen, and actual tonnage increases were much less. Optimum nutrientratios are functions of specific soils, crops and other conditions.For India, advisable minimum phosphate and potash figures are generallyreflected in a h:2:1 balance. On this basis, the above table shows apast and future need for much more P205 and K20.
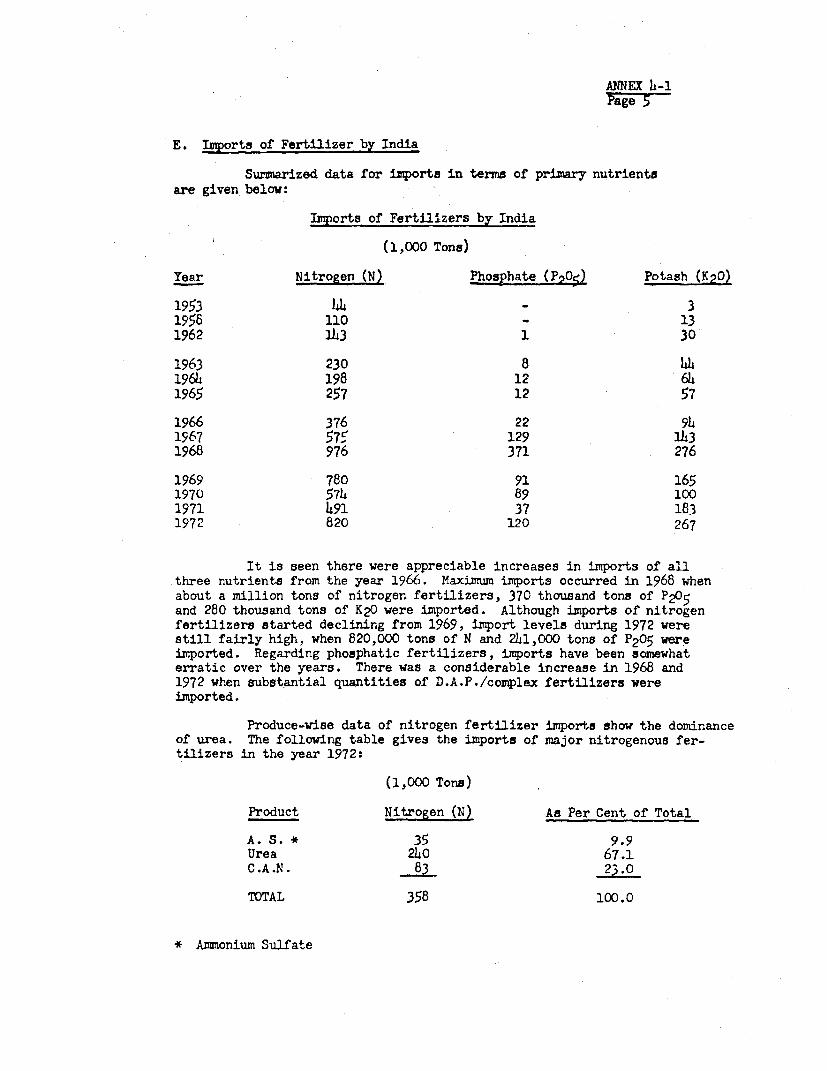
ANNEX h-1Page5
E. Ixports of Fertilizer by India
Surmarized data for irports in terms of primary nutrientsare given below:
IMorts of Fertilizers by India
(1,000 Tons)
Year Nitrogen (N) Phosphate (P9O5) Potash (K20)
1953 l; 31958 110 - 131962 1h3 1 30
1963 230 8 4h196k 198 12 641965 257 12 57
1966 376 22 941967 57c 129 1431968 976 371 276
1969 780 91 1651970 574 89 1001971 491 37 1831972 820 120 267
It is seen there were appreciable increases in imports of allthree nutrients from the year 1966. Maximum imports occurred in 1968 whenabout a million tons of nitrogen fertilizers, 370 thousand tons of P205and 280 thousand tons of K20 were imported. Although imports of nitrogenfertilizers started declining from 1969, import levels during 1972 werestill fairly high, when 820,000 tons of N and 241,000 tons of P2 05 wereimported. Regarding phosphatic fertilizers, imports have been somewhaterratic over the years. There was a considerable increase in 1968 and1972 when substantial quantities of D.A.P./complex fertilizers wereimported.
Produce-wise data of nitrogen fertilizer imports show the dominanceof urea. The following table gives the imports of major nitrogenous fer-tilizers in the year 1972:
(1,000 Tons)
Product Nitrogen (N) As Per Cent of Total
A. S. * 35 9.9Urea 240 67.1C.A.N. 83 23.0
TOTAL 358 100.0
* Ammonium Sulfate

ANNEX h,-IPage 6
A high proportion of urea in the production patternT as discussedearlUer, and in the imports shown in the above table indicates excel]entprospects for thi.s fertilizer.
F. Urea Pricing
The Goverrment Fertilizer Pool sets a ceiling price for ureasold in India. This price represents the wholesale onrice to dealers atrailhead and allows the dealer Rs8O/ton to cover his costs of distribution.The Pool sells all imported fertilizer so at present plays a large rolein rkarketing. Although there is no official duty on imported fertilizel'the pool prices are substantially higher than worl.l market.
Urea Price History in India
Consumer Price Pool i'ri;eDate Rs/Ton Rs/Ton
Dec. 1, 1961 715Jan. 1, 1964 615Feb. 1, 1966 680Apr. 1, 1967 8040 760
Apr. 19, 1968 860 7530Apr. 17, 1969* 943 86sMar. 1, 1971 923April, 1972 959**
The pool price cannot be exceeded by anyone legall;, andl thereis little incentive to sell underneath the price in most cases, due toshortage o- supply and high operating costs for urea produc_ion in Indi?.
In theory, Indian fertilizer manufacturers have freedom toestablish their own prices but for variow. reasons are unable fully todo so. For example, in addition to maximium consumer prices being setby GOI, prices need to he at levels that provide worthwhile returns todistributors and dealers. Although prices and pricing policies have notbeen finally established for E:angal urea, they will probabhl correspondito those now prevailing for sales by the Pool, e.g.,
Projected Urea Price Structure for langal(Ths Per Ton)
Ex Works Distribution 5onsumerPrice Duty Freight Margin Price
754 110 15 80 959
*- 10 excise tax became effective April 17, 1969*a The latest price reflects an excise tax increase
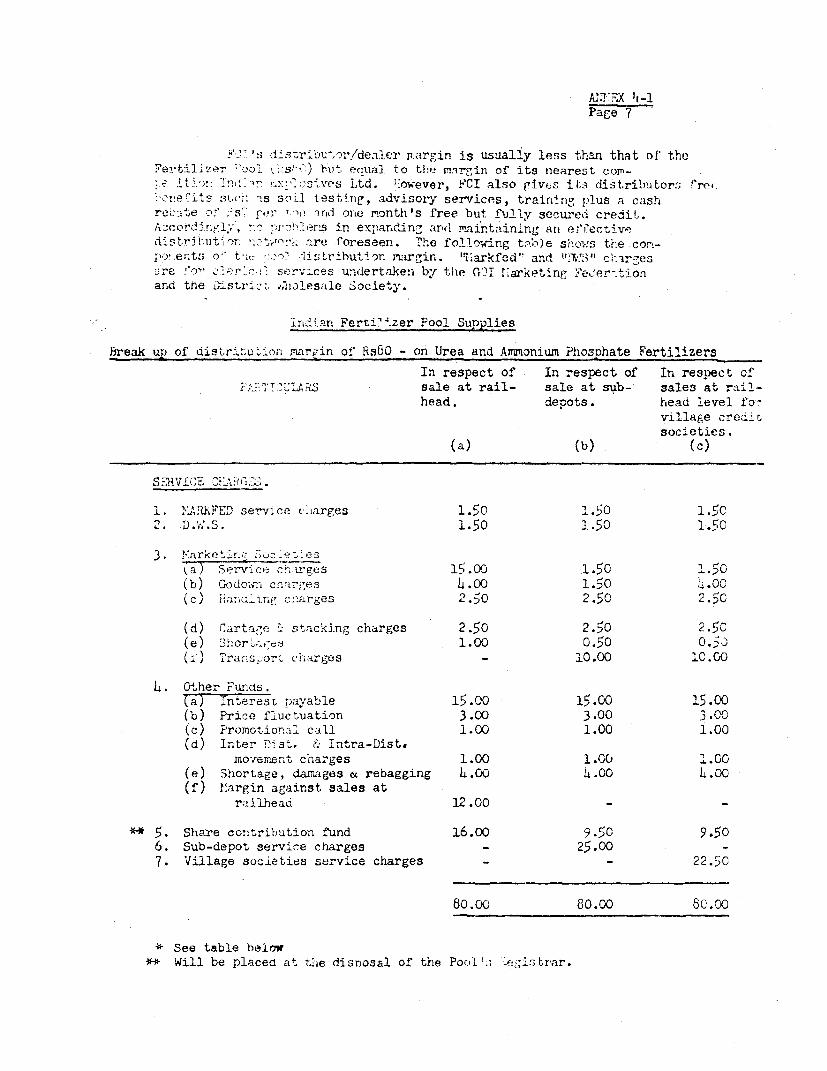
MW-P.P-*X 1l-iPage 7
F!'''' d'is;ribwor,/deaer ].argin is usually less t;han that of' thcFertil-' i,ool . s:) but. emial. to tile rinrgin of its nearest corn-e it I r - ' Vf'S Ltd. ;.Kowever, i'CI also givr3s i distributors rr(.cr e %ts s.L : -s soill testing, advisory services, trairling plus a cash
rei:x'e o ' 9 snti one r.onthIs free but fully secured credit,.AzoordJrygl;T, r^ -i11'e`Irs in exnanding am! !mir.tainlng an effectivedis tr2i ut-^ut are foreseen. Thle followi.ng tab)e shocs the com-po:!ento o-' ti. iiosLributlon . irgin. Irharkfed"' and "`1,t3' cliar.-es_re 'or' er:^.' servtces undertaken br the (,')1T Iarketting Fe,'er-. ionand the Dii.stri. .,'3loesale 3ociety.
-In4in Ferti'4.zer Pool Supplies
break u of diqt,rL'.u_-on margin of Rs60 - on Urea and Ammonium Phosphate Fertilizers
In respect of In respect of In respect cfP'.~IT;'r.''U'DA sale at rail- sale at sub- sales at rail-
head. depots. head level fo-village creditsocieties.
(a) (b) (c)
1. InR-FED service c i1arges 1.50 1,50 1.5C2. D.W.S. 1.50 1.50 1.50
3. N:rkethr. .io_ et.e3'a) Serv1ce c'- .iges 15.00 1.50 1.50(b) Godo,zi cnarges l4.00 1.50 4.00(c) Eiar.ndiir.' cv.arges 2.50 2.50 2.5C
(d) Cartage :- stacking charges 2.50 2.50 2.50(e) Shior;-,-es 1.00 0.50 0.5C(i') Trans,ort ch,rges _ 10.00 lC.CO
h. Other Funds.Ta) TnheresL navable 15.00 15.00 15.00
(b) Price fluctuation 3.00 3.00 3.O0(c) Promotional call 1.00 1.00 1.00(d) Inter Dist. & Intra-Dist.
inovexcent charges 1.00 1.00 1.00(e) Shortage, damages & rebagging 1.00 .4.00 4.00(f) I'argin against sales at
railhead 12.00 _ -
** 5. Share contribution Jund 16.00 9 .50 9.506. Sub-depot service charges 2,5.00 -7. Village societies service charges - - 22.50
80.00 80.00 80.00
* See table below** Will be placed at tiie disnosal of the PoolK ! ,;:-istrar.
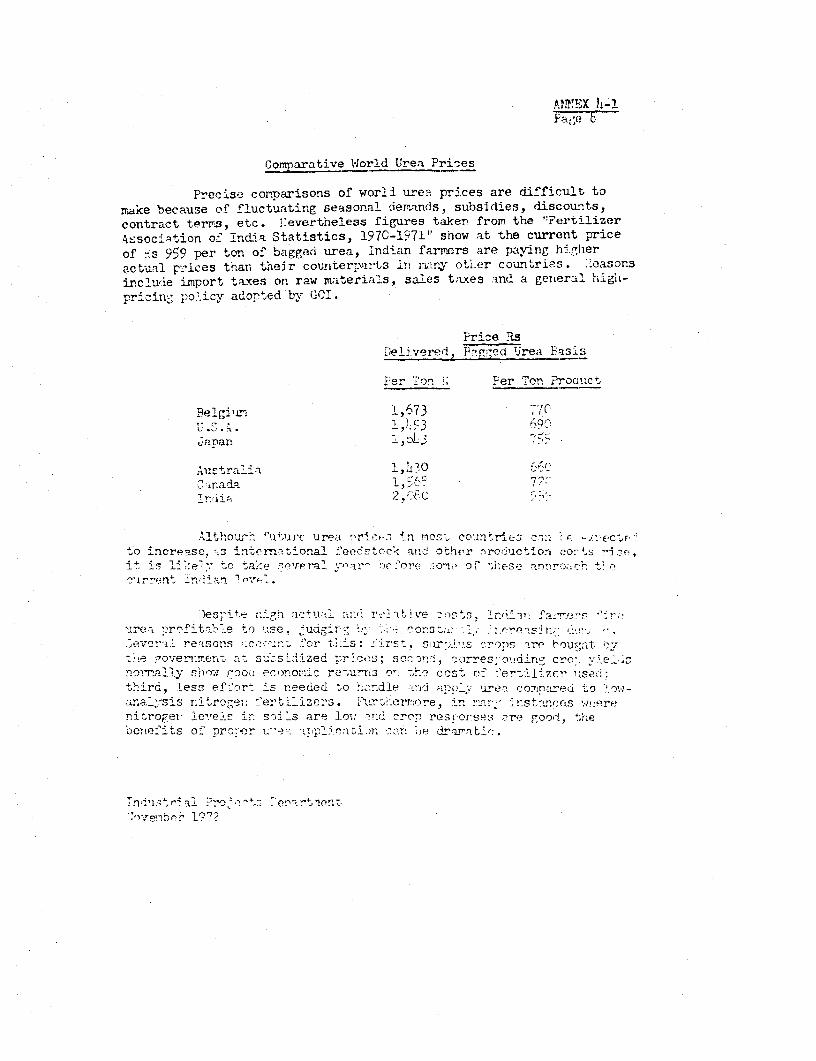
MimT}T4x 1,-1
Comparative World Urea Pri- es
Precise cornarisons of world ure3 prices are difficult tomake because of fluctuating seasonal derands, subsidies, discounts,contract terts, etc. Eevertheless figures taken from the "Fertilizer4ssociition of Indiia Statistics, 197C-l971I show at the current priceof !s 959 per ton of bagged urea, Indian farmers are paying hi.heractual p-:ices thar, their couiter parts in nrnv oti.er countries. .-easonsinclude import taxes on raw materials, sales t;Lxes and a gerieral high-pricin- policy adorted by GOI.
Prize Ts)elivered, P7Fred brea Pas s
Per Pon . Per on Prodiuct
Belgiun^a 1 ,'73 7
,anapn
Auc- trali -a -, 0C±ina-da I '
W~~~~~~~~~~~~2 Graie C "97
Althoug- 4'uturr urea ri n rior-, counreClto increase, Rs intern:ational fefdvs toc a!o other nrro3'-ction Gso ':p,it is li;e- to tak"e .- era'mar' :w :'re .O"t;' O,- hs.Ž anrroac' t-czirrent lni-r: 'n"sC
.)es;te I ngh q>^±u:J n re3¢ ~I''l, xt Ie ';stsr -r.d'Q i'a.s ____'
unrea urefita"le to use. ,ud;,ir- ' Cons;:: '. .-. 'e 1
.evcri. reasor.s for.! this: .Lrst. SL'-)2s cro's are bou i-v;e governirer as s2;sidized crrcos; soc rie, corres-o'd:rt cro. e norrally sb'-w; roo'- eco.orio.z re,urr.3 o- -h.2 cost *!' ',f'tliZr u.sent'-hird, less efL'or- is needed .o 'h..clndle - i a.; urea cosInaei to low-
naly-sis r.it-erog ferti-1izers. ?ur;errmo-e, in pn- r.stanccs wueren±;roreV Ie''eis ir. s--`s are loi 2r.d crc-; resr,orsps ,re goodj, thlebenefits of proper - '-e. arl.r'iman bdte;,.
To ilstci r' R "oj0' 5~~'~ leca ^'t 'ie

.. LKX 4-2Pa.
.'.I: A;"rA' /L ik'.: ILJTU :-' 21t'tl,
Market Forecast for IndiaA. Forecast
Cc-rnsuurrk,-n of f2rtilizors ir India, as prcvicuslv revi-w;-zl, 1n2s' ri-s ,vt -tend o-no thq ypar!. owevcwr, in rclrtion to tar,ret.3, acKiier?
mntrns hav, 1an- -d. As paSt tr-nds have b-nn sonewhat irr ilear, avera¢' annw'1'r-wth ?:trs i-riv-;3 fron hi<-tnri'a1 tdata can-iot be u->d to predict futu.e
ccnsurrtior nrr2c'4yly. pemral .ttertnts have been made by v2rious a:onri'sto opti.matp future fertiliz-rs n.eedr' in India for the year 1974. SomIe ofthese are:
3timat'G-'- oF rt ' t-,r Con uniot_c:sn 1 I I(1,,000 tJrnF)
.! J, PhorThDhatxv
1< n _u.ii:o,3n s n, 1971 3,20 `,w,r''in_st-,; c Ar?ricult,:r- (WT),L 1971 3t1,287
12 LI, 1972 ,/$) 1,C09Fertilizer Association of India, 1971 2,1n0
(FAr )2/It is .-.e-i. tue nitroc-n eStiFi?nt-S Cf the Pla in ol ouiission :-ro
- r IF t,hi- of th. I'-i`nstrv 0o i.-_irultu ' a I.-zfic:t ' i a!r-.\i.qt-t a-;r:m.;.net sithi eac.r. other-. Tl e- f+ .'kI, r&rtitn.L1pr-Ly 'o-r 2°5
V lrr con(Dl rvati- n ,'verr.- o' thco fTur -ii','-nt 25t rat.-ts ;1V':32.69niil1i_,:- tons of nitr,-n ani 1.?0 rdillion tons of P20< .,n 19714. Tri^ is
c- .-l:- to tle Ban4k figure of 2.65 million tons of nitro;w-n.
-. >a.?rdi. sr^ ;t) b-^U. QX.t.'Ert' 0 ;t:. >.. ciP-- includRin,:t Plannine' rOrmlssion, namke ar, assunptir; cof 15 annual growth. 73asdl on thi-siigure, an(i alternptixl'y a more con.rservative rate of growth of' 10,; annuO ly,estimat - for ' and P2 0q consumption -iirrinc, 1975 to 1979) would be-
1,oo0 ton-)
7itro ogn P 2 0r,
'!,.n r 15% 10% 156 10%
1974 2,755 2,7¢5 1,20( 1,2041975 3,1683 3,030 1,1 MI 1,321h1576 3, 64 3 3,333 1,591 1, 456
12)77 L,13S 3,666 1,330 1,6021973 l,037 3,033 2,I0> 1,762IP79 5?,540 1,,1435 2,!1 '0 -1,98
1/ i)e ai-id .t the ZonLl 1,or.nhr'nc hcid in:; ,temhnir, l971.
2/ The major fertilizer industry trade association in Indla.,

kNEX 4-2Page 2
The nitrogen projections based on 10% annual increases agreeclosely with the totals shown in the Regional Demand table in this Annex,and which were derived by the Bank separately.
The attached Bank forecasts of Indian nitrogen fertilizer con-sumption and production are summarized below and show a continued deficitthroughout the 1972 to 1979 period, which wil'l have to be met by imports:
Nitrogent Consumption - Production Forecast for India 1972 to 1979(1,000 tons N)
Year Consumption Production Deficit
1973 2300 1410 8?01974 2650 1740 910
1975 2960 2090 8701976 3320 2465 8551977 3720 3230 490
1978 160 3670 4901979 4600 3920 630
B. Conclusion
Historical data on production, consumption anu imrorts of fer-tilizers i.ndicate large previous shortages. Estimates of futuredemand and supply point to continued production deficits in the fores'-abl-future, although on a smaller scale. This is true for both nitrogen andphosphates, even if all the plants currently under construction an,l thoseunder consideration are completed according to schedule and produce atnear-capacity levels. This deficit plus continued problems in purchasingimported material will make it difficult to continue tha tempo of the "greenrevolution" and ensure an adequacy of food in future years unless the pro-duction of fertilizers is still further increased. Therefore, the pronoseuNangal expansion project should be assured of a total off-take for manyyears, and is also well justified economically.
Industrial Projects DepartmentNovember 1972

C. Regional Foreca3t of Nitrogen Demand in India('000 metric tons of N)
Fiscal Year (Ending March 31) 1969" 1970 1971 1972" 1973 1974 1975 1976 1977 1978 1979 Grovth Rate…- _ _ _ _ _ . _ _ 1974-79
North IndiaPunjab 134 147 175 214 253 312 336 364 391 422 456 8%Haryana (and Delhi) 45 47 64 78 94 116 128 144 159 176 198 1i.5%HimachAl Pradesh 4 3 3 3 4 5 6 8 10 13 16 26 %Jamzu & Kashmir 5 3 3 4 6 8 10 12 14 17 21 21 %Rajasthan 23 31 41 51 63 79 90 102 116 132 149
Total i u- & f 5 55 3r5 m W 5 T 1
East Indiay 334 458 482 510 650 750 850 950 1080 1210 1360 12.8%
South IndiaW 446 527 523 630 750 900 1000 1120 1250 1390 1550 11.5%
West India' 201 191 269 320 390 460 520 590 670 750 850 12.8%
AU India 1190 1410 1560 1,50 2300 2650 2960 3320 3720 4160 4600 11.7%
17 1969-71 data baset on GOt historical data7/ 1972-79 data based on mean projections of D. D. Erown (report dated May 1971)7/ Includes Bihar, Asaam, West Ben6al, Uttar Pradesh, Orrisa, TEA Boardlf Include kndra Pradesh, Myaore, Kerala, Tamil Nadu,GOa, Pondicherry,Coffee Board
Includes Gujarvt, Madhya Pradesh, Xaharashtra
Industreal Projects DepartmentNovwember 1972
SV
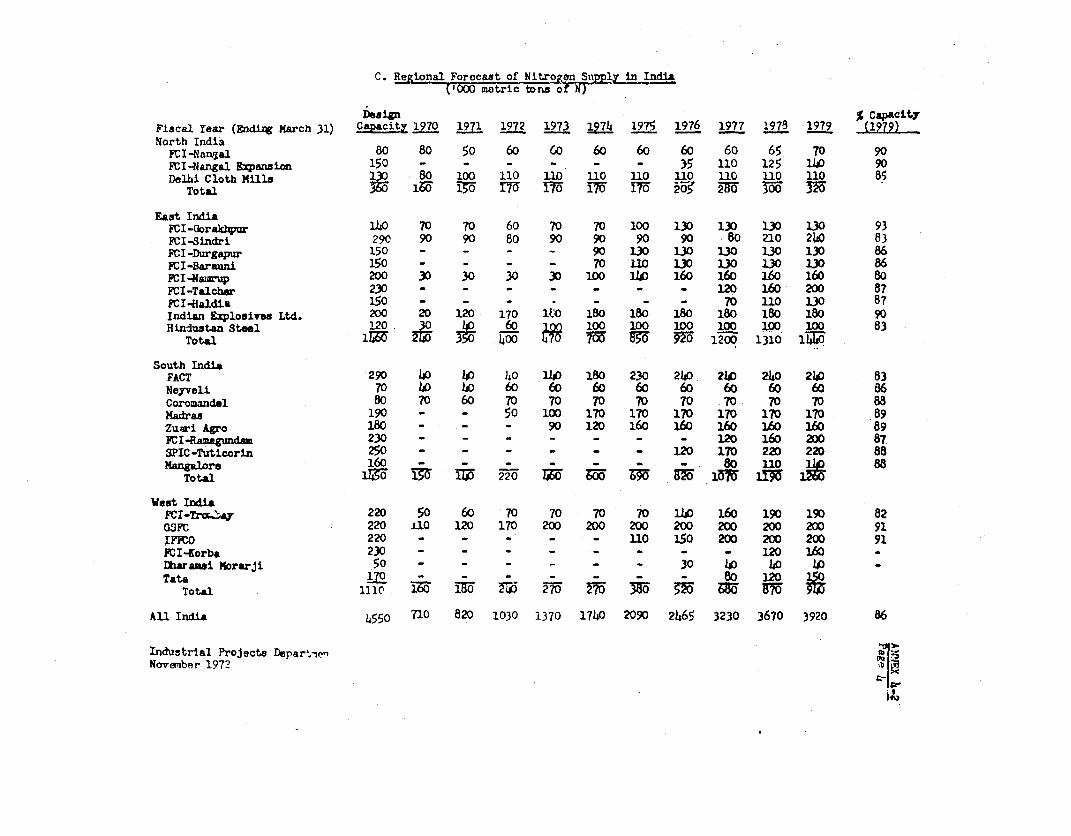
C. Regional Forecast of -Nitro e ply in India('000 motric tDns o
Design % CapacitY
Fiscal Year (Endirg March 31) Capacity 1970 1971 1972 1973 1974 1975 1976 1977 1978 1979 (1979)
North IndianIParngal 80 80 50 60 60 60 60 60 60 65 70 90
FrI-Nangal El,ansLon 150 1 _ _ _ - - 3'5 110 125 140 90
Delhi Cloth Mills 130 80 150 110 LD 110 n 110 110 110 110 85
Total 36 1 0 m i76 IFF M5 2 2M O X
East IndiaFCI-Gorakbpur Ih0 70 70 60 70 70 100 130 130 130 130 93
FCI-Sindri 290 90 90 80 90 90 90 90 80 210 240 83
FCI-Durgapur 150 - - - - 90 13 13 30 13 130 86
FCI-Barauni 150 - - - - 70 110 130 1.30 10 130 86
FCI-iamrup 200 30 30 30 30 100 140 160 160 160 160 80
FCI-Talcher 230 _ _ _ _ _ _ _ 120 160 200 8?
FCI-Haldia 150 - - - - 70 110 130 87
Indian Explosives Ltd. 200 20 120 170 Ito 180 180 180 180 180 180 90
Hinduatan Steel 120 4 60 lo 100 100 100 100 1 100 83
Total 1lig g X 400 M 5IW F- W 17200 1310 1;i;
South IndiaFACT 290 40 I4 40 14O 180 230 240 240 2140 240 83
Neyveli 70 40 40 60 60 60 60 60 60 60 60 86
Coromandel 80 70 60 70 70 70 70 70 70 70 70 88
Madras 190 - - 50 100 170 170 170 170 170 170 89
Zuwri Agro 180 - - - 90 120 160 160 160 160 160 89FCI-Ram.gund 230 - - - - - - 120 160 200 87
SPIC-Tuticorin 250 - _- - 120 170 220 220 88
Mangalore 160 l 80 1 L88
Total 1i3 0 S T 220 1 1 Li
West TndiaFf:I-Tr"~q 220 50 60 70 70 70 0o 114 160 190 190 82
GSFV 220 10O 120 170 200 200 200 200 200 200 200 91
IP^0 220 _- - - - 110 150 200 200 200 91
FCI-Korba 230 - - - - - - - 120 0 -
hara=ui Morarji 50 - - - - - 30 40 40 41°
Tata MO - _ _ _ - 80 120 Total 1110 g - 270iu 7 S 6i m 8 7U
All India 4550 70 820 1030 1370 1740 2090 2465 3230 3670 3920 86
Industrial ProJects Depar-,-ienNoemnber 1972 5Jft
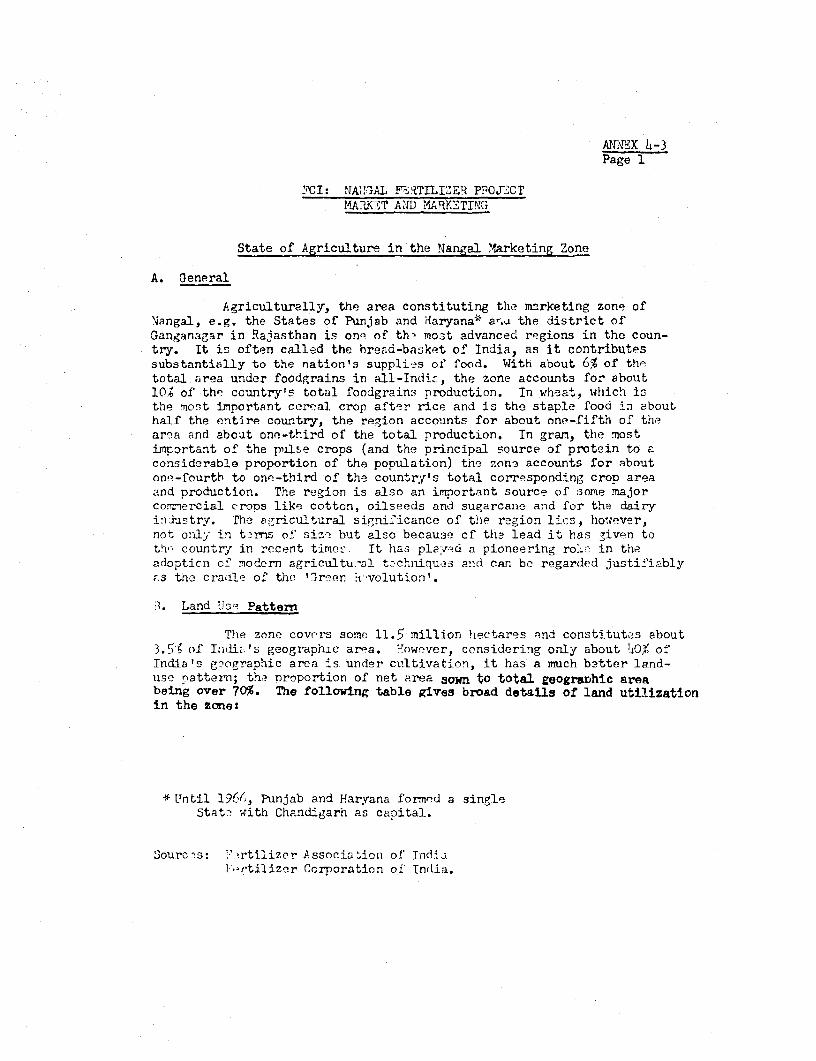
ANŽf*x 4-3Page .
7CI: 'IA.!AL F'iTILIZER PPOJ3CT1MARK7T A'{D MARKETIN'
State of Agriculture in the Nangal Marketing Zone
A. ueneral
Agriculturally, the area constituting the mrrketing zone ofNangal, e.g. the States of Punjab and Haryana* a'.u the district ofGanganagar in Rajasthan is one of th- most advanced regions in the coun-try. It is often called the bread-basket of India, as it contributessubstantially to the nation's supplies of food. With about 6% of thetotal area under foodgrains in all-Indi., the zone accounts for about1O0 of the country's total foodgrains production. In wheat, which isthe most imnportant cereal crop after rice and is the staple food in abouthalf the entire country, the region accounts for about one-fifth of thearea and about one-third of the total production. In gram, the mostimrortant of the pulse crops (and the principal source of protein to aconsiderable proportion of the population) tne zone accounts for aboutone-fourth to one-third of the country's total corresponding croD areaand production. The region is also an important source of some majorcormercial crops like cotton, oilseeds and sugarcane and for the dairyiniustry. The agricultural significance of the region lis, however,not onlj in tŽrrs of size but also because cf the lead it has given totV' country in recent time: It has plpyvid a pioneering role in theadopticn of modern agricultu.-al t-chniqu.s and can be regarded justi4iably.s the craole of the '3reen :xvolution'.
1. Land 11so Pattern
The zone covers some 11.5 million heetares and constitutes about3.54 of India's geographic ar-a. lowever, considering only about 140a ofIndia's geographic area is under cLltivation, it has a much better land-use pattern; the nroportion of net area sown to total geogrx)hic aresbeing over 70%. The following table gives broad details of land utilizationin the zone:
* Until 196(;, Punjab and Har,yana formed a singleState with Chandigarh as capital.
Sourc?s: ?,rtilizer Associa ion of Indialortilizer Corporation of India.

ANNEX 4Fkage 2
N!ngal Marketing AreaLand Utilization, 1967
(1,000 Hectares)
Particulars Punjab Haryana Ganganagar* Total
1. Geographic area 5037 44o6 2070 115132. Reporting area (for land
utilization) 5025 4399 2064 114883. Forests 78 91 3 172
4. Land not available forcultivation 641 469 88 ±i18
5. Other cultivated land(excluding fallow land) 16 !1 2 59
6. Cultivable waste 15B 96 513 7,
7. Fallow land (mainly currentfallows) 262 259 366 e 7'7
8. Net sown area 3670 3423 1092 8e3609. ifroportion cf net sown area
to geographical area 77 78D 53t 7 3
10. Area sown more than once 1301 1176 47 2-L2a11.. Total cropped area 5171 .4599 11339 1D&9
-curce: Data published by the State Governments.
r+t.2s to l%'\oA.
Cropp_d area represents about 7,T of the Indian total. However, intensityof cronning is substantially higher than f-)r thc ~cuntr-y as a whul-c, bcin-i, aboul,1.30 compared to 1.14 and reflecting better utilizlation of th-. 1.-l .:v-,t-Ji ,farnming. The table shno;,i about one-third of tht n t cultivated ar2-a in tb.:r^-.ion is sovm more than once, against only about 1l' for all-Iind .
C. Clizmate
The zone lies in the suo-tropical belt and th2 climate is lar':. 1ydetrnin,d by the long distance from the iBay of 3engal on th.- one hacr .. n-'proximity to the Raiaputana deserts on the othpr. Most of the zone li-'i inthe low-rainfall region with less than 75 cm of annual Pain. Is on- anproachf'-south and westward, rainfall decreases, with Ganganagar diiFtrict rc:LvineonJly about 26 cm. Only four out of lJQ dintricts covered in th} rngion ii..v,r-ninfall exceeding 75 cm. Thus, the rainfall is g3nerally d-fici nt r cron..sMost of the precipitation occurs between July anm 3-?ptirfhr, with -n Ii.itshowe,rs in Decer.ber and January, whicn are crucial for the spring harrr:st.
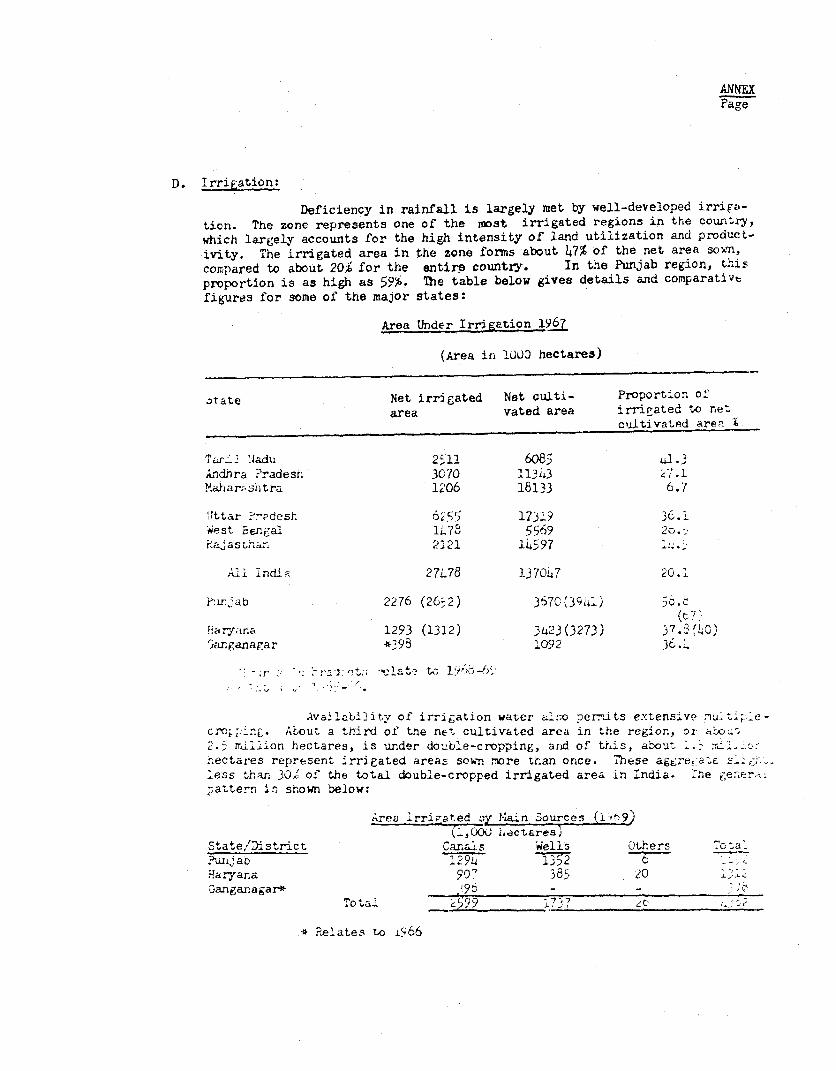
ANNEXPage
D. Irrigation:
Deficiency in rainfall is largely met by well-developed irriga-tion. The zone represents one of the most irrigated regions in the country,which largely accounts for the high intensity of land utilization and product-ivity. The irrigated area in the zone fonns about 47% of the net area sovn,compared to about 20 for the entire country. In the Punjab region, thisproportion is as high as 596. The table below gives details and comparativtfigures for some of the major states:
Area Under IrrIgation 1967
(Area in 100) hectares)
3tate Net irrigated Net culti- Proportion ofarea vated area irrirated to net
cultivatpd area X
T,AxJ I 'adu 2;11 6085 *1.3Andhra ?radesri 3C70 11343 2Ž71.1Mahar,shtra 1206 18133 6.7
Uttar ?-Pdesh 6$5 17319 36.iest Benigal 1L7 5569 2c .56sa-jas Lhar 2121 1-597 14
Ail India 27L78 137047 20.1
.~ui_jab 2276 (26F2) 367C(3c, ,) (t-7'
Haryana 1293 (1312) 3423(3213) 37. .C)rJanganagar *398 1092 36.'
Availability of irrigation water also pexr-its extensive .u1t-p1e-crox;:nE. About a trird of the net cultivated area in the regior., or i.2.,5 miliion hectares, is under double-cropping, and of this, abou, 1.5 .Lo_hectares represent Irrigated areas sown rore tr.an once. These aggre&-atc s -j.
less thanr 3O,u of the total double-cropped irrigated area in India. The Fen.et-ap;attern ir, shown below:
Area Irrigated Oxy Main Sources (Wf69)(1,00c ziectares,
State/District Canals Wells Others o a-1-4;>z.,ao lc~~~~i294 132 t ,
Haryar.a 9Q7 385 20aanganagar* ___________ _ _ _ _ _ _ _ _
Tota.l Ž99 12?,
* Relates to i966
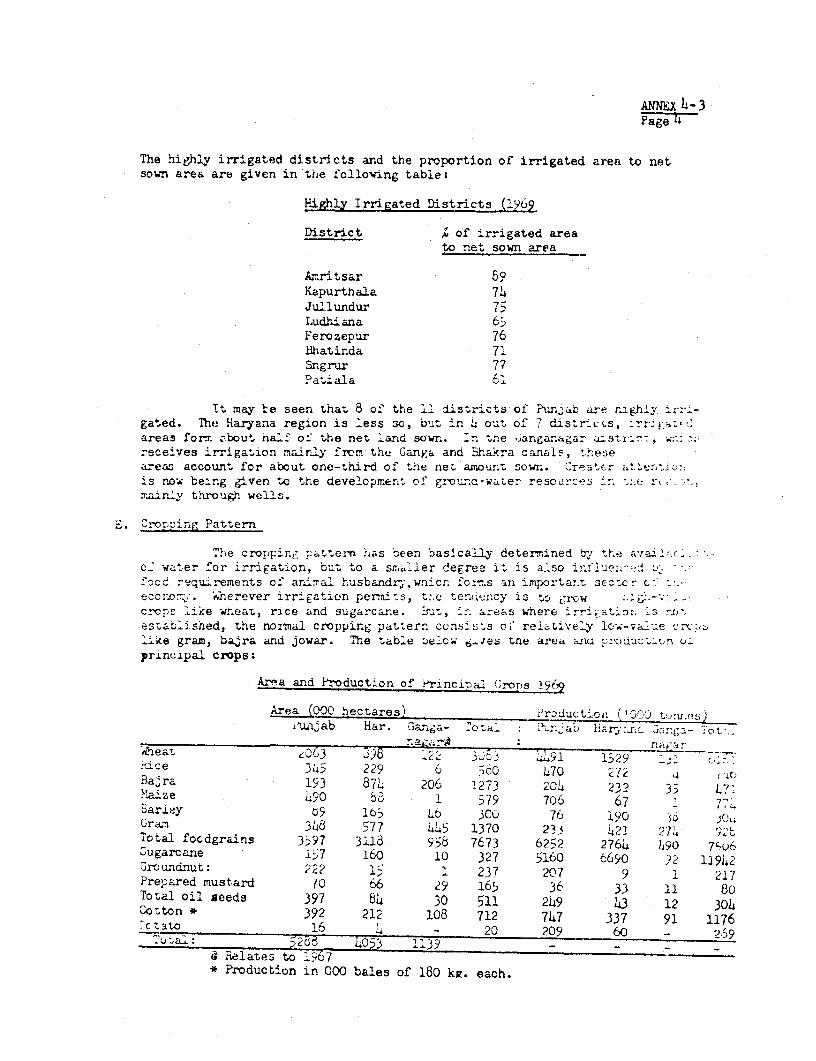
ANNEX -3Page 4
The highly irrigated districts and the proportion of irrigated area to netsown area are given in the following table;
Hlghly Irrigated Districts (1969
District A of irrigated areato net sown area
A-.itsar °9Kapurthala 7Jullundur 75Ludhiana eiFerozepur 76Bhatinda 71Sngrur 77Patiala 6'
Tt may te seen that 8 of the 1' distr-icts of PNx4ab a-e r.ighly ; -gated. The Haryana region is 'ess 30, but in 4 out of 7 distr-icts, rr4atFdareas form, aboul nalf of the net land sowr.. _r tne 6anganagar- Uitr_., .. ;receives irrigation mairly frcn the Ganga and Bhakra cana1F, theseareas account for about one-third of the net amr.ount sown. Greator at r.tic:.is now be:.ng given to the developm.ent of grounu-water resources .e r. ,mainly through wells.
E. Croniuing Pattern
The cro,,pin prattern has been basically determined by the avaic2 water for irrigation, but to a smailer degree it is also iru'luea-:-d . -food requLrements o: ari-al husbandr;. wnich fcrms an i.mpcrtar.t sec^cr c .-ecor-S.o~. xnerever irrigation permits, tr.e tendency is to gv 2:i-crc7lc like wneat, rice and sugarcane. z i, areas where irriiat.o:, -.s r0-.esLab.lshed, the normal cropping pattern cons s-s o: reiatively low-va.e c .'ike gram, baJra and jowar. The tab,e :e1cw 6 zes tne area aria p;ouction .
principal crops:
A-ea and Production of Princioal ,roT)s 196
Area (000 hectares) P'rDduction 1t0c; t :a's)Axu ab Har. Ganga- Io;a. : i.aJ tiar2 ac I 3-ga- :ot..
_ra_a L ._ nA'oZneatr. c3 e 122 33 3 4.L91 1529 2.ice 345 229 6 510 L70 27a 43a-ra 193 874 206 1273 2014 2'2 3, L?:aize 190 53 579 70)6 67 7,4Barley d9 103 L6 3CC 76 190 30aJran 348 577 "5 1370 233 421 271Total focdgrains 3?97 3118 958 7673 6252 2764 h90 h7u6Cugarcane iL,7 160 10 327 5160 6690 ?2 11942Groundnut: 222 1, 1 237 207 9 1 217Prepared mustard 70 66 29 165 36 33 11 80Total oil seeds 397 84 30 511 249 43 12 304Cotton * 392 212 108 712 747 337 91 1176* otato 16 4 - 20 209 60 - 959
5208 15 39 - -3 -
4 Relates to 1967* Production in 000 bales of 180 kg. each.

ANNEX 4-3Page 7-
Wheat is by far the most importanw crop of the region, and in PunJab,accounts for about 30% of the total area cropped. In H&.yana the
proportion is about 22%. As mentioned earlier, the region accounts for aboutone-fifth of the total area sown to wheat in the country and about one-third ofIndian production. The proportions are almost the same for gram, althoughthis accounts for only about 7% of the cropped area in Punjab and 14% inElaryana. About 75% of the total cropped area of the region is devoted tofoodgrains. The region's share ln the production of cotton is also substantial.The relative shares of major crops may be seen belowt
Relative Share of ths l)_on in Princiial Crops1.67 to 196
Percentage share of the area toCrop All India
Area Production1. Wheat 19 312. Rice 2 23. Barley 11 124. Bajra 9 135. Gram 20 266. Foodgrains 6 107. Oilseeds 4 58. Cotton 8 229. Sugarcane 13 10
A significant shift in the cropping pattern of the regio0n nas beenevident in recent years, with high-value crops replacing coarse grains, partL_as a result of irrigation development and partly due AD increasing commerciali-sation of agriculture.
The greater incentive to use purchased inputs like fertilizers,with corresoonding better returns on farm investment, has also hastened this
process. The tanTh below oives some sivnificant trends.
Shifts in Croppin_ Patterns 1951 to 1969*
(Area in .,000 hectares)
Crop 1951 1969
Rice 195 5714Haize 285 578Wheat 1499 2961Sugarcane 147 317Groundnut L0 237Cotton 279 604Ba,ra 1L2' 1067Gram 1737 925
* Xelates to iun4ab and Haryana only.
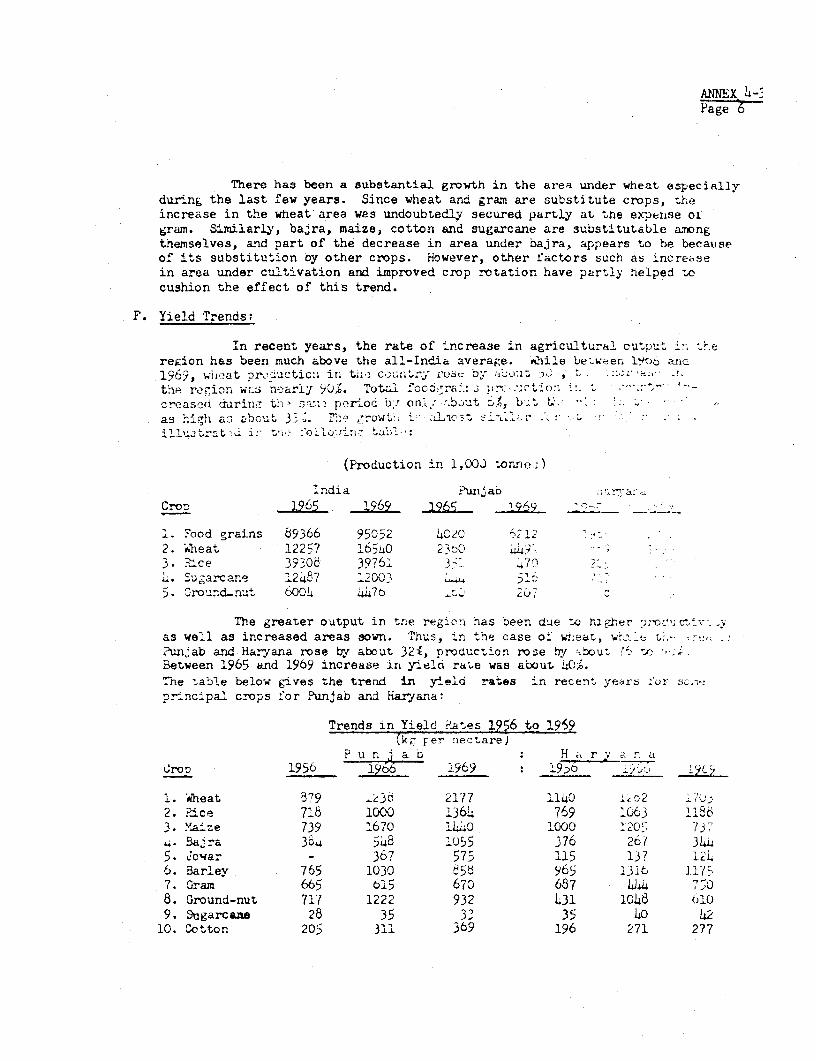
ANINEX 4-'Page o
There has been a substantial growth in the area under wheat especiallydur ng the last few years. Since wheat and gram are substitute crops, theincrease in the wheat area was undoubtedly secured partly at the expense olgram. Similarly, bajra, maize, cotton and sugarcane are substitutable amongthemselves, and part of the decrease in area under bajra, appears to be becauseof its substitution by other c.ops. However, other factors such as increasein area under cultivation and improved crop rotation have partly helped tocushion the effect of this trend.
F. Yield Trends-
in recent years, the rate of increase in agricultural oatput i erewion has been much above the all-India average. ocile be;weer 19 anc
1562, whi?at prcduticut icn it. coUnllry rus,= by lu , 2.. .the roFion wns n-.arly 90,4. 'otal pcrc -a-: pc.- utio- t . .--crease,( durin.r t''. .. period b;. ortlj ,b,-t £, b 't '-as high as .bout 33 . r e ,-owv i C ; d.'l3 tr .; ,
-liu_ .tat ir t.,- fo Lj:in~ tj :
(Production in l,OOJ tonne;)
India .?una:abCron I965 1969 1965 i969
. Food grains 89366 95052 4C ? -212O2. Wheat 12257 16 5u0 2 T-3. Rce 39308 3976370 K
u. ugarcane _12457 ,20C. 53i. ;round nut 004h 4776
The greater output in tne region has been due o hithger o -
as well as increased areas sown. 'hus, in the case of wieat, wre t;.unJab and Hazyana rose by about 32i, proauction rose by Tbout " , A.Between 1965 and 1969 increase in yriel rate was about 4(8,e
The table below gives the trend in yield rates in recent years :jr fOp.rncipal crops for ?unjab and Haryana-
Trends in Yield ?ates 1956 to 1969(kg- Fer nectare)
u n 4 a u H n atron 1956 liob 1969 :6_ ,
1. Wheat 579 1.36 2177 1140 eo2 1U2. ?ice 7'8 1000 1364 769 1063 11863. Ma-ze 739 1670 1JU0 1000 '20 7374. SaJra 364 548 U55 376 26/ 3415. jowar - 367 575 115 13? 1246. Barley 765 1030 858 965 13i6 117l
7. Gram 665 615 670 687 h144 750
8. Ground-nut 717 1222 932 431 1048 6` 109. Sigarcaae 28 35 32 35 40 4210. Cotton 205 311 369 196 271 277

ANNEX 4-3Page 7
Present yields in the region are generally higher than thoae inthe rest of the country, as seen in the tabIs below:
Comparative Yields of Principal CrOps 1969(Kg/na)
Other MajorPunjab Haryana Producing States All India
1. 'Wheat 2177 1703 1162 (U.P.) 11692. Rice 1364 1188 646 " 10763. Bajra 1055 344 3554. Gran 670 750 688 " 607
5. Cotton 343 277 160 (Gujarat) 1236. Groundnut 926 597 4i8 " 631
Increase in yield rates during recent years largely reflect a progres-sive improvement In cultivation methods used in the region, such as irriga-tion and cropping intensity, fertilizer consumption, use of high yielding seeds,farm mechanization etc. Since irrigation alone makes a substantial differencein yield rates, the proportion of gross irrigated area to total cropped areawas increased from about 59% in 1965 in Punjab to 72% in 1969, and from 36%to 46% in Haryana.
The proportion of double-cropped area to net sown area has also beenrising at a rate higher than the average for India. Use of high-yieldingvarieties of seeds, which provided tne primary impulse for growth in farm pro-ductivity in recent years, has spread fairly rapidly, and tne area unaer nign-yielding varieties in 1969-70 formed about 19% of the total area under suchvarieties in the country. The table below pives the area under high-yieldingvarieties:
Coverage under H.Y.V.P. 1970 (1,000 hectares): Punjab H 1aryana
Crop Area under : Total area : area und'p: Total area: HYVP : under irri- HYVP under irri-
gation : : gation.
oiheat 1400 1661 440 666Rice 60 301 20 177Bajra 100 102 130 47Maize 48 363 12 29
Source: Fertilizer statistics 1970; FAI.
For wheat and bajra a large proportion of the irrigated area isalready devoted to high-yielding varieties. For rice, however, the proportionis relatively small, mainly because of strong consumer preferences, &rd the higherreturns from traditional varieties experienced so far. (In the evolution of fertilizerresponsive, disease-resistant, high-yielding varieties,wheat has given betterresults than rice to date.
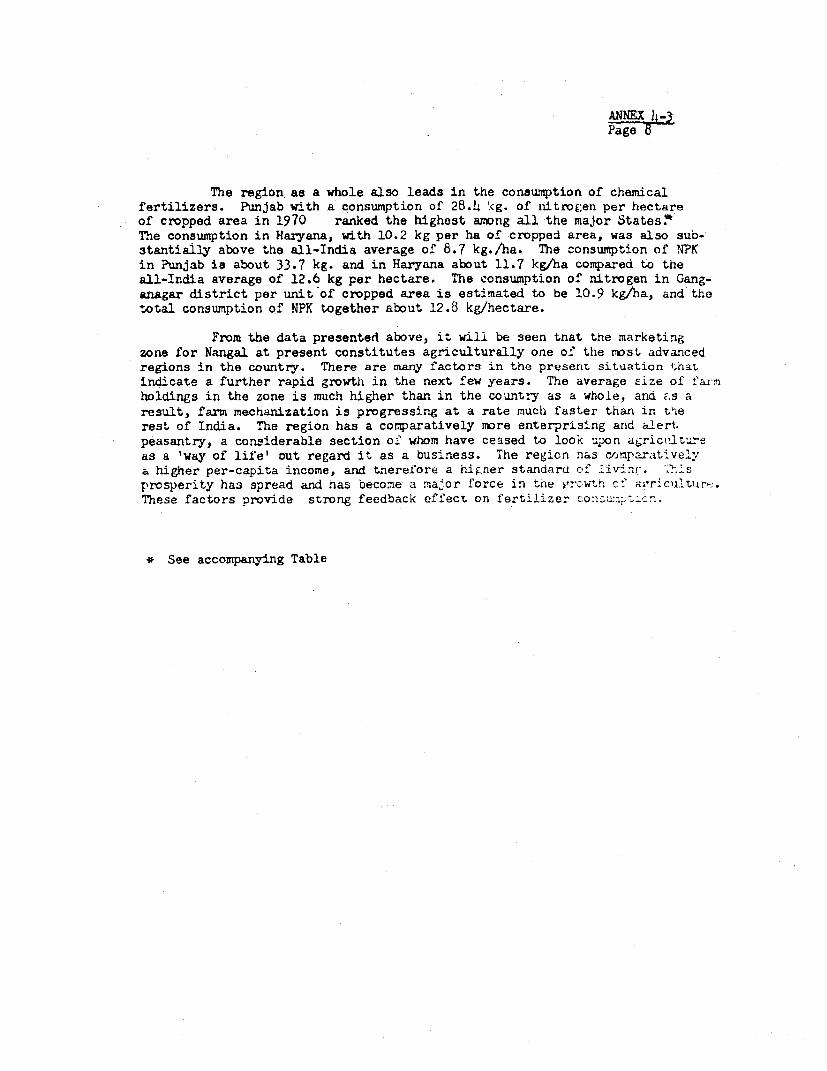
ANNEX-3Page
The region as a whole also leads in the consumption of chemicalfertilizers. Punjab with a consumption of 28.4 Ig. of nitrogpen per hectareof cropped area in 1970 ranked the highest among all the major States'The consumption in Haryana, with 10.2 kg per ha of cropped area, was also sub-stantially above the all-India average of 8.7 kg./ha. The consumption of NIPKin Punjab ia about 33.7 kg. and in Haryana about 11.7 kg/ha compared to theall-India average of 12.6 kg per hectare. The consumption of nitrogen in Gang-anagar district per unit of cropped area is estimated to be 10.9 kg/ha, and thetotal consumption of NPK together about 12.8 kg/hectare.
From the data presented above, it wili be seen tnat tne marketingzone for Nangal at present constitutes agriculturally one of the rest advancedregions in the country. There are many factors in the present situation ',hatindicate a further rapid growth in the next few years. The average Eize of f ainholdings in the zone is much higher than in the country as a whole, and as aresult, farm mechanization is progressing at a rate much faster than in tierest of India. The region has a comparatively nore enterprising and alertpeasantry, a considerable section of whom have ceased to looi. ;pon agric_lLureas a 'way of life' out regard it as a business. The region nlas c_mparative`ya higher per-capita income, and tnerefore a higner standard c,f livinr. .TIsprosperity has spread and nas become a maJor force in tne vrcrwtn c-' ai'r`cuitur:.These factors provide strong feedback effect on fertilizer CO1 S'uz, __C- .
v See accompanying Table
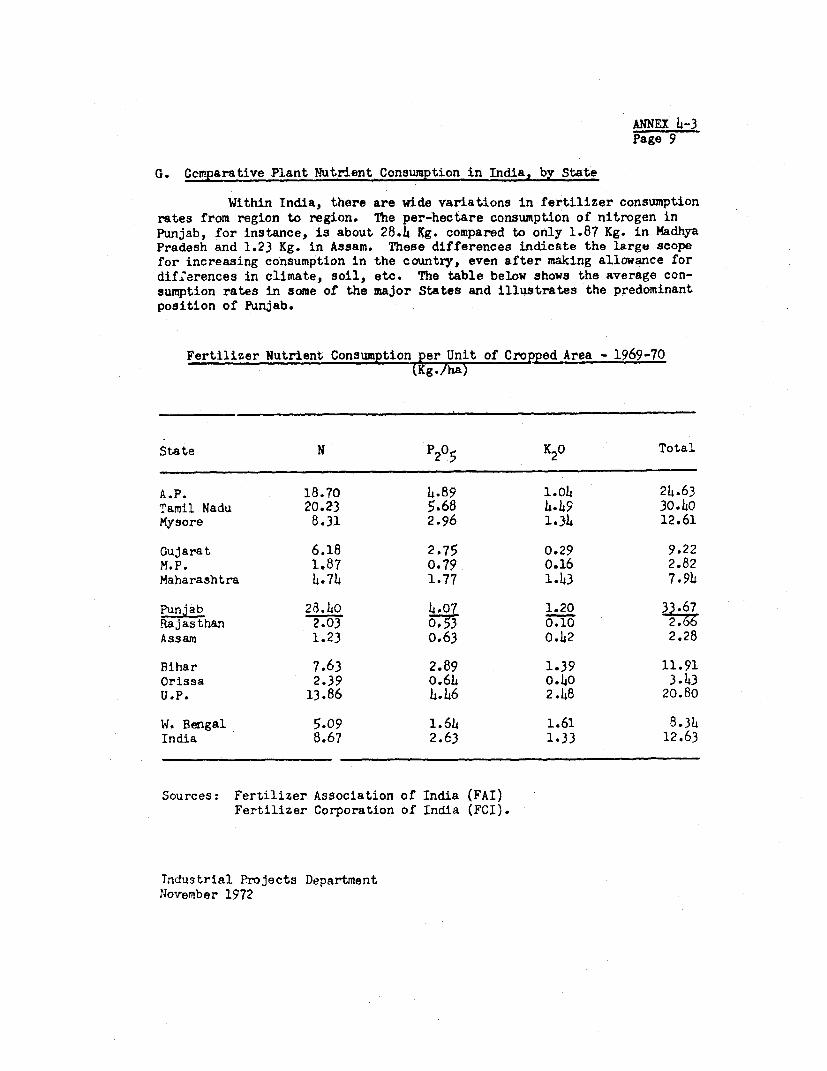
ANNEX 4-3Page 9
G. Ccmparative Plant Nutrient Consumption in India, by State
Within India, there are wide variations in fertilizer consumptionrates from region to region. The per-hectare consumption of nitrogen inPunjab, for instance, is about 28.4 Kg. compared to only 1.87 Kg. in MadhyaPradesh and 1.23 Kg. in Assam. These differences indicate the largte scopefor increasing consumption in the country, even after making allowance fordif.erences in climate, soil, etc. The table below shows the average con-sumption rates in some of the major States and illustrates the predominantposition of Punjab.
Fertilizer Nutrient Consumption per Unit of CroFped Area - 1969-70(Kg./ha)
State N P20 K20 Total
A.P. 18.70 4.89 1.04 24.63Tamil Nadu 20.23 5.68 4.49 30.40Mysore 8.31 2.96 1.34 12.61
Gujarat 6.18 2.75 0.29 9.22M.P. 1.87 0.79 0.16 2.82Maharashtra 4.74 1.77 1.43 7.94
Punjab 28.40 4.07 1.20 33.67Rajasthan 2.03 0.10 2.66Assam 1.23 0.63 0.42 2.28
Bihar 7.63 2.89 1.39 11.91Orissa 2.39 o.6h 0.40 3.43U.P. 13.86 4.46 2.48 20.80
W. Bengal 5.09 1.64 1.61 8.34India 8.67 2.63 1.33 12.63
Sources: Fertilizer Association of India (FAI)Fertilizer Corporation of India (FCI).
Industrial Projects DepartmentNovember 1972
ANNEX 4-4Page 1
FCI: MANGAL FERTILIZEP PROJECTMARKET AND 1Y]7RKETINO
The Nangal Marketing System and Environment
A. C-eneral
The Nangal factory of FCI is located in 1:aya !:angt1 town.shipclose to the Bhakra-Uangal irrigation and power complex in the State ofPunjab. It is the only large-scale nitrogenous fertilizer plant atpresent in the north-western part of India; the two closest units beingsituated in Kanpur and Kota, about 734 and 886 kilonetres away respec-tively, in the States of Uttar Pradesh and RaJasthan. Chandigarh, whichis at present the capital of both the adjoining States of Punrab andHaryana, lJes about 100 km south of Nangal. It is an important distribu-tion center for fertilizer and other connodities, a busiiess and socialfocal point and a:so the headquarters of the regional Apex <o-oporganization.
Northern Rajasthan and in particular the Ganganagar districtof the Rajasthan State, which is contiguous to Punjab, are also includedin the marketing zone of the Nangal Unit. Both from geographic proximityand availability of comnmnication facilities, Ganganagar district can be moreeasily reached from Nangal than fron any other produiction center. Thedistance by rail from Nangal to Ganganagar, is only about h20 kns comparedto 765 kms from Kota, which is situated on the south-eastern border ofRajasthan. Ganganagar, the major distribution center irn the district isbetter connected by rail and road with Punjab and therefore is easilyaccessible from 14angal. The district is extensively irrigated from canalsheading from Punjab. Because of the similarity of soil, climatic andagronomic conditions, cropoing patterns of the district resermbles closelythose in the neighboring districts of Punjab. In contrast with the otherneighboring districts of Rajasthan, Ganganagar has a higher fertilizerdemand, accounting for over 30% of the total fertilizer consumption ofthe state.
For thesB reasons, the states of Punjab and Hiaryana and thedistrict of Ganganagar in Rajasthan constitute the primary marketingzone for the Nangal fertilizer Unit. The Administrative districtscovered in this zone are:
F-n iab Iaryana Rajasthan
1. Gurdasput 1. Hissar 1. Ganganagar2. A=ritaar 2. Rohtak3. Kapurthala 3. Gurgaon4. Jullundur 4. Karnal5. Hcshiarpur 5. Apbala6. Rupar 6. Wind7. Ludhiana 7. Mohendragarh8. Ferozepur9. Bhatinda
10. Sangrur11.. Patiala
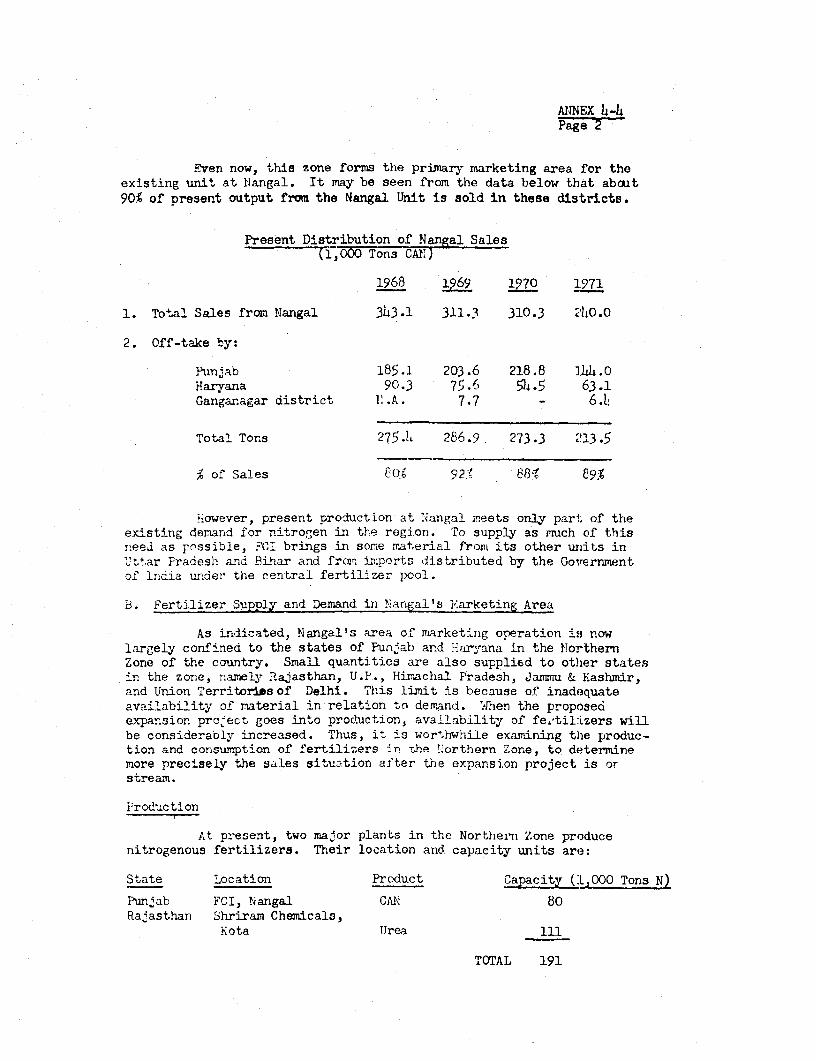
ANNEX 4-4Page 2
Even now, this zone forms the primnary marketing area for theexisting unit at flangal. It may be seen from the data below that about90% of present output from the Nangal Unit is sold in these districts.
Present Distribution of Nangal Salesi,o000 Tons CAE)
1968 1969 1970 1971
1. Total Sales from Nangal 3433.1 311.3 310.3 240.0
2. 0ff-take by:
Psnjab 185.1 203.6 218.8 144.0Haryana 90.3 75.6 5L.5 63.1Gangar.agar district E.A. 7.7 - 6.L
Total Tons 275 .4 286.9 273.3 213.5
% of Sales CG 92, 88 <¢ 89%
However, present production at Nangal meets only part of theexisting demand for ritrogen in the regiorn. To supply as much of thisneei as Fossible, ?CT brings in some material from its other iuits in'ttar Pradesh and Bihar and frwi imports distributed by the Governmento' India under the central fertilizer pool.
B. Fertilizer Supply and Demand in Narigal's Eiarketing Area
As indicated, Nangal's area of mLarketinlg operation is nowlargely confined to the states of Punjab and Haryana in the NiorthernZone of the country. Small quantities are also supplied to other statesir the zone, namely Rajasthan, U.P., Hiiachal Pradesh, Jarmu & Kashmir,and tUnion Territoriesof Delhi. This limit is because of inadequateavailability of material in relation to derrand. W,4hen the proposeaexpansior pro,ect goes into production, availability of fe.tilizers willbe considerably increased. Thus, it is worthwhile examining the produc-tion and consumption of fertilizers in che !Corthern Zone, to determinemore precisely the sales situa.tion after the expansion project is orstream.
i'roduction
At present, two major plants in the Northern Zone producenitrogenous fertilizers. Their location and. capacity units are:
State Location Product Capacity (1,000 Tons N)
Pur. ab FCI, Nangal CAN 80Rajasthan Shriram Chemicals,
Kota fJrea 111
TcYOTAL 191

ANNEX b-Page 3
Actual production of nitrogenous fertilizers in the NorthernZone during the last 6 years is given below. It will be seen that con-siderable expansion in production of nitrogen fertilize'rs took placeonly recently i.e. from 1969 when Shriram Chemical Company at Kotabegan operations.
1,000 Tona N
1966 1967 1968 1969 1970 197.
Punjab 67.2 76.1 78.1 76.6 77.0 80.0Rajasthan - - - 16.0 83.0 90.0
TOTAL 67.2 76.1 78.1 92.6 160.0 170.0
Consumption of Nitrogen Fertilizer in the Nangal Marketing Area
The Northern Zone saw a considerable expansion in consumptionof different fertilizer nutrients during the last decade. The followingtable gives a consumption of Nitrogen for 1962 to 1972 in the majoratates namely Punjab, Haryana. Rajasthan, and elsewhere in Nangal's mainmarketing area:
Consumption of Nitrogen Fertilizer in the MainNangal Marketing Area for 1962 to 1972
1,000 Tons N
Year Punjab Haryana Rajasthan Other Total
1962 18.1 n.a. 3.b ..1 22.61963 26.2 n.a. h.0 1.6 31.81964 37.3 7.8 5.8 2.2 53.1
1965 44 .8 13.8 9.b 2.8 70.81966 33.1 13.2 9.0 5.9 61.31967 68.3 14.2 13.5 11.8 107.8
1968 82.0 31.0 18.9 11.2 143.11969 135.0 4C.3 23.0 12.7 211.01970 146.0 45.0 31.h 8.6 231.0
1971 17b.8 61.0 h0.6 9.6 286.01972 (est.) 210.0 76.0 50.0 Th.0 350.0
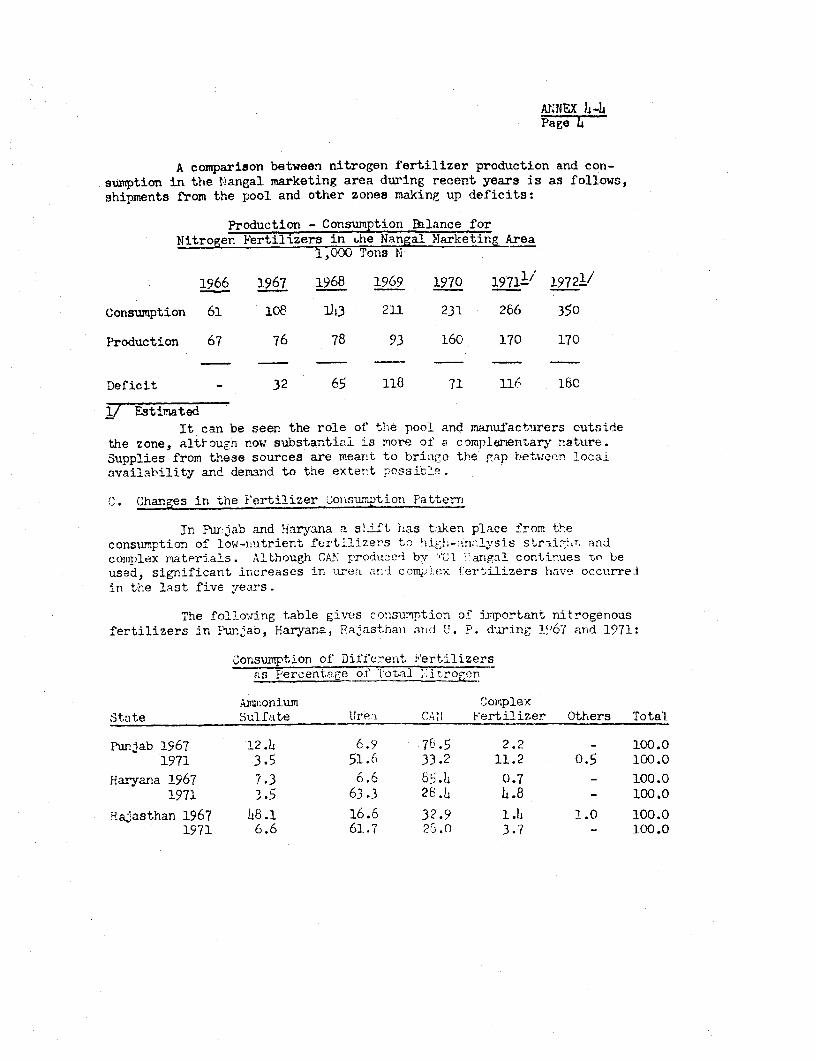
Ai:NEX h-4Page F4
A comparison between nitrogen fertilizer production and con-sumption in the l4angal marketing area during recent years is as follows,shipments from the pool and other zones making up deficits:
Production - Consumption Balance forNitrogen Fertilizers in bhe Nangal Marketing Area
1,000 Tons N
1966 1967 1968 1969 1970 1971't 19 7 2i/
Consumption 61 108 13 211 231 266 350
Production 67 76 78 93 160 170 170
Deficit - 32 65 118 71 1U1A 16C
1/ EstimatedIt can be seen the role of the pool and nanuxfact'irers outside
the zone, althoucgh now substantial is more of a complerentary nature.
Supplies from these sources are meant to briaoe the gap between locaiavailability and demand to the extent rossit1e.
C. Changes in the t'ertilizer Gonsumption Pattern
in tIrjab and haryana a si-ft has taken place from theconsumption of low-nutrient fertilizers to high--rdlysis straii,rlt. and
complex materials. Although C'AN produced bv C'G1 'Vangal continues to beused, significant irncreases in arelar- cotn'i.ea fertAilizers have occurretin the last five years.
The follo ing table gives consumption of im.portant nitrogenousfertilizers in Y.lunab, Haryana, Pajasthan ad U. P. durino- 1V'67 and 1971:
Consumption of Different Fertilizers
as Percentage of Total T i Crogcn
.Am=.onium ComplexS3tate Sulfate lrea (AN Fertilizer Others Total
Punjab 1967 12.h 6.9 76.5 2.2 - 100.01971 3.5 51.6 33.2 11.2 (.5 100.0
Haryana 1967 7.3 6.6 65.4 0.7 - 100.01971 '.5 63.3 28.L 1.8 - 100.0
Ravasthan 1967 h8.l 16.6 32.9 l.h 1.0 100.0
1971 6.6 61.7 25.0 3.7 - 100.0

ANNEX 4-4Page 5
It can be seen that urea became a major nitrogen source in1971 when its share rose to the 52-62% range ir. the above states comparedto only a 7-17% range in 1967. Amr.oniur sulfate has now become a minorfertilizer. CAN, however, still continues to be popular in Punjab, Haryanaand Rajasthan. Comolex fertilizers have also gradually gained acceptance.
D. Future Demand and Supply
Consumption
In addition to IBRD projections, two sets of consumption estimatesfor nitrogenous fertilizers are available. One is based on PlanningConstission targets and the other was developed for the Zonal Conference inApril, 1971, for 1972 and 197h. These aret
Estimates of Future Northern Zone NitroFen Fertilizer Consumption for 1974(1,000 Tons of Nitrogen)
Actual 1972 Planning Zonal ConferenceState Consumption Ccmmission Estimates IRRD
Punjab 225 250 292 312Haryana 75 170 130 116Rajasthan 50 110 73 79TOrAL 3 50 530 495 507
The Zonal Conference estimates are believed to be conservative.For the years beyond 197h, individual estimates have been made by the abovasources for the northern states. For comparison, an ind4vidual estimate byIBRD and used in this report is 520,000 tons N for 197h- However, evenconservative estimates of consurption for 1974 exceed total esti-mated pro-duction capacity of 170,000 tons NJ. As none of the additional projects arelikely to be completed by 1974, the corresponding shortfall is likely to be350,000 tons r. This gap will have to be met by supplies from other Indiansources and the Pool. The subsequent demand-supply pattern is outlined inthe Regional Forecast Tables given in Annex 4 -2, and is reviewed in furtherdetail ir. the following section.
E. Production and Competition in Nangal's Yarketing Area
At present, FCI Yangal has a capacity to produce 320,000tons of Calcium Ammoniun Fitrate (25{ N) equivalent to 80,000 tonsof T, ,The marketing area of the plant includes the State of iurY,JThHaryora, thd &arganagar district of Rajasthan, Himachal Pradesh and thesmall Union Territories of Delhi and Chandigarh. But product demand isso large that it cannot be possibly met by existing production facilities.
1/ Including 13,000 tons for !Hinachal Pradesh, Jarm7iu and Kashimik.

AMTEX 4-4LPage 6
The (orporation tries to make an equitable distribuition of the ava:ilablematerial ajid sells abouit 80% of the quar:tity produced each year in thestates of 1-anjab and HlaxTaina and the renainder iit the othter statesnenticned.
At uresent, other producers who, because of their proximityare interested in selling their products in Nangal's marketing area, areSh'rirarn LCN Gherdio:s, Kota and lndiu; :>.-rosives Ltd., (I.L), KaripLx.DGY has a capacity to produce 250,O0C) tor-s of urea, equivalent to 11,000tons of it, and Irl !/ a production capt;ity of L&'Q,000 tons of urea,equivalent to 2(0,Q000 tons of 1:.
DC-. plDrned to se'l about (0.(.{ tofs of urea in Pwujab and20,00C tons in Hiaryana durinig 1972. Ir 1.9!73 it -?'; sell -bout IJ8,C0O0tons of urea in !Plur`Lj and 1",C)0 'vi' i 4n I,,r'- u arla IV .proposes to sell about 62,000C tcn'i of 'vla -in a n(i 20,000 tonIs in
yaryana. Thus, the bulk of iddaitional fr ..erX ' )i 1-tv- n Wpti un thatwould be shiine-d i n to lur fa b 'r wld Hal--a w I a e,,0(i t QnS ofurea eauivalent tc 79,000 tons of' Ti's W;. b'e ir. adilitlo- tvo the)2,0OC tons of nitrogen (25C0,C{C"' I " -) ,I i'anga, is expeccedto produce during the year. In add tion, W'e i!as also plars to sellabout 10,000 tons of suphala 15:1:,:1' 'euvert to about I,E0 -t.cs ofi: in thne area. Thus, Ost Ur-ti., .a "f' ' ilOUS :iitrui'enousfertilizer in; th.e tw:o raii staiti s __ - Is !ii rwreting area n 1)73will be of tne or('er of l3,X0
mornpared with this arnti pt- v e )::;ability, the tctae est.imateodderand for nitrogen in t-ll';Itb a ',J 1'?3 nJ L7,cxI: to rD.The correspondinlg shortage, amouit.rw , tY t,tvs of will h:aveto be met largely byr iimports v-i. t1ie el r tertii zer Poo. lir, can thusbe seen the iariga' plant has a+. prese:-,. r , nO -'*etitdon. -Inc ee7y,the ctirrent probler,, especially ' s .e(-`raly si3tuit,ed tothese two states, is one of equita'ie :i s her than aompetition.
The expansion orogran of NIargar I-rcvile-ds for 330,00%° tons ofurea, equivalent to 152,000 tons of N? .a 51 cRnactty. It is anticipatedthe exnansion nrroject twill be on streamri In 1;7 arvi g'-adually attain fullcanacity by 1973/1979. On this basis tho tte) ona.na1ty of HI that will heproduced by Nangal, in the existing na n £ in' the 'ip ansion nroject L)uttogether will be:
1,CxDO Tons o0f
C.A. . CreYear :XistiILg 'ixr,;iiO i Tota:l
1',977 60 *,,10 170
1)'./7') . 72 , 2'7 209
_i Indiar Explosives Ltd., Kanpur
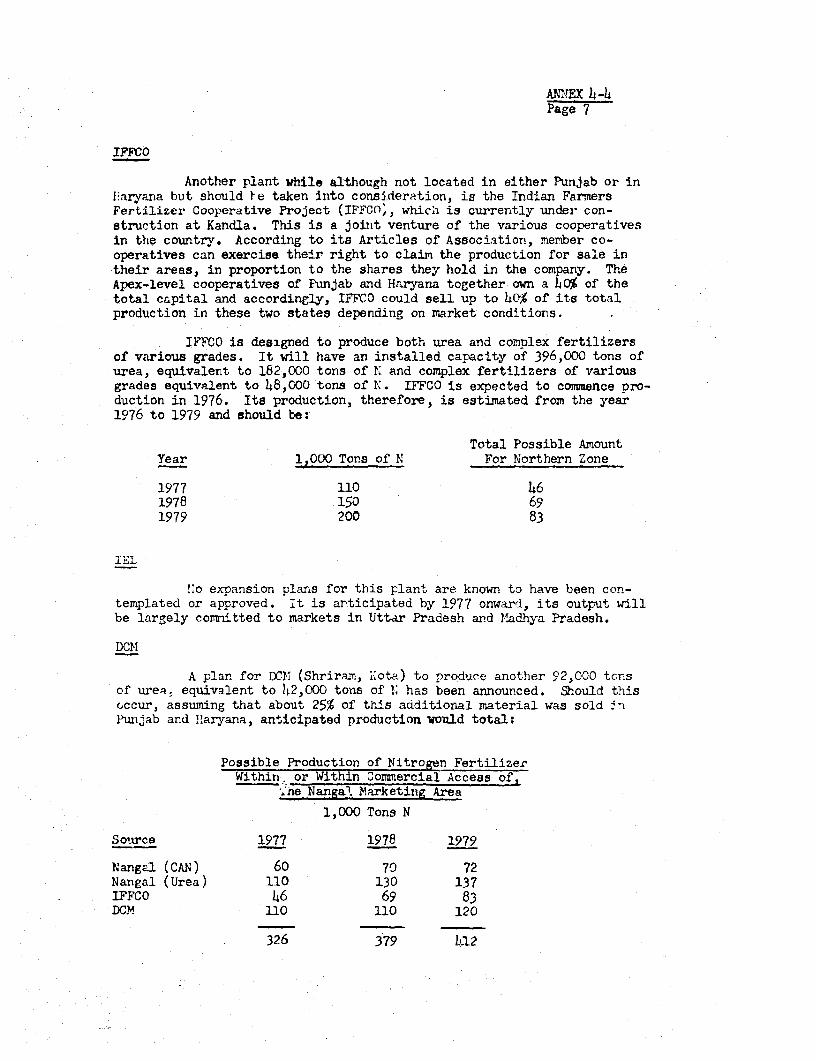
ANEX. 4-4Page 7
IFFCO
Another plant while although not located in either Purijab or iniaryaria but should le taken into consideration, is the Indian FarmftersFertilizer Cooperative Project (IFFCO', which is currently under con-struction at Kandla. This is a joint venture of the various cooperativesin the country. According to its Articles of Association, merber co-operatives can exercise their right to claim the production for sa'le intheir areas, in proportion to the shares they hold in the company. TheApex-level cooperatives of Punjab and Haryana together own a hC% of thetotal capital and accordingly, Ir-FCO could sell up to hO% of its totalproduction in these two states depending on market conditions.
IFFCO is designed to produce both urea and complex fertilizersof various grades. It will have an installed capacity of 396,000 tons ofurea, equivalent to 182,000 tons of !. and complex fertilizers of variousgrades equivalent to 48,000 tons of X. IFFCO is expected to commence Dro-duction in 1976. Its production, therefore, is estimated from the year1976 to 1979 and ohould be:
Total Possible AmountYear 1,000 Tons of N For Northern Zone
1977 110 461978 150 691979 200 83
IEL
!o expansion plans for this plant are known to have been con-templated or approved. it is articipated by 1977 onward, its output willbe laraely conditted to markets in Uttar Pradesh and Madhya Pradesh.
DC-
A plan for DCOi (Shriran, i;ota) to produee another 92,000 tonsof urea, equivalent to 4t2,000 tons of 1. has been announced. Should thisoccur, assuming that about 25% of this additional material was sold -lPunjab and flaryana, anticipated production woald total:
Possible Production of Nitro n FertilizerWithin or Within Cozmaercial Access of,
._e Nanga. Marketing Area
1,000 Tons N
Source 1977 1978 1979
Nangal (CAN) 60 70 72Nangal (Urea) 110 130 137IFFCO 46 69 83DCM 110 110 120
326 379 b-12
MANEX 4-4Page U
Baced on previously indicated estima,ted consumption figures,t'e correspoending demand- supply halance for Fun lab and Hiaryana alonewould he:
1,000 Tons ,!
977 1.976 1979
Demand ,50 598 65l,Supply 326 379 I42
Deficit 224 219 2h2
Conclusion
Thus, even if all nitroger plants - operating, under constructionand envisaged - with actual or potenti sas *r' the trangal !arko: area
were to core on. strean as intended, *'ce o ,' stilI be a aubstantial
uri'ulfilled demand equivalent to two lare urea plar!ts. The ,robability of
a'l this additional capacity becoring ava blc to the nortirr zone from
e-sily accessable sources before 1'1d3 is iont urlikely, whi(n, "further reduces
for many y-ears -he likelihood of the !.aaL expansi.on o1eing faced with serTOus,a,5np e I-- or..
F. Trar.srorta tion, Storage, Distriluticm Ia2 Sales
Tlra aisortation
Hoth rail and road transt:orta:.iOn are used to haul Langal CANfertilizer from the plant to distribut:-n c"n'ers. A good road system
enables 3L$ of present prouaction (or ahonvwt o''J tons annually) to be
movted in this way, coTmpared to a n-"iWrl r'." :' o' j to .O for fer-
til'z_r. 'Aell-d-veloped railroad f-c.lit`ies 4' most of the nortoerrn zone
also exist and track lengtr. per IC"'. su. km s 3) km compred to the national
average of 1.E km. The plant is linked via troar-gauge tracks to important
junctions such-. as :handigarh and w`ati:ri;: w}ere tr-'cks radia'.e in six direc-
tions.
Increased production at 'azngal wil'- largely replace fertilizer
now sl,ipped into the northern zone from other aYeas by the GOI fertilizer
oc-. Hence, ruch of thle addirional transnortation load will be confLned
to the relatively chort dis-ances between the plant and freight-train
nak;.-up yards at 3hatinda, Chandigarh and Ludhiana. The Ministry of Rail-
-a;'s has verbaliy assured the Bank th-at track nodifications and additional
wagors needed to handle anticipi,ed urea shipments, (as well as fuel oil
and coal, have beer studied and nxre included in -jrs forthcoming budgets and
pThn3S. hnese assurances will be c!ecked perrofdically.
AMNEX 4-hPage 9
Storage
Fertilizer consumption in Nangal's marketing area is fairlyuniforn throughout the year because of double cropping and the sidevariety sown. In addition, distribution and discount systems used byco-ops and private dealers have, to date, helped to eliJ±inate the needlfor FCI to store large amounte of material in less-active months.Canacity equivalent to 20 daya' production of bagged urea (20,000 tons)will be provided at the factory. Additional field storage requirod atfull output is expected to range between 1,/00 tons in April to 20,000tons in June. According to FCI, this wlll be provided by the Cooperatives.
Distribution and Sales
In tlŽe principal marketirg areas (Pun4ab and Haryana) and toa large extent in other states, fertilizers reach farmeIs through twodistribution networks, namely, the co-ops and private deialers. Co-opshave a four-tier system comprising Apex Federations, district levelsocieties, retail or wholesale marketing societies tnd village levelco-ops. Sales _ztivities start by Apex officcs giving (dispatch instruc-tions to manufacturers, indicating destinations, rail-head quantitiesand schedules. FCI then supplies material to the railhead or wholesalemarketing societies accordingly (whenever available). The wholesalesociety, in 'urn, distributes the fertilizer to village-level co-ops.
H. Credit
Fertilizers are purchased by various agricult-..'al groups inIndia rr.ging from large comaercial estates to veryr low-income cultivators.The former usually uo not need credit assistance, but many small farmersand ten.nt-rultiva-ors rely on this mear.s of financing on a crop-by-cropbasis. In recent years, detenr2ined attempts have been made by GOI toprovide suitable credit facilities to all levels of the agriculturalconwunity, especially the low-income groups whose only previous recoursewas the village money-lender.
Farmers can now obtain loans from two major sources: Statebanks and co-op "banks" or lending agencies. The co-ops, at Apex levelcan, in turn, obtain loans from the State banks or from the Centr 1Reserve Bank in India. Typical interest terns are:
Reserve Bank to co-cps 4State Banks to co-ops 9Co-ops to farmers 9.5State Banks to farmers 10
Guidance on forthcoming loan needs is given to the State andco-op banks by the 1-inistry of Agriculturo. Loans to farmers are usuallymade on a 6 or 12 month basis and are increasingly granted according to afarmer's ability to produce, rather than his securable assets. To assistvery poor cultivators in backward areas GOI has recently established the

ANTNEX l-hPage 10
Small Farmers Development Agency and the Marginal Farmers DevelopmentAgency. These are intended to provide 100:0, fnar;cinc to about 1 rmillionpeople or. a l," arnrual interest basis; 25$, of these funds will come fromAgency sources and the remainder nfom co-ops.
Iowever, overall credit requixenents in India are large andstill growing. Considerable increases in credit availability will haveto be provided by GO! ir the fii+ure. The Finistr4es of Agriculture anidFinance are aware of thie need and are planning to make more loans avail-.able on iealistic term.s, especially to low-income farmers.
Farmers, in general, nave earned a good borrowing reputation.Prompt repayment has been made in ovep- 75s of all cases and reschedulingor re-financing is preferred Fy the banks to foreclosure. Insuranceagainst default is also available to banks from the Cr0I liational CreditGuarantee Corporation, which provides 7 coverqge up to .ls 5,000 perfarmer for a srl See.
The gro,wth of numerous prIvate fertilizer dealers has led toadditional credit and coverage needs. These individuals now can obtainloans covering 75% of their stock an.' s9.ate banks cat secure 75• riskcoverage for a small charge.
In view of these credit faieilities (and correspondi-g riskcoverage) available to all levels of at rcult-are, it is bel-eved thatsales of urea fror the new TNangal ,L;nt. will not te restricted by paymentproblems, especially as a large part if the markec lies in tle well-developedstates of Pmunjab and Haryana where f-niers are relatively prvsperous and asabstantial nroportion of agricultnr!irtn.uts are purchased with cash.
I. IMarketing and rield Acti.Vities
Yarket Research and Sales Promotion
FCI has, to date, recently established three marketing zo?es -eastern, northern, and south western. Each zone is headed by a MarketingManager and is divided and sub-divided into regions (or States) and areasrespectively. The ITangal regional orfice is presently located at IJangalbut will move to Chandigarh to handle increased sales after the urea plantis built. (Moreover, h>e Apex headquarters, as well as the Governments ofPuniab and Haryana are in Chandigarh .) Area headouarters will remain inNew Delhi and will suipervrise new district offices as they are established,depending on new sales potential'r.
Promotion, publicity and market research are coordinated atregional office level under guidance from the Chief Agricultural Scientistin Niew Delhi, who also gives sirilar assistance to other FCI regionalmarketing offices throughout the country. This helps to ensure collabora-tion and uniformity. At Nangal, a market research manager is in charge ofsales and transportation forecasting and planning. Major promotionalactivities are soil testing and agronomic advisory services headed by adeputy chief agronomist who plans and executes numerous field programs,with the assistance of a staff or soil chemists and demonstrators.
ANNEX h-4
Farmers' education in fertilizer use is being undertakenmainly through the distribution of appropriate literature, personalcontacts by the field staff (especially those in charge of demonstra-tions), audio-visual aids, etc. One mobile film unit is already busilyemployed. It is proposed to increase these facilities in the future.Besides, attempts are being made to understand the farmers' problemsand gain their confidence through periodic organization of group dis-cussions, exhibitions and farm fairs. These events will be considerablyincreased in nunber during the next few years. A monthly newsletteris now directly mailed to farmers, dealers and the field staff, andcirculation will be increased. It is FCI 's objective to develop anintegrated agricultural advisory service as part of the fertilizerpromotion plan, largely through private dealer development.
Field Activities Undertaken in the Two Years 1971 and 1972
These include:
Fertilizer Trials 50Fertilizer Demonstrations 517Fert'lizer Festivals 17F4eld Days 177Exhibitions 10Film Showv 27Soil Analyses 1300(plus thousands of analyses performed by others)
Discussions with FCI Nangal marketing and sales staff at allrevels, as well as with several company dealers displayed an eagernessand ability to sell "their own" urea in place of Limited supplies fromelsewhere. This should not be difficult in a region where farmersgenerally regard agriculture as a business and know the economic benefitsof regular fertilizer application.
Industrial Projects DepartmentNovember 1972

INDIANANGAL FERTILIZER PROJECTSCHEMATIC FLOWSHEET
IXTIMNG GAAL
POWER OXYGEN AI ONE
(SECTION REPLACE J EY EXPANSION PtOJtCT)
LA0 PmCT TD N
ION EMOVAL CONVEtSION CENUGA.IA-N A RIILNO
lULFtX 6C02 T4°Y TtD,= TYN
.. -. C_RIUUM .. . . . } I . ~ I _ .

A!NEX 5-2Page 1
FOIt NANGAL FERTILIZER PROJECT
P.;DJTC? D?,CRIPTIO" -
A. Process Dascription
Thne proposed :angal expansion proiect 2as , daiLy capacity of 900:etric ton u axTmorla (300,000 TPY) and 1,00 1 metric tons urea (330,000 FP')with tho excess ammonia (300 T?D) being used in the existina plant to :-Pnlqce"nonia from eloctrolisis. The 'ollowing description ie based on ty iea1.
oroc~s.s technology b2ing off*red by the proposed contractors. The orejectinclu,!,s a 2uol oil gasification unit based on the 3hell process, in whichheavy petrolznm fractions are partially oxidized with cxygen and heat re-covered as steam. Gasi.ication is zollow?d by a Lurgi-lectisol unit fordesulfurization and decarbonation and final traces of i.npurities are remiovedin a nitrogen wash unit. The synthesis gas is comrressea and fed to theamnonia syrthesis section for conversion to armonia over synthesis cat'ijl Ft.Tslzo,.;tg-nfor gasification and nitrogen for the nitrogen wash or- obt2inedfro-i an air ractionsticn plent. Arwnonia and carbon dioxide are fed to theu.,i nlznt ,nich is based on tr.e tetal ~r:ecycle process of :i.onteca*jr.!-7-dison1eor the production of prilled urea. Tle plant sections are described ingreater detail belowr and in the flowsheet (Annex 5-1).
B. Feedstock
nh. oro4ect is based on the use cr hneavi ptrolnin fractio, fromon- of Indian Oil Corroration1 - refir.eries, as the 'ee¢dstcck. Fanl oil issiiippcd by rail,and loeding and unloading require the tank wagons to b3stea,m-h-ate-. After heating, the oil is pi,Lnperl to t-o stea-n-heated stora-etanks (12,500 kiloliters each, which correspond to a:Ibout 30 d-T. f;-dstockr;Q^uirenert). Unlo..-din,Y flacilities can hi.ndlo si.,ty tank wagons per da:.
C. FVOI Oil ,nsificaticn
ShAll's non-catalytic partial oxidation proce^3s with tctal rucycle-o0' carbozi i3 usrd. It inclutles thr-e gasifiers, each with a -ated canacit':air fOrCOi3 oZ -i.r hour of prciuct .,as (CO + Y12 ). Oxygen (98' 02 ) fr m theair fractionation plant is colpr:!s3ed to 56 atm a n1 ireheatne. tc, 2?%0C.Fuel oil, with recycl-. carbon dij.s-:-rn-d in it, is plrelnat id to 2htO0C aSil pmpeCdto t-h- co-ibustGr _uns on ton of the gasificrs. The co.bius5tor ,uns .le re-c^ive oBxy=n and ste.n.
:eedstock reactc riath o)Trn and steam in tVh flani, belo-; th,- cora-ou3tor to yricld a gas rich in carbon monoyide nn' lhydro;,n. Thr. is lowin mnethane an( contlins sulflur as lhrklrofn sulfik.Ž (;i,) n a 7-r.a11 OUa.,tityof organic sulfur (C,i,G3). About ,3 , the carbon so :.t. f' $ o,t, O(; 3lOP'
clirbon, w-hich is recyclcd.
1/ The deScriptiun of t-.v rnnonia -1lent is typi-al and 7,.yeh- e_ slightly dependinZ oli the nrr)cfss to be 3' ct"in August.

A'.RZ,'t A >ATK.t '-
,'ot ,as frori Vh r''s:c'tcr f lows iTito ?i wist, 't 1.'which adjoi:ns thF reatour sh .11 !lW bilr .i hoil -r Ji , -lows rc;ti p ?2 throuwl: v;thout r.oo't d -rosition nn tho h:lat e:'-larltŽ sf.r''. ::*-tfron2 e th '¶iS iS rocov5r-d i 11Th t -a;t: hat hoilor to ajij.raLc ;t*.sn .;t1O, atm. Gas frorn 1? ' -t n ' t boil r is -.-icircwJati-l,-water ard :Yrthr'r r ,crnb1v d in e. narbo"d on scrubb.hv. Carben di:c'hr-,.from t",e rod3nch ,,tr'i as s' u -ry wi,l i r1 d ^, IŽtii'3 ,.jitatior -ritl!Puel oil. Carbon )-!Jx1ts r' 1 '??'"t o arrn wnatr h Sr 'iiln anti tha2risu.nended in fuel oil ard rcjccl 'i Frc thr: ga.-i fizr.
.'ectiso'l ',.S'i ('3'ulfur 'rr, W. )
T xe 1"-Cet`Ls0 ,roc-s-s (Lul-;}) W'ii<h lti r.w '- no! or tl
physii'al absorptior, cf lhydro-en mfi (:i;), n.'-v:ic 712)
c;>rh- 1 rdito'ridt-, :`2) -' - ;icon. ,, -; N-rt - J 'b fic nt t' s{C tittl wit,. on. .t * :-3a.i1 .0, CC_ t tl i; !'4 'io m-e . iith ges from the i:, '(, n'r'-and CC., L- oi'-cr. 4-1 .^ c1. d brini r.ect :..~ai t crhanzg w Iz, 4vanoratl!v n .s'.rniaa and t. 2 tc, n,a ; c rb
C~~~~~~~~~~~~~~~entrvr into tlh) H-IS abnorb.rr a+. -MA.,.. rhiE.> n 'u~l1 ;'C.} c' . nt; . |--. ihccit G.', r'i hy washl .,'- t. :.t t,<. ^k 90 C.
'From the bottc, c- t; t,:- r; r.iTh motŽ:!^ 'o:3 othe! , 3 toerr, wher- it is evarorated -in tc it - a mrn t-J, firststage, which coi1t. 5ns ;2 and 'C, -.s -- ^s a'o it. t. 'w; c: tfCO2 9bso:ber aind miYn?(i '! t -!.cInij c frn . ti as. i I' - 1c.r * rt,j-,,L±cui- fran t: tcx- X is t 'n,'rti'd t 2r; g- ,-?( n.th~ r en'in tcr whi.ch contcin: ^ti,!--no' i_' pumped to the methanoli;.-till.tion coiunr tc n' r i h < o . A -:tiPi o1 mter ;r'rttiobtain2d by :;o:'ubbing the~ C0? Tr , tu the Ifr' ,-r t ' to'.distillation colwun. Th- mer~,!n-;-rn'.-, gaz ircr2 t stjil.tlo)Column is nztivY--i .ith '. 'f 1'O.,LP *^ , n'! ecol> i '-..t 2x-c'l:!:t--.rtfro ,50C(' to Ioat LCC t c^"- n-. te t.M,:roc vro, 'ir'h. t!-r h
u 'as rc l'-r i'or t* 2>--;: - >- rh7' .:,. 1 t:- .r^ "'-'r tc<-cover sulflur.
Shift CoInvzrsion
Af"t.r I;'ilur rY- 1, tYho gas is trI*at-,ti , t' tr. rt allcarbon monox1de to hydrogen. Tho process utili&ts the high tempera-ture. carbon monoyil"- nor.vr?cv ::..t:Žj.n- nui'actur-(i by 'the e' i) Di-visionof FOCI. 71-is -talsyrt is irn cc't .rc!a2. operation in several plants i-:c].u-ceing Si;clri, Trc-nb.., Narirup and iyv ill. Thc' cataivrst is arrang:-A int;~re, b.:.- ;rit'i rooling bIt)Awee ti:er2. After t o: sncond eni tbir;i ;i- U',is rurnoved u; exchnangw rith the !as onzve-ing the iirst bed. A't:r t::-fir3t bEu, heat is recovered Ior prre-heatin, bhoi.l-r : ei :,ater. Tne 'asleaving the shift conv._rsicn 3ectier' cont;.n2s 2.5 CC0.
'. Carbon Dioxide epnoval
fa.s ron shift convr.rsi-r' wh.:ch contains about 34' C2 en:'0.3 upm If23 and C';, enteis tho anbsor tion refrigeration t.>t;n 1.,0 l9'OCa'id !,? -tn and is cooled to -250C. Ccoit'el -r2s -nter; t,re C02 absorbqr,

MJ:TX 5-2Pag.- 3
wh w s. CTC is reduced tc icss than 1) ppm. Gas from the absorber goes tothe nitrogen wash uriit. Methanol from the CO, rege-r!rator is f.d hack tothe "'X <b,orber for *002 remov.^l. Th? eC2 ri ch r'ethanol i.s flsh-d in7tpe and finaily rtriopned with impure nitrnpen from the air 3-oiraticnWlan, in the CO, r2ceneratrr. Th] bul'k of hydroge.-. obzorboc1 in thc mitth-anrol 19 con off in the I'irst stage. This stream;n is recylced to theI¾,3 rniov'al .section. 'carbon dioxido obtained fromi the n-nerneratton coirmnni_ srnt to ihe Urea plznt. Th2n nethlanol is regenorat-l by stripping withimpur; nitrcgen which cprrios with it thc remaining CO2.
r, ' :tro.n .,ash
'h 1, l irgt tt.e 'ctr.>o4 washing section i- proces,cd in the:litrL :I vash .lant f'r final purification, befcre entering the synthesisloon. F;-i prcce!s gas 12avlrig the :iectisol decarbonation s4ectior. is cooledto -1900C. 'litrcgen is coolcd to -1900C and is utilized in the liaulidnitrcogon unit for scrubbing the gas. Gas 1eaving the unit is a nitrogen-hydro.-en -ivture (ammacria synthesis -as) wihich containc. less than 5 ppm ofcarbon monoy'ce.
!'. 'n.o,a ' nd Storag-e
Lyit .- ,as from the nitncgn wash unit at e atrn and 35C isconp re ssci in a four stage centriAtgal. compressor driven by a stean turbin-.The rr :s iS compressed to 235 atm in three stages after which the recyclef'aS from the synthesis loop is added and the total ^n compressed tc 270 at.,In-d 4V0C. The catalyst in th* ccnv,rtor is arrarv-2d ir. three layers. 'Theentering gar -).chanses heat .eithi th2 outgoing h-ot gas and enttrs the firstez,t2-1v-t b d at about ;})O2. ast heat is reecvlred after t'hi: first twostages by producing st':ue at 100 atmt. Gas from the last catalyst bed con-taining about 19,' iELmmonia is cooled b: exchangs with the incoming gas andleaves the converter at 88°C.
A.-monia is cooled anc conrensed ir. ti-o stac-s in c water-coolcdec-'.d, ner and ar.monia-cool.d condensor. The condnsred arwnoria is separatedanji t`he remaining gas which contains about 3. ', :3 is recycled to the racir-culator. ,Ar'trria from the condensors is flas!ied to about 22 atm. and tlenn~rnt to tetora'e.
;. - Tractio-c;.tion
0 >---~ :fr zartial oxidation and niitro. r .Crr thle nitr-ogen LC;ub-bini, uni-.'x _,a nitrogen for syn:thesis gas Prc obtained from can air fractior.a-ticn plLnt. ,.r Jis compressed and cooled to about -170°C and oxygen andiLitrog'-n are swnrae.ted in a distillation column. The unit produced ?7F.1 nureoyygcn and nitrogen witlh tot more than 20 ppmry oygen and 100 ppm atron.
J. Trea Syit'esis and "Irilling
ITrea production will be based on the modiftied tlontedieon totalr-cycl? urea process. Amncnia and carlcr. dioxidce are co.nn-ssezo n.-ni 'Atc th-ie r-.ctor operoting at 210 atm and 2000C. Part of the carbo. ni_xid-iF taken off at an intcrrediate stage of th2 compres3or at 80 atm and s?ntto tne first condensor. Thle solution from the reactor which consists of

Ai'V!T 5-2Page 4$
urea, water, aim.onium carbainatma trid am'norici is sent tc the first distillerwhere most of the carbamat3 is Jeco-ro-"'d at, R? atm and(i 1y 0'° ito rlmoriniaard carbon dioxide an(, most of the -cxc .s- arvmonia is evaporated. Due to thehigh ratio of arunonia to carbon dioyid'V u sed in the systen, the decompoA.tioit
of t-e carb, rrate nr3c eds to its equi2ibrium. Th-2 -. 'lU--'t frori tI. firstdistiller enters thn s"parator, it' which liquid and varor bTnarat-. rhe
vapor ?nt.ers th- first condmnsnr anu is partialtly condens-4: as a.-!ioiia and;ammoniurn carbamat.o aqueous solutito(r at abcut i<-l'$G' V tnKC 9 t;. Thr'cona.`nsation -jn-rat-e low; r-ssllr. t;> an. T" uncond gns,as irs furt-ercool Qd with uater tc, -ibout 1) -°'. 2hi in- ; t:; '. elm r. 'rv t,: conl- 'n-orar- washed to reaLver ,.^rronia ari thc -t'l.
Thre s'olttion i,rodi)x-" i.!l ttl iLr t ondr ' r is revyclii tv threactor tnrough a carbamnate pmn. r .e urea sicKlution separat-i inr tihe fir.-tseyparator paoses through a seconu 'ldstil -r .-nd secono seoarat,or otrc tir.at about 12 atmn. Gas to the secor!s conrcrns"r is condenL-i ai an a,,n:?ou:isolution and ther recycled to the first, condenser. The urea solution7a:sses to th.n t:ird dstiller and senarators, which onerate .t 4 atm, toyield a 75% urea solution. Thc gas separated at th. stage is condansedand recycled to the second stage condenser.
Urea solutlor. is i.rlcnrtrat. ir two s5 a,es coeer_-in- uni lr vacuun.The -as effluent from- the first st,g' i- *'ond-nsed arii ;uwe. io~ r covorilfrom the soluticn in c- recti'icaticti colimn _nd recycledi. r ̂ .t::> n-constage 9Q9.7T no'lten ur-a is ob*t:i_ed wi':d h -.' sprca,v- irto th- .lllir tow rto convert urea into sp.nri's cr " rill-
K. Froduct Handling and Stora'o?
Bulk s-tera,- for urea i provided in a concrete sil' wit .e .-
city of 20,000 tons. .:eclainmtion fron storag- is by a mobile scraar wrii-.discs-:arRes the reclaired urea v' t! zm';av-rfr ann trearrt I.t to , te'- ha--4ing Plant. The bagging plant has sio line-.
L. Plant Facilitics for Utilities
Steam is gennerated by waste rteat boiler: after the Shell -' sifi rn,in the ammonia converter and i th- firt;' stae cndenser o urt' 'Tlant.hle stean in tha first two instancoes is at 100 atm and would b-' surwd c rmtndby steam generaticn from. tne scrvico boil rs at the sane o resst-re. Ihe s..r-vice boiler installation co.niiists of two coal-fired water tube boil±ors, cachof which i3 adequate for meeting the net imcn'ort steam requiree:i:nt of t.:e nro-cess plants. ..ach has a normal ratod capacity for steam g3neration of 16tons per hour at 100 atm. The stea.mR genaratioii nlant includes necessaryfacilities for coal unloading and h3ndling, coal grinding, svuJrrn-2aters,economizers anr ash handling ant: di.-pooal.
The net power require? ent of' about 30 Hril for the expansion pro,ectis3 ohtained fron the Bhakra stationi at 616 KY voltag- at the factor7, miinsubstation and stepped down to 11 Ui. Po'5 r Et 11 KV is distribut-l fromthe main substation to the varioua plcnt substations and utilia,-.1 a;, 11 KV.3.3 KV, bOO V/3 phase or 230 V/sin,gle phase depending on th.e nature of theload. The plant substations include facilities for transforming to the abovevoltages and distribution to tne loadl cinters.

ABNk X 5-2Page( 5
'.:at-r for th- expanusicn pro,ect ir obtain,uJ by collecting th.utiliz!-d onrce-through cooling water from thie !xisting fdcilities .nnd ro-usecafter troatmnnt as make-up to the cooling water circulrtion systai.
f'acilitics include equipment for treating the water for u.e innrocess and for the production of boiler feed water of' suitable qluality foruse in the generation of steam at 100 atm.
Provision has been made in the air com)ressor of the a-; fractiona-tion plant for the necessarny additional capacity to rMeet the air requirementsin the instruments. Standby compressors of srmaller canacity are provided forcritWcal instnm-ents when the air compressor of the air fracti.on;tion plantis not operating.
M. Prcject T;il.mrer.tation
The pro'i-ct will be implemrented with FCl as i_s o.rn g;sneral con-tractor. Assistance will be obtained from the n)rocess licensors, who willb- nssociated with FCI in process design, ergineering, procurement, con-.tructicn, testing and cornissioning and project mLnangement. The basicresnonsibilitv for design, engineering and procuroment will be undertakenby p {r n. .CI will form a proiect management group led by a experiencedsenior FCI engineer as Project Manager. He will be assiFted by a ProjectOfficer, a Construction Engineer, a Civil Engineer, a Materials Manager, a?ersonnel Maraver and a Finance Manager.
The project management group will be assisted by F. Uhde, theselected ammonia contractor, and Montedison. Each contractor will havsresponsibility for his plant and will consult with FCI regarding coordinationwith oth,r phases of the project.
Detailrd cnginearing will be carried out by , e D .with assisQtn^cefron t`ie co:trao:ors. The scope will. incluae enginrering design of fabricated'quipInmnt wner, required plus pirling, electrical, instrummntation, utilities,strictu a. anu civil designs. Detailed engineering drawings and data sheetswill be chiecked by the process licensors and contractors for conformity with,dcs ien requiremqents.
Procurement will be carried out in conformity w:ith the? proceduresdiscussed with the Bank and GOI. The assistance of the contractors will beLsed in procurement to the maxlimt extent.
Civil works, including structural work and founi&tion and erectionof mechanical and electrical items, piping, instruments, inselation cabling,etc., will be carried out by the project authorities through dc,nestic 3ub-contractors. These contractors will be chosen by competiti-ve domestic biddingtaking into account their capabilities, resources and past performance.
For major items of equipment involving specialized constru ti(n orcr-ction skills, the bidder will bc r2quired to include in his offrr provisieitor making available the skilled technicians required.
Commissionint, will be carril-d out by the Pro-ect authorities withthe rqeuired issi.stance from P e, D and engineers from th- rocoss licensorsunder various process license agreements.
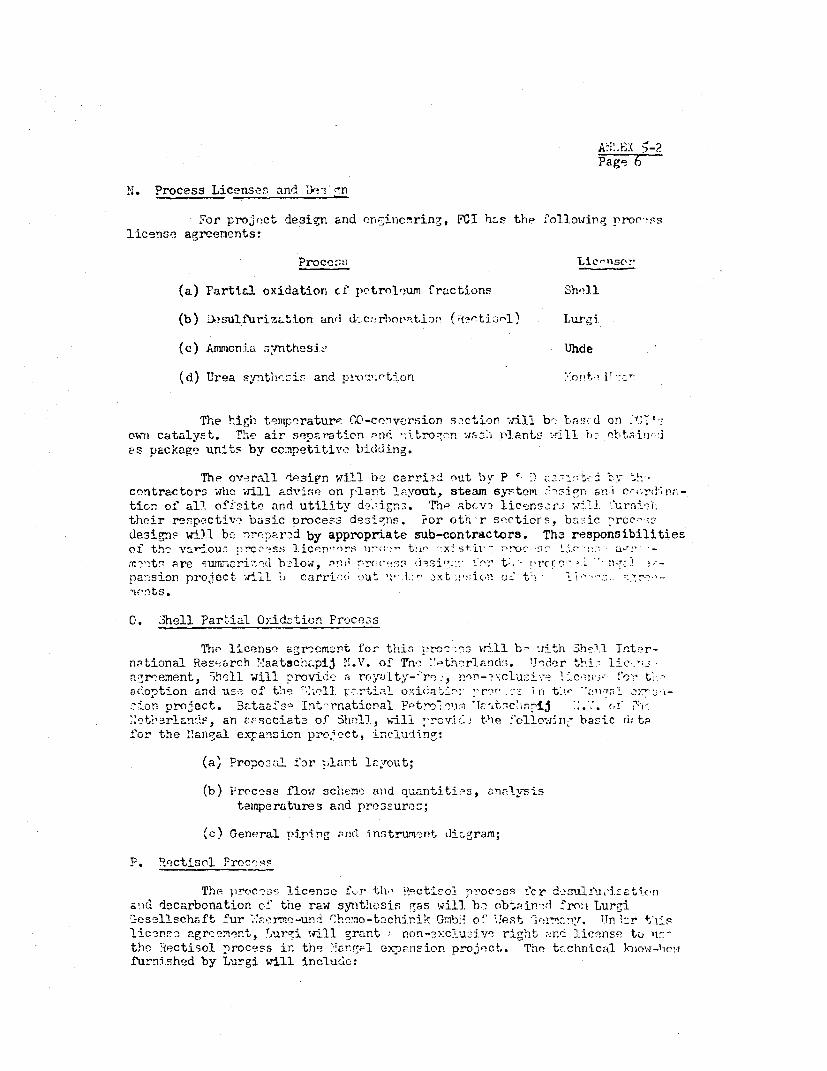
Page 6S
N. Process Licenses and D'e. yn
i4or project design and ernincnring, FCI h.s the followirg pror-sslicense agreements:
Pro cc tic'nso
(a) Partial oxidation cf petroleum fractions Shrll
(b) sulfuriz;tion andl dic:lrbovAt.ior' (;) tiL l) Lurcgi
(c) Arnwonka s,nthesiz Uhde
(d) Urea synthleris and p)!ozwtion '
The higi-h terirpraturF! (CO-conversiCn s2ction w-ill be bas!-d onj'7'roi-m catalyst. The air separaticn qnd .'itro.:n was;_h. ilantS rill r,- ebt<iaFS package units by ccmpetitivo bidding.
The overall design will tbe carriil out by P -- ! a i-; Ihcontractors who will advlise on rlant Uayout, steam system c-ord1N -tion of all offoite and utility d?.ig-,,. Thei abcv- licenscr. w'. 1 1'urnIttheir respectiv-? basic process desians. ror oth-r sectiors! br. ic 'rcr.designs will b:e nrrepar)d by appropriate sub-contractors. Tha responsibilitiesof th^ v_rlou. ;cc-ss licen-ors 1r-.- tie --- 4_ - rros' : -mr".ts -,re surcize b2low, -,nI nrocbxr .i-sa i,:: r t:.:- prcro- pansion project will , carrir;! out n'- r , ŽXt2 !';iCn o t -
0. 3hell Par'ial Oxiddction Process
Tie( license a-gr-cmert for this pro^ -. s will b- with Sh-ell Tnter-n,ntional Res-rch 'Maatschzpij "!.V. of lnhe ''etherlancds. TJeder tlir- lic->a2r-ement, 5ho11 will n-rovi(e a roe :ty-fr non-Žx:clusi-'? 1Ci3 for t'ac.option and us-. of the -;ell ycrtial oM-ic.atŽll l >rn z , t>e :La ci-s on proiect. 3ataafs- Int-rnaticnal Petrol . T1c..c;,-i .'. of CU:t,et>nsrlan -, an -sscciat3 of Shel11, will rcvV> the 4ellow`n,l basic d, ta
for the I16anoal expansicn proiect, includin:
(a) Proposal for .,lart l1,rout;
(b) Process flot- scheme and quantitias, analysistemperatures and prcssures;
(c) General piping -rnd instrum-nt di..gram;
P. RZectisol Proc-ss
The procone7, license fcr tih- Dectico' procoss !'cr dcLsuflii'i:ationaci decarbonation of the raw synthesis rgas will. be obtjin7d fronn Lurg,iC-eselLschaft fur :'.e~rne-un;^i Chc!no-tachinik Gmb:i of 'est n.rsny. ITnlr thislicer'se agreement, T!,uri vill grant non--3xclu$ive- right c;nd 'License to li:-the !vectisol process in the Pargai ex-ppnsion project. The tcchnicl ki)nw-hrlicfurnished by Lurgi will include:
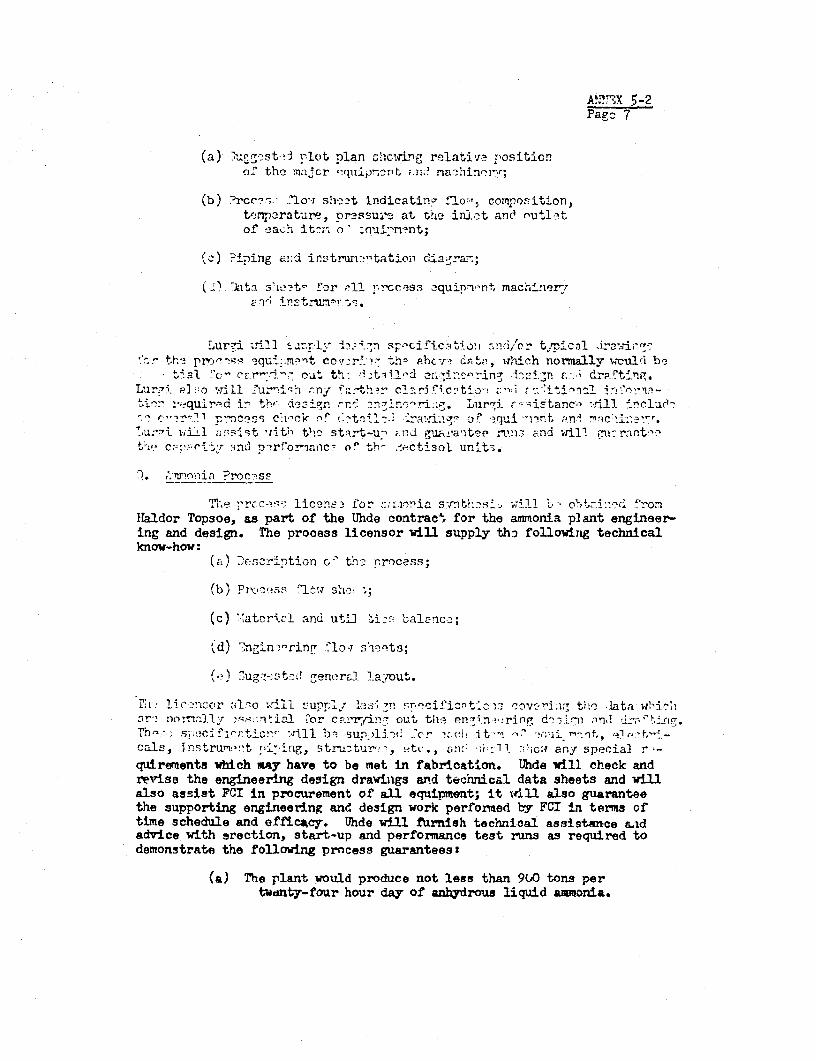
A!TWX 5-2Pago 7
(a) u st plot plan ci.cwing relatjri~ rpositiono . the majcr eq"uipn -. ont r.n,. Tqa.1hiljnj-'r;
(b) rc-? ,. .'lo sh-ayt indicating flo .,, composition,teorn3rature, preFssu;tu at the inl.et anc OUtlgtof each it-,- o -vnui-'rnt;
(o) Fi-ing a!;d instrur1--tatioin d.-a;yra:-;
(~) :i i.t; s'?to for r,1 e-1rcces.s 3qujp-l-nt, mach'nery
buroti;r_1 *-.r~*.n '., scPhc-.- now -,tip o ,tJa istr'cr th'3 mr!,>q 3qui:;!?- "t coy:r' th* ahczj c¢it, which normally wculd! b-
4'a "'c.t c rr-i.:- eit th: ('Atq.11'- ei,n-.orino -*V.'n a-,i draftinr,.Luri,i Pl?o wfll furn'i-h -ny 'ath'r clarri.c:5tj- <:j ,":'ti.9n:l ti.:'ue-
ti-11 1_ :qu-ir-d ir th*- dte-,3 n .rns--ni.^.i:, Lura1 --Cistanc, -..ill ̀ nclurl-o r ?-~C'..l ,resclnk of :t.' :iz of 3q}ui- rint anq l ,?r
'.u; I-iAl a-it 'itlh thlo start-u-' a.i guivantaes rnin3 and will =.i:rant-?c.' - .r mnd rrfornanc- o" th- .;ectisol unit3.
'.,Trvoa Proc : ss
rhe p'r.CcŽ:' licene2 for .:;rvrui sv1th2SL {ri1. ot.i r1 fronzHaldor Topsoe, as part of the Uhde contrae' for the ammonia plant engineer-ing and design. The process licensor will supply ths followirg technicalknow-how:
(a) Descrintion r,' thc r rocass;
(b) Prcv ss 2^lcw sh.7;;
(c) '*atcri.cJ and uti)] Li:s balanc.c;
(d) 2i-n,ntrin!7 flo,y Dhnts;
(e)..u.<st>i eneral l.amuD.
r, lic clr al-.o will supply cosv [rrlcificnt C: vi.:i, the lata whir'tar'~ noi-all-r z-nt ial ?or c.rrfin7 out ths: en-i.n ering d,s->l-n nIm 'in-h _.rm .
cals, jnstrur2'!t >r>ing, structur-, -tt ., anw' .; 11 any special rquirements which iAy have to be met in fabrication. Uhde will check andrevise the engineering design drawisigs an.d tecnnical data sheets and willalso assist FCI in procurement of all equipment; it will also guaranteethe supporting engineering and design work performed by FCI in terms oftime schedule and efficacy. Uhde will furnish tecnnical assistance .adadvice with erection, start-up and performance test runs as required todemonstrate the following process guarantees:
(a) The plant would produce not less than 9(0 tons pertwdnty-four hour day of anhydrous liquid amonia.
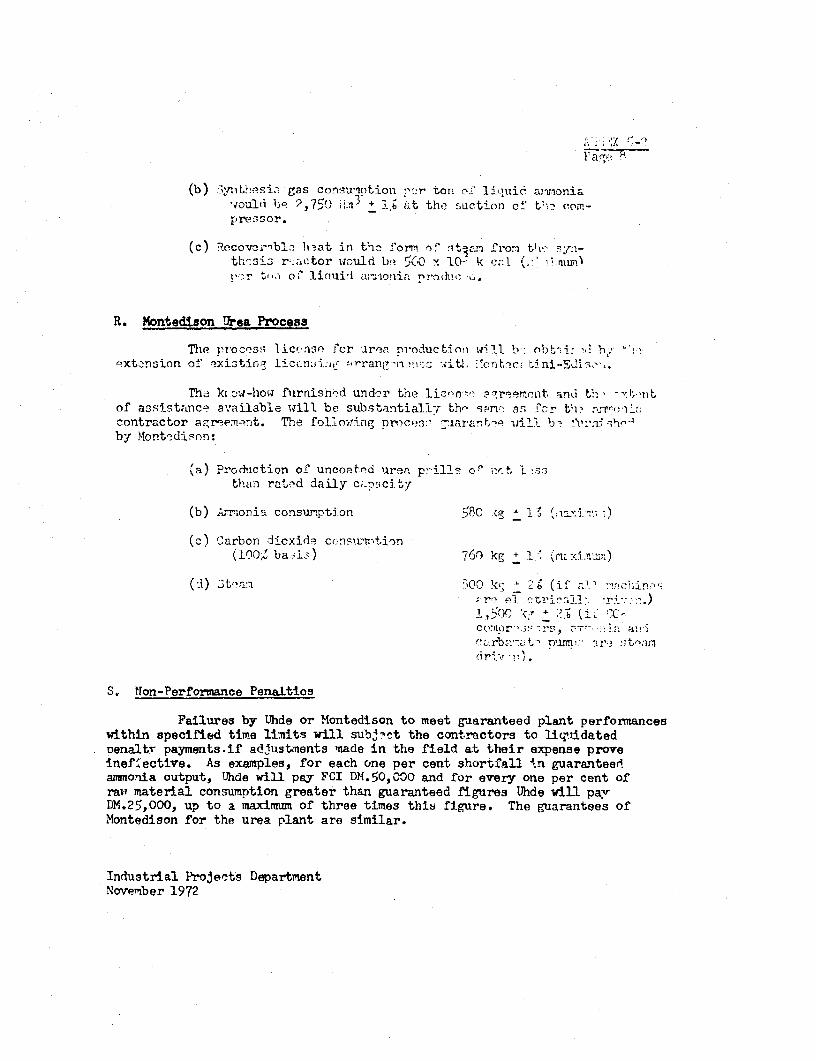
(b) ',ythns-i.) gas consuription nr'cr tori of lioiuic. aivioniaWould ba 2,750 i'il + 1 b at the suction of tl9 com-p res 0 Or.
(c) Recov-ai-bl:> lheat in tho form of List onrol t tv' .F:lrn-
thesis r:actor would l) 5C60 x 10- k e.l (, 41 1AlUO
R. Montedison !Uea Process
The proce9s licoanse cr uroa nproduction will b: obtai:. ' h. 'e?xtonsion of exi3tina liccflil^-w- rrang-nm:;. :itl jonLec: rAni-Edi;@
Tha ki. w-hoa furnisned und^r the li-n-v sr~rermit and th Yl;t..of assistance available wfill be substantially thn sPrpas ol,r th- r-*iL-
contractor agrme,Tnnt. The folloving proce:-- -arant-,o ulil ' '' ' yt;-,An
by Montedison:
(a) Production of uncoat-d arera p-ills or 'or. l tthaii ratOd dai1ly c. p-icity
(b) Arrionia consurmption 5go .g 0 1 z l t
(c) a'arbon dioxide consimrition(1O;J, ba-i.3) 760 kg + I rvXin".:)
(i1) St"aa iOO 2" 0' (i f? -c.J.i '',
1 1500 . O t C-
cusnorMa.t n?m.t ~t.:
S. Mfon-Performance Penalties
Failures by Uhde or Montedison to meet guaranteed plant performanceswithin specified time liiits will sub-4--t the contractors to liqtidatedoenaltr payments.if adiustments made in the field at their expense proveinef'ective. As examples, for each one per cent shortfall tn guaranteed.ammonia output, Uhde will pay FCI DM.50,COO and for every one per cent ofravr material consumption greater than guaranteed figures Uhde wiLl pavDM.25,OOO, up to a maximum of three times thii figure. The guarantees ofMontedison for the urea plant are similar.
Industrial Projects DepartmentNovember 1972

FCI: NANMGAI. F:iTILIZz;R KiOJECT
4:NNGAL EXPANSION PROJECT
CAPITAL cSor hSTIMnTtS(In Millions of Rupees)
Finanmi2l Economic
Local Foreign rotal 1.oc al Foreign Total
Equipment, supplies, bpare Parts 31 293 324 31 293 324Freight and Handling 9 17 26 S' 17 26Duty and Taxes 95 - 95 - - -License Fees - 12 12 - 12 12Engineering Design, Pro,iect Management- 43 16 59 37 16 53Erection anr Commissiconang 33 1 47 33 14 47civil Works•!/ 37 - 7 29 - 29
Sub-Total 214 352 600 129 352 49T
Additional- Working Capital 16 - 16 16 - 16
Contingency 26 32 58 16 32 48al,talation ?26 32 58 16 32 19
Total Project Cost 316 416 732 187 416 603
lnte-sL Daring Construction2' 37 - 37 12 25 37
Total Financing Required 3•3 h16 769 199 _ .hi 640
Equivalent US$ 49 57 106 27 61 88
1/ For economic al',ernatives Xs6 mi;'.ion Indian taxes were excluded.2/ For economic alternatives 40% of civil works costs assumed to be unskilled labor shadow-priced at,
50% of nominal wages,3/ Figures for economic alternatives are based on an interest rate of 10% o;i long-term
assumed cost of capital
Inoustrial Projects DepartmentNTovember 1972
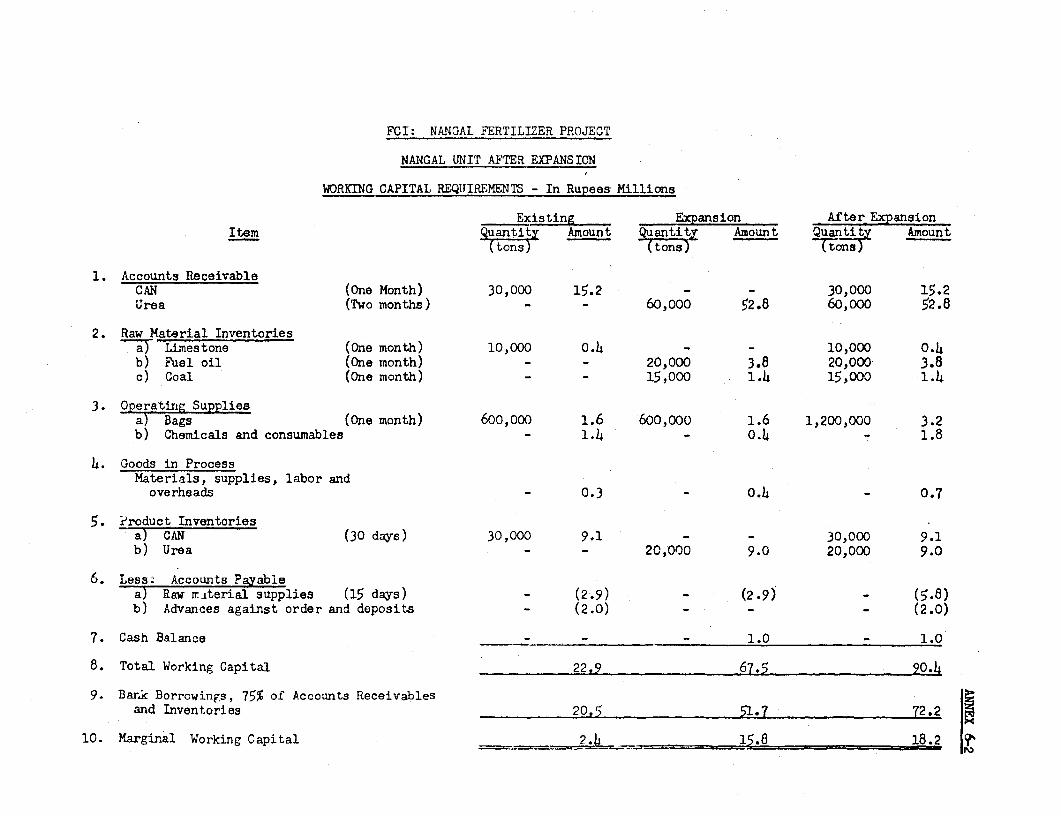
FCI: NANGAL FERTILIZER PROJECT
NANGAL UNIT AFTER EXPANSION
WORKING CAPITAL REQUIREMENTS - In Rupees Millions
Existing ___XPansion After ExpansionItem (ton s Amount Quantity Amount Amount
(tons) (tons) tonsT
1. Accounts ReceivableCAN (One Month) 30,000 15.2 - - 30,000 15.2Urea (Two months) - - 60,000 52.8 60,000 52.8
2. Raw Material InventoriesaT Limestone (One month) 10,000 0.4 - - 10,000 0.4b) Fuel oil (One month) - - 20,000 3.8 20,000 3.8c) Coal (One month) - - 15,000 1.4 15,000 1.4
3. Operatirm Suppliesa) Bags (One month) 600,000 1.6 600,000 1.6 1,200,000 3.2b) Chemicals and consumables - 1.4 - 0.4 - 1.8
4. Goods in ProcessMaterials, supplies, labor and
overheads - 0.3 - 0.4 - 0.7
5. ?roduct Inventoriesa) CAN (30 days) 30,000 9.1 - - 30,000 9.1b) Urea - - 20,000 9.0 20,000 9.0
6. Less. Accounts Payablea) Raw r.iterial supplies (15 days) - (2.9) _ (2-9) _ (5-8)b) Advances against order and deposits - (2.0) -_ (2.0)
7. Cash Balance - - 1.0 - 1.0
8. Total Working Capital 22.9 _ 67.5 90.4
9. Bank Borrowings, 75% of Accounts Receivablesand Inventories 20.5 51.7 72.2
10. Marginal Working Capital l1.8 18.2

ANNEX 6-3
Projected Disbursement of IDA Credit
LoanDisbursement Outstandtnz Undisbursed
(in !TS$ Million)
IDA Fiscal Year
1973
Oct. - Dec. 0 - 58.0
Jan. - March 0.5 0.5 57.5
April - June 1.0 1.5 56.5
July - Sept. 2.0 3.5 54l5
Oct. - Dec 4.o 7.5 50.5
Jan. - March 4.5 12.0 46.oApril - June 4&.5 16.5 41.5
1975
July - Sept. 9.0 25.5 32.5Oct. - Dec. 17.0 42.5 15.5
Jan. - March 9.0 5L.5 6.5April - June 2.0 53.5 4.5
1976
July - Sept. 2.0 55.5 2.5Oct. - Dec. 1.5 57.0 1.0
Jan. - March o.5 57.5 0.5April - June 0.5 58.0 0
Industrial ProJects DepartmentNovember 1972

FCINANGAL EXPANSION PROJECTIMPLEMENTATION SCHEDULE
1973 1974 1975 1976
_3 F MA M J J3 A S1 ON 0C3 F M A M A S O N D J F M J A SOND J F M A M J
PROCESS ENGINEERING IDETAILED ENG3INEERING I E g EEf C1I
EQUIPMENT AND METERIALI B I fPROCUREMENT
EQUIPMENT AND METERIALS Eli
DELIVERY I
EQUIPMENT ERECTION we It. :§ 3 U
TESTING AND START-UP O H01
STABILIZATION AI:D GUARANTEE c j - 11RUNS
fndustrI.t Pro;j;t DegsO.,nK eWWid 8..Ek4.7f2rn,,..bw 1972

FCI: !1ANGAL FERTILIZER PRtJECT AJNLX 8-:Page 1
WAIGAL 'VITTRevenues and Cperating Costs Comparison-/
Before and After Expansion Project
Modified CombinedExisting Existing Expansion3/ AfterFacilities FacilitiesZ/ Project Exnansion
A B C B + C
Mill. Rs/t. Mill. Rs/t. Mill. Rs/t. mih. Rs/t.Rs/Yr. of _ Rs/Yr. of N Rs/Yr. ofr i Rs/Yr. of;,
Production (intor3 of I1) 56,000 - 72,000 - 137,00) - 209,COO _
SalesUrea - - 229 1,672 229 1,6724/CAN 100 1,785 128 1,778 - - 128 1,778Z/Heavy WatenW 6 107
106 1,892 128 1,778 229 1,672 357 1,708Costs of Goods SoldFuel Oil - - 14 194 26 190 hO 191Other Raw Materials 7 125 12 167 16 117 28 134Rpags 11 196 15 208 1!- >) 3u 144
18 321 41 569 5'7 Lln 98 !69, pnrnting :xrn_qns
Power 28 5L0 5 69 13 I8Salaries 18 321 18 250 3 22 21 100Freight and iandling 5 89 6 83 6 4i! 12 57Iraintenance lu 178 7 97 i' o20 9Depreciation 4 72 15 208 9 13 04 306Others 2 31 1 86
67 1,196 53 735 100 731 753 731
Operating Profit 21 375 34 471 72 527O 1., -OInterest - - 4 56 1,i 1C9 19 '1
Net Income BeforeTaxes 21 375 30 h18 ' 187 _ 7 17
i1et Income BeforeTaxes as / of Sales 20 23 25 2h
1/ Based on average revenues and expenses at 90% of capacity and 1972 Uricesi2/ After replacement of electrolysis and proportional allocation of costs from
expansion project.3/ Incremental costs for expansion project after allocation a portion of synthes:3
gas co3ts to modified existing facilities.L/ in terms of N of respective type of fertilizer produced about 6~, hif er revenues
for CAN as compared to urea (per ton of N) are offset by higher prodact2'on,handling and transportation costs for CAN.
5/ Heavy water production will be phased out with replacemont of electrolysissection.
Industrial Projects DepartmentNovember 1972
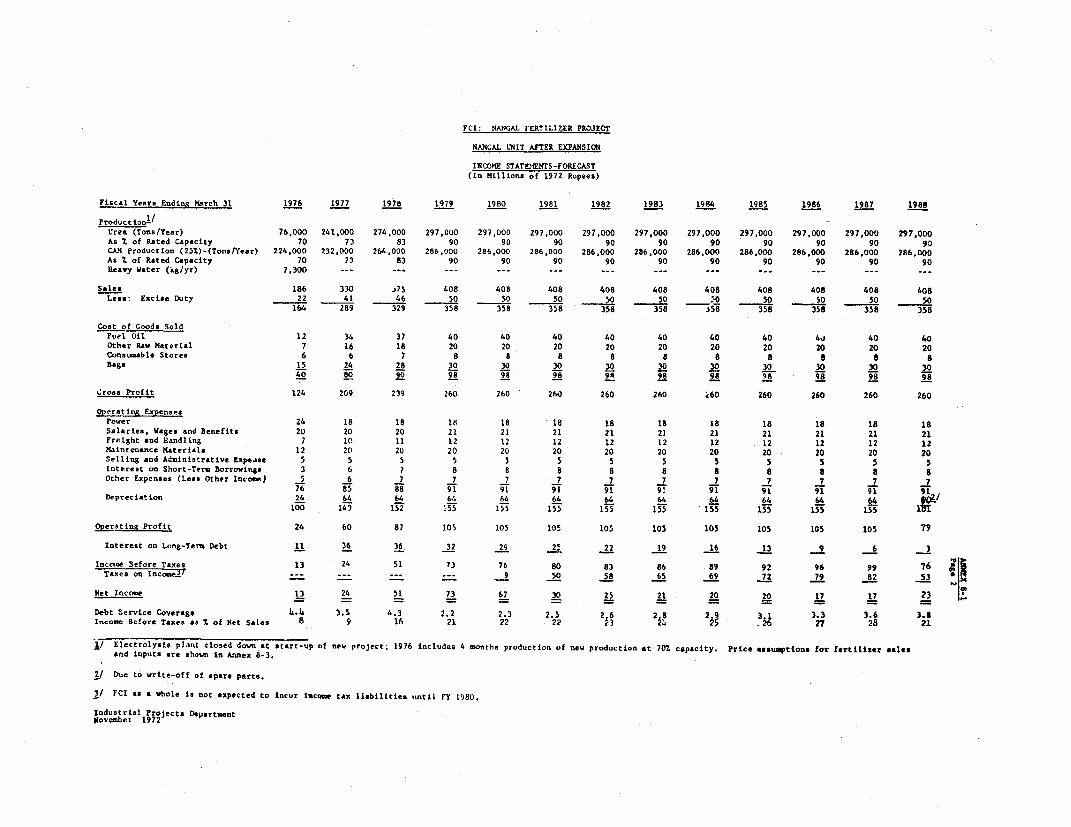
FCI NIANGAL FERTILIZER PROJECT
NANCAL UNIT AFTER EXPANSION
INCOME STATEMENTS-FORECAST(In Killions of 1972 Rupees)
Fiscal Years Ending March 31 1976 1977 1978 1979 1980 1981 1982 1983 1984 1985 1986 1987 1988
Product ionilUrea (Tons/Year) 76,000 241,000 274,000 297,000 297,000 297,000 297,000 297,000 297,000 297,000 297,000 297,000 297,000
As , of Rated Capacity 70 73 83 90 90 90 90 90 90 90 90 90 90
CAN Production (257.)-(Toss/Year) 224,000 232,000 264,000 286,000 286,000 286,000 286,000 286,000 286,000 286,000 286,000 286,000 286.000
As 7 of Rsted Capacity 70 73 83 90 90 90 90 90 90 90 90 90 90
lleavy Water (kg/yr) 7,300 --- -- --
Sales 186 330 .75 408 408 408 408 408 408 408 408 408 408
Lese: Excise Duty 22 41 46 50 50 50 5 50 0 50 SO 50 50
164 289 329 358 358 358 358 358 358 358 358 358 358
Cost of Goods SoldFuel Oil 12 34 37 40 40 40 40 40 40 40 4si 40 40
Other Raw Material 7 16 18 20 20 20 20 20 20 20 20 20 20
Consuabe Stores 6 6 7 8 8 8 8 8 8 8 8 8 8
Bags 15 24 28 30 30 30 30 30 30 30 30 30 30
40 80 90 98 98 98 998 98 9S 98 98 98
Cross Profit 124 209 239 260 260 260 260 260 Z60 260 260 260 260
Operating ExpensesPower 24 18 18 1H 18 18 1 18 18 18 18 18 18Salaries, Wages and benefits 20 20 20 21 21 21 21 21 21 21 21 21 21
Freight and Handling 7 10 11 12 12 12 12 12 12 12 12 12 12
Maintenance Materials 12 20 20 20 20 20 20 20 20 20 20 20 20
Selling and Administrative Expease 5 5 5 5 5 5 5 5 5 5 5 5 5
Interest on Short-Term borrowings 3 6 7 8 8 8 8 8 8 8 8 8 8
Other Expenses (Less Other Income) 5 6 7 7 7 7 7 7 7 7 7 7 7
76 85 88 91 91 91 91 9! 91 91 91 91 91
Depreciation 24 64 64 646 64 64 64 64 64 64, /
100 149 152 155 155 155 155 155 155 155 155 155 1=
Operatine Profit 24 60 87 105 105 105 105 105 105 105 105 105 79
Interest on Long-Term Debt 11 36 36. 32 29 2' 22 19 16 13 9 6 3
Income 3efore Taxes 13 24 51 73 76 80 83 86 89 92 96 99 76Taxes on Inc;;UT 92 ~~~~~~__ _ 96 8265
Taxes on Incon _--- - 9 50 58 65 69 72 79 82 53
Net Incoc 13 24 51 73 67 30 25 21 20 20 17 17 23
Debt Service Coverage hIa. 3.5 4.3 2.2 2.3 2.5 2.6 2 8 2.9 3.1 3.3 3.6 3,6
Income Before Taxes as . of Net Salas 8 9 16 21 22 22 23 K 2 20 27 28 21
1/ Electrolysis plant closed down at start-up of new project; 1976 includes 4 months production of new production at 707 capacity. Price assumtions for fertilizer salesand inputs are shown in Annex 8-3.
2/ Due to write-off of spare parts.
3/ FCI as a whole is not expected to incur iacome tax liabilities until FY 1980.
Industrial Projects Departmentlovembei 1972
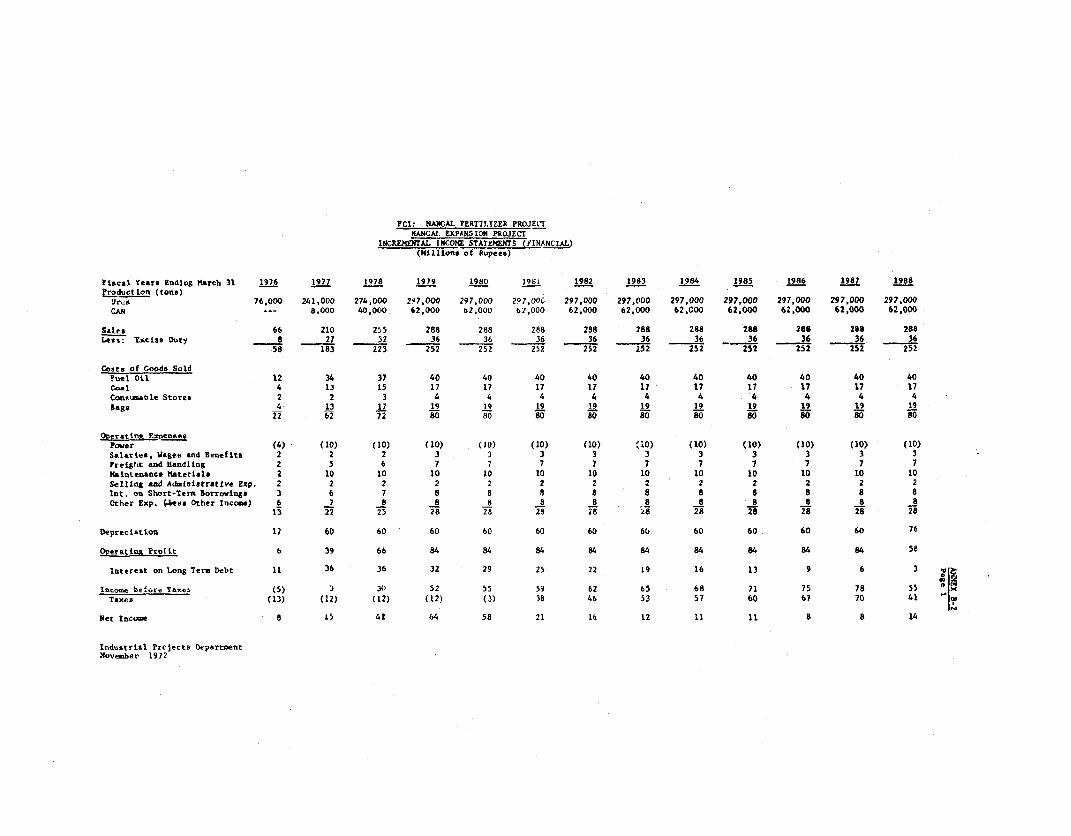
PCI: NANCAI FERTILIZER PROJEtTMANCAI. EXPANS IO1 PROJECT
INCRD_ AL 9 KCOlZ STATEwrUS (FINANCIL4L(Millions of Rupees)
Fiscal Years Ending Karch 31 1976 1977 1978 1979 1980 1981 1982 1983 1984 1985 1986 1987 1988Product ion (tons)Ur,a 76,000 241,000 274,000 287,000 297,000 2e7,OOC 297,000 297,000 297,000 297,000 297,000 297,000 297,000CAN --- 8,000 40,000 62,000 62,000 62,000 62,000 62,000 62,000 62,000 62,000 62,000 62,000
Salts 66 210 2~5 288 288 288 288 288 288 2S8 268 288 288Less: Excise Duty 8 27 32 36 36 36 36 36 36 - 36 36 36 36.58 183 223 252 252 252 252 252 252 252 252 252 252
Costs of Goods SoldFuel Oil 12 34 37 40 40 40 40 40 40 40 40 40 40Coal 4 13 15 17 17 17 17 17 17 17 17 17 17Consuma.0le Stores 2 2 3 4 4 4 4 4 4 4 4 4 4Sags 4 13 17 19 19 19 19 19 19 19 M9 19 1922 62 72 80 8o 80 80 80 80 80 80 80 80
Operating ExpenesPower (4) (10) (10) (10) (10) (10) (10) 'iO) (10) (10) (10) (10) (10)Salartes, Vases and Benefits 2 2 2 3 3 3 3 3 3 3 3 3 3Freight and Handling 2 5 6 7 7 7 7 7 7 7 7 7 7Kaintenance Materials 2 10 10 10 10 10 10 10 10 10 10 10 10SellIog and Ad.inistratfve Exp. 2 2 2 2 2 2 2 2 2 2 2 2 2lnt. on Short-Term lorrovings 3 6 7 8 8 8 a 8 8 8 8 8 8Other Exp. eAss Other incae) 6 7 8 8 8 8 8 8 8 8 8 8 a13 22 25 28 28 28 28 28 28 28 28 28 28
Depreciation 17 60 60 60 60 60 60 6U 60 60 60 60 76
Operating Profit 6 39 66 84 84 84 84 84 84 84 84 84 58
interest on Long Term Debt 11 36 36 32 29 25 22 19 16 13 9 6 3
In.one before Ta-e (5) J 30 52 55 59 62 65 68 71 75 78 55Taxes (13) (12) (12) (12) (3) 38 46 53 57 60 67 70 41Net Income 8 I5 42 64 58 21 16 12 Sl 11 8 8 14
Industrial Projects Department2lovember 1972

ANNX 8-Page 2
FCI: NANGAL FERTILIZER PROJECT
NANGAL EXPANSION PROJECT
INCREMENTAL ANNUAL REVENUES AND COSTS-"
Financial EconomicRs/Ton of Million Rs/Ton of Million
N Rs/Yr N Rs/Yr
Production in Terms of N (Tons/Year) 152,120 152,120
Sales (Less Excise Duty) 1,658 252 1,250 190
Costs of Goods SoldFuel Oil 263 0o 263 h0Coal 112 17 112 17Consumable Stores 26 26 4Bags 125 19 79 1J
526 80 480 73
G,ross Profit. 1,132 172 770 117
CDerating Expenses'ower (66) (10) (520) (79)
Sala:ies, Wages & Benefits 20 3 20 3Freight & Handling 46 7 h6 7Maintenance Materials 72 11 59 9Selling & Administrative Expenses 13 2 13 2.nterest on Short-Term Borrowings 53 8 53 8Depreciation 408 62 316 48?ther Expenses 53 8 46 7
599 91 33 5
Cynerating Profit 533 81 737 112
Interest on Long-Term Debtd/ 125 19 118 18
Net Income Before Taxes 1408 62 619 94
1/ Based on average revenueo and expenses at. 90% of capacity and 1972 prices.See Annex 8-3 for description of differences between financial and economic figures.
2/ 9'icures for Economic Alternatives are based on an interest rate of 10% representingassumed cost of capital.
Industrial Projects Department
Novemnber 1972
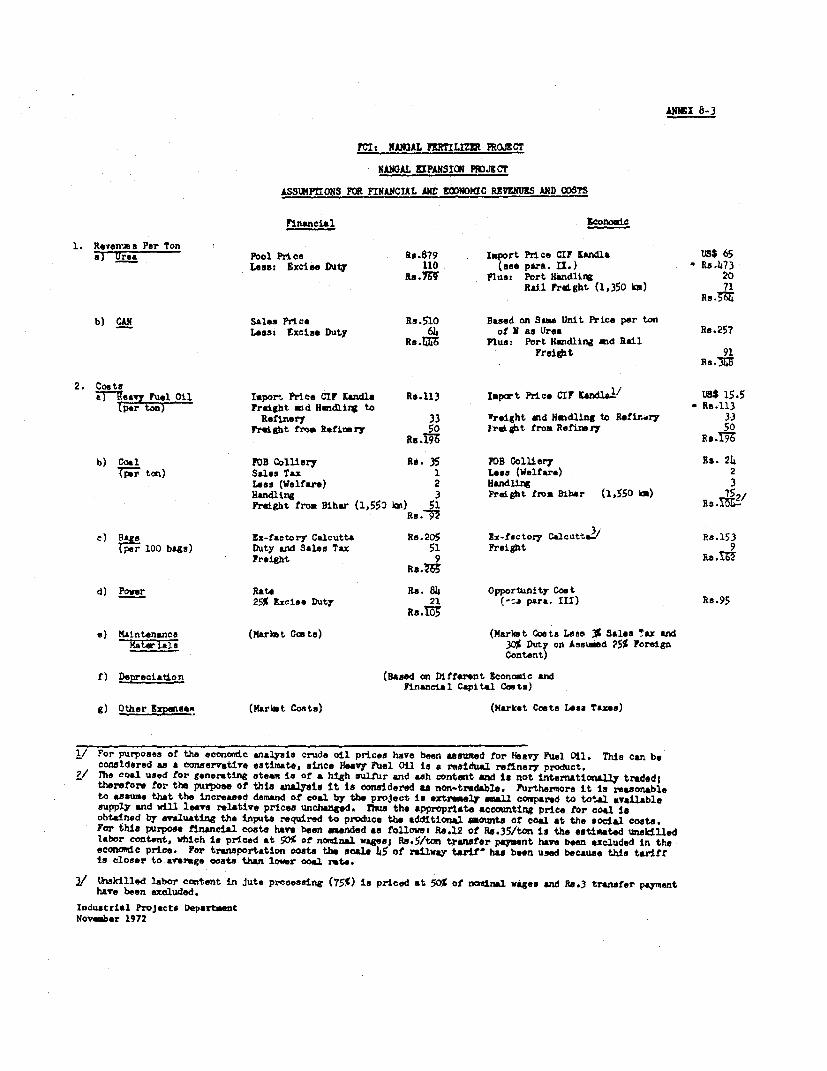
ANNX 8-3
FCI: NANOAL JER5TLIZU PROJECT
NANGAL EIPANSION PROJECT
ASSUMPTIONS FPR FINANCIAL ANM E)WNOMIC REVENUES AND CSTS
Financial Economic
1. Revenes Per ?ona) Ursa Pool Price Rs.879 Import, Price CIF Kandla US$ 65
Lees: Excise Duty 110 (see para. U.) Rs.1473Rs.79 Plus: Port Handling 20
RaS1 Freight (1,350 kb) 71
b) CAN Sales Price R.5o10 Based on Sam Unit Price per tonLes3 Excise Duty 64 of Y as Urea Rs.257
Rs.LJ6 Plus: Port Handling and RailFreight 91
2. Coats7ZRTeavy ru;l Oil Iuport Price CIF Kandla Rs.113 Import Price CIF Candlei/ USs 15.5
Freight aid Handlig to - Rs.113Refinery 33 'reight and Hoidling to Refirzry 33
Freight fros Ref1oary 50 Preight from Refinery
b) Coal FOB Colliery Re. 35 FOB Colliery R3. 2 4ape-r ton) Sales Tax 1 Lees (Welfare) 2
Less (Welfare) 2 Handling 3Handling 3 Freight from Bibar (1,550 km) 752/Freight from Bihar (1,550 kin) 51 R o
Rs 92
s 1 b Ex-faetory Calcutta Rs.205 Ex-factory Calcutt 2 / Rs 153r100 bgs) Dty and Sales Tax 51 Freight 9
Freight 9 ROMRs.M
d) Power Rate Re. 84 Opportunity Cost25% Excise Duty 21 (-ca para. III) Rs.95
a) Maintenance (Harlot Costs) (market Coats Less 3% Sales ax andMater ali 30% Dut on Assemd 25% Foreign
Content)
f) Depreciation (Based on Different Economic andFinancial Capital Coats)
g) Other xmaeea (Harint Costs) (MaLrket Costs Less Taxes)
1/ For purposes of the econoadc analysis crude oil prices have been aasumed for Heavy Fuel 011. This can beconsidered as a conservative estimate, since Heavy Fuel Oil is a residual refinery product.
2/ The coal used for generating ateam is of a high sulfur and ash content and is not inteznationally traded;therefore for the purpoae of this analysis it ts ooneidered as non-tradable. Furthemore it is reasonableto asaume that the increased demand of coal by the project is extremely, smal compared to total availablesupply and will leave relative pricest unchanged. Thus the appropriate accounting price for coal toobtained by evaluating the inputa required to produce the additional anoumts of coal at the soceal costs.For this purpoee financial coats have been asended as followst Rs.l2 of Rs.35/ton is the estimated unskilledlabor content, which is priced at 50% of notdnal vages; Rs.5/ton transfer pqyent have been excluded In theeconowie price, For trwnsportation oosta the scale 45 of railway tarifr has been used because this tariffis closer to average ooats than lower ooal rate.
/ thekilled labor content in Jute precessing (75%) is priced at 50% of nawinml wages and RJ.3 transfer paymenthave been excluded.
Industrial Projects DepartmentNovember 1972
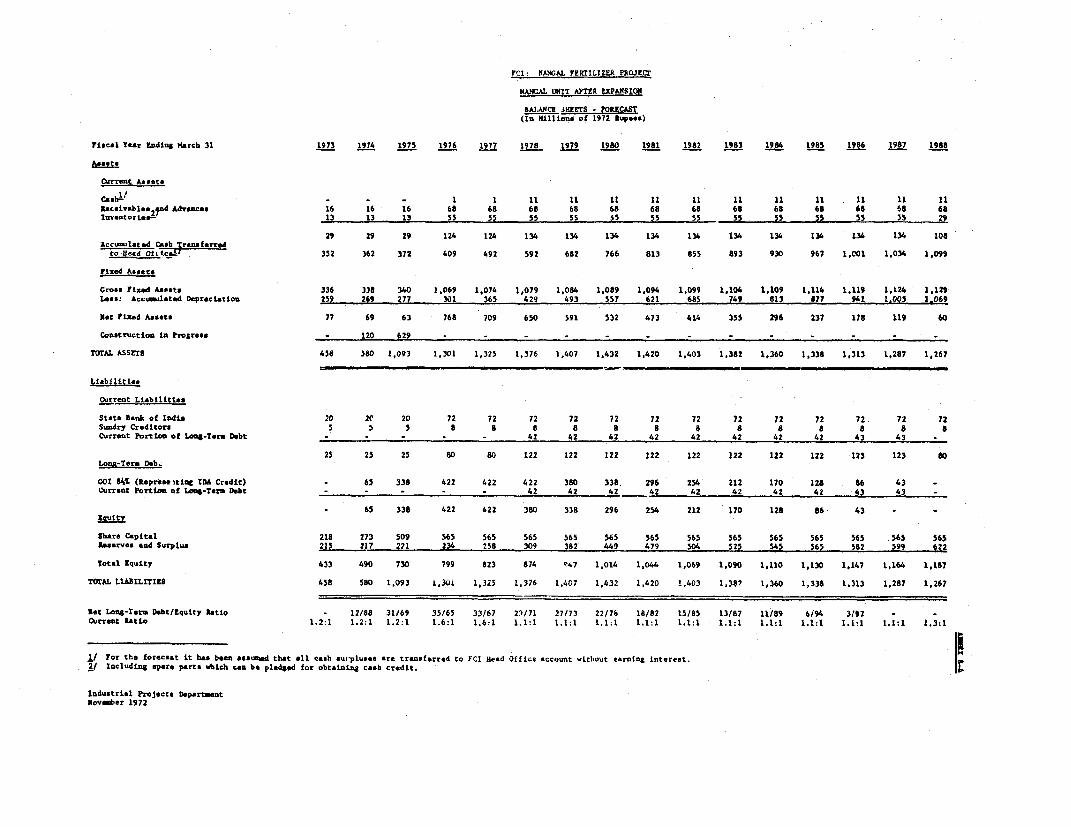
FCI: NAIGAIL FERTILIZER PROJECr
KANCAL UNIT AFTER EXPAN1SION
2AIMA4CE MiFErS * FORECAST(In Killion, of 1972 Rupees)
Fiscal Y"r Ending March 31 1973 1974 1975 1976 1977 1978 1979 1980 1981 1982 1983 1984 1985 1986 1987 1938
Assets
Ourrent As Jts
Cashlz . I I it 11 it it 11 11 11 11 11 11 11
Rsceivabls 2 nd A -ancs 16 16 16 68 68 68 68 68 68 68 68 68 68 68 68 68
Inventories- 13 13 - 13 55 55 55 55 i5 55 55 55 55 55 SS 55 29
29 29 29 124 124 134 134 134 134 134 134 134 134 134 134 108
Accumlatesd Cab Trans ferredto Head Otjtce4! 352 362 372 409 492 592 682 766 813 855 893 930 967 I.COI 1,034 1.099
Fixed Assets
Gross tLied Assets 336 338 340 1.069 1,074 1,079 1,084 1,089 1,094 1,099 1.104 1.109 1,114 1,1.9 1,124 1,129
Loss: Accumulatd Depreciation 259 269 277 301 365 429 493 557 621 685 749 813 877 941 1.005 1.069
Not Fixed AssetS 77 69 63 768 709 650 591 532 473 414 355 296 237 178 119 60
Construction in Progrze 120 629
TOTAL ASSETS 458 580 1,093 1,301 1,325 1,576 1,407 1.432 1.420 1,403 1,382 1,360 1,338 1,313 1,287 1,267
Liabilities
Current Liabilitiss
Stata lank of India 20 20 20 72 72 72 72 72 72 72 72 72 72 72 72 72
Sundry Creditors 5 5 5 8 8 a 8 a 8 a 8 8 8 8 8 8
Current Portion of Lomn-Ters Debt - - 42 42 42 42 42 42 42 42 43 43
25 25 25 80 80 122 122 122 122 122 122 122 122 123 123 80
Loni-Tor. Deb.
G00 8SA (lepres"tine IDA Credit) * 65 338 422 422 422 380 338. 296 254 212 170 128 86 43 -
Current Portion of Long-Tsr. Debt - 42 42 42 _42 42 42 42 42 43 43 -
- uity 65 338 422 422 380 338 296 254 212 170 128 86 43 *
Share Capital 218 273 509 565 565 565 565 565 565 565 565 565 565 565 565 565
leservs end Surplus 215 217 221 234 258 309 382 449 479 504 525 545 565 582 599 622
Total Equity 433 490 730 799 823 874 "47 1,014 1,044 1,069 1,090 1,110 1,130 1,147 1,164 1,187
TOTAL .LABILTTIES 458 580 1,093 1,301 1,325 1,376 1,407 1,432 1,420 1.403 1,382 1,360 1.338 1.313 1,287 1,267
Net Long-Ter. Debt/Equity Ratio - 12/88 31/69 35/65 33/67 23/71 27/73 22/78 18/82 15/85 13/87 11/89 6/94 3/97 -
Current Ratio 1.2:1 1.2:1 1.2:1 1.6:1 1.6:1 1.1:1 1.1:1 1.1;1 1.1:1 1.1:1 1.1:1 1.1:1 1.1:1 1.1:1 1.1:1 f.3:1
1/ For the forecast it has been *ssus d that all cash su-pluses are tramsferred to FCI Head Office account utihout eftrning interest. e
/ including spare parts ubich can be pledged for obtaining cash credit.
industrial Projects DepartntNovember 1972
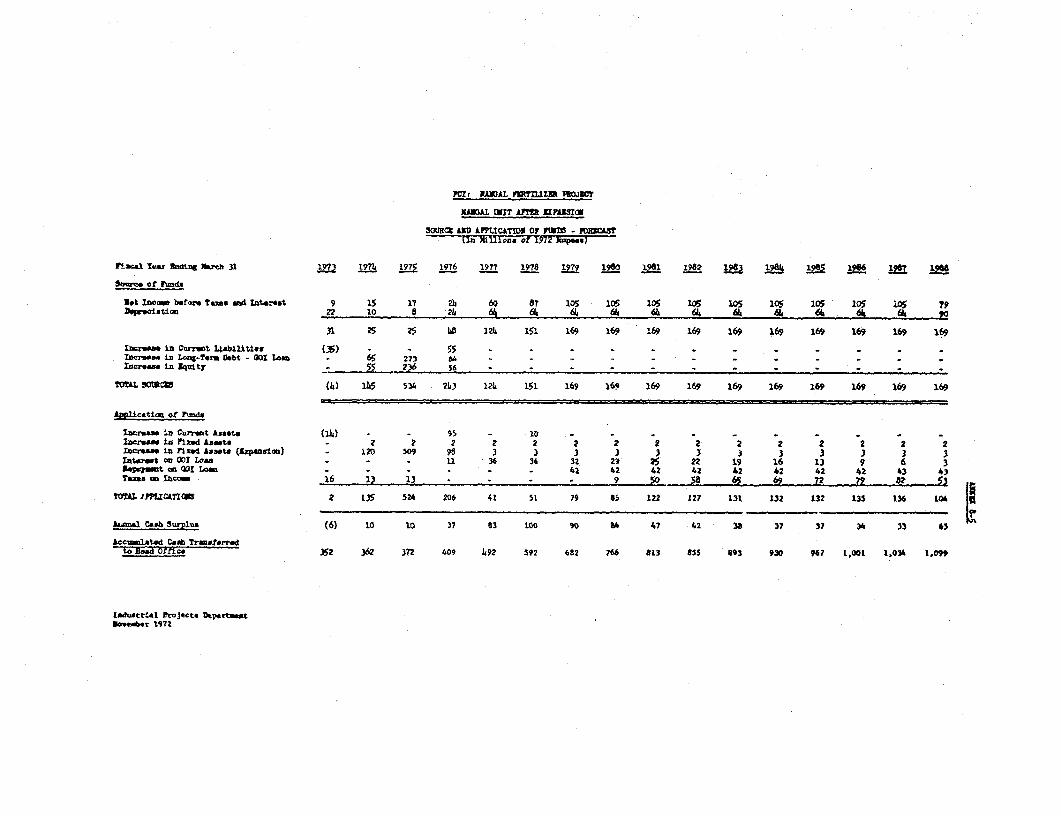
Ci r ANAL PTflLZR 1T0JM7
IUADAL MIT A7T gnXsrE
SOCR UM AP9LIC&1DO OP YIB - R)cMS?til MITong er 1V72 i2".)
r?s.al s as" farebS, 31 1973 197 175 1976 1977 19 78 179 190 1981 p1S2 3 2 L9% 1S 8 0B
Sowree of Fun.ds
Not lsco before tes au d 1te-st 9 15 17 2 8 69 8o 105 105 105 1oS 105 105 105 105 105 79Deciation 22 10 8 ?4 61 6k 6, 6k 61s 4 6 d51 - 6k 6k 61 61 0
31 25 b 4,6 1216 151 169 169 169 169 169 169 16 169 169 169
Imr.a. in Cerzt LiabiitIes (35) - - 55 Inerse. iA Lon-T.,u Debt - 001 La - 65 273 4 - -Ineras in Squity 55 236 56 - - - -
TOML S=Cx (4) 145 534 243 121, 151 169 169 169 169 169 169 169 169 169 169
Appicatin of Ykmdm
Sear . in Curruzt Assets (1J) - 95 - 10 - _- -_ . .Iner.a in it.d Assets - 2 2 2 2 2 2 2 2 2 2 2 2 2 2Dvs .1 nF d A.sst (Lxanut.ia) - 120 509 98 3 3 3 1 3 3 3 3 3 3 3 3
uterl"t n 00I L_an 11 - 36 36 32 29 25 22 19 16 13 9 6 3rmt an WI Lo _ _ _ . - - 42 442 42 412 2 42 42 42 43 43
Tans aw ar 16 1) 13 - - - 9 50 58 65 69 72 79 a2 53
TOA J.PCA2TIW 2 135 524 206 41 51 79 85 122 127 131 132 132 3 t36 104
kAeel CbS SurP1 (6) 10 10 37 43 t00 90 84 47 42 38 37 37 34 33 63
Acct1atod Cansh Trmf.rrvdto Bead Office -352 362 372 409 492 592 682 766 813 855 693 930 967 1,00t 1.034 1.0"
lOdWte.Ar lroject. D.ptrtmtUnvere 1972
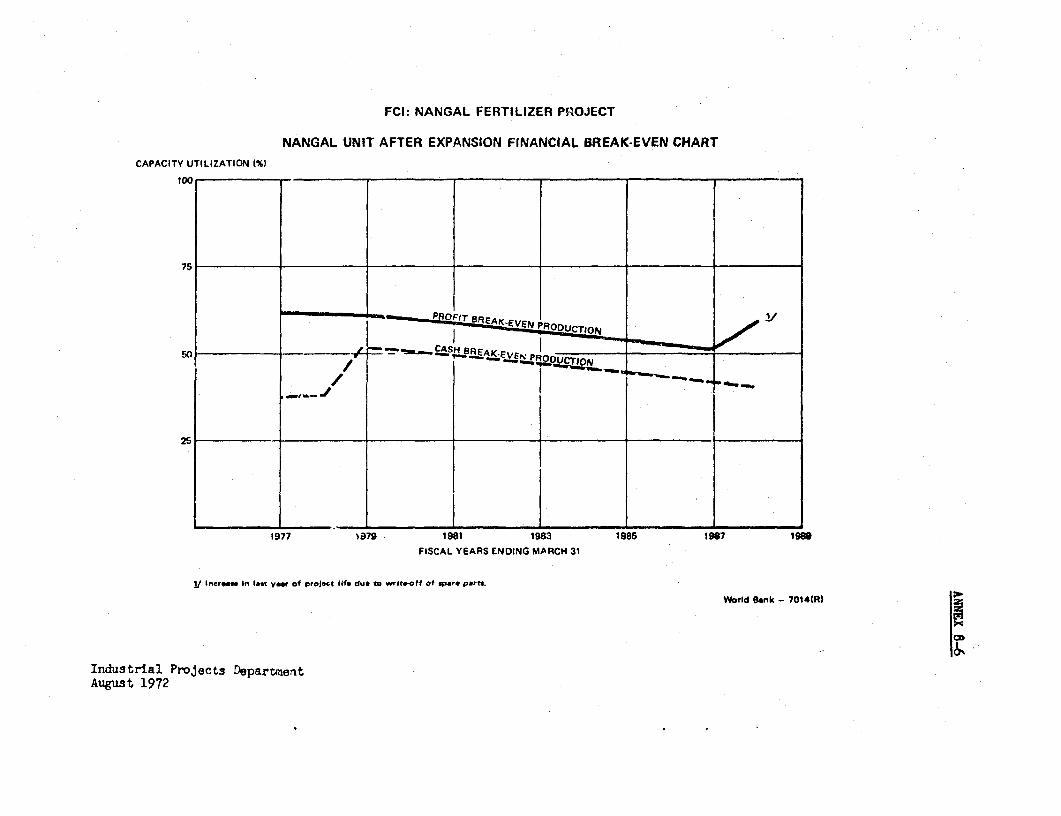
FCI: NANGAL FERTILIZER PROJECT
NANGAL UNIT AFTER EXPANSION FINANCIAL BREAK-EVEN CHART
CAPACITY UTILIZATION l%}
10 1
75
so 1 *. , / >S8REAK-tEN PDX
1977 )979 1981 1983 1985 1987 1989
FISCAL YEARS ENDING MARCH 31
1/ Increae In lost vow of project lif du* to writeoff of spare Parts.
World Bank - 7014(RI
Industrial Projects DepartmentAugust 1972
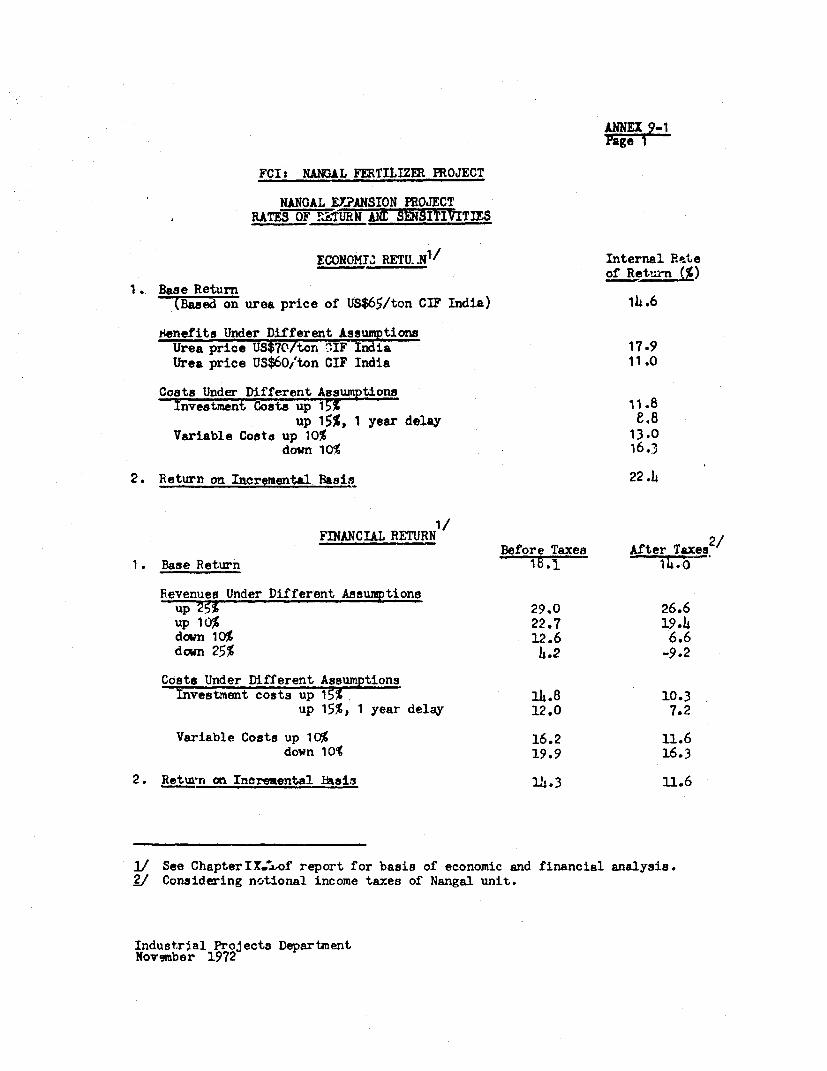
ANNEX 9-t1page I
FCI: NANGAL FERTILIZER PROJECT
NANGAL EY2ANSION PROJECTRATES 0 IURv`E ! TIES
ECONOMTW RETU..N1/ Internal Reteof Return (r%)
1. Base Return(Based on urea price of US$65/ton CIF India) 14.6
$enefits Under Different AssumptionsUrea price US$70/ton C.IF India 17.9Urea price US$60/ton CIF India 11.0
Costs Under Different ABumptionsInvestment Costs up 15% 11.8
up 15%, 1 year delay e.MVariable Costa up 10% 13.0
down 10% 16.3
2. Return on Incremental Basis 22.4
1/FINANCTAL RITURN 21
FINANCIAL RETURN Before Taxes After Taxes1. Base Return 1 t. 14.T
Revenues Under Different Assumptionsup 25% 29.0 26.6up 10% 22.7 19.4down 10% 12.6 6.6down 25% 4.2 -9.2
Costs Under Different AssumptionsInvestment costs up 15%. 14.8 10.3
up 15%, 1 year delay 12.0 7.2
Variable Costs up 10% 16.2 11.6down 10% 19.9 16.3
2. Return an Incremental Basig l4.3 li.6
I! See ChapterIX4:of report for basis of economic and financial analysis.2/ Considering notional income taxes of Nangal unit.
Industrial Projects DepartmentNov,imber 1972
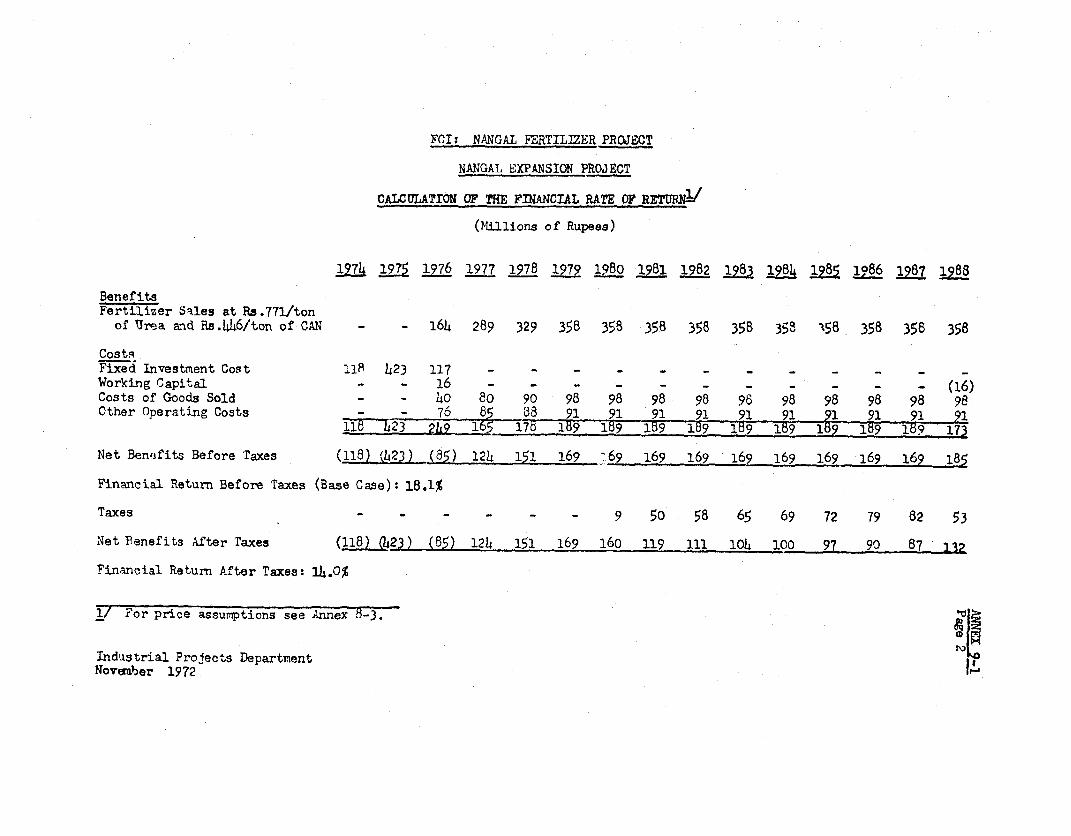
FOI: NANGAL FERTILIZER PROJECT
NANGAL EXPANSION PROJECT
CALCULATION OF THE FINANCIAL RATE OF RETRN
(Millions of Rupees)
1974 1975 1976 1977 1978 1972 1980 1981 1982 1983 1984 1987 1986 8
BenefitsFertilizer Sales at Rs.771/tonof 'uma and Rs.446/ton of CAN - - 164 289 329 358 358 358 358 358 358 ' .58 358 356 358
CostsFixed Investment Cost 118 423 117 - - - _ _ _ _ _ _ _ _ _
Working Capital - - 16 - _ (16)
Costs of Goods Sold - - 40 80 90 98 98 98 98 96 98 98 98 98 98
Other Operating Costs - - 76 85 38 91 91 91 91 91 91 91 91 91 91
115 -- 23 - 2h9 165 -175 189 159 159 159 159 189 189 159 189 - 173
Net Bensfits Before Taxes (118) 'h23) (85) 124 151 169 '69 169 169 169 169 169 169 169 185
Financial Return Before Taxes (Base Case): 18.1%
Taxes - - - - - - 9 50 58 65 69 72 79 82 53
Net Benefits After Taxes (118) a23) (85) 124 151 169 16o lg 111 104 100 97 90 87 132
Financial Return After Taxes: 14.0%
1V For price assumptions see Annex 8-3.
Industrial Projects DepartmentNovember 1972

FCI: N; YAL FERTILIZER PR0JECT
NANG.2L _UXPANSION PROJECT
CALCULATION OF THE ECONOMIC R1Tz OF R"JRET (BASe. CASE
(Mlillions of Rupees)
1974 1975 1976 1977 1978 12979 1980 1281 1982 1983 i22 1985 19bE 1987 1988
BenefitsFertilizer Sales Ex-plant
(NSt65/ton of urea cifKandla + Transportationto "Tangal) - - 126 217 247 268 268 268 268 268 268 268 2`8 268 268
CostsFixed Investnent Cost 103 336 99 - - - - - - - - - - - -
Workina Cap-ltal - - 16 - - - - - - - - - - - (16)Operating CostsCosts of Goods Sold - - 34 72 80 87 87 87 87 87 87 87 87 87 87Others - - 23 68 70 71 71 71 71 7 71 71 _ . 11 71
103 336 172 140- 150 158 158 158 158 J155 18 1 i 5~ 158 -142
NIet Esnefits (103) (336) 77 97 110 110 110 110 110 110 11C _' 110 126
Economic Return (ase Case): 1b.6%
TT Fr price assumptions see Annex 8-3.
Industrial Projects Department ( November 1972
ANNEX 9-2Page 1
FCI - NXAGAL FERTILIZER PLANTUP,A WORLD PRICES
General
India imports large amounts of urea annually for distributionvia tl-h" Central Fertilizer Pool. Wlhile quantities in recent years havediminished (1 million tons in 1969 compared to 776,000 tons in 197l! theimpact of world availability and price trends needs to be exarined inview of their effects on donestic production policies and prices.
In the last fifteen years, world urea demand grew from about300,000 TPY to some 18 million TPY today. Urea is now the predominantform of nitrogen fertilizer, displacing traditional materials such asammonium sulfate and ammonium nitrate. Looking ahead, no large-scalesubstitute nitrogen fertilizer in term of efficacy and deliverednutrient cost to farmers can be foreseen at the present time, except foranhydrous or acueous ammonia. (To date, use of these materials is limitedto e-'zntries having appropriate, highly-developed distribution and applica-tion syrstans for "direct application" and liquid fertilizer use and thusnot likely to be employed in India in the near future).
Price Trends
World urea prices have typically followed those for other man-made commodities, i.e. moving fron an initial high to an unrealistic low(due to plant overbuilding and technical developments permitting the con-struction of huge installations) ardl then to in intermediate, more rationalprice level. Whereas in the early 196 0's export prices for bagged materialfrom the small plants then in vogue exceeded $100 per ton CIF India, by1970 corresponding prices had fallen to the $55-$60 ton range for ureamade in plants ten times larger, especially those based on low-costnatural gas feedstock.
Ilore recently, however, FOB prices began to rise. In 1970and 1971 some 200,000 tons of bagged urea were inported from 3urope byIndia at about $55 per ton FOB or $75 CIF. In addition, 53,000 tons weresupplied by Iran, I;uwait and South Kcrea at about ̀ 51 per FOB or $55 CIFand 75,000 tons from Japan at $61 and '68 per ton respectively. In thefirst half of 1972, about 120,000 tons of urea were imported by India from-urope at ̀ 56 to $59 FOB or $67 to $69 CIF. Also some 270,000 tons wereshipped from Iran, Kuwait and Saudi Arabia at about $60 FOB or $65 CIF.(These CIF prices reflect very low prevailing freight rates which areexpected to return to higher levels and gradually escalate). Further ureaprice trends were discussed, during June 1972, with several brokers, andNitrex (Zurich) as well as British aulphur Corporation and InternationalSuperohosphate Manufacturers Association in London, and their views supportthe foregoing reasons for an upward movement in world urea prices. Mostcurrent bids are about 10% higher than last year; a recent tender fromBangladesh, for example, brought bids ranging from South Korean baggedmaterial at $63.5 per ton to European urea at $75.6 per ton, both c.i.f.basis. Some recent offers for 1973 shinments to India range between $70to $77 per ton c.i.f. The above organizations were confident that typical

ANNEX 9-2Page 2
world urea prices, bagged, c.i.f. India are likely to be at least in the$65 to $70 range for several years, and could go $5 per ton higher. Noearious concern was expressed about the possible depressant effects onIndian imported urea prices due to large plants under construction orplanned in Columbia and Venezuela. These plants are understood to bebehind schedule and furthermore, likely major markets will be the gas-shortULS. and some countries in Latin America, as well as Western Eurove. For theeconomic evaluation of the Nlangal expansion project, an estimate of US $65per ton of urea, bagged, c.i.f. India, has been used, compared to the above-mentioned forecasts of at least $65-$70 on the same basis.
Trends towards higher FOB prices are likely to continue for thefollowing reasons;
Rising Feedstock Prices
Feedstock prices are higher and countries in North Africa, theMiddle East and South America have begun to realize the value of theirnatural gas resources; accordingly they have greatly reduced wastage frortiflaring. Also, they are having second thoughts about nroducing low-costammonia and other products based on gas-field eosts of 5 to 10 cents permillion Btu. Sales of liquified natural gas (LNG) to the U.S. and Europeat FOB prices of 30 to 40 cents per million Btu are more profitable andthe volume of LNG exports is expected to increase greatly, especially toXhe U.S.
In addition, 11orth America and -Lurope now realize their suppliesof' gas reserves are not inexhaustable. Cooseauentlyr goviernm-ents ar!d gas-producing companies are controlling outputs to an increasing degree. Thisis resulting in appreciable price escalation; in U.S.A., for example, somenatural gas contracts originally let at about $0.20 per nillion Btu arebeing renewed at double this figure, or more. Armonia-urea plants basedon naphthia and fuel oil are also faced with rising .eedstock prices. Thisis due not only to increasing crude Prices, but also to growring feedstockdemands from synthetic natural gas i;C) plants and other petrochemicalprocesses.
Higher Bagging Costs
Similarly bagging ard handling costs are increasing. Discussionswith fertilizer producers in many countries reveal escalating bagging andhandling costs, even though these operations are highly mechanized. Infact, mechanization, although reducing total bagging and handling costs, canmake these operations more sensitive to wage increases for direct laborand maintenance, as well as rising capital needs. Furthermore, stricterbagging specifications in terms of better containers, moisture-proofing,sealing, etc., have also increased bagging expenses. Whereas a few yearsago, '5 to $6 per ton was a typical bagging cost, most fertilizer producersin industrialized caontries indicate $8 to $10 per ton to be a morerealistic bagging-cost range.
ANNEX 9-2Page 3
Escalating Capital, Start-up and Operating Costs
Plant construction, start-up and operating costs have increasedsharply in recent years. Few large aimonia and urea plants bullt in thelast decade throughout the world have achieved planned construction andstart-up schedules and costs, even in highly-developed countries. A 6 to 12month delay can reduce a calculated return on investment by 2-4%, andpurchasing substitute product in the meantime is an additional excesscost. Hence, long construction timn-lags in the field, plus a subsequentinability to achieve rated production rapidly, have virtually eliminatedthe opportunity for some ammonia/urea plants to make acceptable rates ofreturn on existing sales contracts. Accordingly, realistic sale3 agree-ments reflect (or should) the probability of initial excess costs occurringdue to plant construction and start-up delays, and resuaiting higher costs(or smaller profits).
Similarly, many large ammonia/urea and other petrochemicalplants have had difficulty in maintaining rated capacity, often becauseof mechanical problems rather than fundamental design errors. In effortsto minimize installed costs, little margin has been left for equipmentthat is not quite up to specification, and modification or replacementcan be expensive in terms of extra capital cost and lost production.
Built-in insurance against such problems is therefore prudenteven though initial plant cost is likely to be greater, and realisticsales contracts must recognize the corresponding additional financialreturn necessary. Another additional cost burden that has to be recoveredin most operating and planned projects is the capital and operating expenseof pollution control, which can add about 10% to fixed :Lnvestment andseveral percent to operating cost, depending on circumstances. No newtechnology offering substantial cost reduction, or significant economiesof scale obtainable by building much larger single-train plants areforeseen at the present time.
Industrial Projects DepartmentNoeiember 1972

FCI: NANGAL FERTILIZER PROJECT
ECONOMIC RETURN SENSITIVITY TO DIFFERENT PRICE ASSUMPTIONS FOR UREA (BASE RETURN)
RATES OF RETlJRN 1%) ,
l0 I'
B~~ ~ ~ ~ ~~ ~~~~ _ _ri _ _ _ _ _ _
L-~~~~~~~~~~~~~ ~ Os 47CIF $63 CIF $"0 ci FA ClF$1CIF
BnPrios AssumnptionUIS$65 CIF Indiatton of Ures- Rs 473+ Rs 91 Freight and Handling to Nangal World Bank - 7015(2RI
I,
ANrTEX 9-4
FCI: NANGAL FERTIMZER PROJECT
NANGAL EXPANSION PROJECT
INCREMNTAL ANNUAL FOHEIGN EXCHANGE SAVINGS/
Costs in 1972 RuneesPer Ton of N of Fertilizer ''oldForeiZn Local Total
Costs of Coods Sold
Fuel Oil/ 130 131 261Coal - l1 111Consumable Stores - 26 ?Rags 8 70 78
138 338 17,
Ooerating Expenses
Power (129) (387) (516)Salaries, Wages and 9enefits - 20 20Freight and Handling -MLaintenance Materials 15 ht 59Interest on Short-Term Borrowings - 5 52Depreciation 235 10' 340Other ExDenses - 59 59
121 (42) 79
lOg Return on Capital Employed-/ 144 65' 209
Total Costs 403 361 764Million
Rs/Ton of N U)S $ per year
Gross Foreign Exchange Value of Fertilizer SalesV 1L,029 21.6
Estimated Foreign Exchange Content ofProduction Costs 403 8.5
Net Foreign Exchange Savings 626 13.151
1/ Based on economic cost figures from Annex 8-3.2/ Due to refinery configuration, foreign exchange cost of one ton of heavy fuel
oil is approximately equal to import cost of one ton of crude CIF Kandla. NoFE charges have been taken for refining since fuel oil is considered a refineryby-product.
3/ Full project costs including interest during construction and escalation./ Based on urea price of US $65/ton CIF India.
g/ Additionally there are Rs.30 million local currency savings resulting from thenecessary transportation -for imnorted fertilizer from the port 'o the Nangal area.
Industrial Projects DepartmentNovember 1972
IBRD 3559R2
'- ' \ .,, , 806 y2- JULY 1972
INDIAAFGHANISTAN § ' s\
AFGHANISTAN -,, _ , -- PRESENT AND PROPOSED MAJOR FERTILIZER PLANTS
j; !~~~~~~~~~~~~~~~~~~~~~~~~~~~~~p
r N ;;-i *r5si. U;t v t,^r
'1 ) -_____ t o- ~ A%: N: '1' * ; " 3 t C8AstS
JIV 5,4* 'Ai A AfyA.
PAKISTAN *. £fndgar*
-. z . De ,, . j \ J 1 T I B E T-.5s N E PA L \ x / ~ < / '.
NEPAL AA'
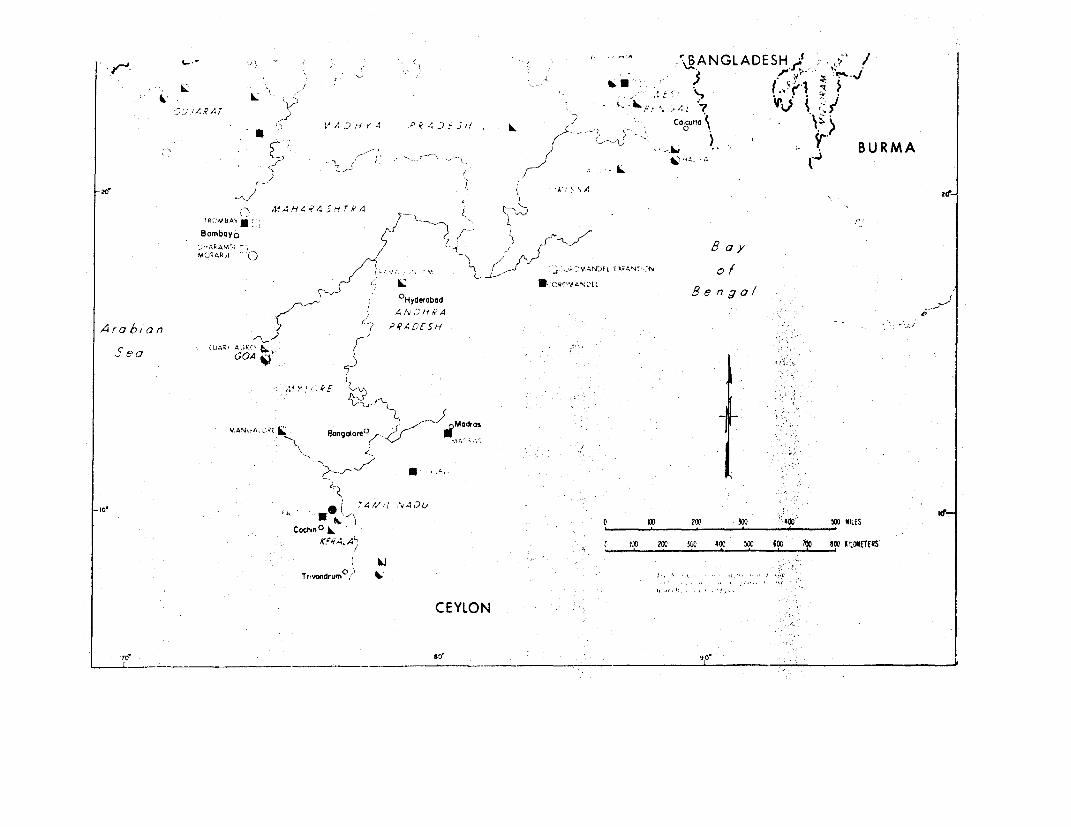
17ANGLADE.zw/ ,. /
l ~~ GE ; 'P A;.I \ ANGLADES ; r' /
'n ,8 4 _o =,, J p 8 -; 9 S J e i 29 ~~~~~~~~ ~ ~~Coicutto .
'' g - X w-.S. )- -; i-BURMA
.r A'J AA '?Sr
lf:4I'7f 4 ? L .A
Bornboyo2 Ba~~~~y
) '.AN[)A EXAN'2 a /frr~~~~~~~~~~S 0 i11 CRMANCEL
OHyderobod
Arabi an 2>? RnS: :t 0
rea GQaAn
V AN4,A, . i M-*dros
go £ g0 ! Z dAv /Y .vA-7D ; .US, Ia o
Cochin O AL 0 100 200 300 0 500 tMtLES
Cochrn0 L, VK.AKrA K) 200 10 Z 300 40 50 6 70 IOQ KILOETERS
Trivondruim # ,
CEYLON
7C 9 I.